Kingfisher PLC · LSE:KGF
Kingfisher — H1 1999 Earnings Presentation
45 slides from Kingfisher's earnings presentation, September 1999
Slide 1: Interim results for half-year ended 31 July 1999
Interim results for half-year ended 31 July 1999
Slide 2: Sir Geoffrey Mulcahy, Group Chief Executive
Sir Geoffrey Mulcahy Group Chief Executive
Slide 3: Today's agenda
Today’s agenda • Highlights • Financials • Operations • Questions and answers
Slide 4: Growth in sales and profits
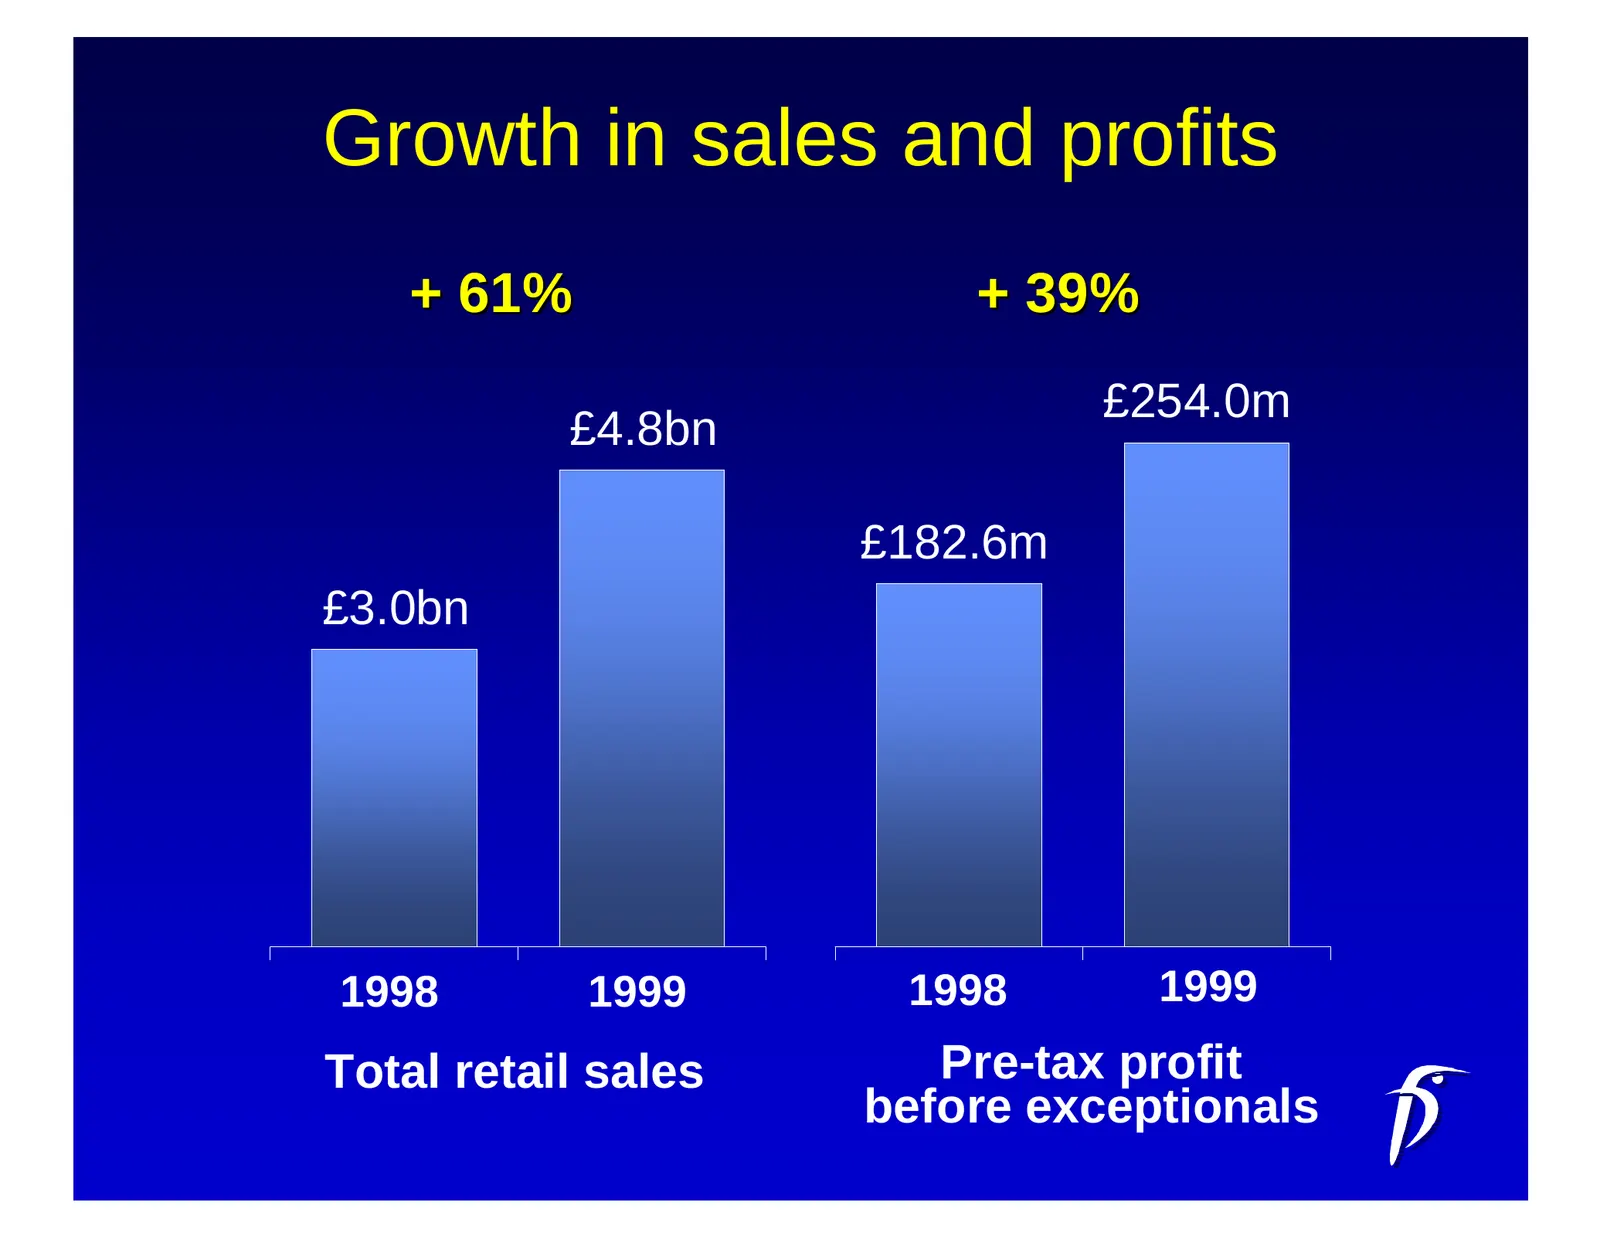
Growth in sales and profits + 61% + 39% £254.0m £4.8bn £182.6m £3.0bn 1998 1999 1998 1999 Total retail sales Pre-tax profit before exceptionals
Slide 5: EPS and dividend growth
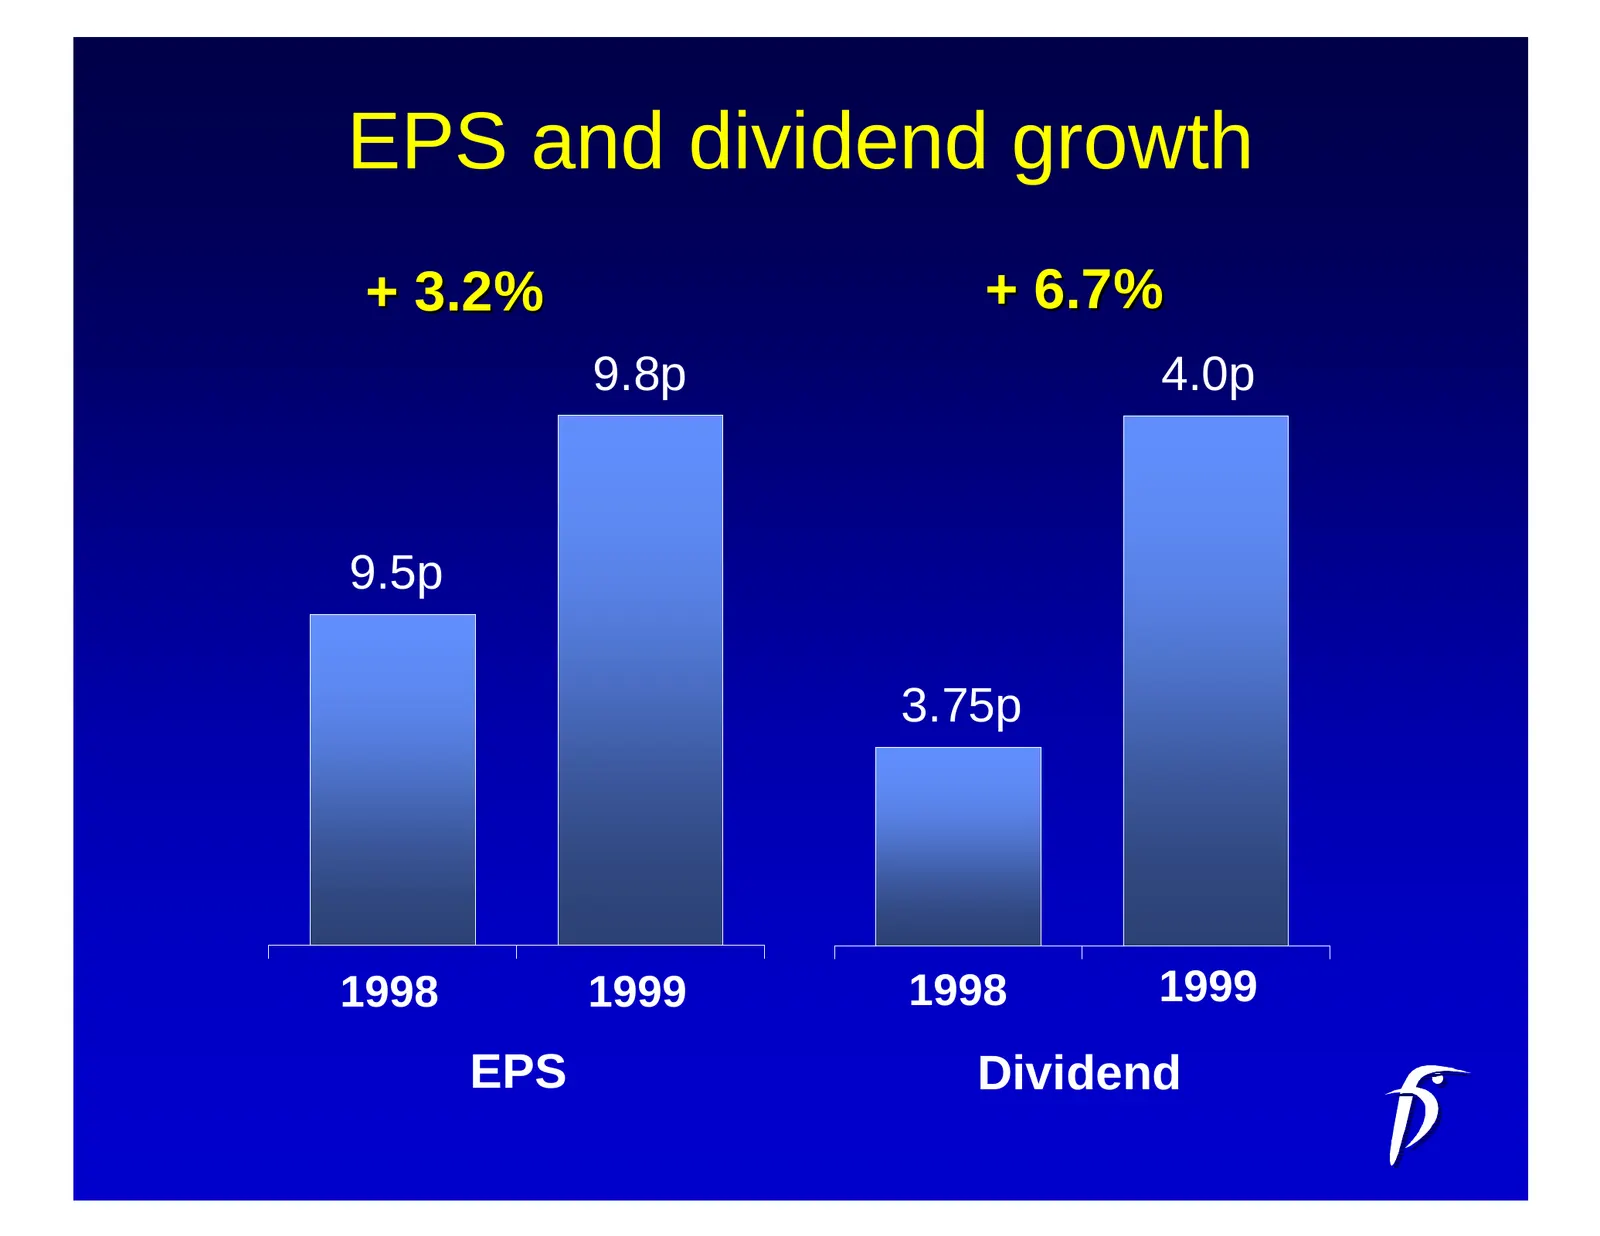
EPS and dividend growth + 3.2% + 6.7% 9.8p 4.0p 9.5p 3.75p 1998 1999 1998 1999 EPS Dividend
Slide 6: Kingfisher's strategy
Kingfisher’s strategy • Build a pan-European business – market leadership – growth markets • Offer customers: – best choice – best value – best service • Efficient supply chain with global sourcing capabilities
Slide 7: Key progress
Key progress • No.1 position in DIY in Europe • No.3 position in Electricals in Europe • Developing new consumer channels – e-commerce - LibertySurf, other ISPs – direct mail - Screwfix, other catalogues
Slide 8: New formats and evolution
New formats and evolution • Launch of ‘Big W’ • Opening of B&Q in Shanghai • Opening of interactive Comet • New sites via acquisitions of: – Dickens – Co-op Homeworld sites
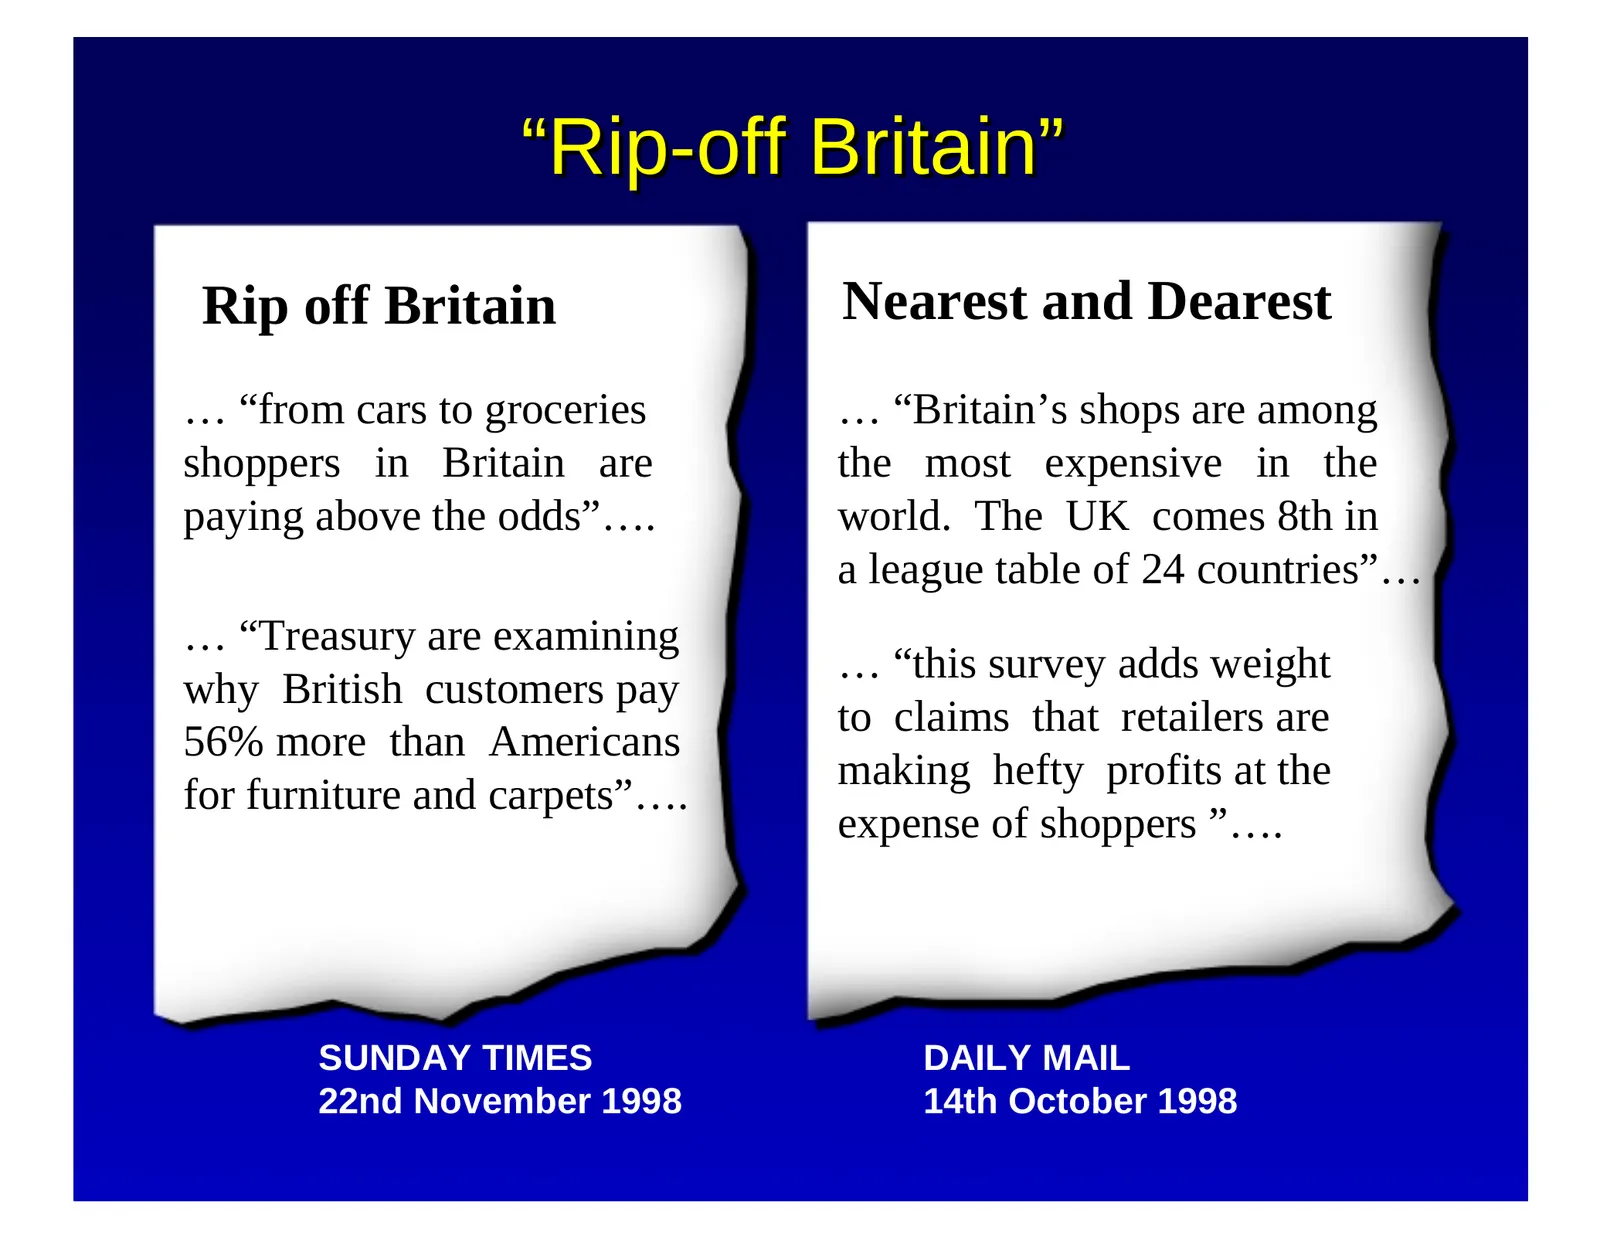
Slide 9: "Rip-off Britain"
“Rip-off Britain” Rip off Britain Nearest and Dearest … “from cars to groceries … “Britain’s shops are among shoppers in Britain are the most expensive in the paying above the odds”…. world. The UK comes 8th in a league table of 24 countries”… … “Treasury are examining … “this survey adds weight why

Slide 10: KINGPSHER
KINGPSHER
Slide 11: Ability to seize opportunities
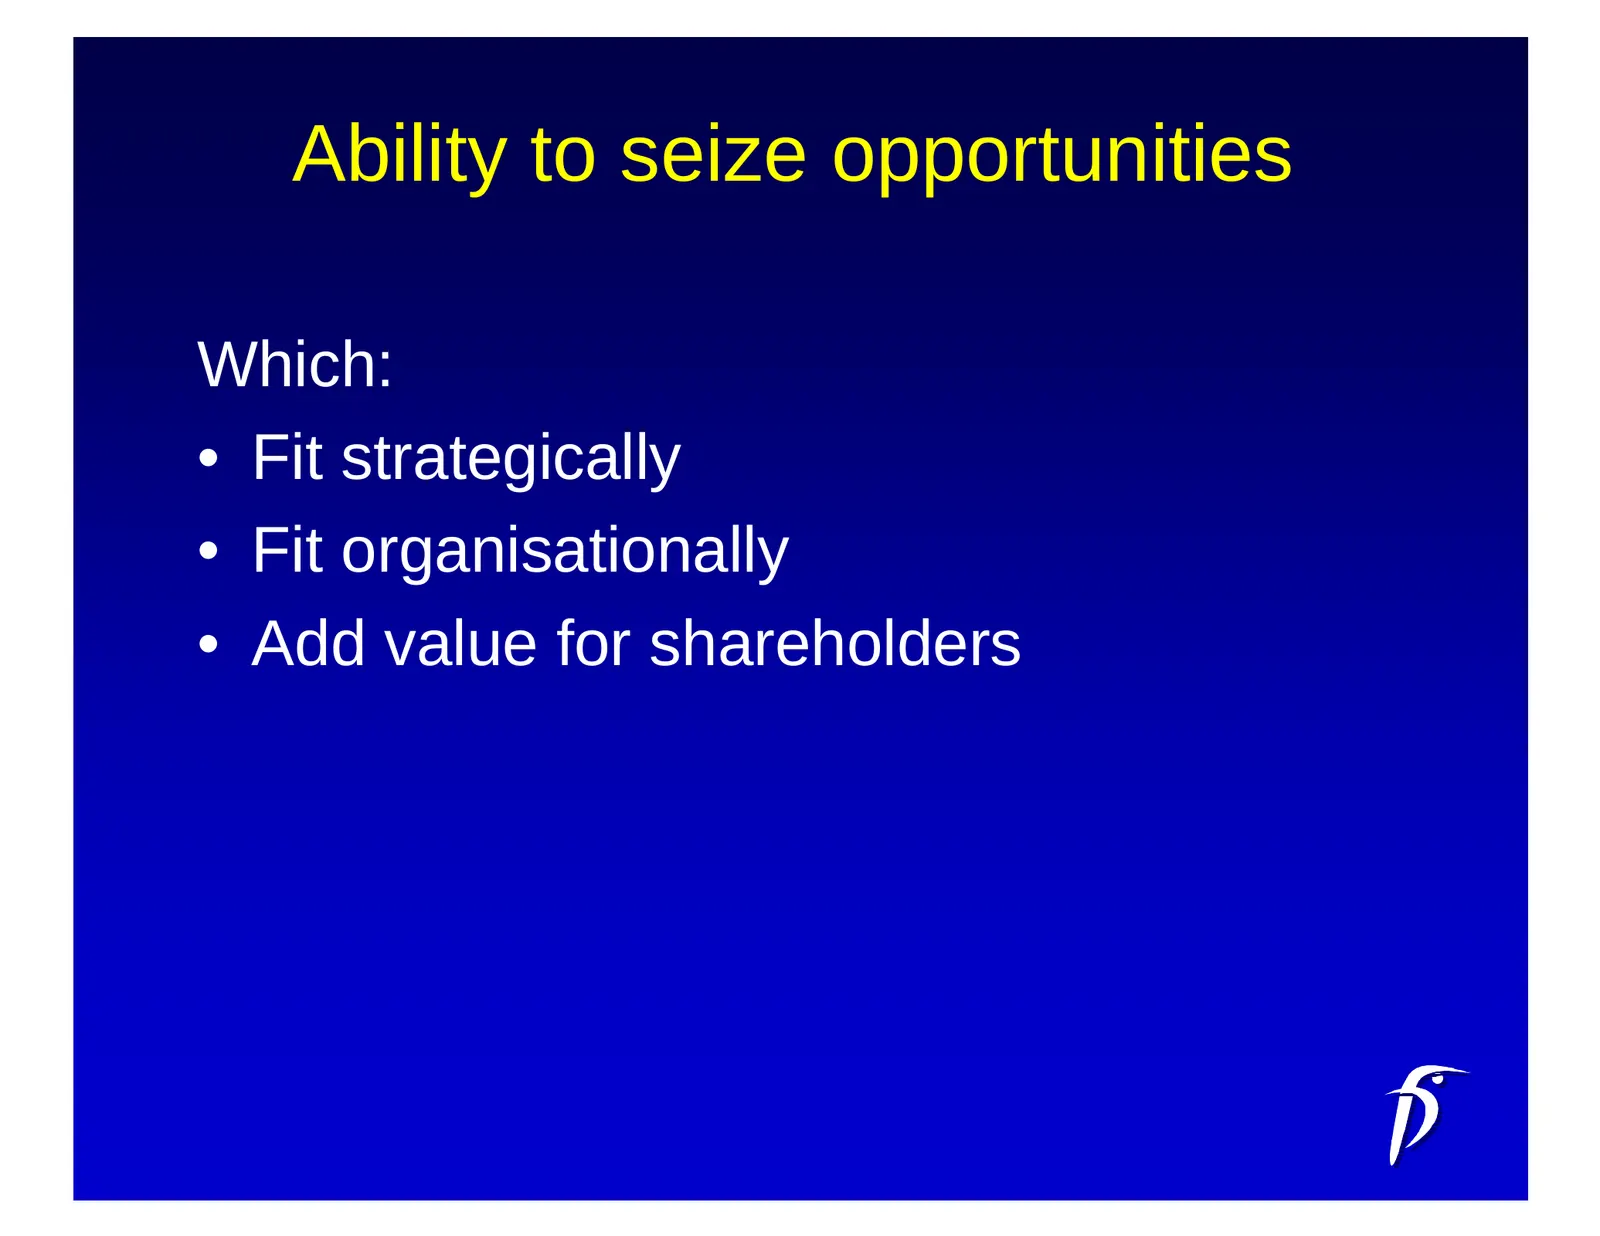
Ability to seize opportunities Which: • Fit strategically • Fit organisationally • Add value for shareholders
Slide 12: Successful US retailers
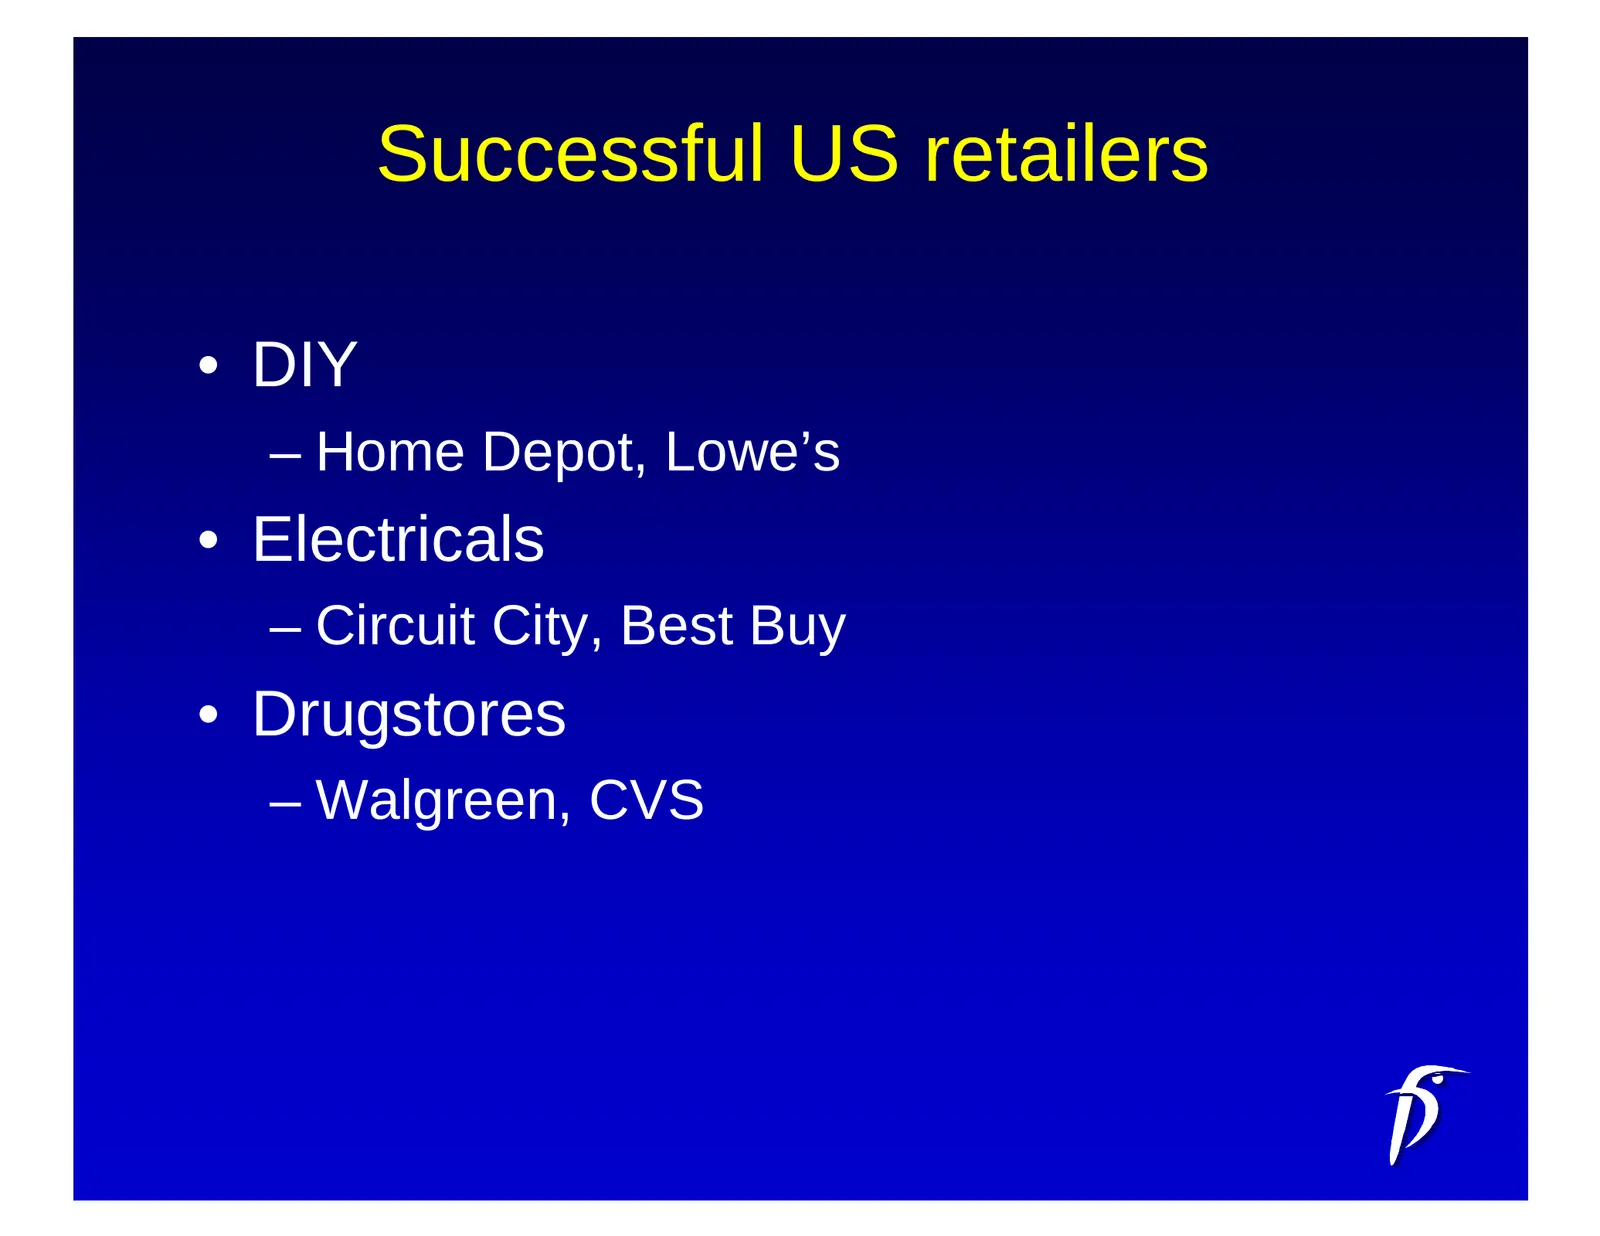
Successful US retailers • DIY – Home Depot, Lowe’s • Electricals – Circuit City, Best Buy • Drugstores – Walgreen, CVS

Slide 13: KINGPSHER
KINGPSHER

Slide 14: Philip Rowley, Finance Director
Philip Rowley Finance Director
Slide 15: Profit and loss highlights
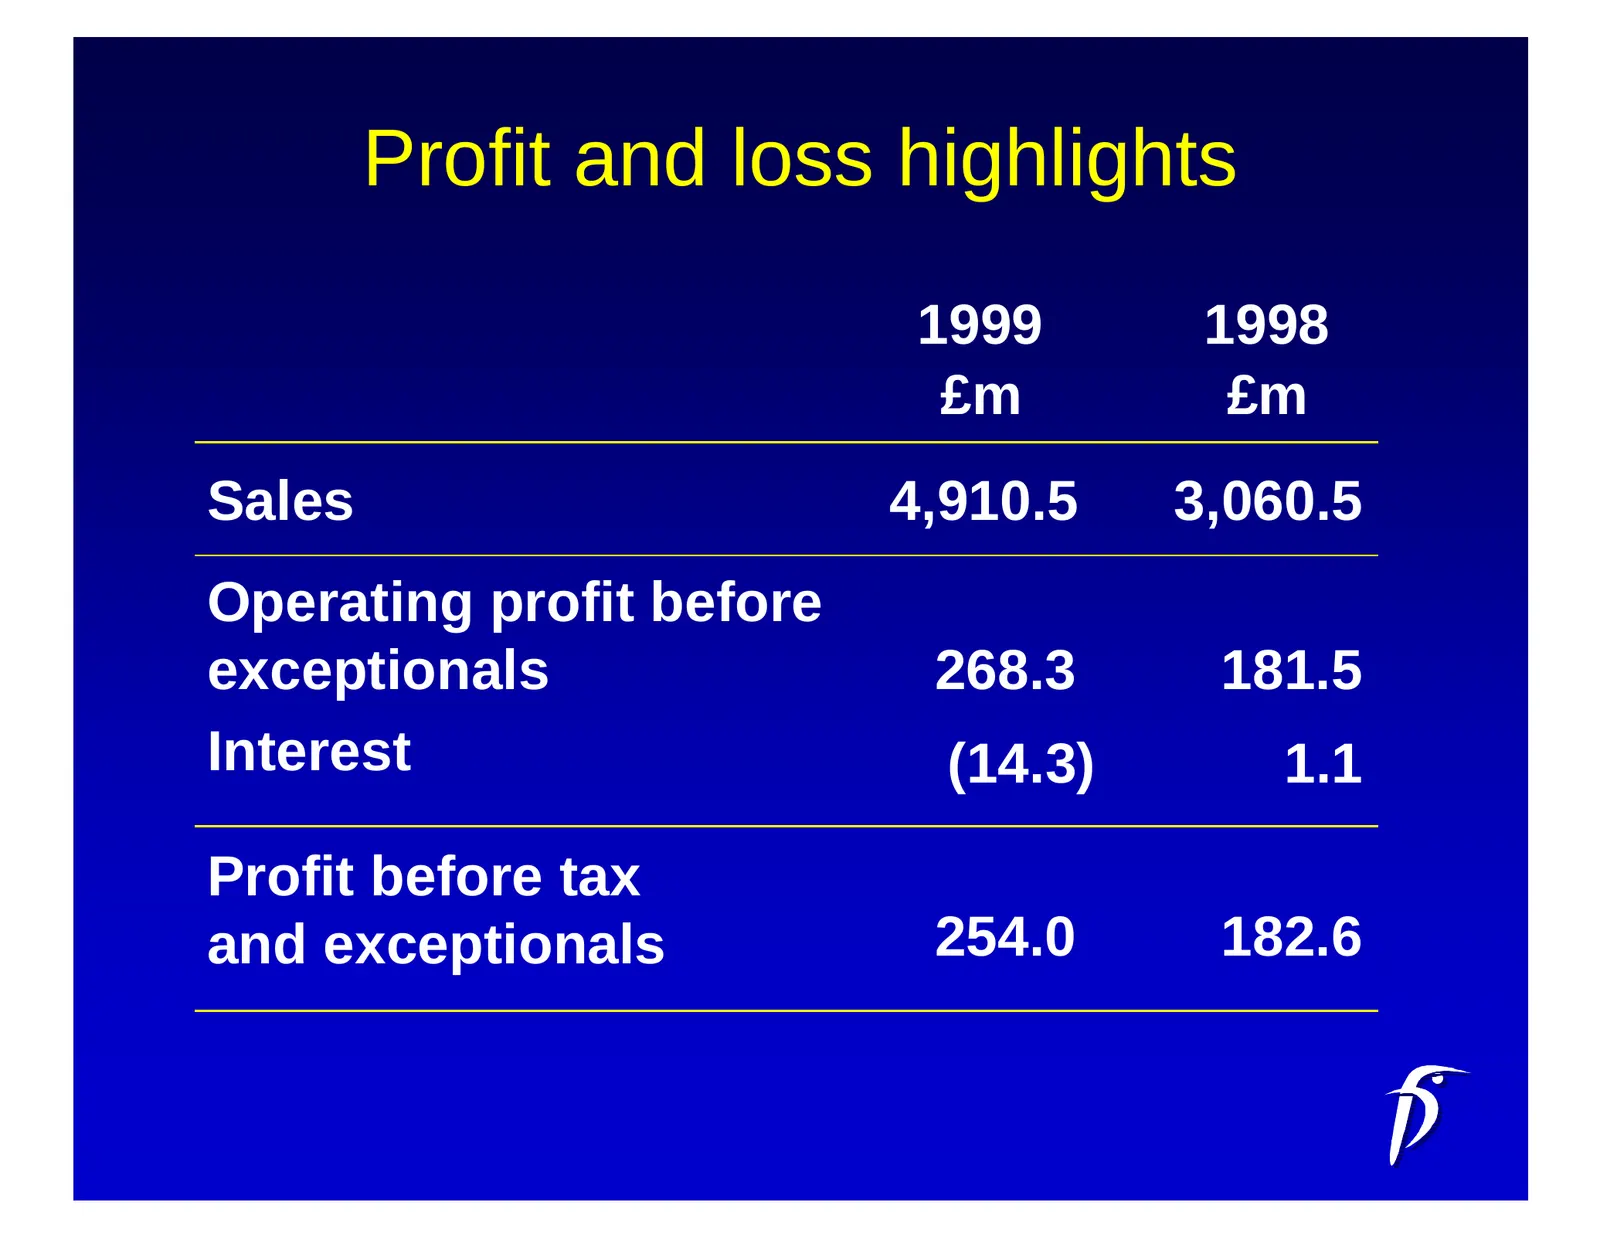
Profit and loss highlights 1999 1998 £m £m Sales 4,910.5 3,060.5 Operating profit before exceptionals 268.3 181.5 Interest (14.3) 1.1 Profit before tax and exceptionals 254.0 182.6
Slide 16: Profit and loss highlights
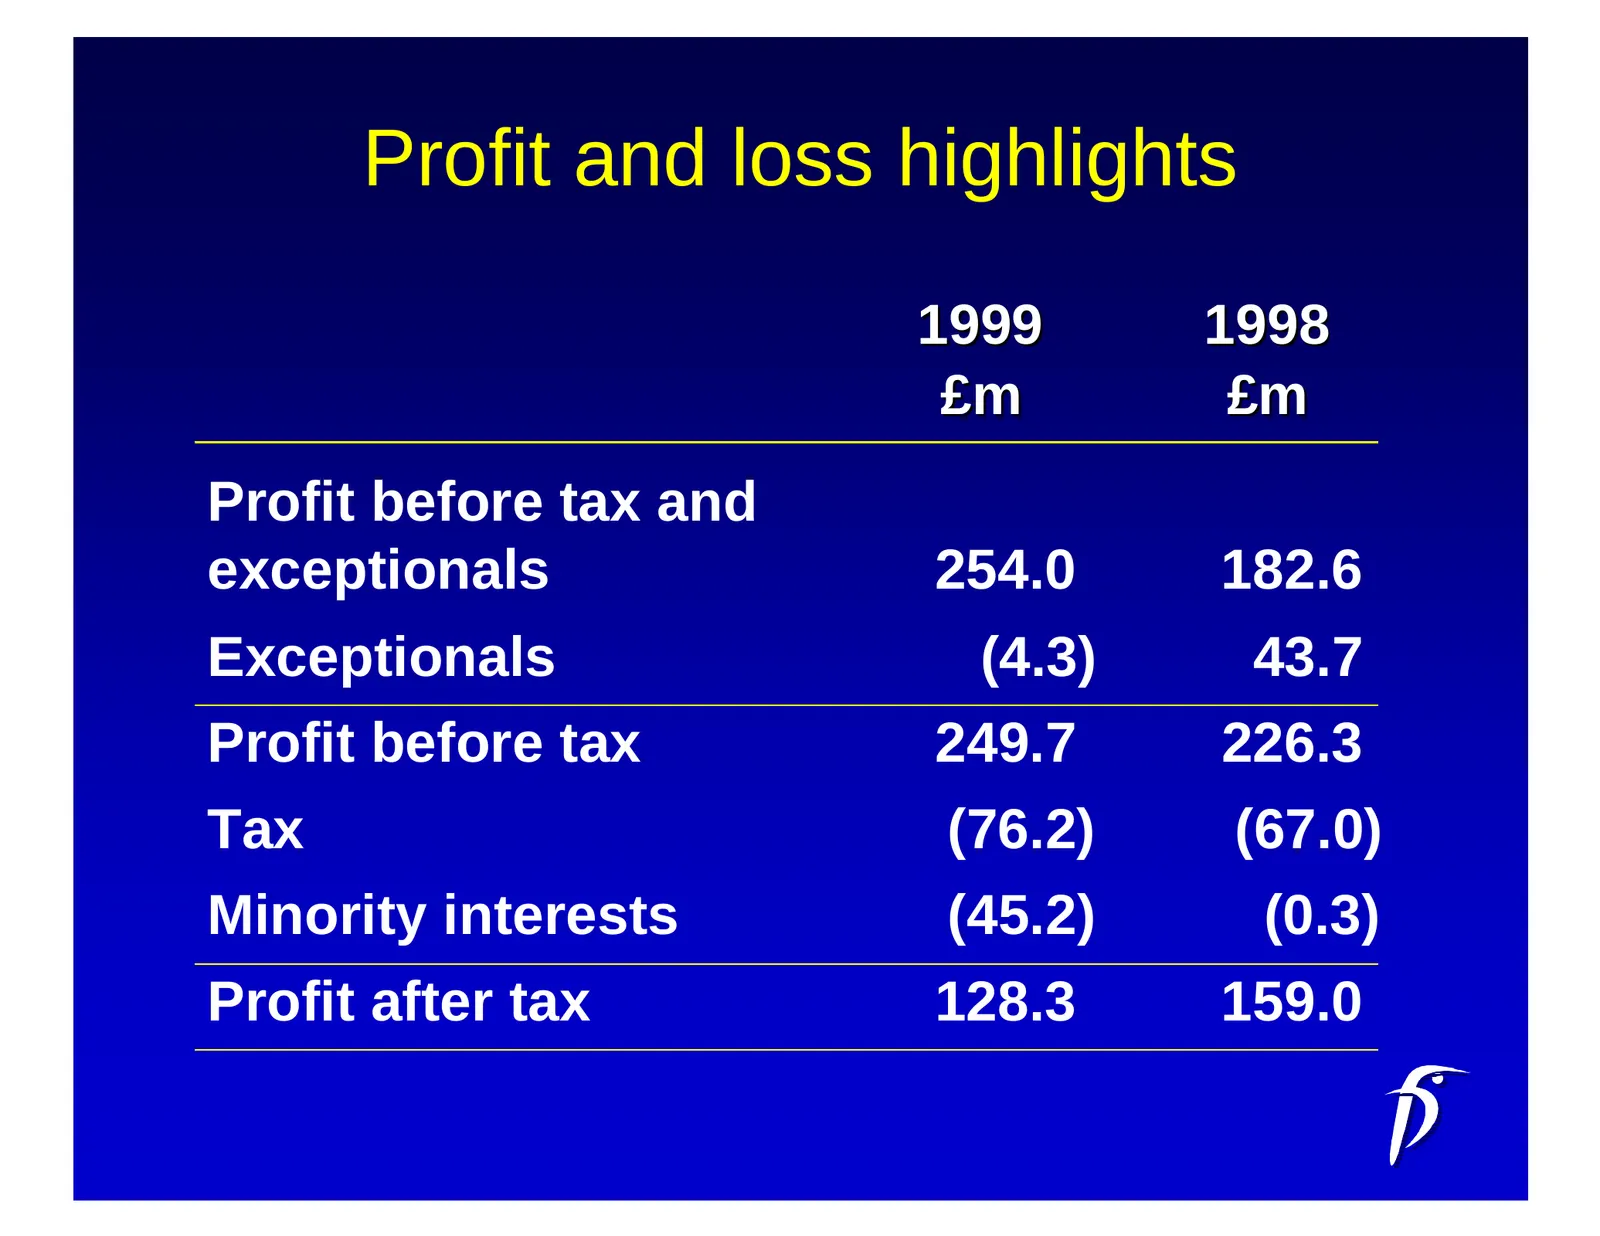
Profit and loss highlights 1999 1998 £m £m Profit before tax and exceptionals 254.0 182.6 Exceptionals (4.3) 43.7 Profit before tax 249.7 226.3 Tax (76.2) (67.0) Minority interests (45.2) (0.3) Profit after tax 128.3 159.0
Slide 17: EPS/Dividend growth
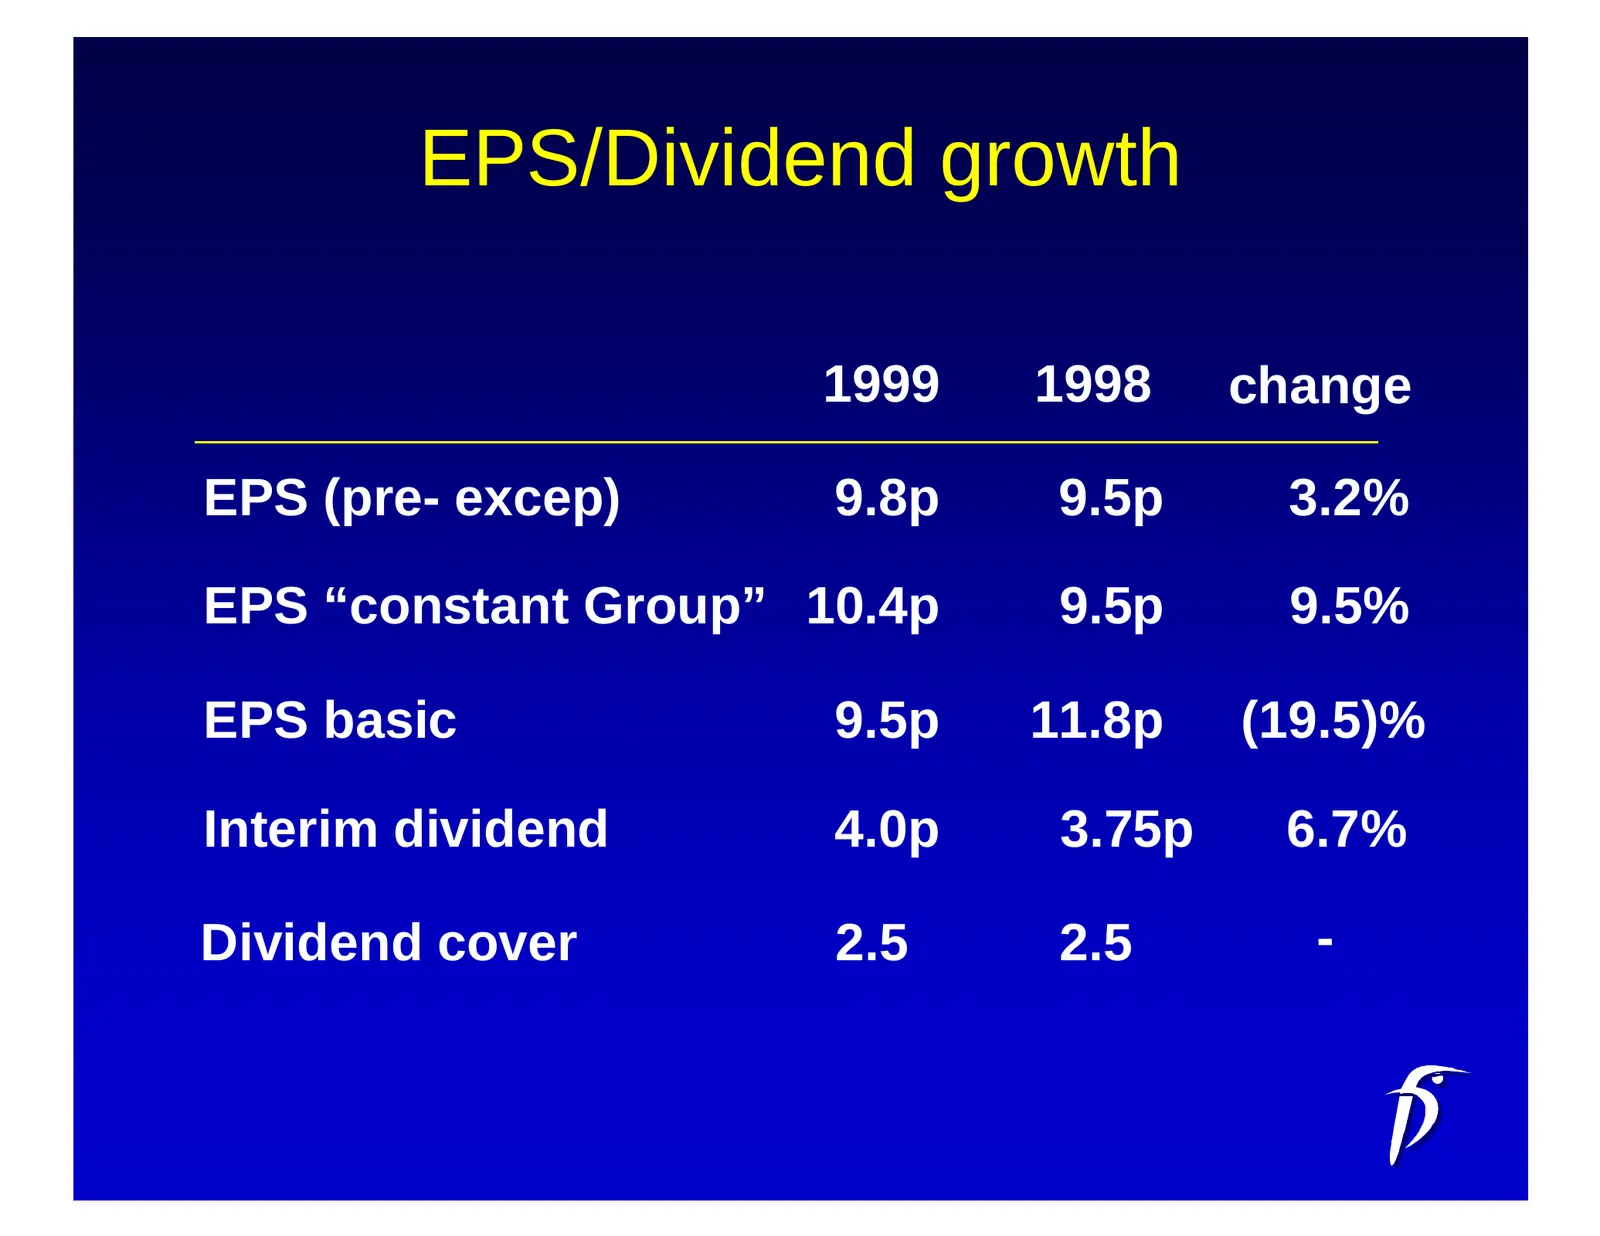
EPS/Dividend growth 1999 1998 change EPS (pre- excep) 9.8p 9.5p 3.2% EPS “constant Group” 10.4p 9.5p 9.5% EPS basic 9.5p 11.8p (19.5)% Interim dividend 4.0p 3.75p 6.7% Dividend cover 2.5 2.5 -
Slide 18: Retail sales growth
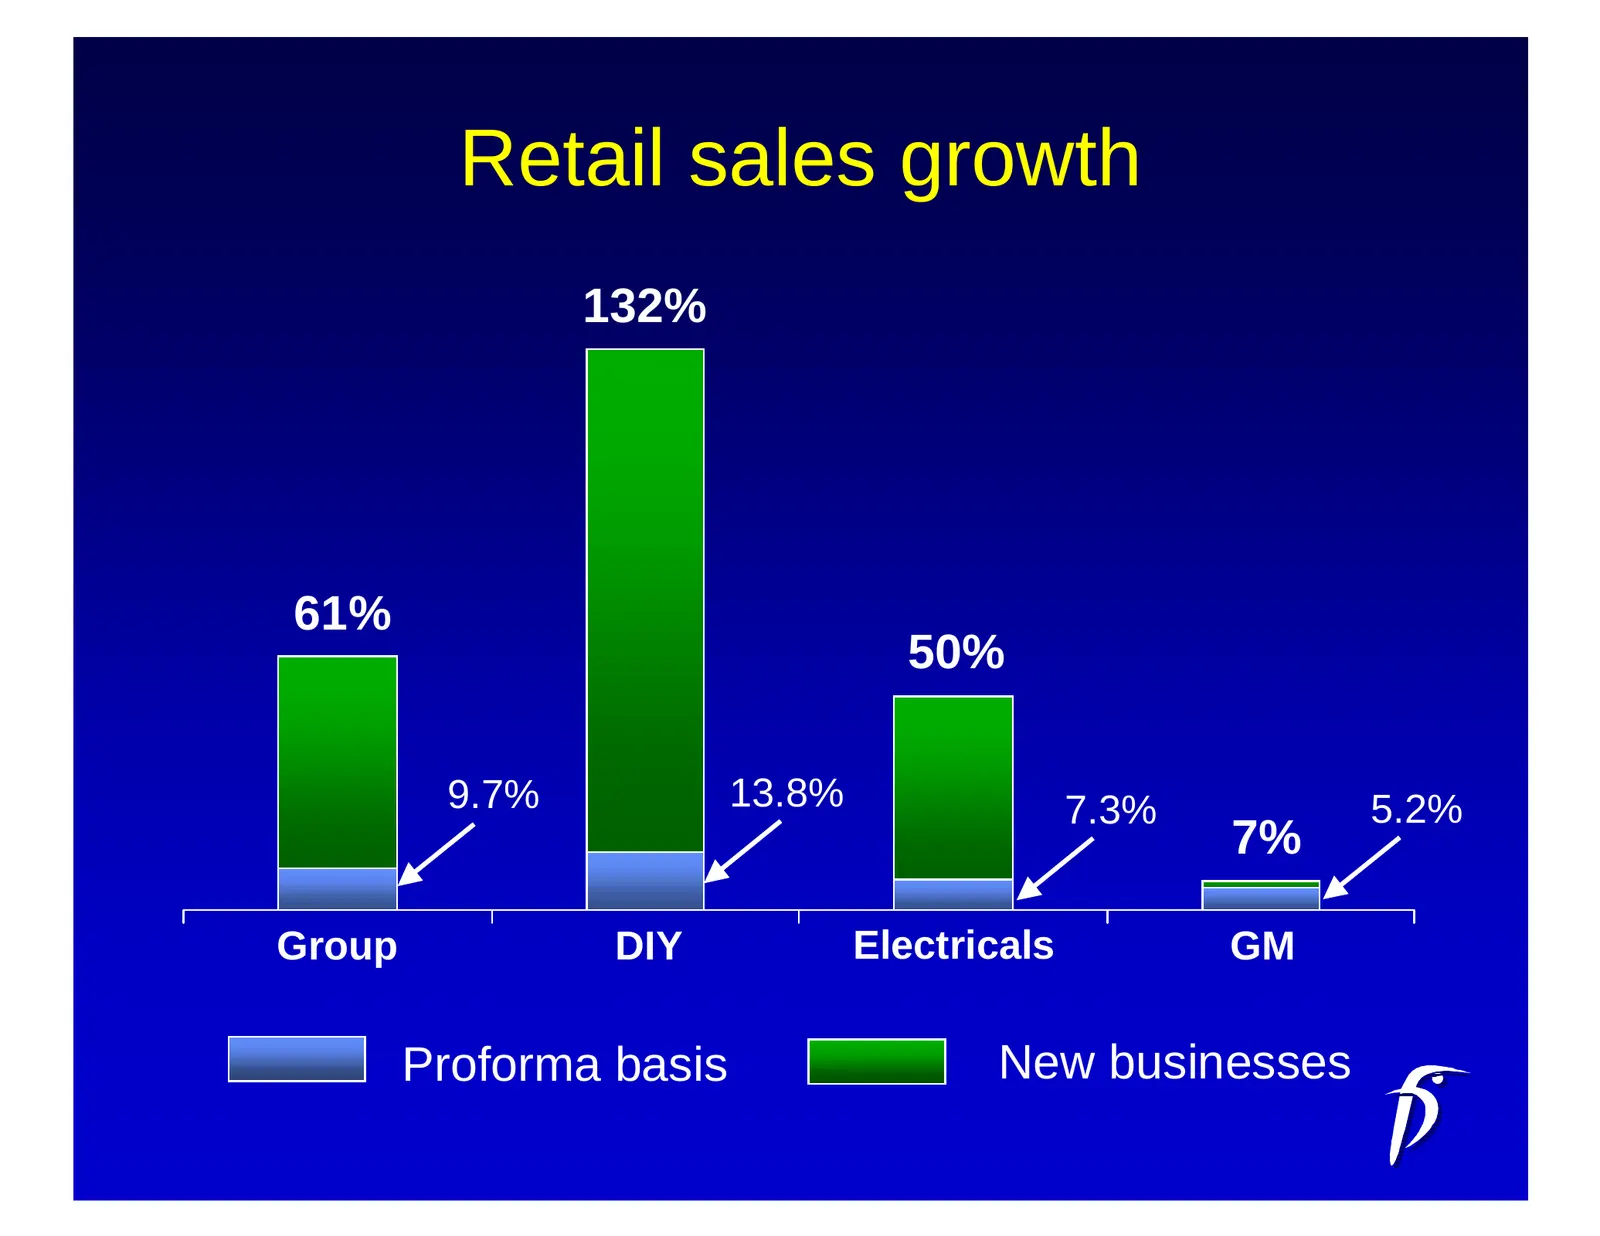
Retail sales growth 132% 61% 50% 9.7% 13.8% 7.3% 5.2% 7% Group DIY Electricals GM Proforma basis New businesses
Slide 19: Like-for-like sales growth (%)
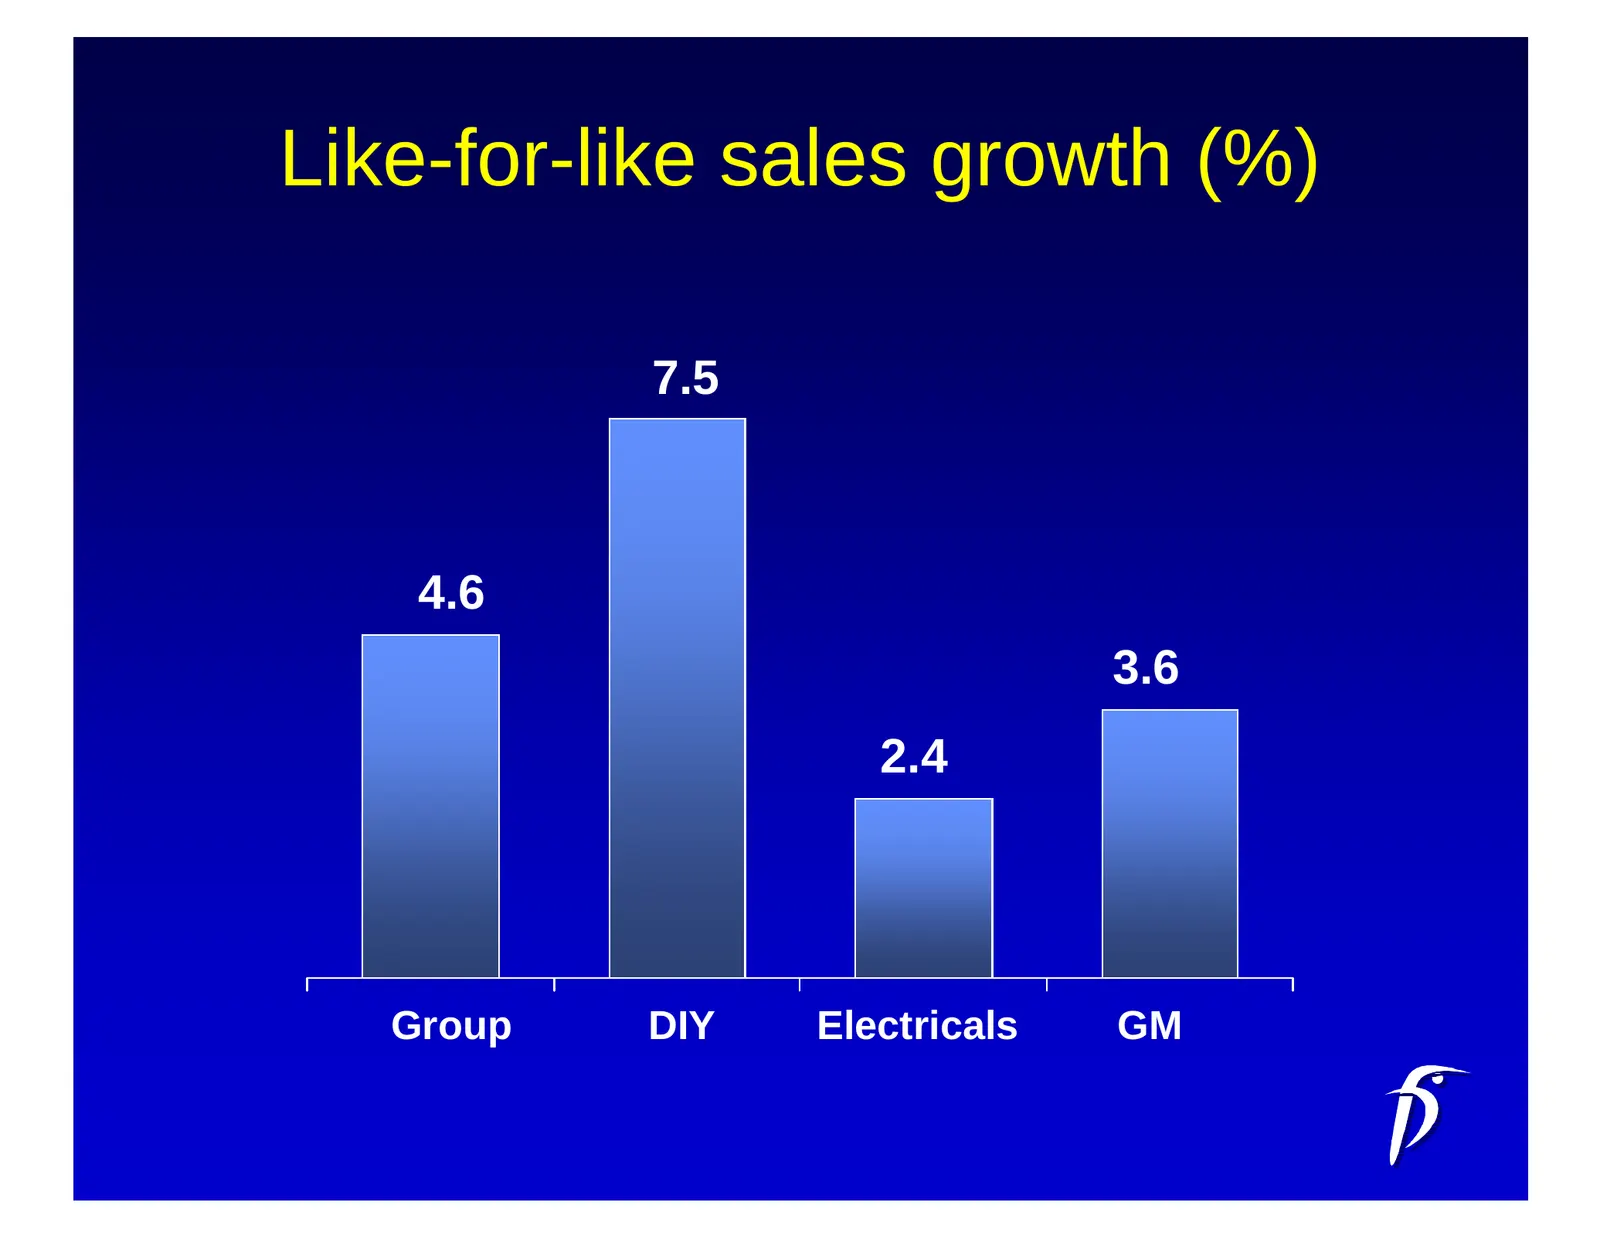
Like-for-like sales growth (%) 7.5 4.6 3.6 2.4 Group DIY Electricals GM
Slide 20: Net space expansion (%)
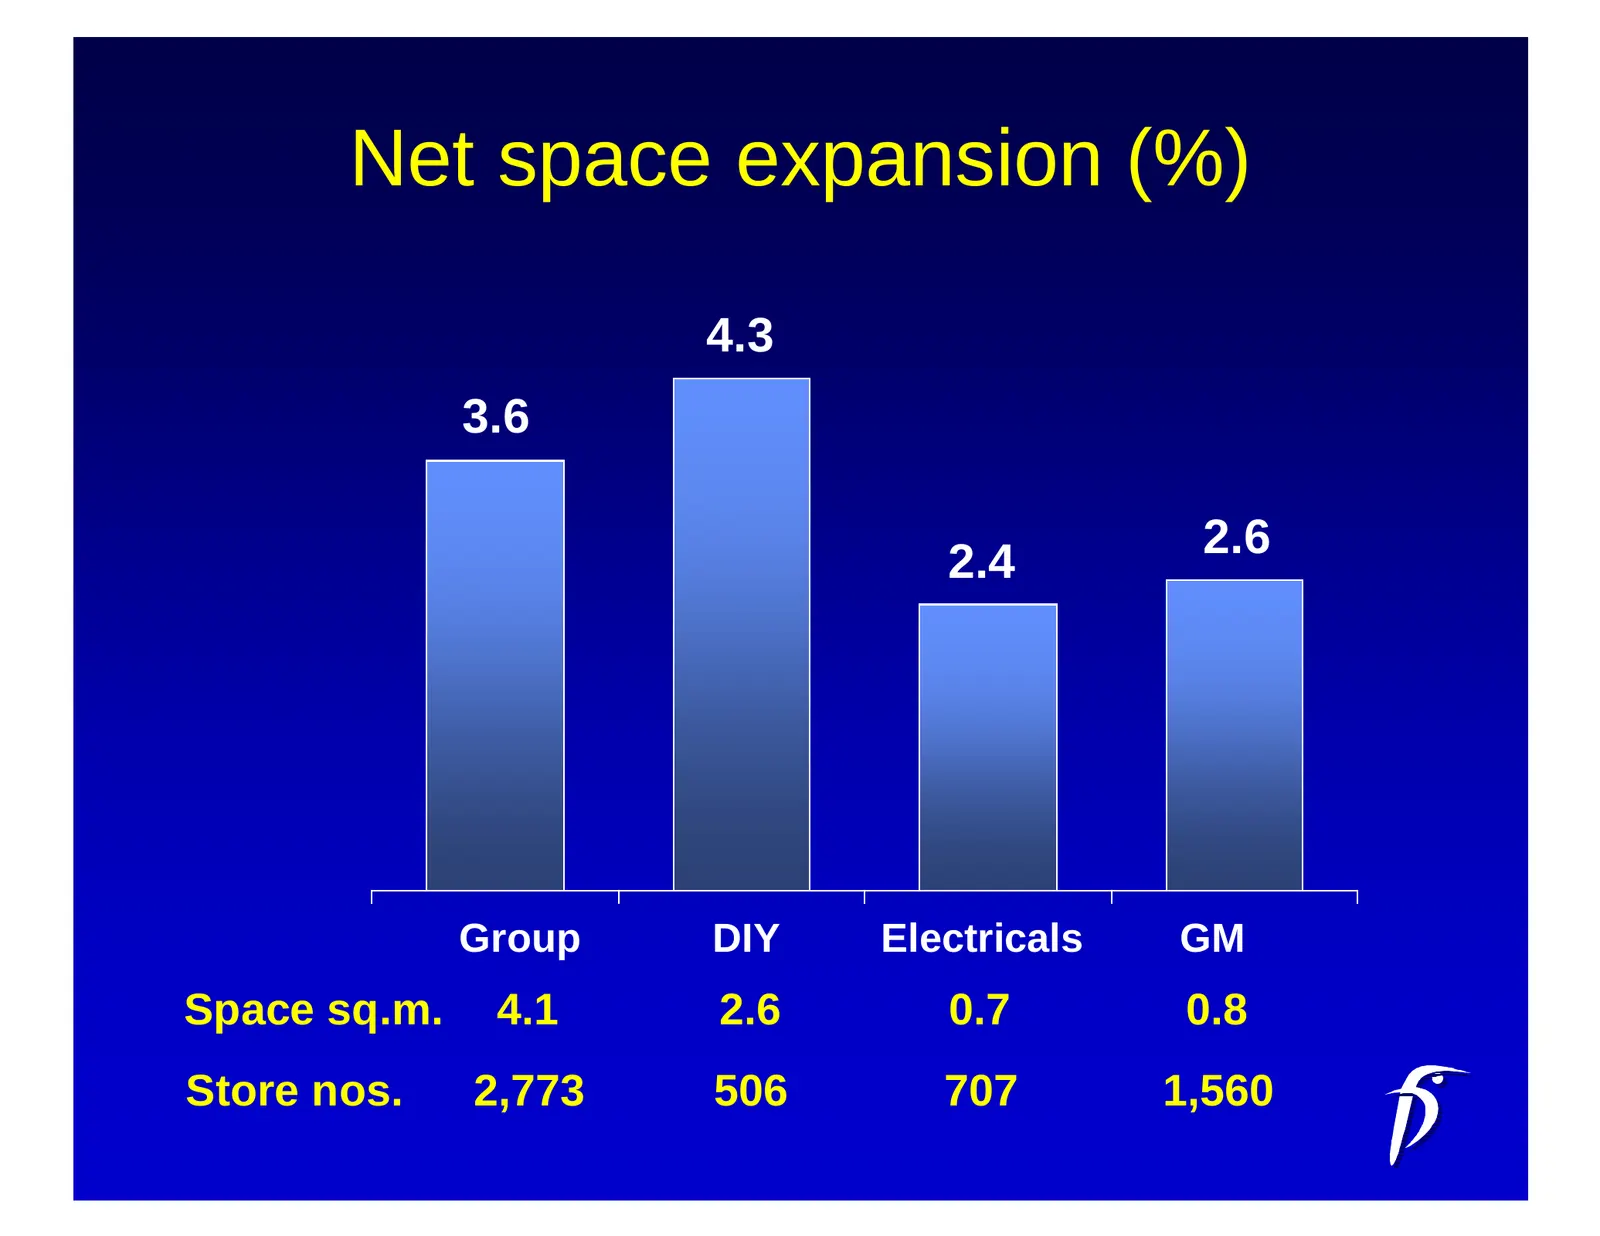
Net space expansion (%) 4.3 3.6 2.6 2.4 Group DIY Electricals GM Space sq.m. 4.1 2.6 0.7 0.8 Store nos. 2,773 506 707 1,560
Slide 21: DIY
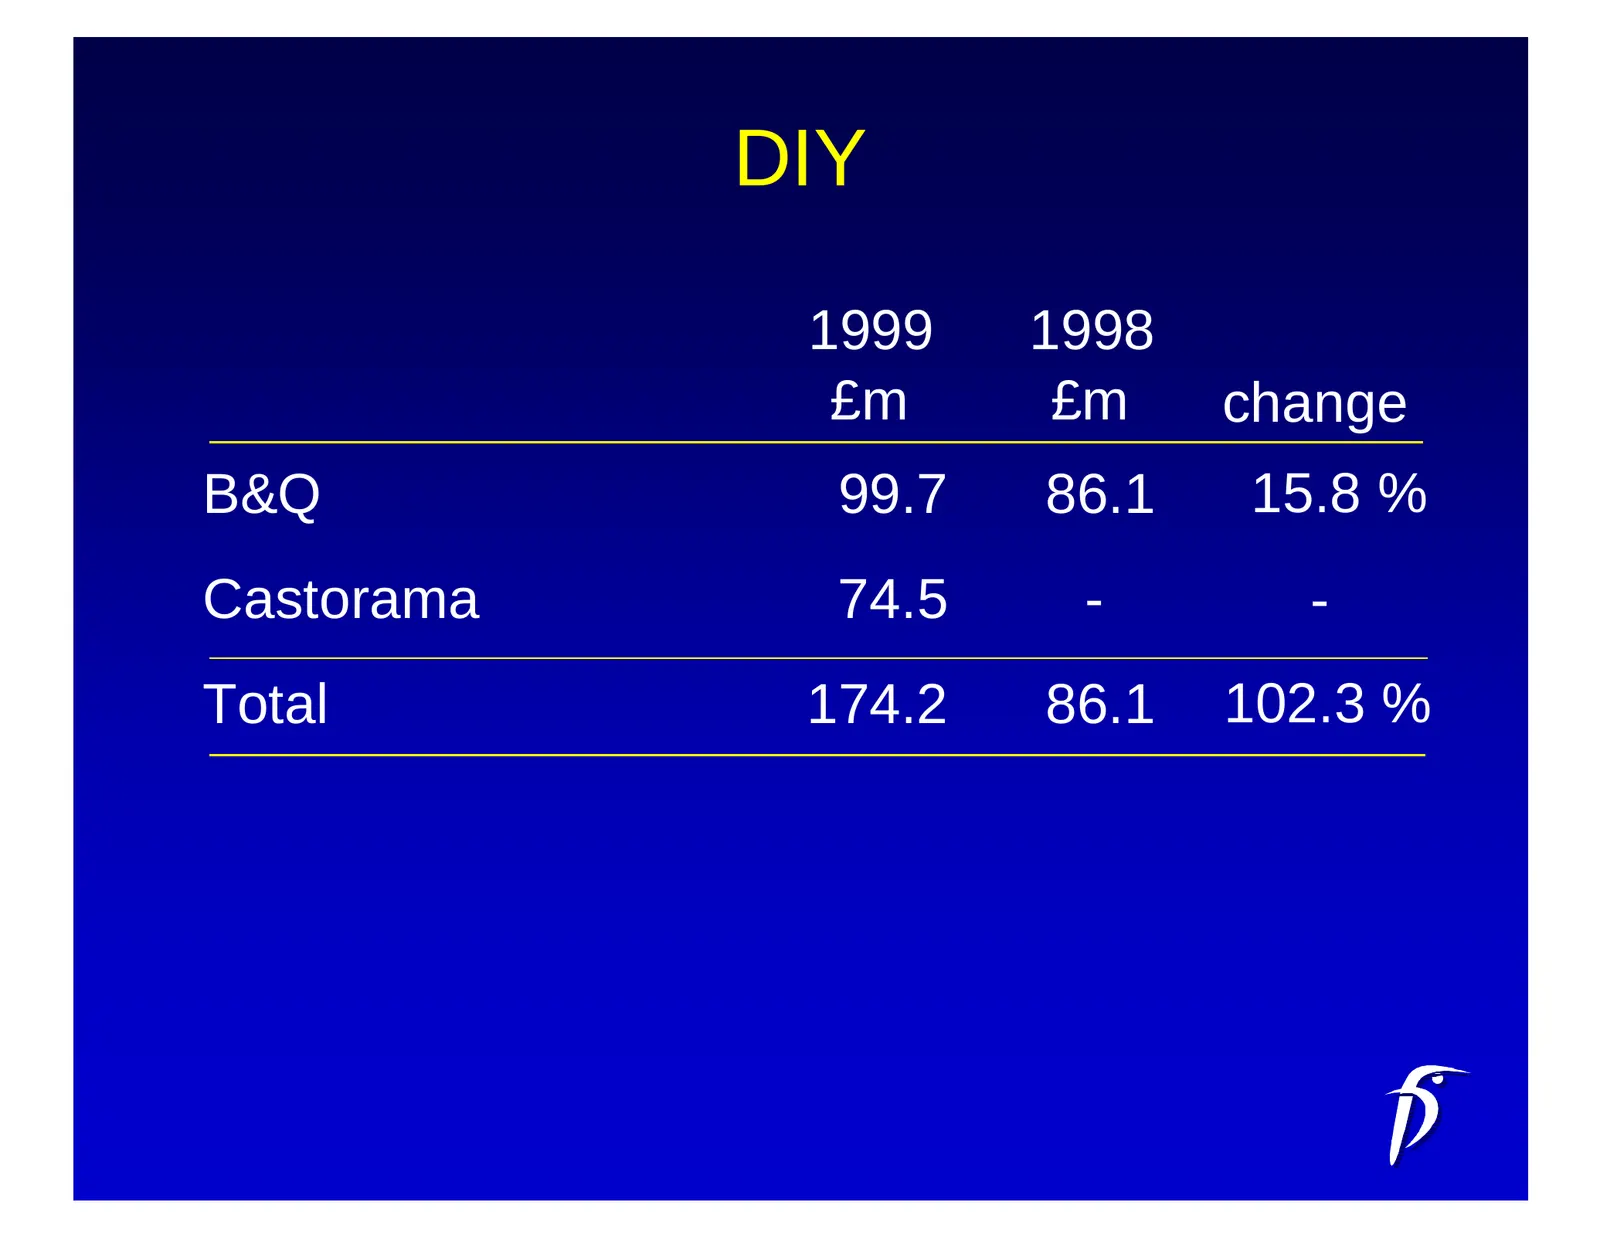
DIY 1999 1998 £m £m change B&Q 99.7 86.1 15.8 % Castorama 74.5 - - Total 174.2 86.1 102.3 %
Slide 22: Electricals
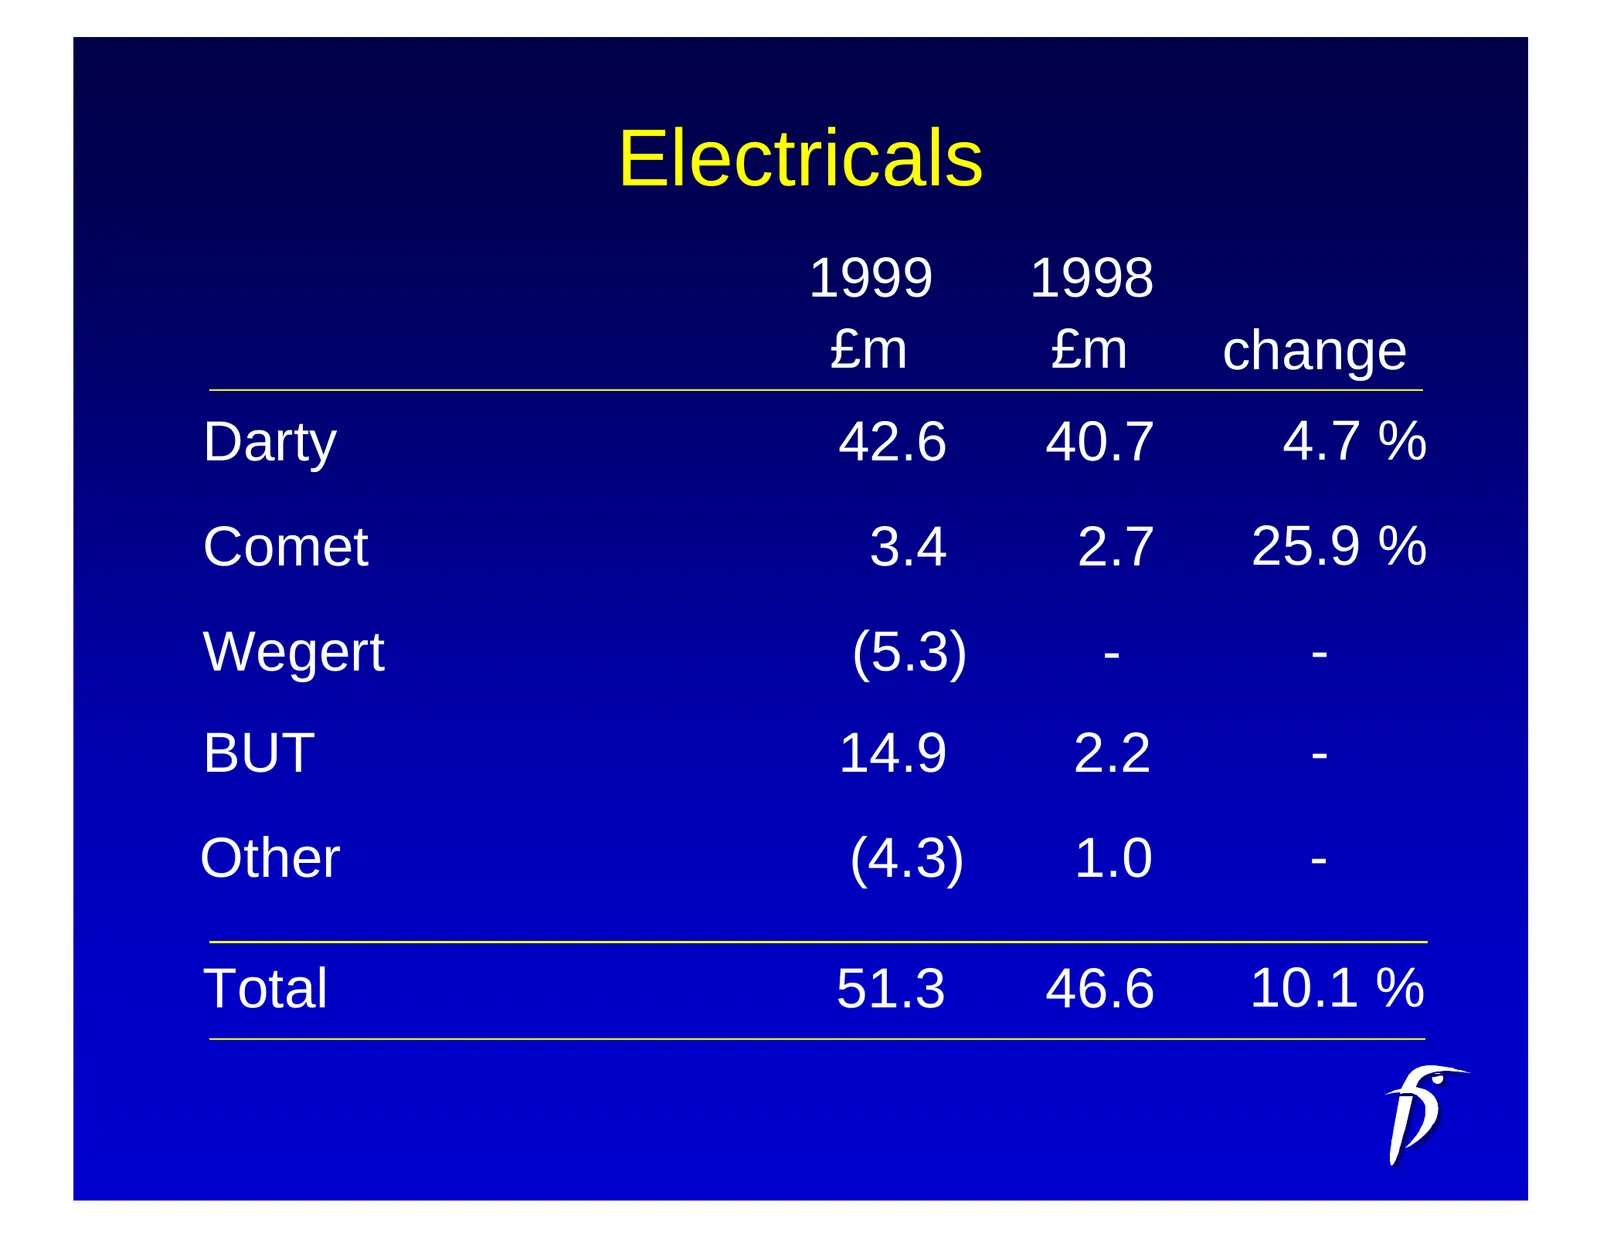
Electricals 1999 1998 £m £m change Darty 42.6 40.7 4.7 % Comet 3.4 2.7 25.9 % Wegert (5.3) - - BUT 14.9 2.2 - Other (4.3) 1.0 - Total 51.3 46.6 10.1 %
Slide 23: General Merchandise
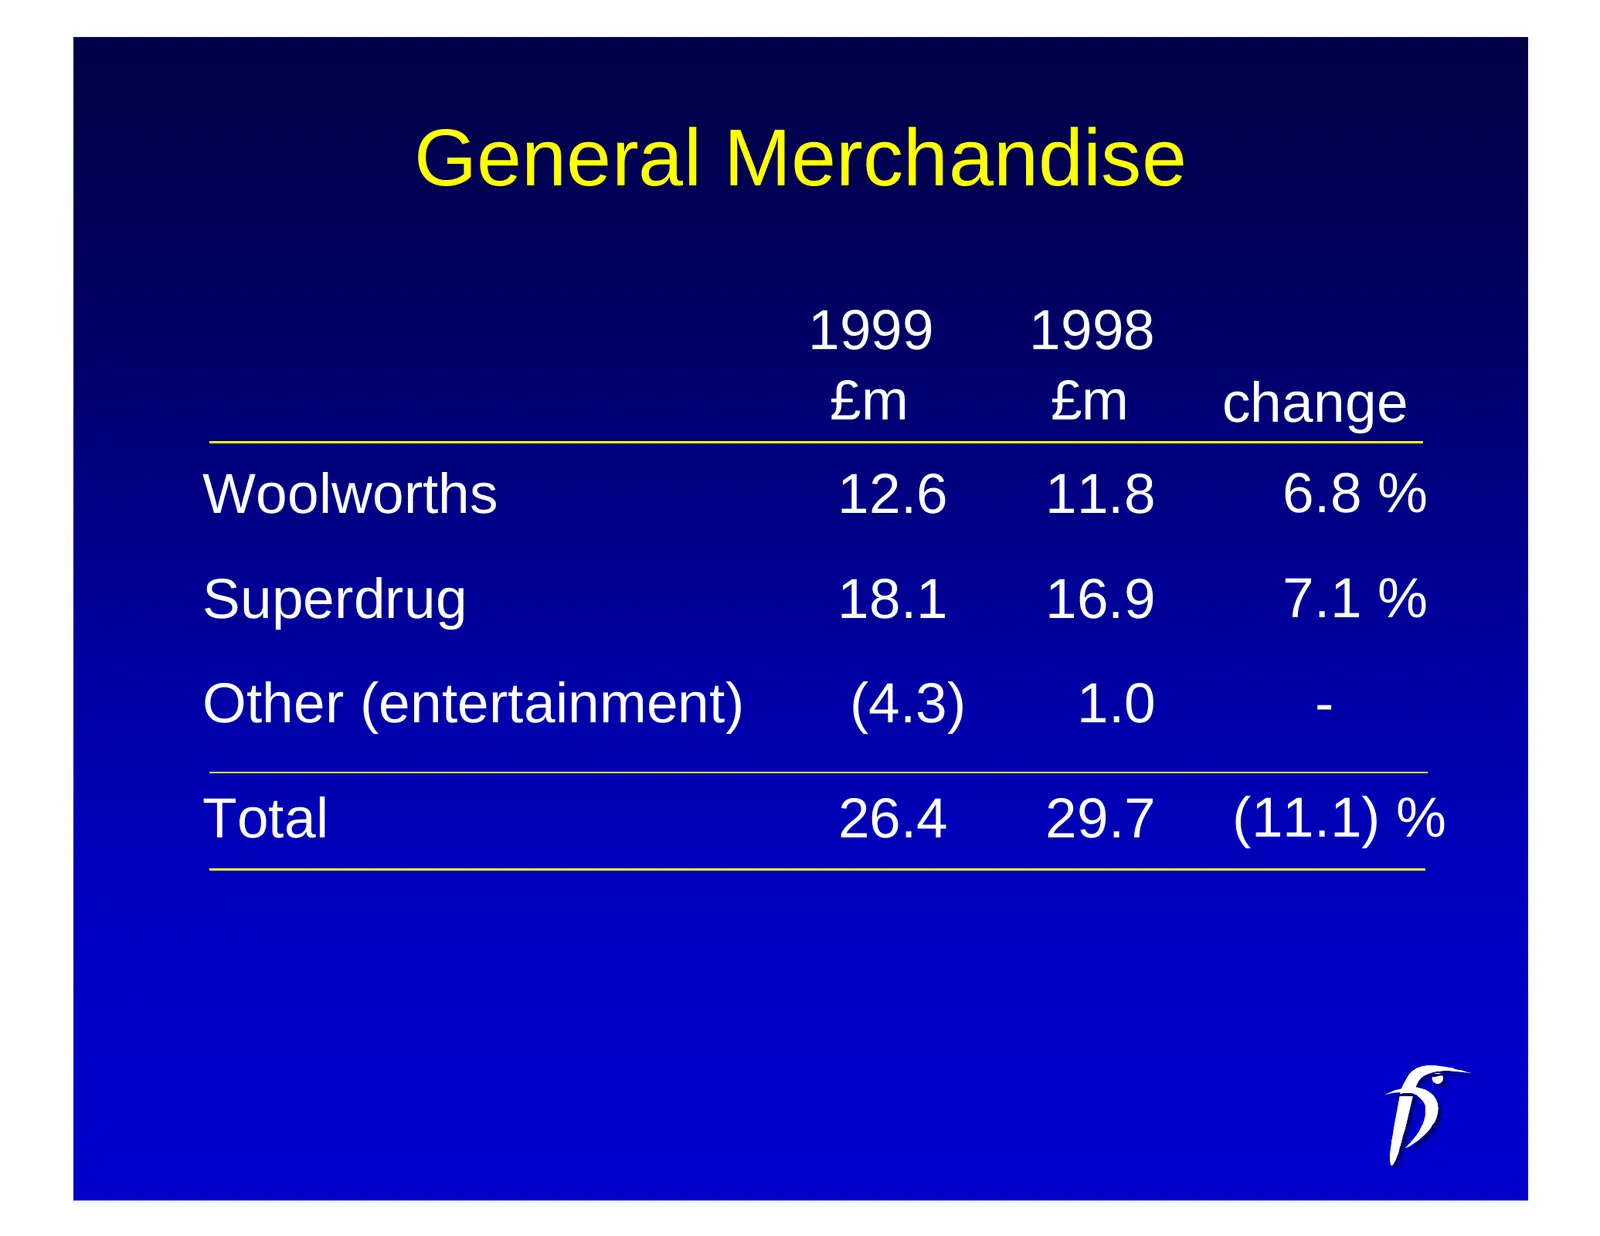
General Merchandise 1999 1998 £m £m change Woolworths 12.6 11.8 6.8 % Superdrug 18.1 16.9 7.1 % Other (entertainment) (4.3) 1.0 - Total 26.4 29.7 (11.1) %
Slide 24: Operating profit
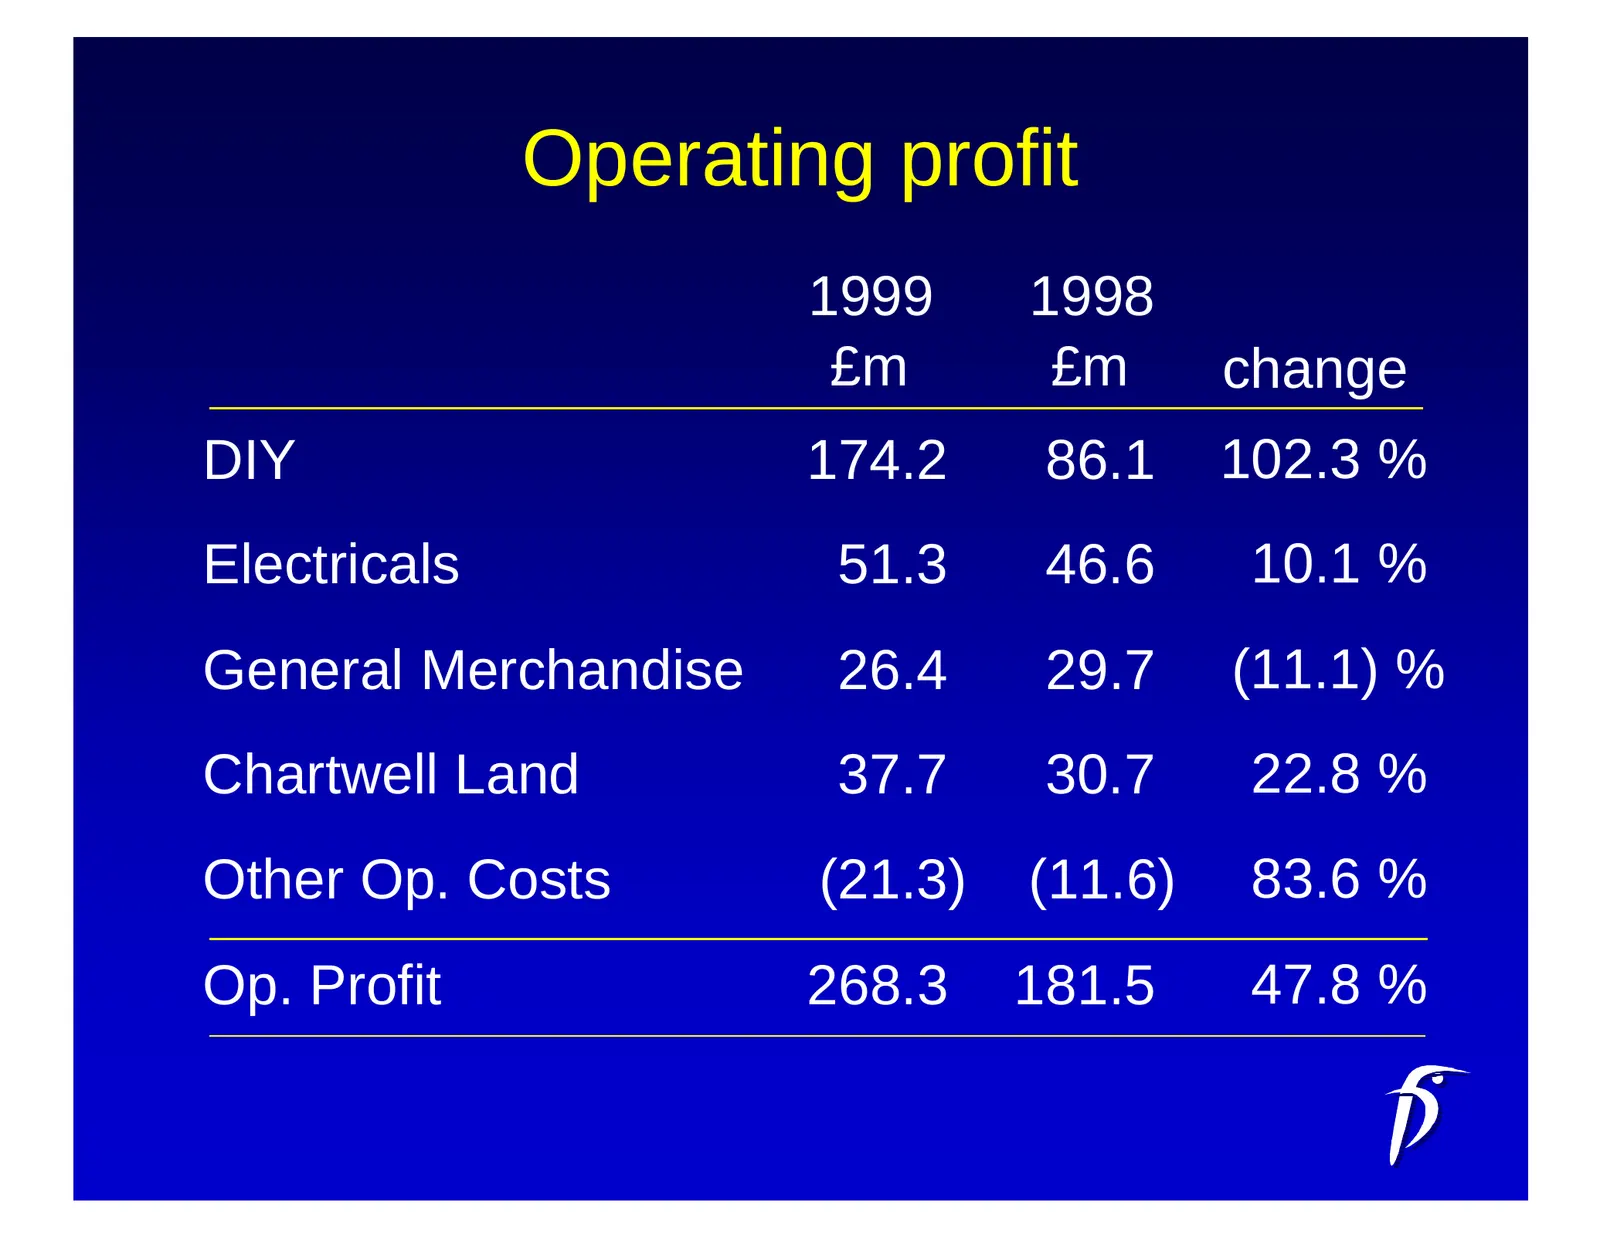
Operating profit 1999 1998 £m £m change DIY 174.2 86.1 102.3 % Electricals 51.3 46.6 10.1 % General Merchandise 26.4 29.7 (11.1) % Chartwell Land 37.7 30.7 22.8 % Other Op. Costs (21.3) (11.6) 83.6 % Op. Profit 268.3 181.5 47.8 %
Slide 25: Net debt
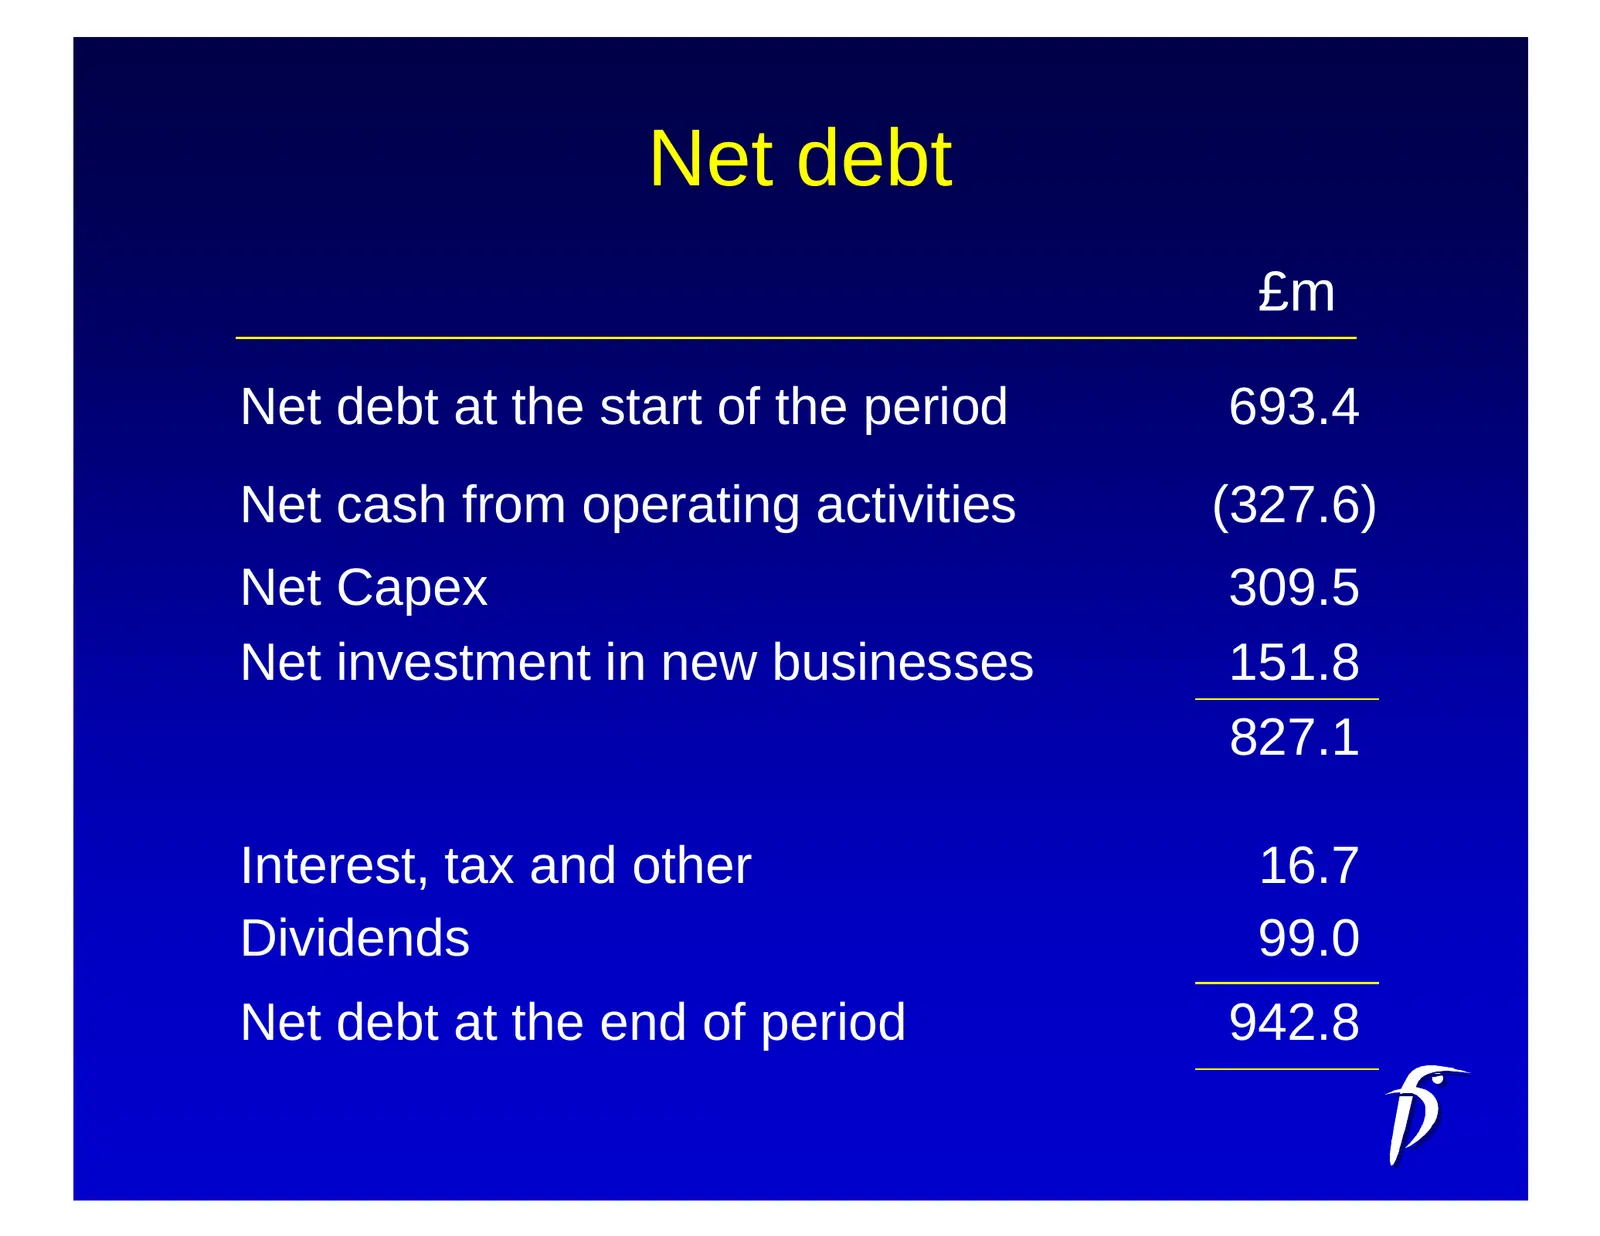
Net debt £m Net debt at the start of the period 693.4 Net cash from operating activities (327.6) Net Capex 309.5 Net investment in new businesses 151.8 827.1 Interest, tax and other 16.7 Dividends 99.0 Net debt at the end of period 942.8
Slide 26: Castorama/B&Q
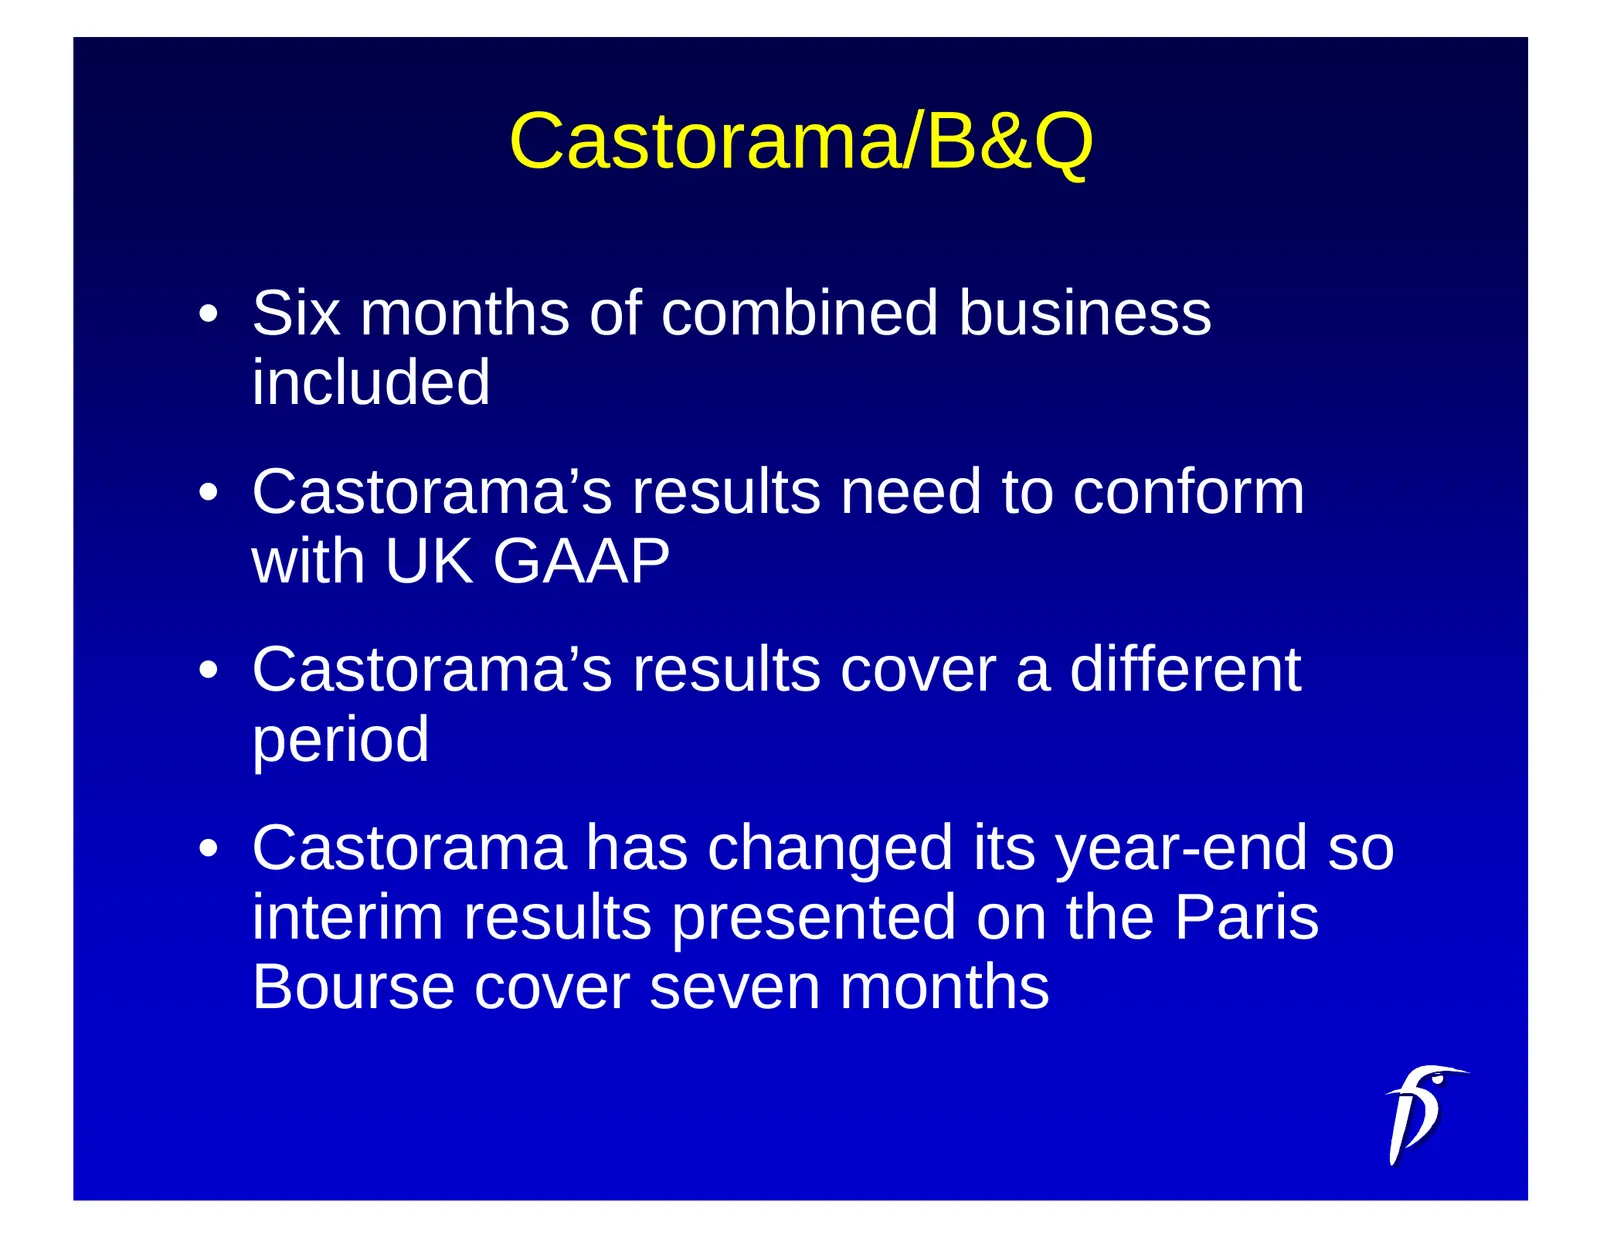
Castorama/B&Q • Six months of combined business included • Castorama’s results need to conform with UK GAAP • Castorama’s results cover a different period • Castorama has changed its year-end so interim results presented on the Paris Bourse cover seven months
Slide 27: Castorama sales
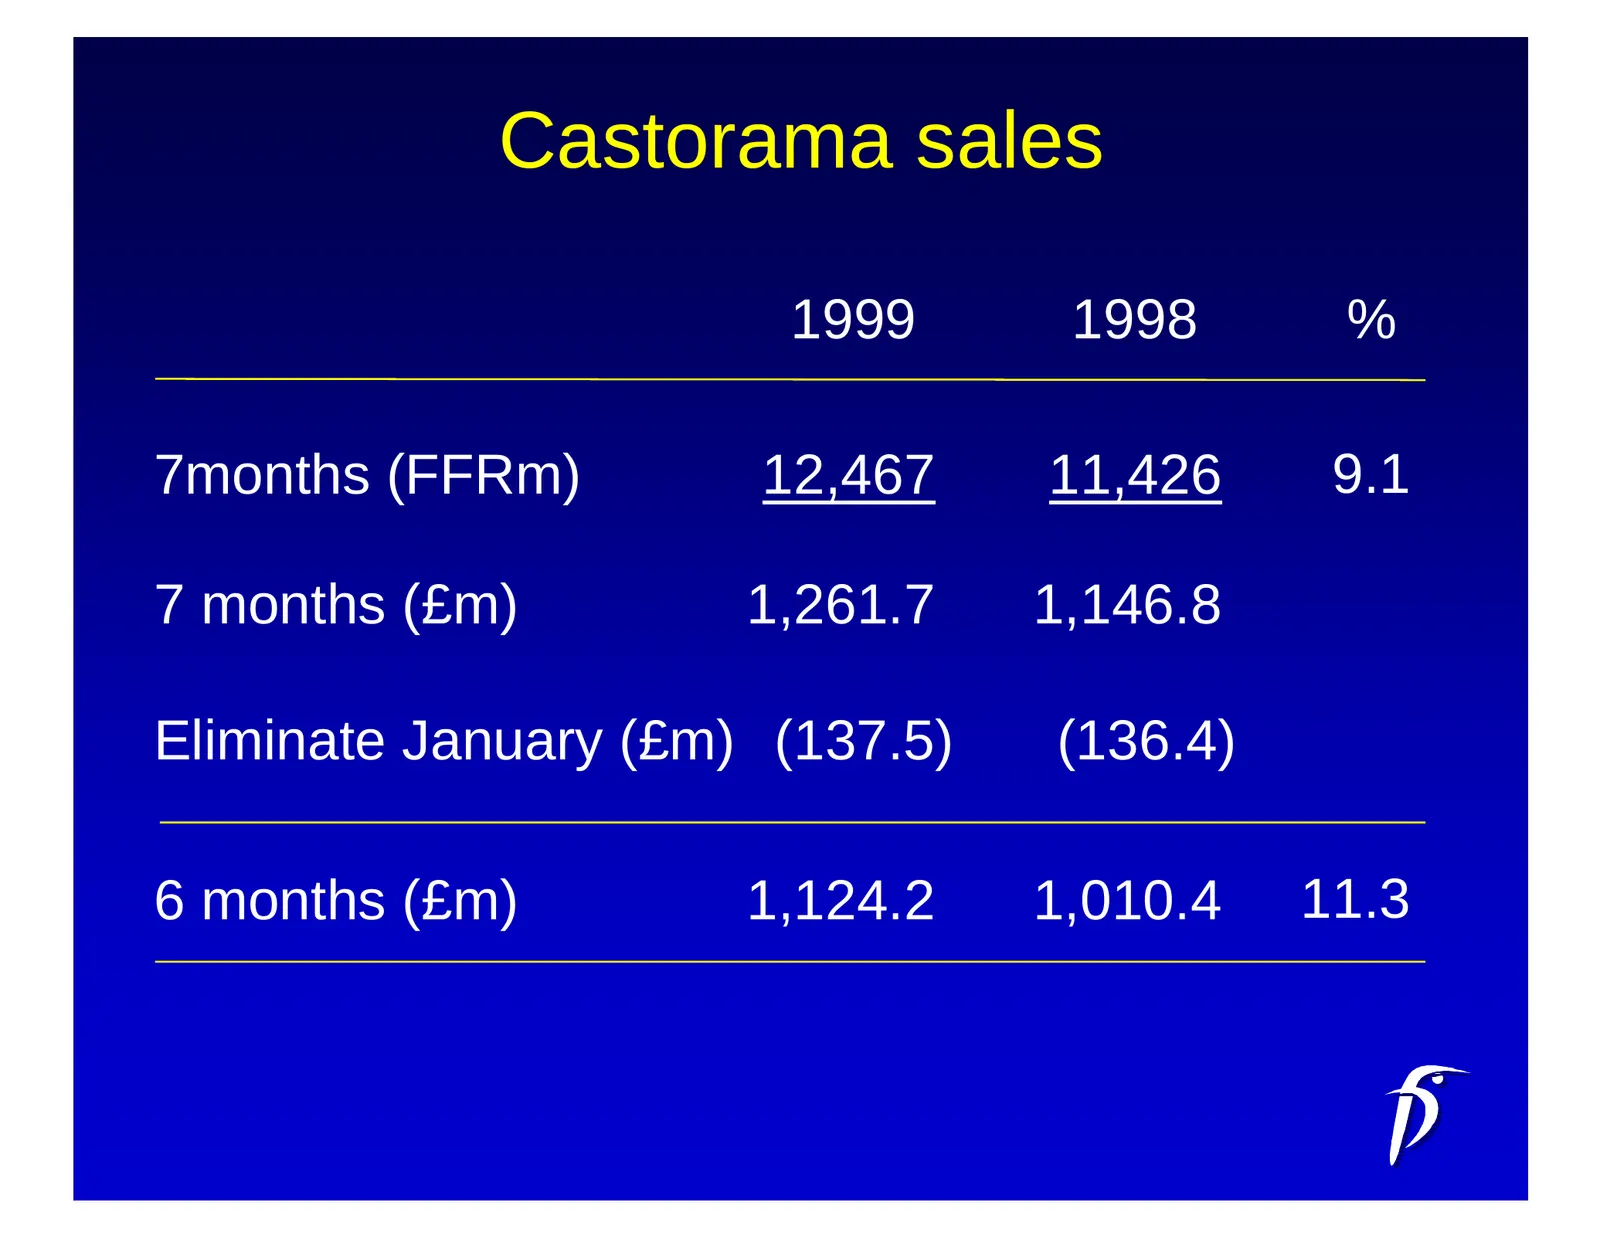
Castorama sales 1999 1998 % 7months (FFRm) 12,467 11,426 9.1 7 months (£m) 1,261.7 1,146.8 Eliminate January (£m) (137.5) (136.4) 6 months (£m) 1,124.2 1,010.4 11.3
Slide 28: Castorama profits
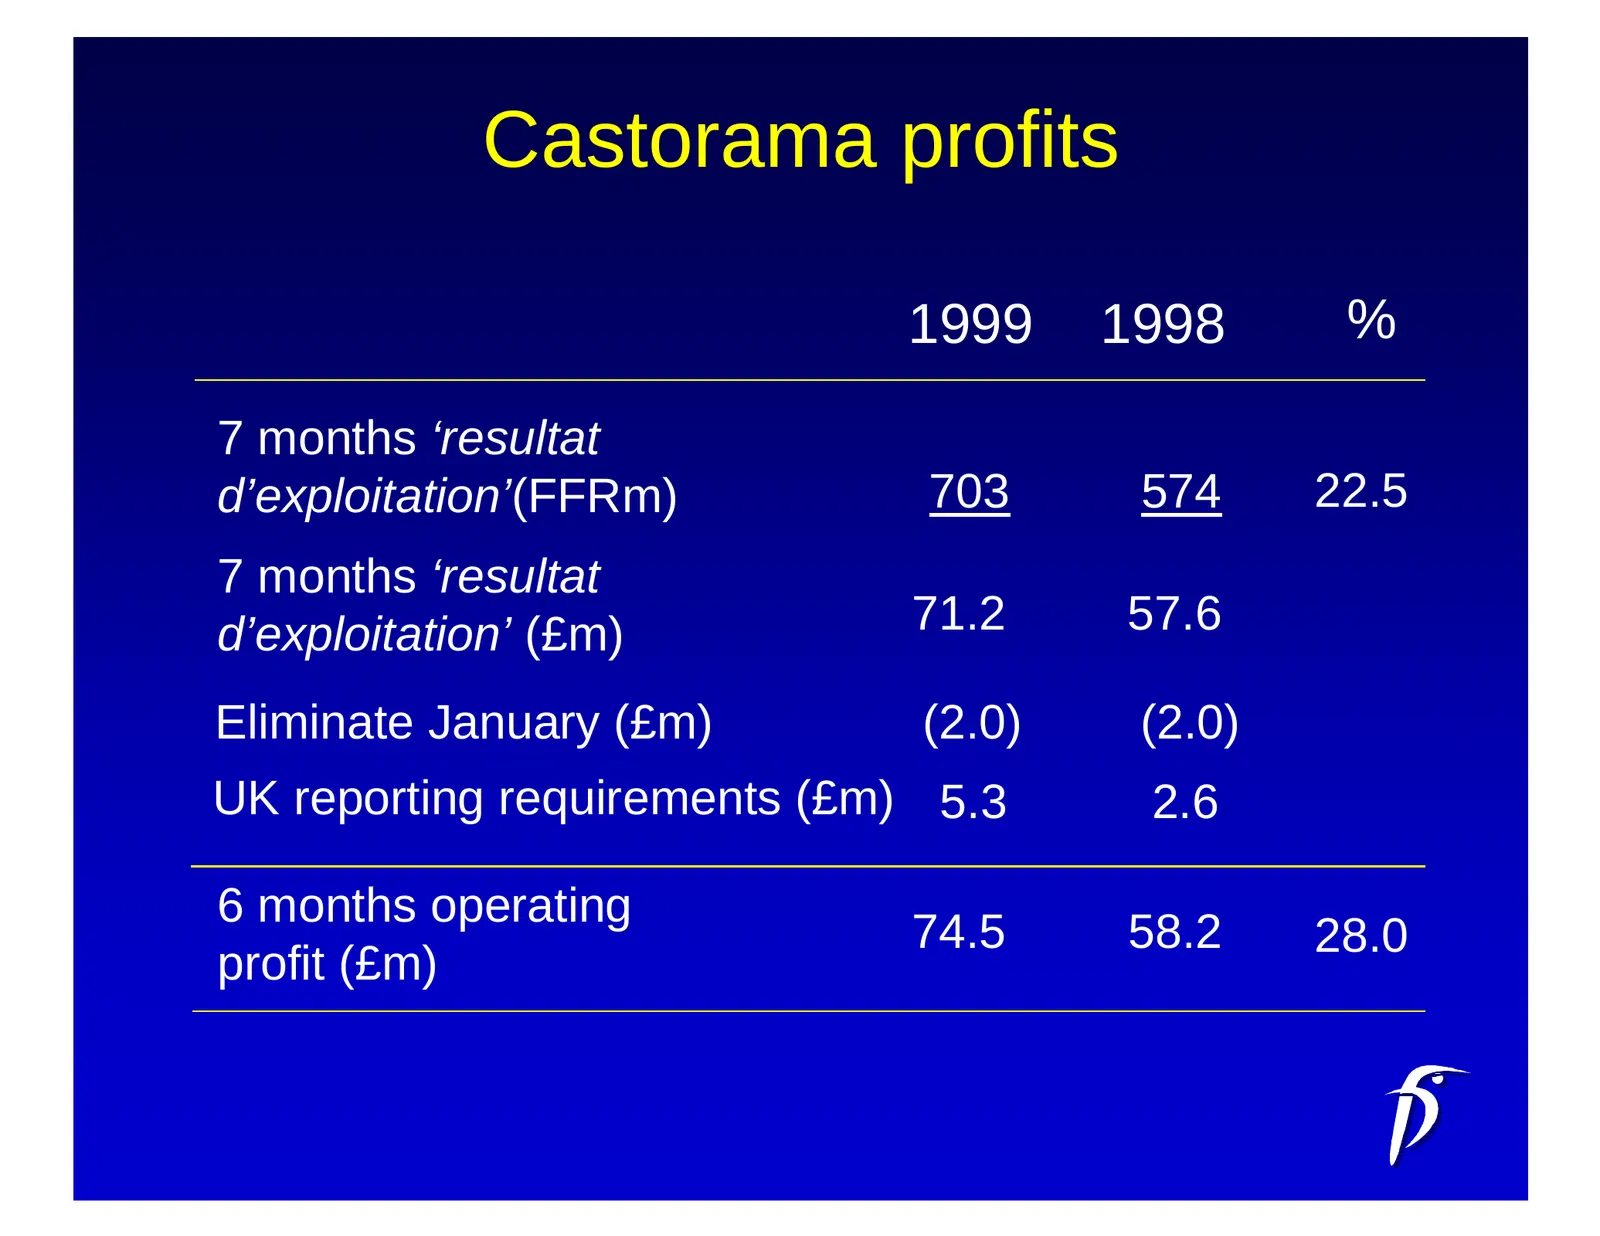
Castorama profits 1999 1998 % 7 months ‘resultat d’exploitation’(FFRm) 703 574 22.5 7 months ‘resultat d’exploitation’ (£m) 71.2 57.6 Eliminate January (£m) (2.0) (2.0) UK reporting requirements (£m) 5.3 2.6 6 months operating 74.5 58.2 28.0 profit (£m)
Slide 29: Combined B&Q/Castorama sales
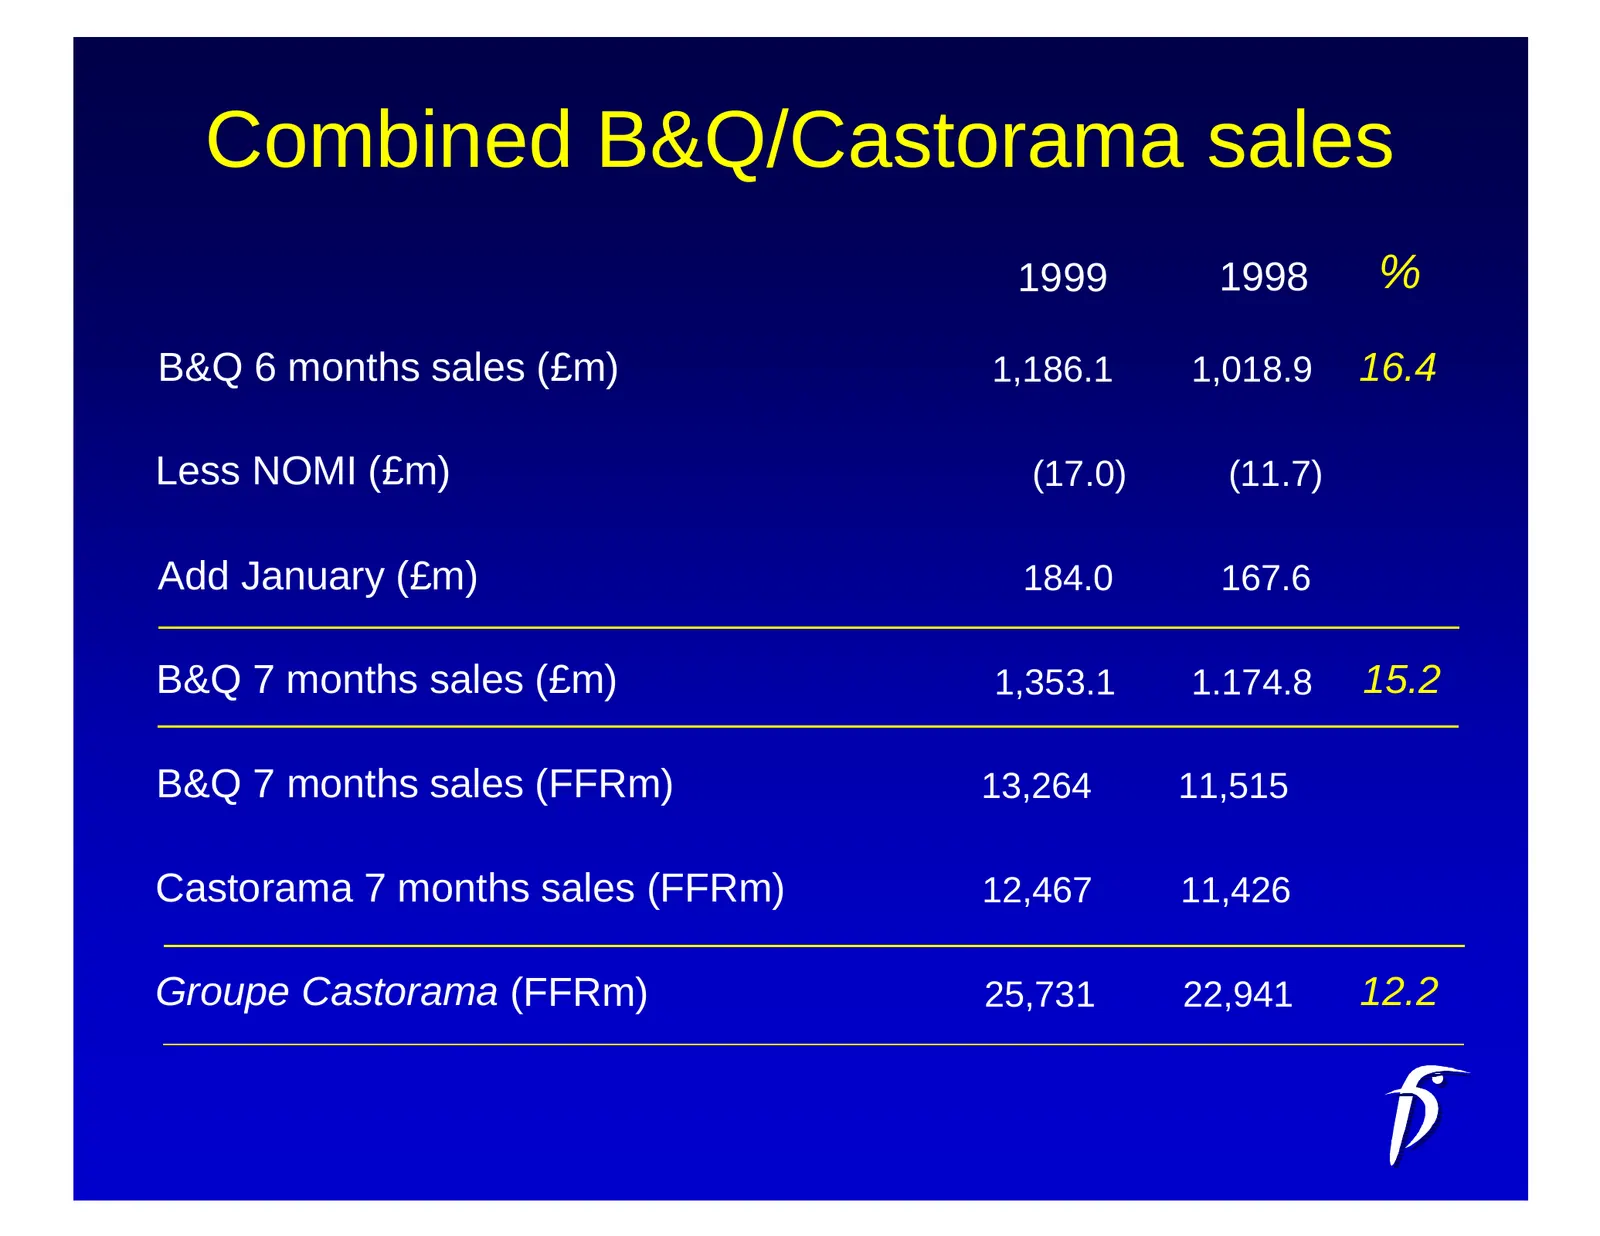
Combined B&Q/Castorama sales 1999 1998 % B&Q 6 months sales (£m) 1,186.1 1,018.9 16.4 Less NOMI (£m) (17.0) (11.7) Add January (£m) 184.0 167.6 B&Q 7 months sales (£m) 1,353.1 1.174.8 15.2 B&Q 7 months sales (FFRm) 13,264 11,515 Castorama 7 months sales (FFRm) 12,467 11,426 Groupe Castorama (FFRm) 2
Slide 30: Combined B&Q/Castorama profits
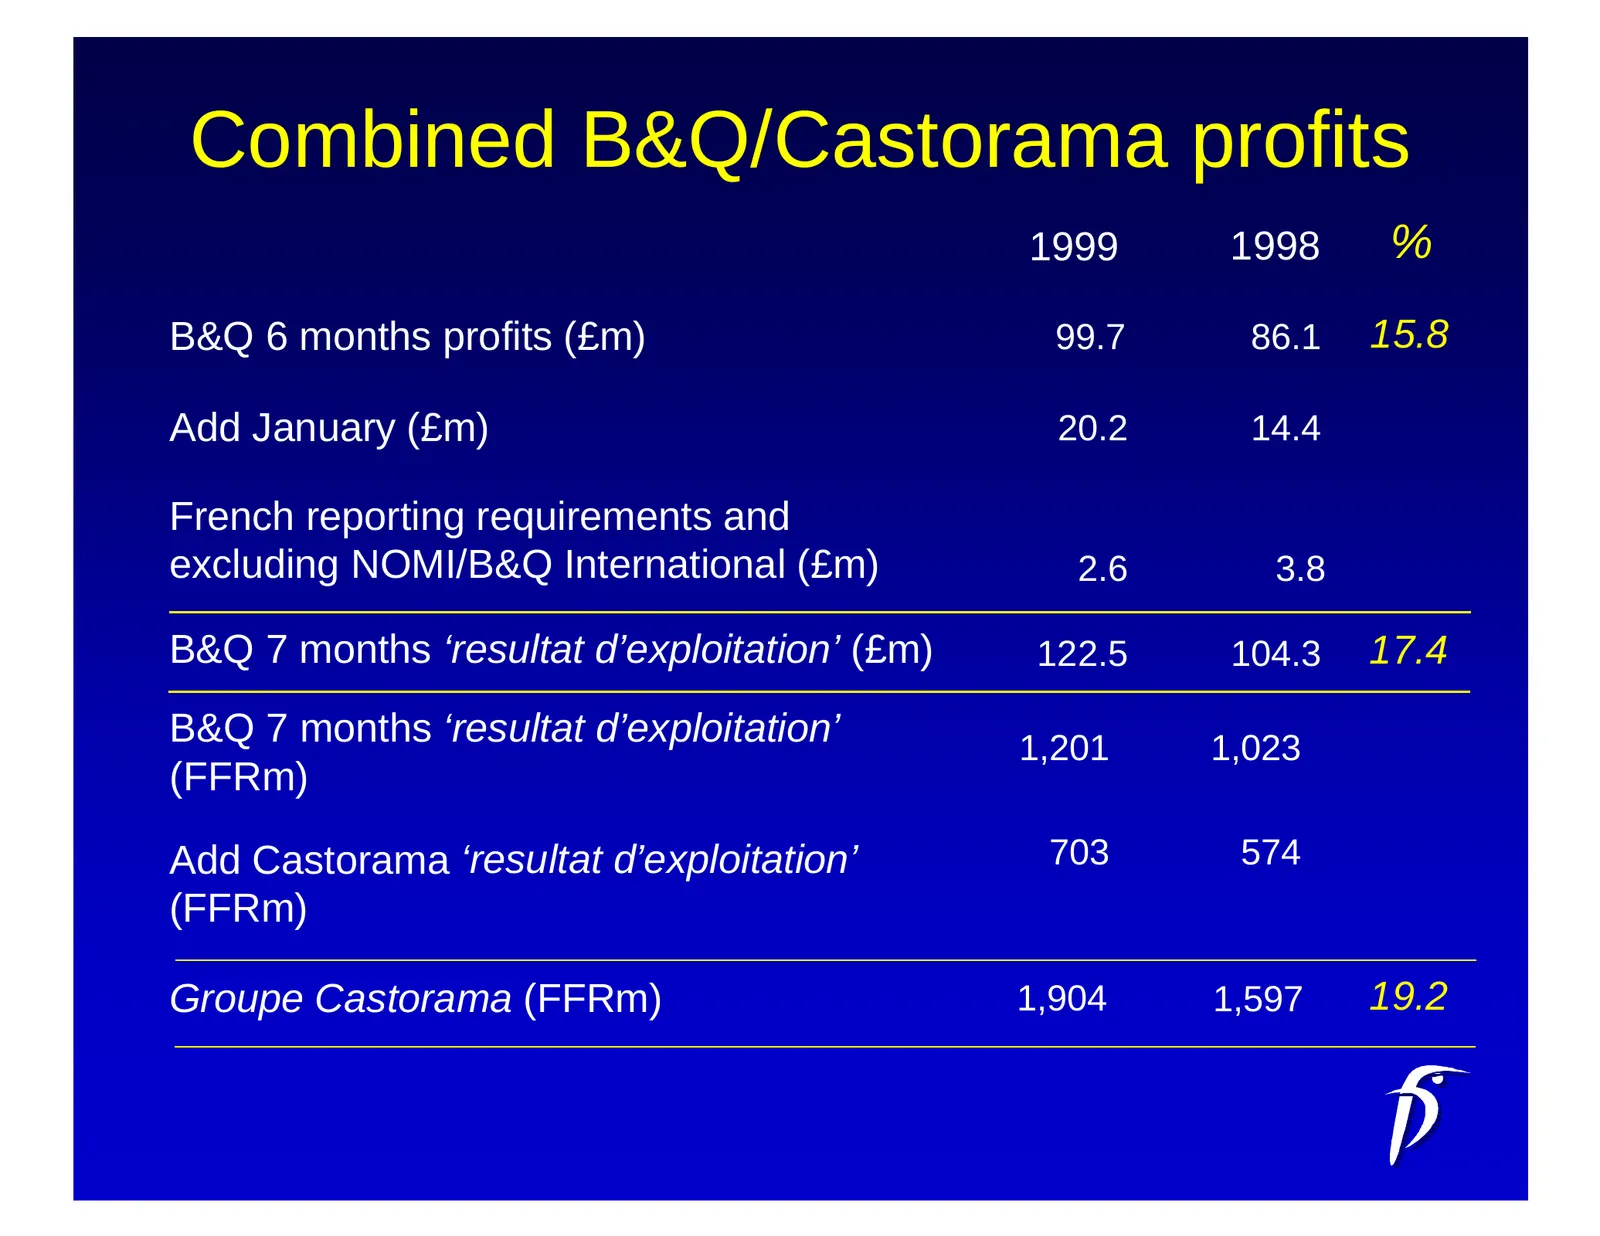
Combined B&Q/Castorama profits 1999 1998 % B&Q 6 months profits (£m) 99.7 86.1 15.8 Add January (£m) 20.2 14.4 French reporting requirements and excluding NOMI/B&Q International (£m) 2.6 3.8 B&Q 7 months ‘resultat d’exploitation’ (£m) 122.5 104.3 17.4 B&Q 7 months ‘resultat d’exploitation’ 1,201 1,0

Slide 31: Key progress
KINGPDSHER Key progress
Slide 32: Kingfisher DIY
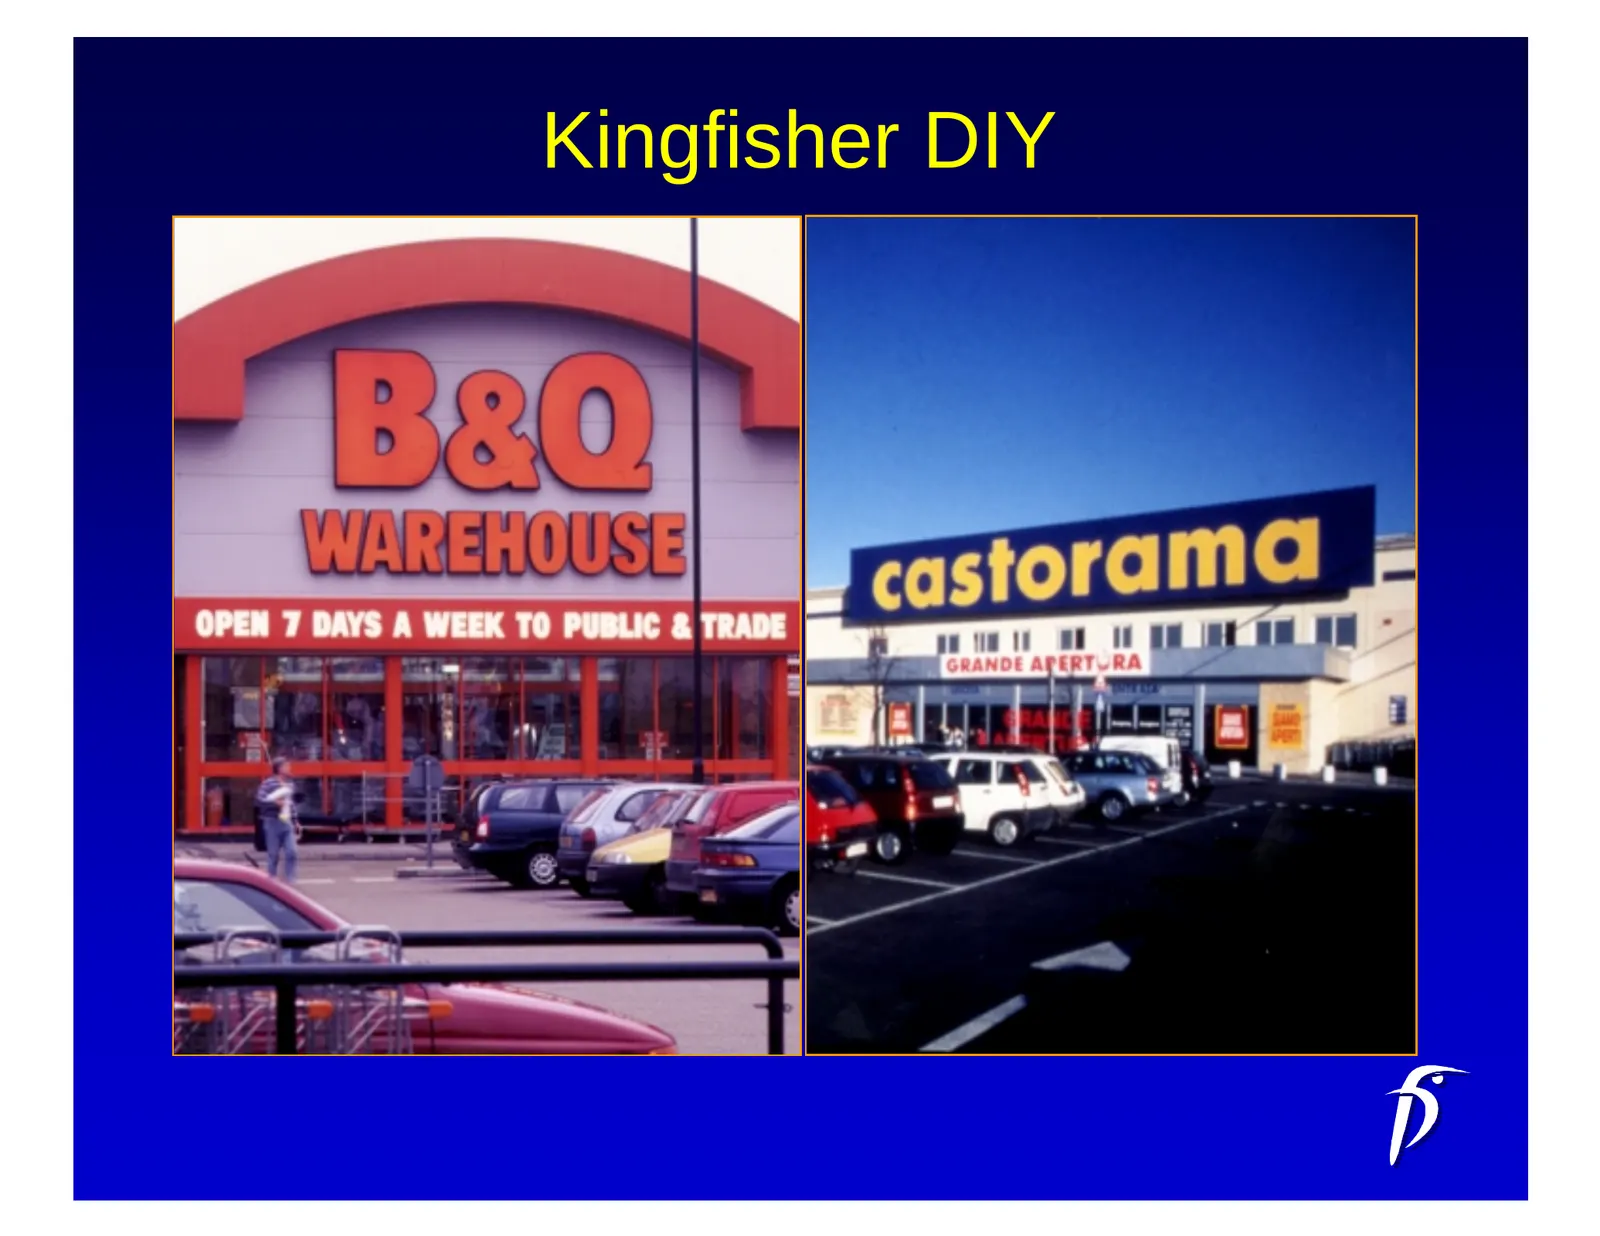
Kingfisher DIY Se tient | aT R =
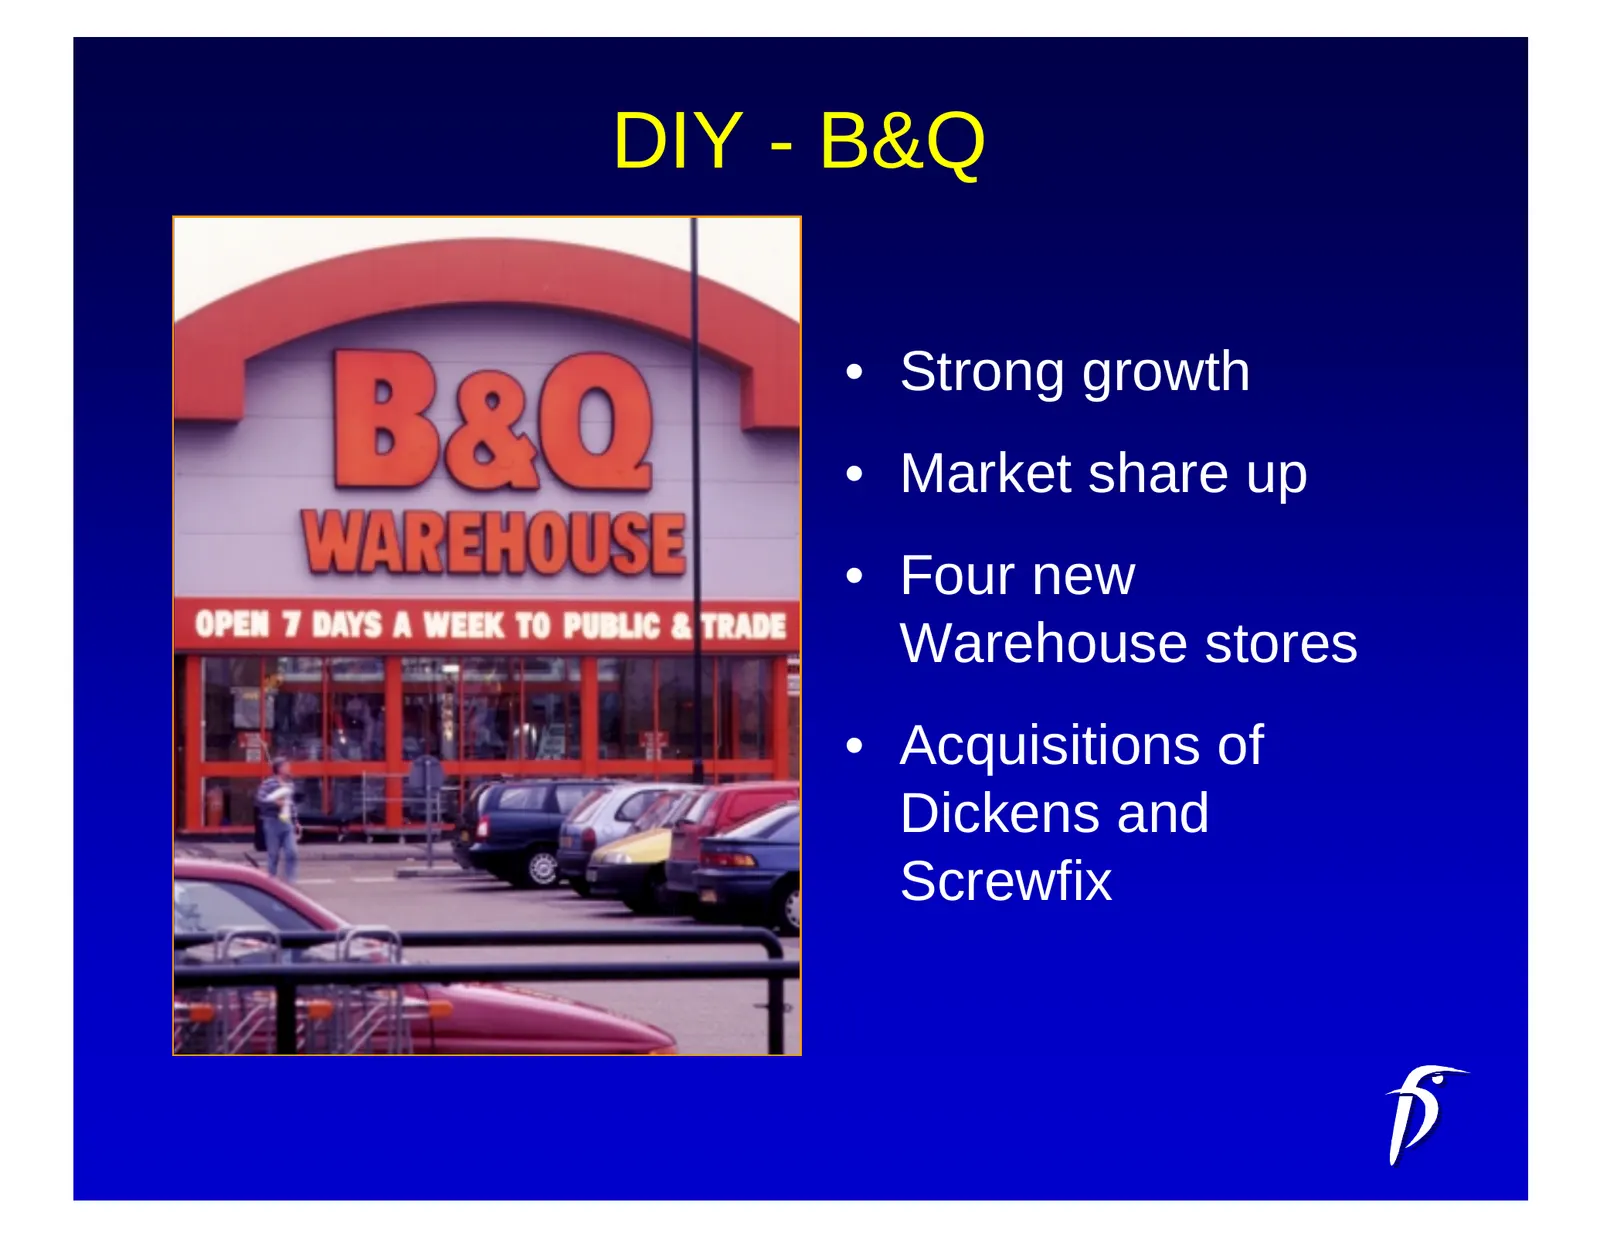
Slide 33: DIY - B&Q
DIY - B&Q • Strong growth • Market share up • Four new Warehouse stores • Acquisitions of Dickens and Screwfix
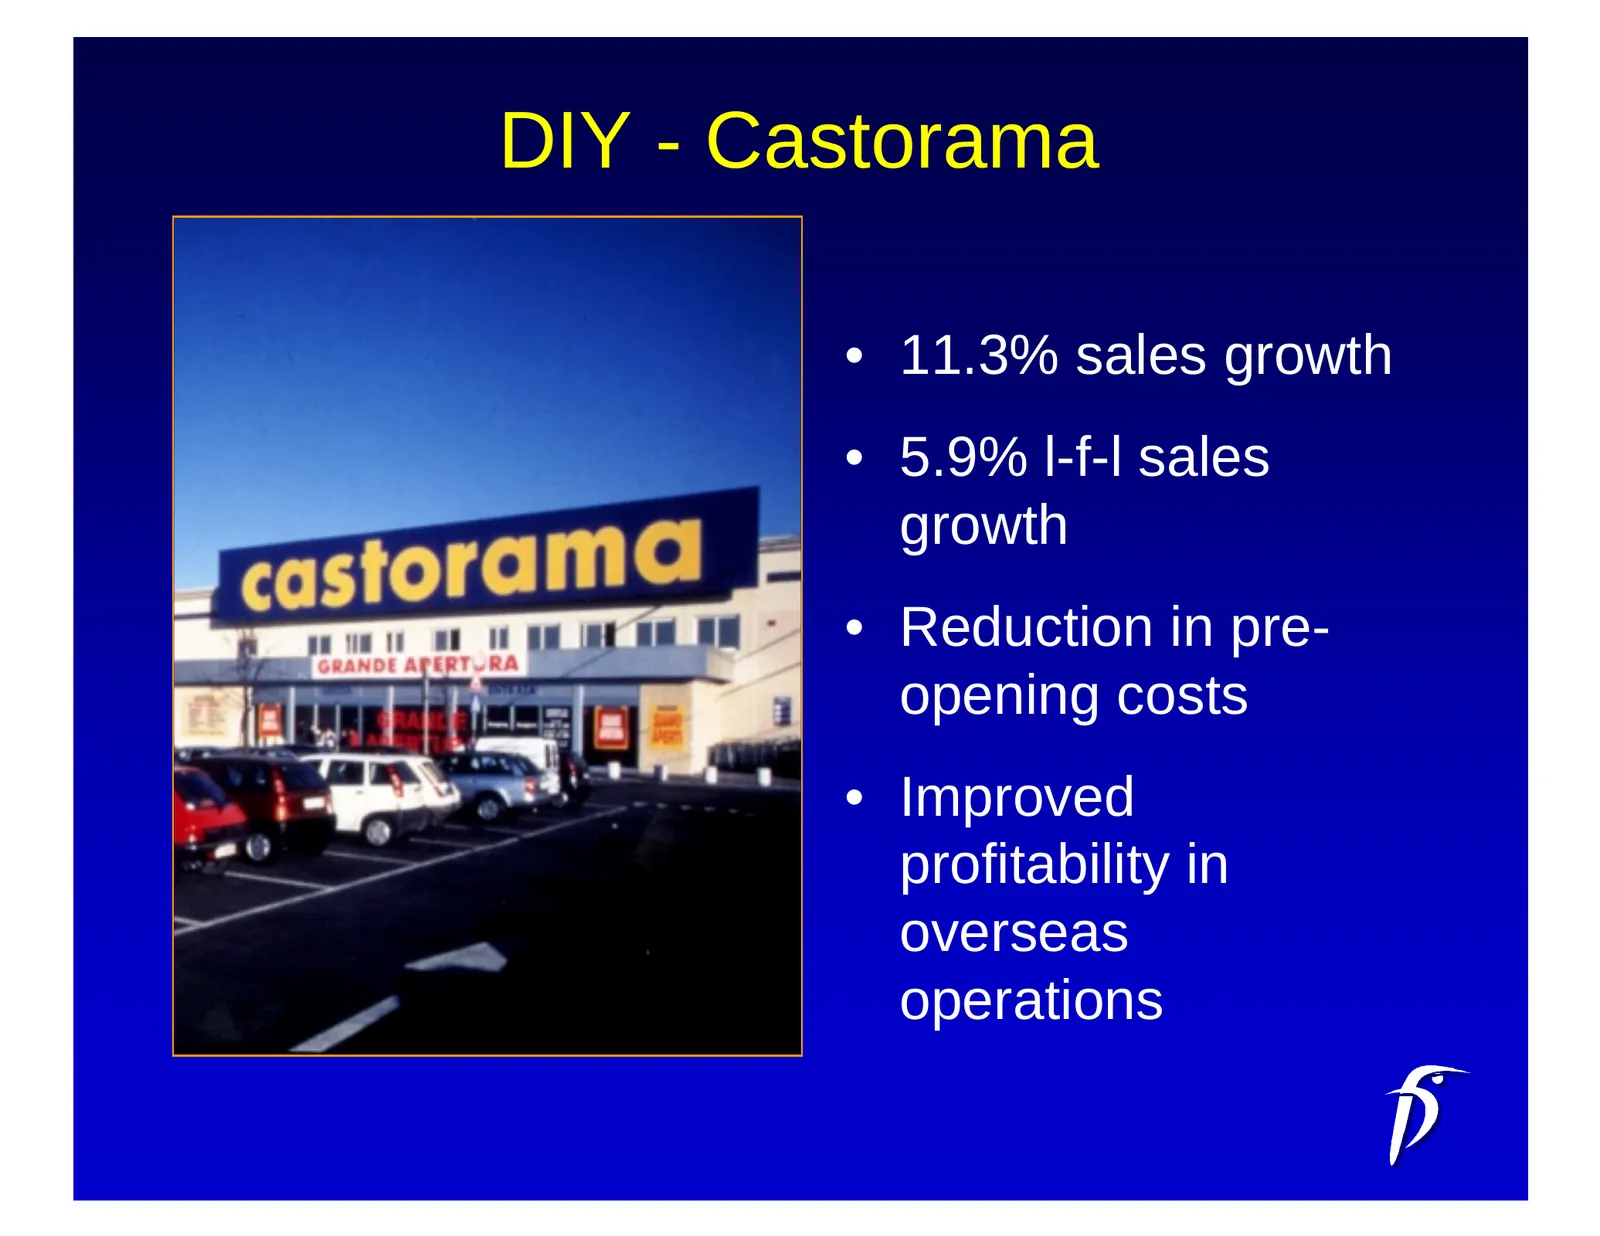
Slide 34: DIY - Castorama
DIY - Castorama • 11.3% sales growth • 5.9% l-f-l sales growth • Reduction in pre- opening costs • Improved profitability in overseas operations
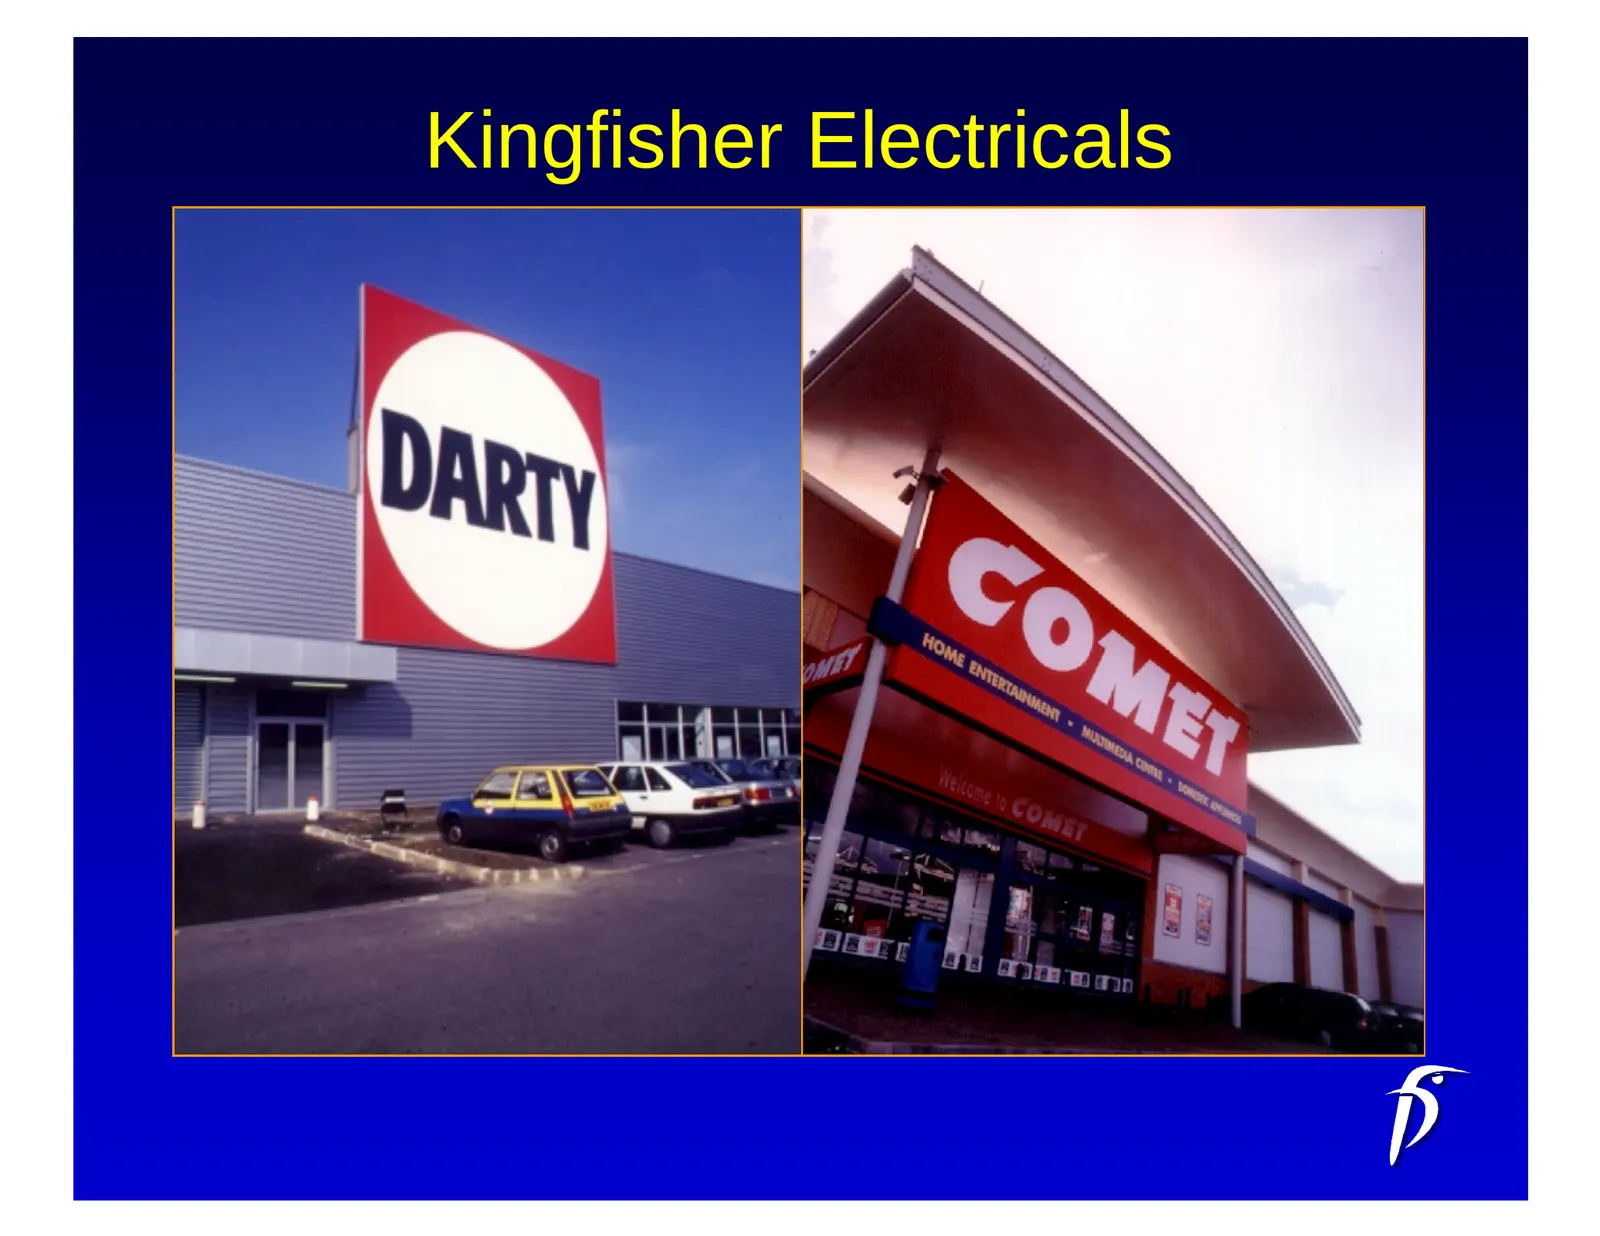
Slide 35: Kingfisher Electricals
Kingfisher Electricals
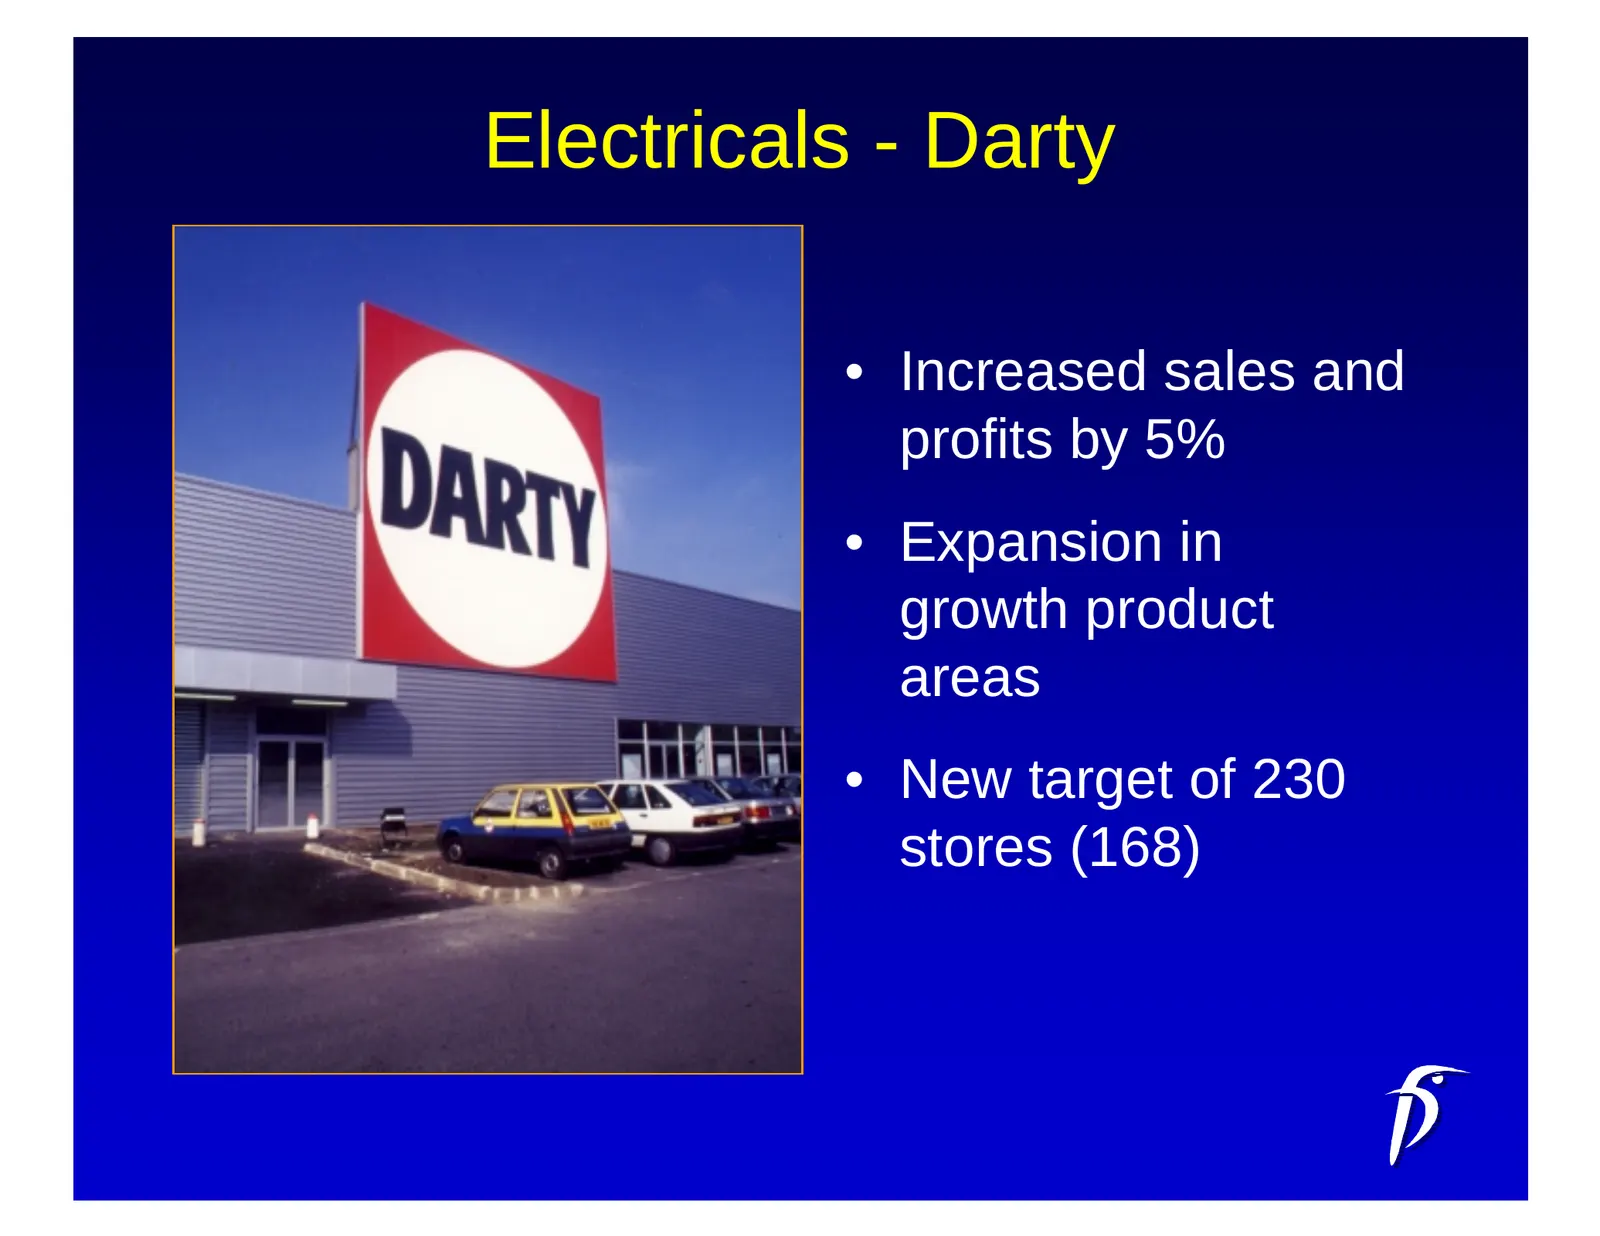
Slide 36: Electricals - Darty
Electricals - Darty • Increased sales and profits by 5% • Expansion in growth product areas • New target of 230 stores (168)
Slide 37: Electricals - BUT
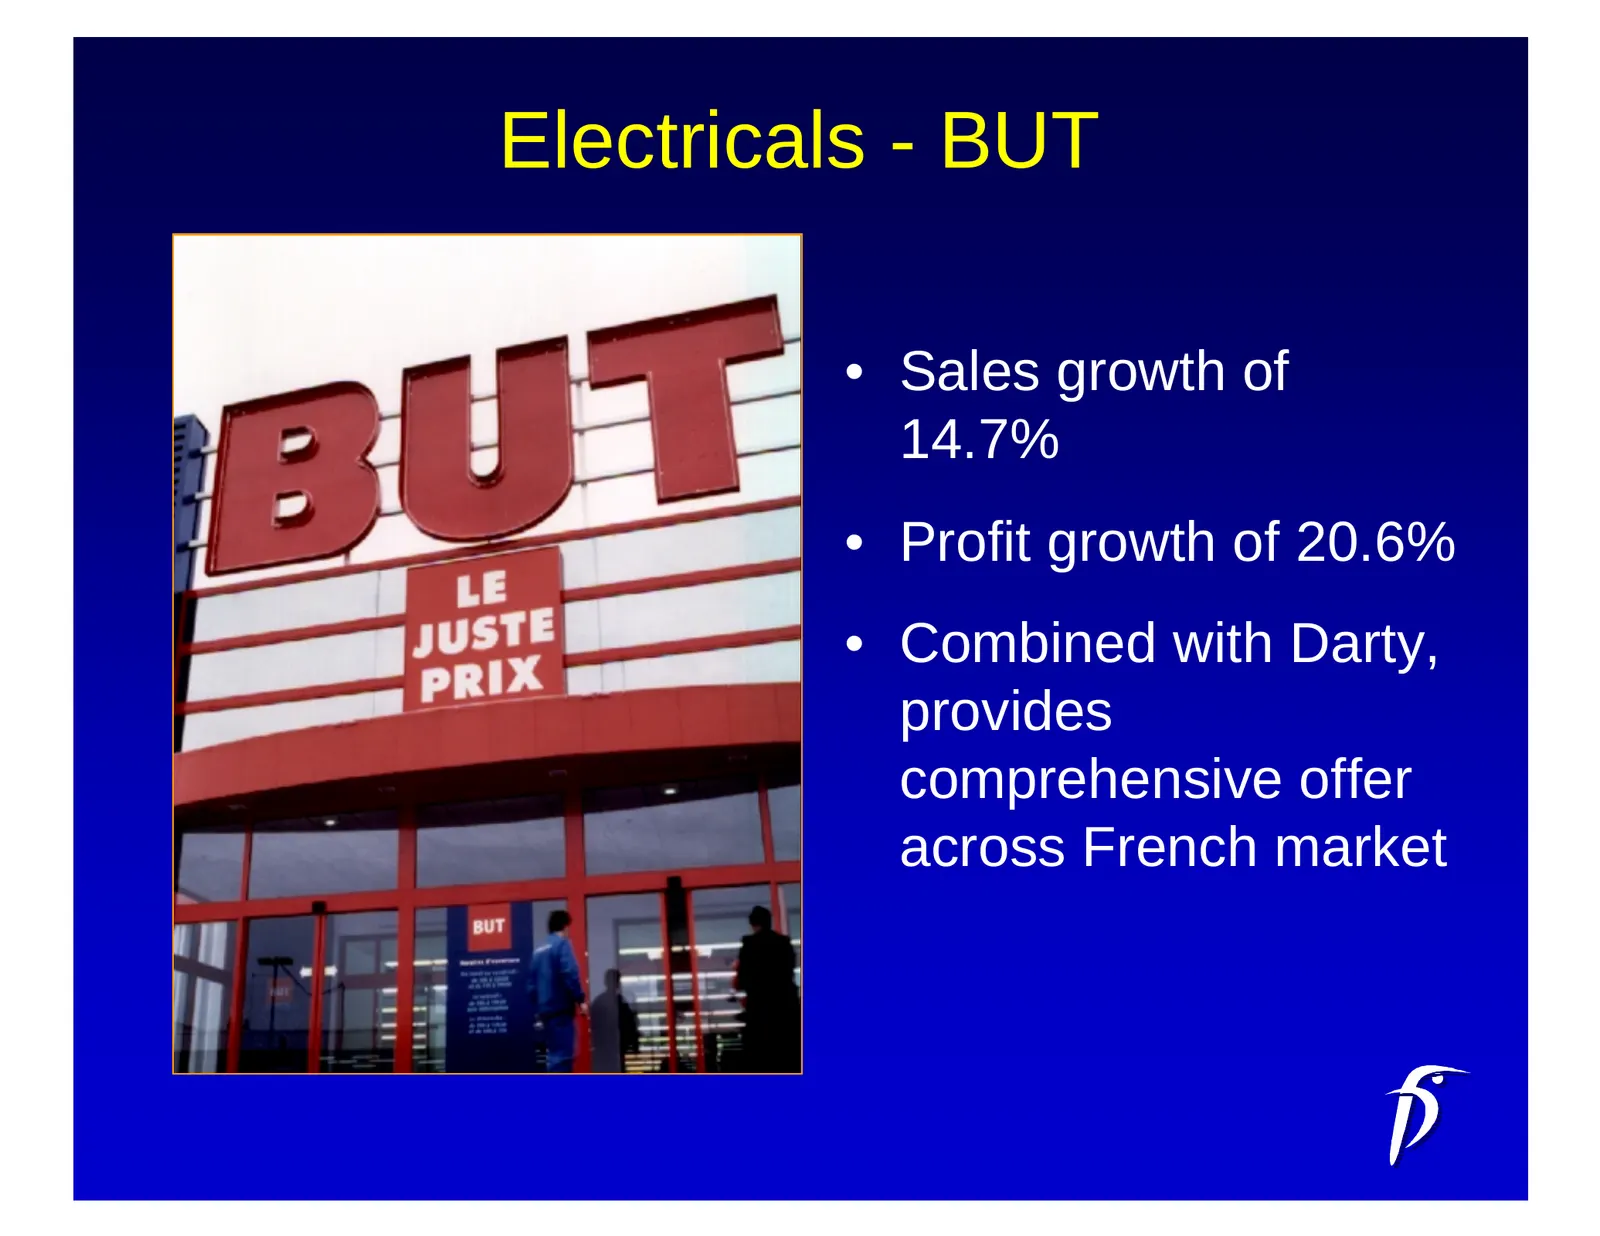
Electricals - BUT • Sales growth of 14.7% • Profit growth of 20.6% • Combined with Darty, provides comprehensive offer across French market
Slide 38: Electricals - Comet
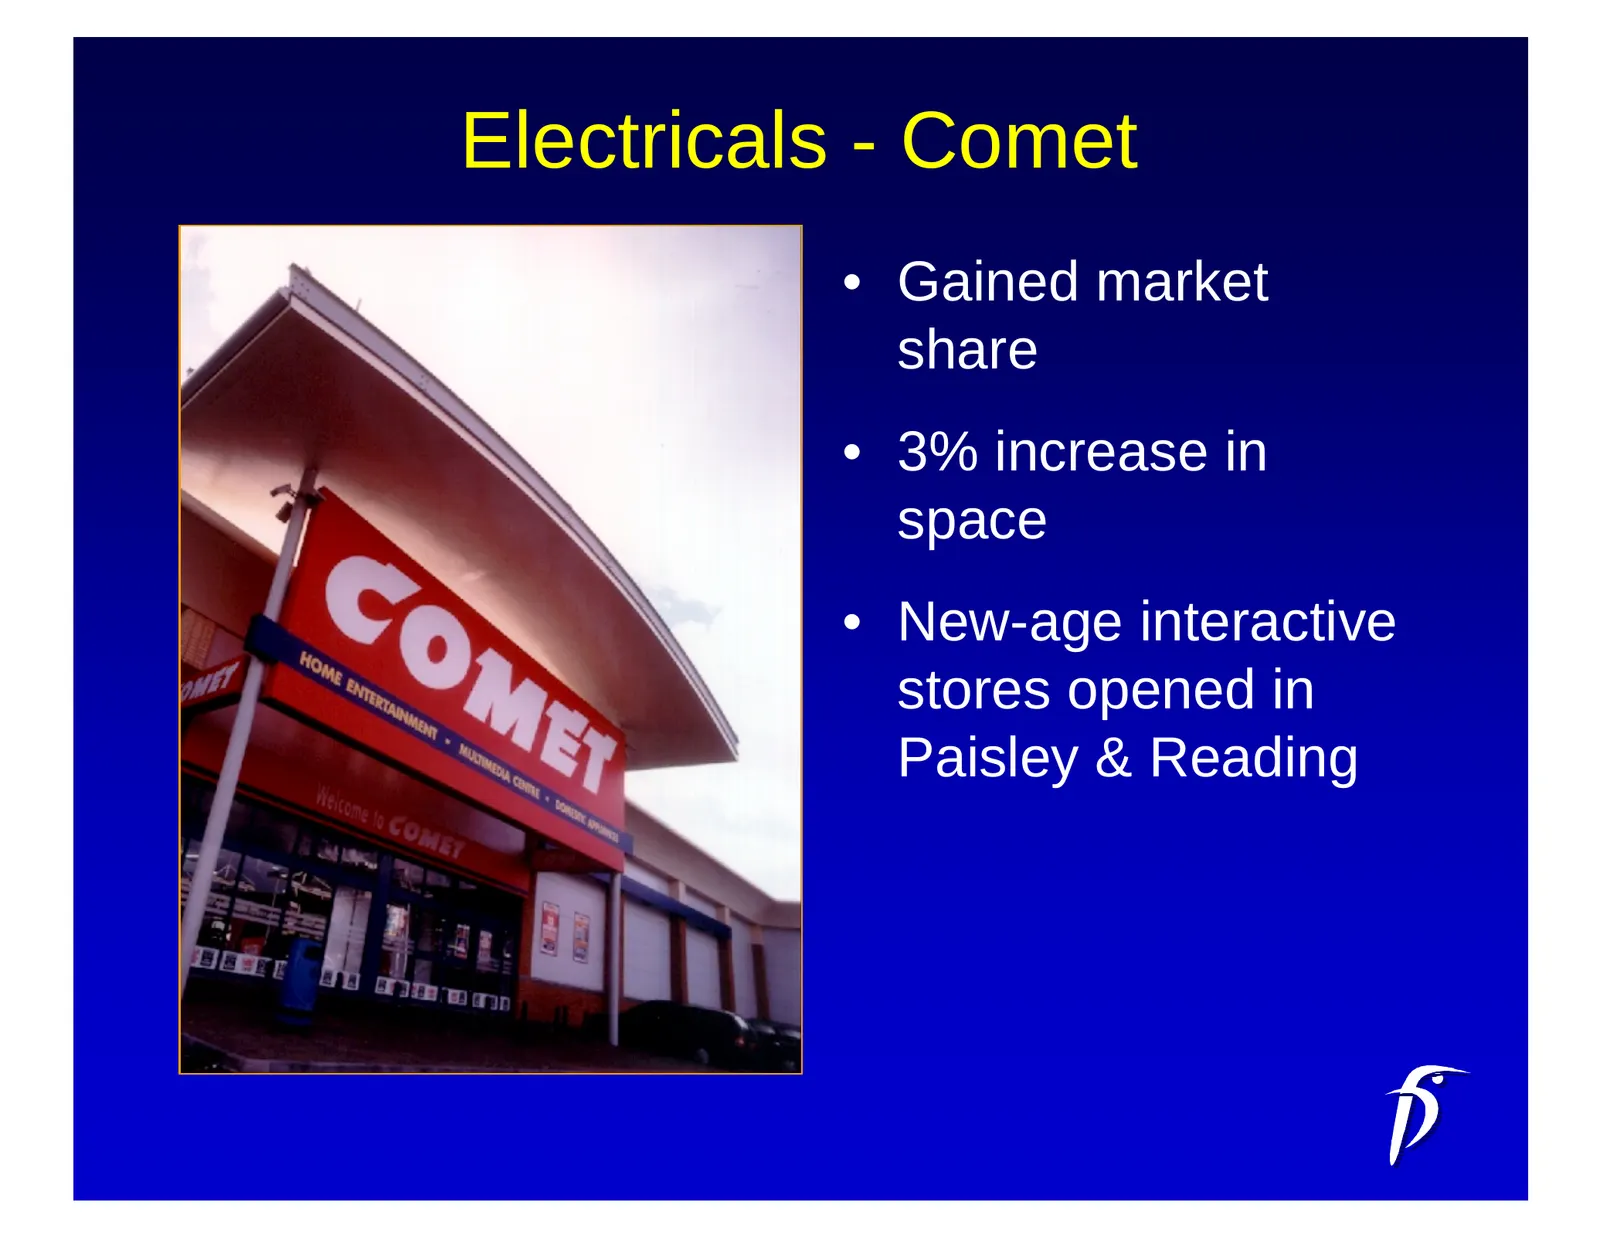
Electricals - Comet • Gained market share • 3% increase in space • New-age interactive stores opened in Paisley & Reading
Slide 39: Electricals - Wegert
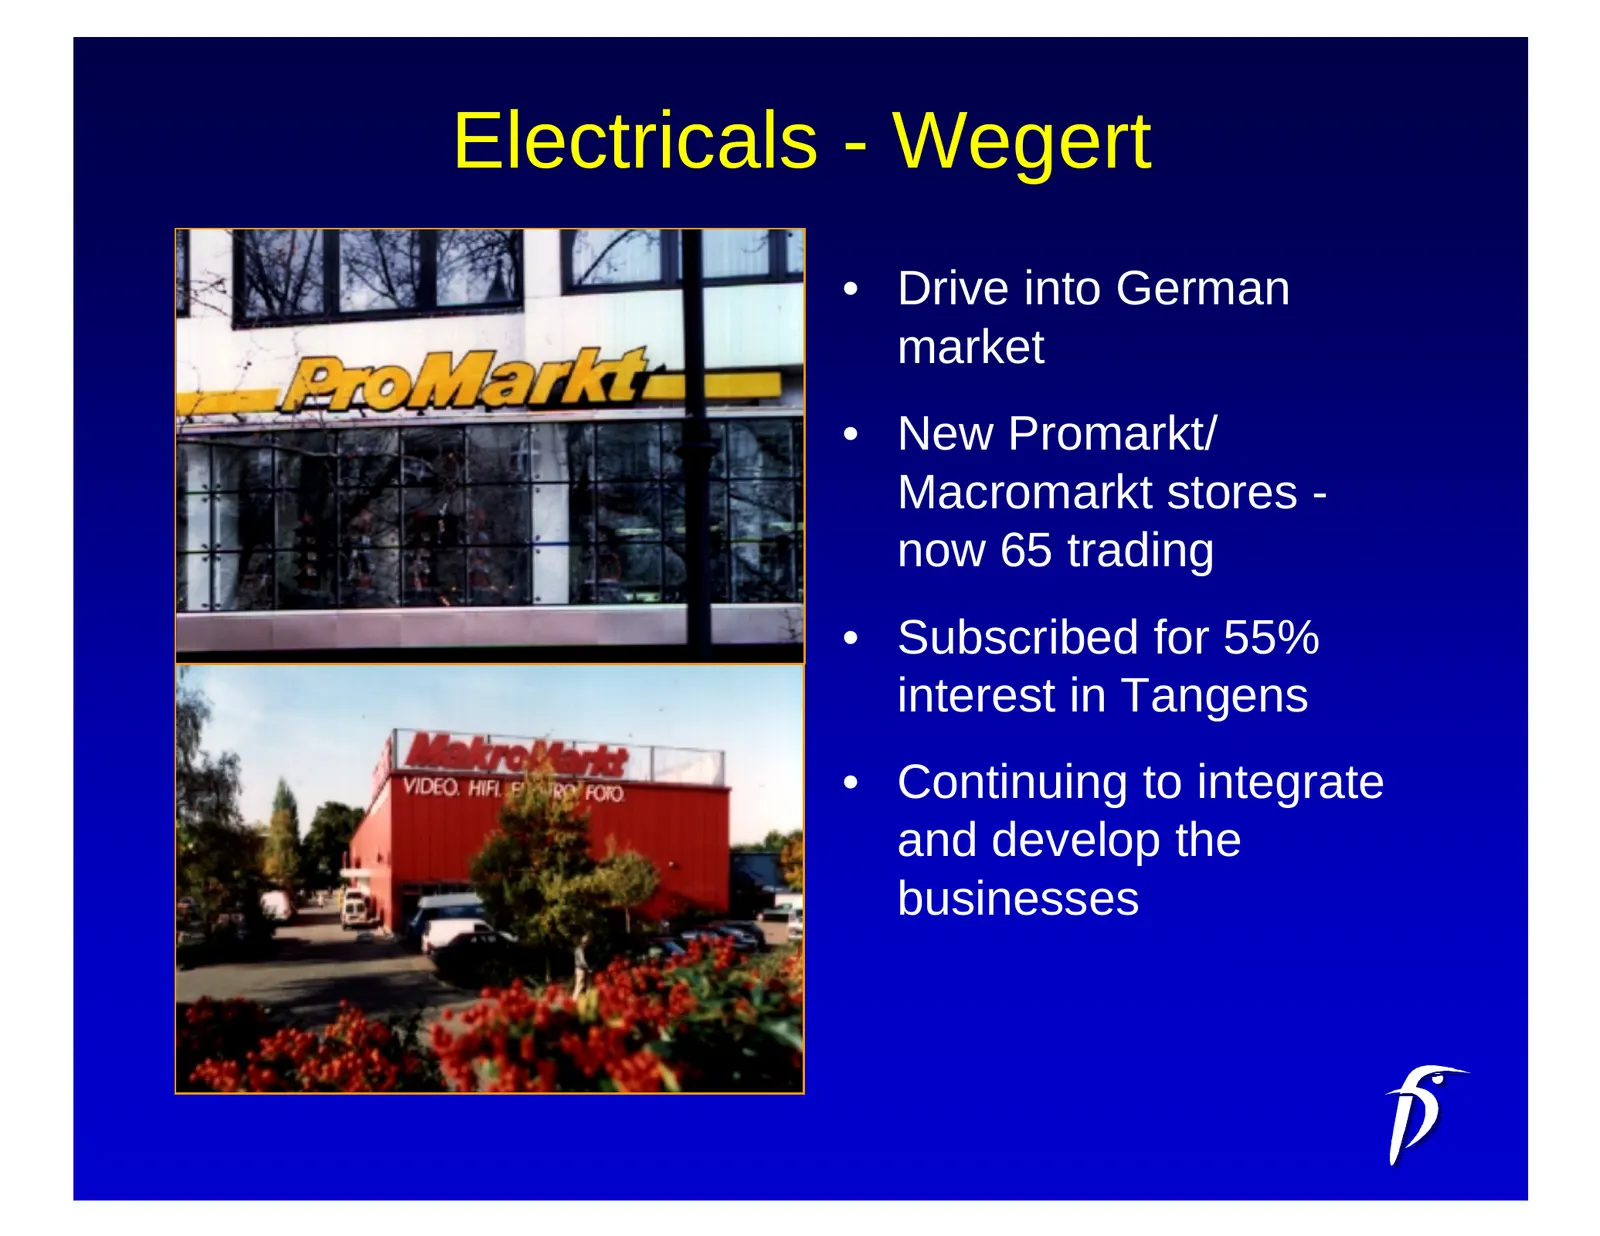
Electricals - Wegert • Drive into German market • New Promarkt/ Macromarkt stores - now 65 trading • Subscribed for 55% interest in Tangens • Continuing to integrate and develop the businesses
Slide 40: Kingfisher General Merchandise
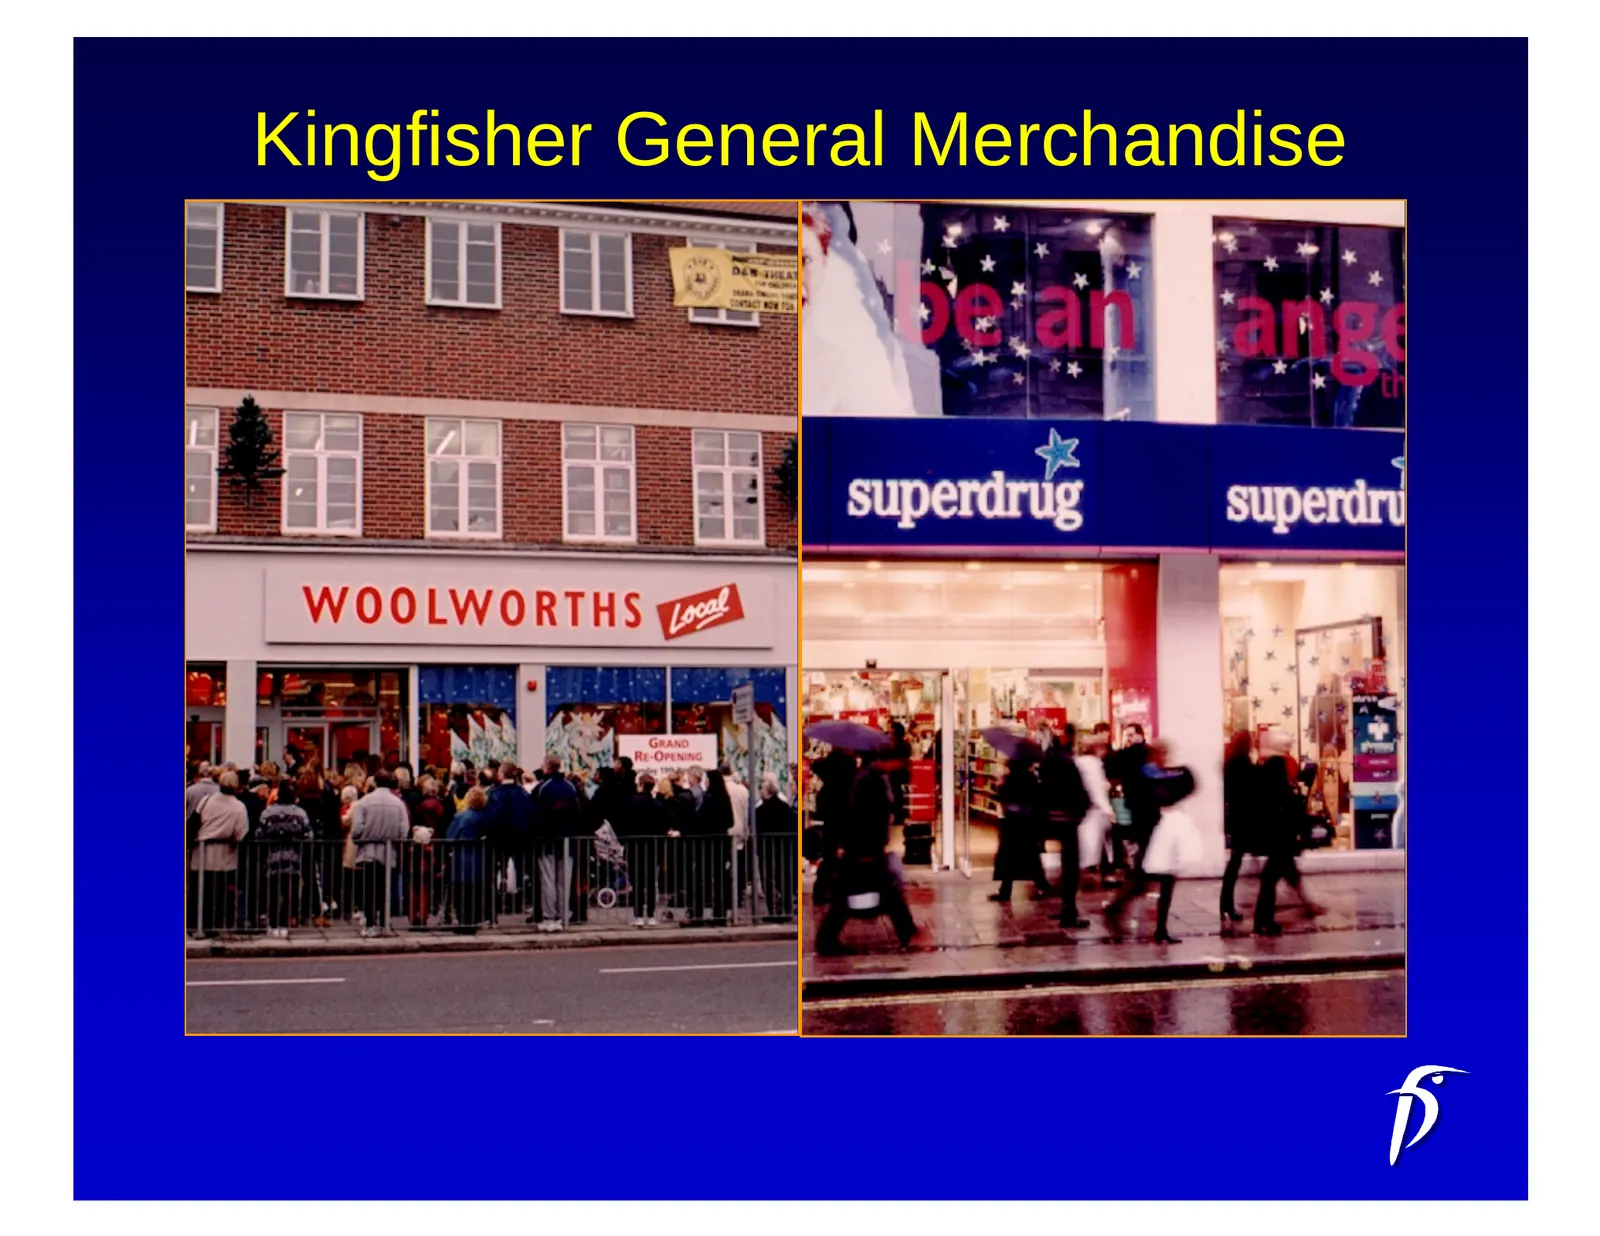
Kingfisher General Merchandise
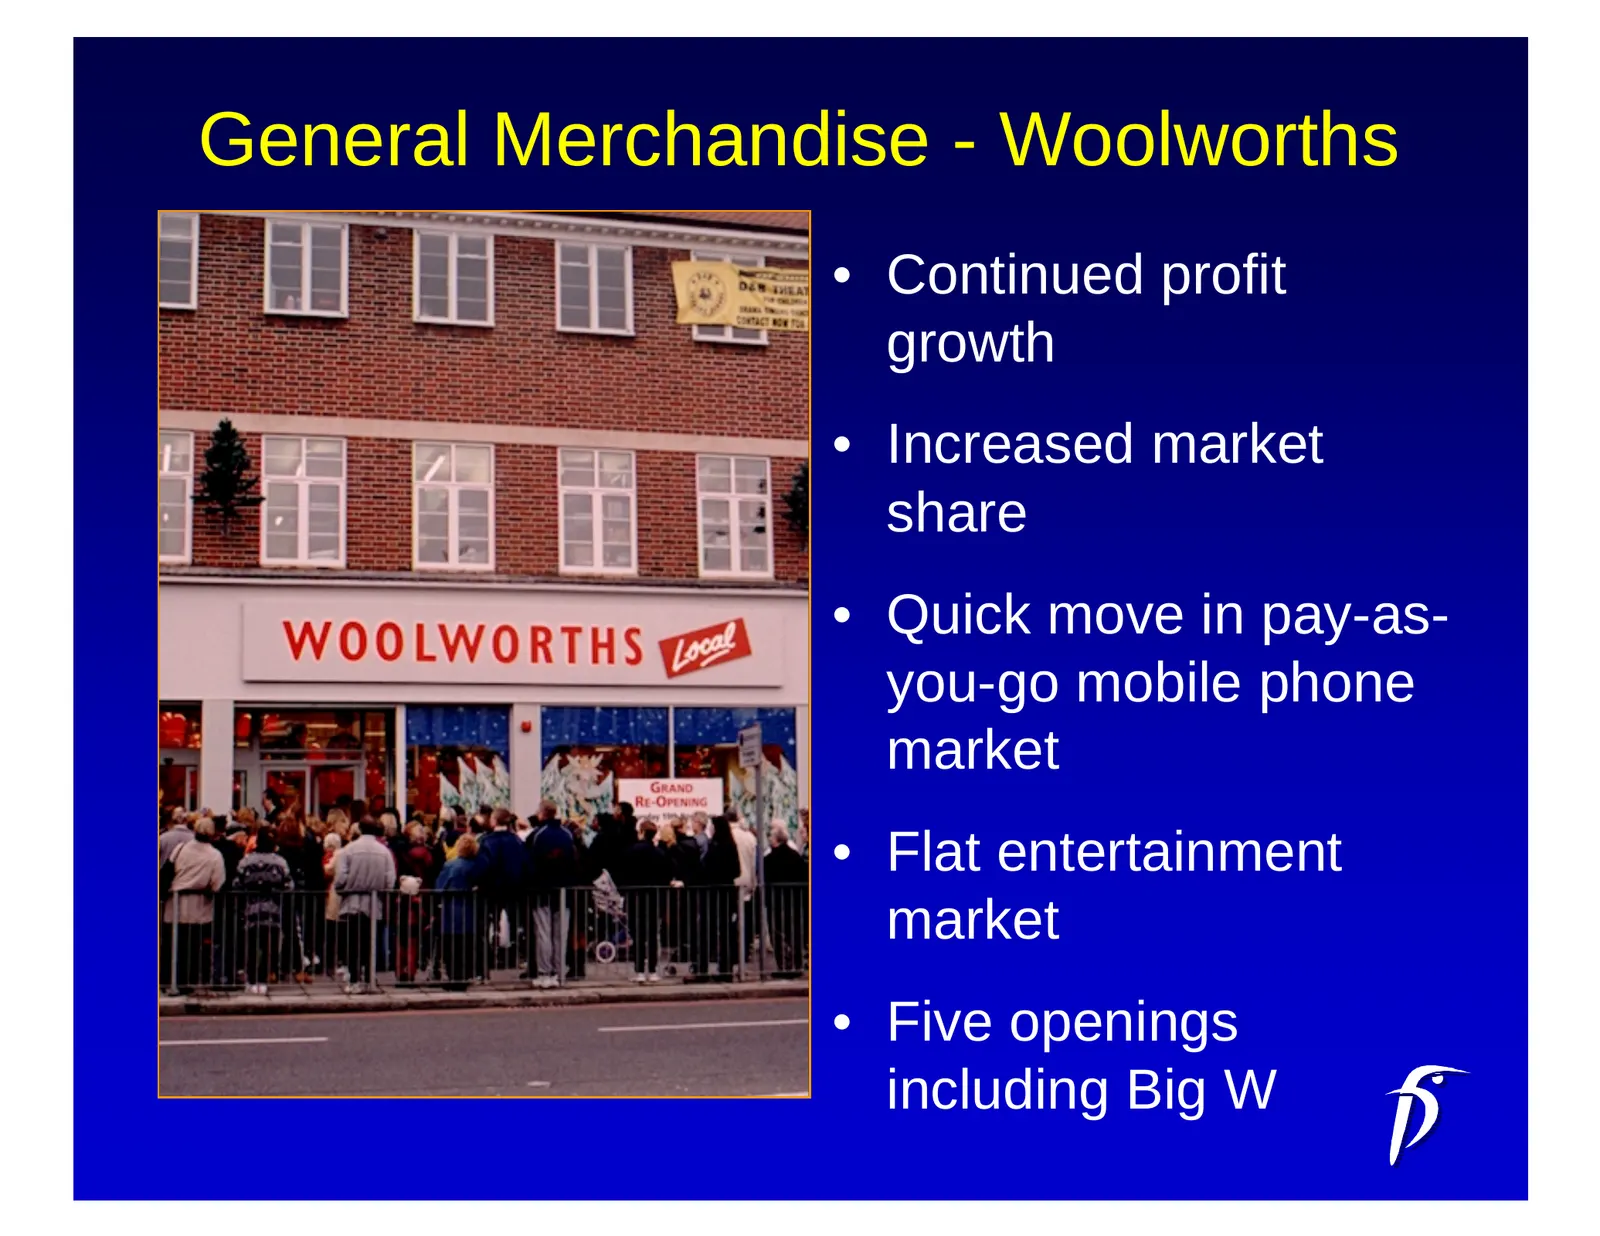
Slide 41: General Merchandise - Woolworths
General Merchandise - Woolworths • Continued profit growth • Increased market share • Quick move in pay-as- you-go mobile phone market • Flat entertainment market • Five openings including Big W
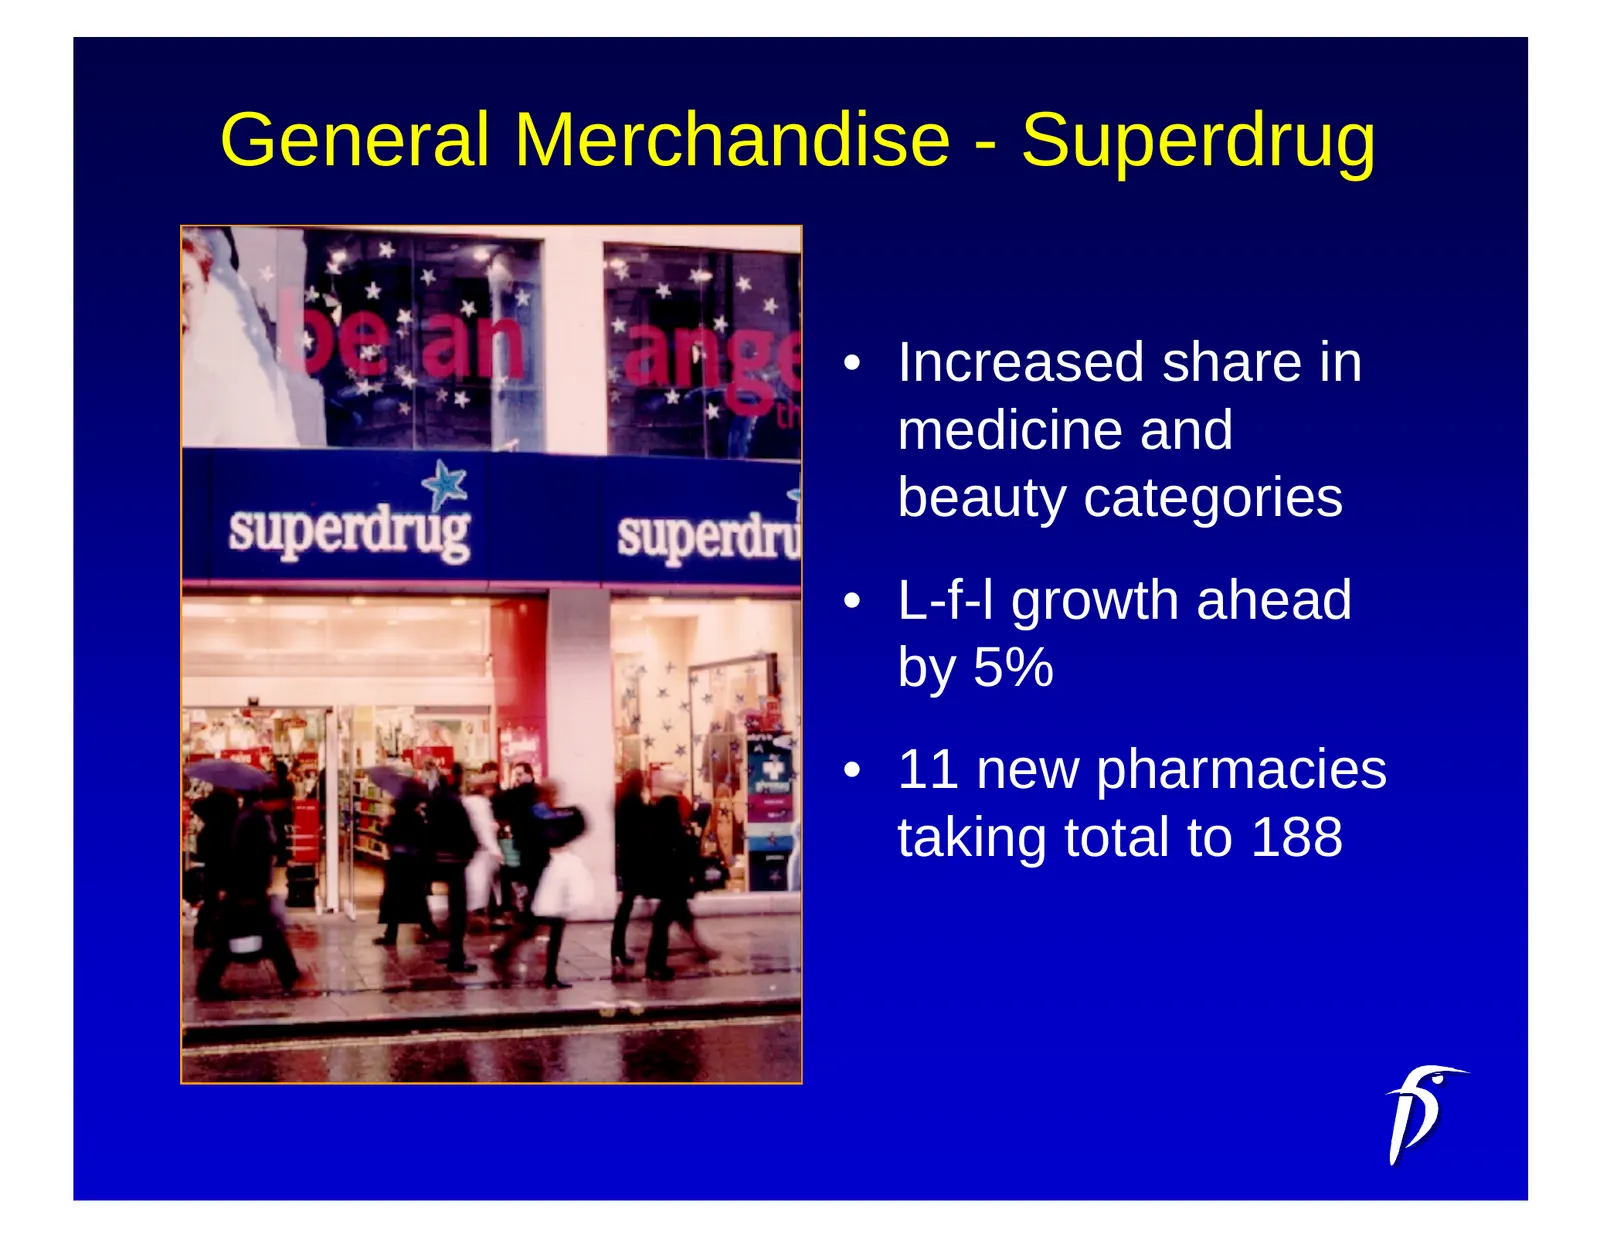
Slide 42: General Merchandise - Superdrug
General Merchandise - Superdrug • Increased share in medicine and beauty categories • L-f-l growth ahead by 5% • 11 new pharmacies taking total to 188
Slide 43: Achieving future growth
Achieving future growth • Establish market-leading positions in all our markets • Grow existing brands/formats & introduce new shopping concepts • Develop complementary channels • Capitalise on retail consolidation opportunities • Pursue the need for scale • Seek manufacturer and government co- oper

Slide 44: Closing statement on customer focus and investing
“Our absolute focus on customers and commitment to investing and innovating for the future will ensure our continued progress”

Slide 45
Source: Internet Archive copy of kingfisher.com
More decks from Kingfisher PLC
 H1 2026/27 Earnings Presentation33 slides · Sep 22, 2026
 FY2025/26 Earnings Presentation39 slides · Mar 24, 2026
 H1 2025/26 Earnings Presentation38 slides · Sep 23, 2025
 H1 2025/26 Earnings Presentation6 slides · September 2025
 FY2024/25 Earnings Presentation35 slides · Apr 8, 2025
 FY2024/25 Earnings Presentation40 slides · Mar 25, 2025