Edgewater Technology — CJS Securities New Ideas for the New Year Conference 2008
22 slides from Edgewater Technology's conference presentation, Jan 10, 2008

Slide 1: CJS Securities New Ideas for the New Year Conference
January 9, 2008 Presentation by: Shirley Singleton Chairman, President & CEO Exhibit 99.1 CJS Securities, Inc. New Ideas for the New Year Conference January 9, 2008 Presentation by: Shirley Singleton Chairman, President & CEO CJS Securities, Inc. New Ideas for the New Year Conference

Slide 2: Safe Harbor Language
2 Safe Harbor Language Certain statements contained in this presentation and in the subsequent discussion that are not statements of historical facts are "forward looking statements" within the meaning of the Private Securities Litigation Reform Act of 1995. The words - "believe," "expect," "anticip

Slide 3: Edgewater Technology (NASDAQ: EDGW)
3 Edgewater Technology (NASDAQ: EDGW) Edgewater Technology (NASDAQ: EDGW) Technical Management Consulting Firm - Premium Information Technology (IT) Services Market Opportunity - Focused on High Margin Specialty or Premium IT Services - Centered on the middle market, which is where all of the major

Slide 4: Why Should You Be Interested in Us?
4 Why Should You Be Interested in Us? Why Should You Be Interested in Us? Compounded Annual Growth Rate (CAGR) - 40% over past 3 years Focused on Strategy Engagements & Moving up the Pyramid of IT Services Doubled CPM Practice during 2007* Continue to Build a National Footprint in Premium IT Service
Slide 5: Geographic Expansion in US
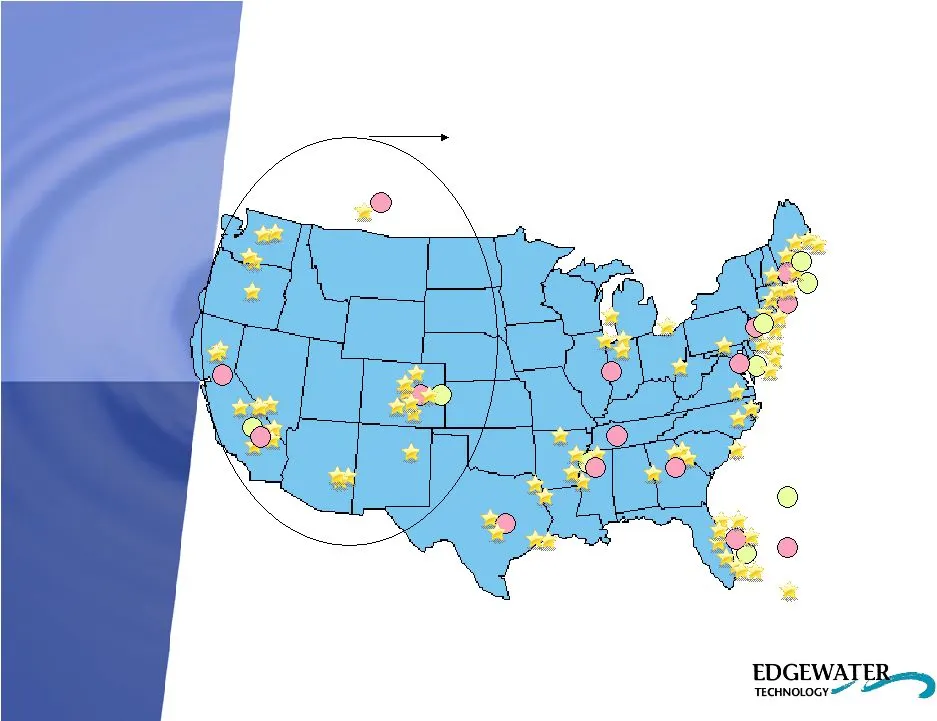
5 Geographic Expansion in US Geographic Expansion in US Los Angeles Denver Boston Calgary Office Locations BDM Locations Staff Locations New in 2007 San Francisco Dallas Memphis Manchester Sterling New York
Slide 6: Service Offerings
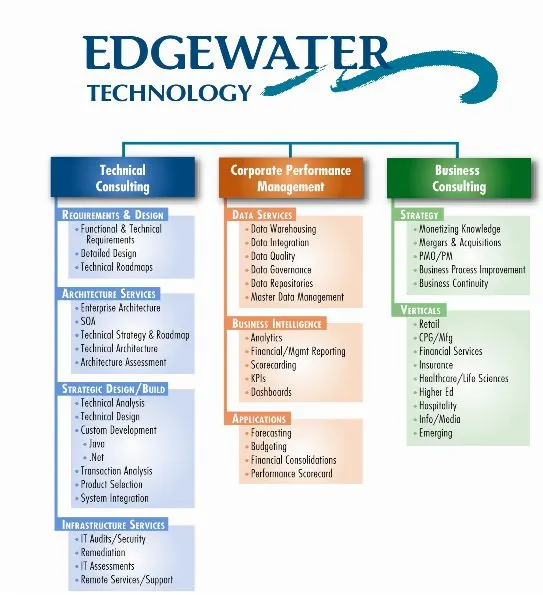
Service Offerings Service Offerings 58% of Svs. Revenue 58% of Svs. Revenue 29% of Svs. Revenue 29% of Svs. Revenue 13% of Svs. Revenue 13% of Svs. Revenue (All service revenue percentages are as of 9/30/07.)

Slide 7: Acquisition Strategy
7 Acquisition Strategy Acquisition Strategy Completed Three Strategic Acquisitions in ‘07 - Vertical Pitch, LLC (December ‘07) • CPM/BI/BAM Horizontal • Continues the expansion of Edgewater’s national footprint to West • Accretive - Lynx Business Intelligence Consulting, Inc. (September ’07) • CPM/B

Slide 8: 2008 Outlook
8 2008 Outlook 2008 Outlook Trends: - Continued high demand for BI / CPM - Emergence of Analytics - Revitalization of Web/Internet Challenges: - Near-term Organic Growth in Tech Consulting - Need CPM Resources to Sustain Growth - Retrain existing staff to keep in line with trends - Competitive Pay P
Slide 9: Estimated Change in Service Offerings Business Mix in 2008
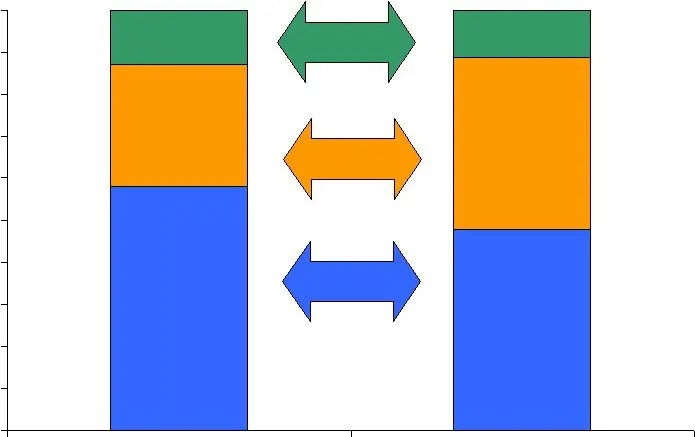
Business Consulting CPM Consulting Technical Consulting Estimated Change in Service Offerings – Business Mix in 2008 Estimated Change in Service Offerings – Business Mix in 2008 58% 48% 29% 41% 13% 11% 0% 10% 20% 30% 40% 50% 60% 70% 80% 90% 100% 2007 2008

Slide 10: Acquisition Strategy
10 Acquisition Strategy Acquisition Strategy Go-forward Acquisition Guidelines - Add to Premium Services - Enhance Geographical Footprint - Additional Vertical Expertise - Target Size - Revenue Size • $5m to $20m - Accretive - Internal Rate of Return > 20% - Target Valuation of 5 – 7 x EBITDA - Comb

Slide 11: Edgewater's Growth Goals
11 Edgewater’s Growth Goals Edgewater’s Growth Goals Focus on becoming the Premier Specialty IT Services Company in the US Continue to drive revenue growth in 2008 Continue to focus on business fundamentals and execute strategy Find acquisition(s) to fit into and/or expand our service offerings Targ

Slide 12: Investment Considerations
12 Investment Considerations Investment Considerations Seasoned Management Team Management Aligned with Shareholders - 18% Officer Ownership (stock & options) - Performance-based Compensation Strong Operating Metrics Strong Balance Sheet (as of 9/30/07) - $100m+ in Total Assets • 13% growth in Worki
Slide 13: Financial Graphs & Non-GAAP Earnings Analysis
Financial Graphs & Non-GAAP Earnings Analysis Financial Graphs & Non-GAAP Earnings Analysis
Slide 14: Financial Performance
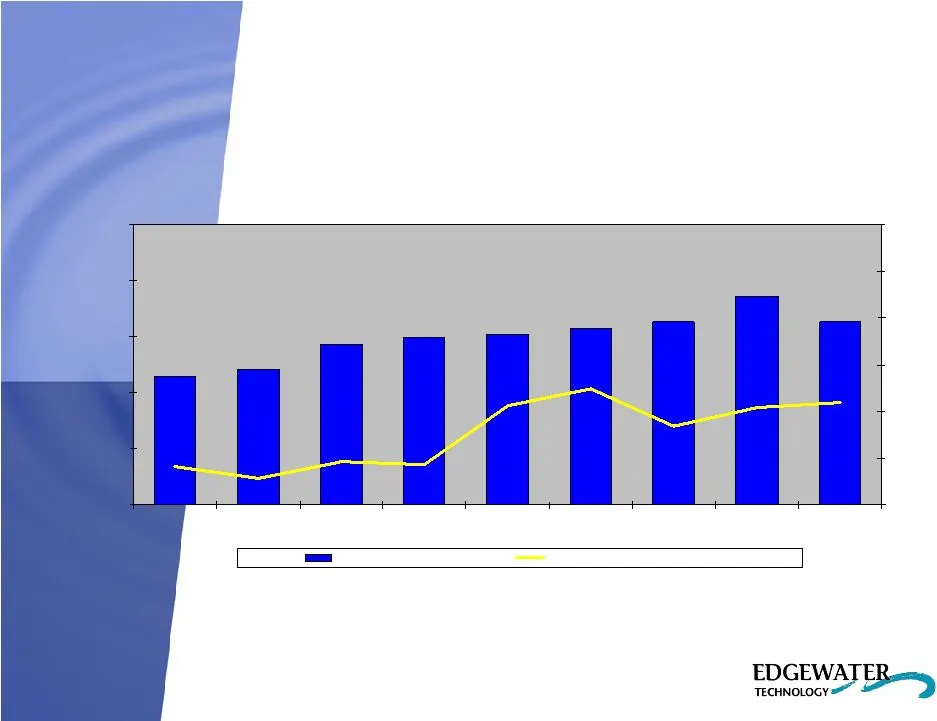
14 1,097 1,046 281 414 460 837 1,244 1,064 460 Financial Performance Financial Performance 11,496 12,111 14,308 14,890 15,163 15,722 16,272 18,577 16,352 $0 $5,000 $10,000 $15,000 $20,000 $25,000 Q3 '05 Q4 '05 Q1 '06 Q2 '06 Q3 '06 Q4 '06 Q1 '07 Q2 '07 Q3 '07 $0 $500 $1,000 $1,500 $2,000 $2,500 $3,00
Slide 15: Financial Performance
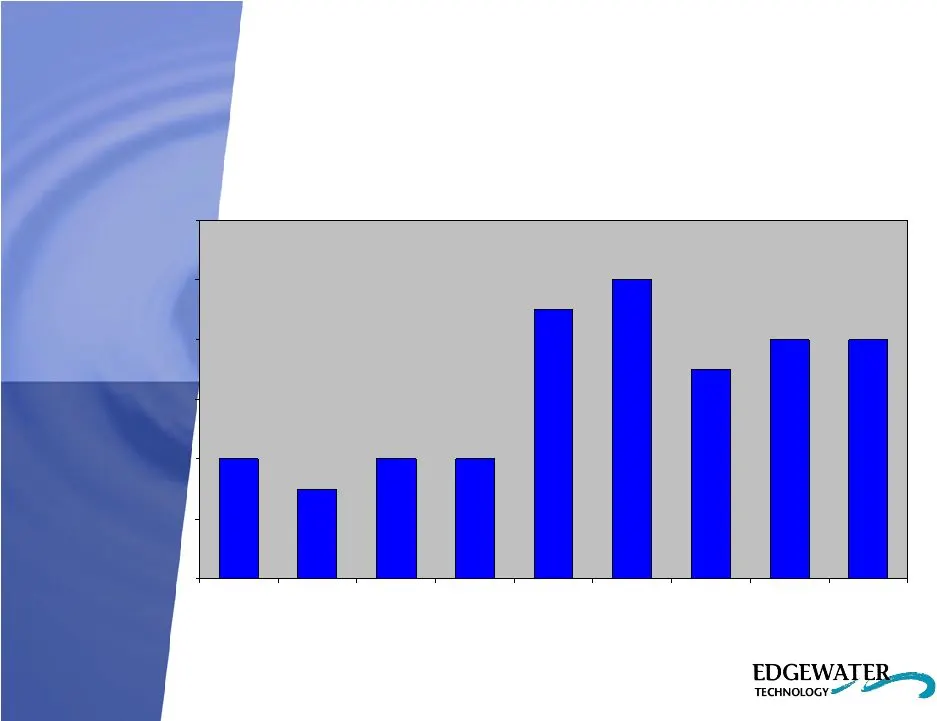
15 Financial Performance Financial Performance Quarterly Diluted Income from Continuing Operations per Share $0.04 $0.03 $0.04 $0.04 $0.09 $0.10 $0.07 $0.08 $0.08 $0.00 $0.02 $0.04 $0.06 $0.08 $0.10 $0.12 Q3 '05 Q4 '05 Q1 '06 Q2 '06 Q3 '06 Q4 '06 Q1 '07 Q2 '07 Q3 '07
Slide 16: Financial Performance
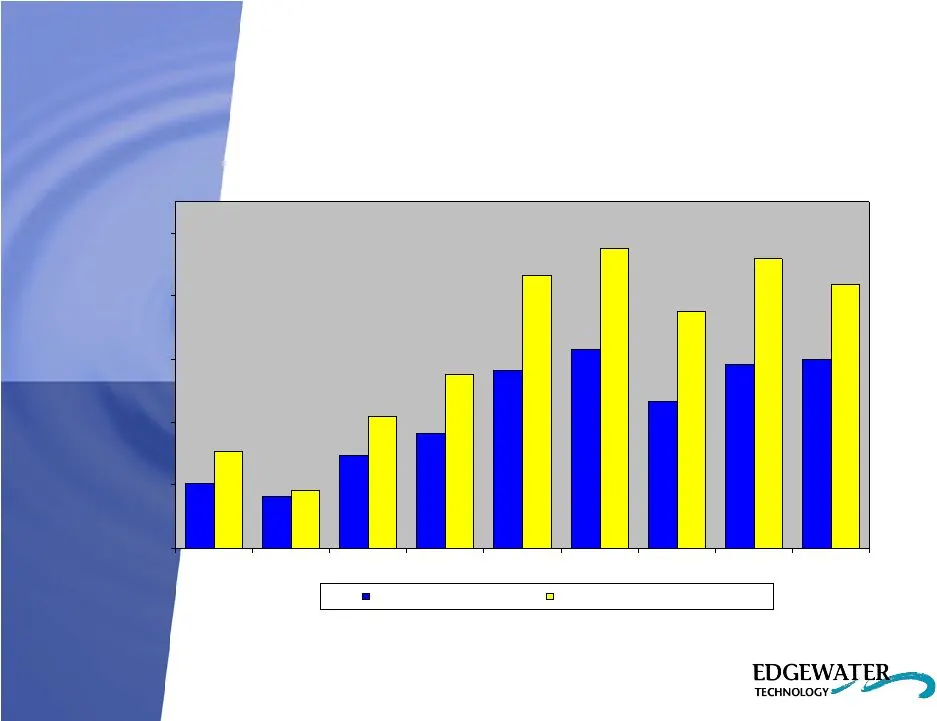
16 Financial Performance Financial Performance 1,405 1,164 1,579 1,498 1,454 1,377 2,165 2,386 1,878 1,051 2,298 2,094 $0 $500 $1,000 $1,500 $2,000 $2,500 Q3 '05 Q4 '05 Q1 '06 Q2 '06 Q3 '06 Q4 '06 Q1 '07 Q2 '07 Q3 '07 Cash Net Income Adjusted EBITDA (excludes SBC) Quarterly Cash Net Income & Adjuste
Slide 17: Financial Performance
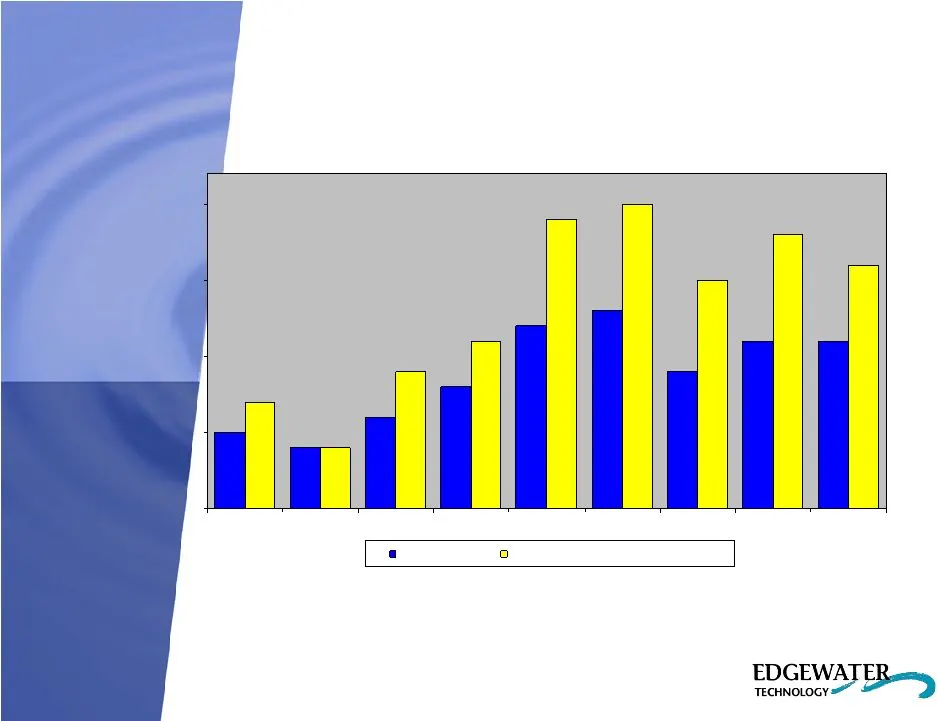
17 Financial Performance Financial Performance Quarterly Diluted Cash EPS & Adjusted EBITDA per Share 0.05 0.040.04 0.06 0.08 0.12 0.13 0.11 0.07 0.09 0.11 0.20 0.18 0.16 0.09 0.11 0.19 0.15 $0.00 $0.05 $0.10 $0.15 $0.20 Q3 '05 Q4 '05 Q1 '06 Q2 '06 Q3 '06 Q4 '06 Q1 '07 Q2 '07 Q3 '07 Cash EPS Adjuste
Slide 18: Financial Performance
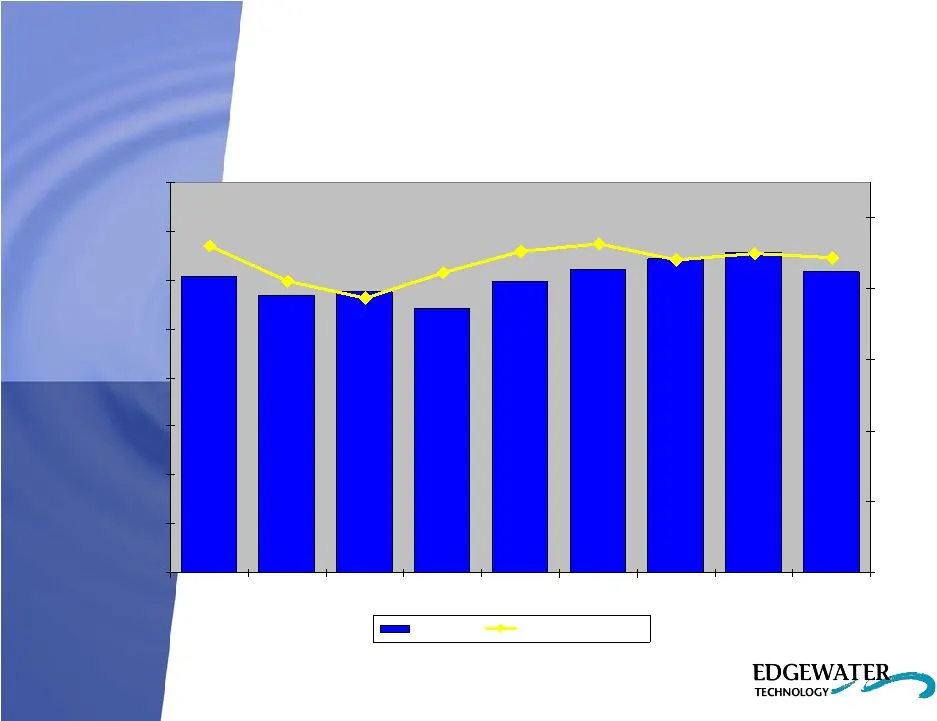
18 79.9% 82.2% 81.1% 77.0% 78.8% 78.5% 80.3% 82.8% 80.8% Financial Performance Financial Performance Target range for Utilization is 78% – 82% 46.3% 45.2% 42.2% 38.7% 41.0% 46.0% 44.0% 44.9% 44.3% 50.0% 55.0% 60.0% 65.0% 70.0% 75.0% 80.0% 85.0% 90.0% Q3 '05 Q4 '05 Q1 '06 Q2 '06 Q3 '06 Q4 '06 Q1 '07
Slide 19: Financial Performance
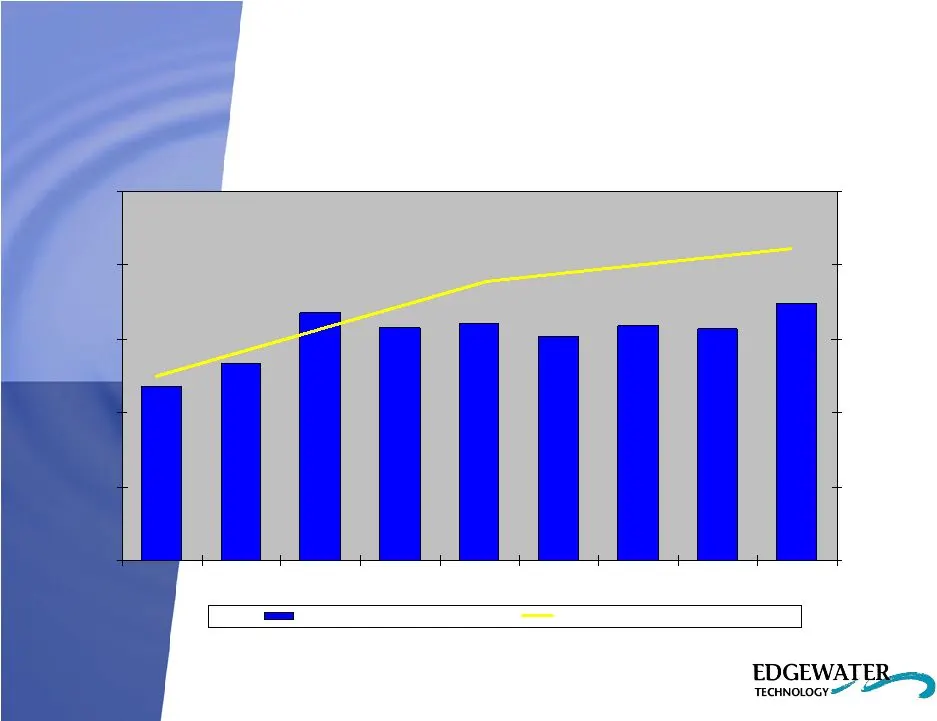
19 274 218 233 268 258 252 259 257 261 Financial Performance Financial Performance $294,132 $264,414 $280,602 Q3 '05 Q4 '05 Q1 '06 Q2 '06 Q3 '06 Q4 '06 Q1 '07 Q2 '07 Q3 '07 $200,000 $225,000 $250,000 $275,000 $300,000 $325,000 Billable Headcount Revenue per Billable Consultant Consultant Headcount &

Slide 20: Q4 and Fiscal 2007 Earnings Results Call
20 Q4 and Fiscal 2007 Earnings Results Call Q4 and Fiscal 2007 Earnings Results Call Scheduled : February 27, 2008 Scheduled : February 27, 2008
Slide 21: Reconciliation of Non-GAAP Financial Measures
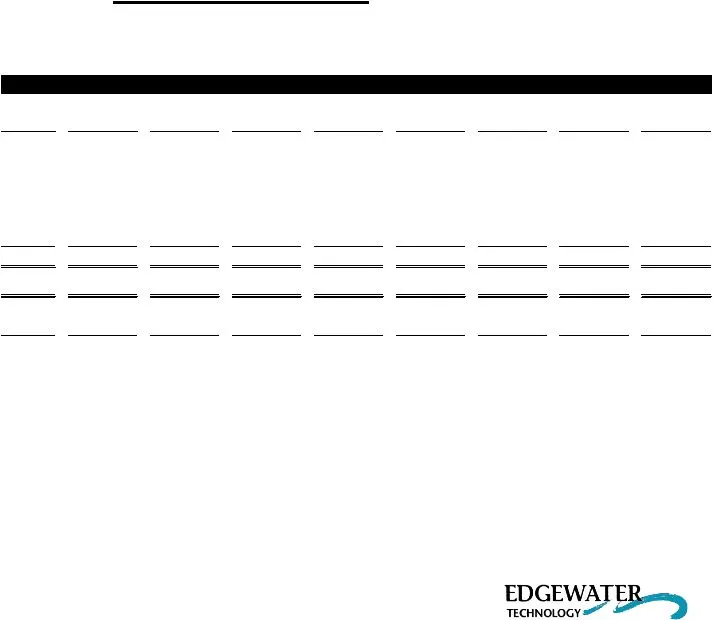
Quarterly Period Ended Appendix Appendix Reconciliation of Non-GAAP Financial Measures Reconciliation of Non-GAAP Financial Measures Note: Cash Net Income and Cash Earnings per Diluted Share are Non-GAAP financial measures and are not intended to be financial measures that should be regarded as an a
Slide 22: Reconciliation of Non-GAAP Financial Measures
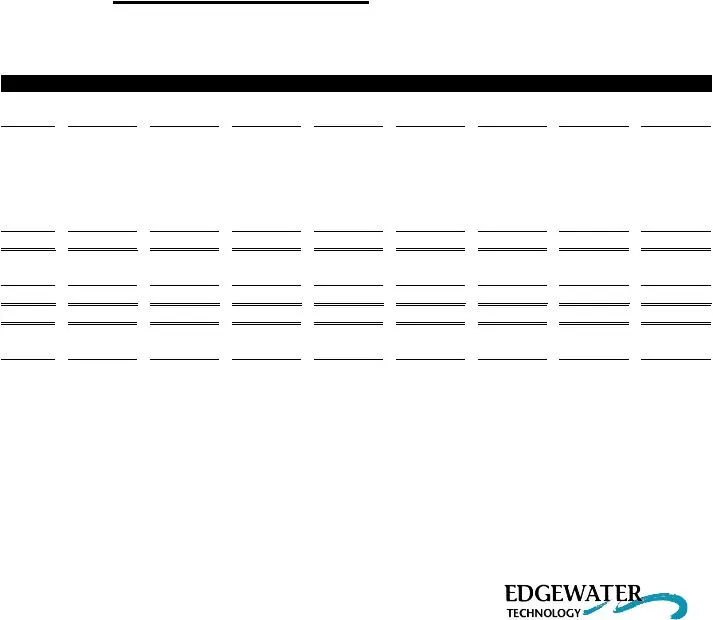
Quarterly Period Ended Appendix Appendix Reconciliation of Non-GAAP Financial Measures Reconciliation of Non-GAAP Financial Measures Note: EBITDA, Adjusted EBITDA and Adjusted EBITDA per Diluted Share are Non-GAAP financial measures and are not intended to be financial measures that should be regard
Source: SEC EDGAR · 8-K filed Jan 10, 2008
More decks from Edgewater Technology Inc
 Merger or Acquisition (September 2018)37 slides · Sep 13, 2018
 Merger or Acquisition (May 2018)34 slides · May 22, 2018
 Merger or Acquisition (March 2018)27 slides · Mar 19, 2018
 Proxy Contest (January 2017)8 slides · Jan 31, 2017
 Proxy Contest (January 2017)35 slides · Jan 24, 2017
 Proxy Contest (January 2017)38 slides · Jan 23, 2017