Old Mutual Ltd. · JSE:OMU
Old Mutual — H1 2016 Earnings Presentation
40 slides from Old Mutual's earnings presentation, Aug 11, 2016
Slide 1: Interim Results 2016
INTERIM RESULTS 2016 11 August 2016 INVESTMENT | SAVINGS | INSURANCE | BANKING
Slide 2: Disclaimer
DISCLAIMER This presentation may contain certain forward-looking statements with respect to certain of Old Mutual plc’s plans and its current goals and expectations relating to its future financial condition, performance and results. By their nature, all forward-looking statements involve risk and u
Slide 3: Presentation Agenda
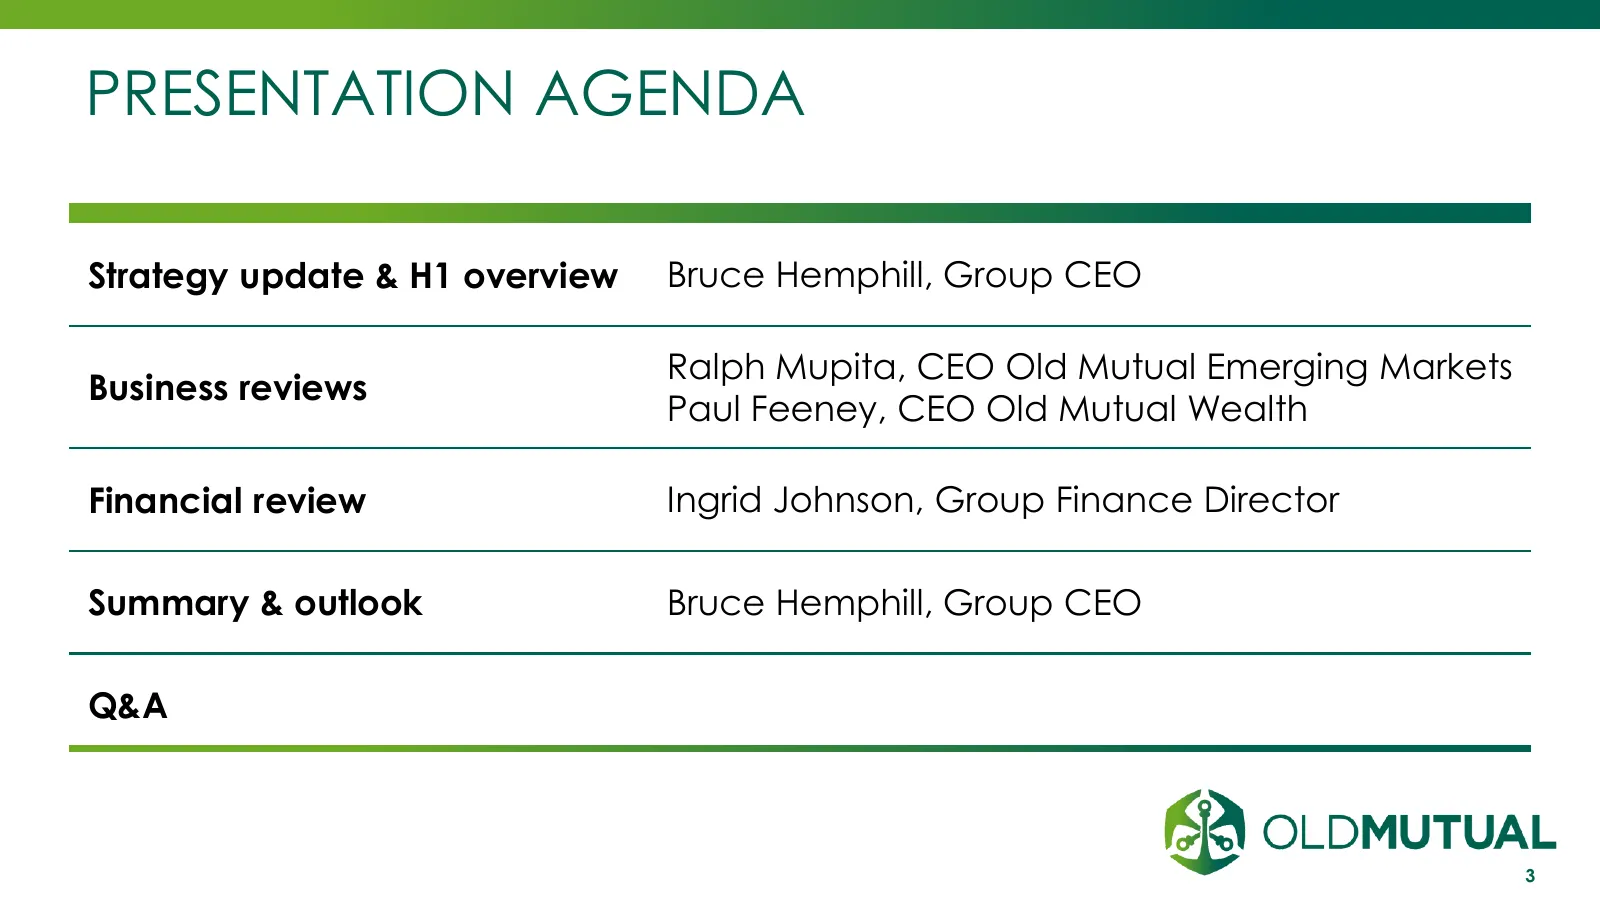
PRESENTATION AGENDA Strategy update & H1 overview Bruce Hemphill, Group CEO Ralph Mupita, CEO Old Mutual Emerging Markets Business reviews Paul Feeney, CEO Old Mutual Wealth Financial review Ingrid Johnson, Group Finance Director Summary & outlook Bruce Hemphill, Group CEO Q&A 3
Slide 4: Strategic Path
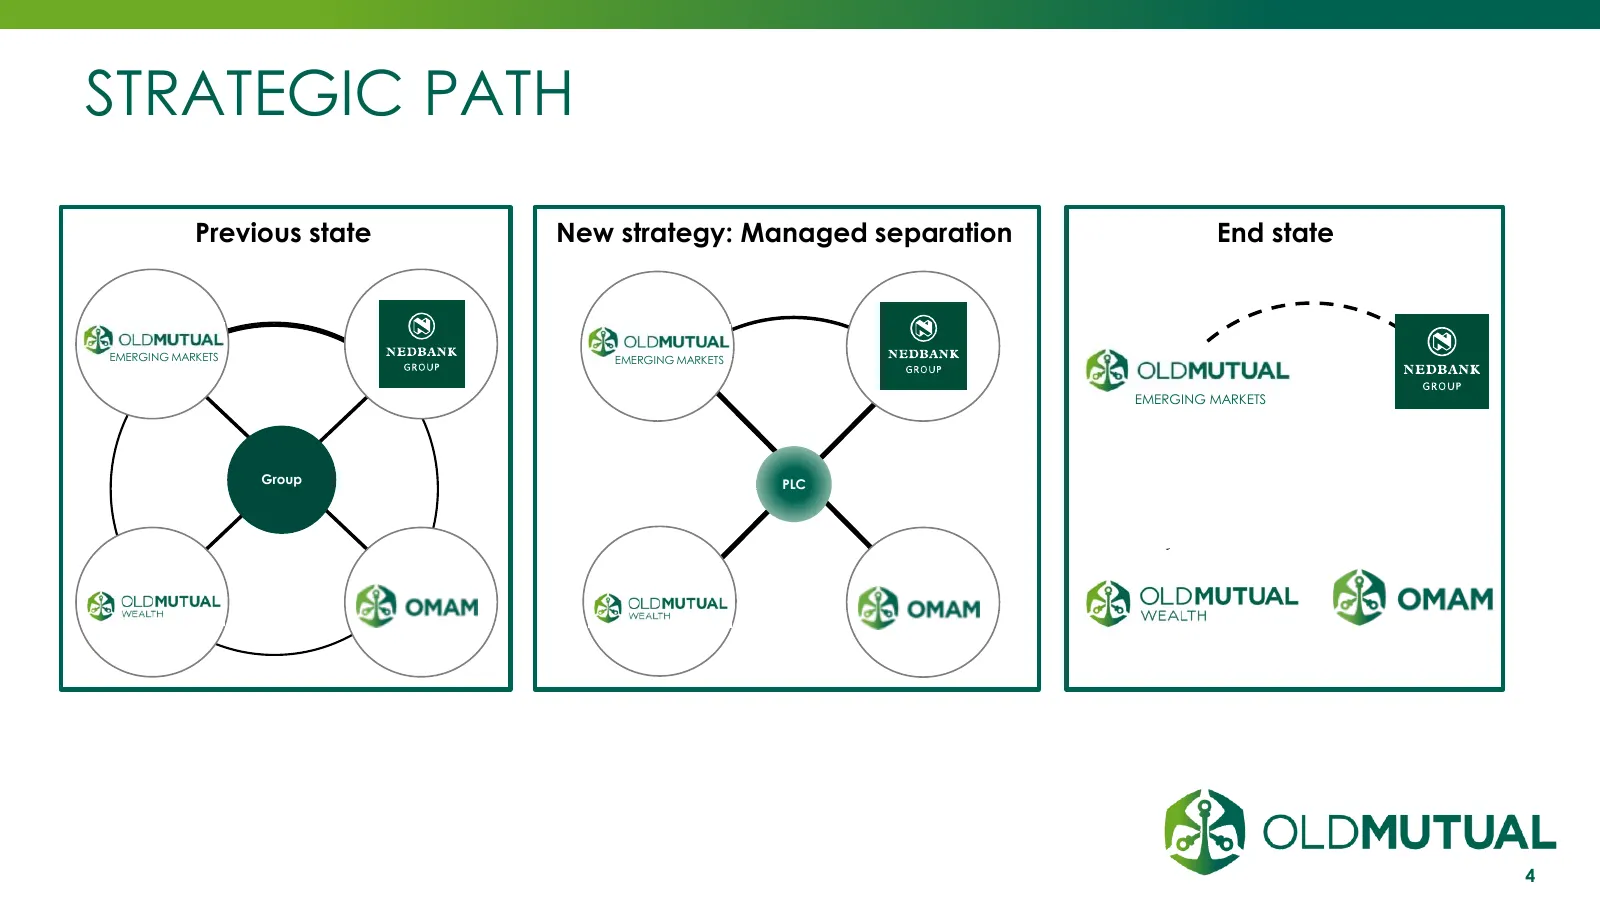
STRATEGIC PATH Previous state New strategy: Managed separation End state EMERGING MARKETS EMERGING MARKETS EMERGING MARKETS Group PLC 4
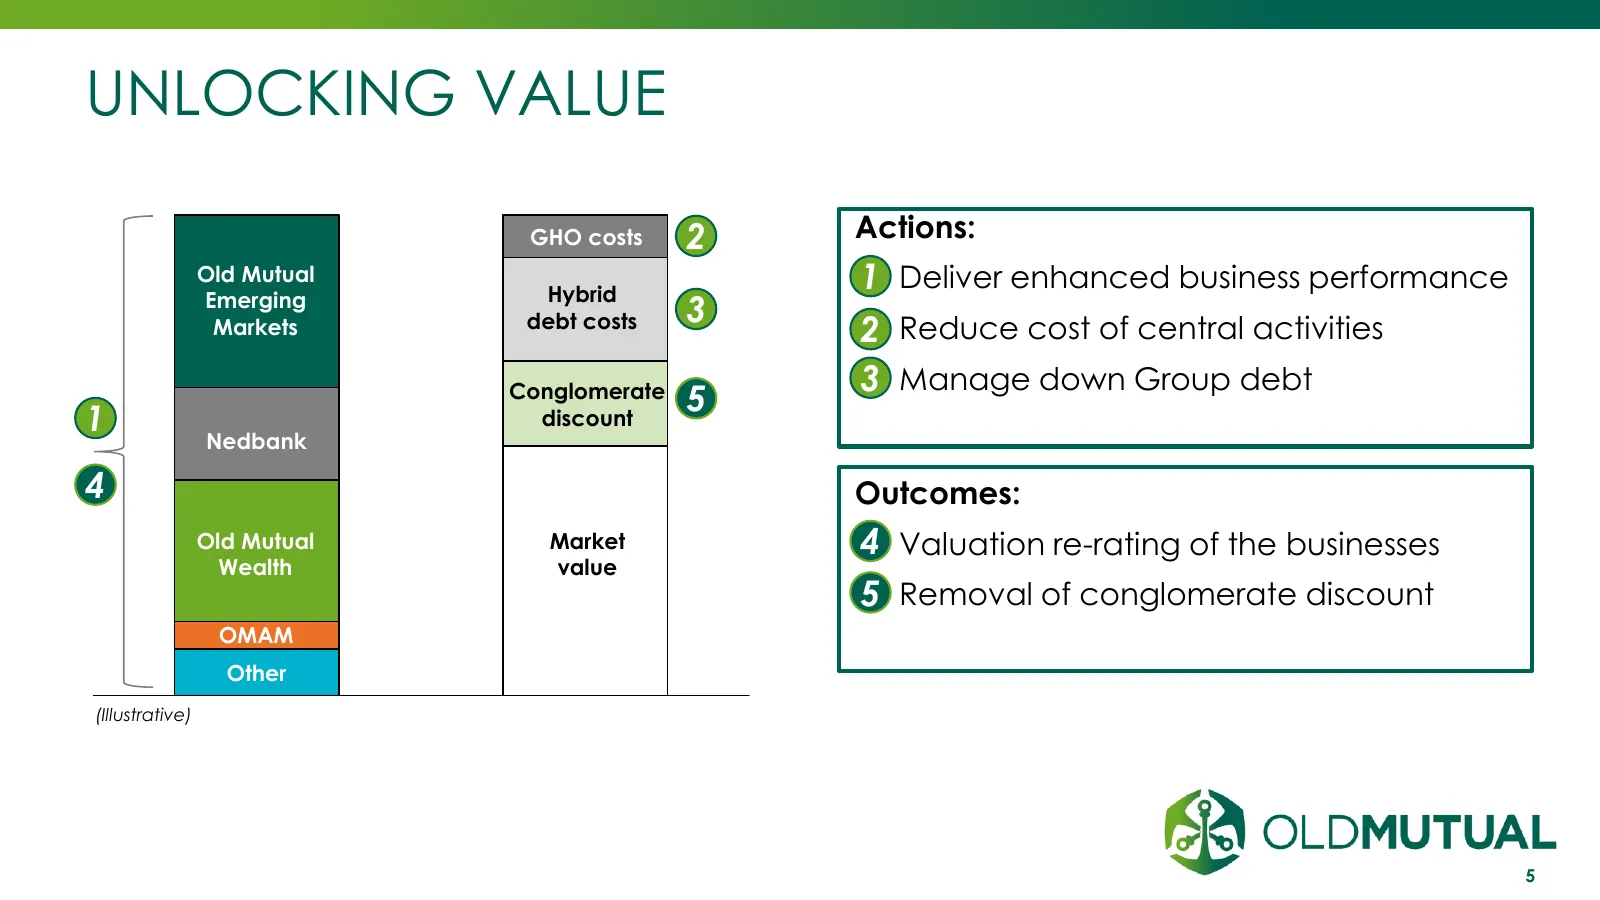
Slide 5: Unlocking Value
UNLOCKING VALUE GHO costs 2 Actions: Old Mutual Hybrid 1 Deliver enhanced business performance 1. Emerging 3 Markets debt costs 2 Reduce cost of central activities 2. 3 Manage down Group debt 3. Conglomerate 5 1 Nedbank discount 4 Outcomes: Old Mutual Market 4 Valuation re-rating of the businesses 4
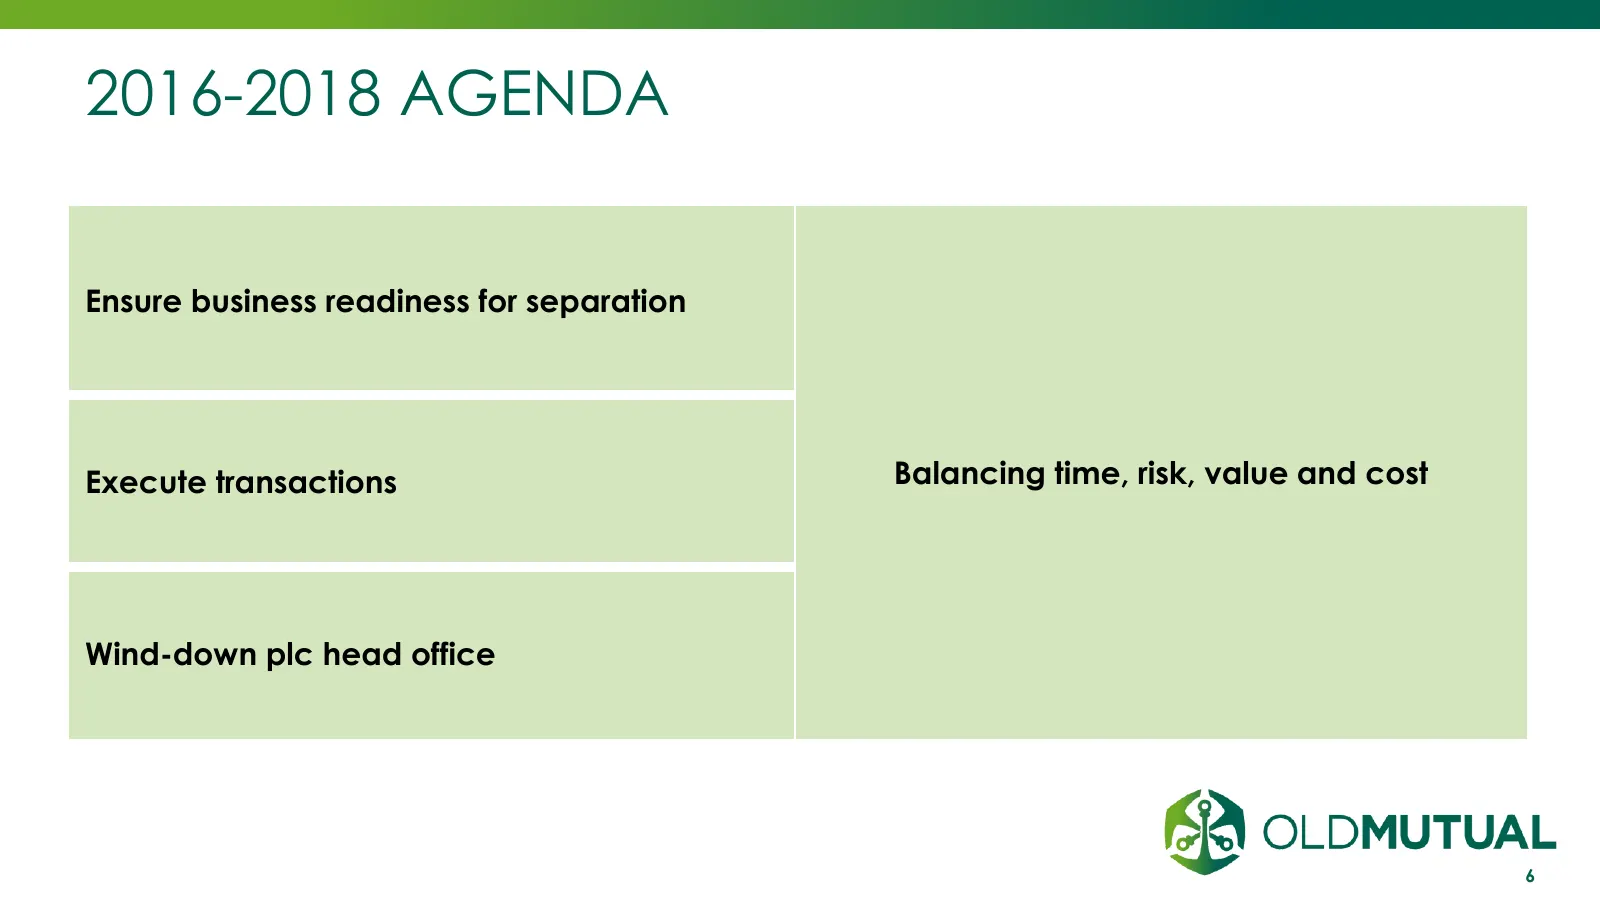
Slide 6: 2016-2018 Agenda
2016-2018 AGENDA Ensure business readiness for separation Execute transactions Balancing time, risk, value and cost Wind-down plc head office 6
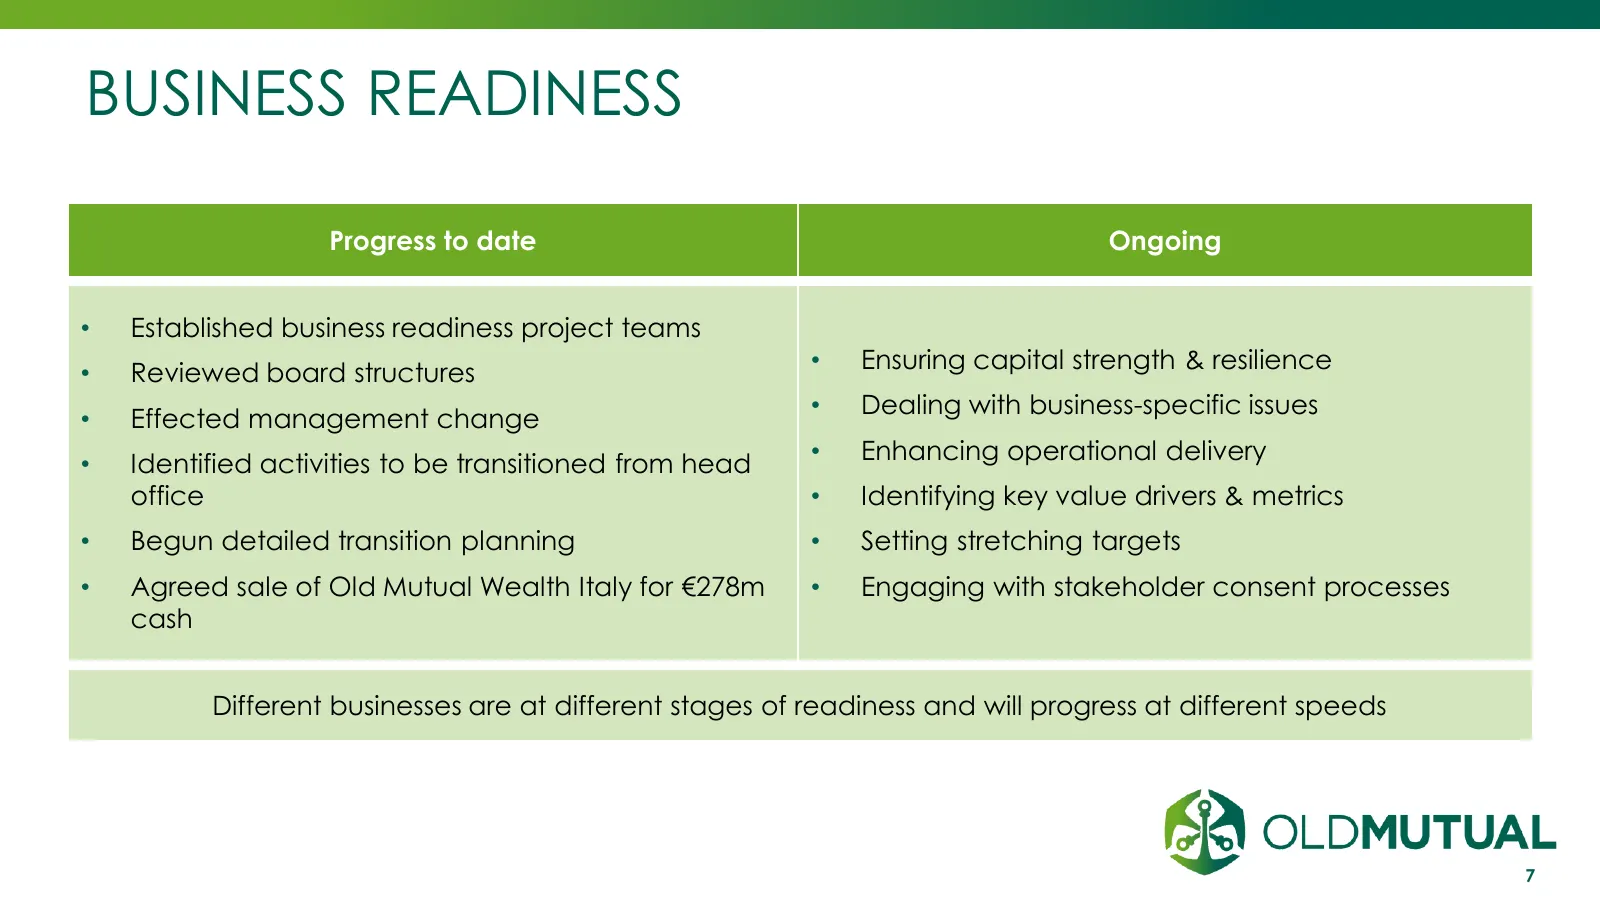
Slide 7: Business Readiness
BUSINESS READINESS Progress to date Ongoing • Established business readiness project teams • Ensuring capital strength & resilience • Reviewed board structures • Dealing with business-specific issues • Effected management change • Enhancing operational delivery • Identified activities to be transiti
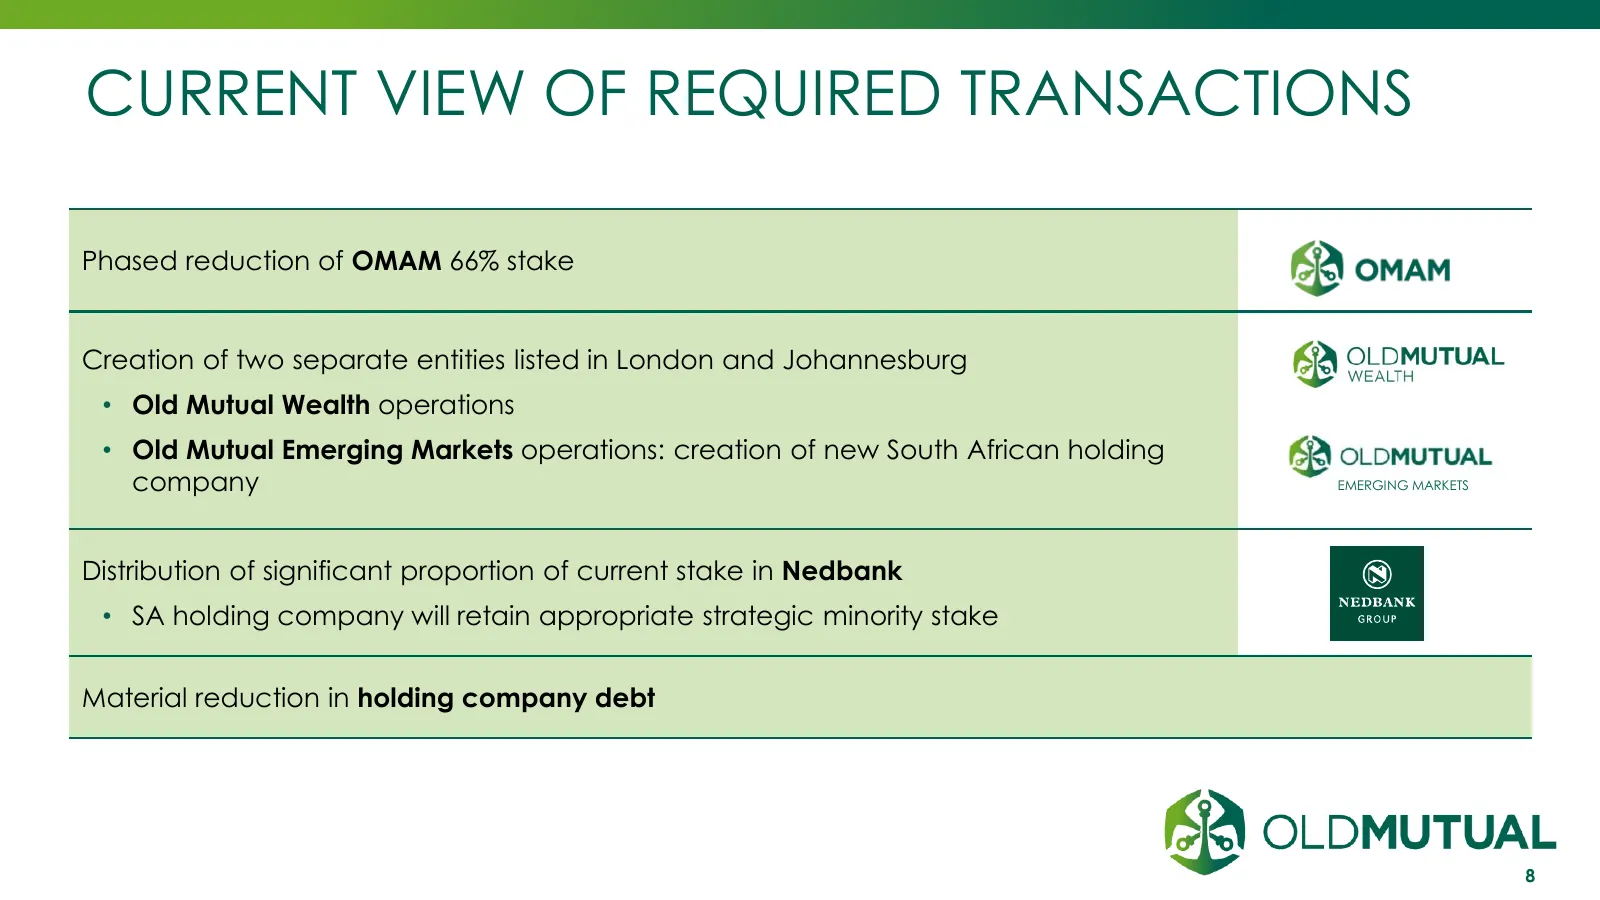
Slide 8: Current View of Required Transactions
CURRENT VIEW OF REQUIRED TRANSACTIONS Phased reduction of OMAM 66% stake Creation of two separate entities listed in London and Johannesburg • Old Mutual Wealth operations • Old Mutual Emerging Markets operations: creation of new South African holding company EMERGING MARKETS Distribution of signifi
Slide 9: PLC Head Office
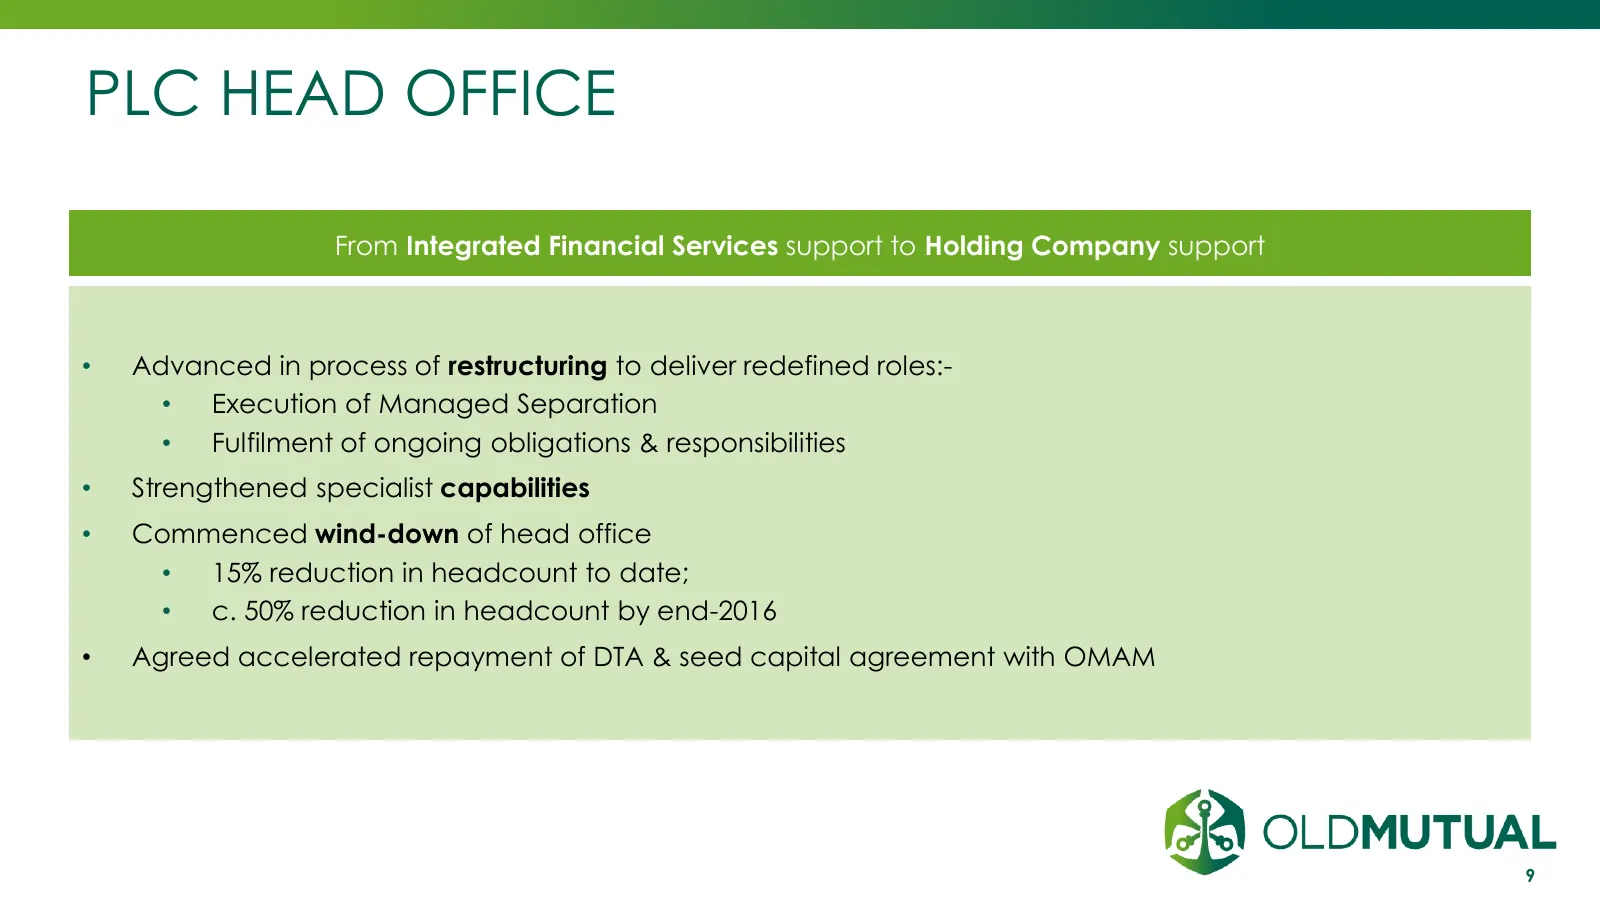
PLC HEAD OFFICE From Integrated Financial Services support to Holding Company support • Advanced in process of restructuring to deliver redefined roles:- • Execution of Managed Separation • Fulfilment of ongoing obligations & responsibilities • Strengthened specialist capabilities • Commenced wind-d
Slide 10: 2016-2018 Agenda
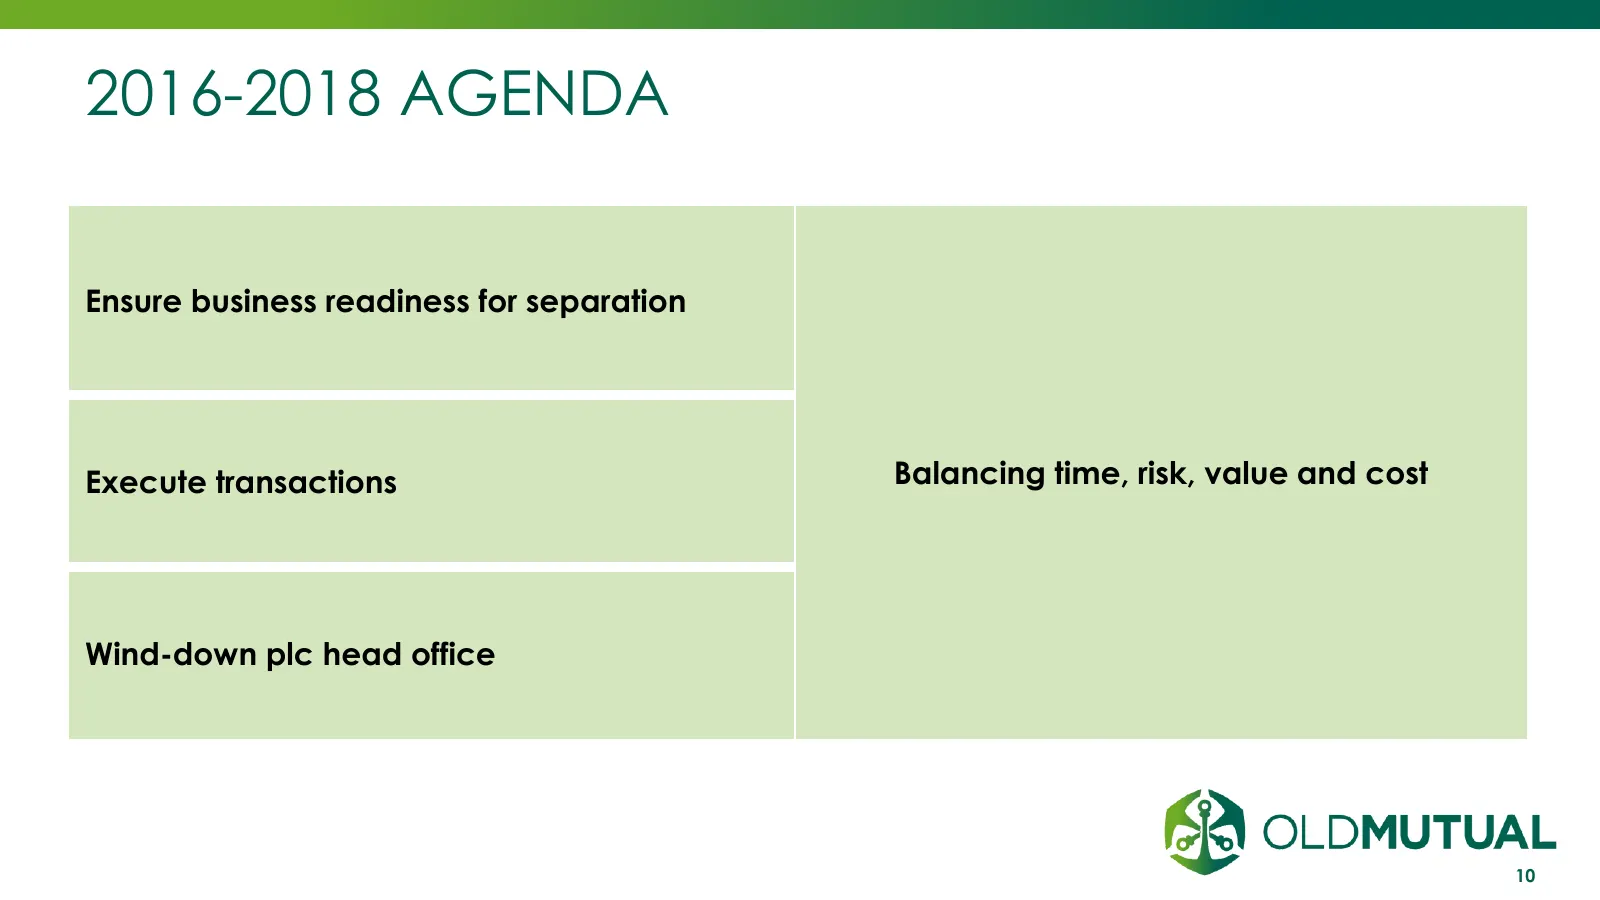
2016-2018 AGENDA Ensure business readiness for separation Execute transactions Balancing time, risk, value and cost Wind-down plc head office 10
Slide 11: H1 Overview: Macro Background
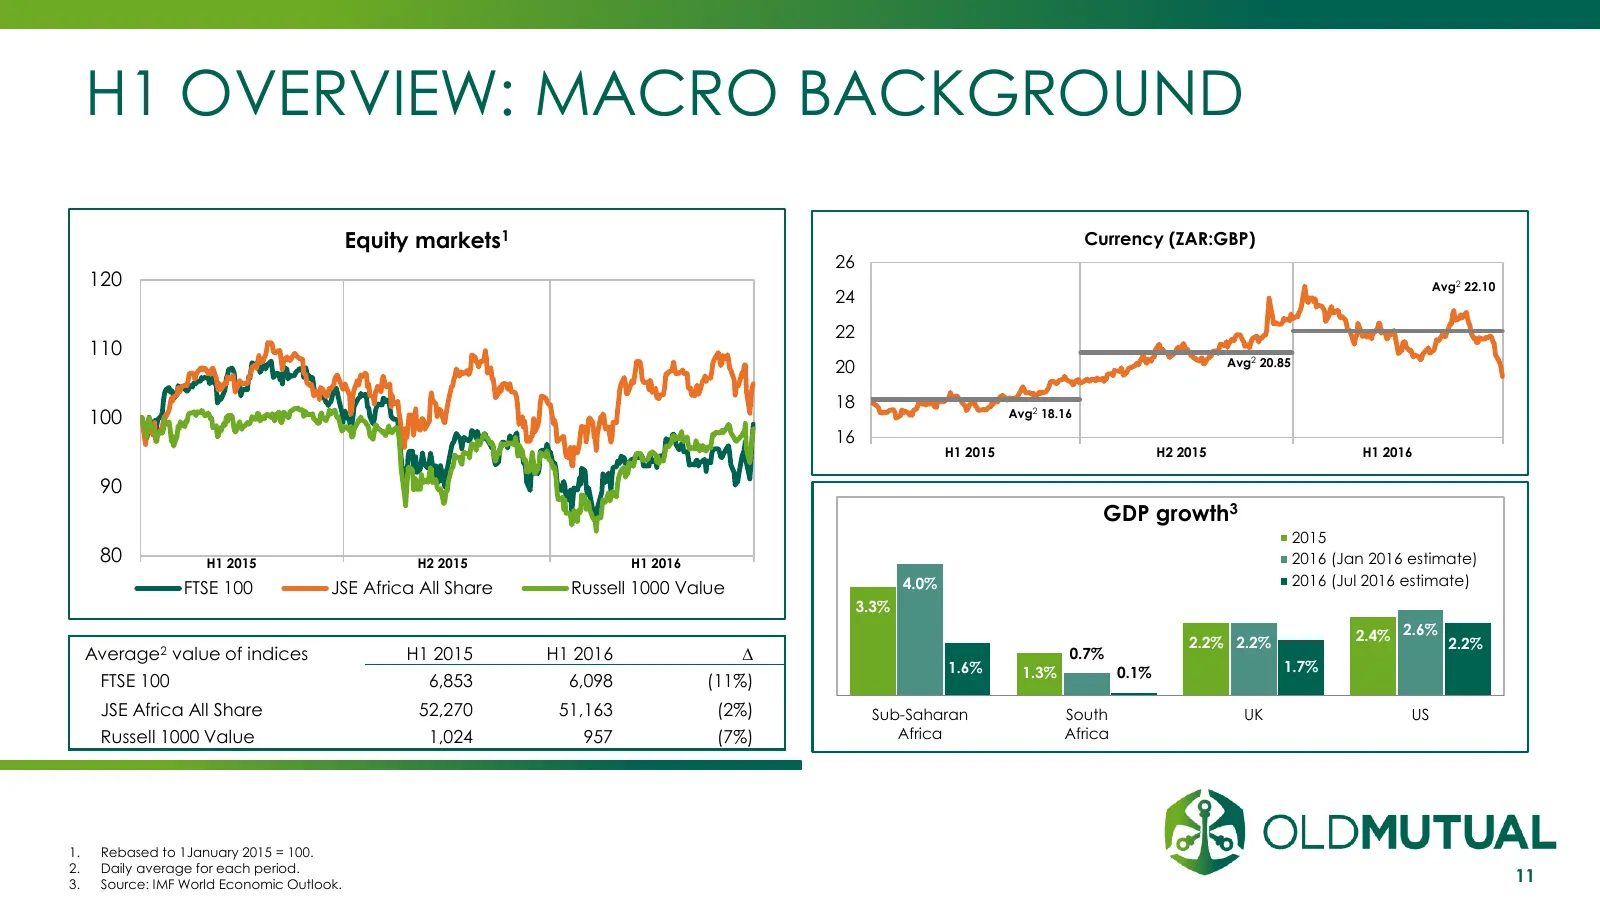
H1 OVERVIEW: MACRO BACKGROUND Equity markets1 Currency (ZAR:GBP) 26 120 Avg2 22.10 24 22 110 Avg2 20.85 20 18 100 Avg2 18.16 16 H1 2015 H2 2015 H1 2016 90 GDP growth3 2015 80 H1 2015 H2 2015 H1 2016 2016 (Jan 2016 estimate) FTSE 100 JSE Africa All Share Russell 1000 Value 4.0% 2016 (Jul 2016 estimat
Slide 12: H1 Overview: Operational Performance
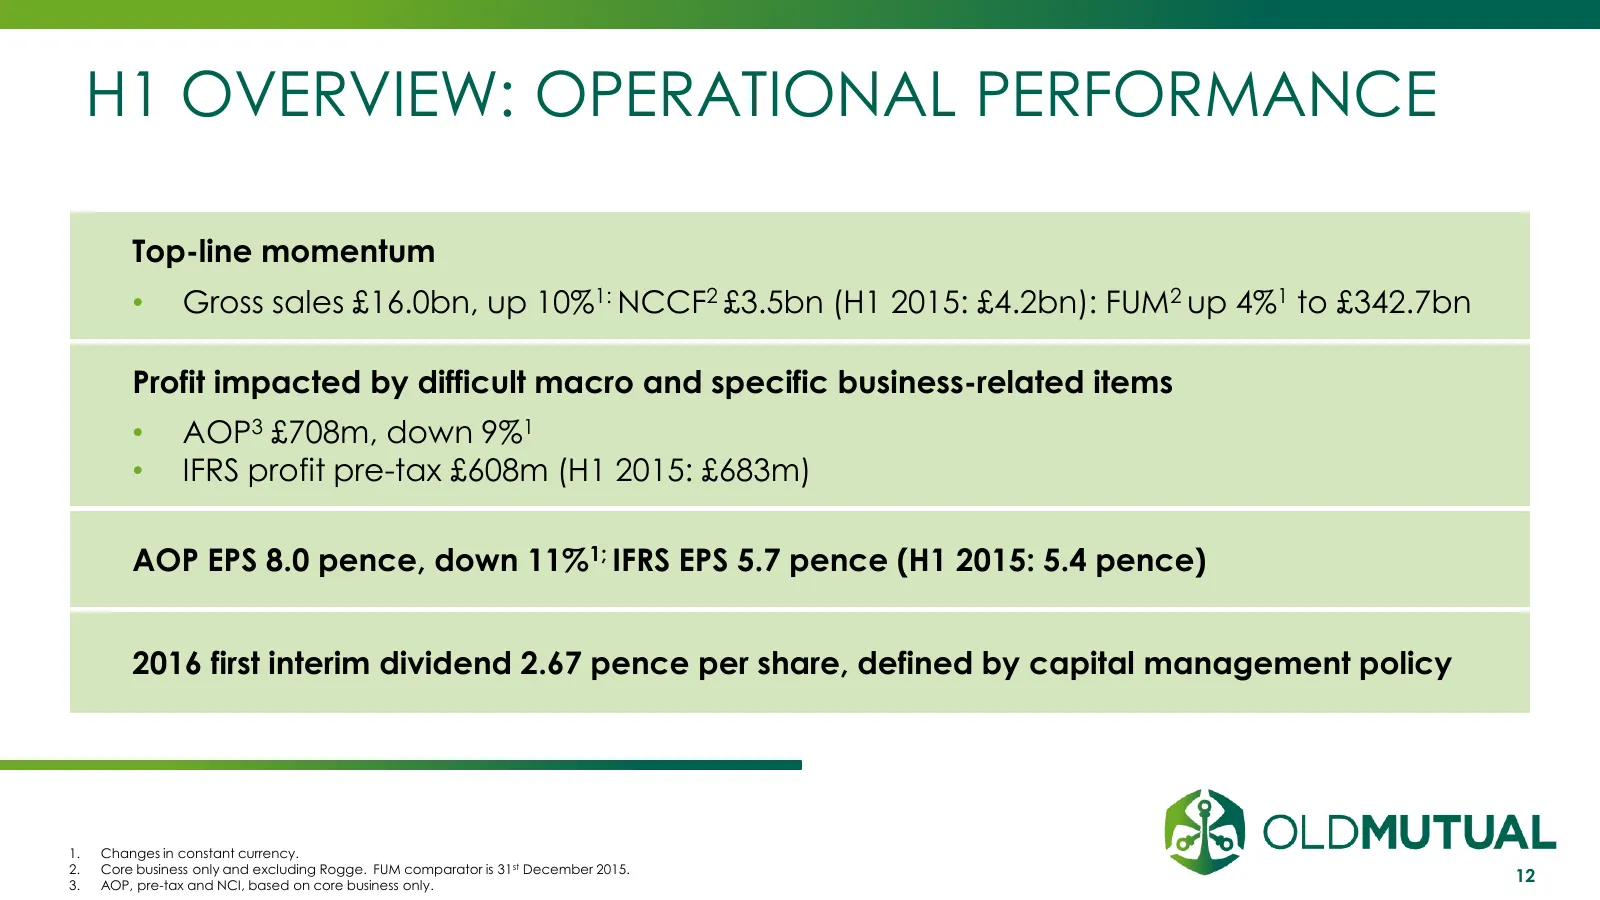
H1 OVERVIEW: OPERATIONAL PERFORMANCE Top-line momentum • Gross sales £16.0bn, up 10%1: NCCF2 £3.5bn (H1 2015: £4.2bn): FUM2 up 4%1 to £342.7bn Profit impacted by difficult macro and specific business-related items • AOP3 £708m, down 9%1 • IFRS profit pre-tax £608m (H1 2015: £683m) AOP EPS 8.0 pence,
Slide 13: Nedbank
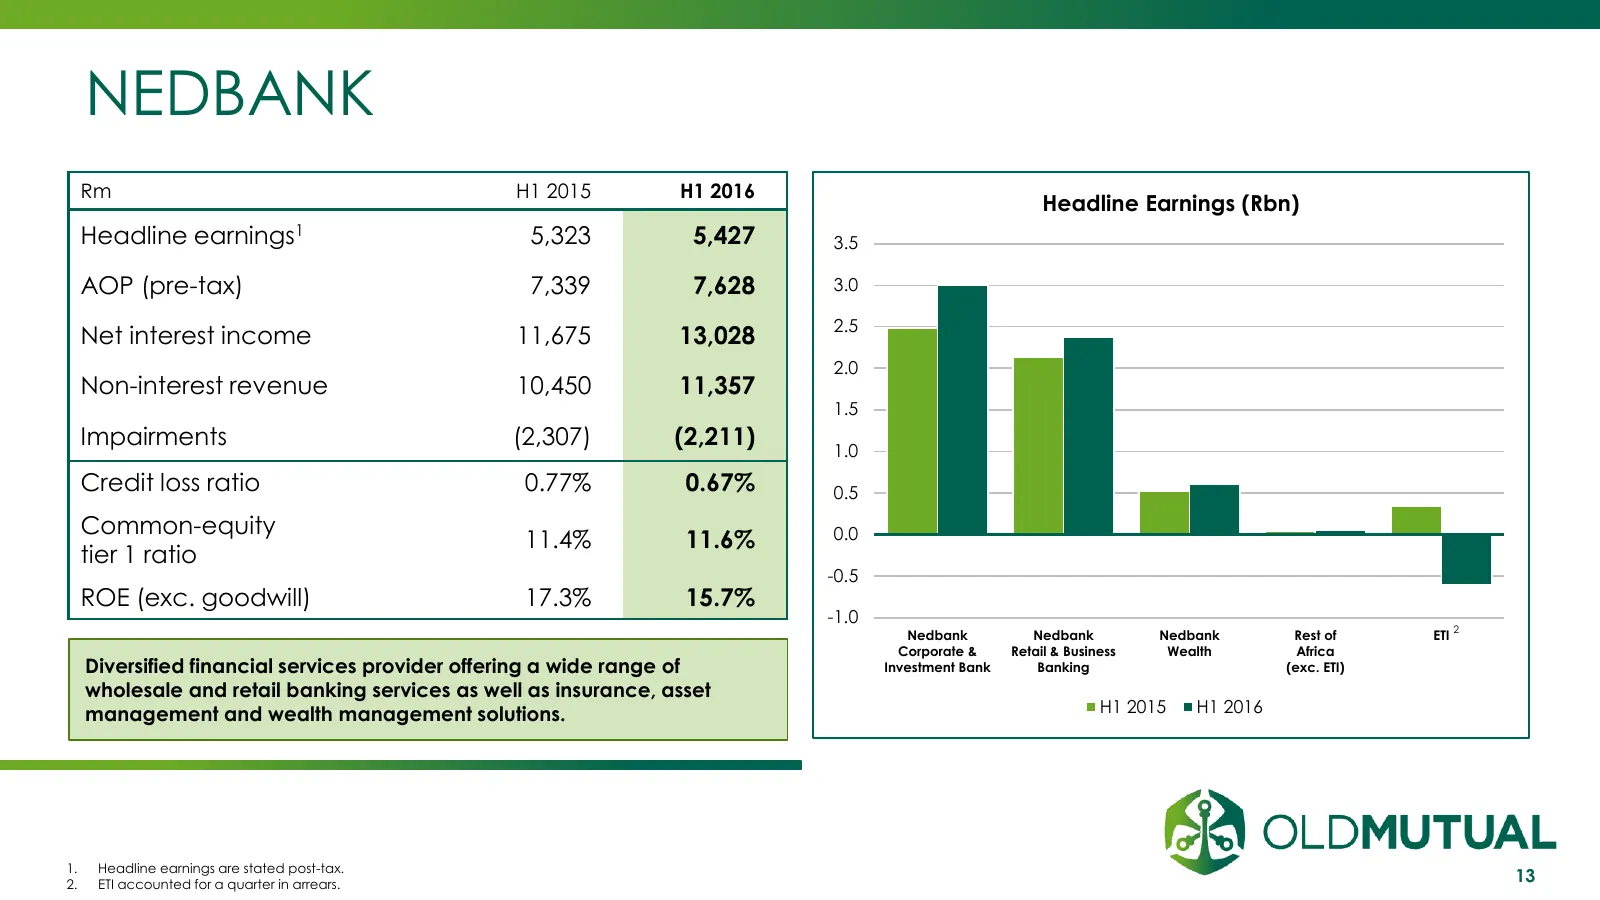
NEDBANK Rm H1 2015 H1 2016 Headline Earnings (Rbn) Headline earnings1 5,323 5,427 3.5 AOP (pre-tax) 7,339 7,628 3.0 2.5 Net interest income 11,675 13,028 2.0 Non-interest revenue 10,450 11,357 1.5 Impairments (2,307) (2,211) 1.0 Credit loss ratio 0.77% 0.67% 0.5 Common-equity 0.0 11.4% 11.6% tier 1
Slide 14: OM Asset Management
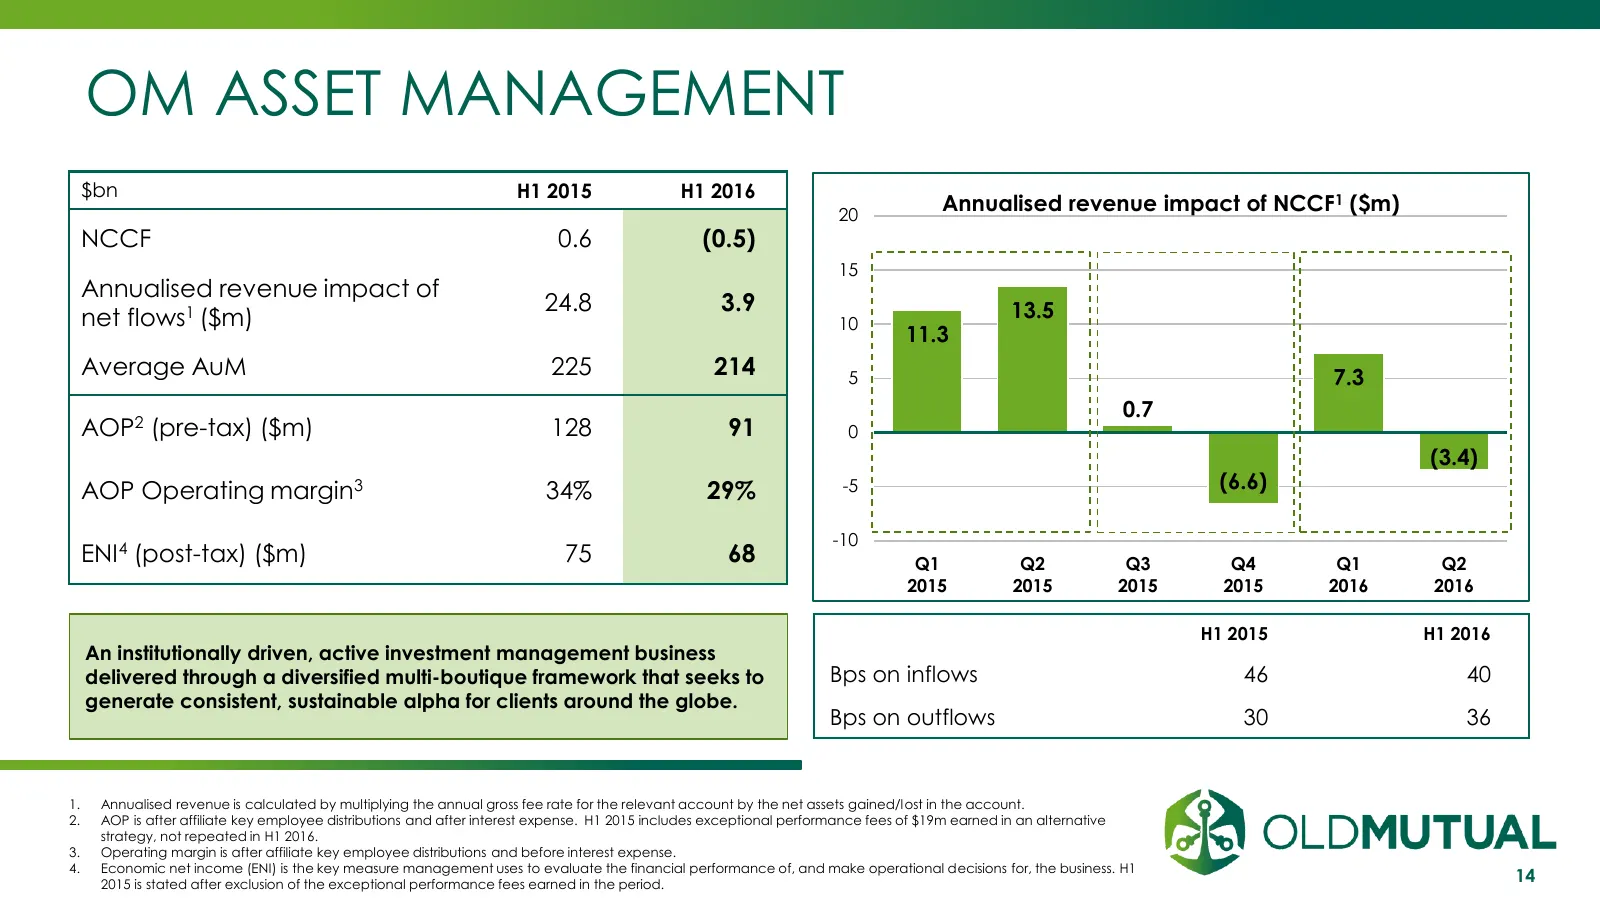
OM ASSET MANAGEMENT $bn H1 2015 H1 2016 20 Annualised revenue impact of NCCF1 ($m) NCCF 0.6 (0.5) 15 Annualised revenue impact of 24.8 3.9 13.5 net flows1 ($m) 10 11.3 Average AuM 225 214 5 7.3 0.7 AOP2 (pre-tax) ($m) 128 91 0 (3.4) AOP Operating margin3 34% 29% -5 (6.6) -10 ENI4 (post-tax) ($m) 75

Slide 15: Old Mutual Emerging Markets
OLD MUTUAL EMERGING MARKETS 11 August 2016 INVESTMENT | SAVINGS | INSURANCE | BANKING
Slide 16: Operational Performance
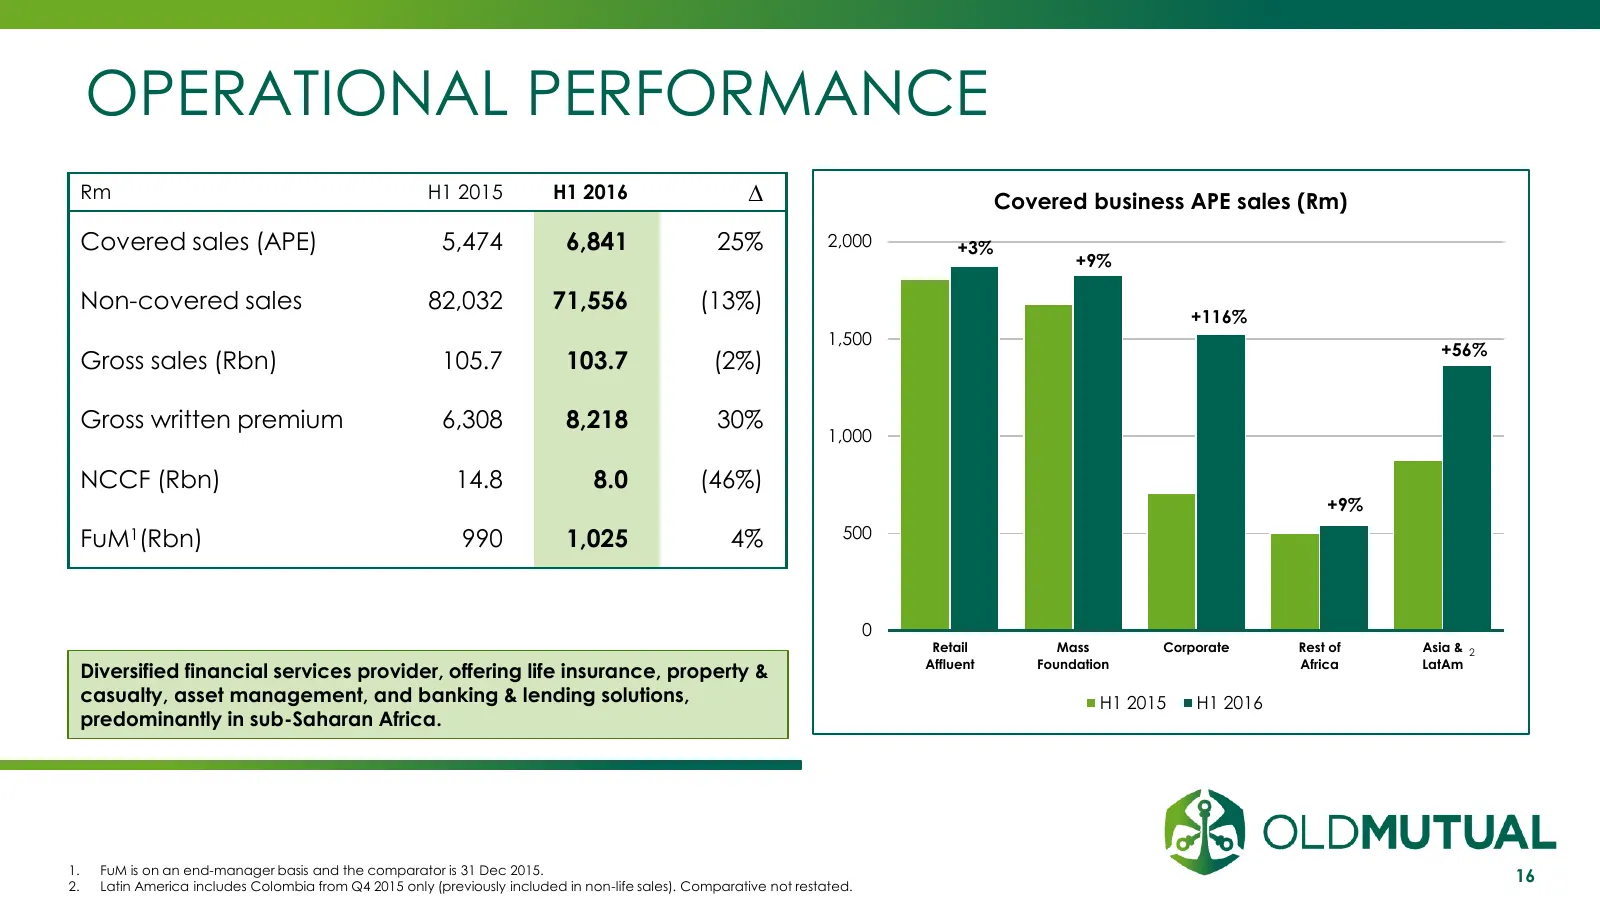
OPERATIONAL PERFORMANCE Rm H1 2015 H1 2016 ∆ Covered business APE sales (Rm) Covered sales (APE) 5,474 6,841 25% 2,000 +3% +9% Non-covered sales 82,032 71,556 (13%) +116% 1,500 +56% Gross sales (Rbn) 105.7 103.7 (2%) Gross written premium 6,308 8,218 30% 1,000 NCCF (Rbn) 14.8 8.0 (46%) +9% FuM1(Rbn)
Slide 17: Profit, Cash & Returns
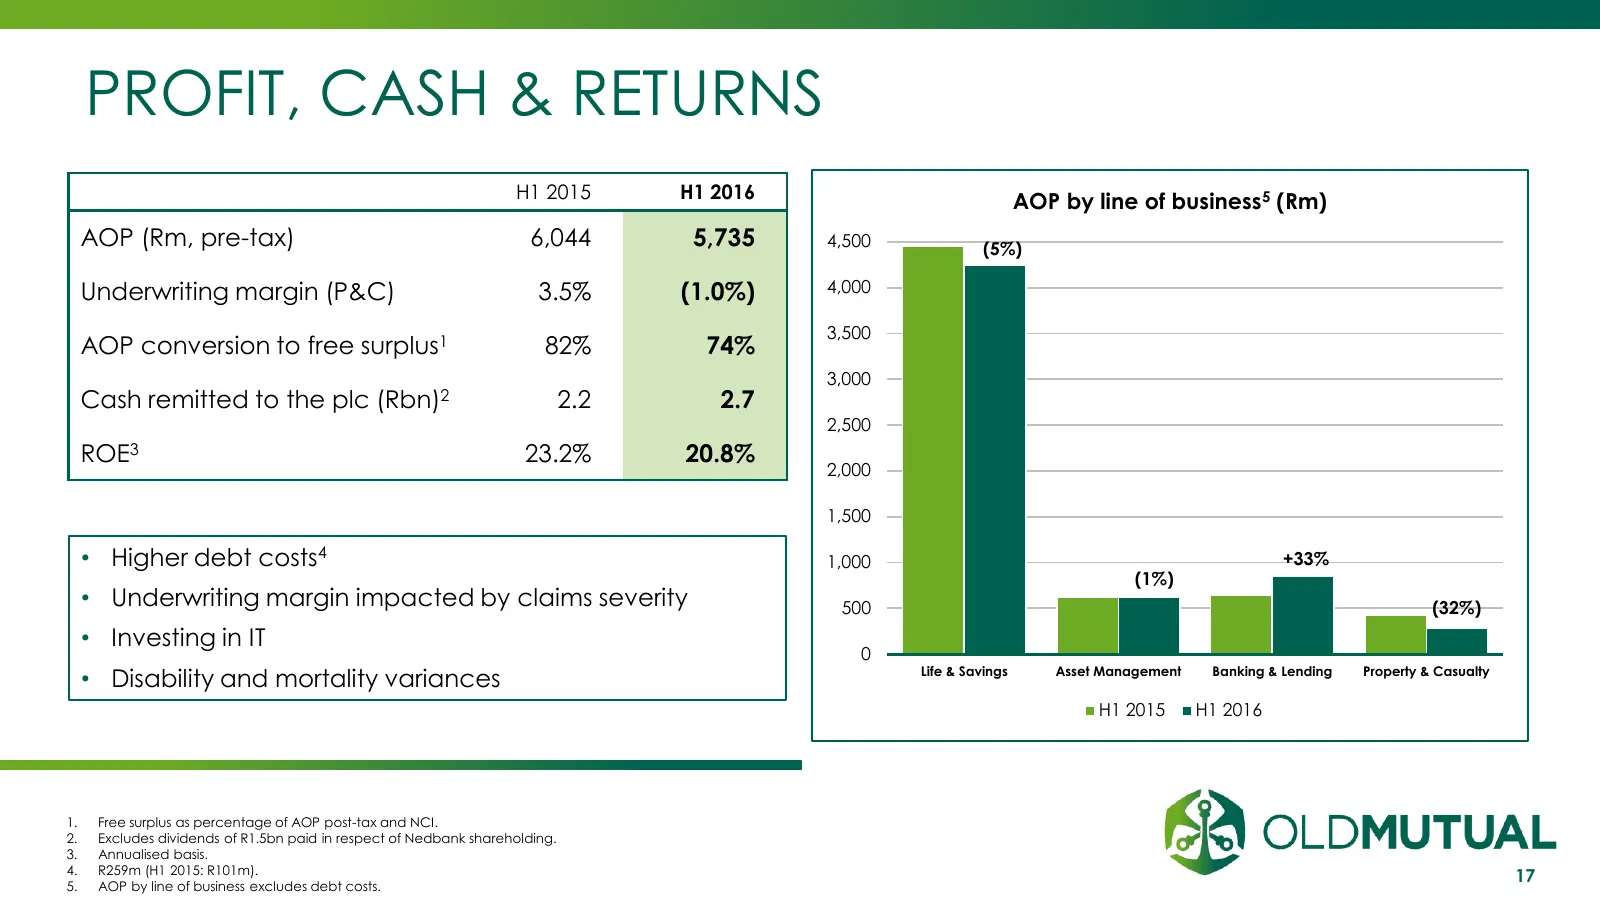
PROFIT, CASH & RETURNS H1 2015 H1 2016 AOP by line of business5 (Rm) AOP (Rm, pre-tax) 6,044 5,735 4,500 (5%) Underwriting margin (P&C) 3.5% (1.0%) 4,000 3,500 AOP conversion to free surplus1 82% 74% 3,000 Cash remitted to the plc (Rbn)2 2.2 2.7 2,500 ROE3 23.2% 20.8% 2,000 1,500 • Higher debt costs
Slide 18: Emerging Markets MCEV Results
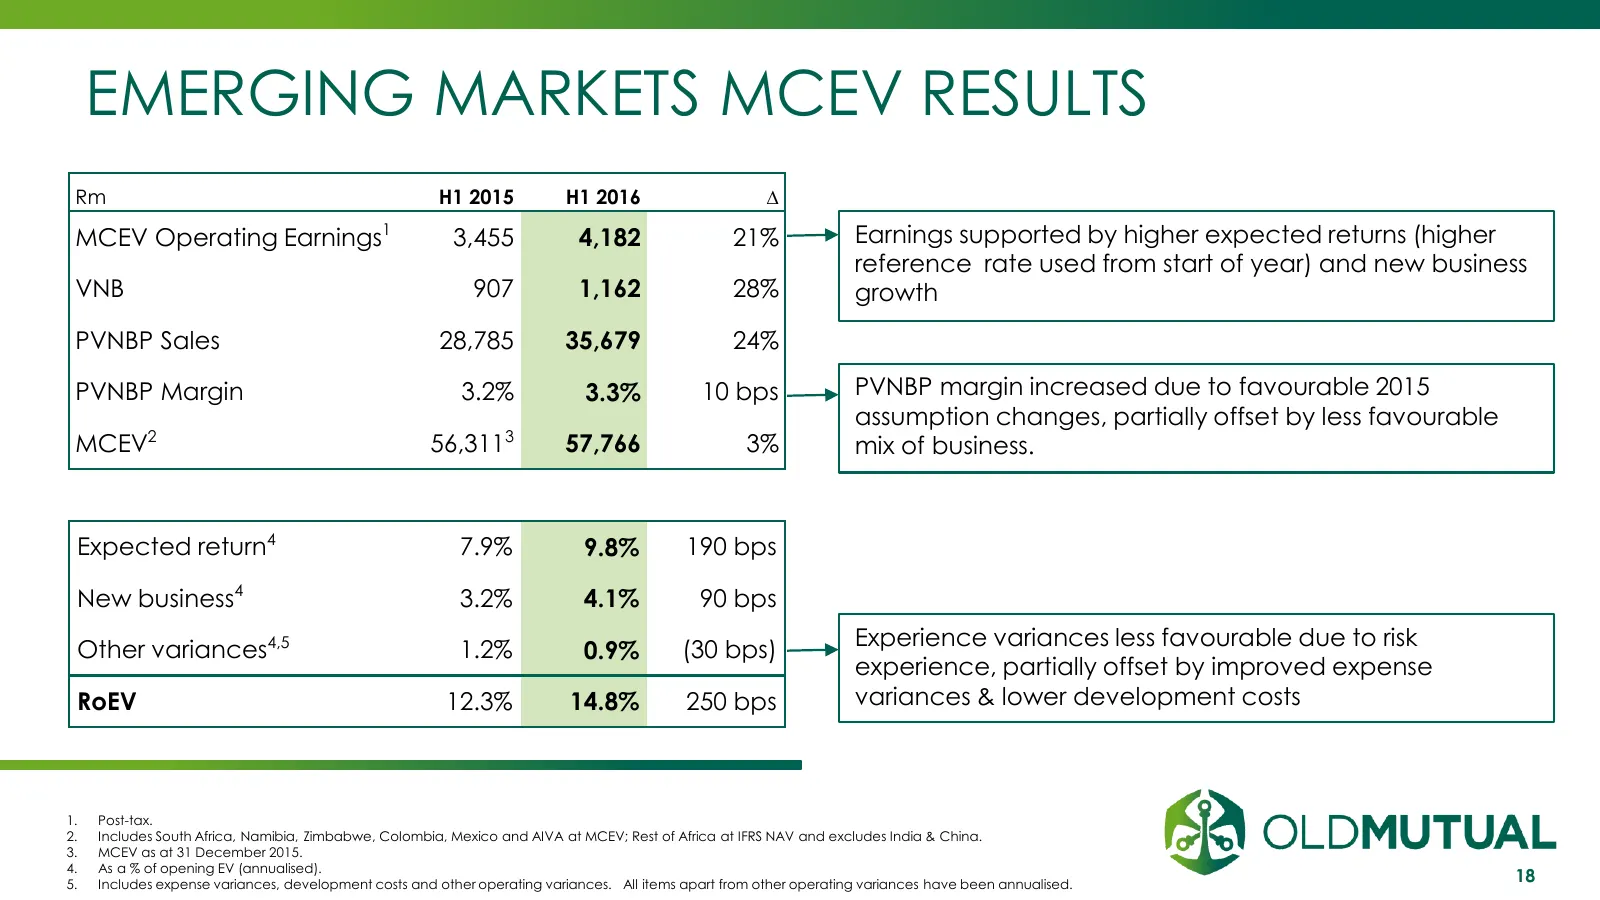
EMERGING MARKETS MCEV RESULTS Rm H1 2015 H1 2016 ∆ MCEV Operating Earnings 1 3,455 4,182 21% Earnings supported by higher expected returns (higher reference rate used from start of year) and new business VNB 907 1,162 28% growth PVNBP Sales 28,785 35,679 24% PVNBP Margin 3.2% 3.3% 10 bps PVNBP margi
Slide 19: Recent Developments Outside South Africa
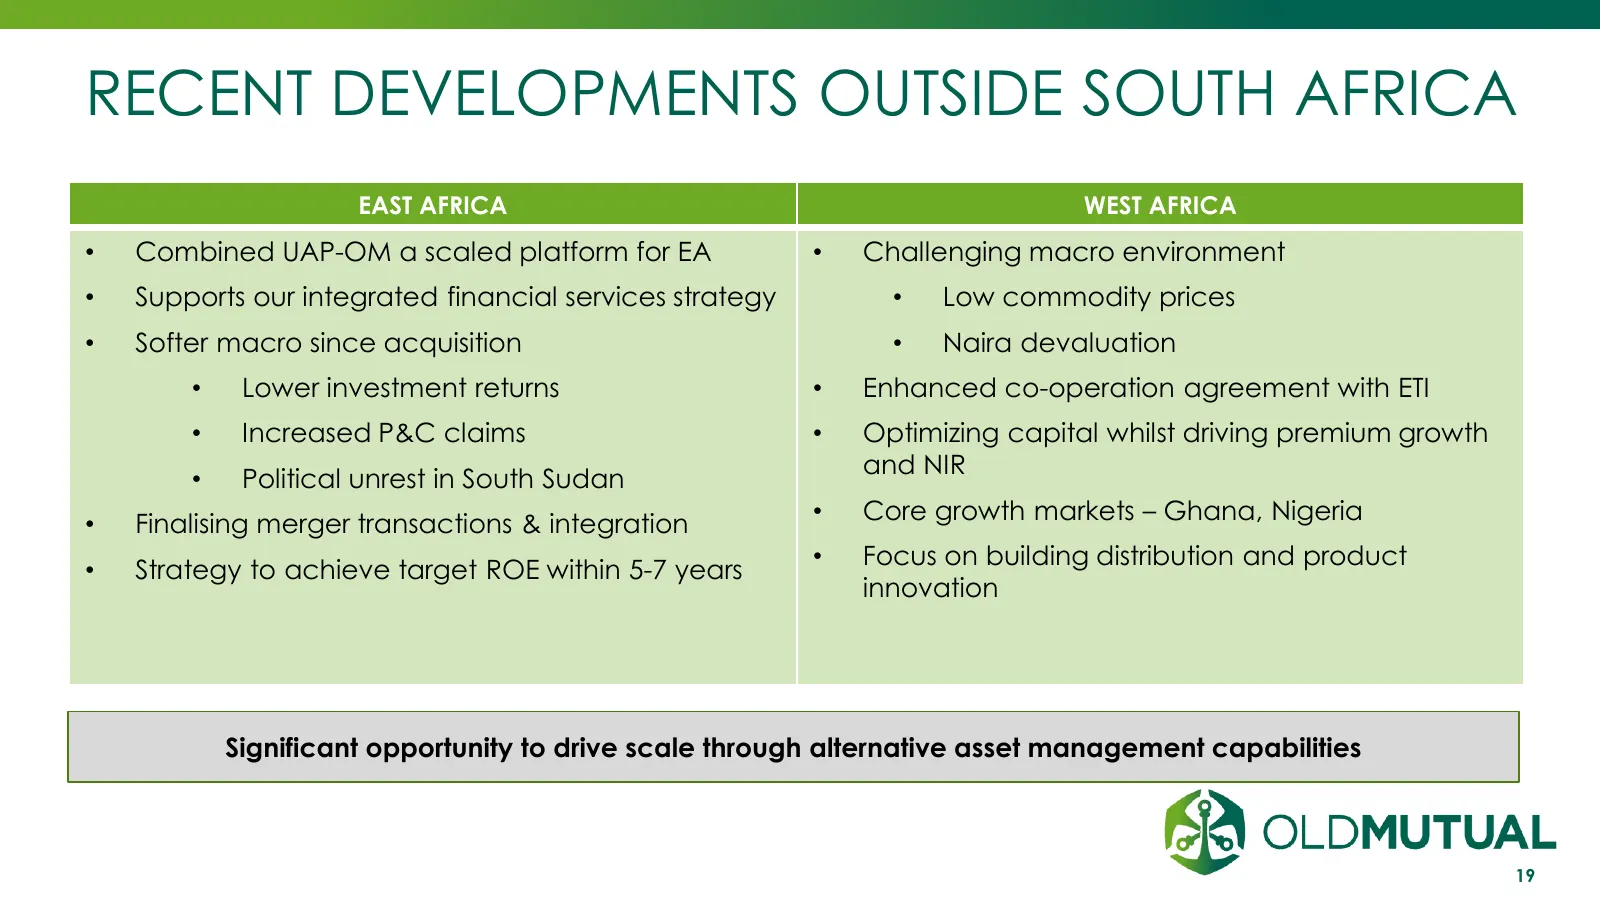
RECENT DEVELOPMENTS OUTSIDE SOUTH AFRICA EAST AFRICA WEST AFRICA • Combined UAP-OM a scaled platform for EA • Challenging macro environment • Supports our integrated financial services strategy • Low commodity prices • Softer macro since acquisition • Naira devaluation • Lower investment returns • E
Slide 20: OMEM: Summary
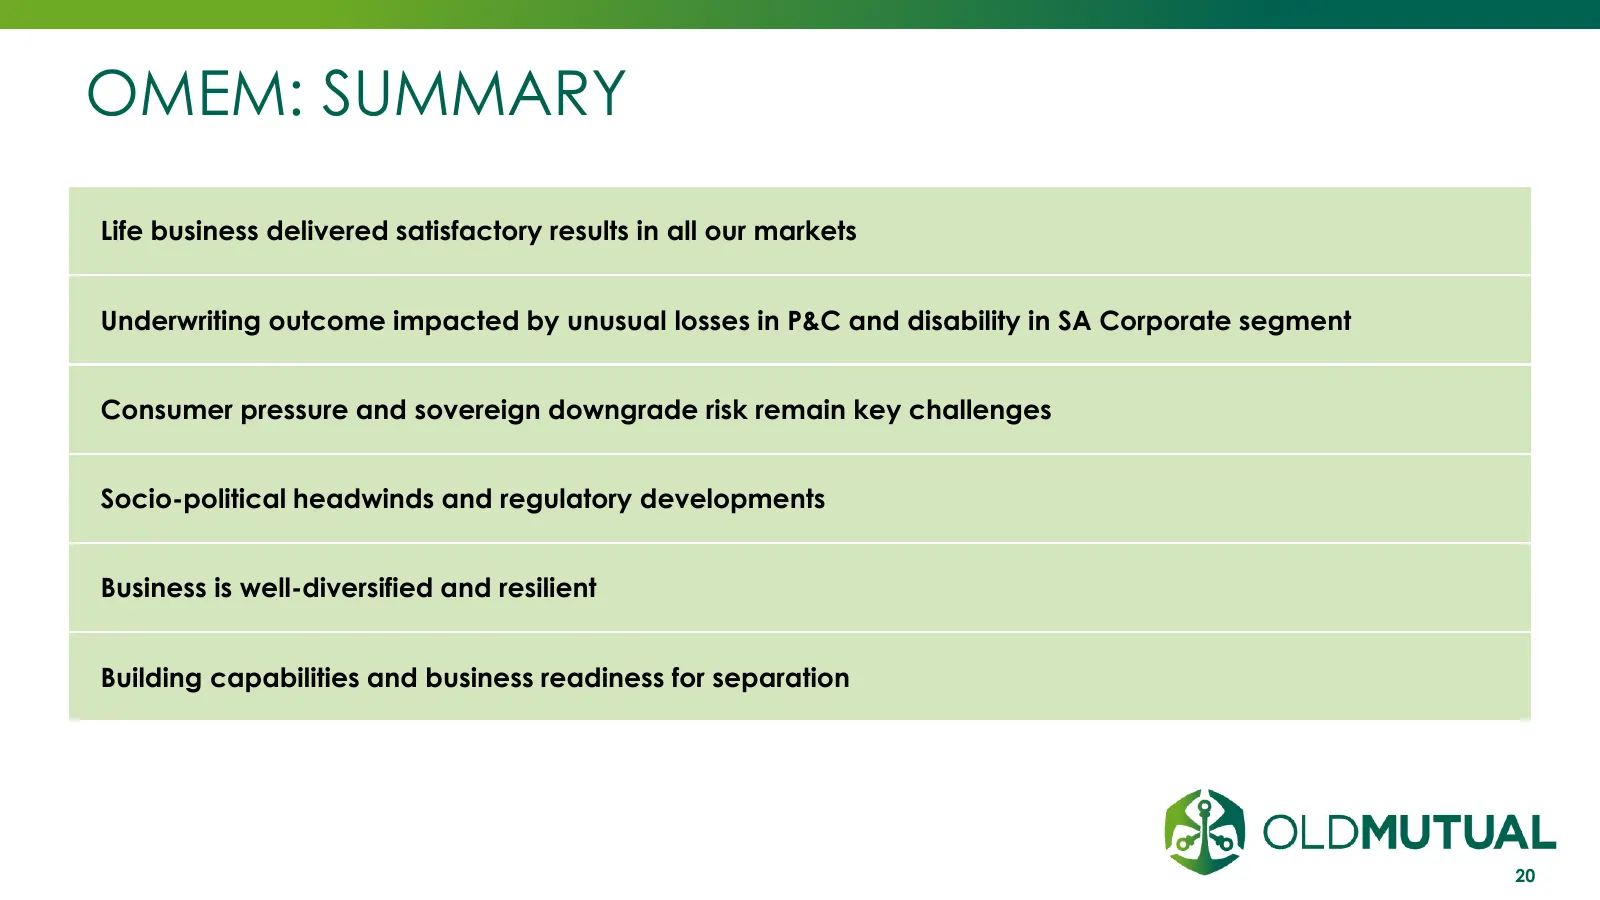
OMEM: SUMMARY Life business delivered satisfactory results in all our markets Underwriting outcome impacted by unusual losses in P&C and disability in SA Corporate segment Consumer pressure and sovereign downgrade risk remain key challenges Socio-political headwinds and regulatory developments Busin

Slide 21: Old Mutual Wealth
OLD MUTUAL WEALTH 11 August 2016 INVESTMENT | SAVINGS | INSURANCE | BANKING
Slide 22: Operational Performance
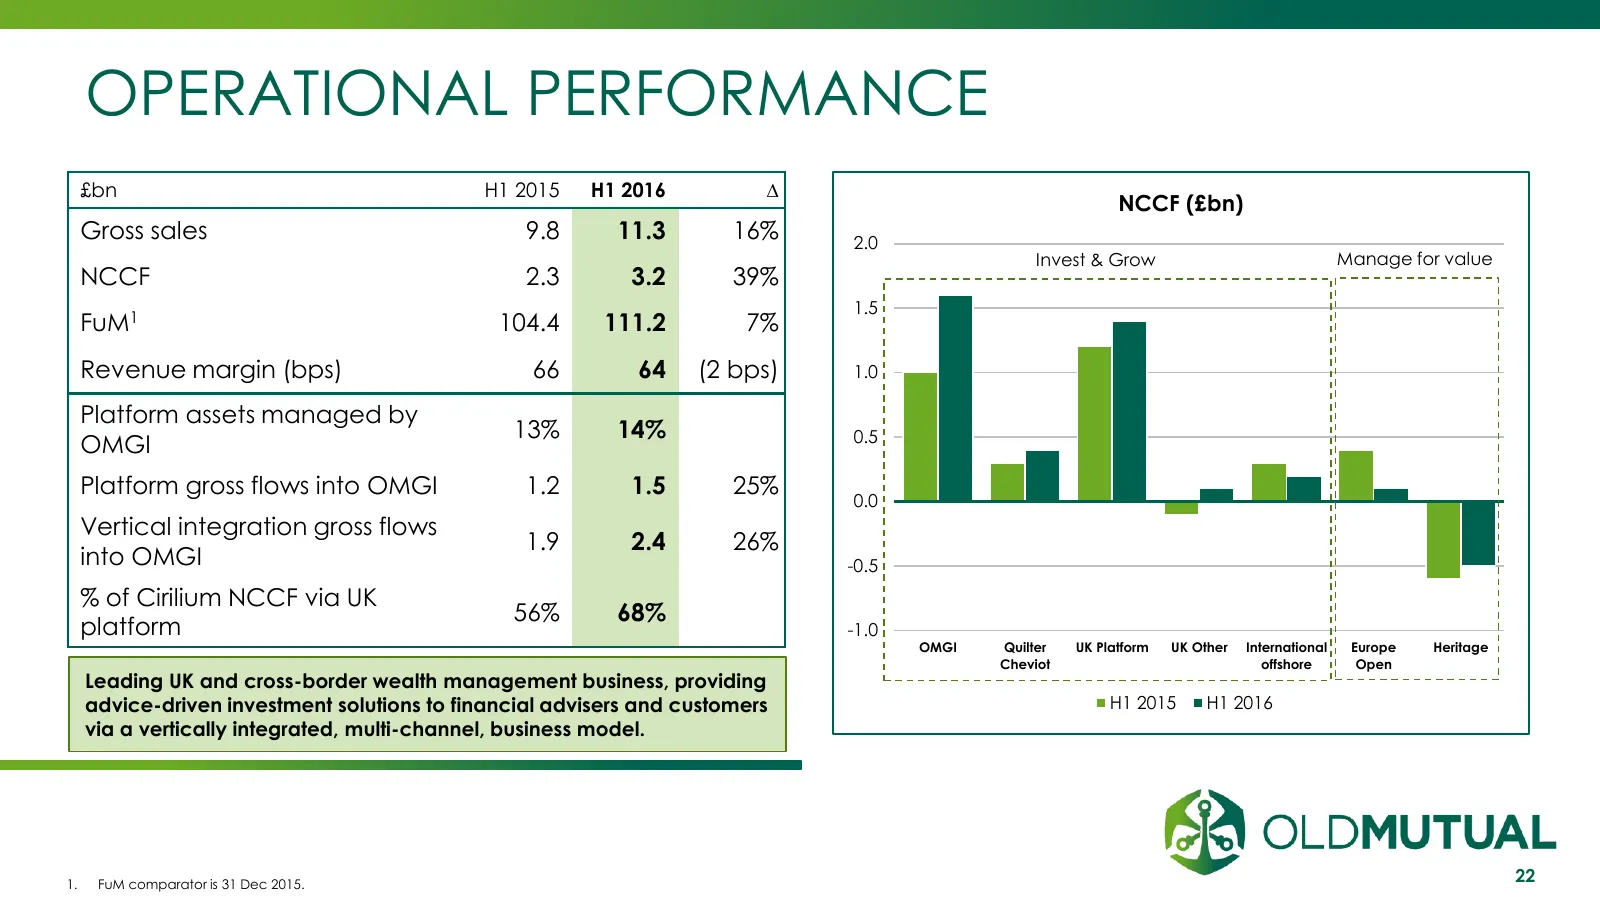
OPERATIONAL PERFORMANCE £bn H1 2015 H1 2016 ∆ NCCF (£bn) Gross sales 9.8 11.3 16% 2.0 Invest & Grow Manage for value NCCF 2.3 3.2 39% 1.5 FuM1 104.4 111.2 7% Revenue margin (bps) 66 64 (2 bps) 1.0 Platform assets managed by 13% 14% 0.5 OMGI Platform gross flows into OMGI 1.2 1.5 25% 0.0 Vertical int
Slide 23: Profit, Cash & Returns
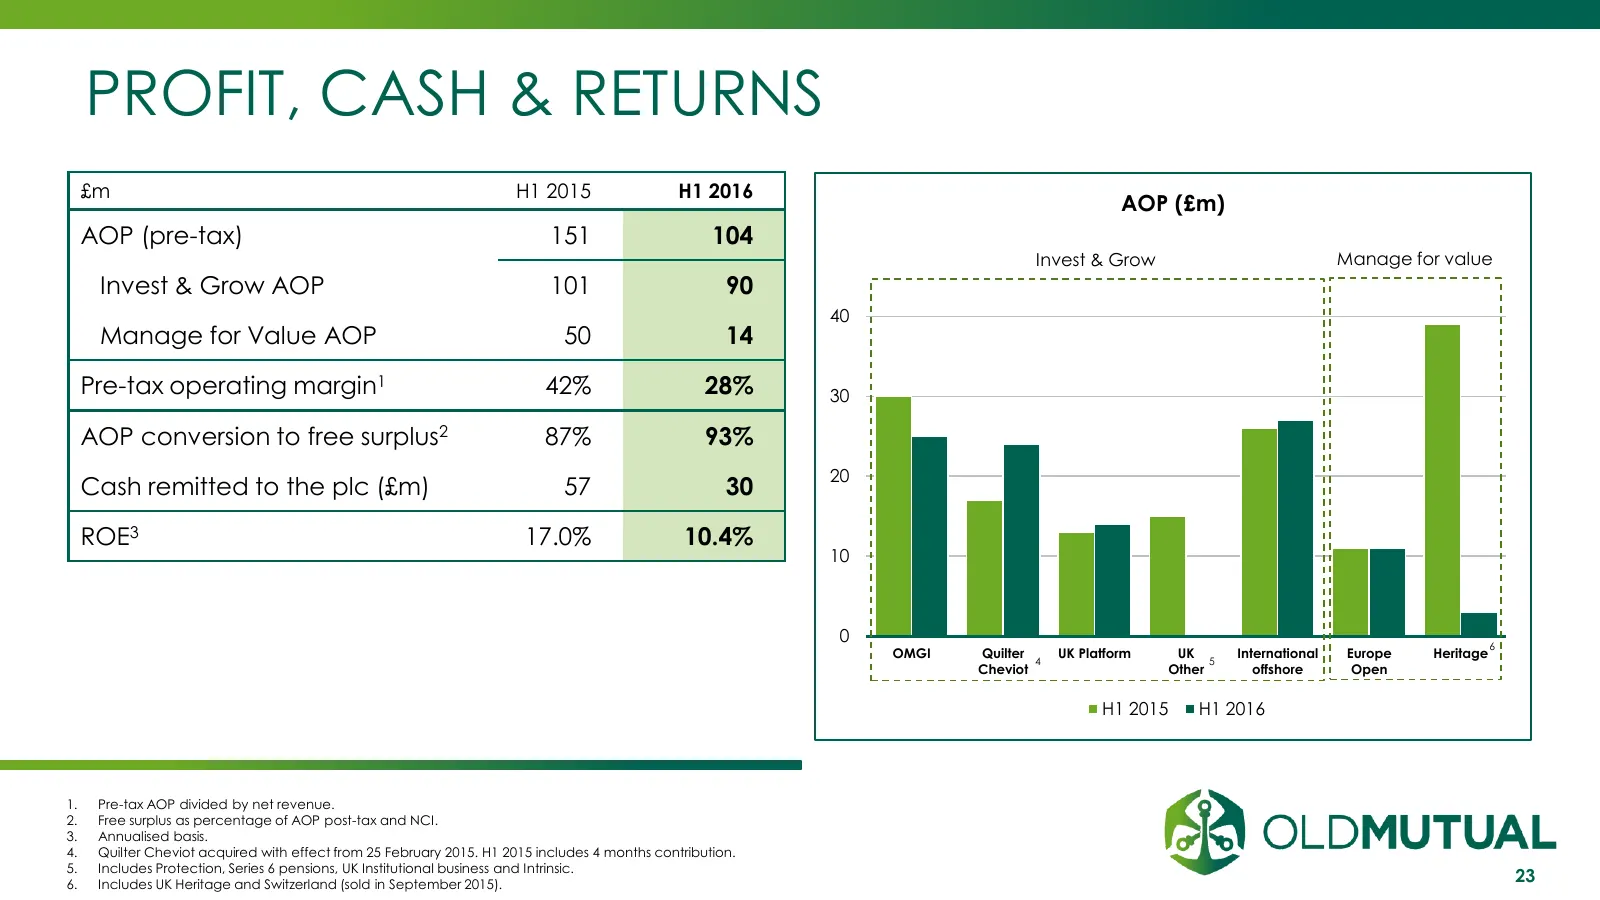
PROFIT, CASH & RETURNS £m H1 2015 H1 2016 AOP (£m) AOP (pre-tax) 151 104 Invest & Grow Manage for value Invest & Grow AOP 101 90 40 Manage for Value AOP 50 14 Pre-tax operating margin1 42% 28% 30 AOP conversion to free surplus2 87% 93% 20 Cash remitted to the plc (£m) 57 30 ROE3 17.0% 10.4% 10 0 6 O
Slide 24: UK Platform Transformation Update
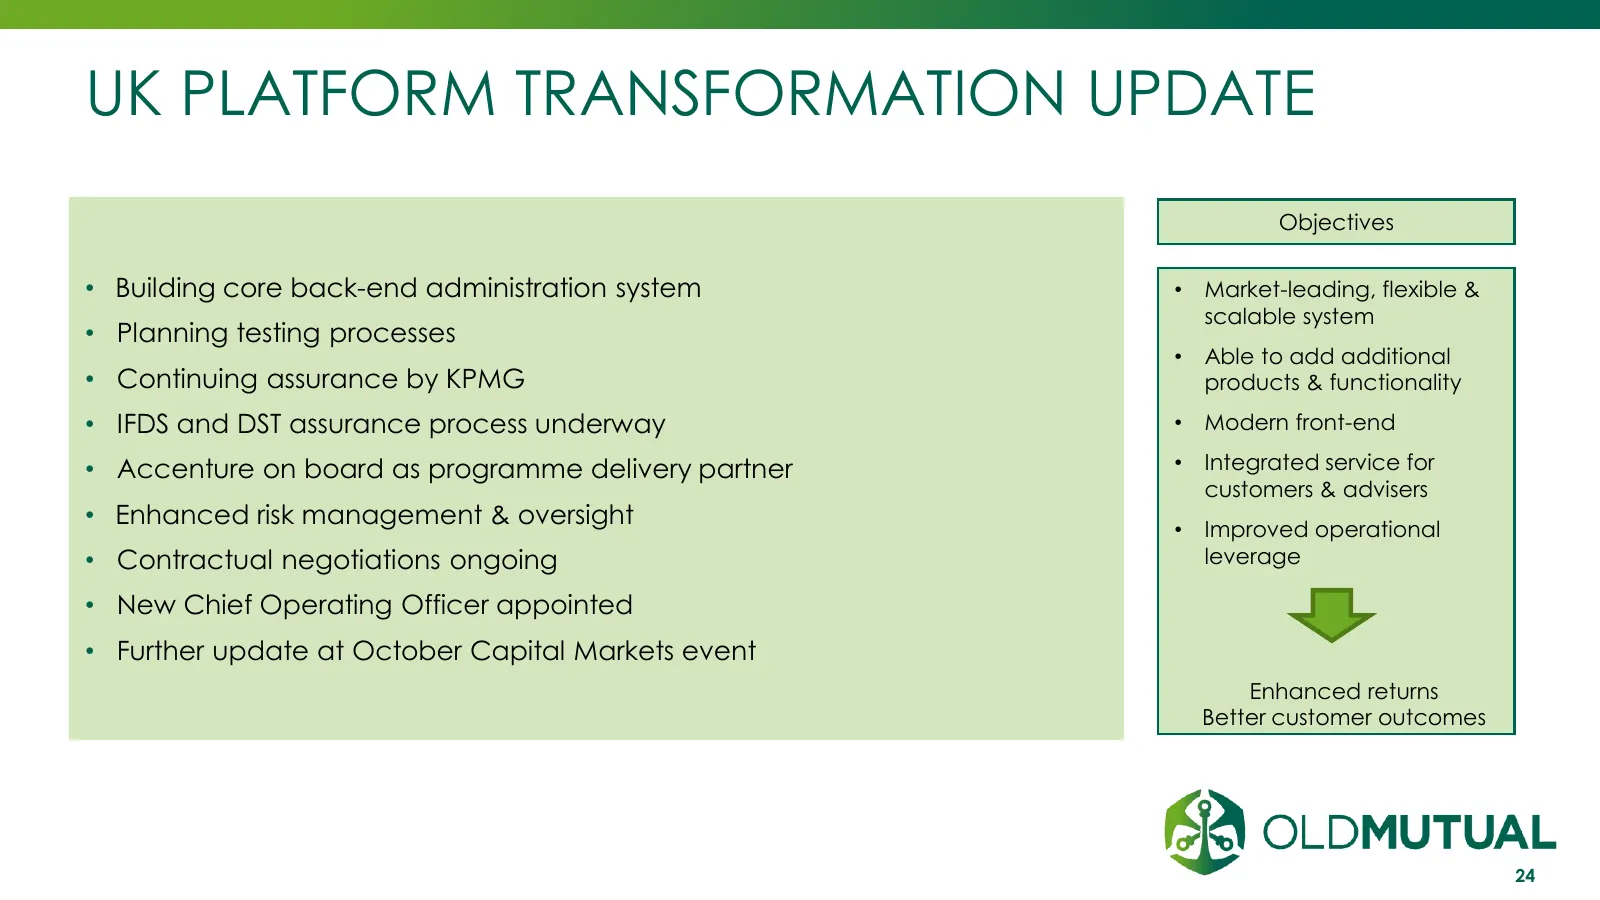
UK PLATFORM TRANSFORMATION UPDATE Objectives • Building core back-end administration system • Market-leading, flexible & scalable system • Planning testing processes • Able to add additional • Continuing assurance by KPMG products & functionality • IFDS and DST assurance process underway • Modern fr
Slide 25: Old Mutual Wealth: Summary
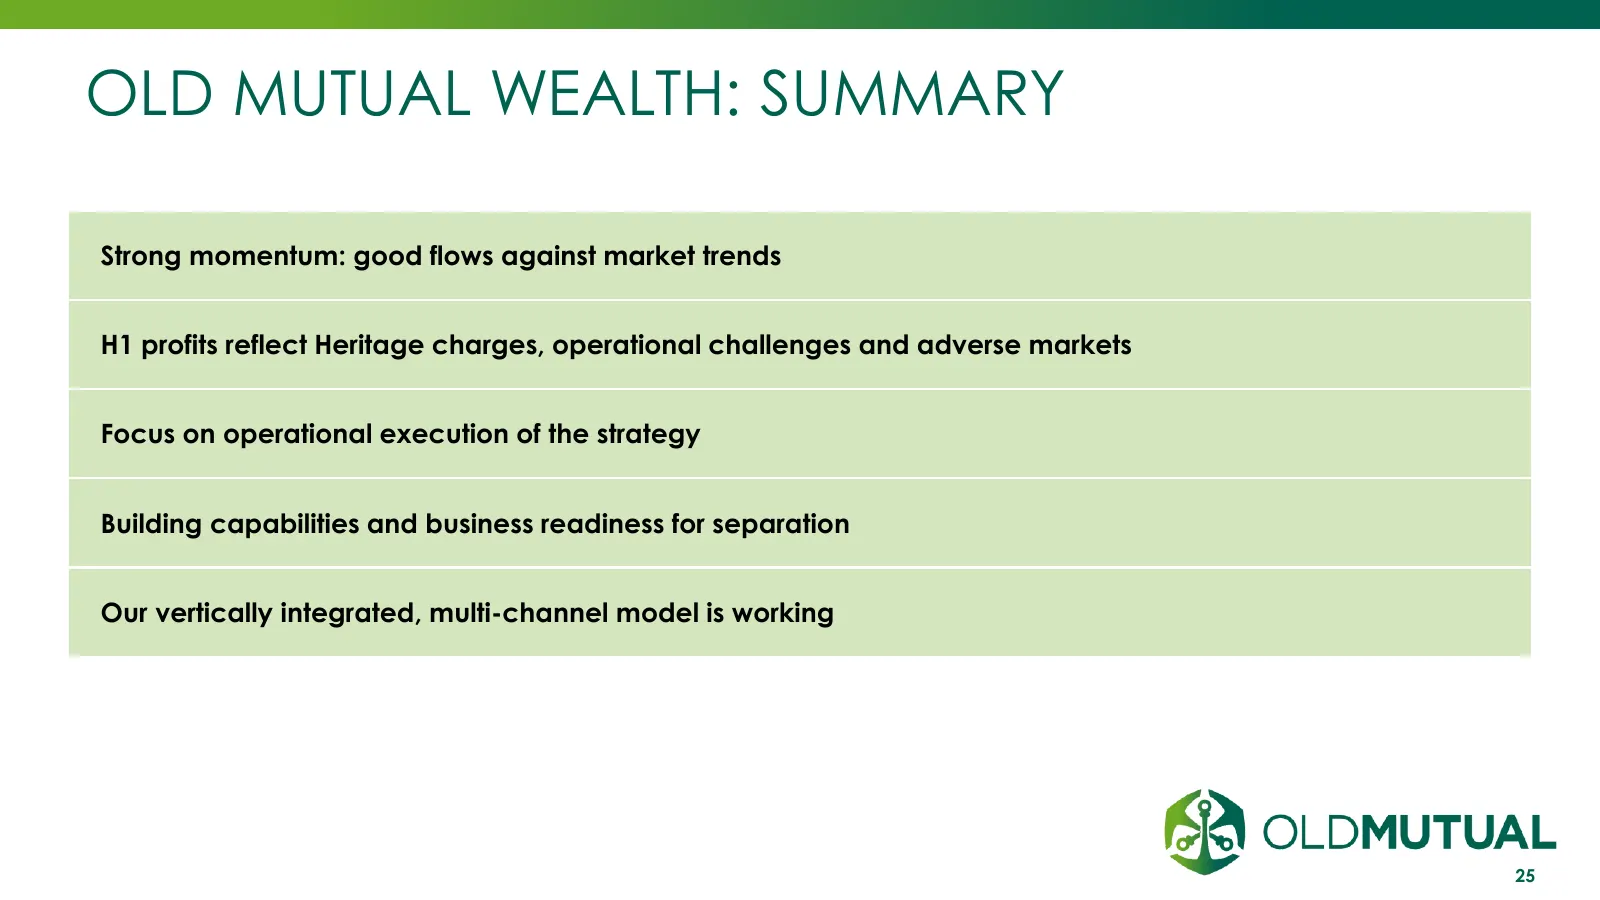
OLD MUTUAL WEALTH: SUMMARY Strong momentum: good flows against market trends H1 profits reflect Heritage charges, operational challenges and adverse markets Focus on operational execution of the strategy Building capabilities and business readiness for separation Our vertically integrated, multi-cha
Slide 26: Financial Review
FINANCIAL REVIEW 11 August 2016 INVESTMENT | SAVINGS | INSURANCE | BANKING
Slide 27: Agenda
AGENDA Profit Cash Capital Financial summary 27
Slide 28: Operating Profit Analysis (AOP)
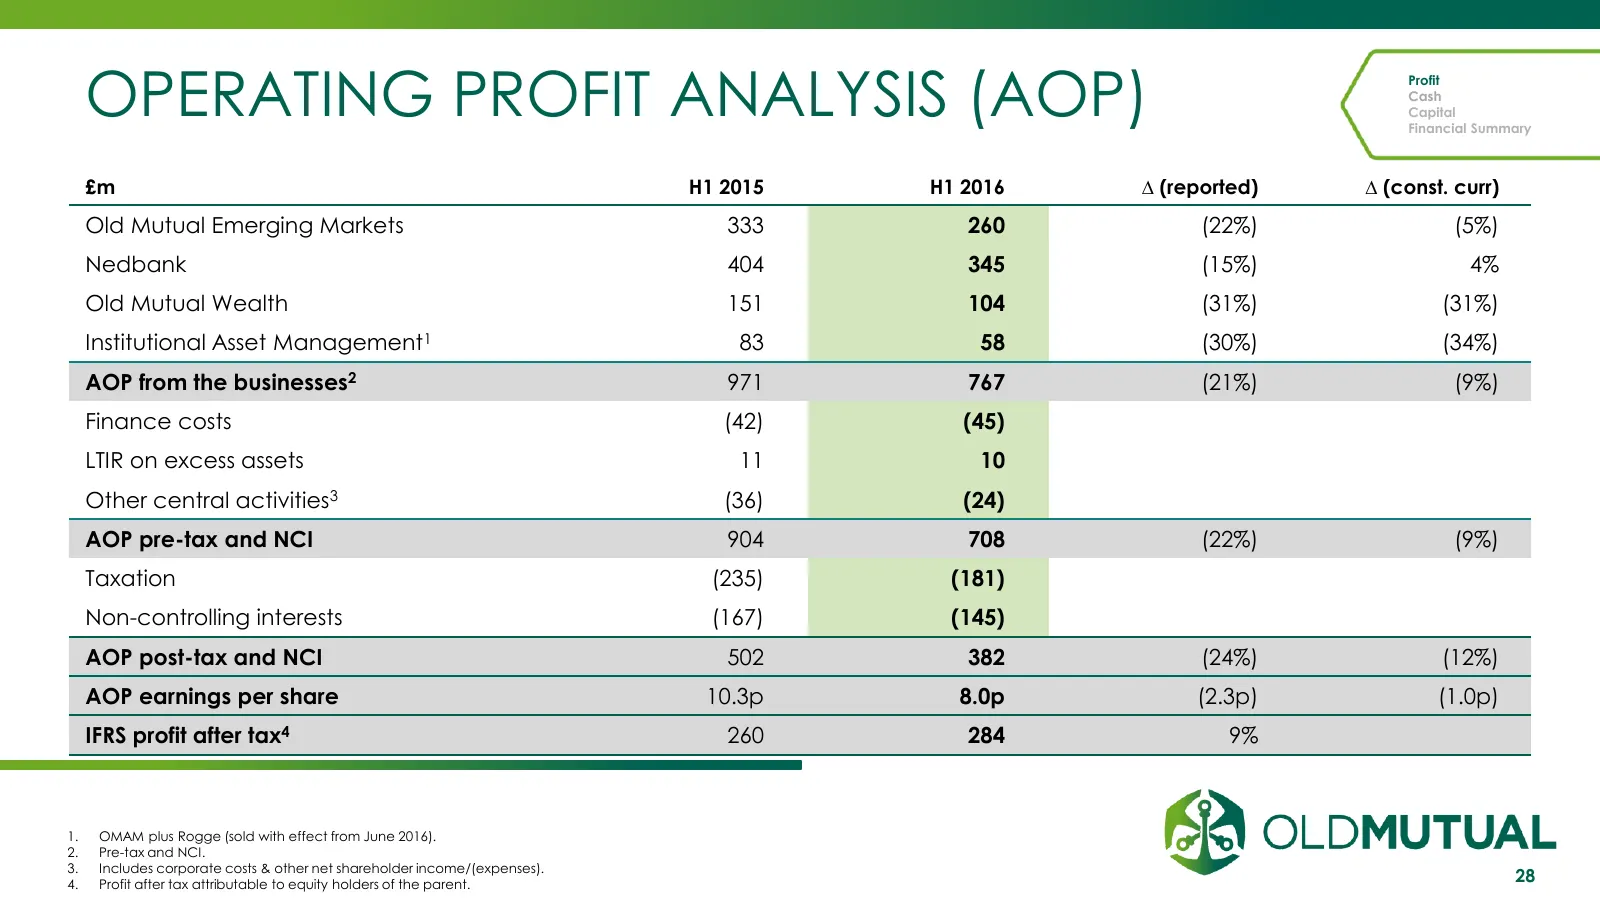
OPERATING PROFIT ANALYSIS (AOP) Profit Cash Capital Financial Summary £m H1 2015 H1 2016 ∆ (reported) ∆ (const. curr) Old Mutual Emerging Markets 333 260 (22%) (5%) Nedbank 404 345 (15%) 4% Old Mutual Wealth 151 104 (31%) (31%) Institutional Asset Management1 83 58 (30%) (34%) AOP from the businesse
Slide 29: Cost of Central Activities
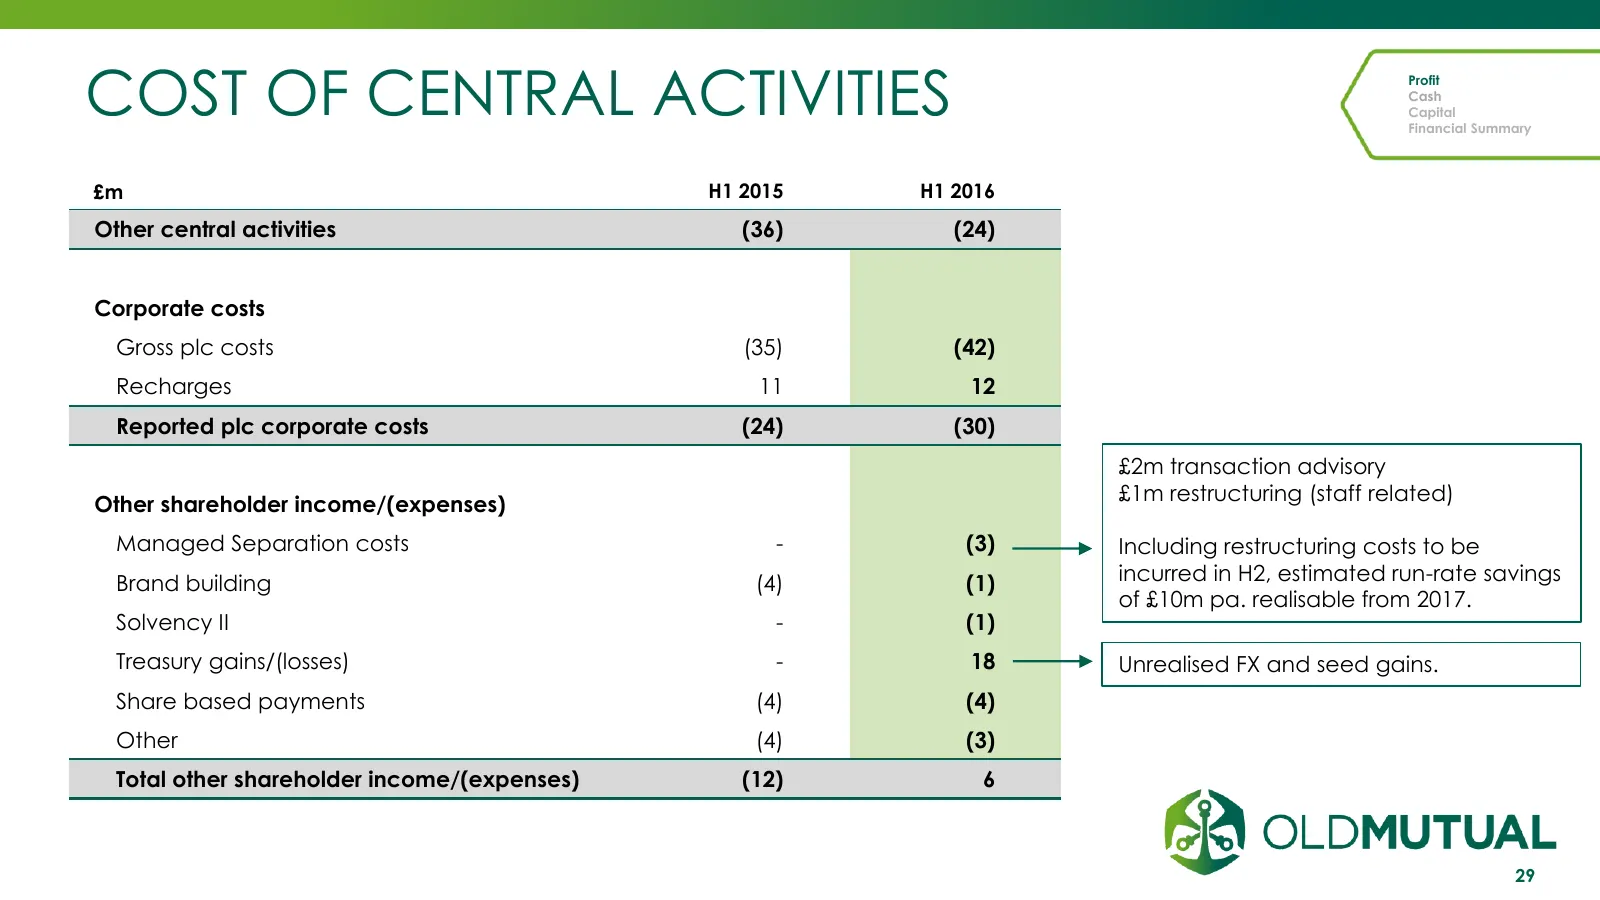
COST OF CENTRAL ACTIVITIES Profit Cash Capital Financial Summary £m H1 2015 H1 2016 Other central activities (36) (24) Corporate costs Gross plc costs (35) (42) Recharges 11 12 Reported plc corporate costs (24) (30) £2m transaction advisory £1m restructuring (staff related) Other shareholder income/
Slide 30: Conversion of Business AOP to PLC Cash
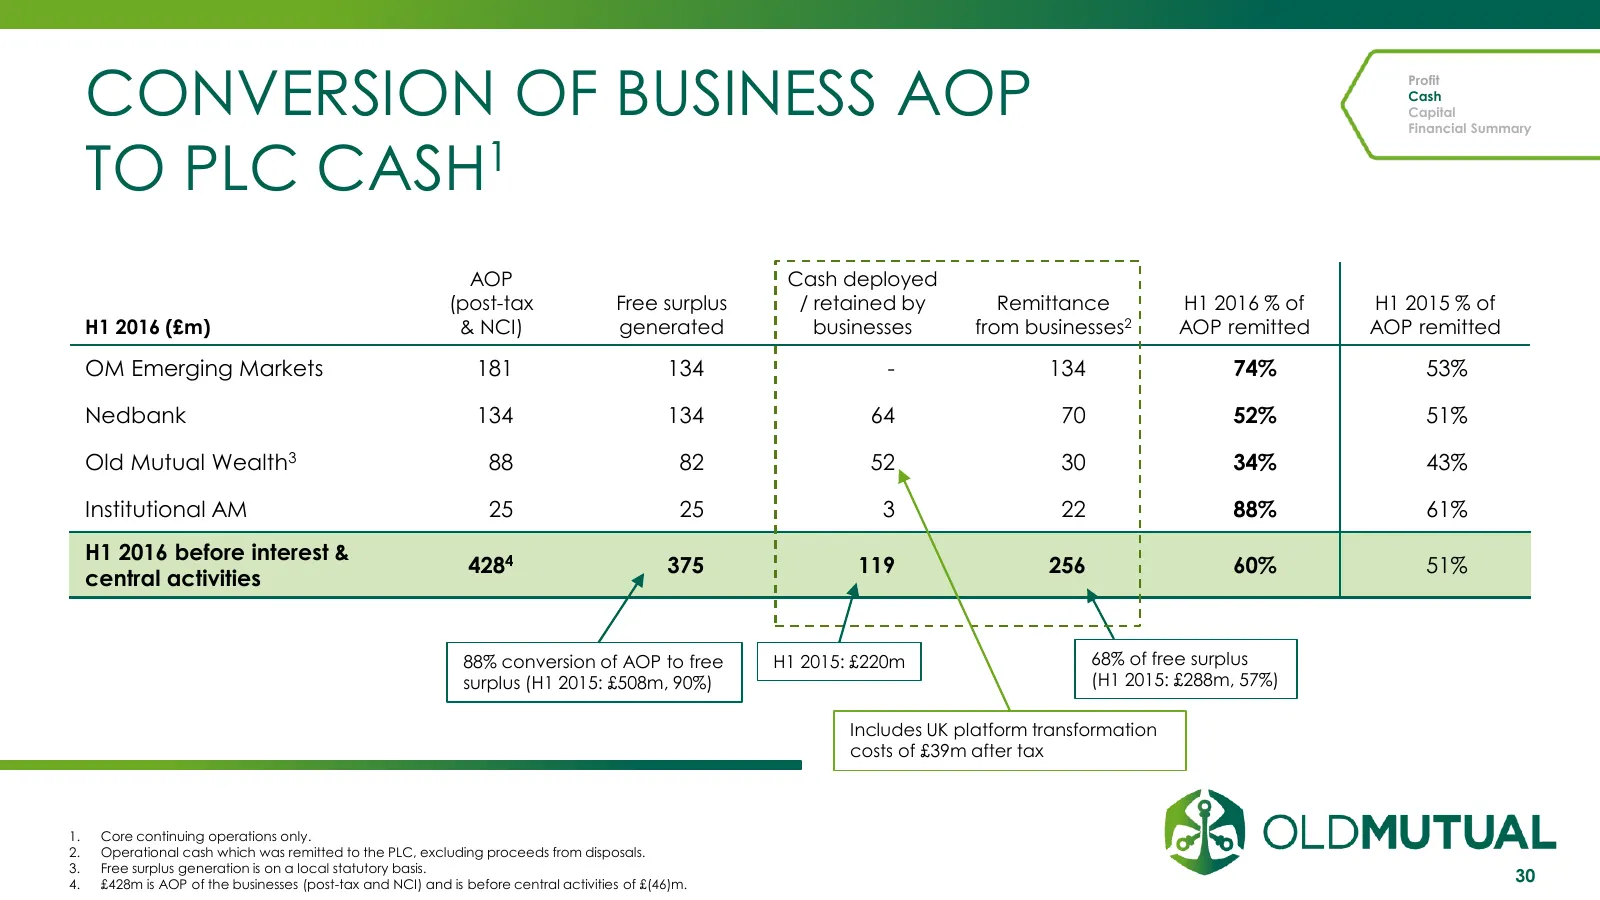
CONVERSION OF BUSINESS AOP Profit Cash Capital Financial Summary TO PLC CASH1 AOP Cash deployed (post-tax Free surplus / retained by Remittance H1 2016 % of H1 2015 % of H1 2016 (£m) & NCI) generated businesses from businesses2 AOP remitted AOP remitted OM Emerging Markets 181 134 - 134 74% 53% Nedb
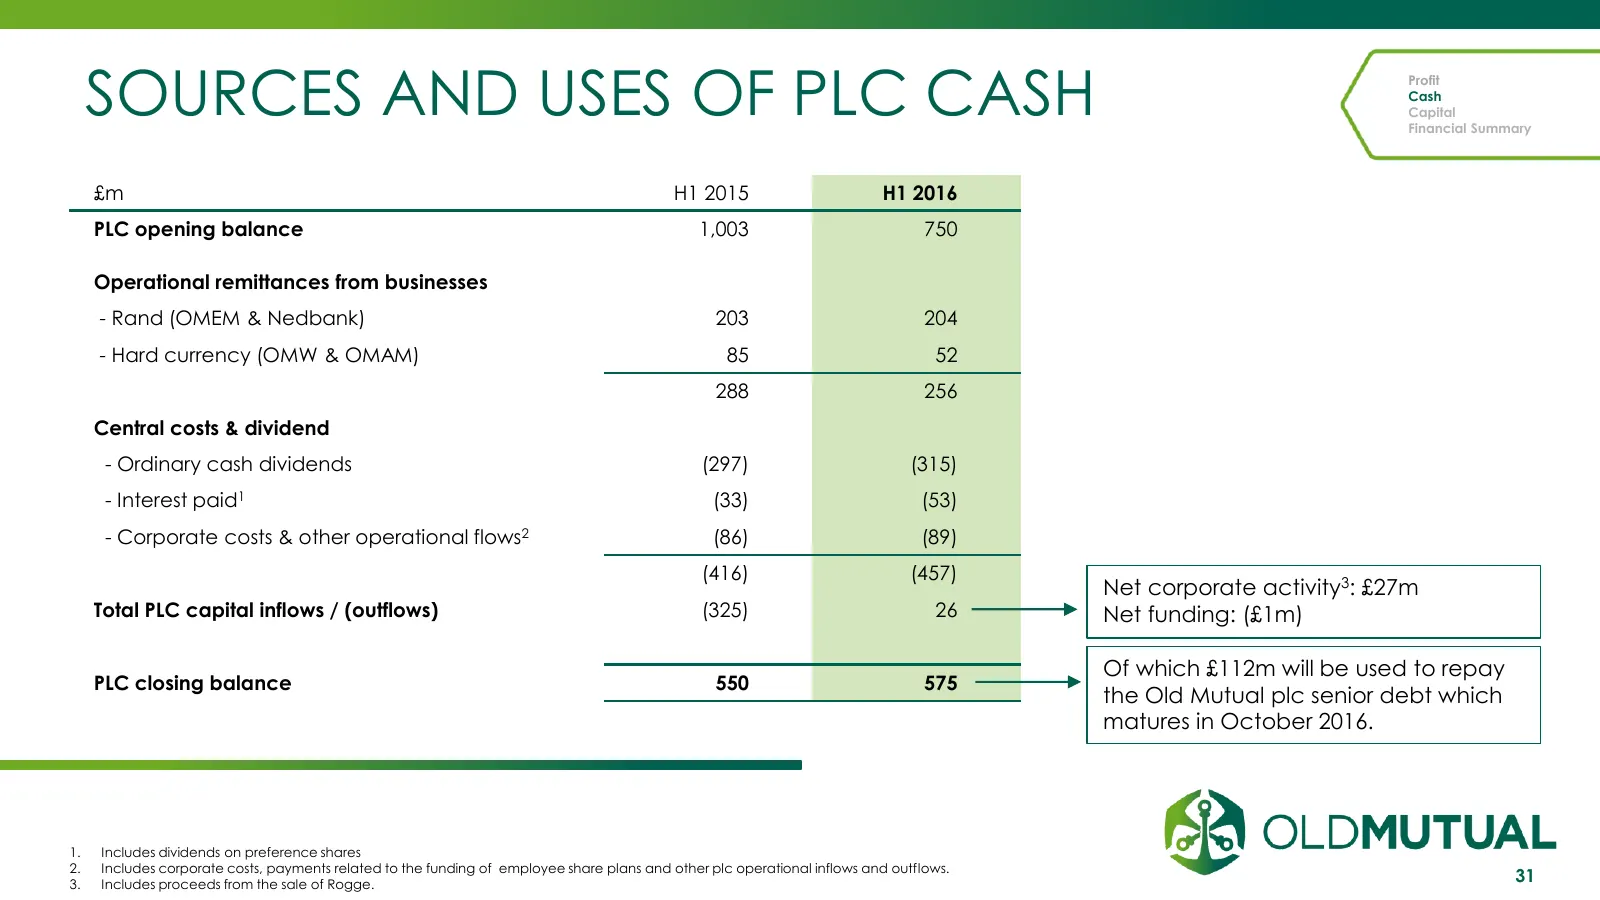
Slide 31: Sources and Uses of PLC Cash
SOURCES AND USES OF PLC CASH Profit Cash Capital Financial Summary £m H1 2015 H1 2016 PLC opening balance 1,003 750 Operational remittances from businesses - Rand (OMEM & Nedbank) 203 204 - Hard currency (OMW & OMAM) 85 52 288 256 Central costs & dividend - Ordinary cash dividends (297) (315) - Inte
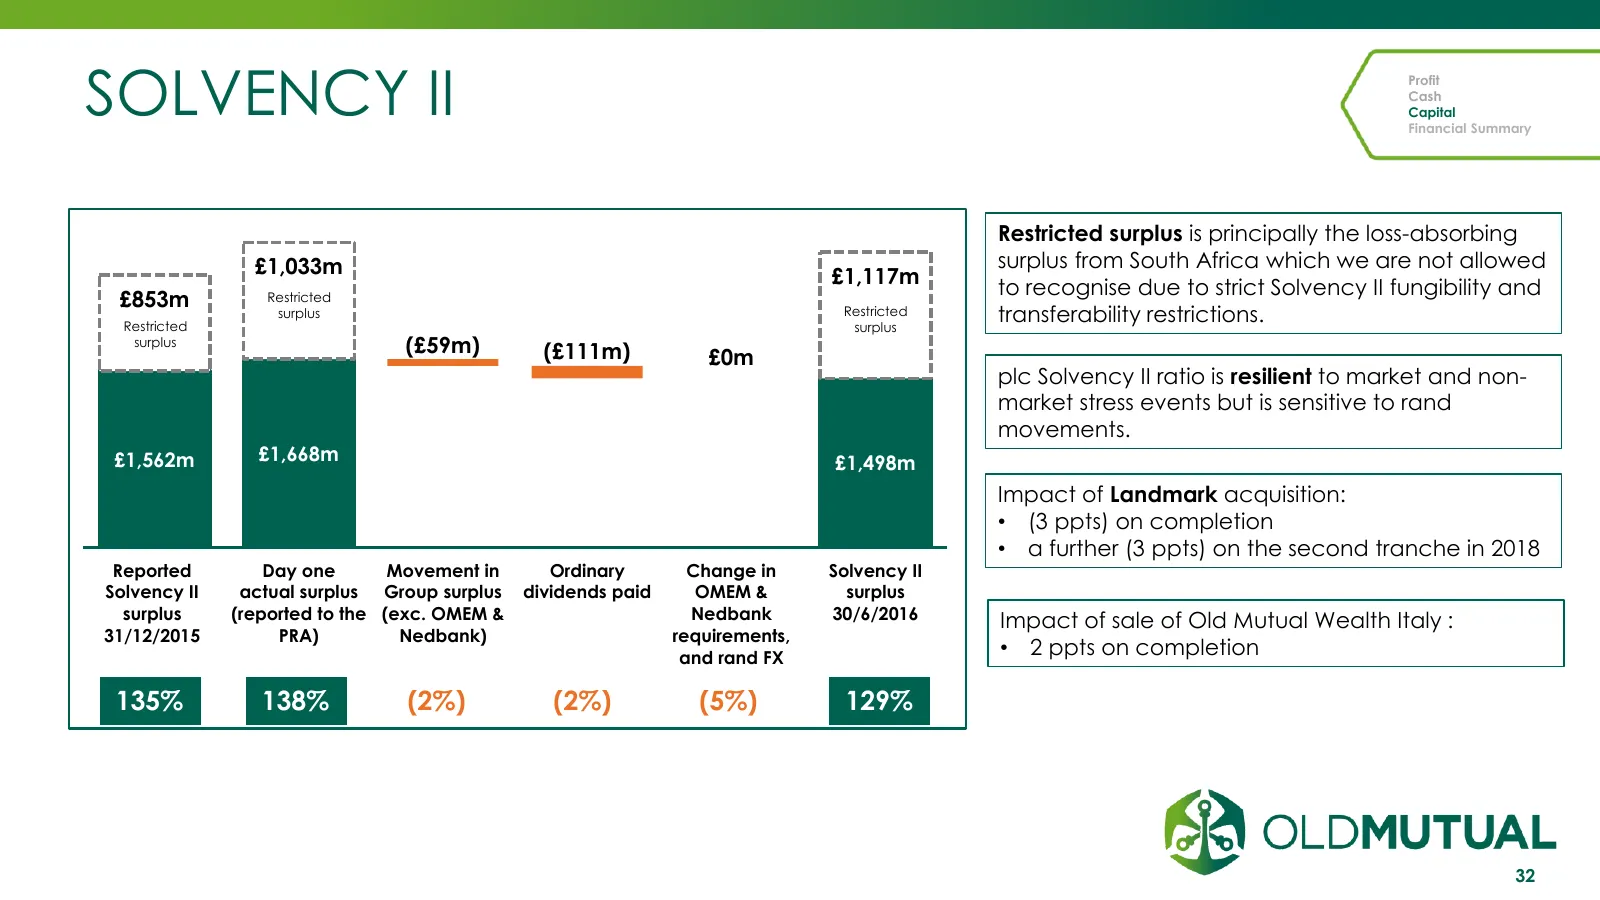
Slide 32: Solvency II
SOLVENCY II Profit Cash Capital Financial Summary Restricted surplus is principally the loss-absorbing £1,033m surplus from South Africa which we are not allowed £1,117m to recognise due to strict Solvency II fungibility and £853m Restricted Restricted surplus Restricted surplus transferability rest
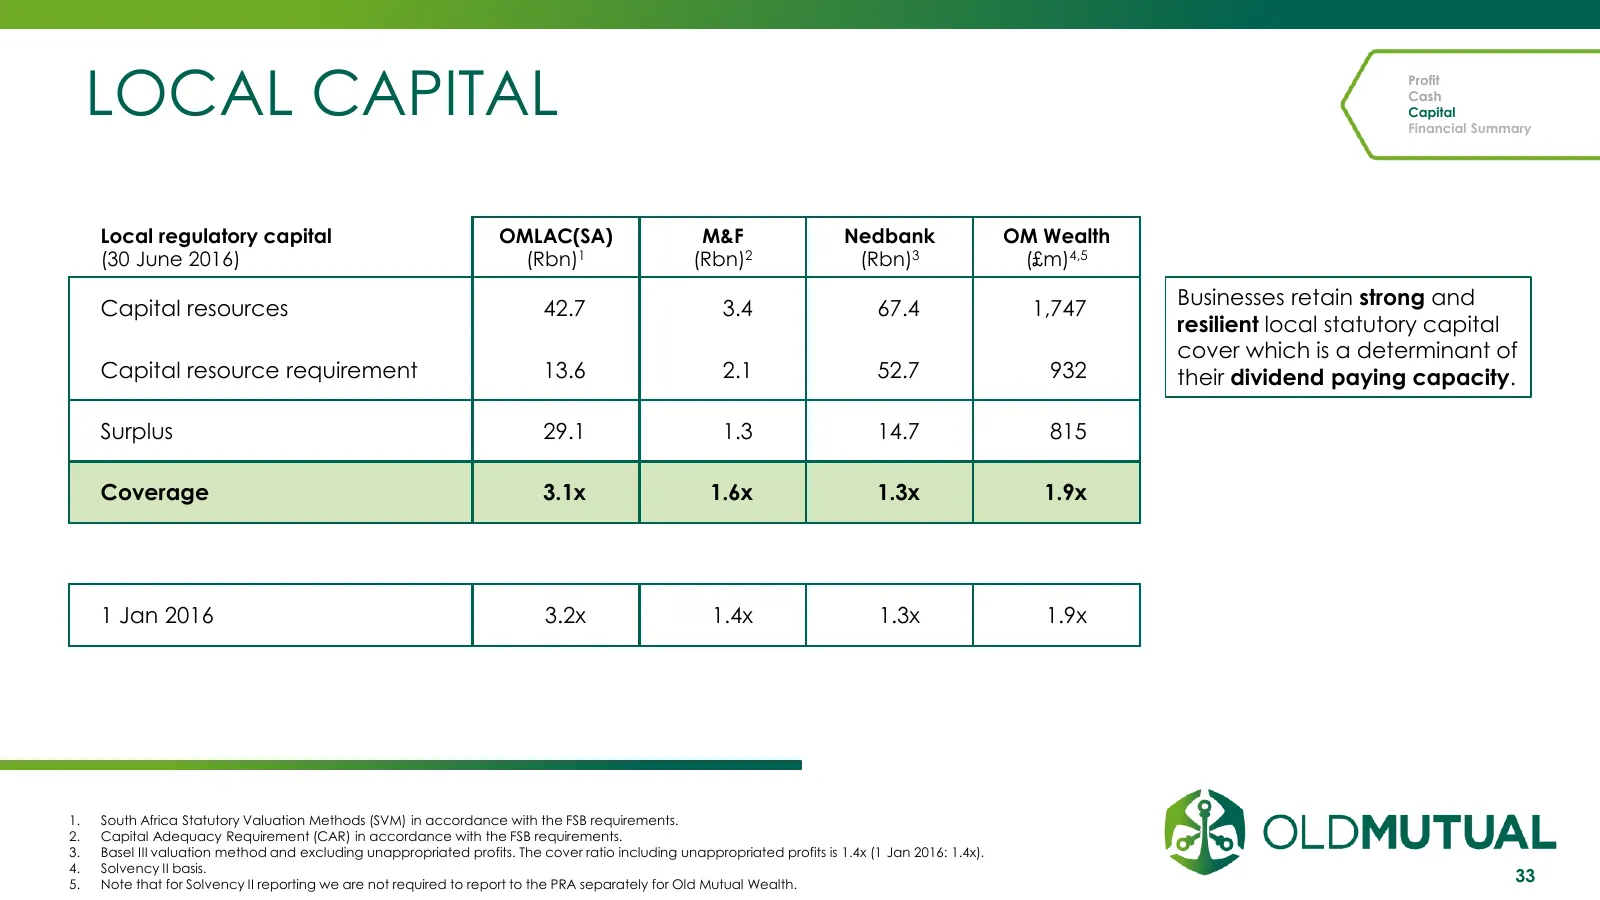
Slide 33: Local Capital
LOCAL CAPITAL Profit Cash Capital Financial Summary Local regulatory capital OMLAC(SA) M&F Nedbank OM Wealth (30 June 2016) (Rbn)1 (Rbn)2 (Rbn)3 (£m)4,5 Businesses retain strong and Capital resources 42.7 3.4 67.4 1,747 resilient local statutory capital cover which is a determinant of Capital resour
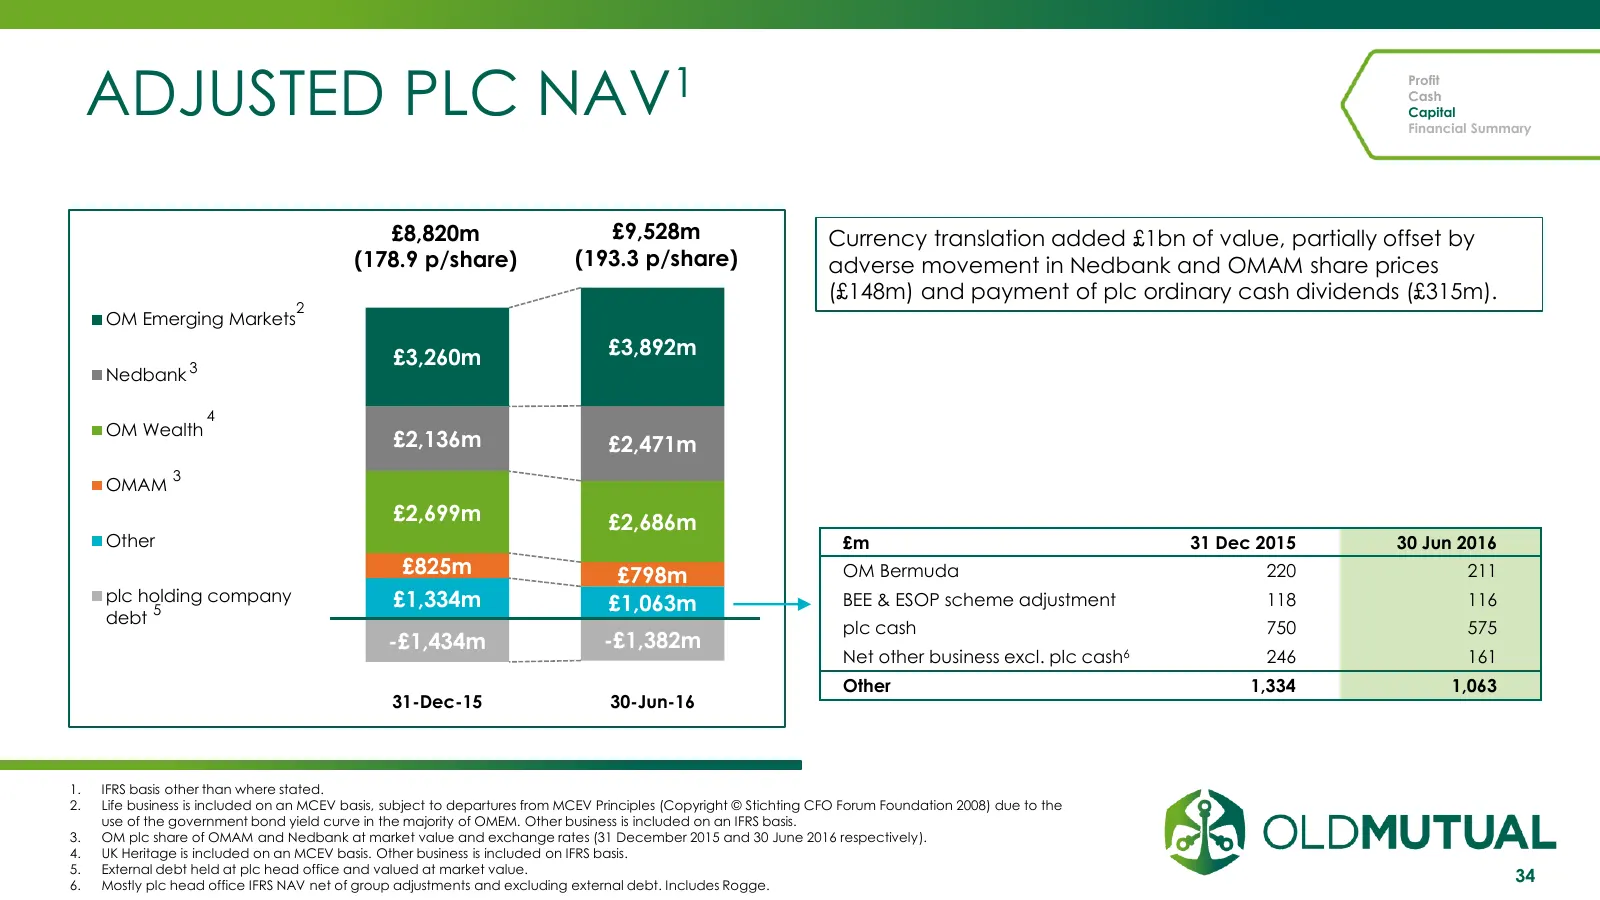
Slide 34: Adjusted PLC NAV
ADJUSTED PLC NAV1 Profit Cash Capital Financial Summary £8,820m £9,528m Currency translation added £1bn of value, partially offset by (178.9 p/share) (193.3 p/share) adverse movement in Nedbank and OMAM share prices (£148m) and payment of plc ordinary cash dividends (£315m). 2 OM Emerging Markets £3
Slide 35: Capital Management
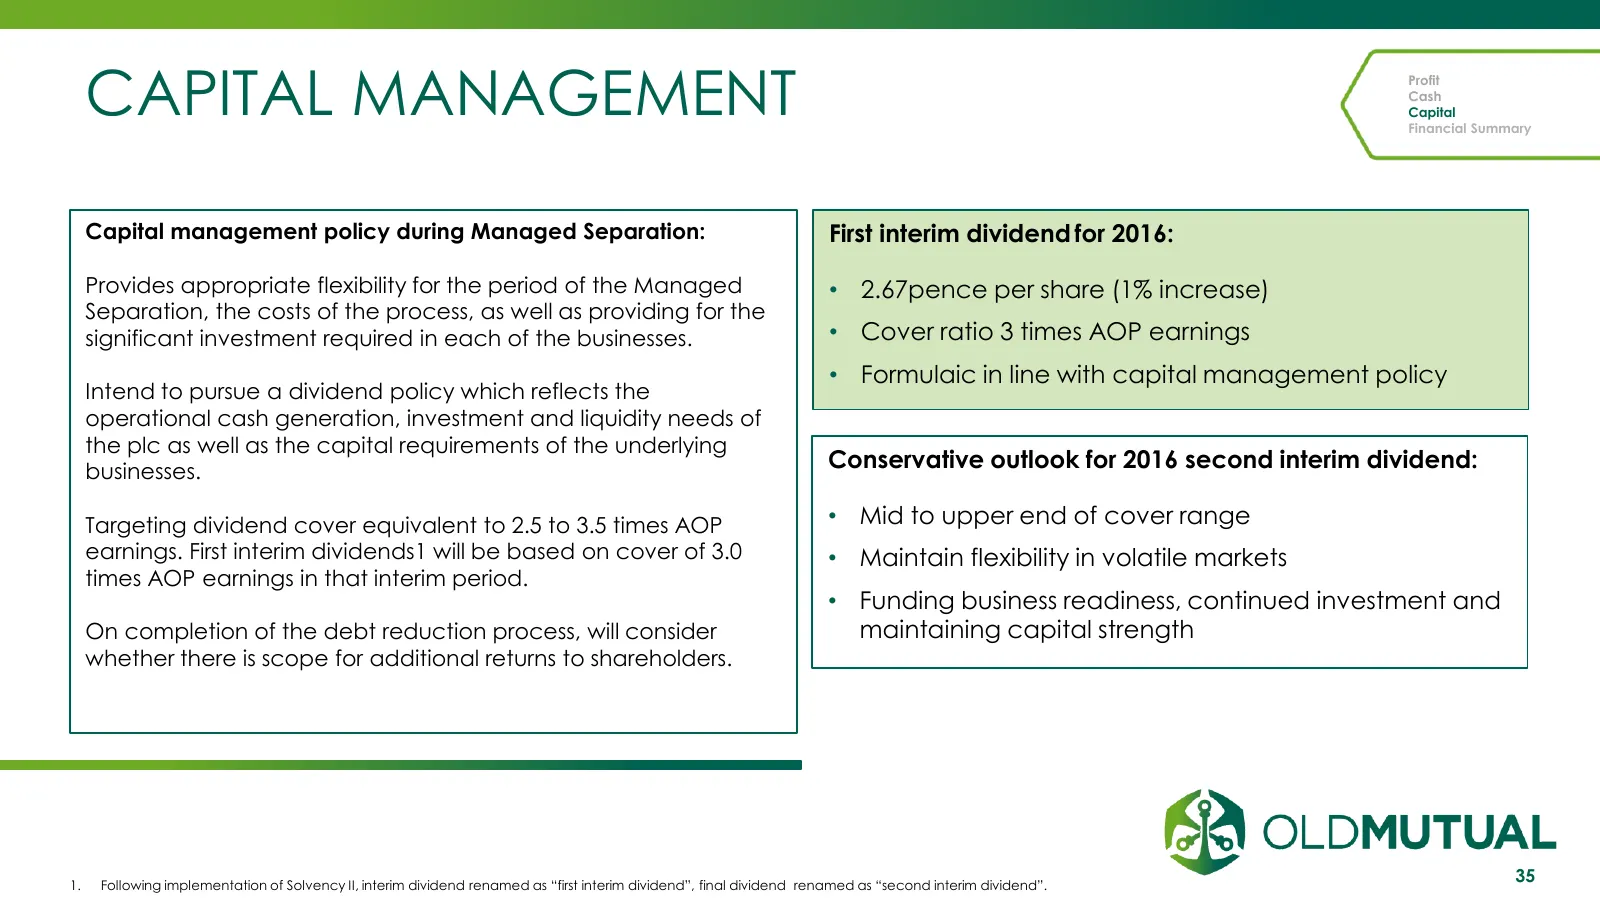
CAPITAL MANAGEMENT Profit Cash Capital Financial Summary Capital management policy during Managed Separation: First interim dividend for 2016: Provides appropriate flexibility for the period of the Managed • 2.67pence per share (1% increase) Separation, the costs of the process, as well as providing
Slide 36: Financial Summary
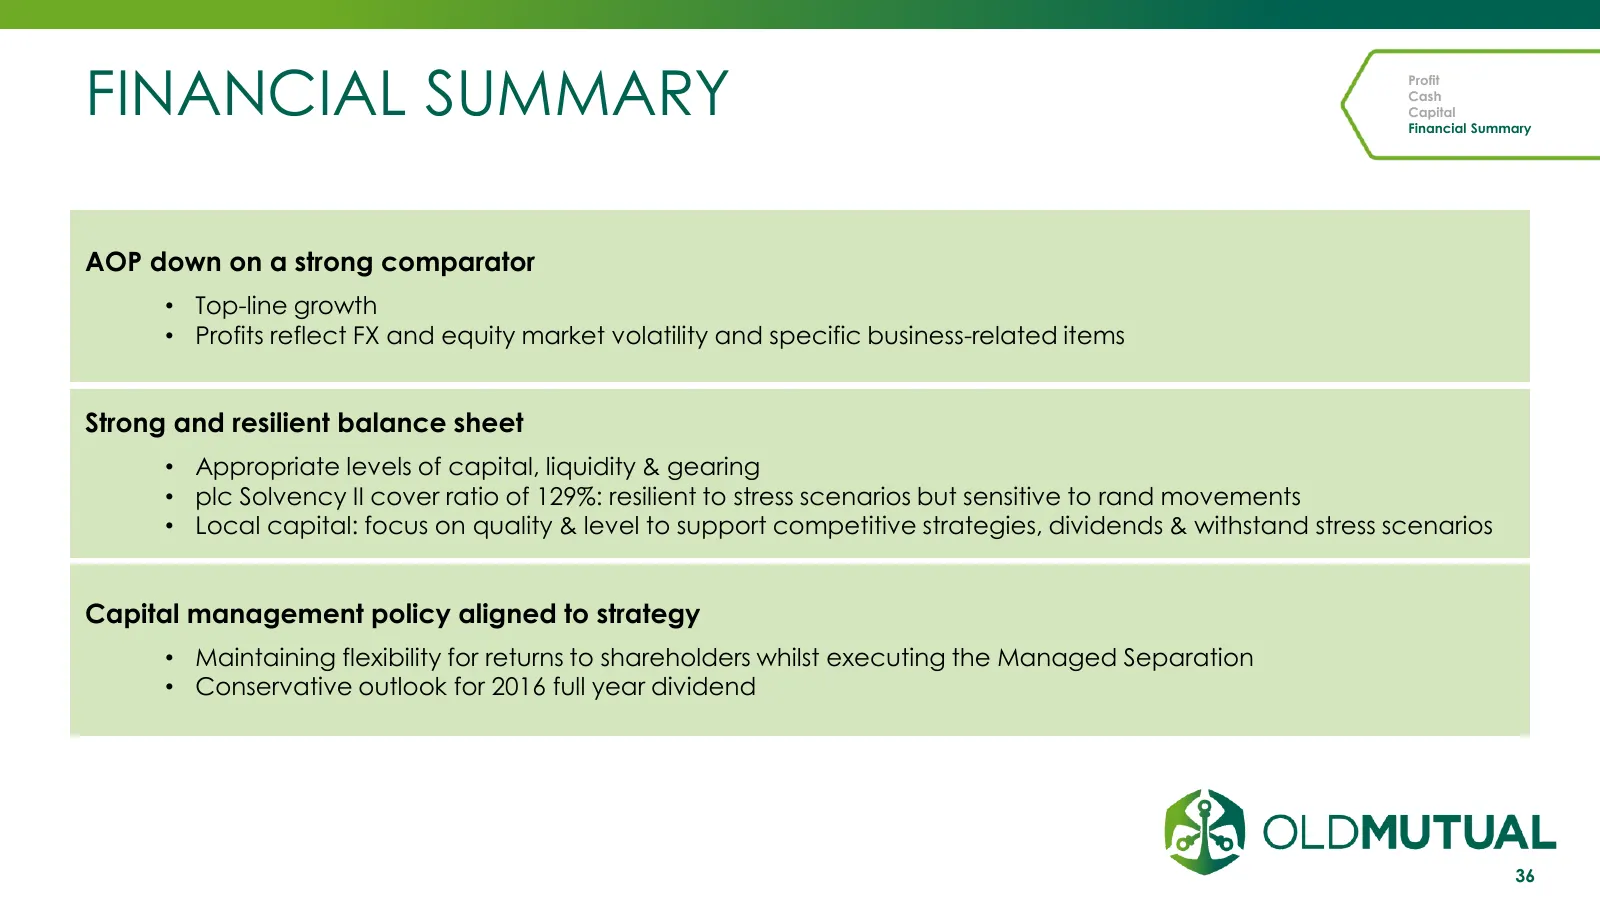
FINANCIAL SUMMARY Profit Cash Capital Financial Summary AOP down on a strong comparator • Top-line growth • Profits reflect FX and equity market volatility and specific business-related items Strong and resilient balance sheet • Appropriate levels of capital, liquidity & gearing • plc Solvency II co

Slide 37: Summary & Outlook
SUMMARY & OUTLOOK 11 August 2016 INVESTMENT | SAVINGS | INSURANCE | BANKING
Slide 38: Summary & Outlook
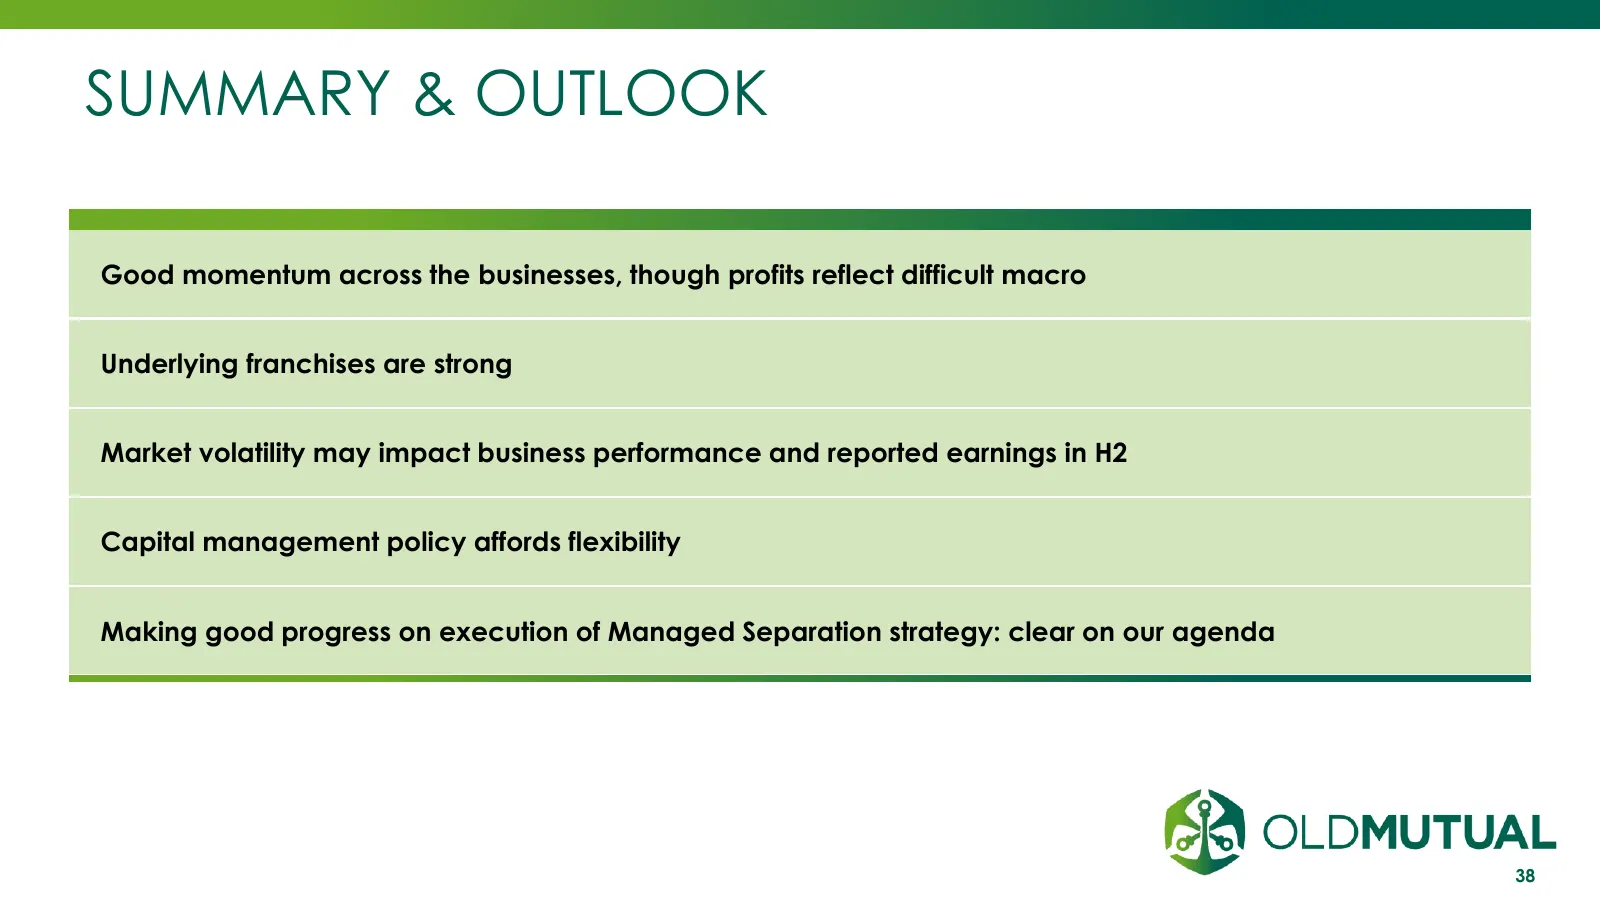
SUMMARY & OUTLOOK Good momentum across the businesses, though profits reflect difficult macro Underlying franchises are strong Market volatility may impact business performance and reported earnings in H2 Capital management policy affords flexibility Making good progress on execution of Managed Sepa
Slide 39: Q&A
Q&A 11 August 2016 INVESTMENT | SAVINGS | INSURANCE | BANKING
Slide 40: Interim Results 2016
INTERIM RESULTS 2016 11 August 2016 INVESTMENT | SAVINGS | INSURANCE | BANKING
Source: Internet Archive copy of oldmutual.com
More decks from Old Mutual Ltd.
 FY2025 Earnings Presentation46 slides · Oct 12, 2026
 Q2 2026 Earnings Presentation48 slides · Sep 8, 2026
 H1 2025 Earnings Presentation45 slides · Sep 10, 2025
 FY2024 Earnings Presentation40 slides · Mar 18, 2025
 FY2023 Earnings Presentation39 slides · Mar 27, 2024
 H1 2024 Earnings Presentation33 slides · 2024