Strategic Hotels and Resorts Inc
Strategic Hotels and Resorts — Investor Presentation (June 2012)
35 slides from Strategic Hotels and Resorts's investor presentation, Jun 4, 2012

Slide 1: Investor Presentation June 2012
Exhibit 99.1 Investor Presentation June 2012

Slide 2: BEE's Unique Value Proposition
1 I. BEE’s Unique Value Proposition II. Company Overview III. Industry Update IV. Operating Trends V. Financial Overview BEE’s Unique Value Proposition
Slide 3: The only pure play high-end lodging REIT
2 o The only pure play high-end lodging REIT o High-end outperforms the industry in a recovery o Industry leading asset management expertise o Assets are in pristine condition o Embedded organic growth through revenue growth and ROI opportunities o Historically low supply growth environment, particu
Slide 4: Proven Investment Track Record, Industry Leading Asset Management, Unique Portfolio
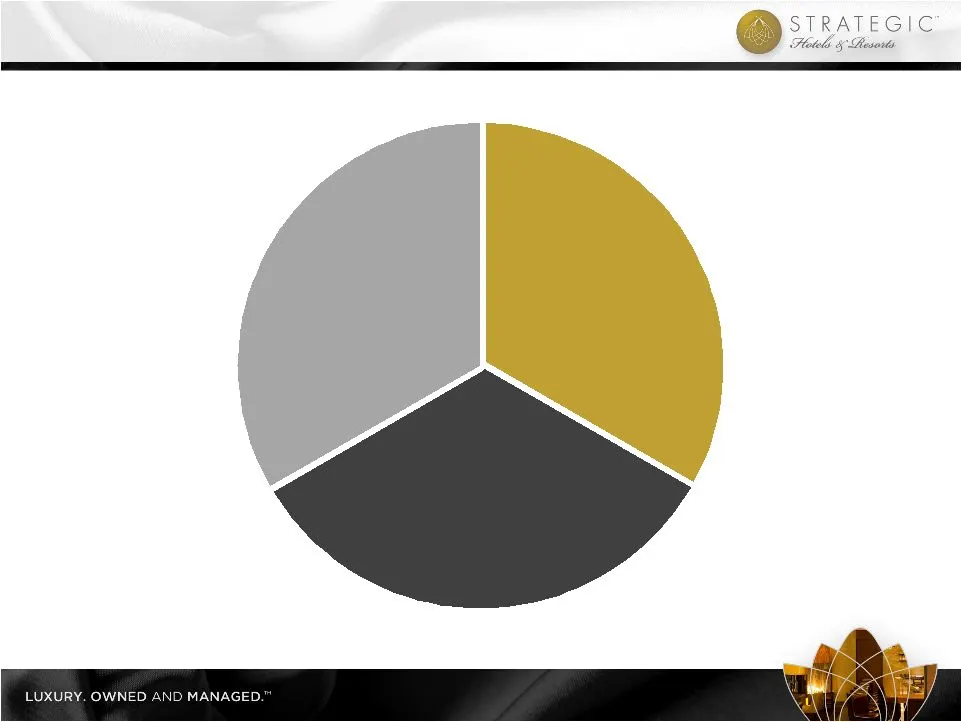
Proven Investment Track Record Industry Leading Asset Management High-end, Unique & Irreplaceable Hotel & Resort Portfolio 3 BEE’s Unique Value Proposition
Slide 5: High-end, Unique & Irreplaceable Hotel & Resort Portfolio
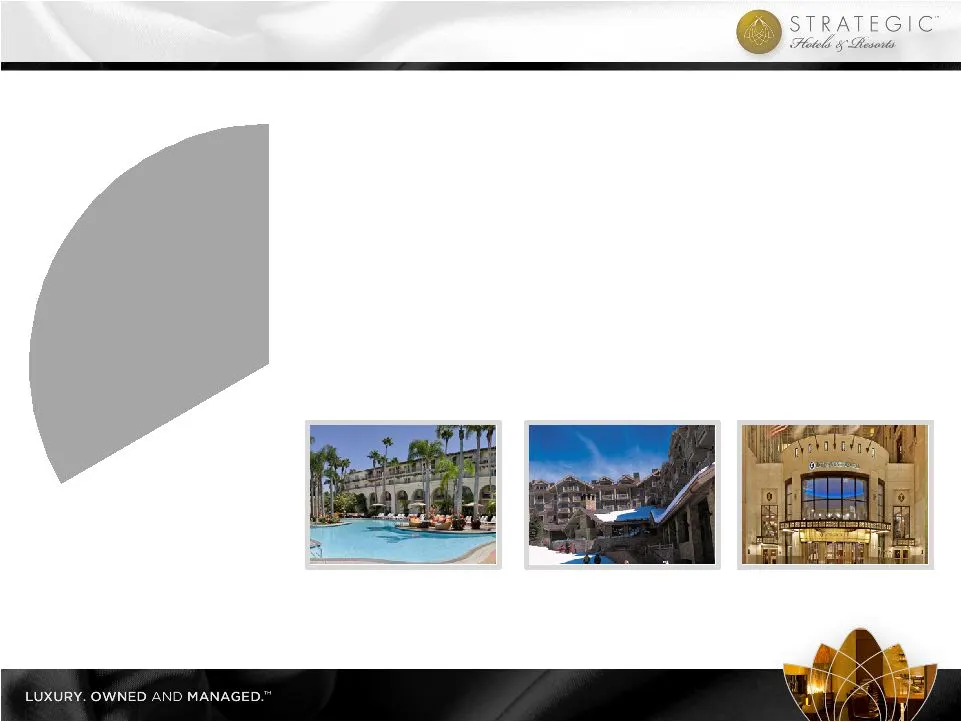
Industry As High-end, Unique & Irreplaceable Hotel & Resort Portfolio 4 Highlights o Best portfolio in public markets o Locations in high-barrier-to-entry markets o City-center and resort destinations o World-class amenities o No new supply in BEE’s markets Four Seasons Jackson Hole Ritz-Carlton Lag
Slide 6: Proven Investment Track Record
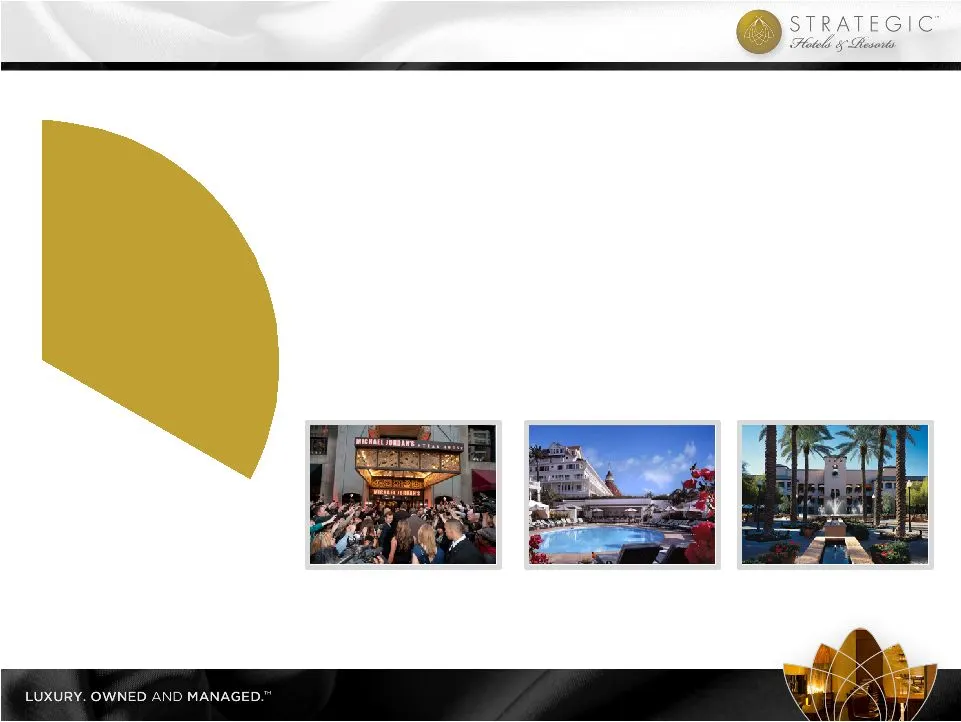
Proven Investment Track Record 5 Highlights o Execution of complex and accretive restructurings o Assessment and development of ROI projects o Recent success in acquiring hotels through off-market transactions o Maximized proceeds through well-timed asset sales Hotel del Coronado Michael Jordan’s St
Slide 7: Industry Leading Asset Management
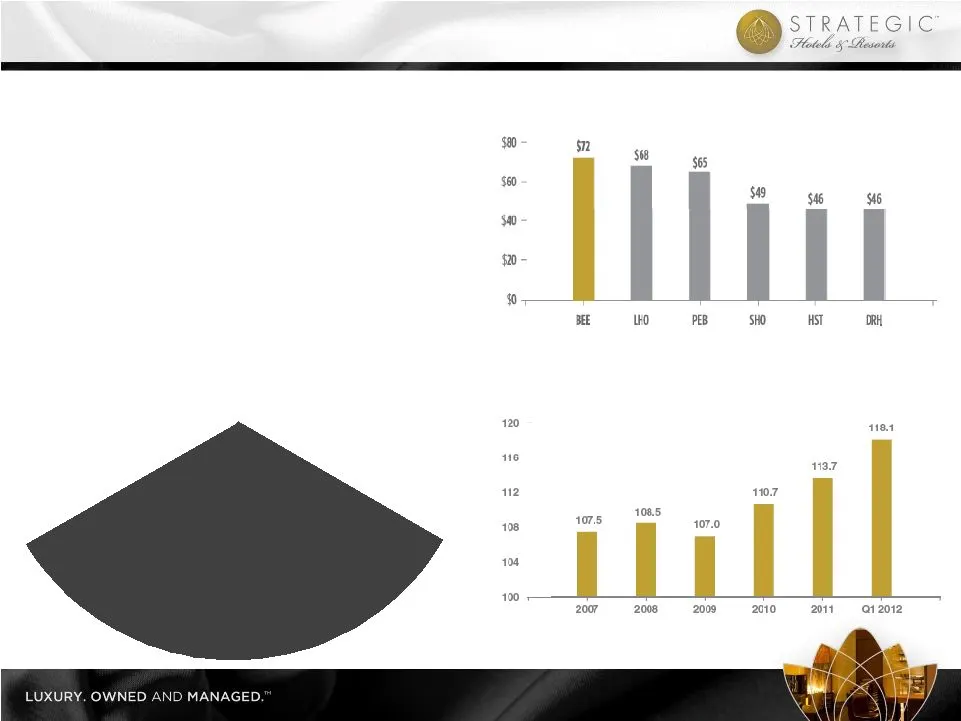
Industry Leading Asset Management 6 Highlights o Highest EBITDA per room in competitive set o Sustained market share penetration and revenue growth o Implemented cost cutting initiatives in advance of recession o Maintaining fixed cost reductions in recovery o Strong relationships with and rigorous

Slide 8: Company Overview
7 I. BEE’s Unique Value Proposition II. Company Overview III. Industry Update IV. Operating Trends V. Financial Overview Company Overview
Slide 9: Top-Tier Market Exposure
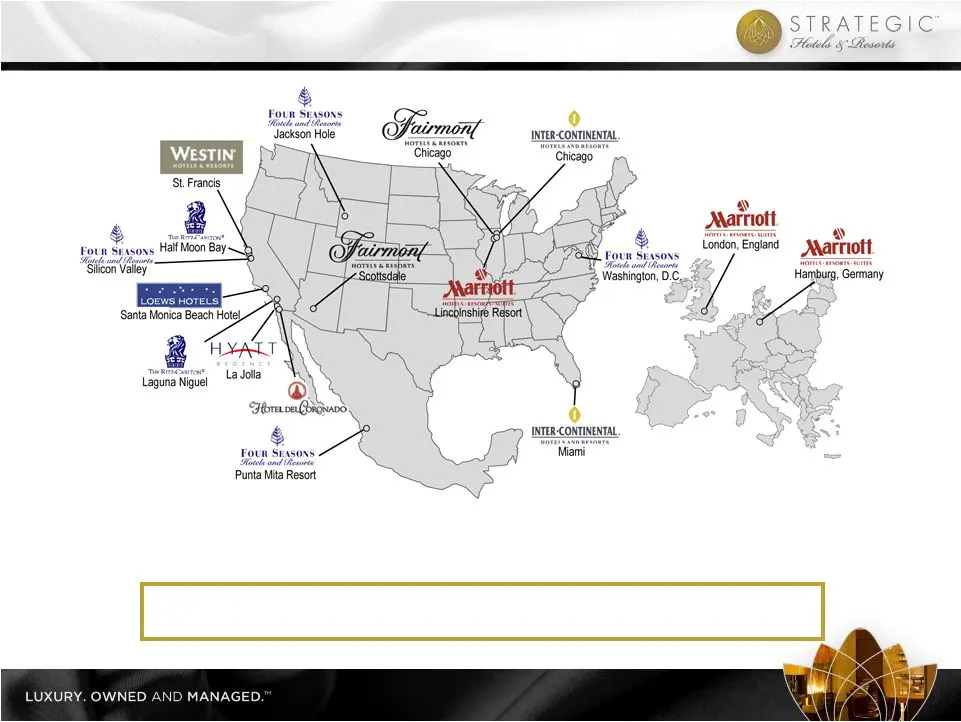
8 Top-Tier Market Exposure hotels located in primary gateway cities and high barrier to entry markets; including 7,762 rooms and 840,000 square feet of meeting space
Slide 10: Notable capital projects 2008-2011
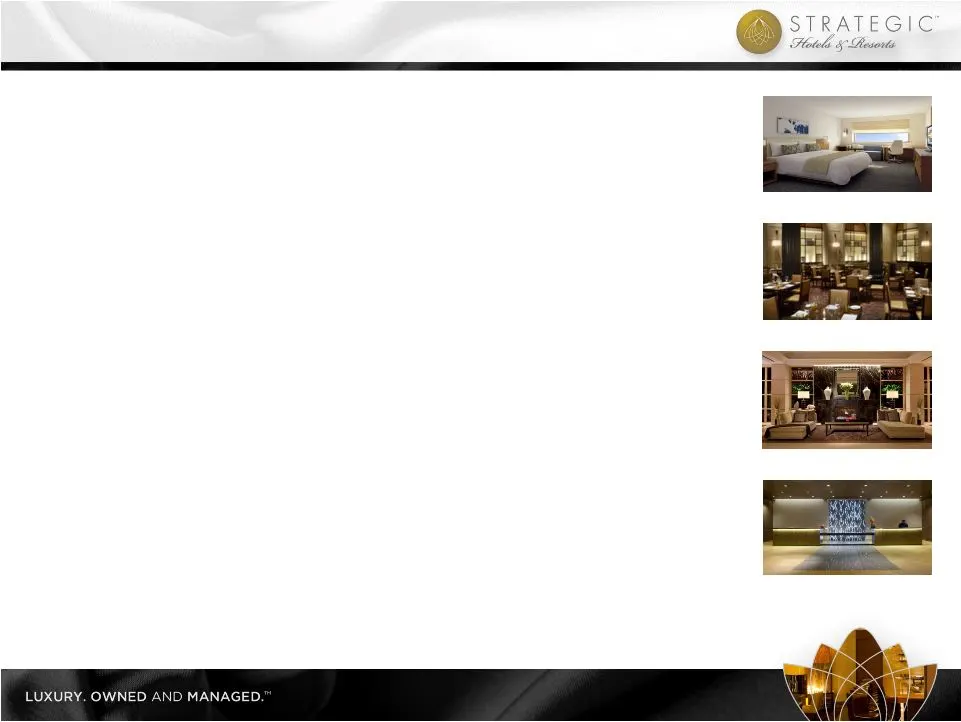
9 o InterContinental Miami – Guestroom renovation o InterContinental Chicago – Michael Jordan’s Steak House o Four Seasons Washington, D.C. – Retail outlet renovation o Marriott Lincolnshire Resort – Lobby renovation o Westin St. Francis – Michael Mina Steakhouse conversion o Four Seasons Washington
Slide 11: Potential Capital Projects in the Pipeline
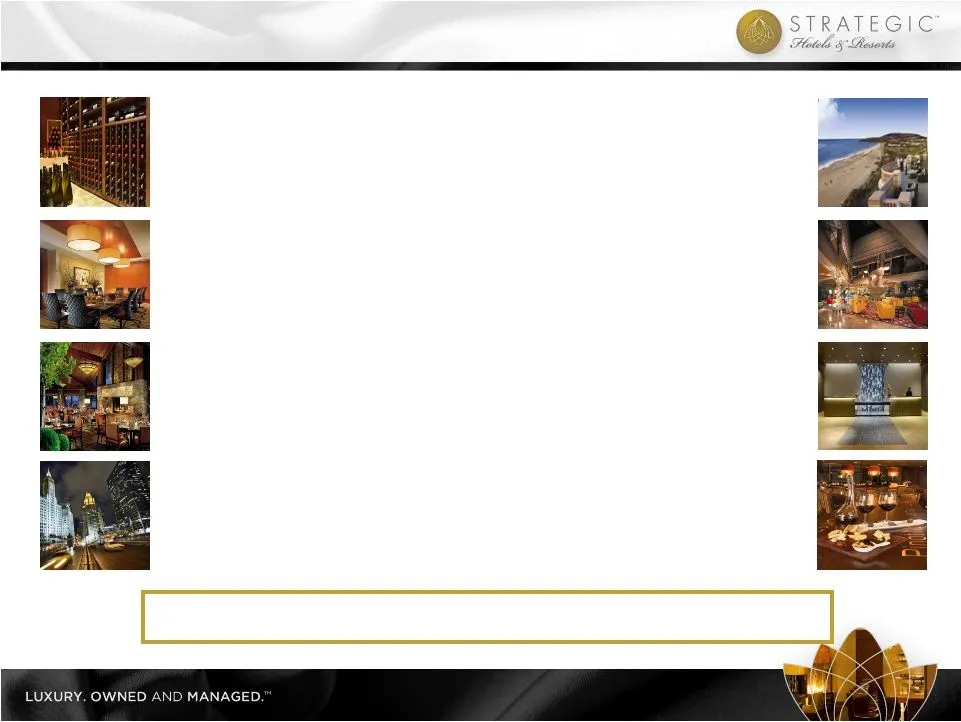
10 Four Seasons Washington, D.C. o ENO Wine Room o Retail space optimization Four Seasons Silicon Valley o Qauttro patio renovation o Meeting room renovation Four Seasons Jackson Hole o Restaurant re-concept InterContinental Chicago o North tower guestroom renovation o Meeting space expansion o Mich

Slide 12: Industry Update
11 I. BEE’s Unique Value Proposition II. Company Overview III. Industry Update IV. Operating Trends V. Financial Overview Industry Update
Slide 13: Lodging Outlook
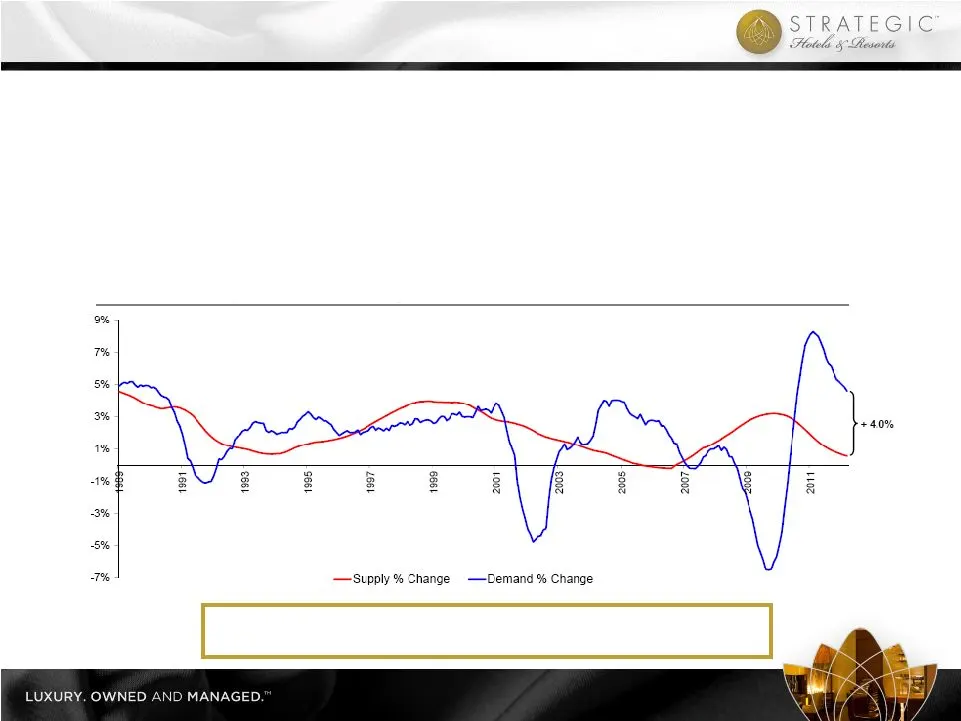
12 o Lodging demand historically correlates with GDP (~80%) but potential exists for near-term disconnect, particularly at the high-end o Customer demographics for luxury / high-end very strong – corporate America and college educated consumers o Supply growth remains historically low and developmen
Slide 14: Favorable Supply Outlook
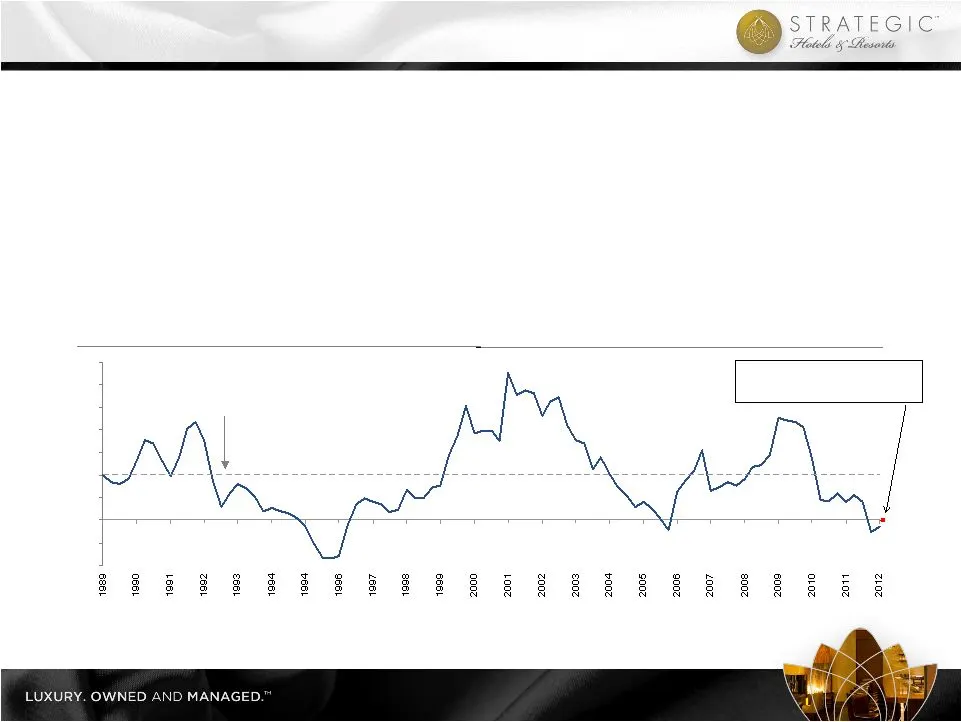
13 Source: Smith Travel Research Note: Data represents trends within the United States o Luxury supply growth was historically lower leading into the recent recession o Projects in planning or under construction have decreased significantly o No new competitive luxury or upper-upscale supply project
Slide 15: Luxury Hotels Outperform in a Recovery
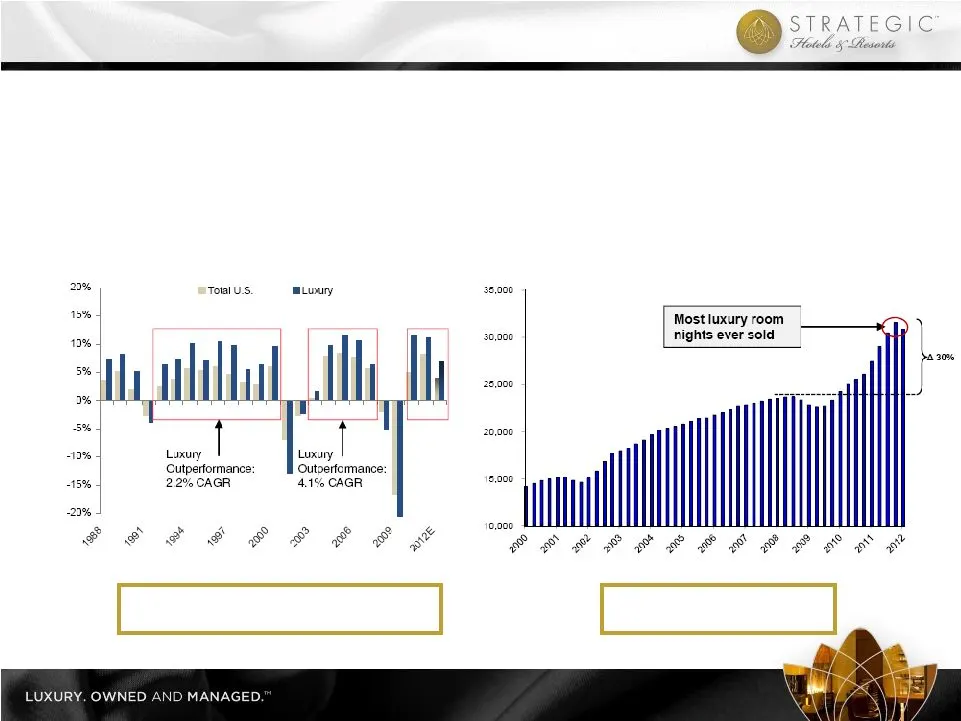
14 14 Source: Smith Travel Research and PWC Source: Smith Travel Research Annual % Change in RevPAR Quarterly Luxury Room Night Demand (000s) o Luxury hotels have experienced prolonged RevPAR growth following past industry downturns o 1992 – 2000: consecutive years of annual luxury RevPAR growth tot
Slide 16: BEE Outperforms Competitors
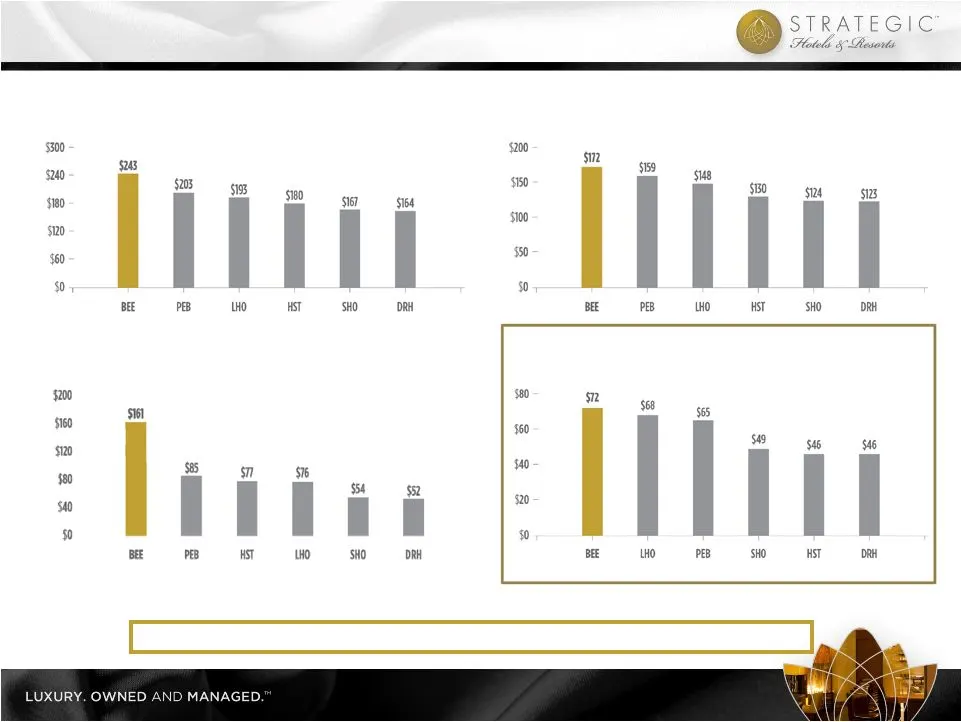
15 ADR RevPAR EBITDA Per Available Room Non – Rooms Revenue Per Available Room Note: All metrics represent full-year 2011 results BEE portfolio reflects Total United States portfolio as of 12/31/2011 Source: Public filings BEE delivers industry leading results BEE Outperforms Competitors
Slide 17: STRATEG
STRATEG Hoteles i Resorts dD? LUXURY. OWNED AND MANAGED.
Slide 18: BEE Revenue Mix Compared to Peers
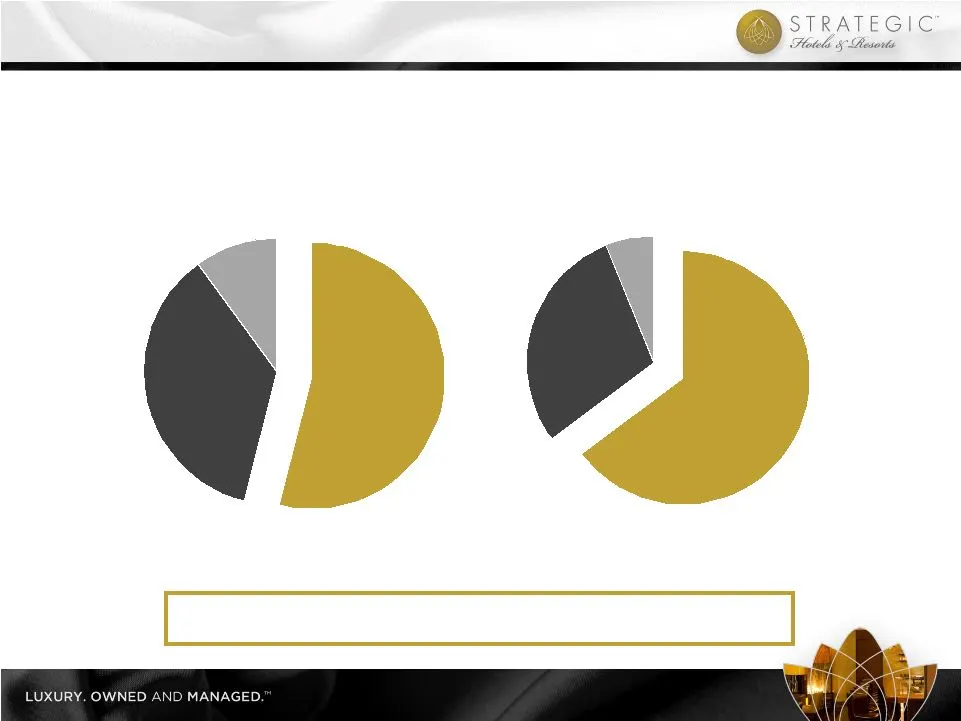
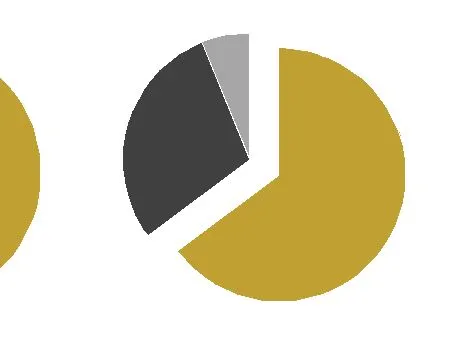
54% 36% 10% Rooms Other Food & Beverage 65% 29% 6% Rooms Other Food & Beverage 16 o Total RevPAR is key top-line performance metric o Focus on maximizing RevPAR, non-rooms revenue, and yield per square foot BEE Total Revenue Mix Peers Total Revenue Mix Note: All metrics represent the full-year 2011.
Slide 19: BEE Revenue Mix
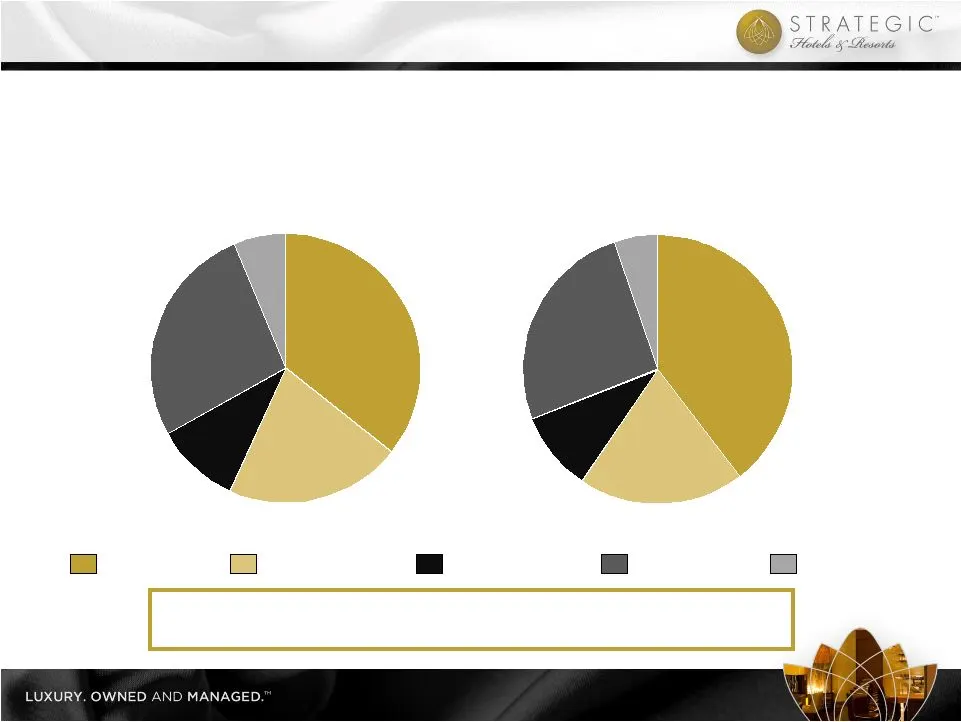
36% 21% 10% 27% 6% 40% 20% 9% 26% 5% 17 17 Note: Statistics represent the full year 2011. Portfolio reflects the North America Same Store portfolio BEE Occupied Room Nights Mix BEE Room Revenue Mix o Targeted mix of business ~50% / 50% group / transient o Group business typically yields higher non-r
Slide 20: Hotel 5; Ras
Hotel 5; Ras LUXURY. OWNED AND MANAGED.

Slide 21: Operating Trends
19 I. BEE’s Unique Value Proposition II. Company Overview III. Industry Update IV. Operating Trends V. Financial Overview Operating Trends
Slide 22: Group Booking Outlook
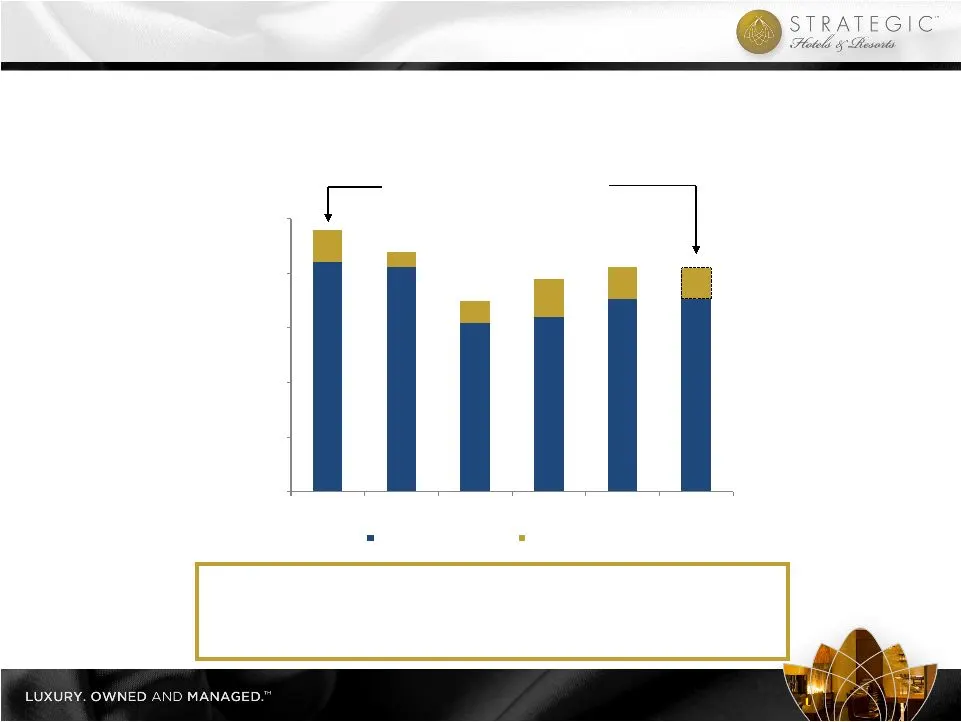
20 o Group pace remains the most reliable forward looking indicator o Booking window has shortened forcing more reliance on room nights booked ITYFTY (“in-the-year-for-the-year”) Year-Over-Year Group Pace Assuming similar production as 2011, group room nights 14% below peak *2012 production in the y
Slide 23: Embedded Portfolio Growth
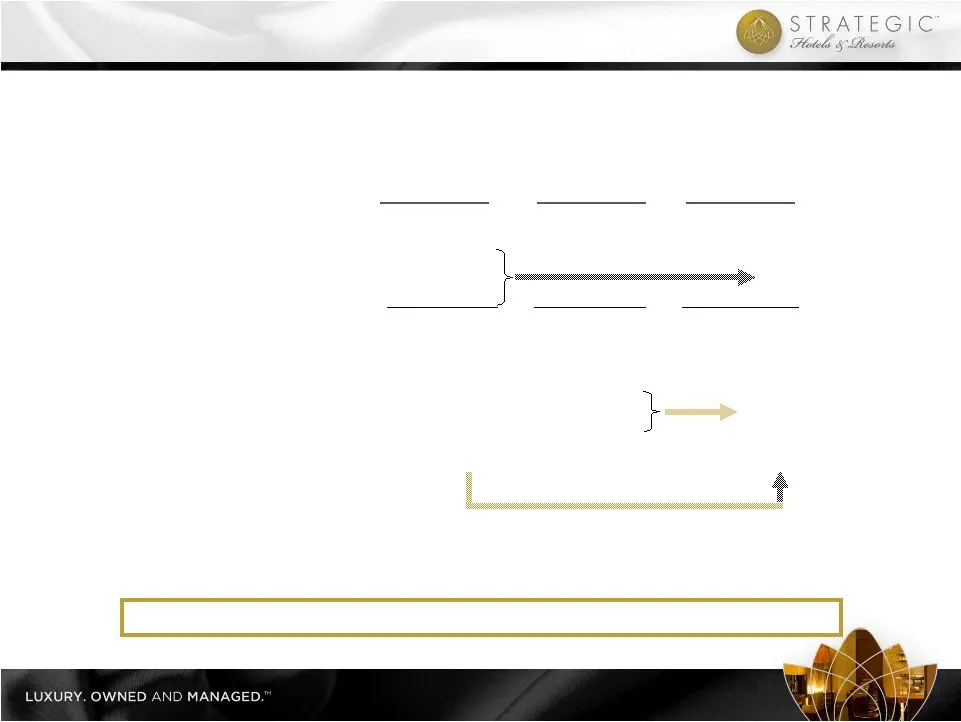
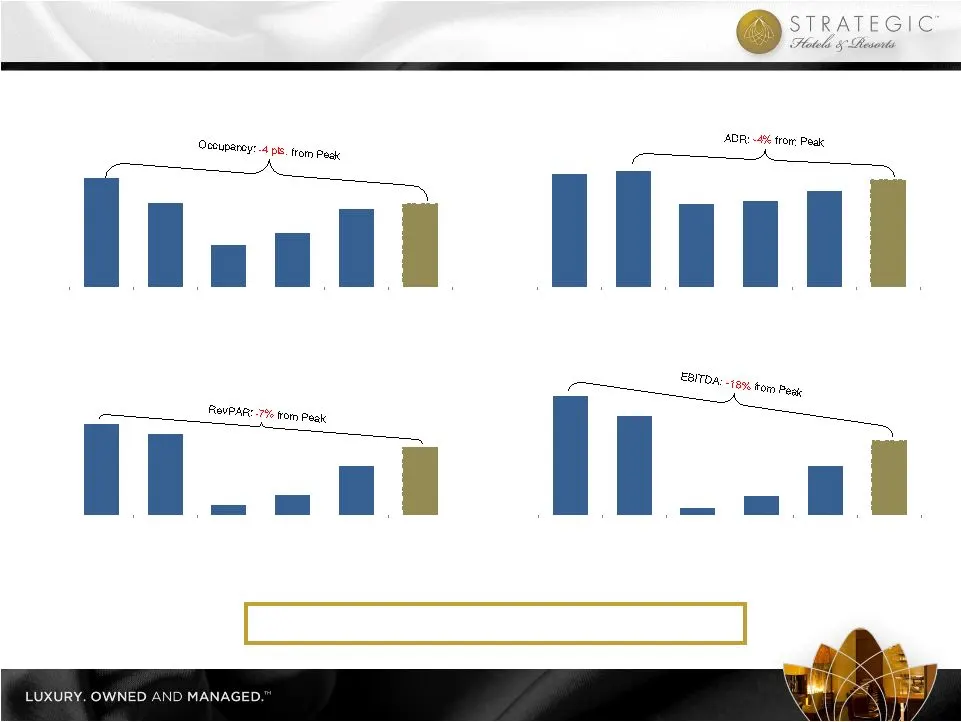
21 $100 $120 $140 $160 $180 $200 2007 2008 2009 2010 2011 2012F $140 $160 $180 $200 $220 2007 2008 2009 2010 2011 2012F $120 $160 $200 $240 $280 2007 2008 2009 2010 2011 2012F 60% 64% 68% 72% 76% 80% 2007 2008 2009 2010 2011 2012F Occupancy ADR RevPAR Property EBITDA (in millions) Note: Same store N

Slide 24: Financial Overview
22 I. BEE’s Unique Value Proposition II. Company Overview III. Industry Update IV. Operating Trends V. Financial Overview Financial Overview
Slide 25: Recapitalization achievements: equity raised, asset sales, debt repayments
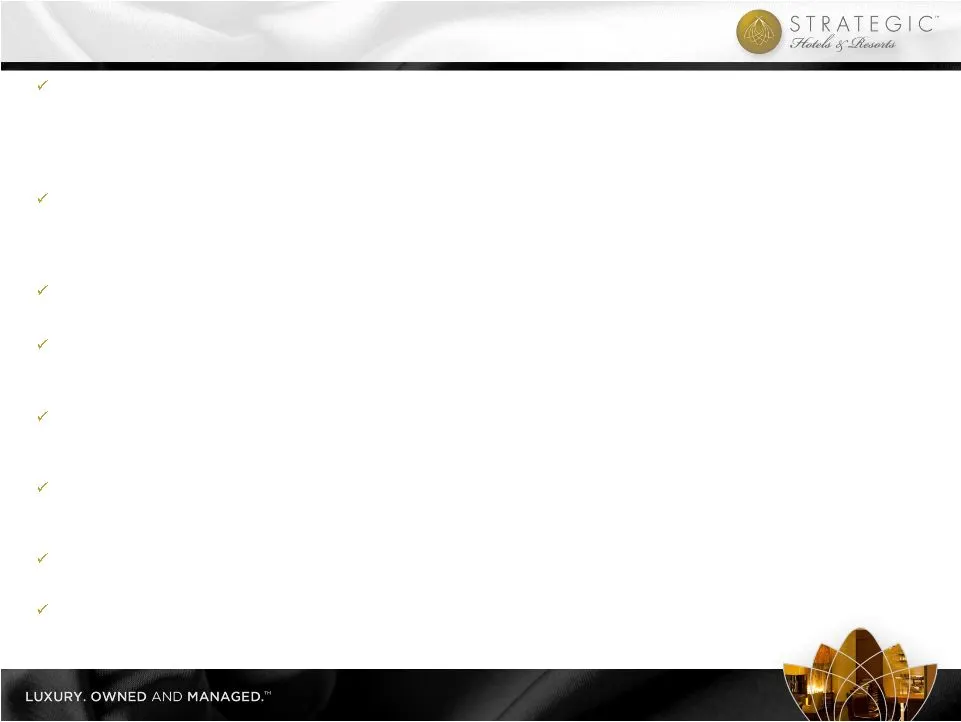
23 Raised $665 million in equity: o $335 mm secondary offering (May 2010) o $145 mm Woodbridge transaction acquiring two Four Seasons hotels plus PIPE (February 2011) o $70 mm equity placement to GIC for share in InterContinental Chicago (June 2011) o $115 mm overnight equity offering (April 2012) A
Slide 26: Strong Recapitalized Balance Sheet
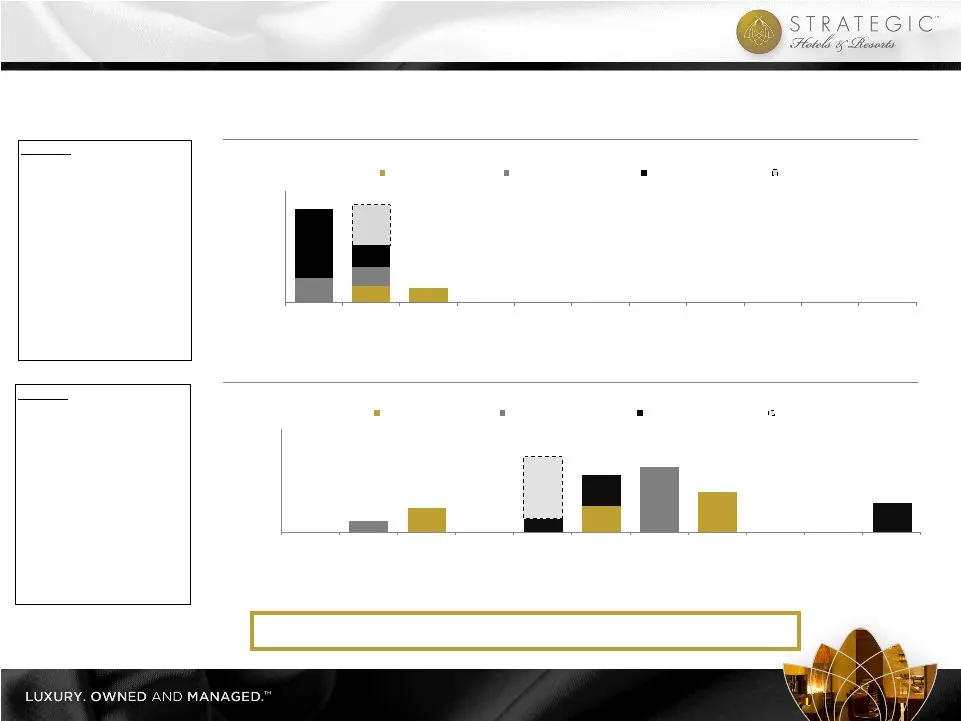
$115.5 $130.0 $195.0 $52.2 $315.7 $66.5 $145.8 $145.0 $148.9 $124.9 $220.0 $173.5 $614.5 $194.8 24 $0.0 $100.0 $200.0 $300.0 $400.0 $500.0 2011 2012 2013 2014 2015 2016 2017 2018 2019 2020 2021 Bank Life Co. CMBS Corporate $300.0 Capacity $275.8 $358.0 $0.0 $200.0 $400.0 $600.0 $800.0 $1,000.0 2011
Slide 27: TEGILe
TEGILe STR Hotela Resets LUXURY. OWNED AND MANAGED.”
Slide 28: TEGILe
TEGILe STR Hotela Resets LUXURY. OWNED AND MANAGED.”
Slide 29: The only pure play high-end lodging REIT
27 o The only pure play high-end lodging REIT o High-end outperforms the industry in a recovery o Industry leading asset management expertise o Assets are in pristine condition o Embedded organic growth through revenue growth and ROI opportunities o Historically low supply growth environment, partic
Slide 30: Disclaimer
28 Disclaimer Except for historical information, the matters discussed in this presentation are forward-looking statements subject to certain risks and uncertainties. Forward-looking statements relate to expectations, beliefs, projections, future plans and strategies, anticipated events or trends, a
Slide 31: Non-GAAP to GAAP Reconciliations
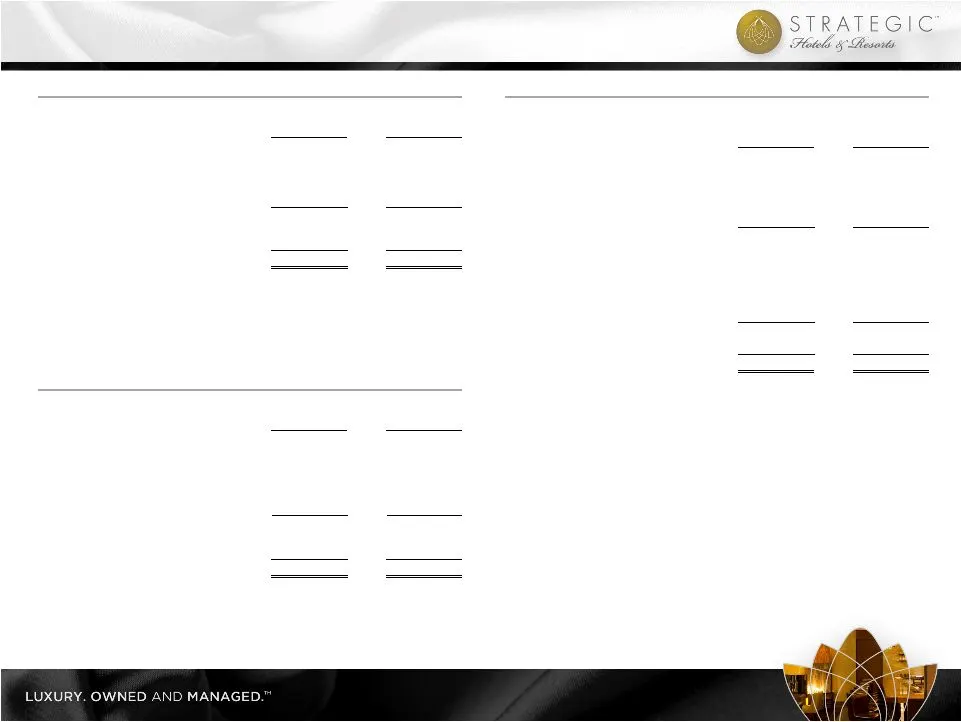
29 Non-GAAP to GAAP Reconciliations Reconciliation of Net Debt / EBITDA ($ in 000s) YE 2009 (a) 1Q 2012 (b)(c) Consolidated debt $1,658,745 $1,000,128 Pro rata share of unconsolidated debt 282,825 212,275 Pro rata share of consolidated debt (107,065) (45,548) Cash and cash equivalents (116,310) (113
Slide 32: Non-GAAP to GAAP Reconciliations
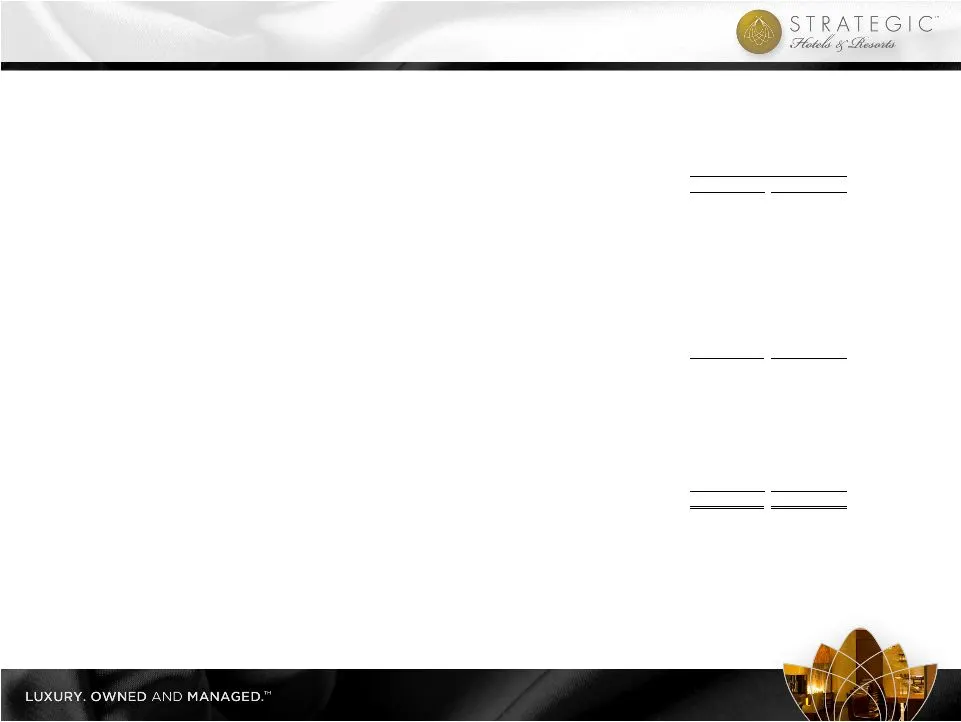
30 Non-GAAP to GAAP Reconciliations 2012 2011 Net loss attributable to SHR common shareholders (31,516) $ (35,407) $ Depreciation and amortization 25,490 30,605 Interest expense 19,605 19,548 Income taxes - continuing operations (1,648) Income taxes - discontinued operations - Noncontrolling interes
Slide 33: Non-GAAP to GAAP Reconciliations
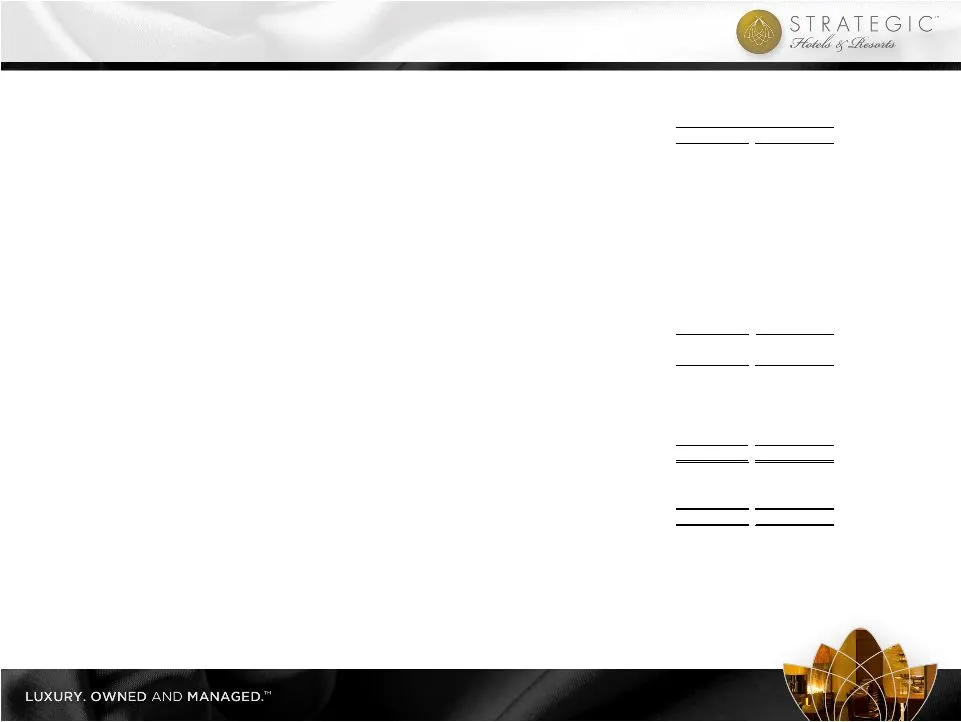
31 Non-GAAP to GAAP Reconciliations 2012 2011 Net loss attributable to SHR common shareholders (31,516) $ (35,407) $ Depreciation and amortization 25,490 30,605 Corporate depreciation (265) (299) Gain on sale of assets - continuing operations - (2,640) Gain on sale of assets - discontinued operation
Slide 34: Non-GAAP to GAAP Reconciliations
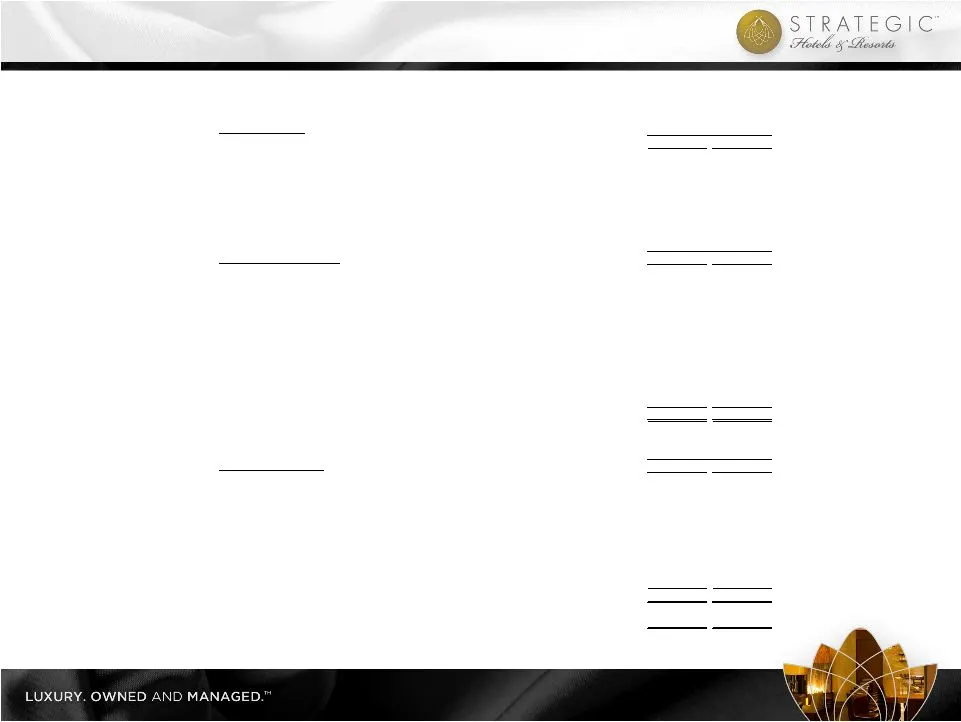
32 Non-GAAP to GAAP Reconciliations Operational Guidance Low Range High Range North American same store Total RevPAR growth (a) 5.0% 7.0% North American same store RevPAR growth (a) 6.0% 8.0% (a) Includes North American hotels which are consolidated in our financial results, but excludes the Four Se

Slide 35: Thank You
33 Thank You
Source: SEC EDGAR · 8-K filed Jun 4, 2012
More decks from Strategic Hotels and Resorts Inc
 Investor Presentation (June 2015)43 slides · Jun 1, 2015
 Investor Presentation (February 2015)43 slides · Feb 24, 2015
 Investor Presentation (January 2015)44 slides · Jan 26, 2015
 Investor Presentation (November 2014)50 slides · Nov 5, 2014
 Investor Presentation (October 2014)50 slides · Oct 3, 2014
 Investor Day (September 2014)67 slides · Sep 22, 2014