Gevity HR — Investor Presentation (February 2005)
30 slides from Gevity HR's investor presentation, Feb 22, 2005
Slide 1: Comprehensive insourced employee management solution
comprehensive insourced employee management solution management solution management solution February, 2005

Slide 2: Safe harbor
safe harbor Gevity HR, Inc. fully complies with Regulation Fair Disclosure guidelines. Naturally, whenever we make any forward-looking statement, there is always a degree of uncertainty and risk because actual results may differ materially from those we anticipate, project or expect. In this regard,
Slide 3: Company highlights
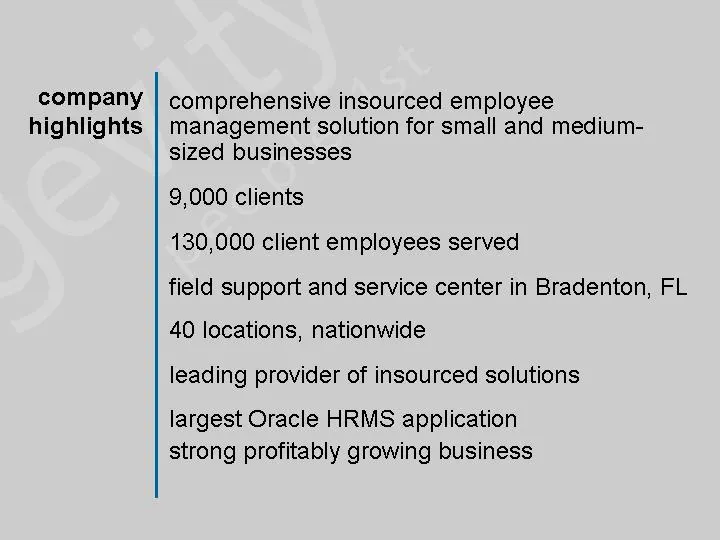
company highlights comprehensive insourced employee management solution for small and medium- sized businesses 9,000 clients 130,000 client employees served field support and service center in Bradenton, FL 40 locations, nationwide leading provider of insourced solutions largest Oracle HRMS applicat
Slide 4: Gevity's evolution
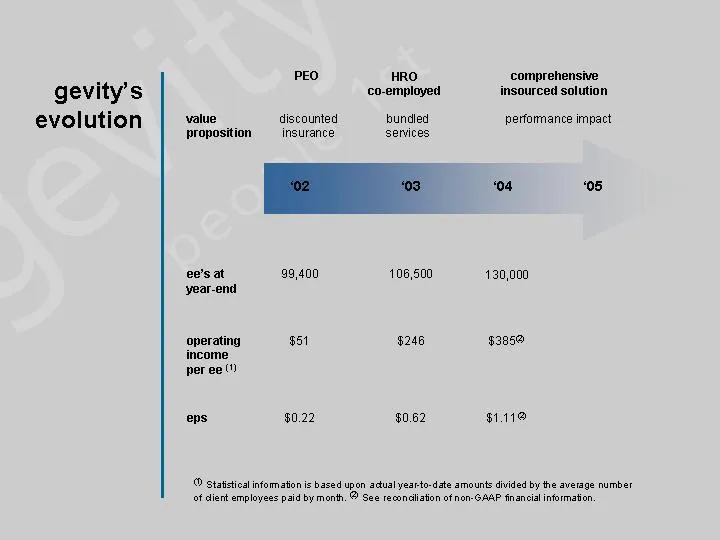
gevity's evolution PEO HRO co-employed comprehensive insourced solution discounted insurance bundled services performance impact '02 '03 '05 '04 value proposition ee's at year-end 99,400 106,500 130,000 operating income per ee (1) $51 $246 $385(2) eps $0.22 $0.62 $1.11(2) (1) Statistical information
Slide 5: Magnitude of potential market
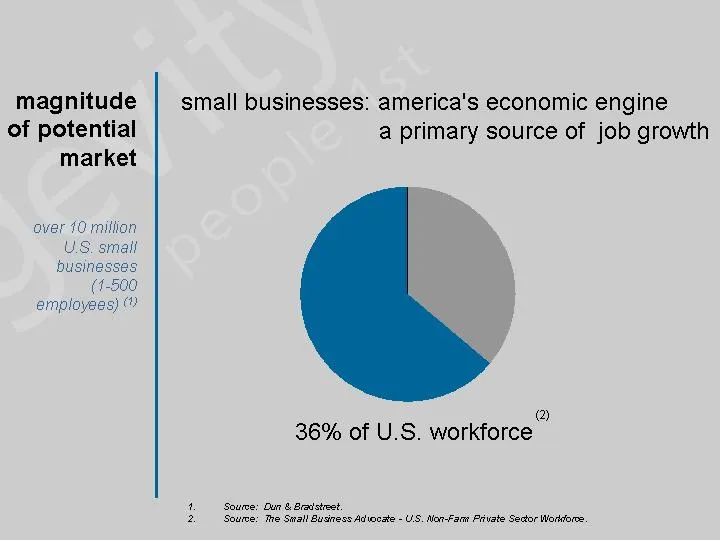
magnitude of potential market over 10 million U.S. small businesses (1-500 employees) (1) Source: Dun & Bradstreet. Source: The Small Business Advocate - U.S. Non-Farm Private Sector Workforce. small businesses: america's economic engine a primary source of job growth 36% of U.S. workforce penetrate
Slide 6: Attractive market opportunity
attractive market opportunity 36% of US workforce is underserved from HR perspective challenged by economic justification for HR function challenged by impact of HR practices on performance challenged by stepped demands imposed by HR infrastructure small business segment: the engine's challenges
Slide 7: Business impact
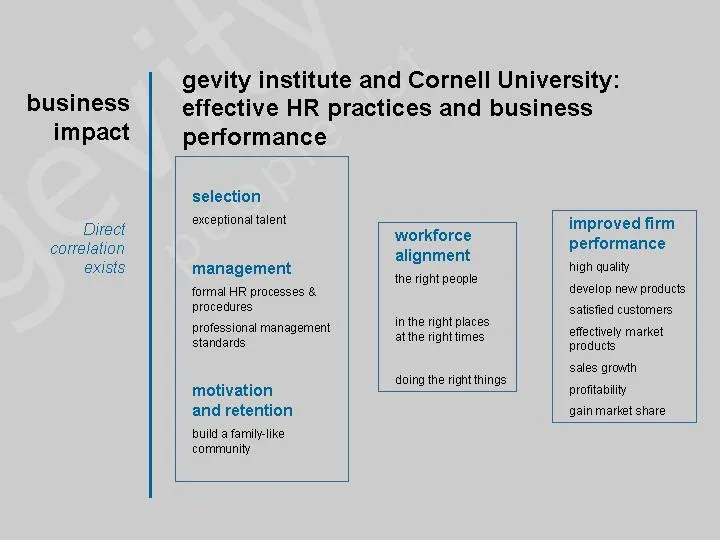
business impact gevity institute and Cornell University: effective HR practices and business performance selection exceptional talent management formal HR processes & procedures professional management standards motivation and retention build a family-like community workforce alignment the right peo
Slide 8: Gevity's end-to-end solution
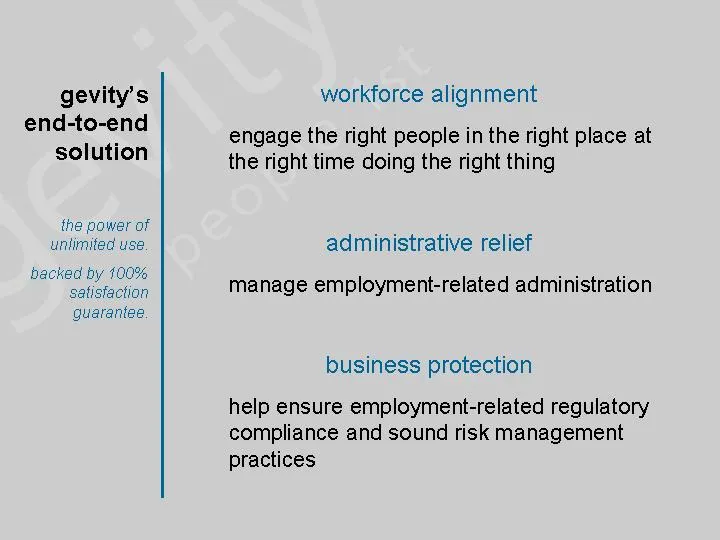
gevity's end-to-end solution workforce alignment engage the right people in the right place at the right time doing the right thing administrative relief manage employment-related administration business protection help ensure employment-related regulatory compliance and sound risk management practi
Slide 9: Workforce alignment
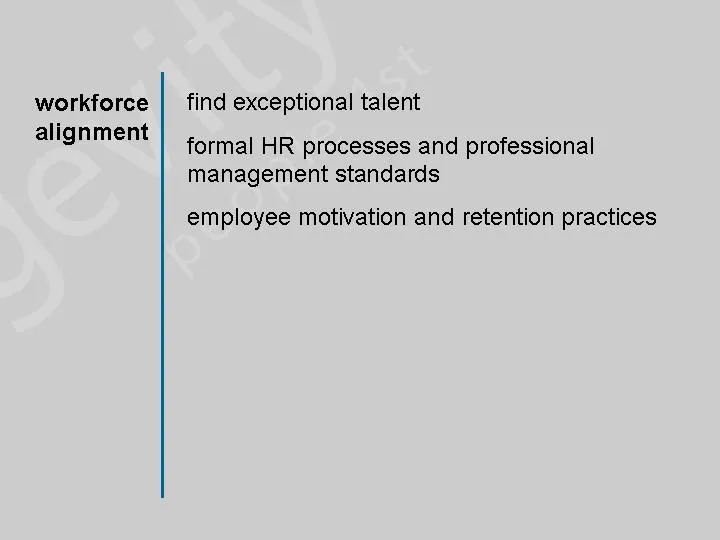
workforce alignment find exceptional talent formal HR processes and professional management standards employee motivation and retention practices
Slide 10: Administrative relief
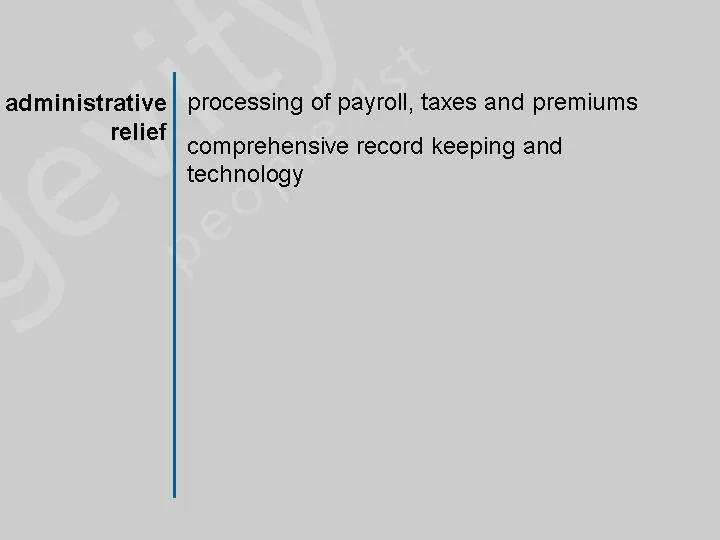
administrative relief processing of payroll, taxes and premiums comprehensive record keeping and technology
Slide 11: Business protection
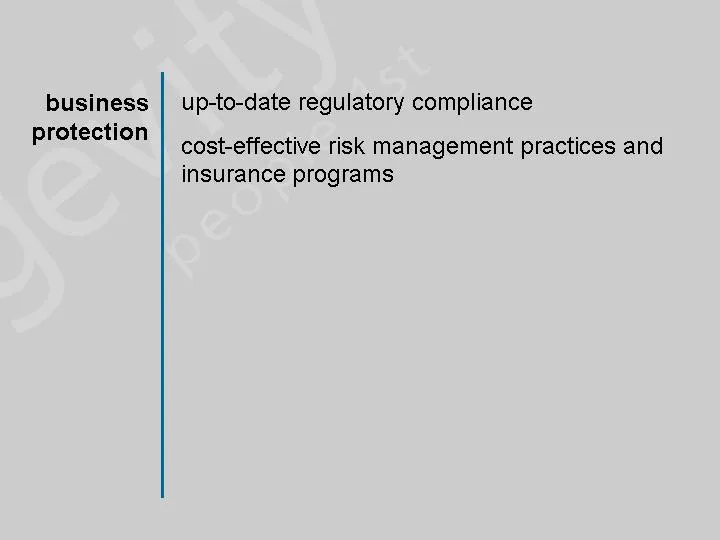
business protection up-to-date regulatory compliance cost-effective risk management practices and insurance programs
Slide 12: Service levels and platforms
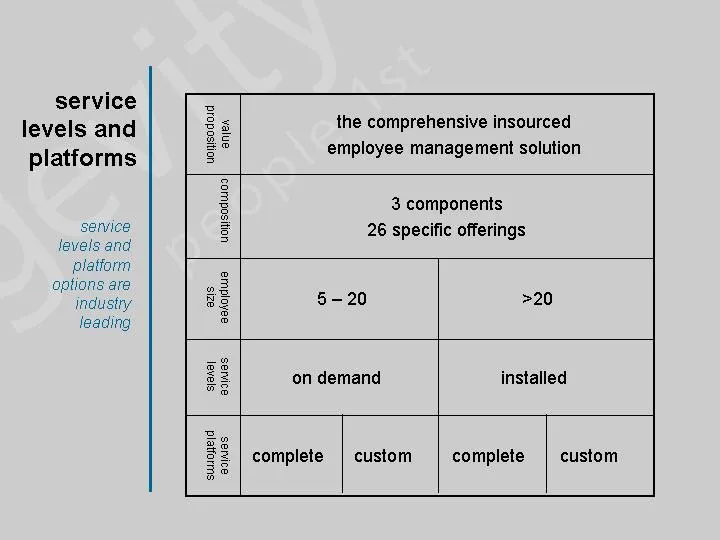
service levels and platforms value proposition the comprehensive insourced employee management solution composition 3 components 26 specific offerings employee size 5 - 20 >20 service levels on demand installed service platforms complete custom complete custom service levels and platform options are
Slide 13: Service delivery
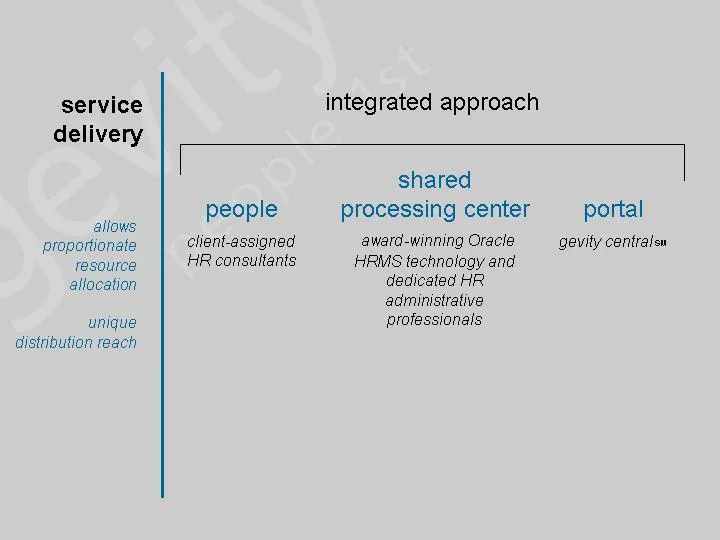
service delivery integrated approach people shared processing center award-winning Oracle HRMS technology and dedicated HR administrative professionals portal SM client-assigned HR consultants gevity central allows proportionate resource allocation unique distribution reach
Slide 14: Favorable client attributes and market dynamics
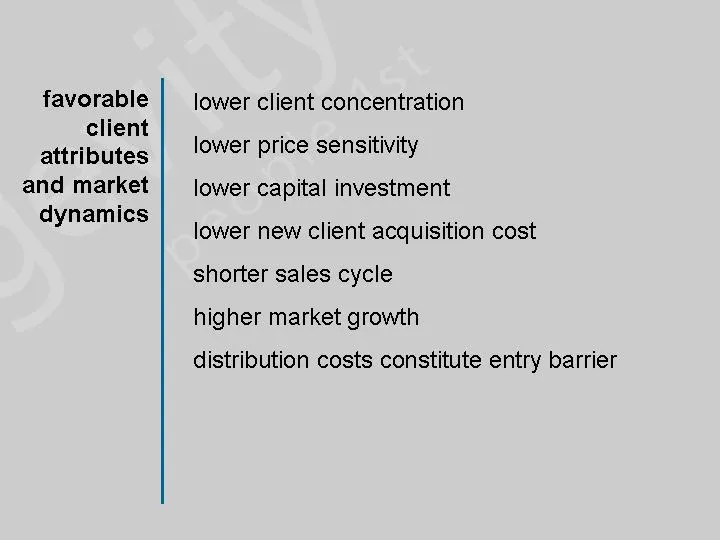
favorable client attributes and market dynamics lower client concentration lower price sensitivity lower capital investment lower new client acquisition cost shorter sales cycle higher market growth distribution costs constitute entry barrier
Slide 15: Gevity's unique position
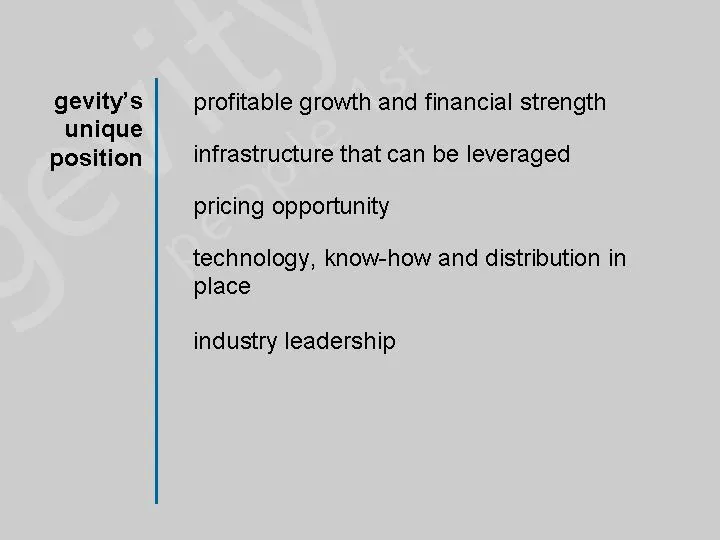
gevity's unique position profitable growth and financial strength infrastructure that can be leveraged pricing opportunity technology, know-how and distribution in place industry leadership
Slide 16: Corporate governance oversight
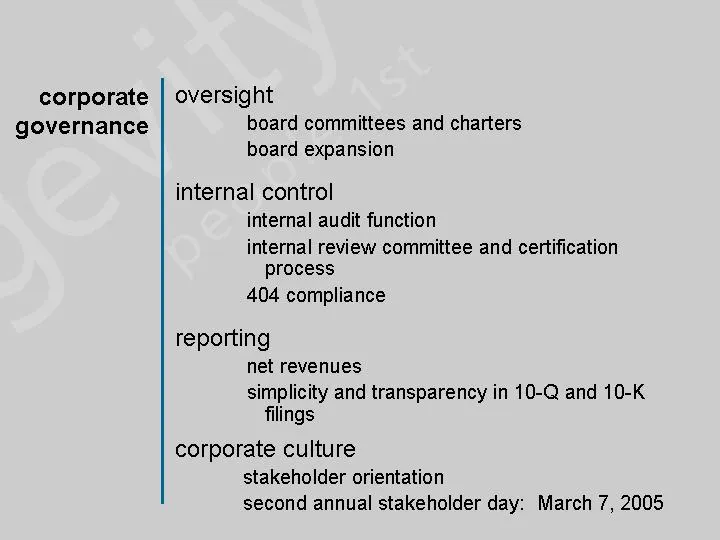
corporate governance oversight board committees and charters board expansion internal control internal audit function internal review committee and certification process 404 compliance reporting net revenues simplicity and transparency in 10-Q and 10-K filings corporate culture stakeholder orientati
Slide 17: Investment opportunity
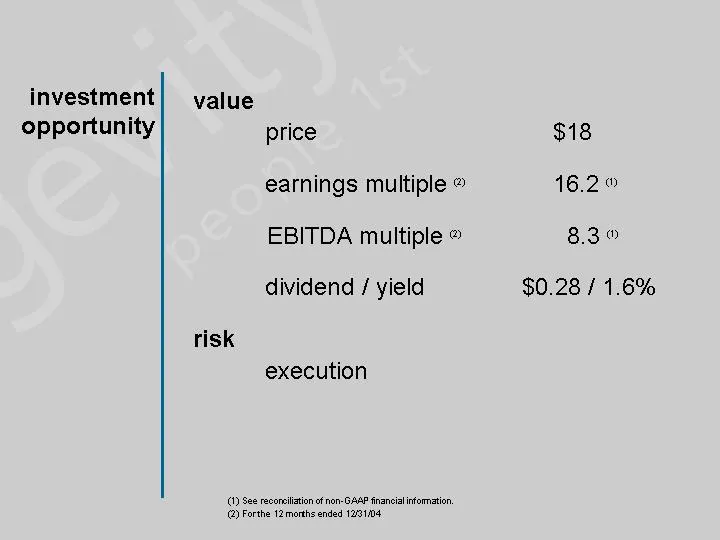
investment opportunity value price $18 earnings multiple (2) 16.2 (1) EBITDA multiple (2) 8.3 (1) dividend / yield $0.28 / 1.6% risk execution (1) See reconciliation of non-GAAP financial information. (2) For the 12 months ended 12/31/04
Slide 18: Comprehensive insourced employee management solution
comprehensive insourced employee management solution management solution management solution
Slide 19: Performance review: revenue and gross profit
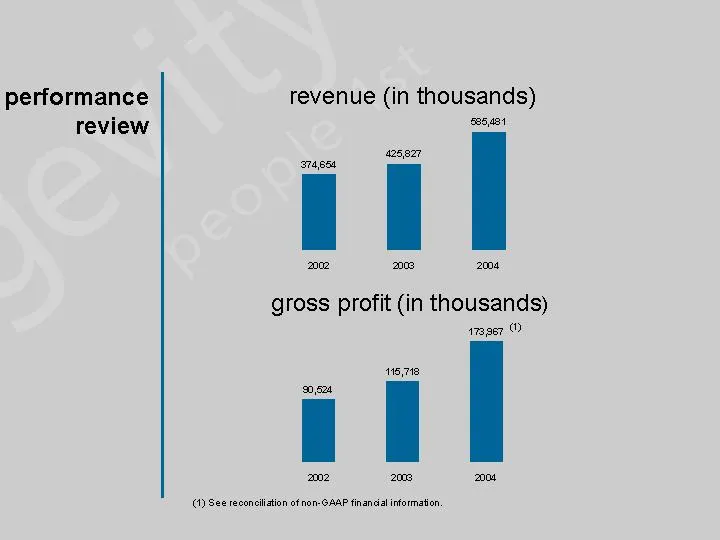
performance review revenue (in thousands) 2002 2003 2004 374654 425827 585481 2002 2003 YTD 2004 13092 28955 42678 (1) See reconciliation of non-GAAP financial information. gross profit (in thousands) 2002 2003 2004 90524 115718 173967 (1)
Slide 20: Performance review: net income and EBITDA
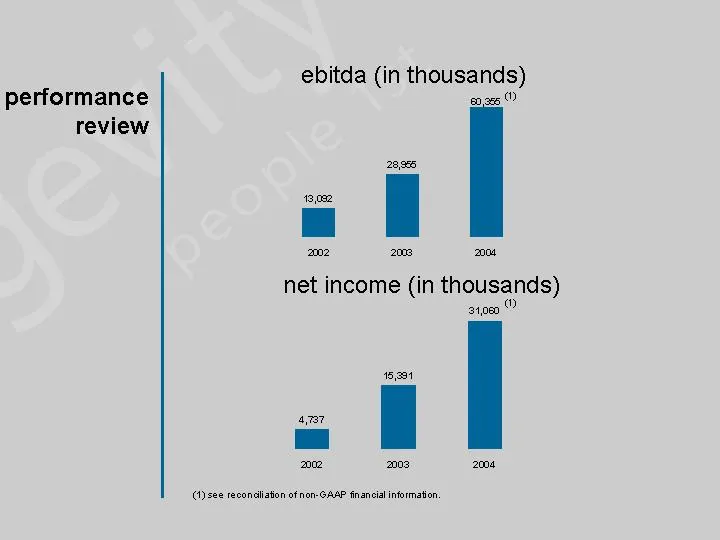
performance review (1) see reconciliation of non-GAAP financial information. net income (in thousands) 2002 2003 2004 4737 15391 31060 ebitda (in thousands) 2002 2003 2004 13092 28955 60355 (1) (1)
Slide 21: Performance review: ROIC and diluted EPS
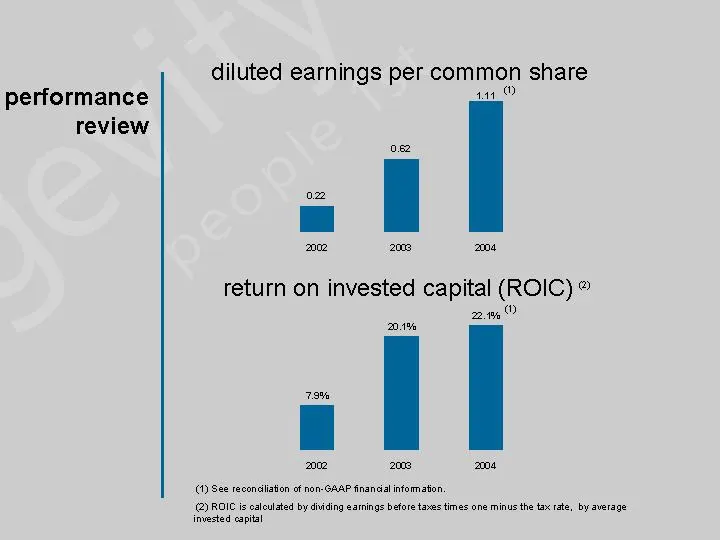
performance review (1) See reconciliation of non-GAAP financial information. (2) ROIC is calculated by dividing earnings before taxes times one minus the tax rate, by average invested capital return on invested capital (ROIC) (2) 2002 2003 2004 0.079 0.201 0.221 diluted earnings per common share 200
Slide 22: Performance review: full year 2004 results
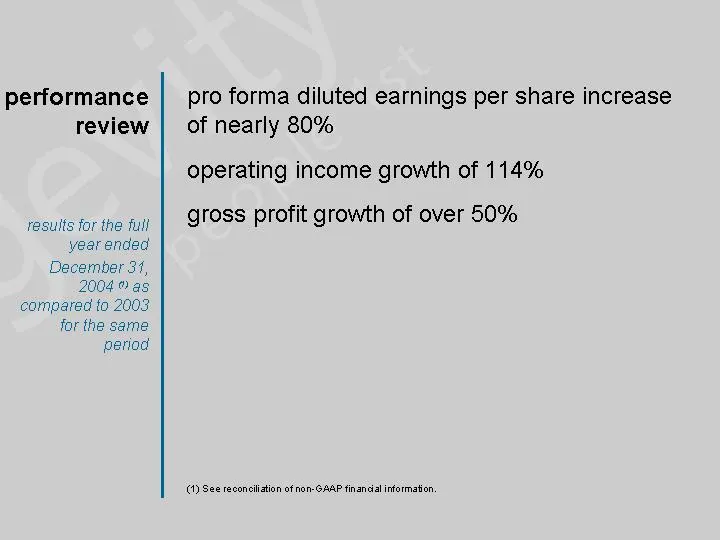
performance review pro forma diluted earnings per share increase of nearly 80% operating income growth of 114% gross profit growth of over 50% results for the full year ended December 31, 2004 (1) as compared to 2003 for the same period (1) See reconciliation of non-GAAP financial information.
Slide 23: Complete service platform
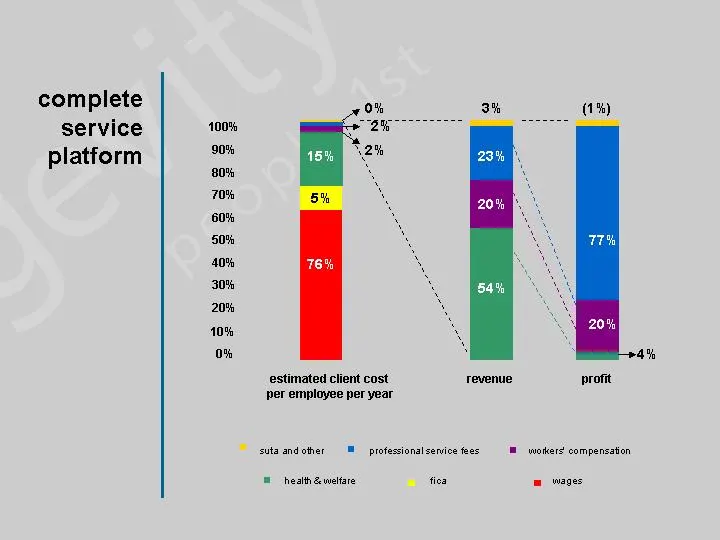
complete service platform estimated client cost per employee per year 76% 5% 15% 0% 10% 20% 30% 40% 50% 60% 70% 80% 90% 100% profit (1%) 77% 20% revenue 23% 20% 54% 3% 2% 0% 2% suta and other professional service fees workers' compensation health & welfare fica wages 4%
Slide 24: Custom service platform revenue and gross profit breakdown
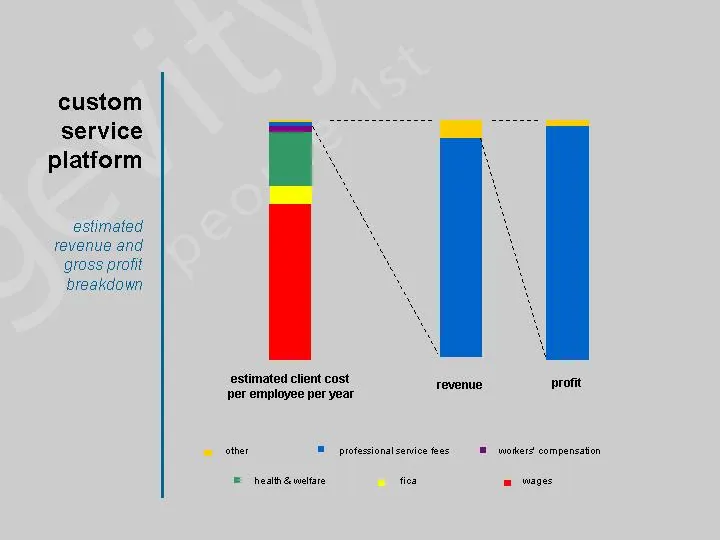
estimated revenue and gross profit breakdown custom service platform profit revenue other professional service fees workers' compensation health & welfare fica wages estimated client cost per employee per year
Slide 25: Financial performance per client employee
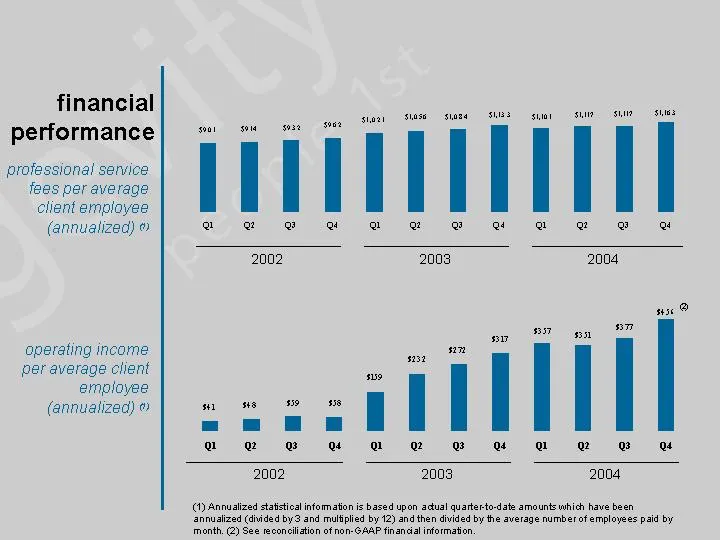
financial performance operating income per average client employee (annualized) (1) professional service fees per average client employee (annualized) (1) Q1 Q2 Q3 Q4 Q1 Q2 Q3 Q4 Q1 Q2 Q3 Q4 901 914 932 962 1021 1056 1084 1133 1101 1117 1117 1163 2002 2003 2004 Q1 Q2 Q3 Q4 Q1 Q2 Q3 Q4 Q1 Q2 Q3 Q4 41
Slide 26: Pricing
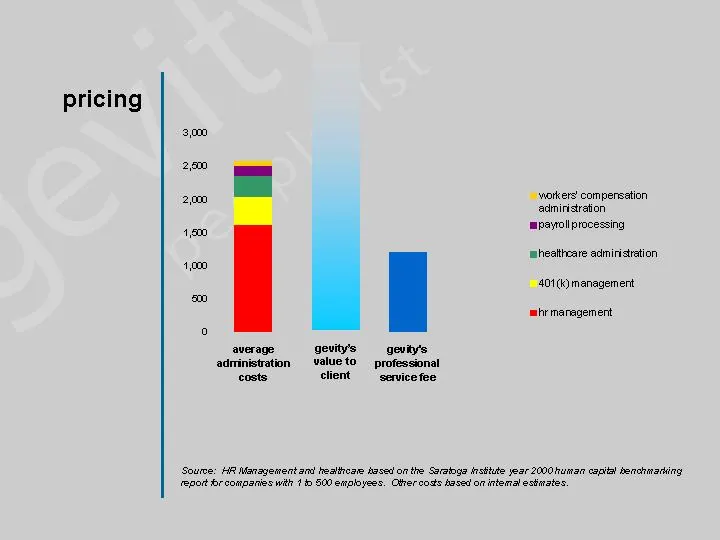
pricing average administration costs gevity's values gevity's professional service fee hr management 1605 0 0 401(k) management 430 0 0 healthcare administration 315 0 0 payroll processing 150 0 0 workers' compensation administration 77 0 0 gevity professional service fee 0 1200 gevity's value to cl
Slide 27: Balance sheet items December 31, 2004
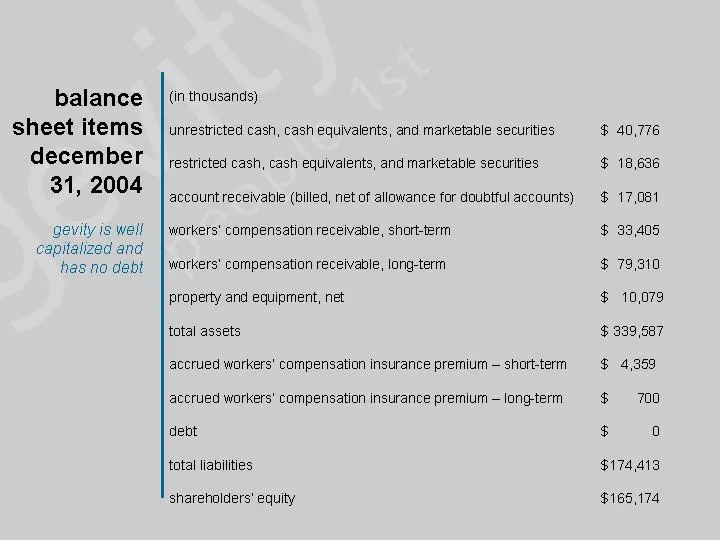
balance sheet items december 31, 2004 gevity is well capitalized and has no debt (in thousands) unrestricted cash, cash equivalents, and marketable securities $ 40,776 restricted cash, cash equivalents, and marketable securities $ 18,636 account receivable (billed, net of allowance for doubtful acco
Slide 28: 2005 guidance
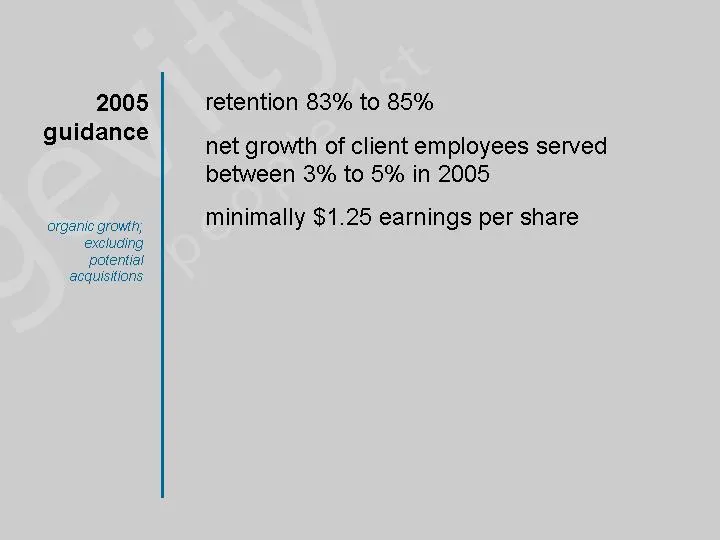
2005 guidance retention 83% to 85% net growth of client employees served between 3% to 5% in 2005 minimally $1.25 earnings per share organic growth; excluding potential acquisitions
Slide 29: Reconciliation of non-GAAP financial information
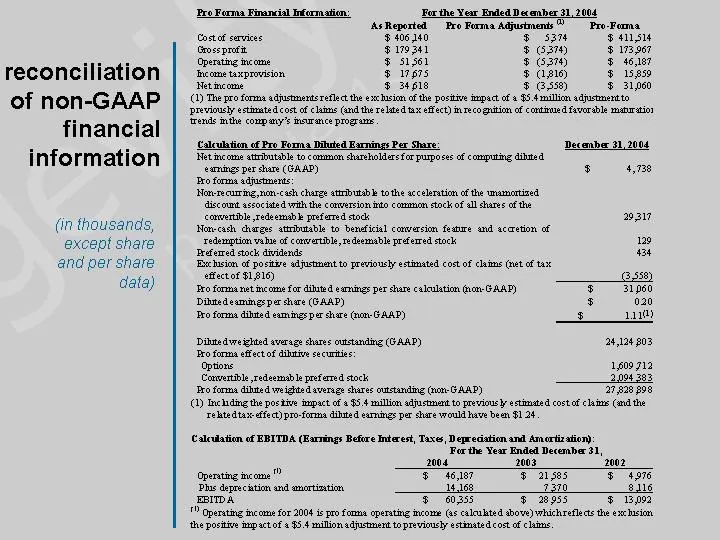
reconciliation of non-GAAP financial information (in thousands, except share and per share data)
Slide 30: The greatest human resource is the human spirit
the greatest human resource is the human spirit human spirit human spirit
Source: SEC EDGAR · 8-K filed Feb 22, 2005