Durr AG · XETR:DUE
Durr — Non-Deal Roadshow (June 2010)
40 slides from Durr's roadshow presentation, Jun 7, 2010
Slide 1: Roadshow USA
Roadshow USA Dürr Aktiengesellschaft Ralph Heuwing, CFO Günter Dielmann, IR New York, Chicago, June 07-09, 2010
Slide 2: Disclaimer
Disclaimer This investor presentation has been prepared independently by Dürr AG (“Dürr”). The presentation contains statements which address such key issues as Dürr´s strategy, future financial results, market positions and product development. Such statements should be carefully considered, and it
Slide 3: Agenda
Agenda 1. Dürr: Global leader with strong competitive position 2. Strategy 3. Financial overview and outlook © Dürr Aktiengesellschaft, CCI, Roadshow USA, June 07-09, 2010 -3-
Slide 4: Dürr: Global leader with strong competitive position
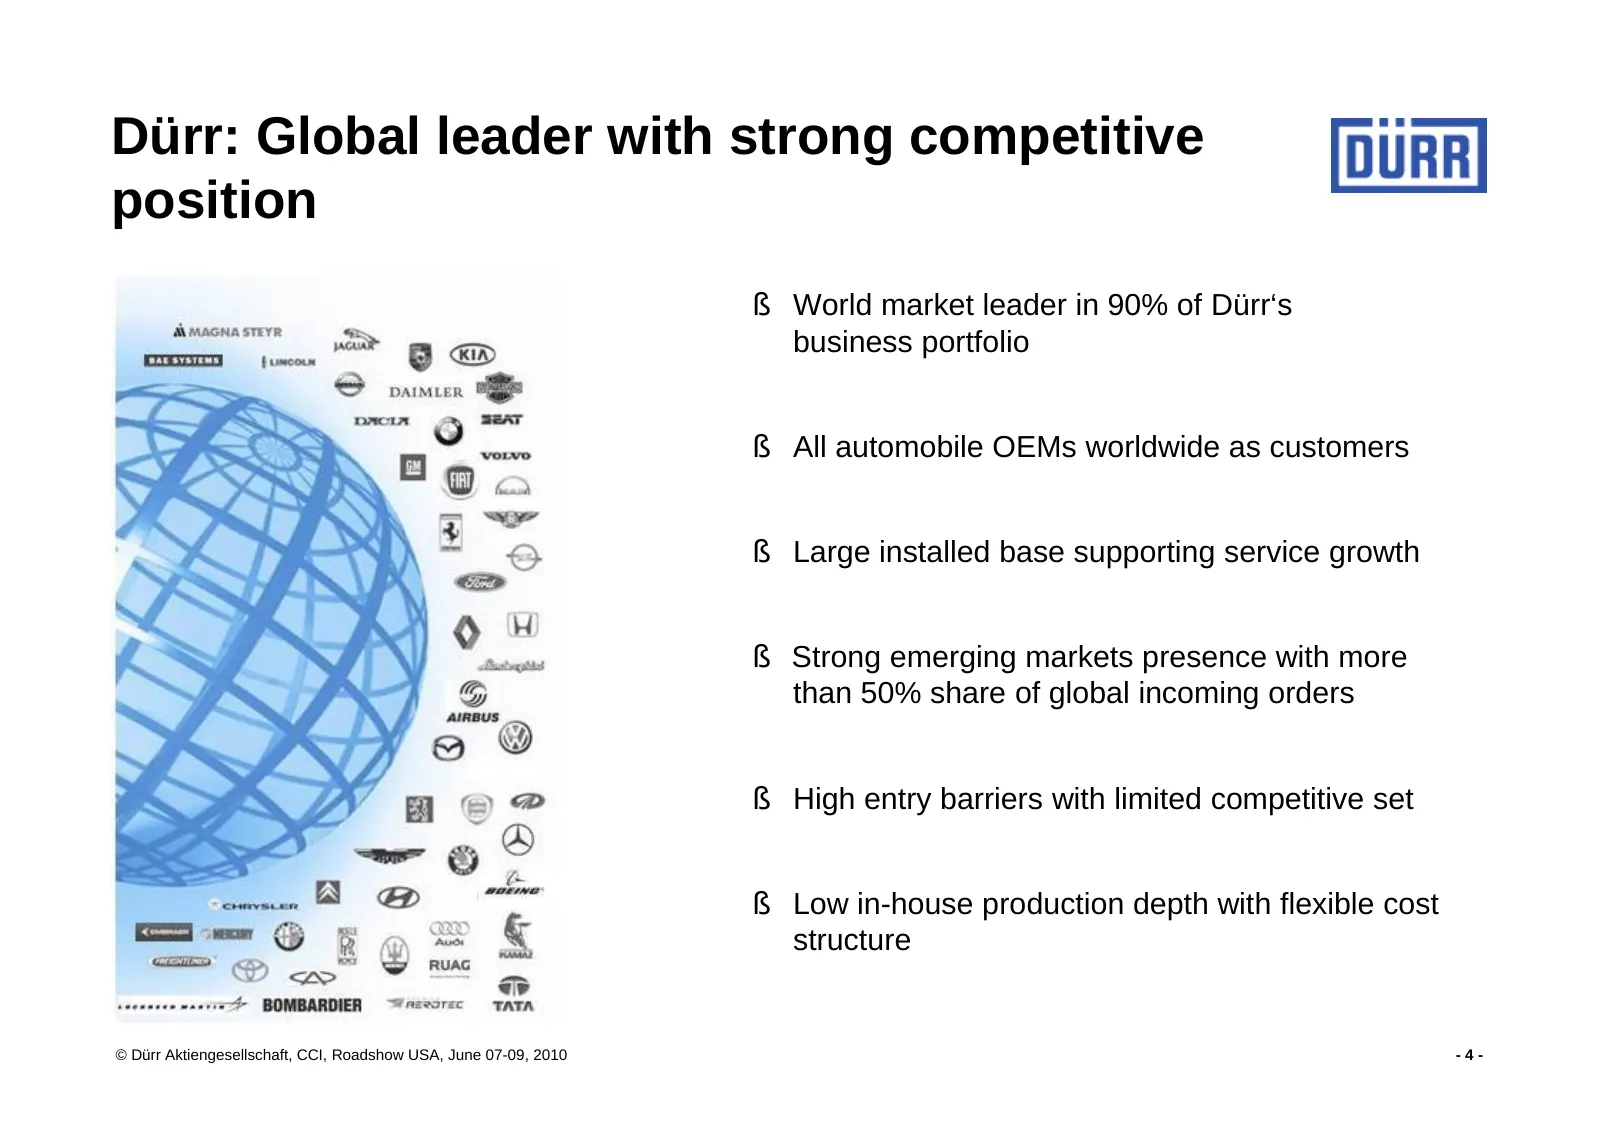
Dürr: Global leader with strong competitive position § World market leader in 90% of Dürr‘s business portfolio § All automobile OEMs worldwide as customers § Large installed base supporting service growth § Strong emerging markets presence with more than 50% share of global incoming orders § High en
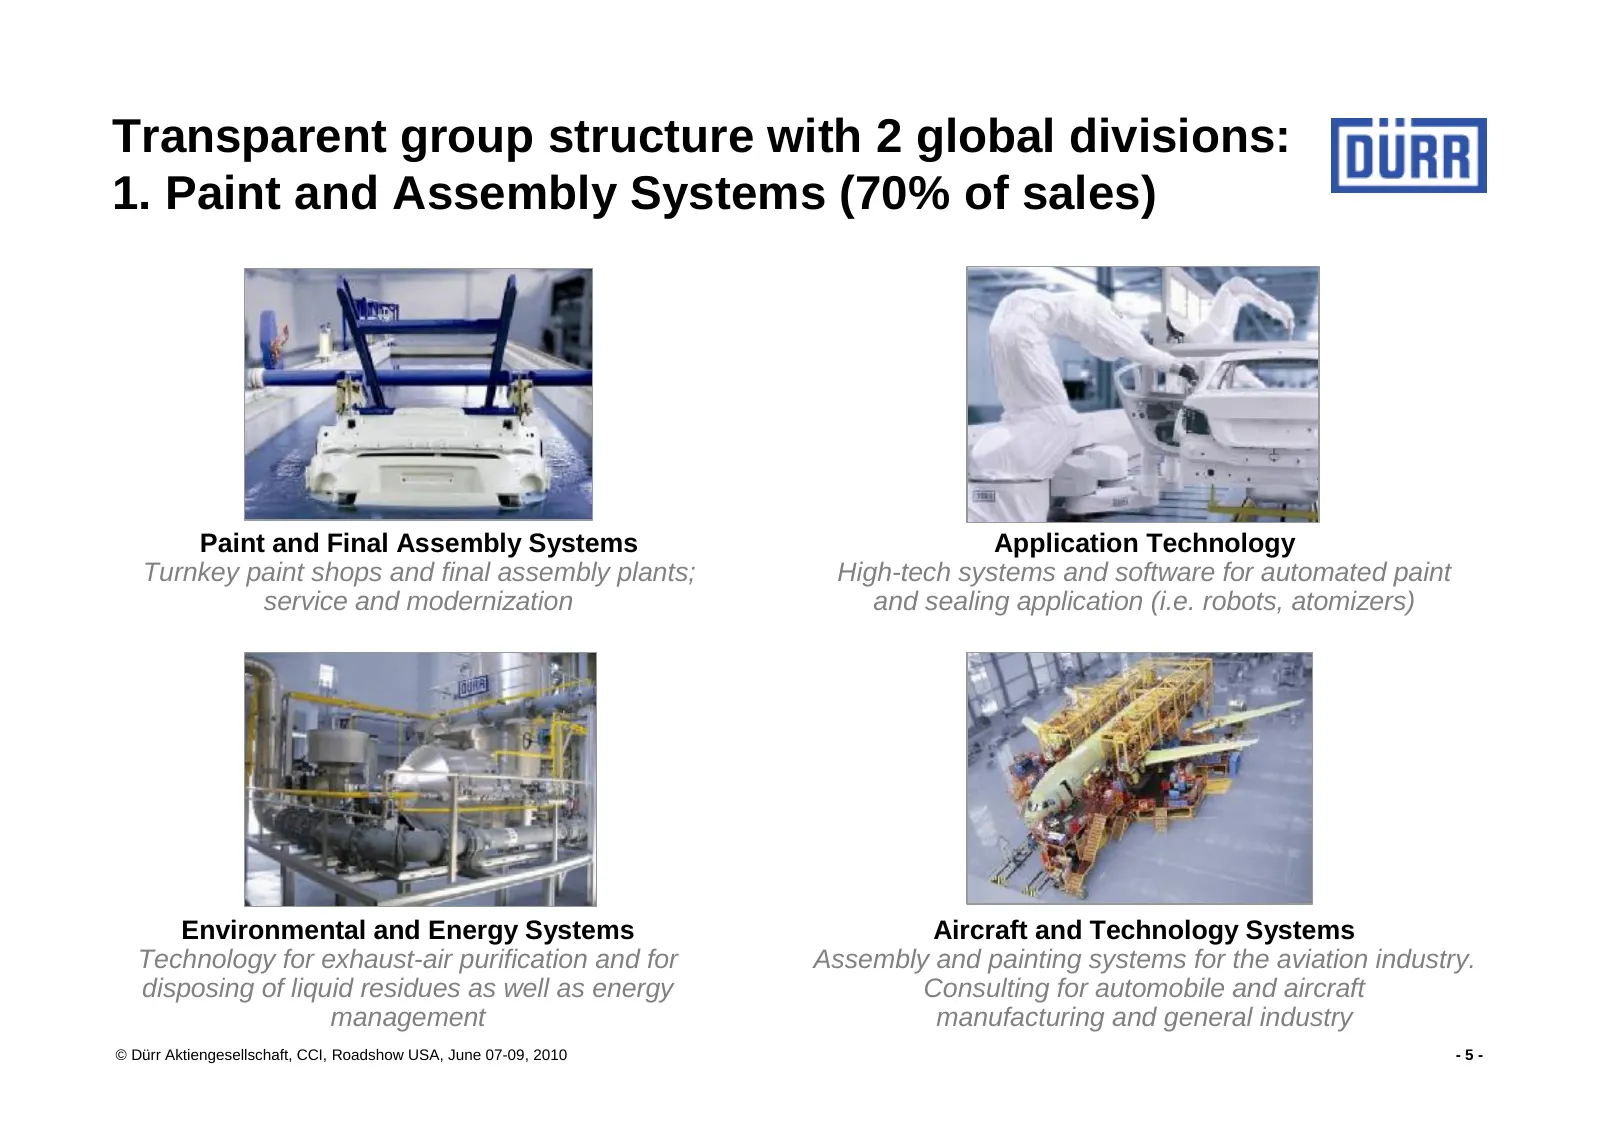
Slide 5: Transparent group structure with 2 global divisions: 1. Paint and Assembly Systems
Transparent group structure with 2 global divisions: 1. Paint and Assembly Systems (70% of sales) Paint and Final Assembly Systems Application Technology Turnkey paint shops and final assembly plants; High-tech systems and software for automated paint service and modernization and sealing applicatio
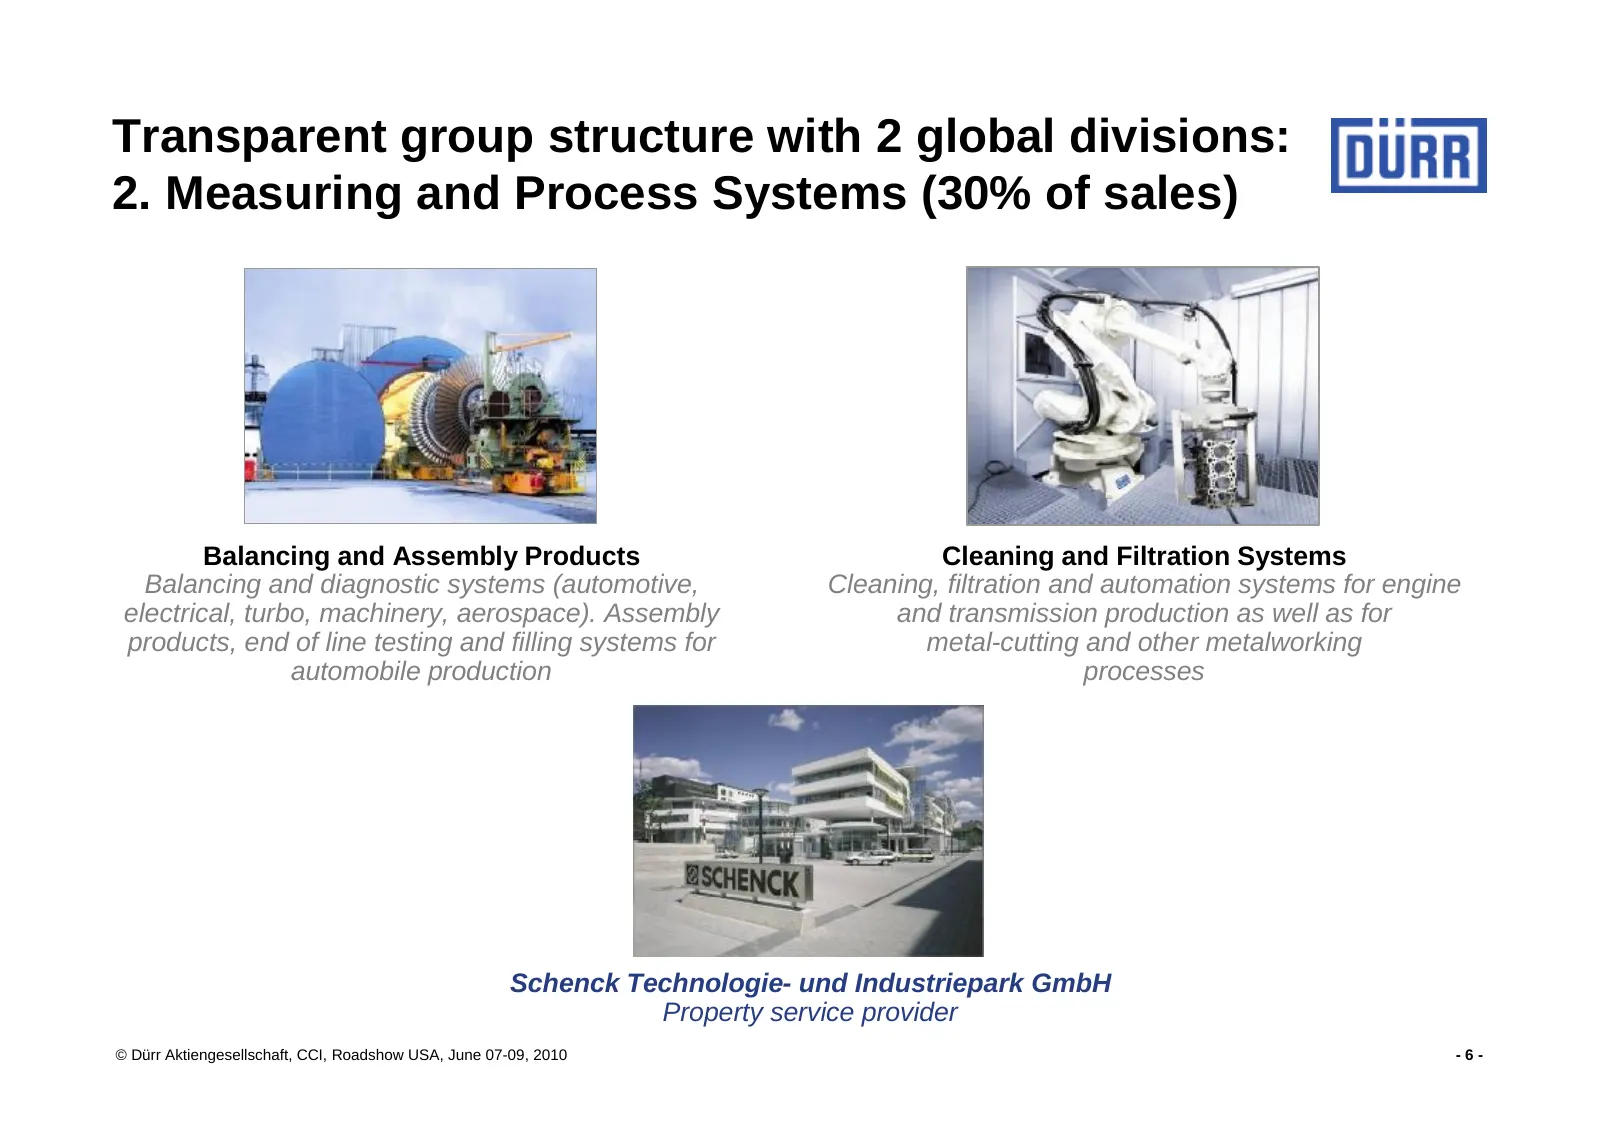
Slide 6: Transparent group structure with 2 global divisions: 2. Measuring and Process Systems
Transparent group structure with 2 global divisions: 2. Measuring and Process Systems (30% of sales) Balancing and Assembly Products Cleaning and Filtration Systems Balancing and diagnostic systems (automotive, Cleaning, filtration and automation systems for engine electrical, turbo, machinery, aero
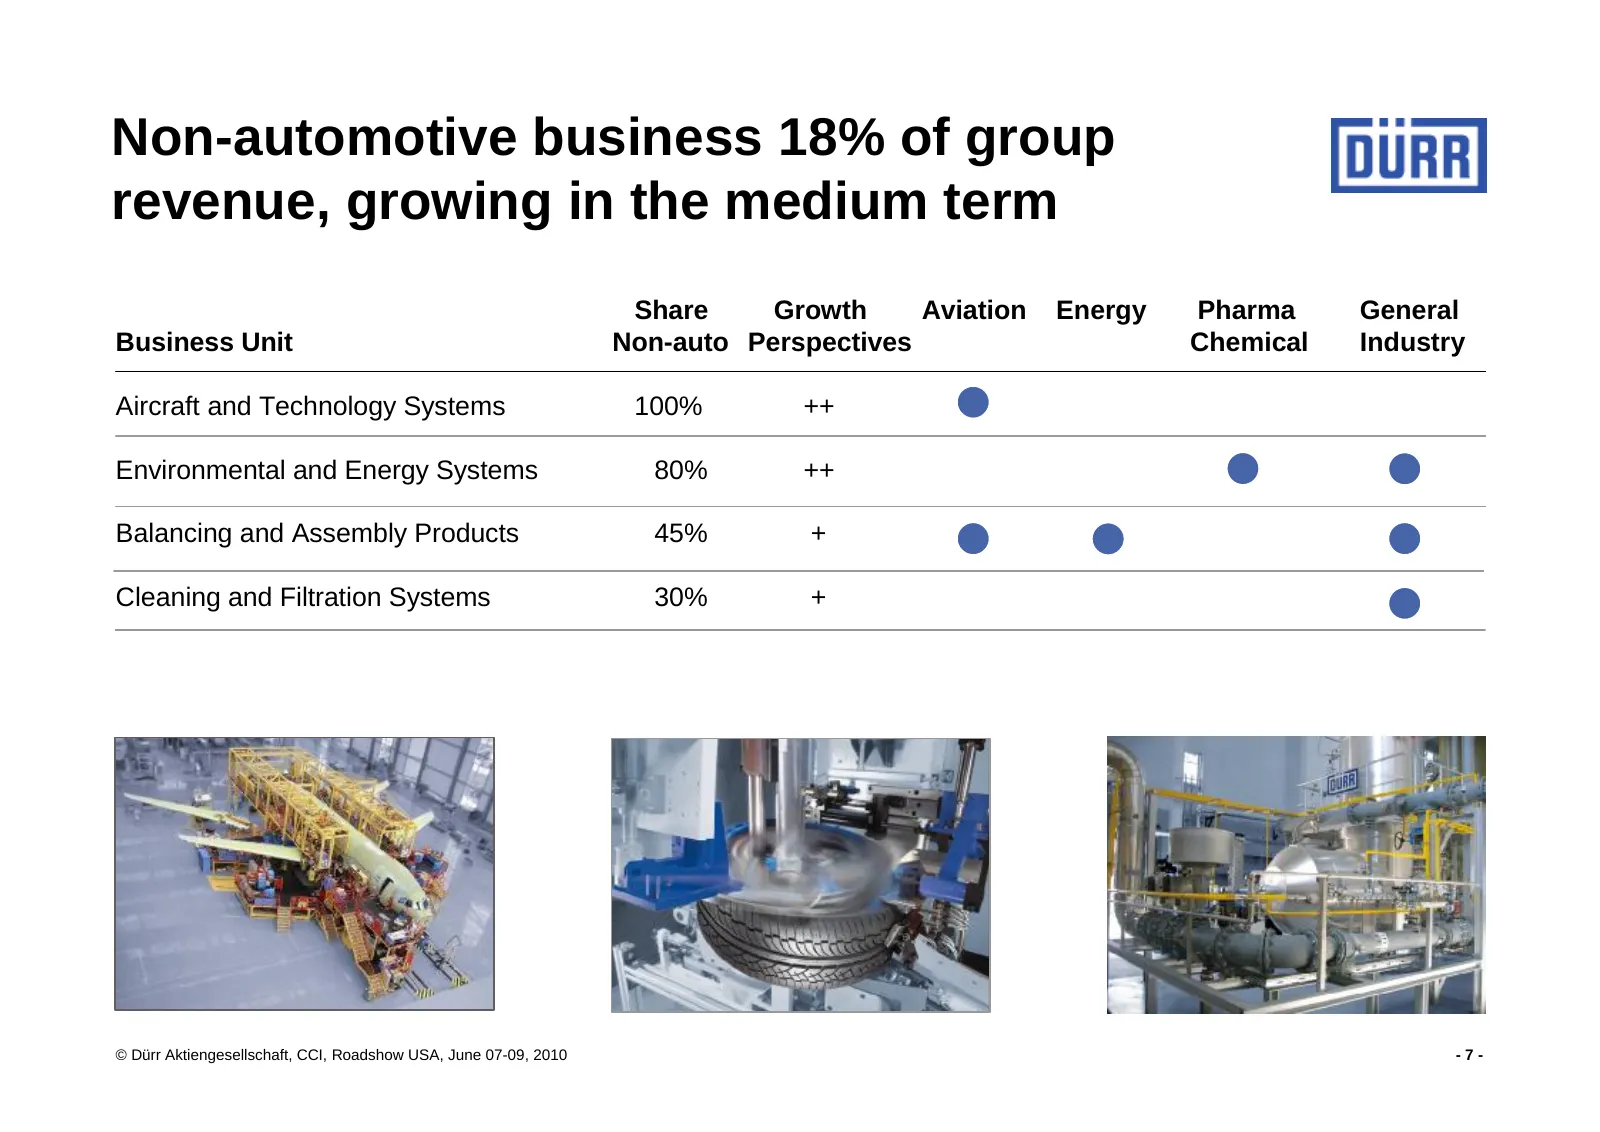
Slide 7: Non-automotive business 18% of group revenue, growing in the medium term
Non-automotive business 18% of group revenue, growing in the medium term Share Growth Aviation Energy Pharma General Business Unit Non-auto Perspectives Chemical Industry Aircraft and Technology Systems 100% ++ Environmental and Energy Systems 80% ++ Balancing and Assembly Products 45% + Cleaning an
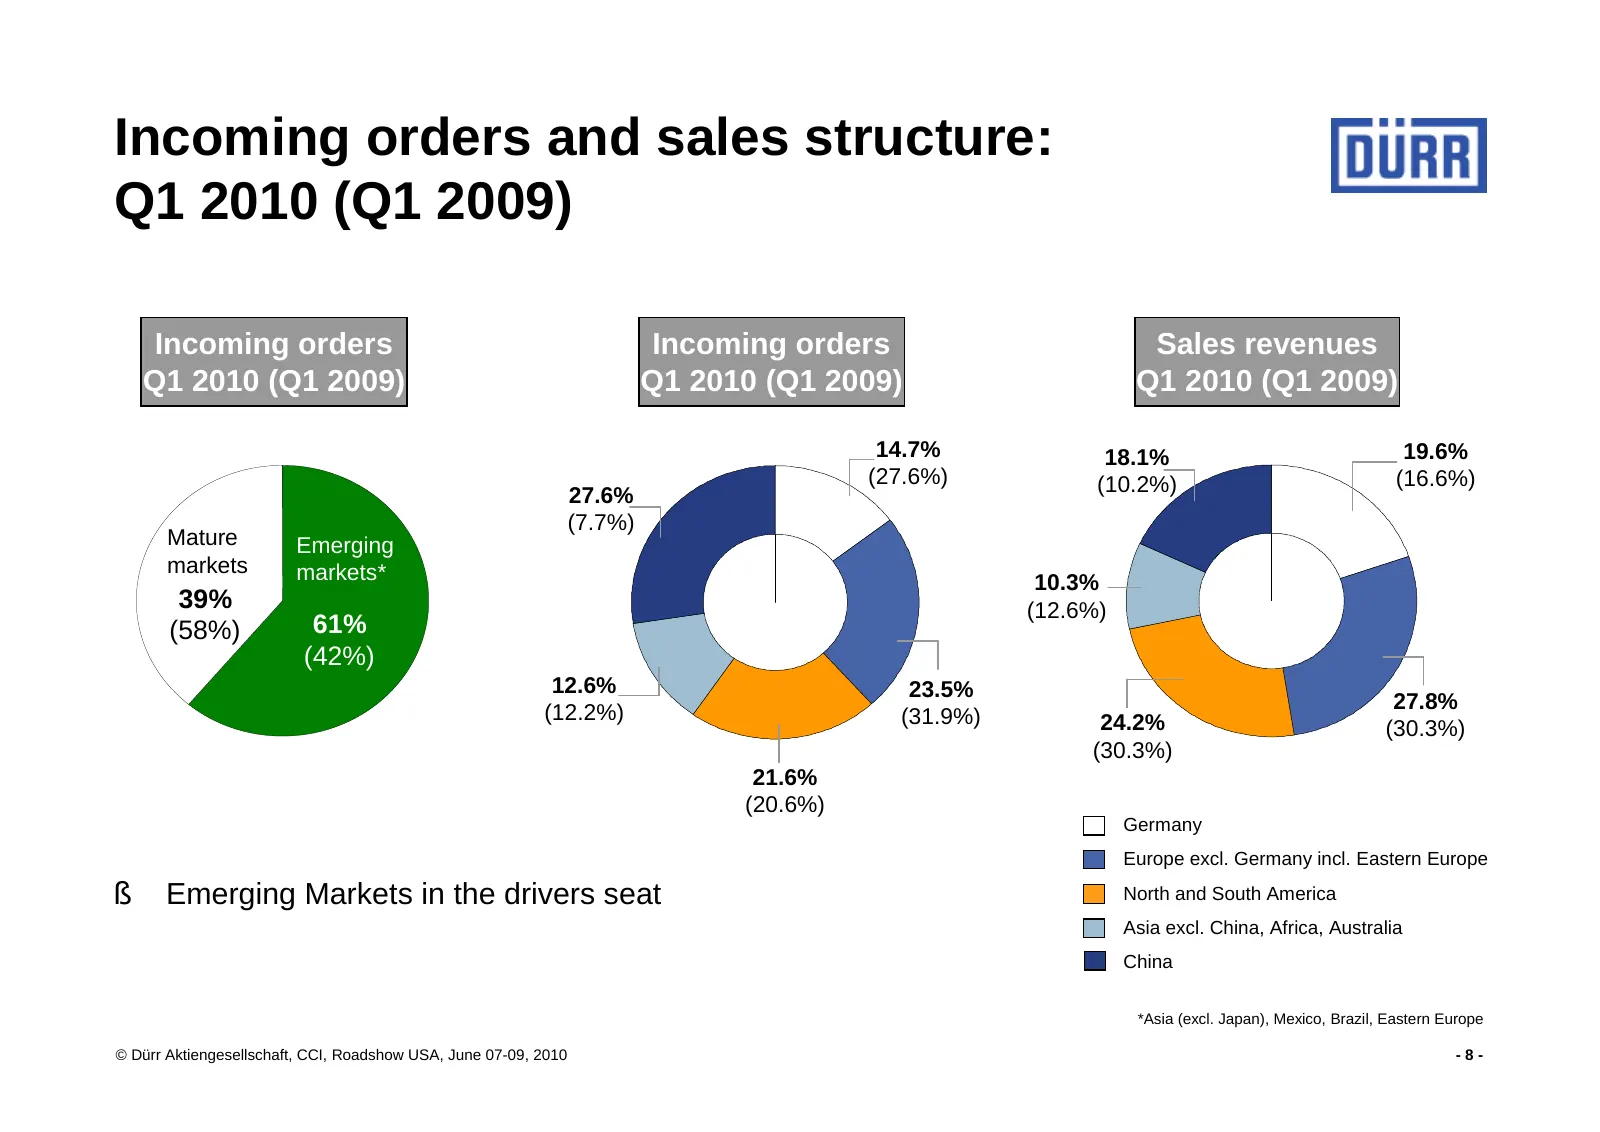
Slide 8: Incoming orders and sales structure: Q1 2010 (Q1 2009)
Incoming orders and sales structure: Q1 2010 (Q1 2009) Incoming orders Incoming orders Sales revenues Q1 2010 (Q1 2009) Q1 2010 (Q1 2009) Q1 2010 (Q1 2009) 14.7% 18.1% 19.6% (27.6%) (10.2%) (16.6%) 27.6% (7.7%) Mature Emerging markets markets* 10.3% 39% (12.6%) (58%) 61% (42%) 12.6% 23.5% (12.2%) 27
Slide 9: Asia/China: Dürr in leading position
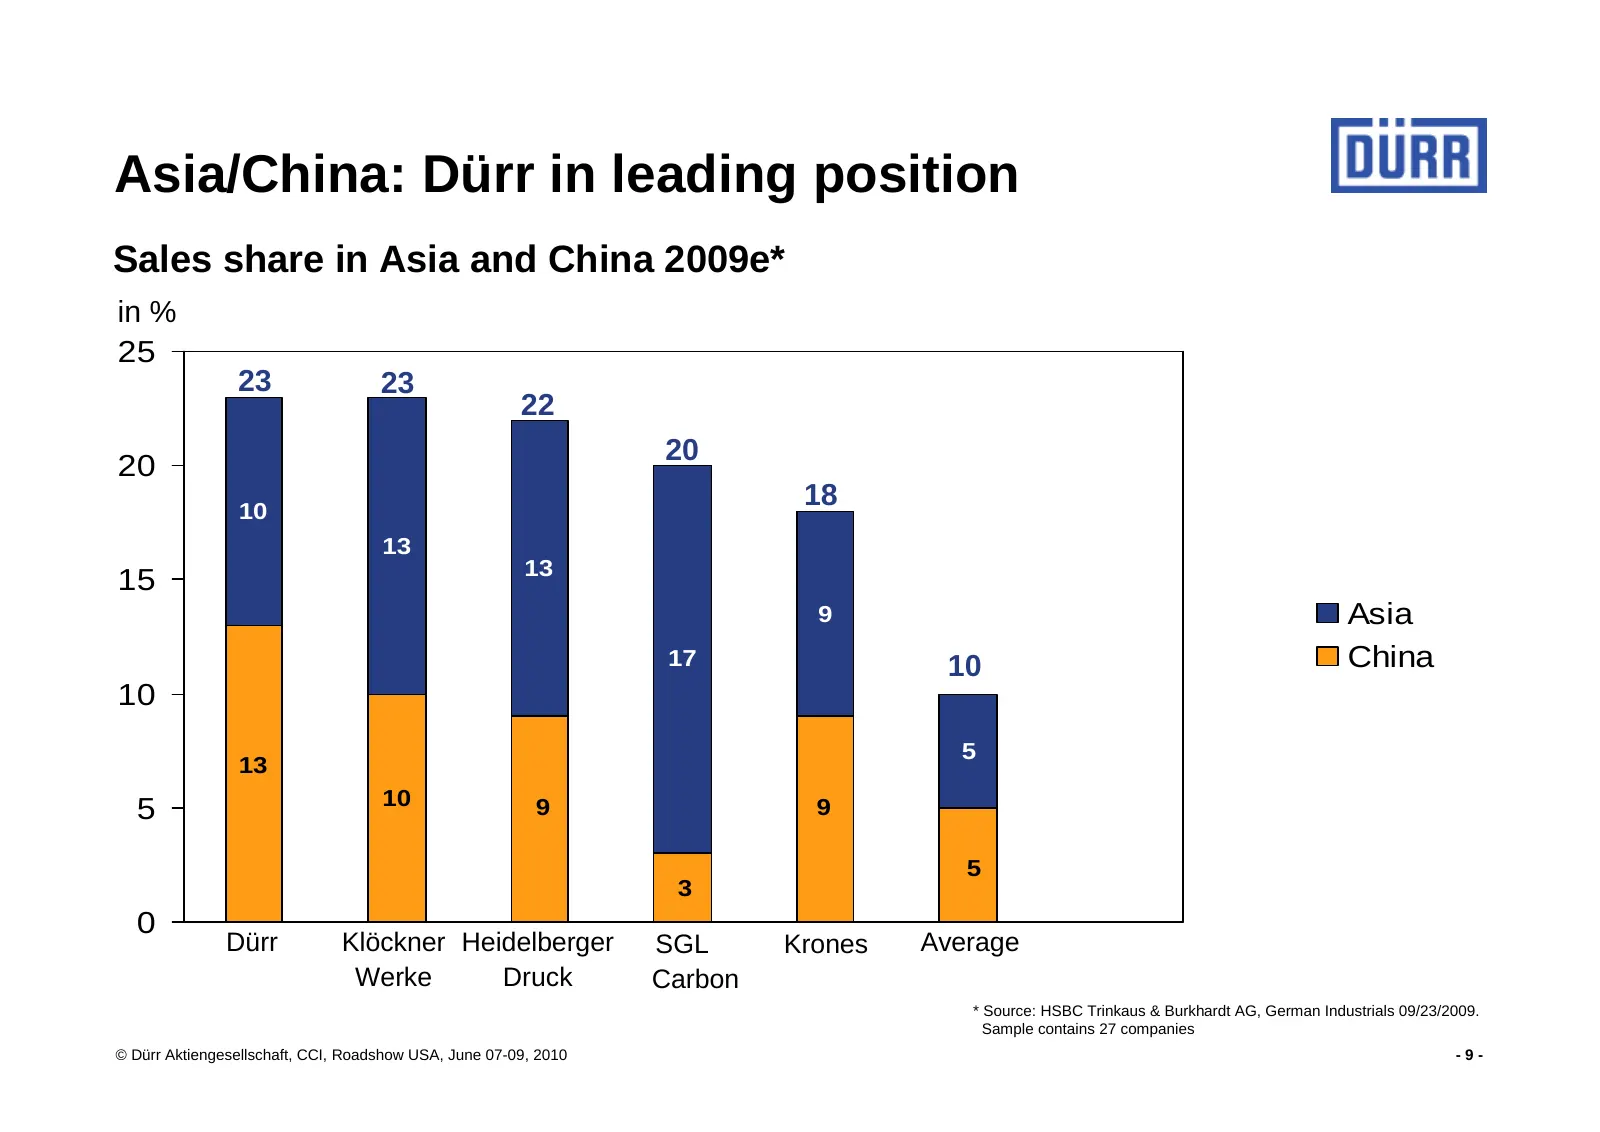
Asia/China: Dürr in leading position Sales share in Asia and China 2009e* in % 25 23 23 22 20 20 10 18 13 13 15 9 Asia 17 10 China 10 5 13 10 5 9 9 5 3 0 Dürr Klöckner Heidelberger SGL Krones Average Werke Druck Carbon * Source: HSBC Trinkaus & Burkhardt AG, German Industrials 09/23/2009. Sample con
Slide 10: Agenda
Agenda 1. Dürr: Global leader with strong competitive position 2. Strategy 3. Financial overview and outlook © Dürr Aktiengesellschaft, CCI, Roadshow USA, June 07-09, 2010 - 10 -
Slide 11: Strategy: Review “Dürr 2010”
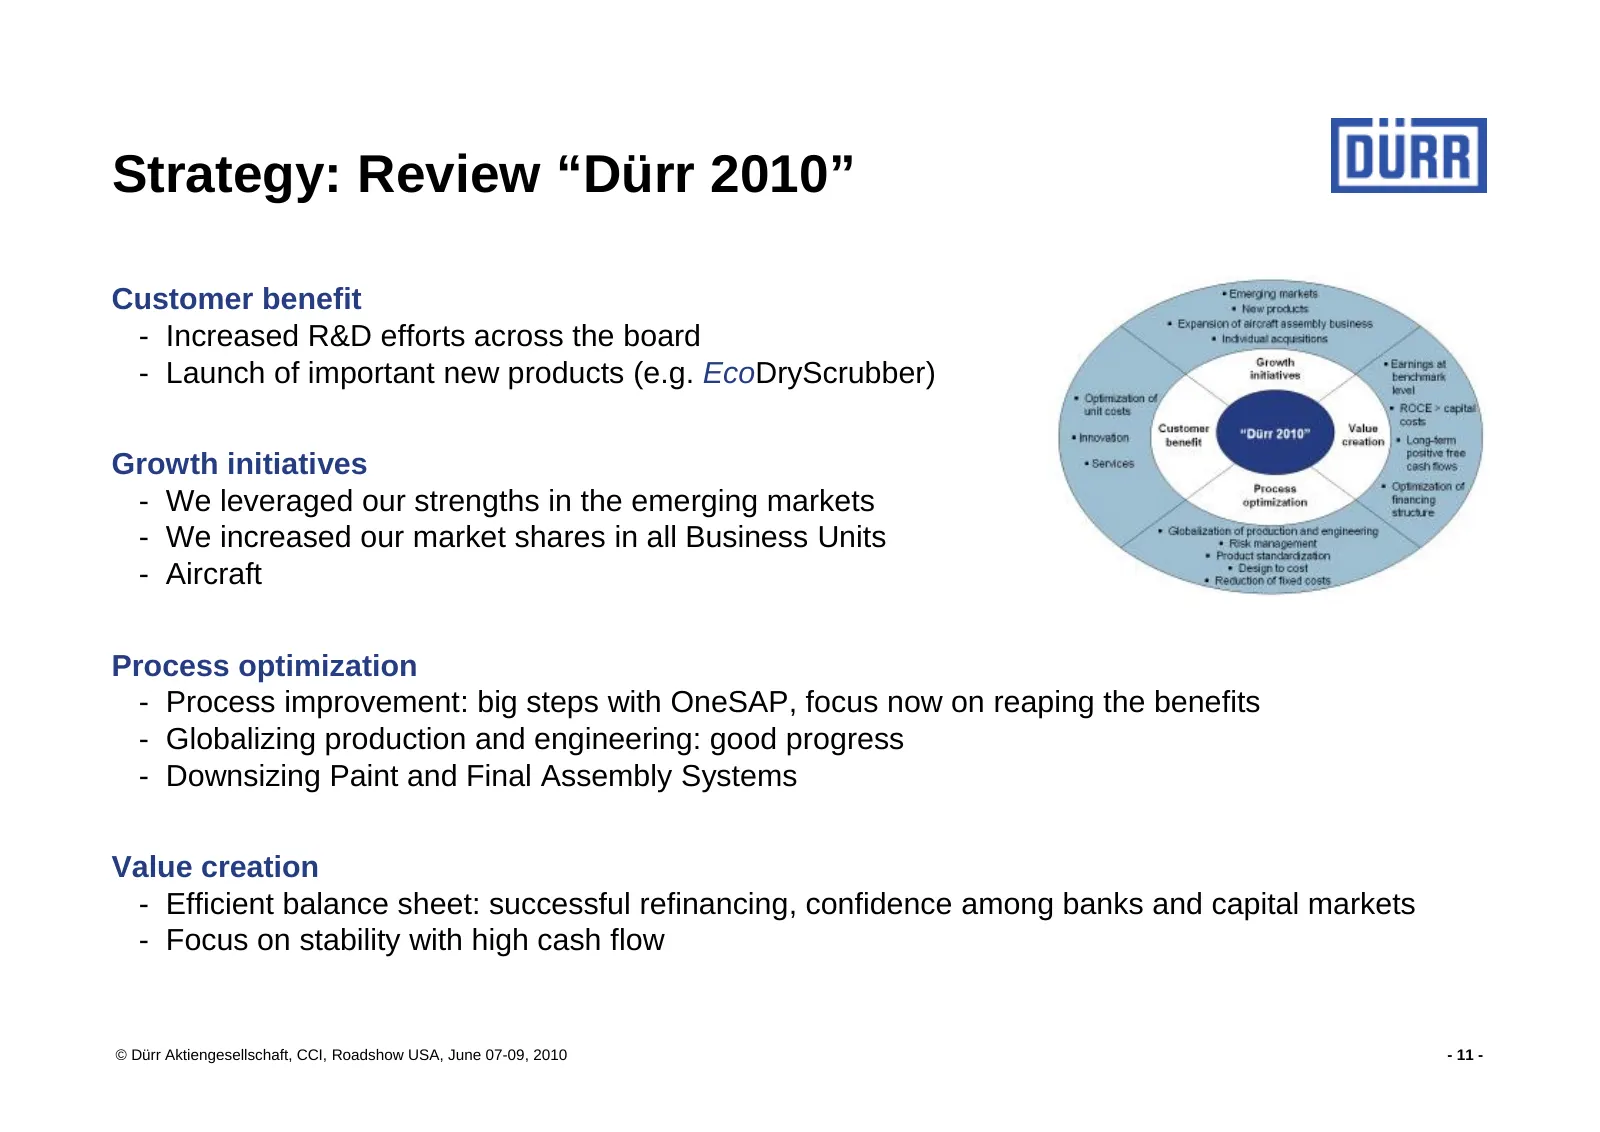
Strategy: Review “Dürr 2010” Customer benefit - Increased R&D efforts across the board - Launch of important new products (e.g. EcoDryScrubber) Growth initiatives - We leveraged our strengths in the emerging markets - We increased our market shares in all Business Units - Aircraft Process optimizati
Slide 12: Strategy: Our plans going forward
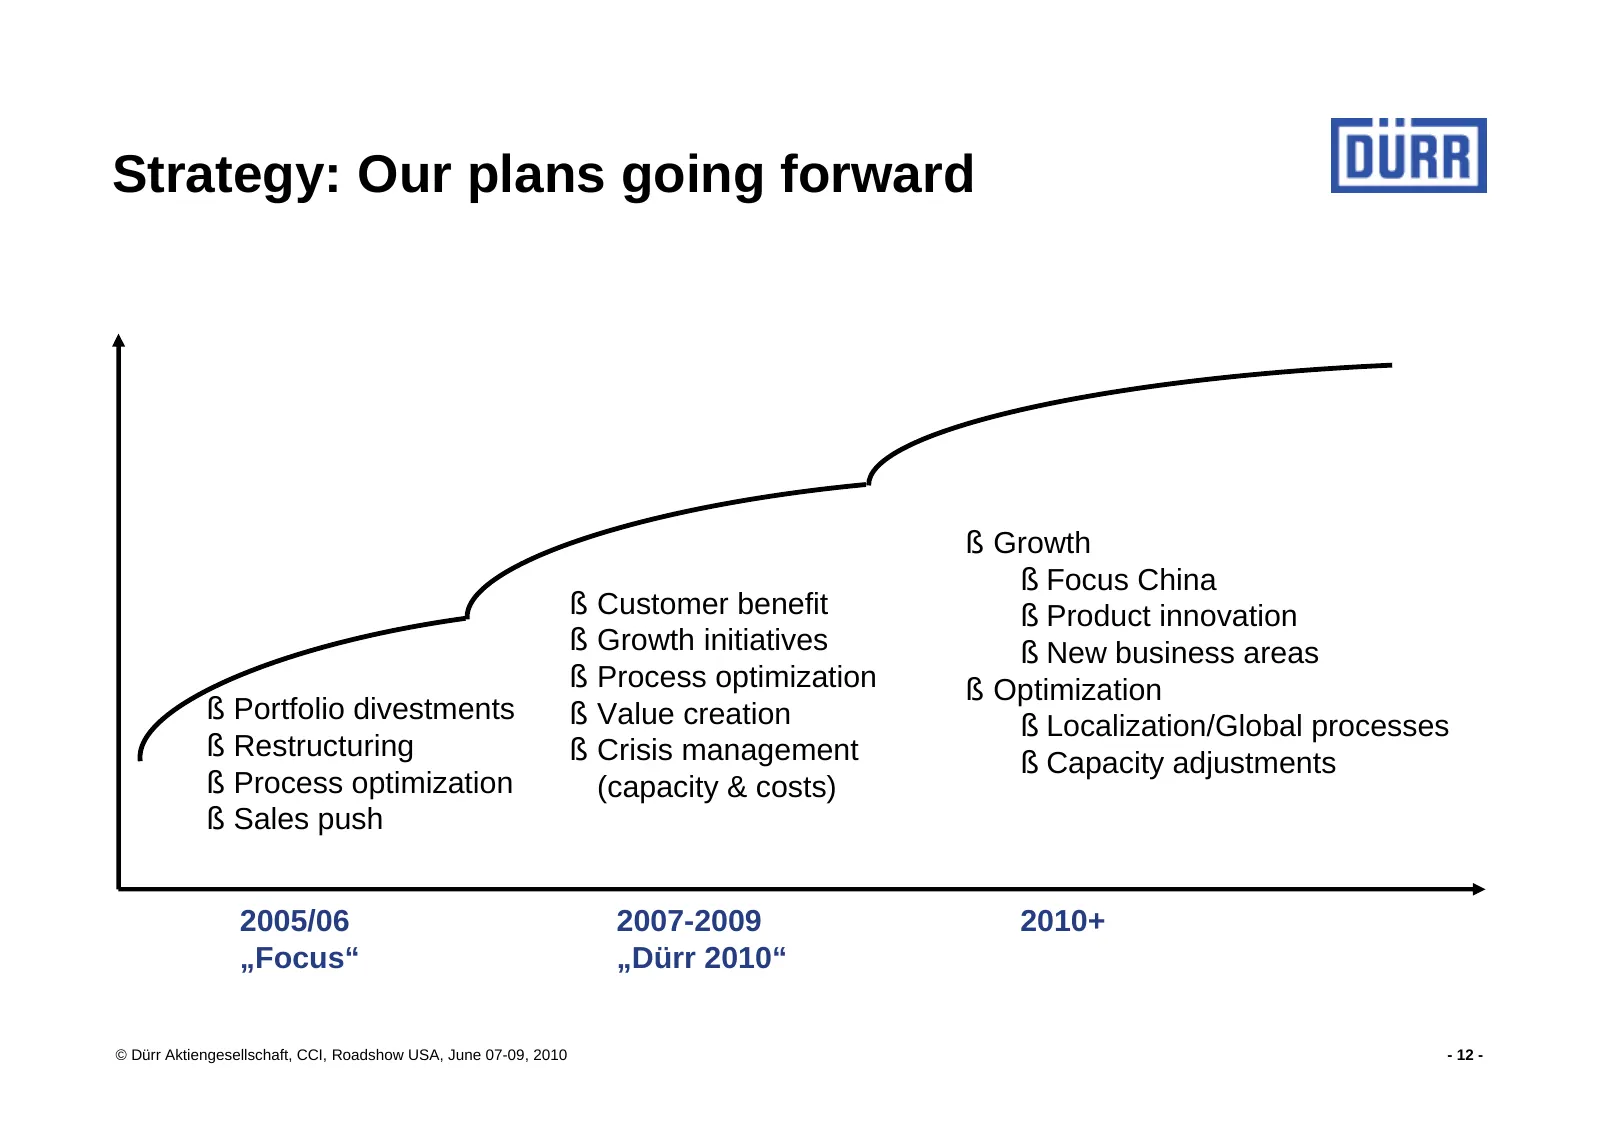
Strategy: Our plans going forward § Growth § Focus China § Customer benefit § Product innovation § Growth initiatives § New business areas § Process optimization § Optimization § Portfolio divestments § Value creation § Localization/Global processes § Restructuring § Crisis management § Capacity adj
Slide 13: Strategy: Growth
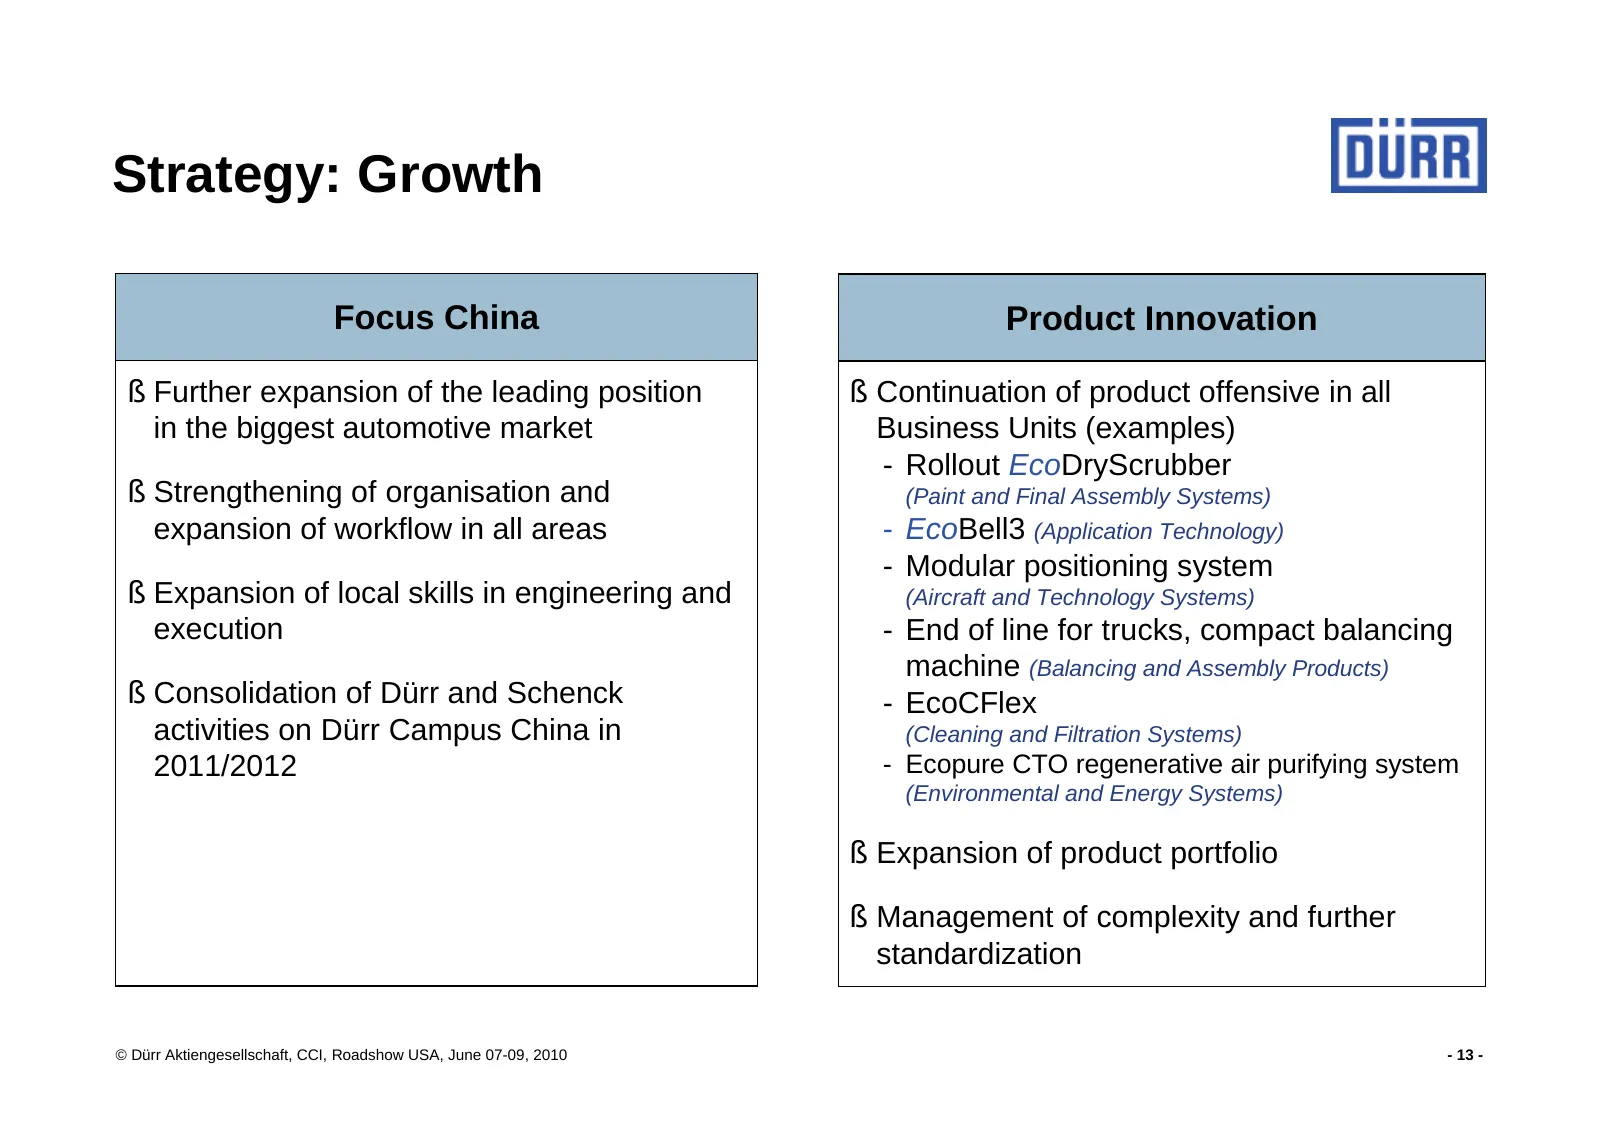
Strategy: Growth Focus China Product Innovation § Further expansion of the leading position § Continuation of product offensive in all in the biggest automotive market Business Units (examples) - Rollout EcoDryScrubber § Strengthening of organisation and (Paint and Final Assembly Systems) expansion
Slide 14: Strategy: Product innovation (1)
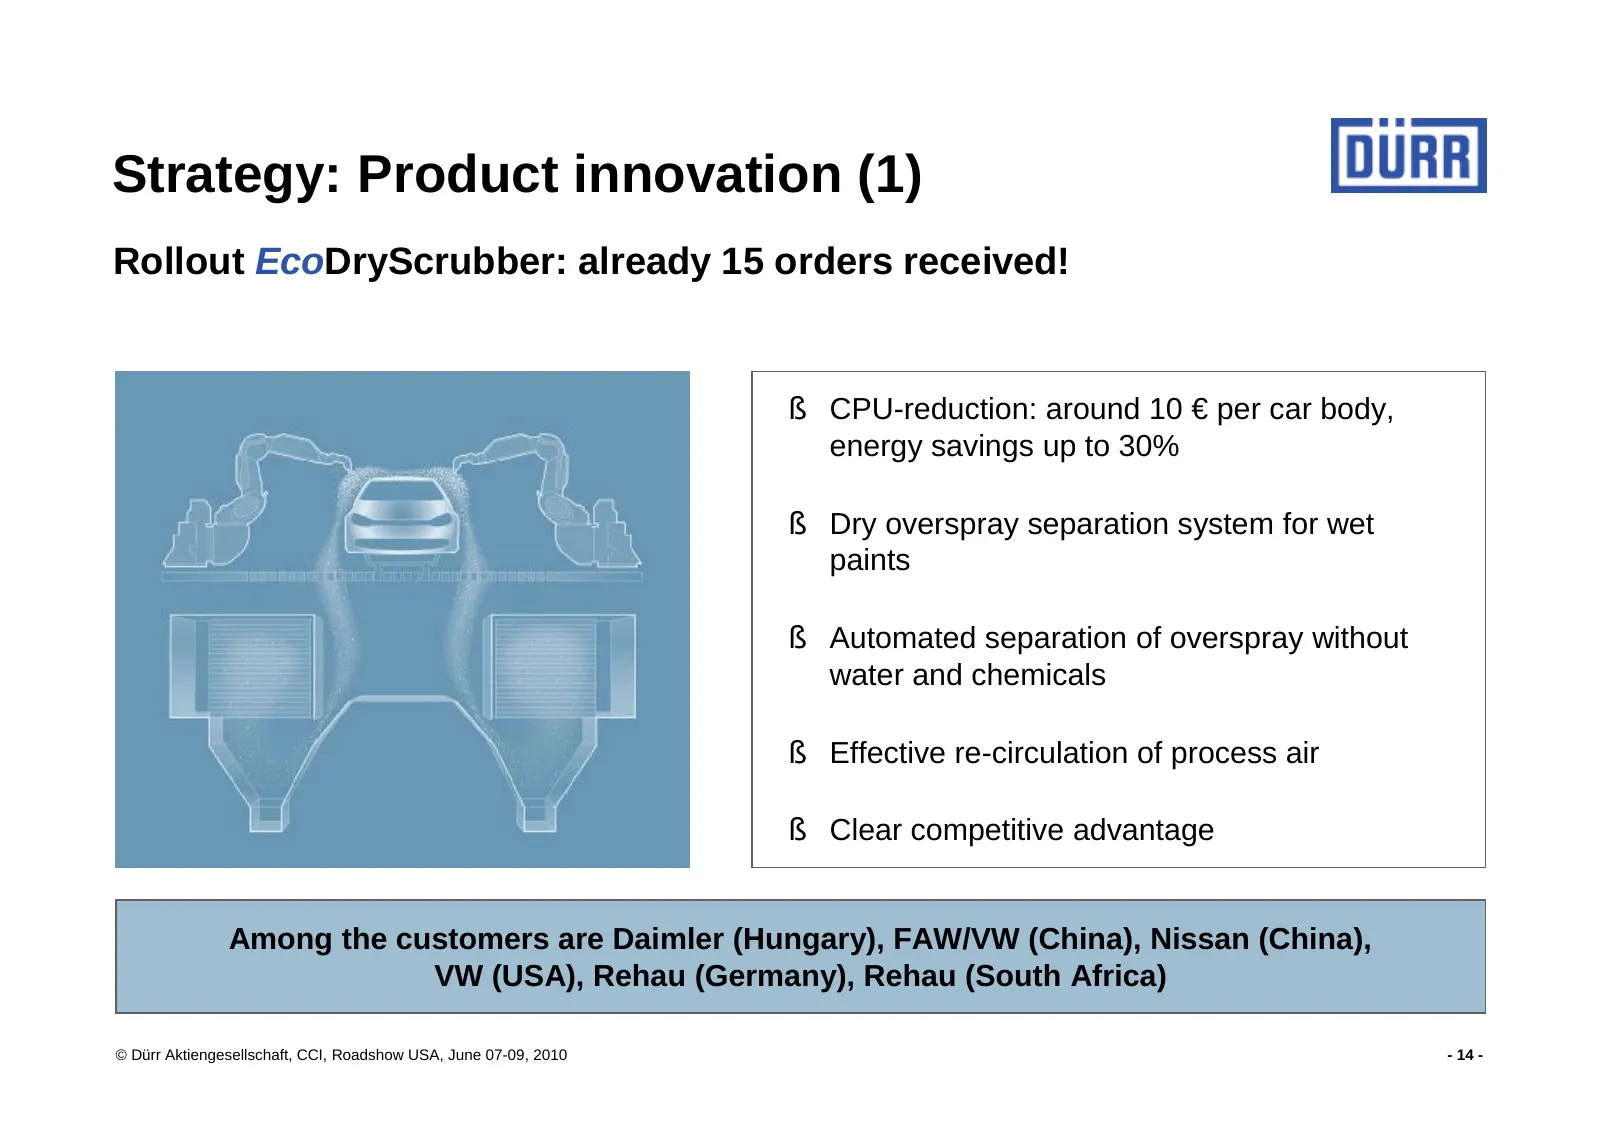
Strategy: Product innovation (1) Rollout EcoDryScrubber: already 15 orders received! § CPU-reduction: around 10 € per car body, energy savings up to 30% § Dry overspray separation system for wet paints § Automated separation of overspray without water and chemicals § Effective re-circulation of proc
Slide 15: Strategy: Product innovation (2)
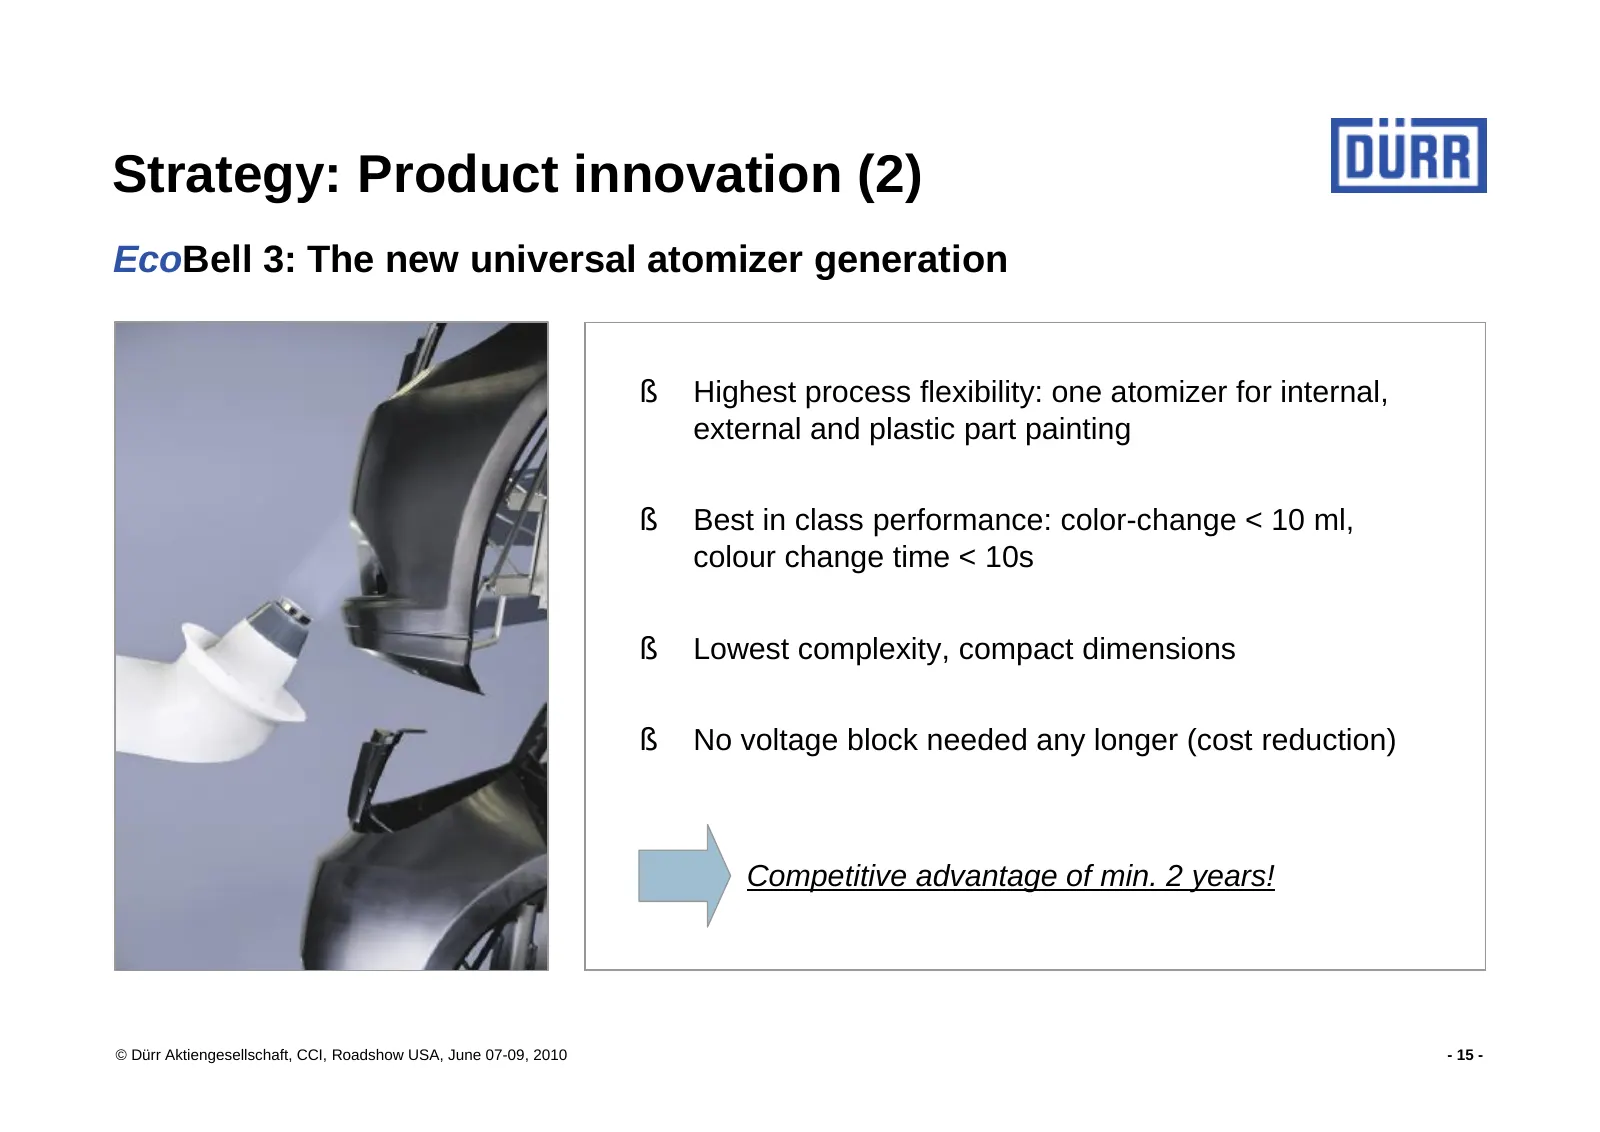
Strategy: Product innovation (2) EcoBell 3: The new universal atomizer generation § Highest process flexibility: one atomizer for internal, external and plastic part painting § Best in class performance: color-change < 10 ml, colour change time < 10s § Lowest complexity, compact dimensions § No volt
Slide 16: Strategy: Product innovation (3)
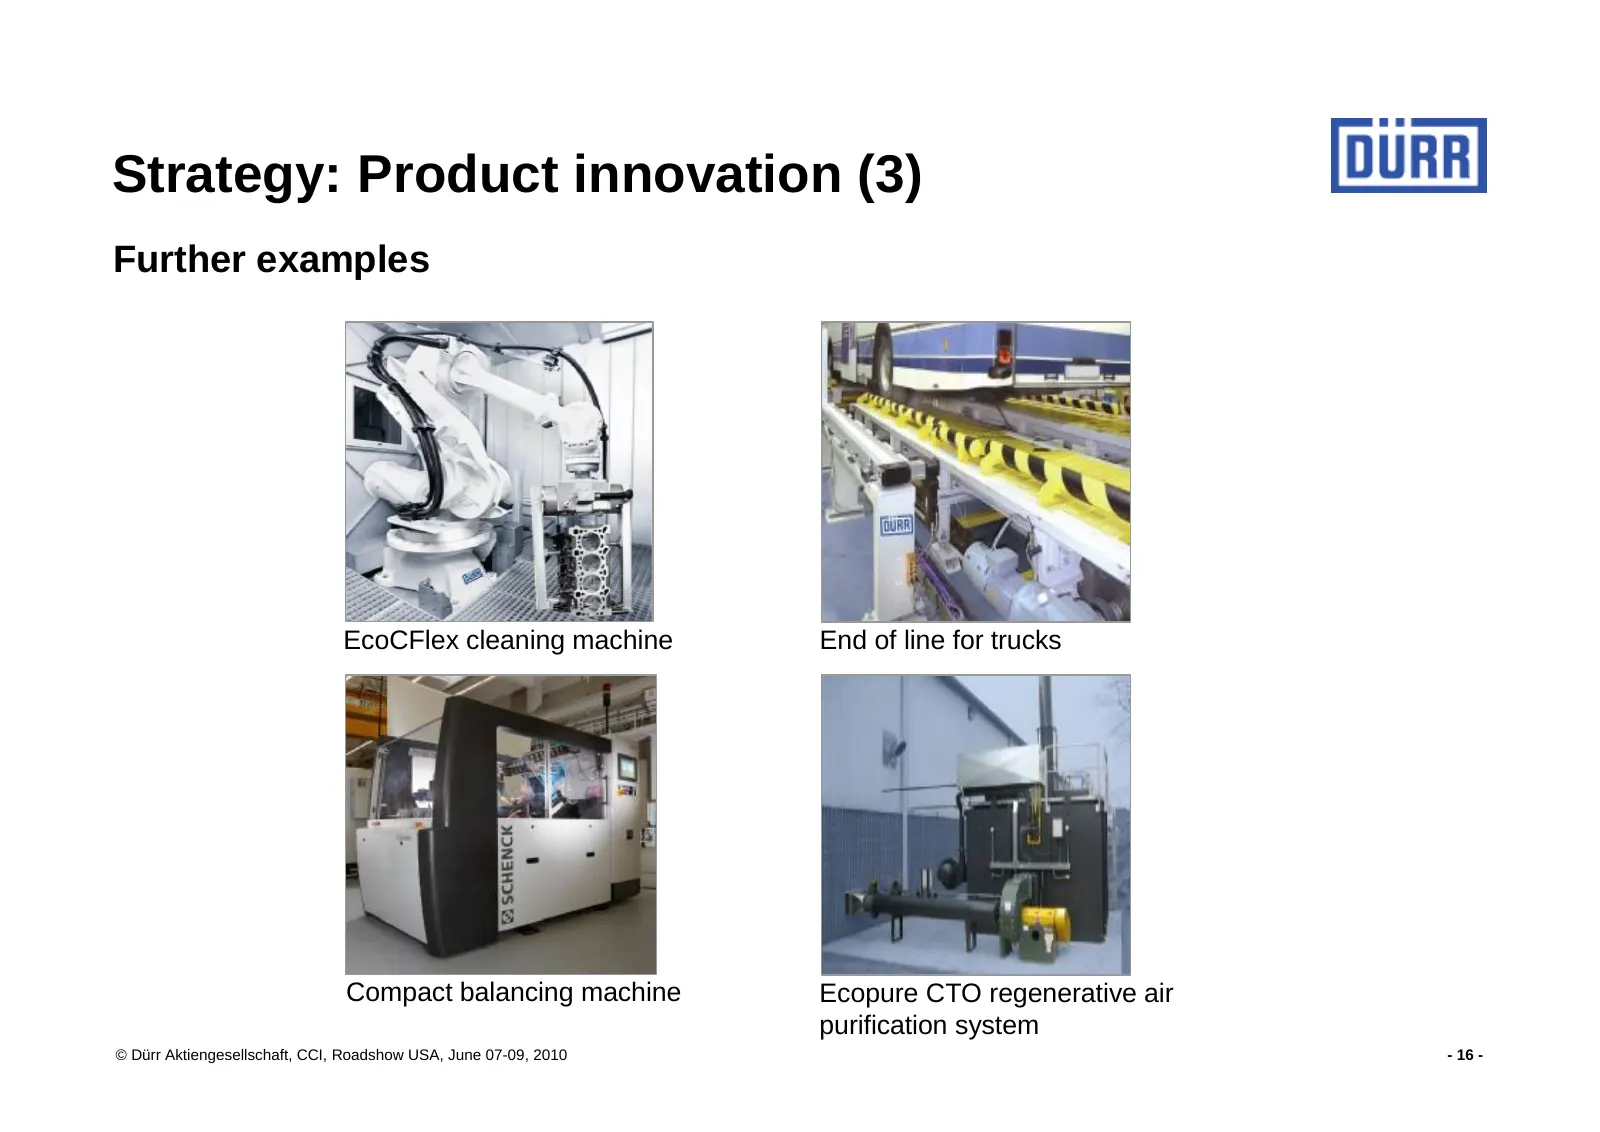
Strategy: Product innovation (3) Further examples EcoCFlex cleaning machine End of line for trucks Compact balancing machine Ecopure CTO regenerative air purification system © Dürr Aktiengesellschaft, CCI, Roadshow USA, June 07-09, 2010 - 16 -
Slide 17: Strategy: Growth in new business areas
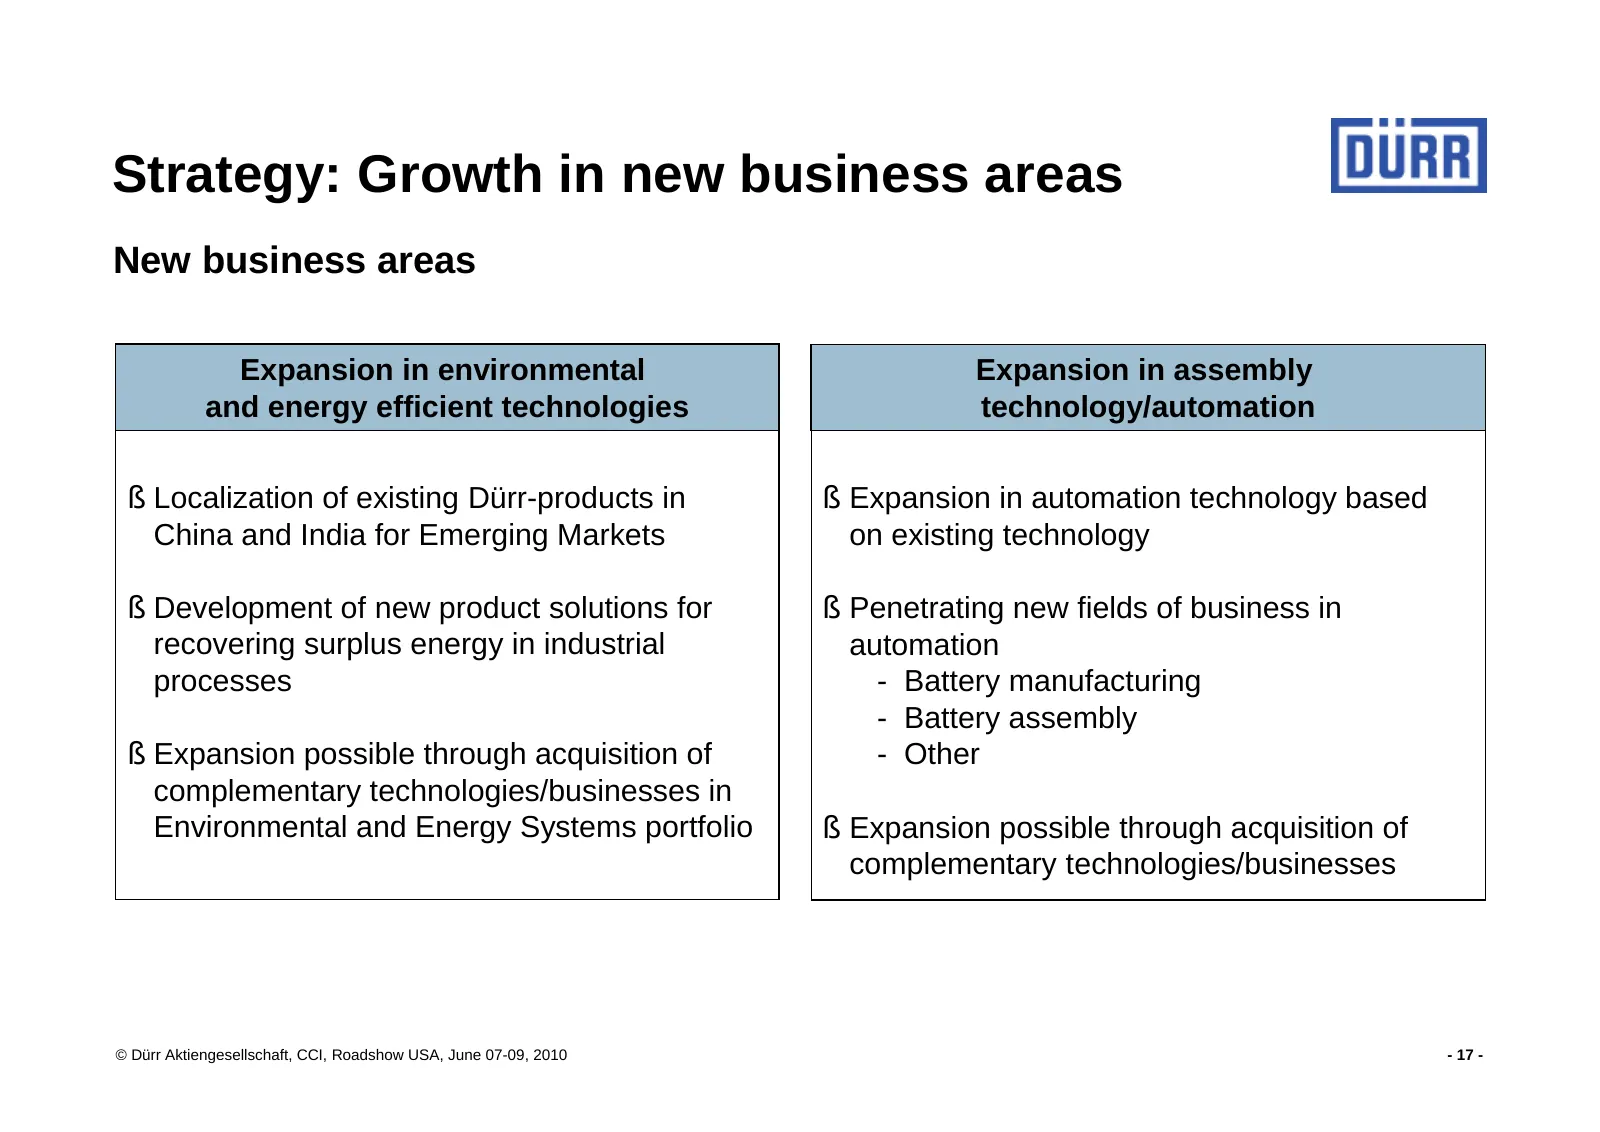
Strategy: Growth in new business areas New business areas Expansion in environmental Expansion in assembly and energy efficient technologies technology/automation § Localization of existing Dürr-products in § Expansion in automation technology based China and India for Emerging Markets on existing t
Slide 18: Strategy: Several acquisitions 2009/2010 to expand in new business areas
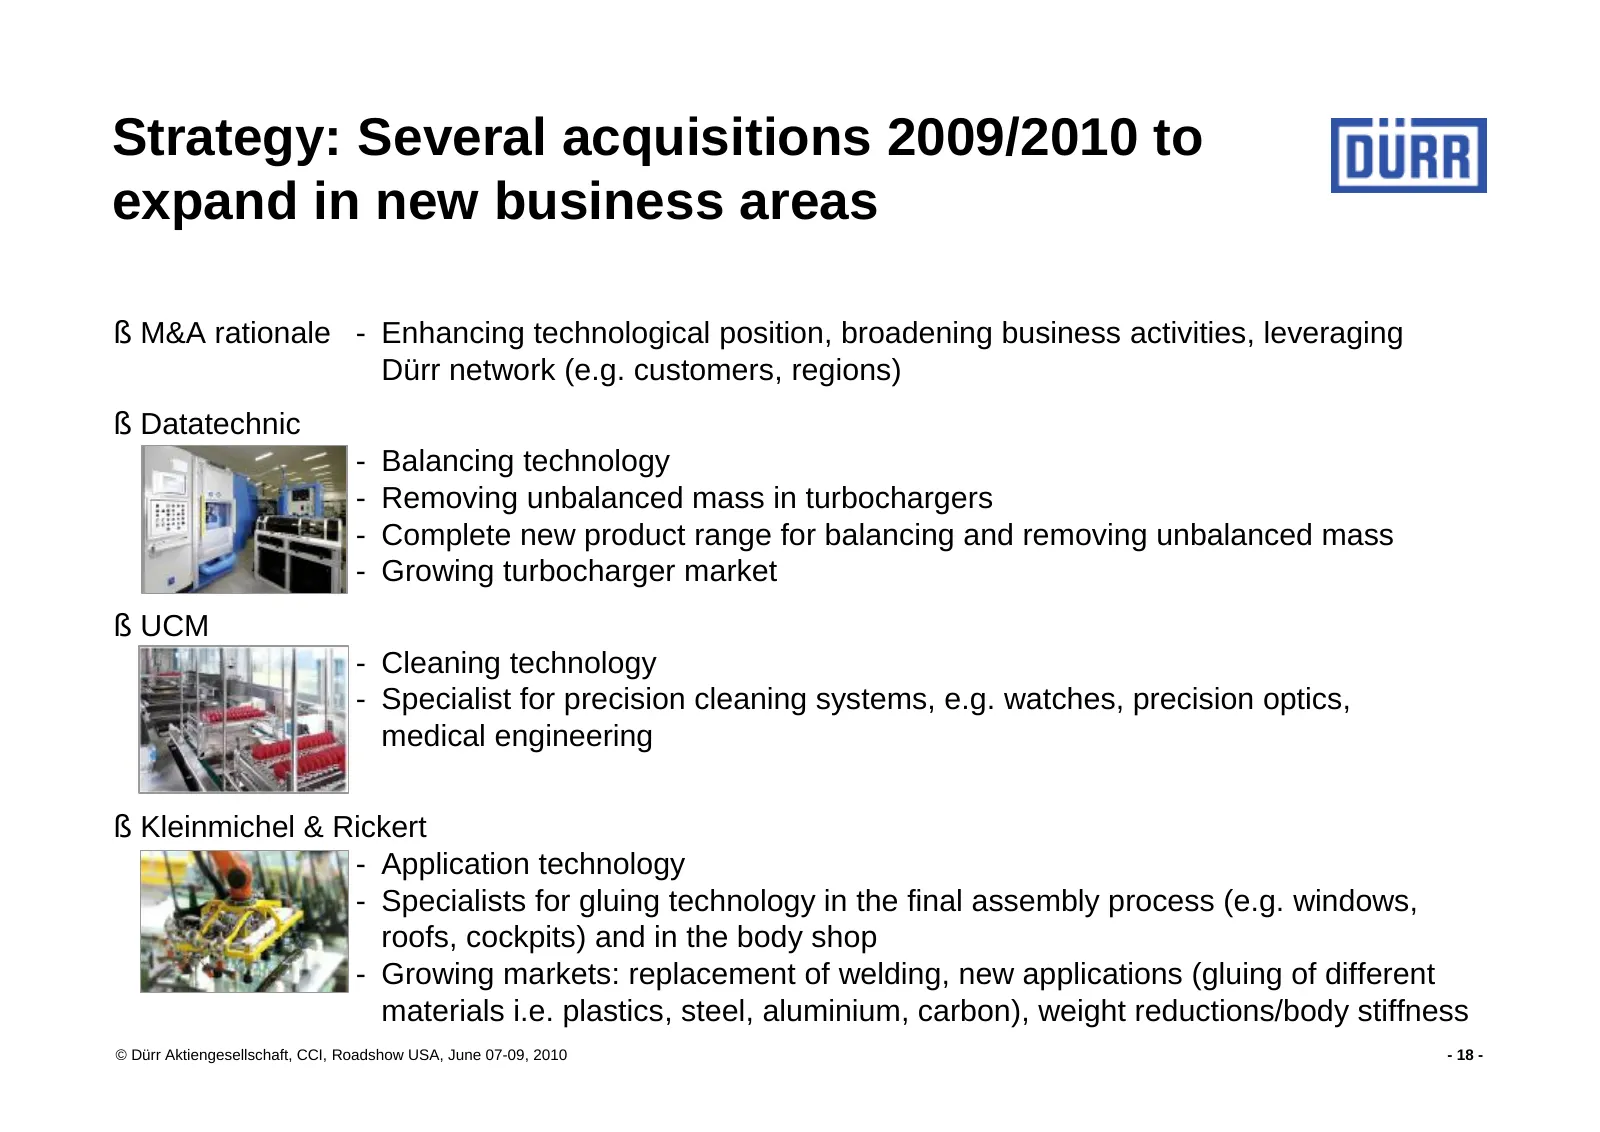
Strategy: Several acquisitions 2009/2010 to expand in new business areas § M&A rationale - Enhancing technological position, broadening business activities, leveraging Dürr network (e.g. customers, regions) § Datatechnic - Balancing technology - Removing unbalanced mass in turbochargers - Complete n
Slide 19: Strategy: Ongoing optimization process
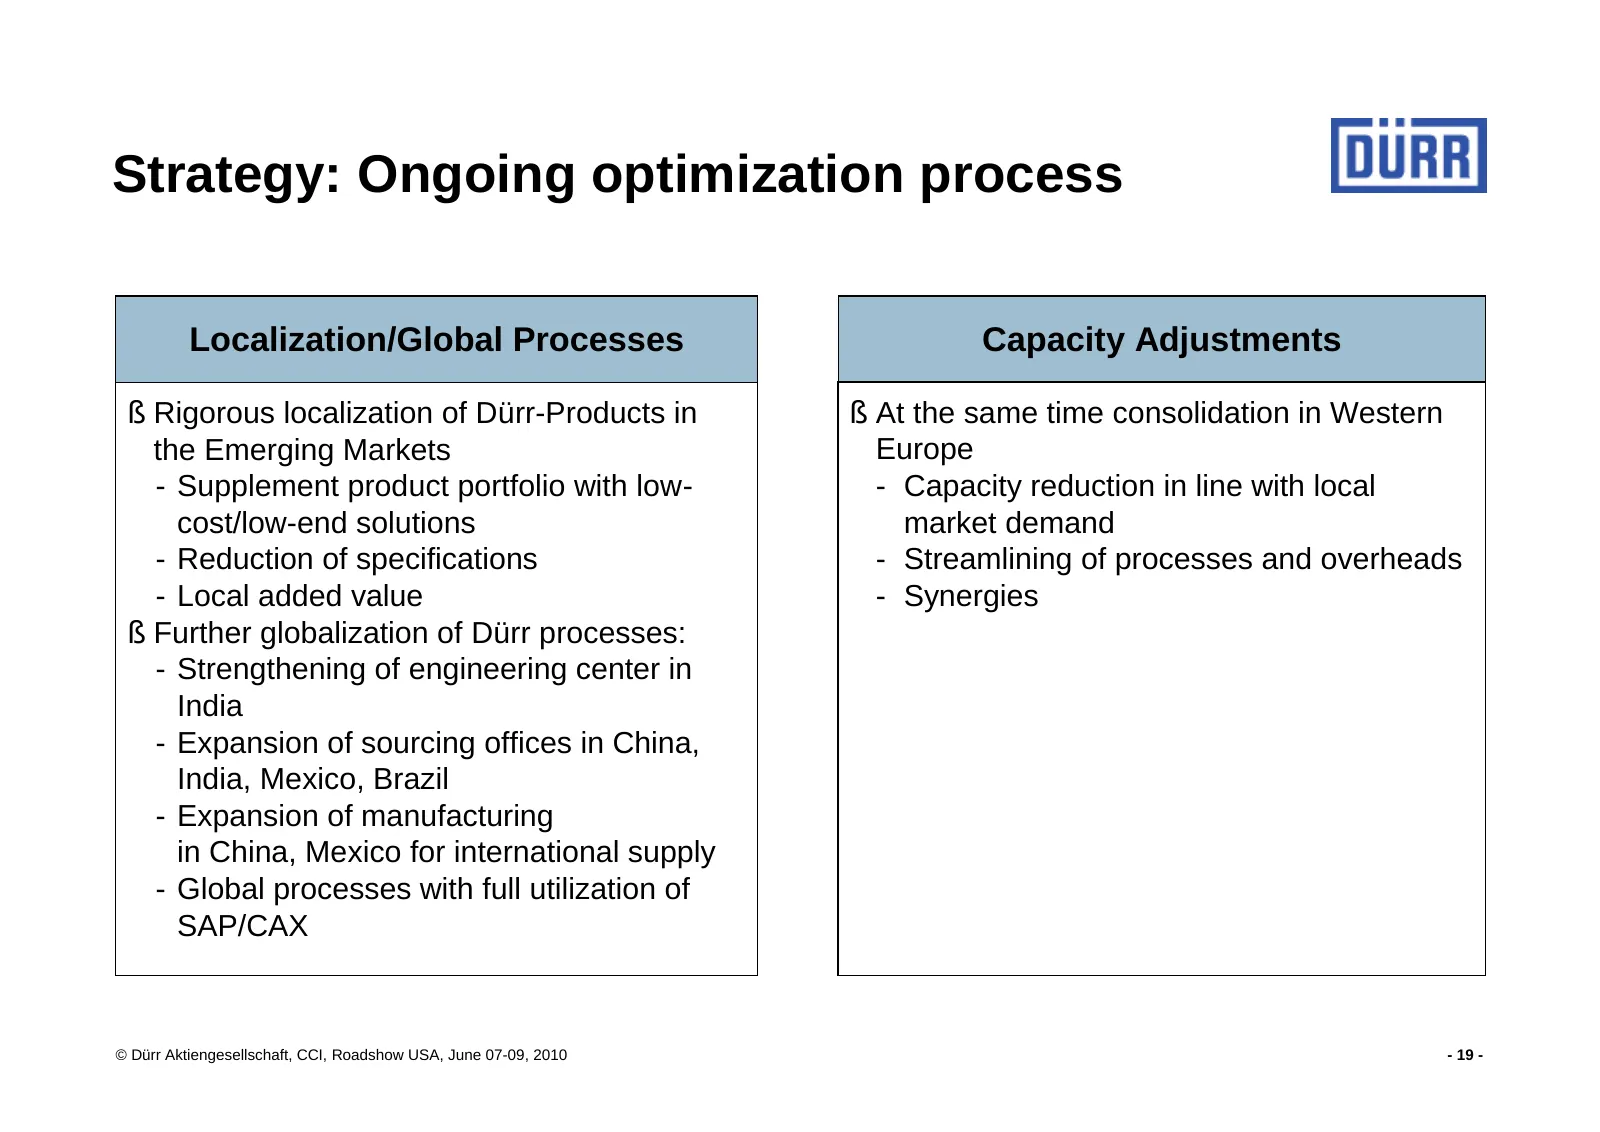
Strategy: Ongoing optimization process Localization/Global Processes Capacity Adjustments § Rigorous localization of Dürr-Products in § At the same time consolidation in Western the Emerging Markets Europe - Supplement product portfolio with low- - Capacity reduction in line with local cost/low-end
Slide 20: Agenda
Agenda 1. Dürr: Global leader with strong competitive position 2. Strategy 3. Financial overview and outlook © Dürr Aktiengesellschaft, CCI, Roadshow USA, June 07-09, 2010 - 20 -
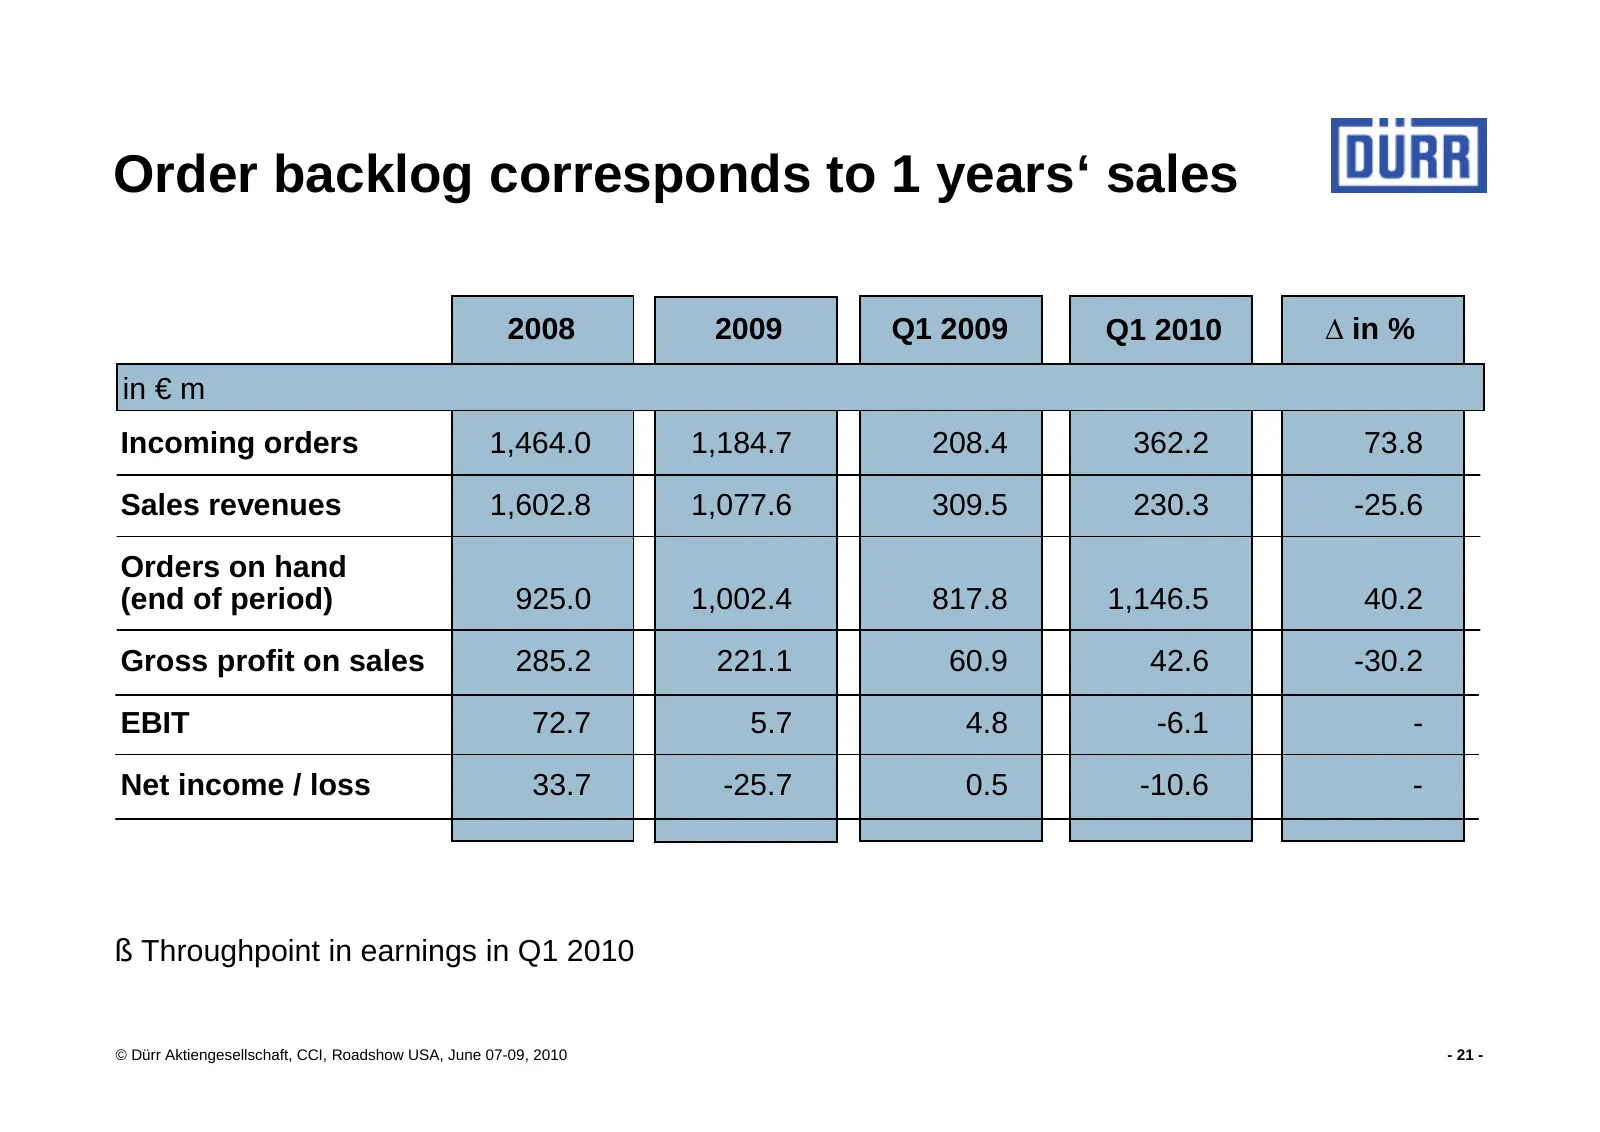
Slide 21: Order backlog corresponds to 1 years' sales
Order backlog corresponds to 1 years‘ sales 2008 2009 Q1 2009 Q1 2010 ∆ in % in € m Incoming orders 1,464.0 1,184.7 208.4 362.2 73.8 Sales revenues 1,602.8 1,077.6 309.5 230.3 -25.6 Orders on hand (end of period) 925.0 1,002.4 817.8 1,146.5 40.2 Gross profit on sales 285.2 221.1 60.9 42.6 -30.2 EBIT
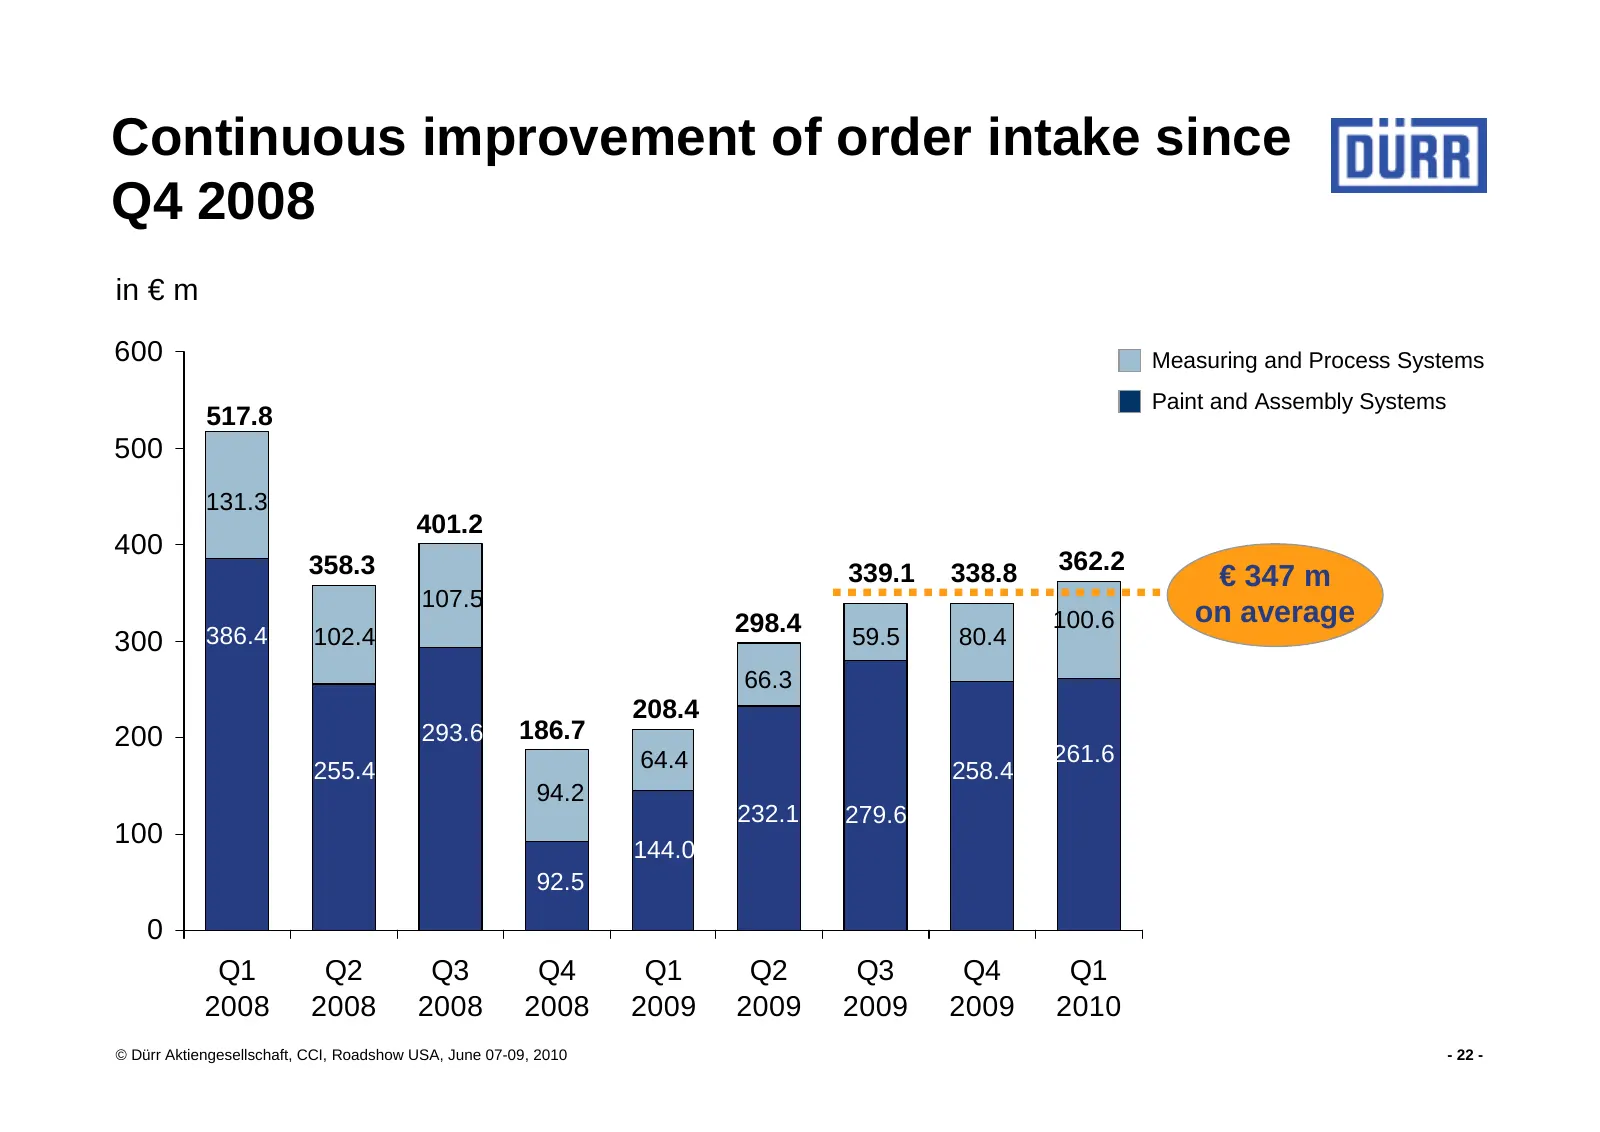
Slide 22: Continuous improvement of order intake since Q4 2008
Continuous improvement of order intake since Q4 2008 in € m 600 Measuring and Process Systems Paint and Assembly Systems 517.8 500 131.3 401.2 400 358.3 339.1 338.8 362.2 € 347 m 107.5 298.4 100.6 on average 300 386.4 102.4 59.5 80.4 66.3 208.4 200 293.6 186.7 64.4 261.6 255.4 258.4 94.2 232.1 279.6
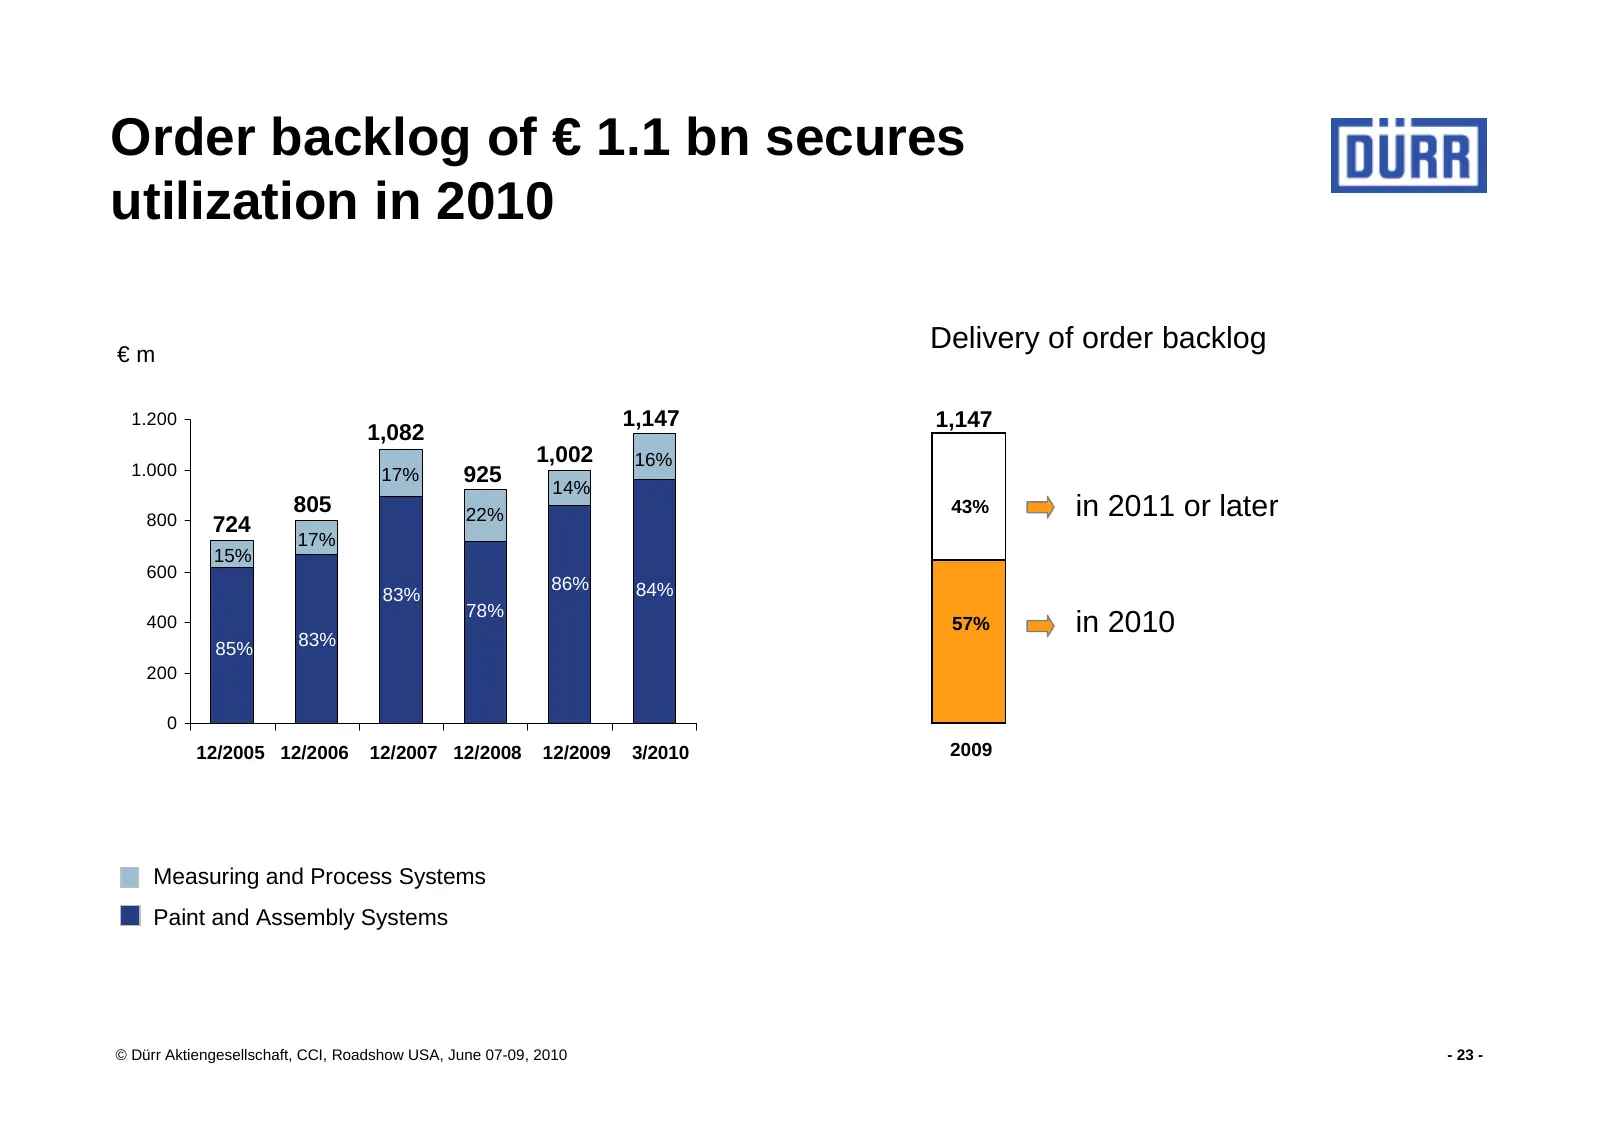
Slide 23: Order backlog of € 1.1 bn secures utilization in 2010
Order backlog of € 1.1 bn secures utilization in 2010 €m Delivery of order backlog 1.200 1,147 1,147 1,082 1,002 16% 1.000 17% 925 14% 800 805 22% 43% in 2011 or later 724 17% 15% 600 86% 84% 83% 78% 400 83% 57% in 2010 85% 200 0 12/2005 2005 12/2006 2006 12/2007 2007 12/2008 2008 12/2009 2009 3/201
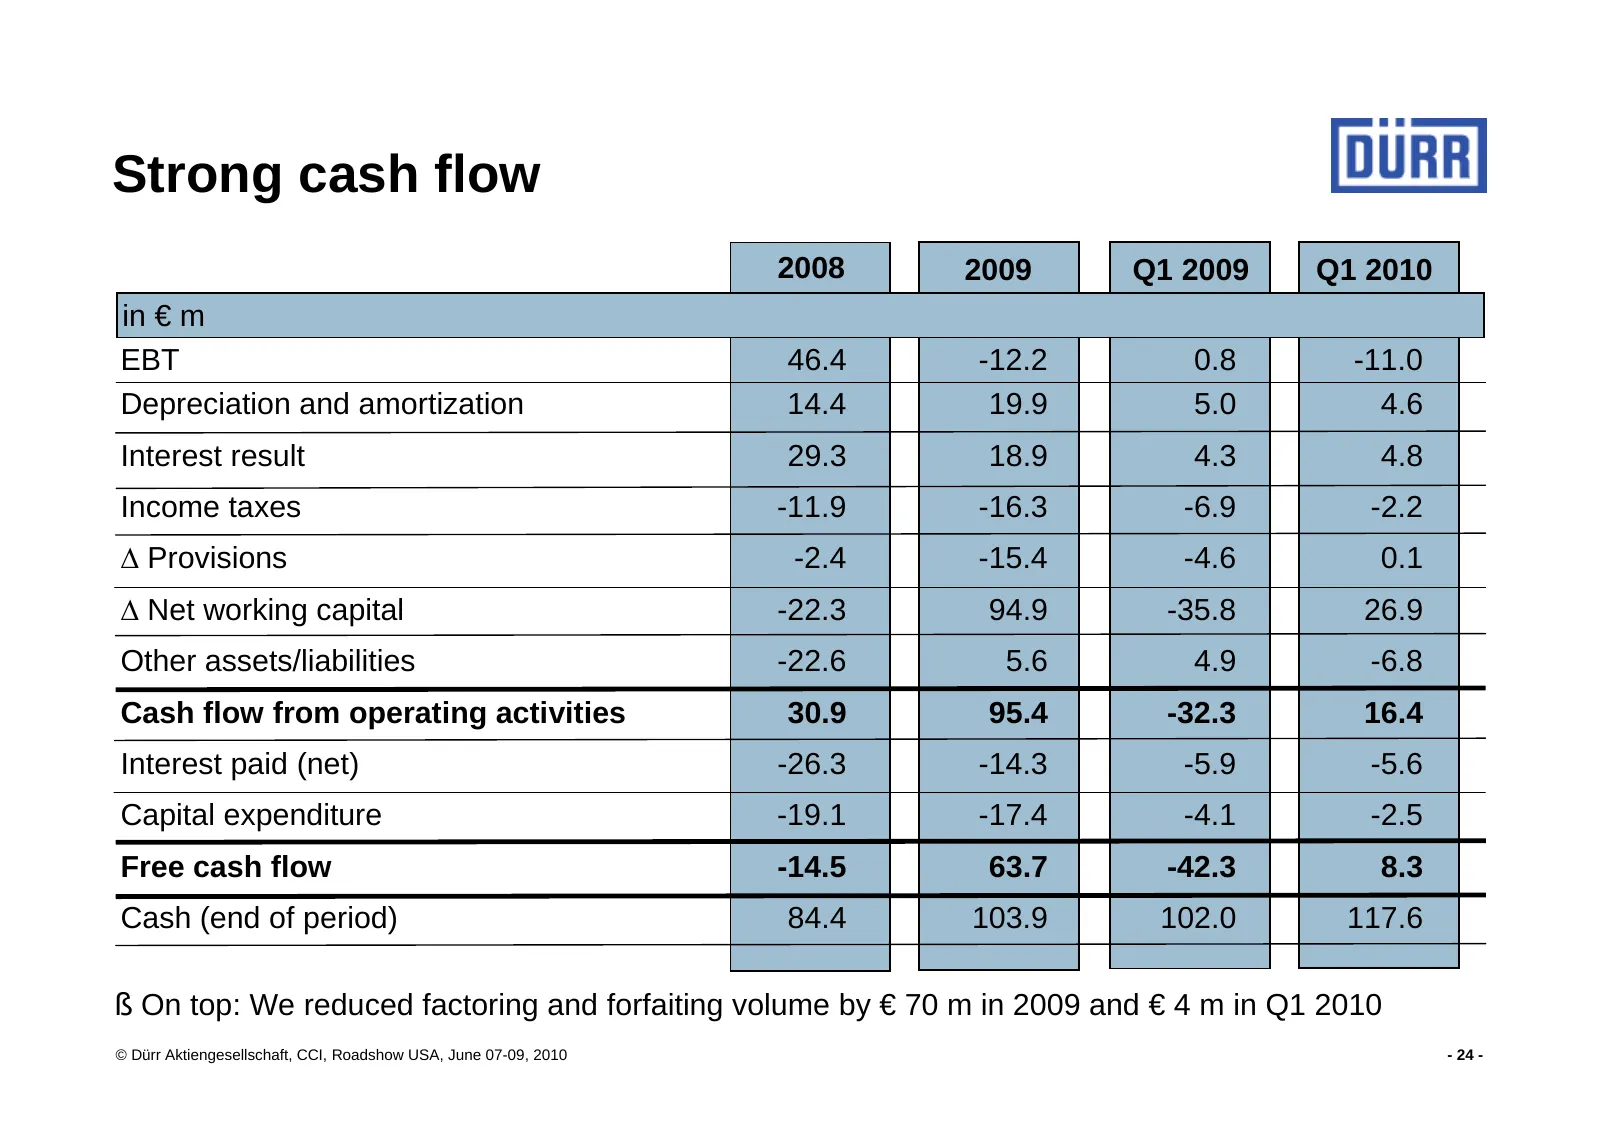
Slide 24: Strong cash flow
Strong cash flow 2008 2009 Q1 2009 Q1 2010 in € m EBT 46.4 -12.2 0.8 -11.0 Depreciation and amortization 14.4 19.9 5.0 4.6 Interest result 29.3 18.9 4.3 4.8 Income taxes -11.9 -16.3 -6.9 -2.2 ∆ Provisions -2.4 -15.4 -4.6 0.1 ∆ Net working capital -22.3 94.9 -35.8 26.9 Other assets/liabilities -22.6
Slide 25: Solid financial structure
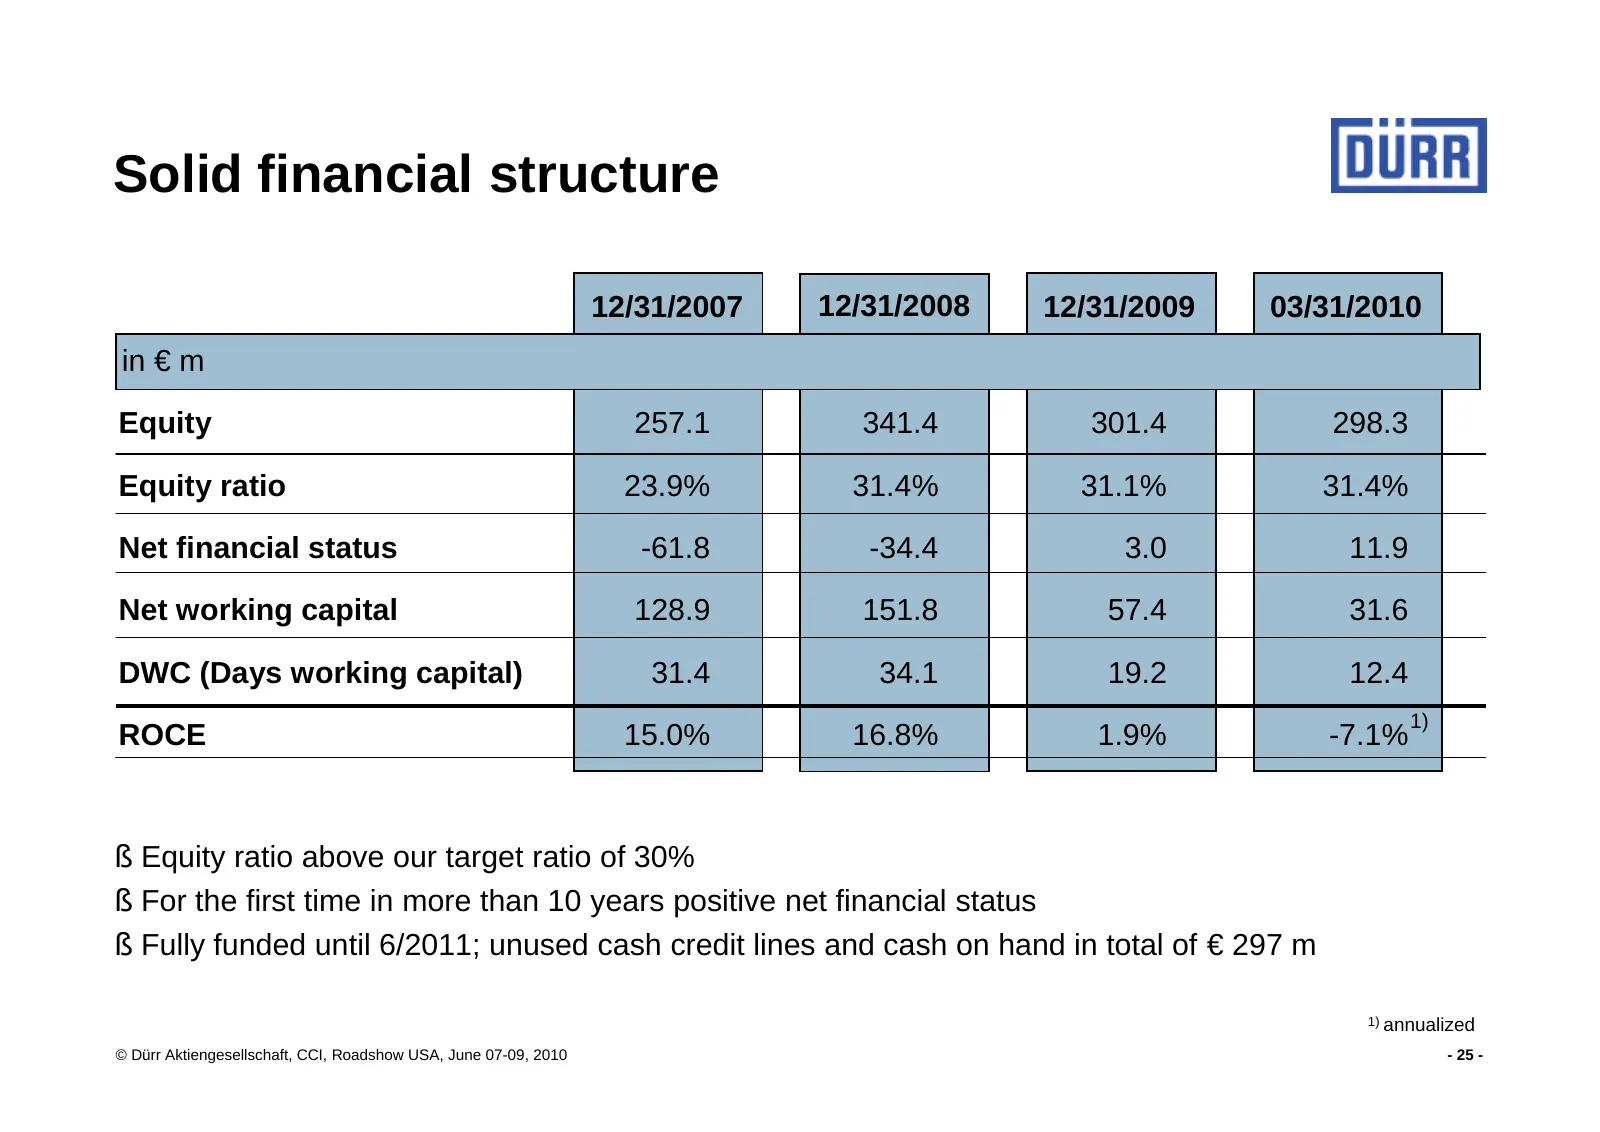
Solid financial structure 12/31/2007 12/31/2008 12/31/2009 03/31/2010 in € m Equity 257.1 341.4 301.4 298.3 Equity ratio 23.9% 31.4% 31.1% 31.4% Net financial status -61.8 -34.4 3.0 11.9 Net working capital 128.9 151.8 57.4 31.6 DWC (Days working capital) 31.4 34.1 19.2 12.4 1) ROCE 15.0% 16.8% 1.9%
Slide 26: Markets: Q1 2010 better than expected
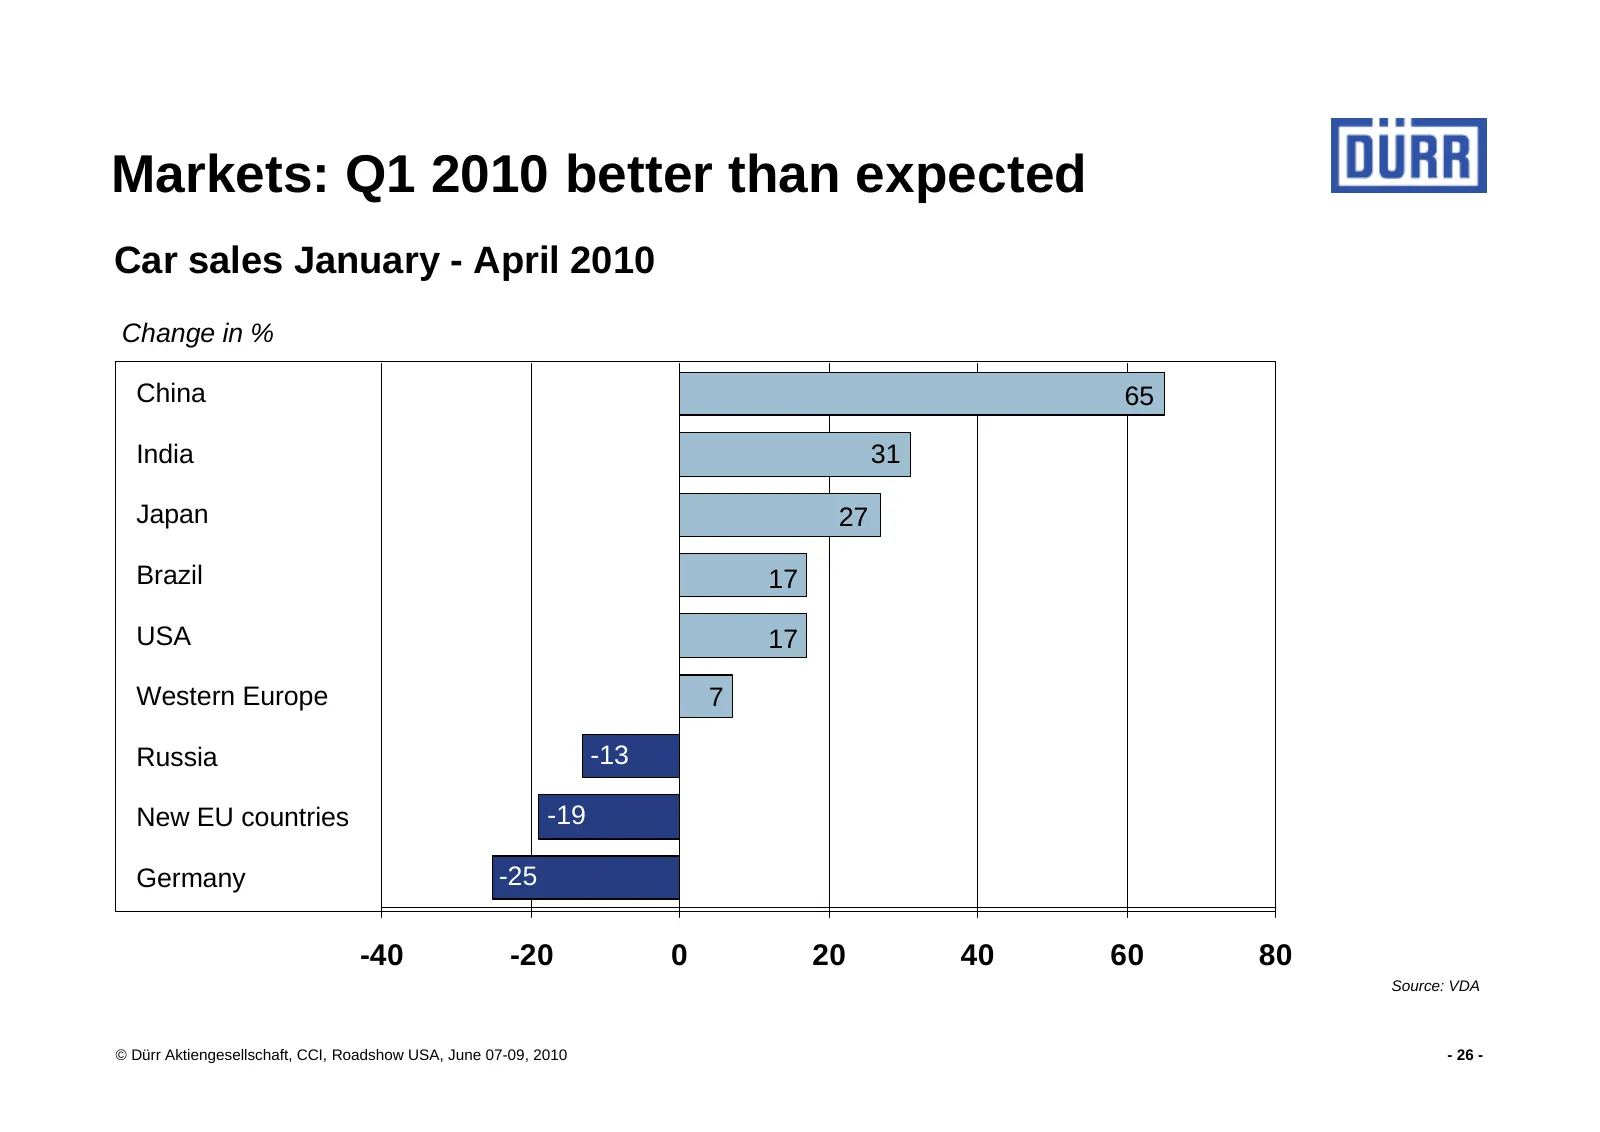
Markets: Q1 2010 better than expected Car sales January - April 2010 Change in % China 65 India 31 Japan 27 Brazil 17 USA 17 Western Europe 7 Russia -13 New EU countries -19 Germany -25 -40 -20 0 20 40 60 80 Source: VDA © Dürr Aktiengesellschaft, CCI, Roadshow USA, June 07-09, 2010 - 26 -
Slide 27: Markets and outlook
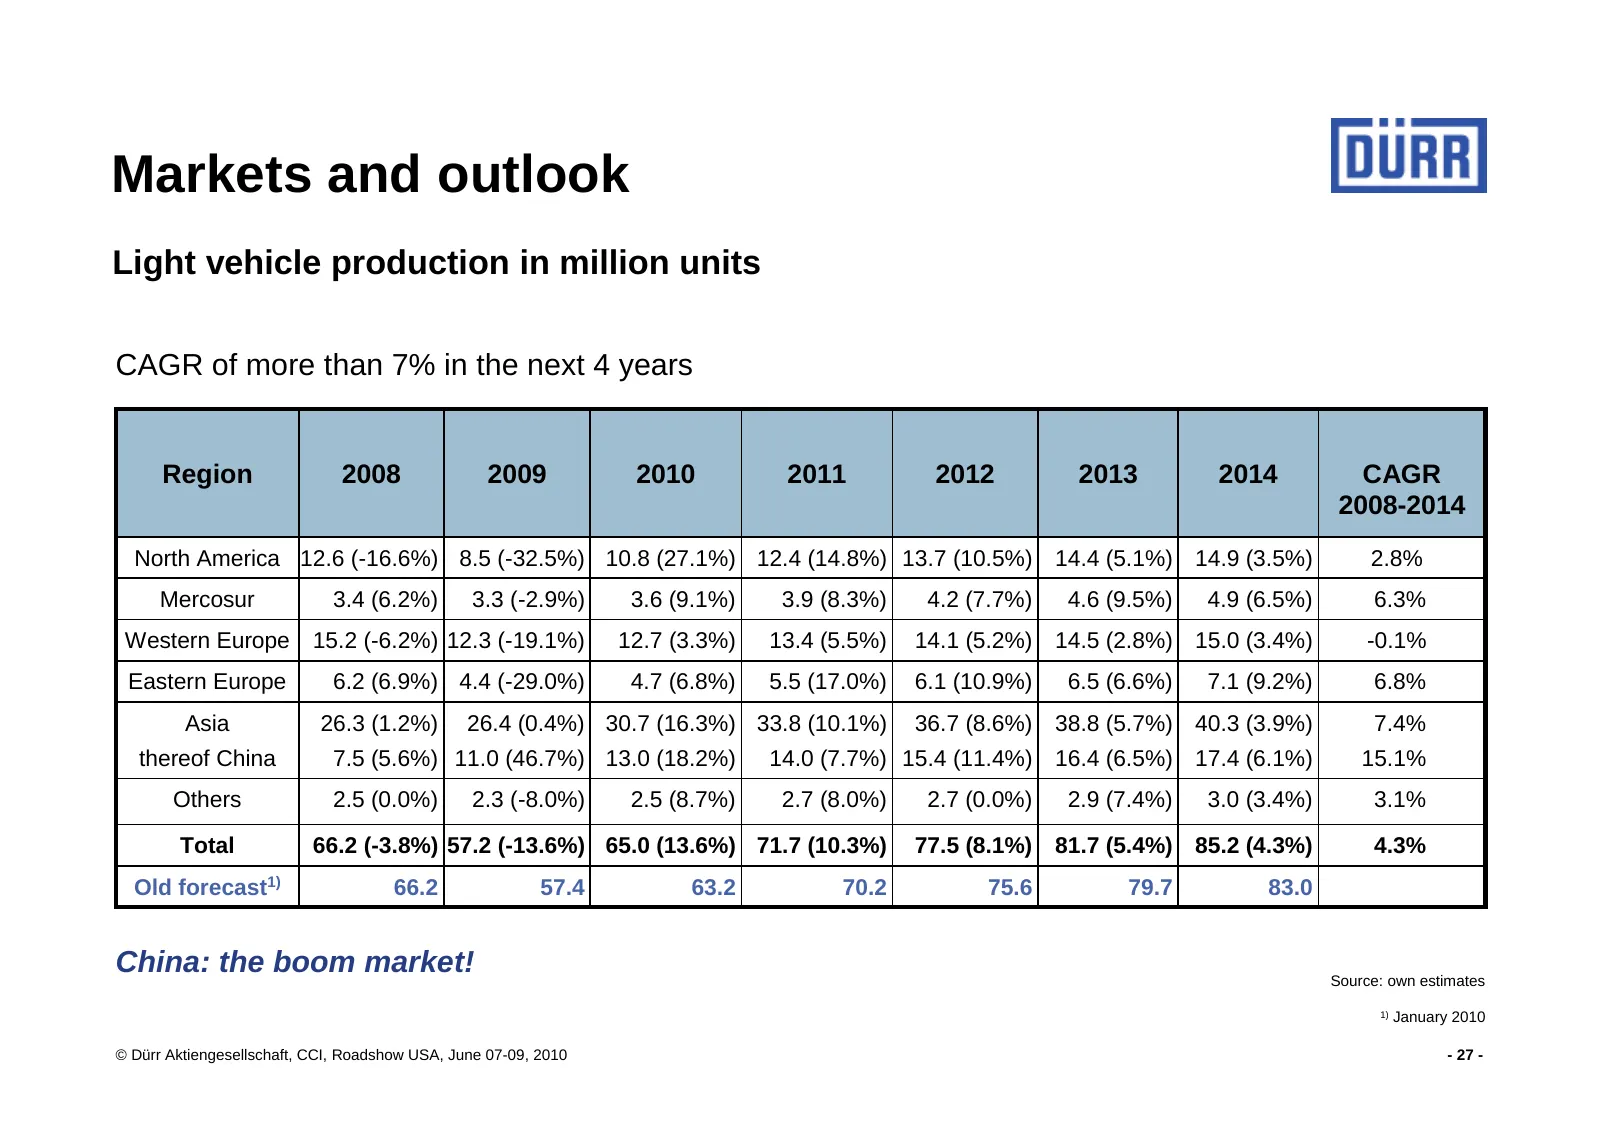
Markets and outlook Light vehicle production in million units CAGR of more than 7% in the next 4 years Region 2008 2009 2010 2011 2012 2013 2014 CAGR 2008-2014 North America 12.6 (-16.6%) 8.5 (-32.5%) 10.8 (27.1%) 12.4 (14.8%) 13.7 (10.5%) 14.4 (5.1%) 14.9 (3.5%) 2.8% Mercosur 3.4 (6.2%) 3.3 (-2.9%)
Slide 28: Outlook worldwide: automobile production to recover strongly in 2010 and 2011
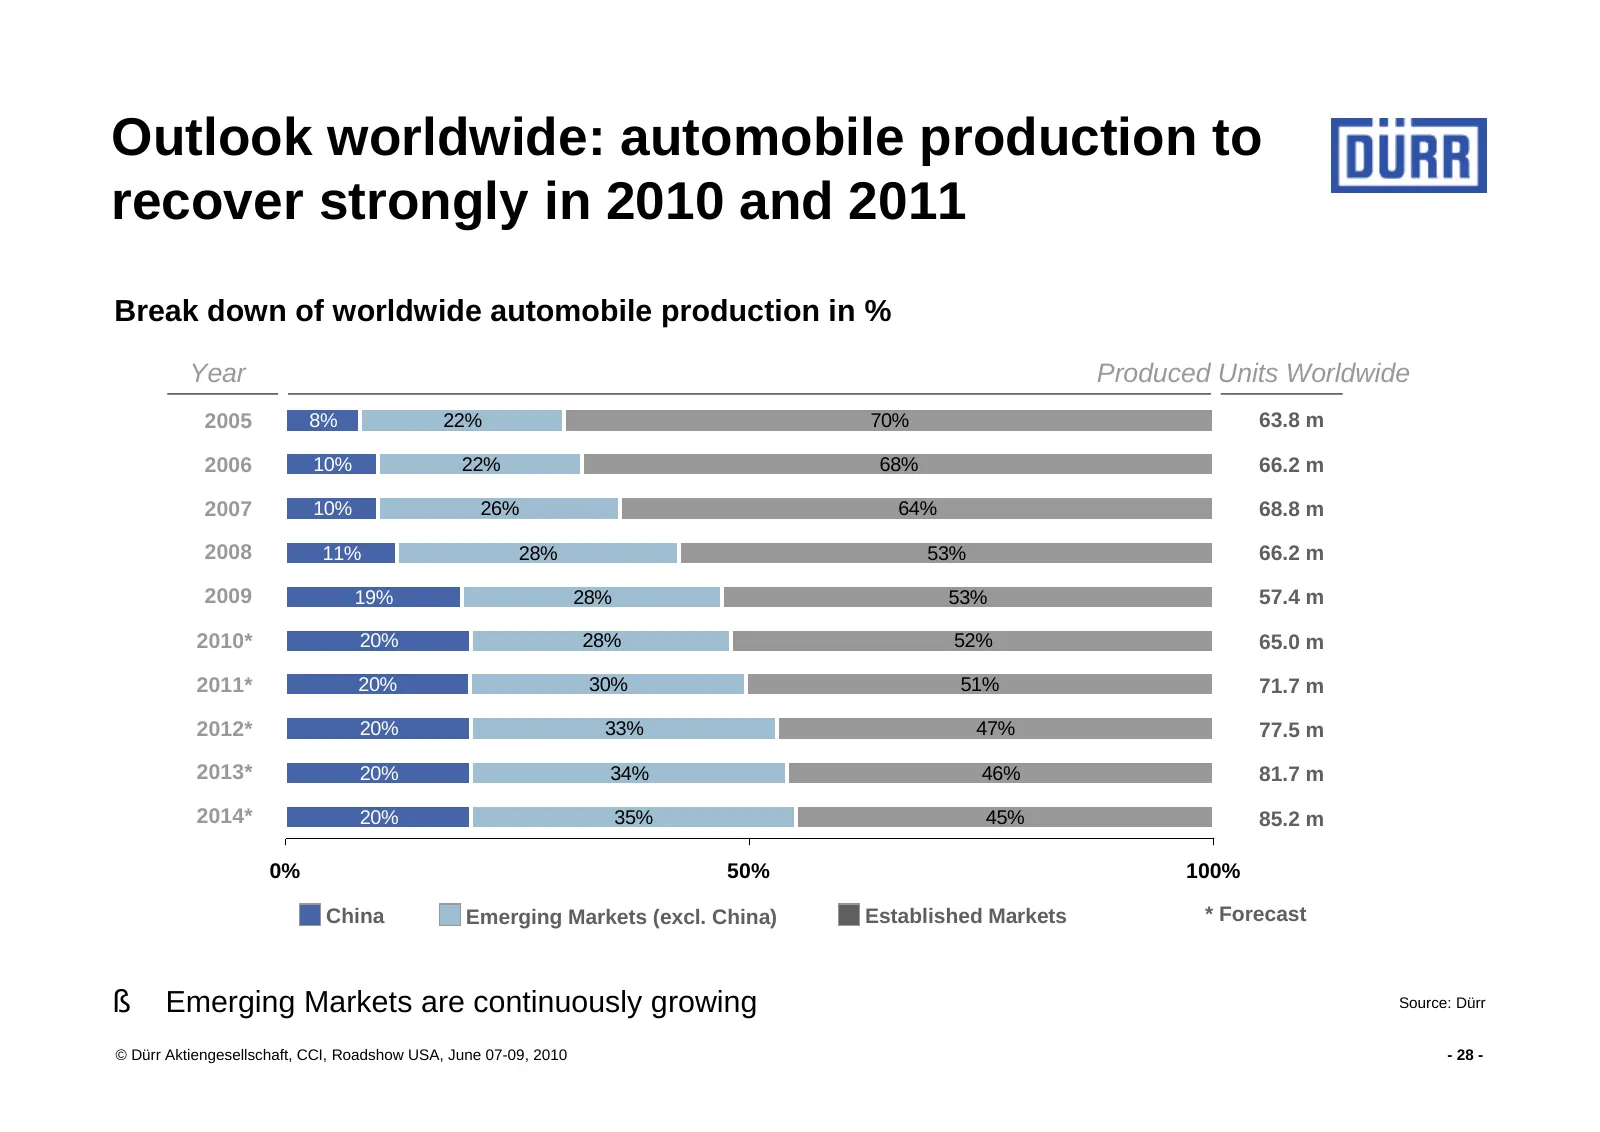
Outlook worldwide: automobile production to recover strongly in 2010 and 2011 Break down of worldwide automobile production in % Year Produced Units Worldwide 2005 8% 22% 70% 63.8 m 2006 10% 22% 68% 66.2 m 2007 10% 26% 64% 68.8 m 2008 11% 28% 53% 66.2 m 2009 19% 28% 53% 57.4 m 2010* 20% 28% 52% 65.0
Slide 29: Outlook: Growth ahead
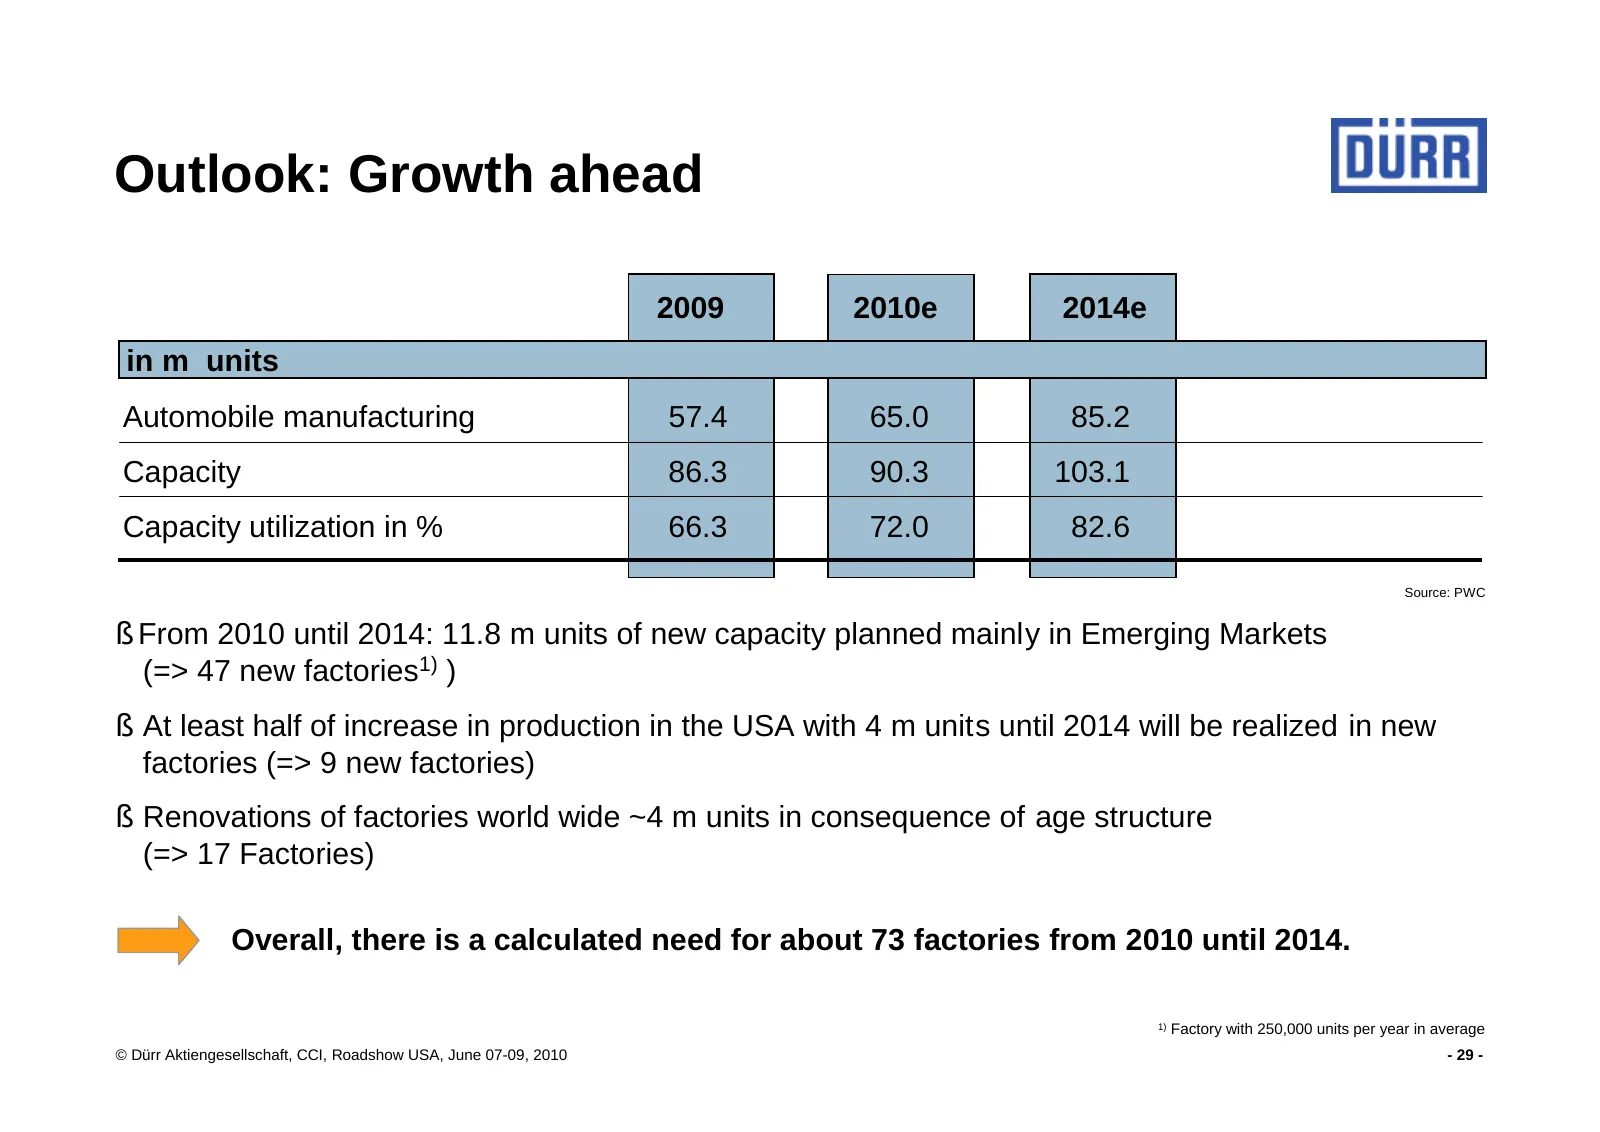
Outlook: Growth ahead 2009 2010e 2014e in m units Automobile manufacturing 57.4 65.0 85.2 Capacity 86.3 90.3 103.1 Capacity utilization in % 66.3 72.0 82.6 Source: PWC § From 2010 until 2014: 11.8 m units of new capacity planned mainly in Emerging Markets (=> 47 new factories1) ) § At least half of
Slide 30: Markets and outlook: Strong recovery
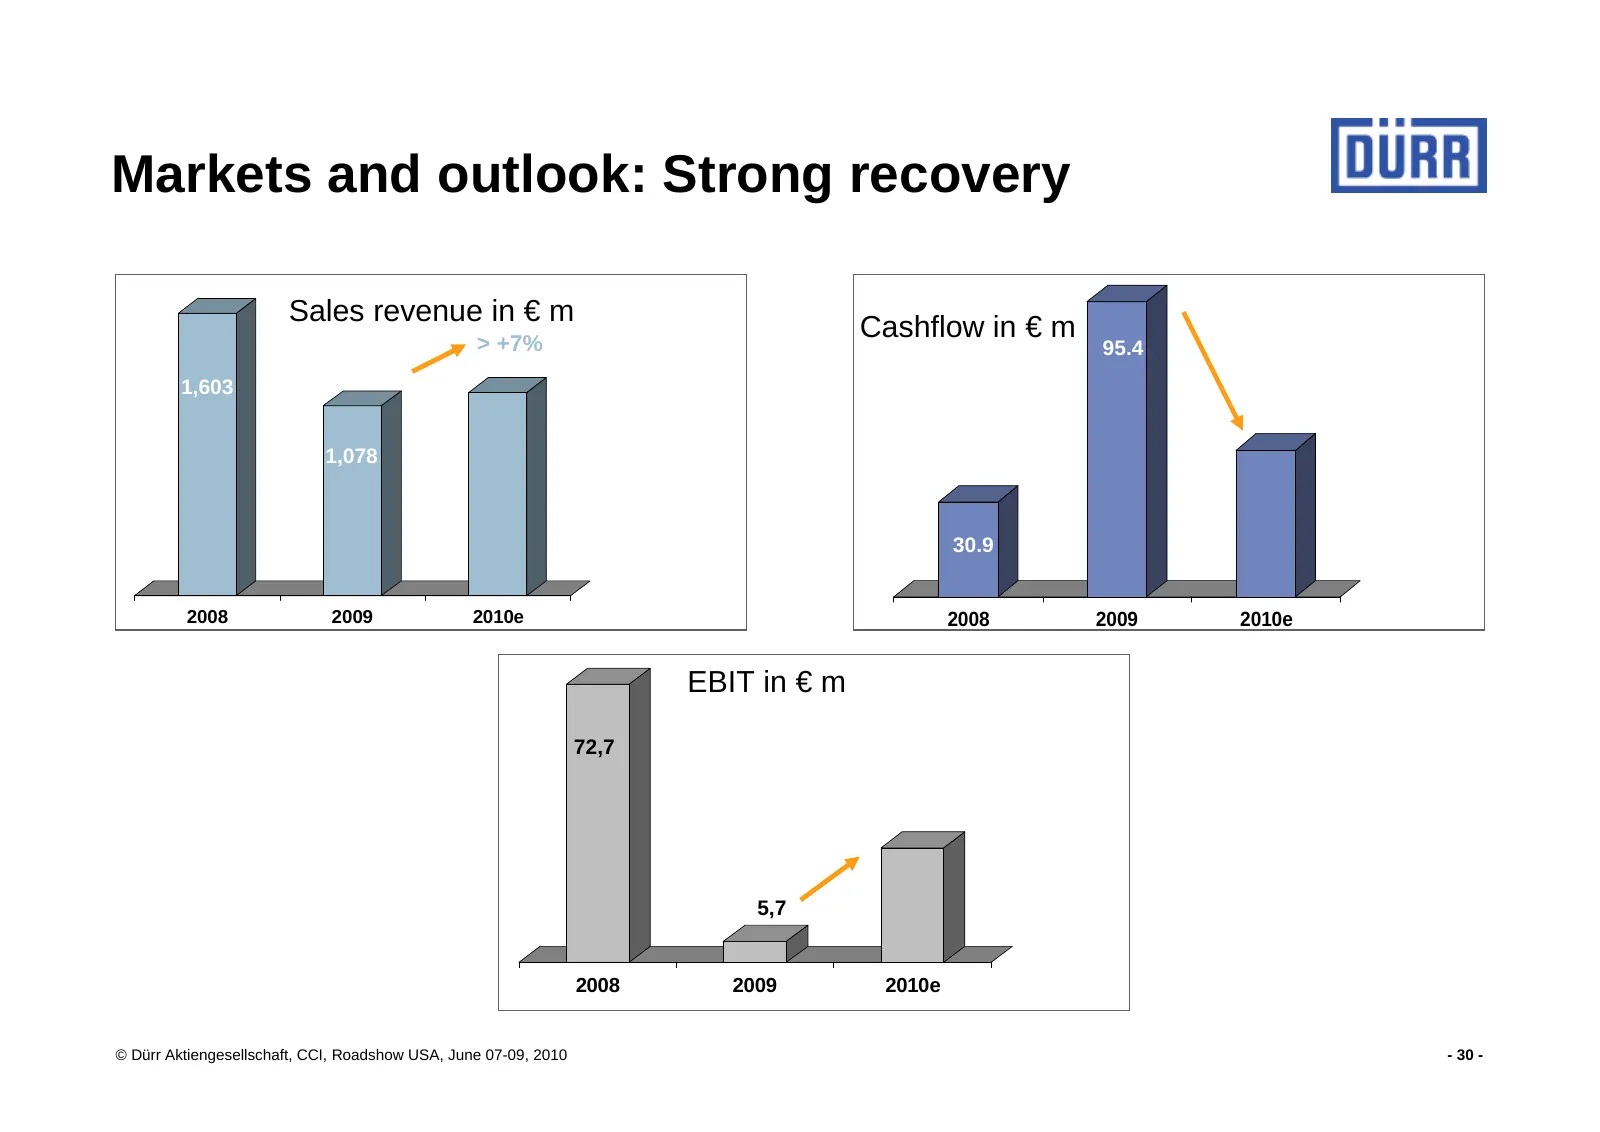
Markets and outlook: Strong recovery Sales revenue in € m > +7% Cashflow in € m 95.4 1,603 1,078 30.9 2008 2009 2010e 2008 2009 2010e EBIT in € m 72,7 5,7 2008 2009 2010e © Dürr Aktiengesellschaft, CCI, Roadshow USA, June 07-09, 2010 - 30 -
Slide 31: Outlook: Improving market conditions, positioning for growth
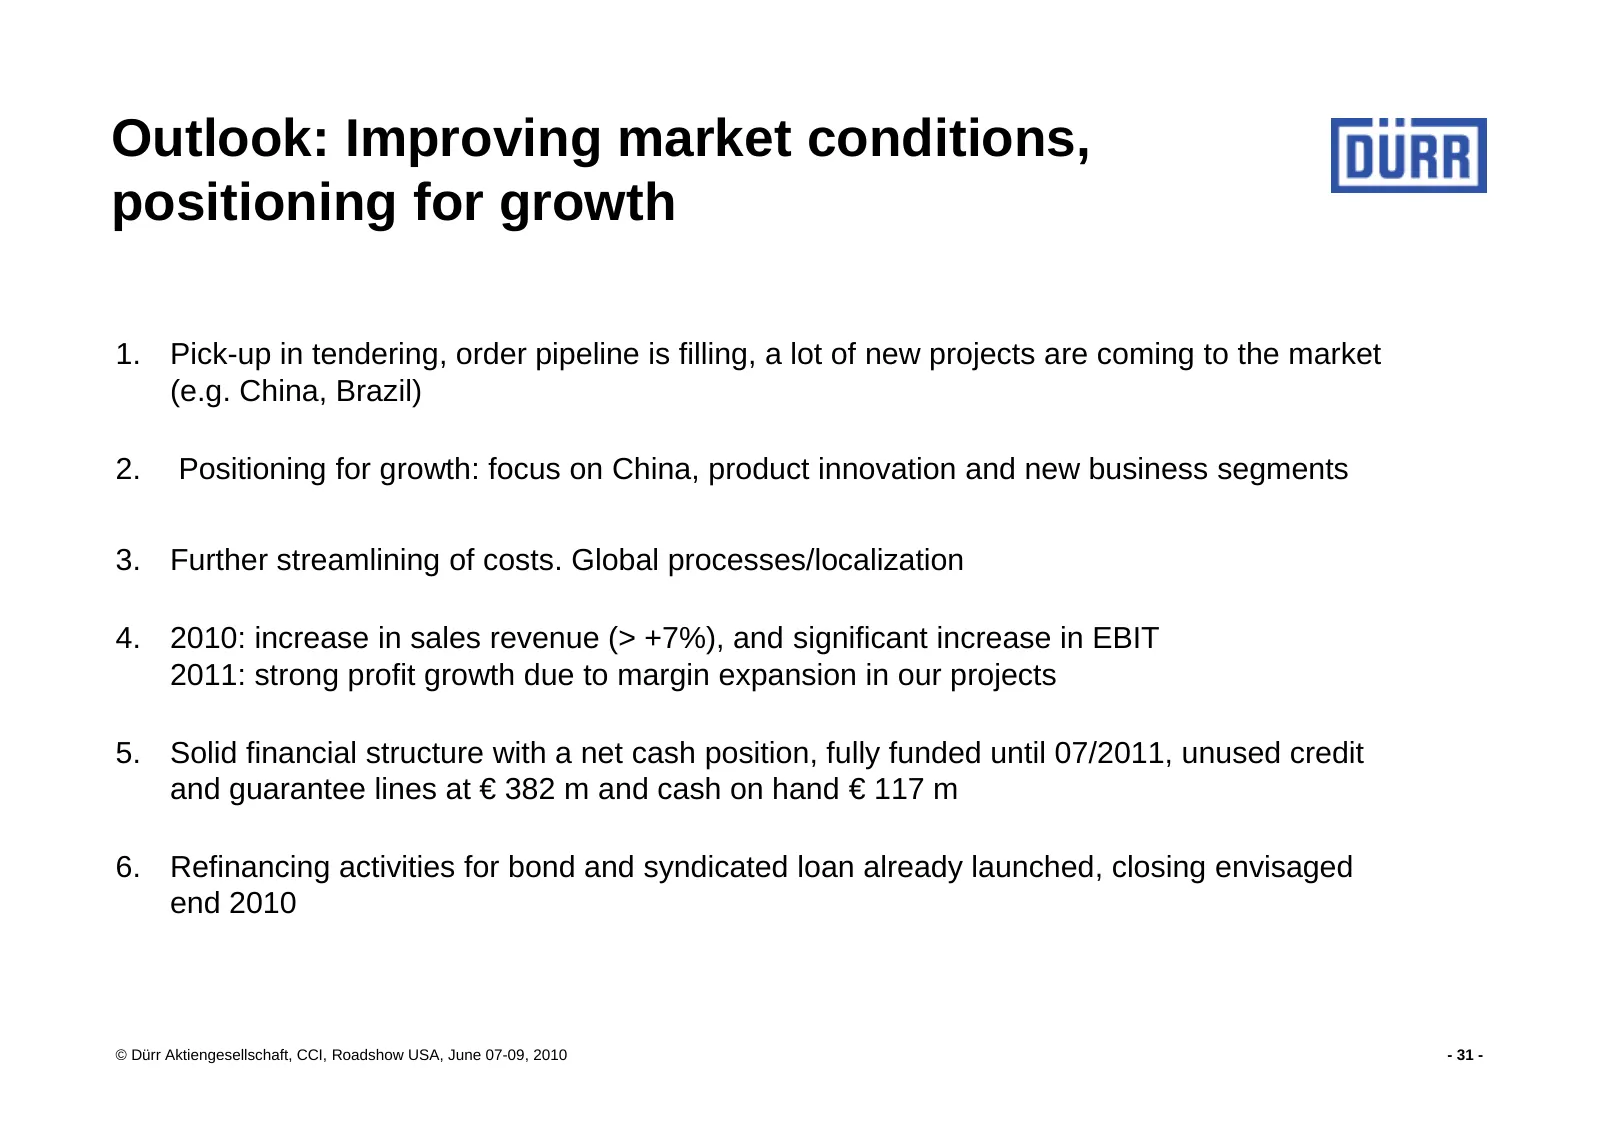
Outlook: Improving market conditions, positioning for growth 1. Pick-up in tendering, order pipeline is filling, a lot of new projects are coming to the market (e.g. China, Brazil) 2. Positioning for growth: focus on China, product innovation and new business segments 3. Further streamlining of cost
Slide 32: Drivers for future business growth
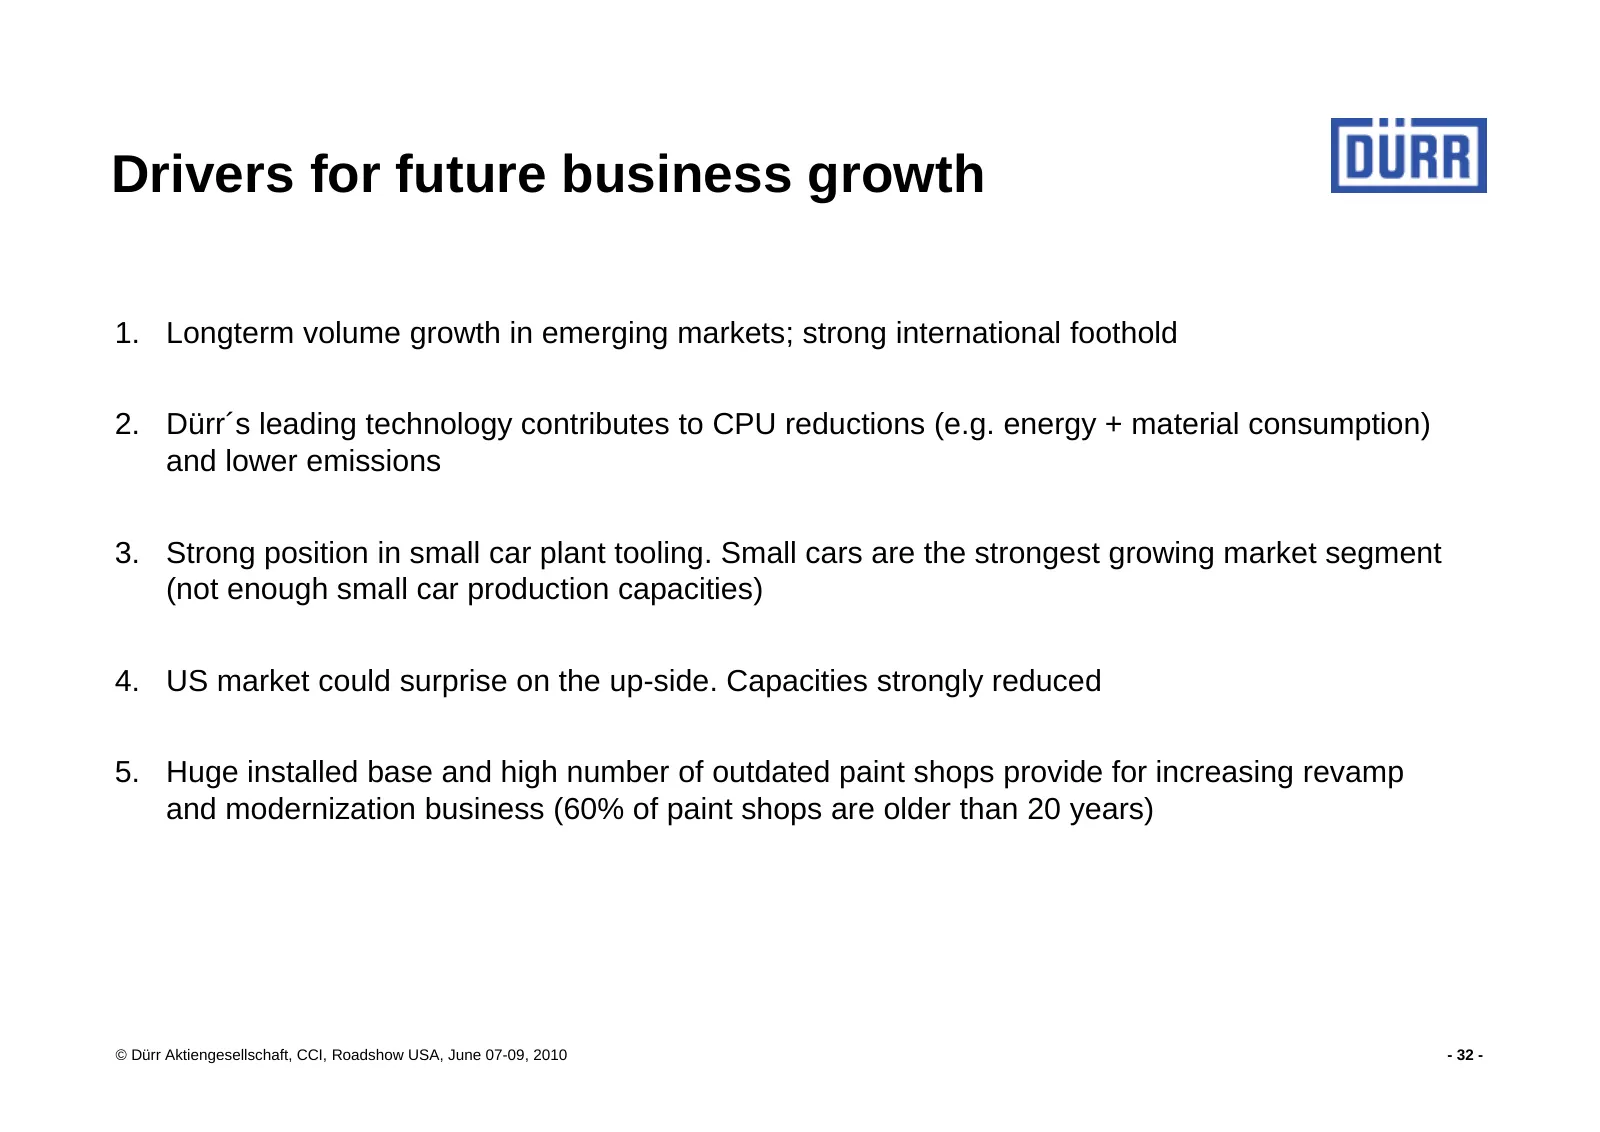
Drivers for future business growth 1. Longterm volume growth in emerging markets; strong international foothold 2. Dürr´s leading technology contributes to CPU reductions (e.g. energy + material consumption) and lower emissions 3. Strong position in small car plant tooling. Small cars are the strong
Slide 33: Financial calendar
Financial calendar 08/05/2010 Interim financial report for the first half of 2010 11/03/2010 Interim report for the first nine months of 2010 Contact: Dürr Aktiengesellschaft Günter Dielmann Corporate Communications & Investor Relations Carl-Benz-Str. 34 74321 Bietigheim-Bissingen Germany Phone: +49
Slide 34: © Dürr Aktiengesellschaft, CCI, Roadshow USA, June 07-09, 2010
© Dürr Aktiengesellschaft, CCI, Roadshow USA, June 07-09, 2010 - 34 -
Slide 35: Management
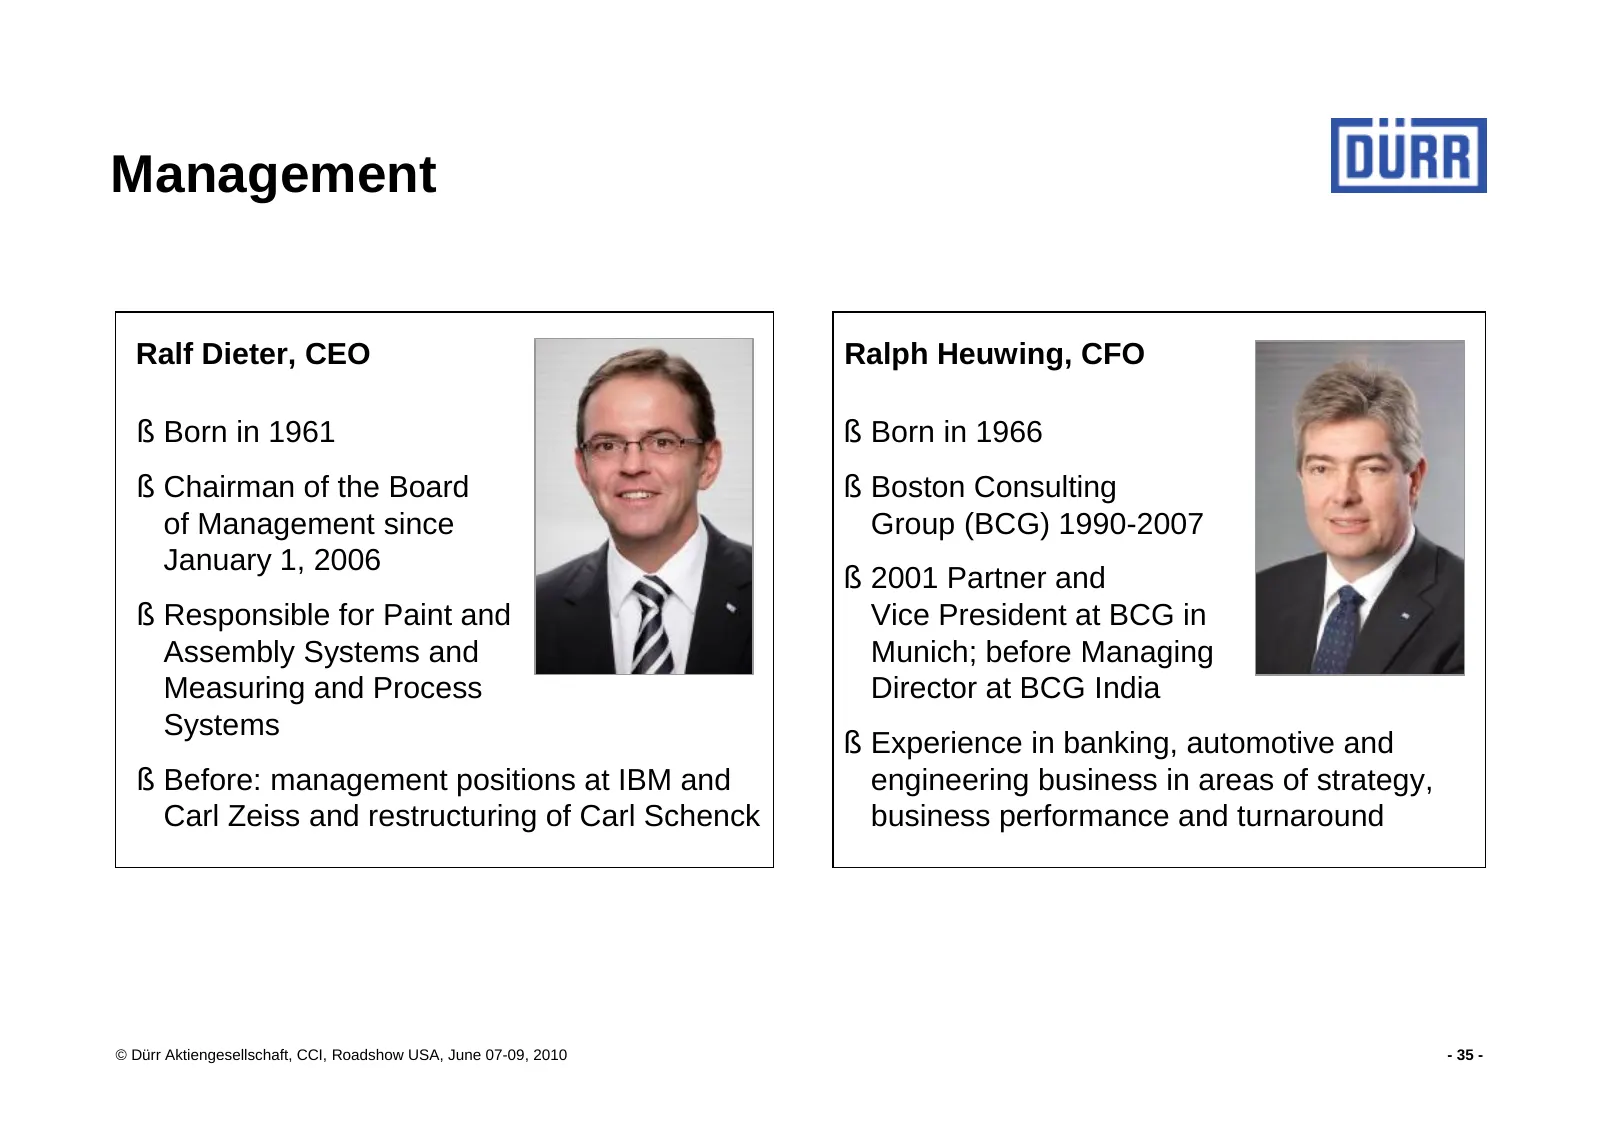
Management Ralf Dieter, CEO Ralph Heuwing, CFO § Born in 1961 § Born in 1966 § Chairman of the Board § Boston Consulting of Management since Group (BCG) 1990-2007 January 1, 2006 § 2001 Partner and § Responsible for Paint and Vice President at BCG in Assembly Systems and Munich; before Managing Meas
Slide 36: Shareholder structure June 1, 2010
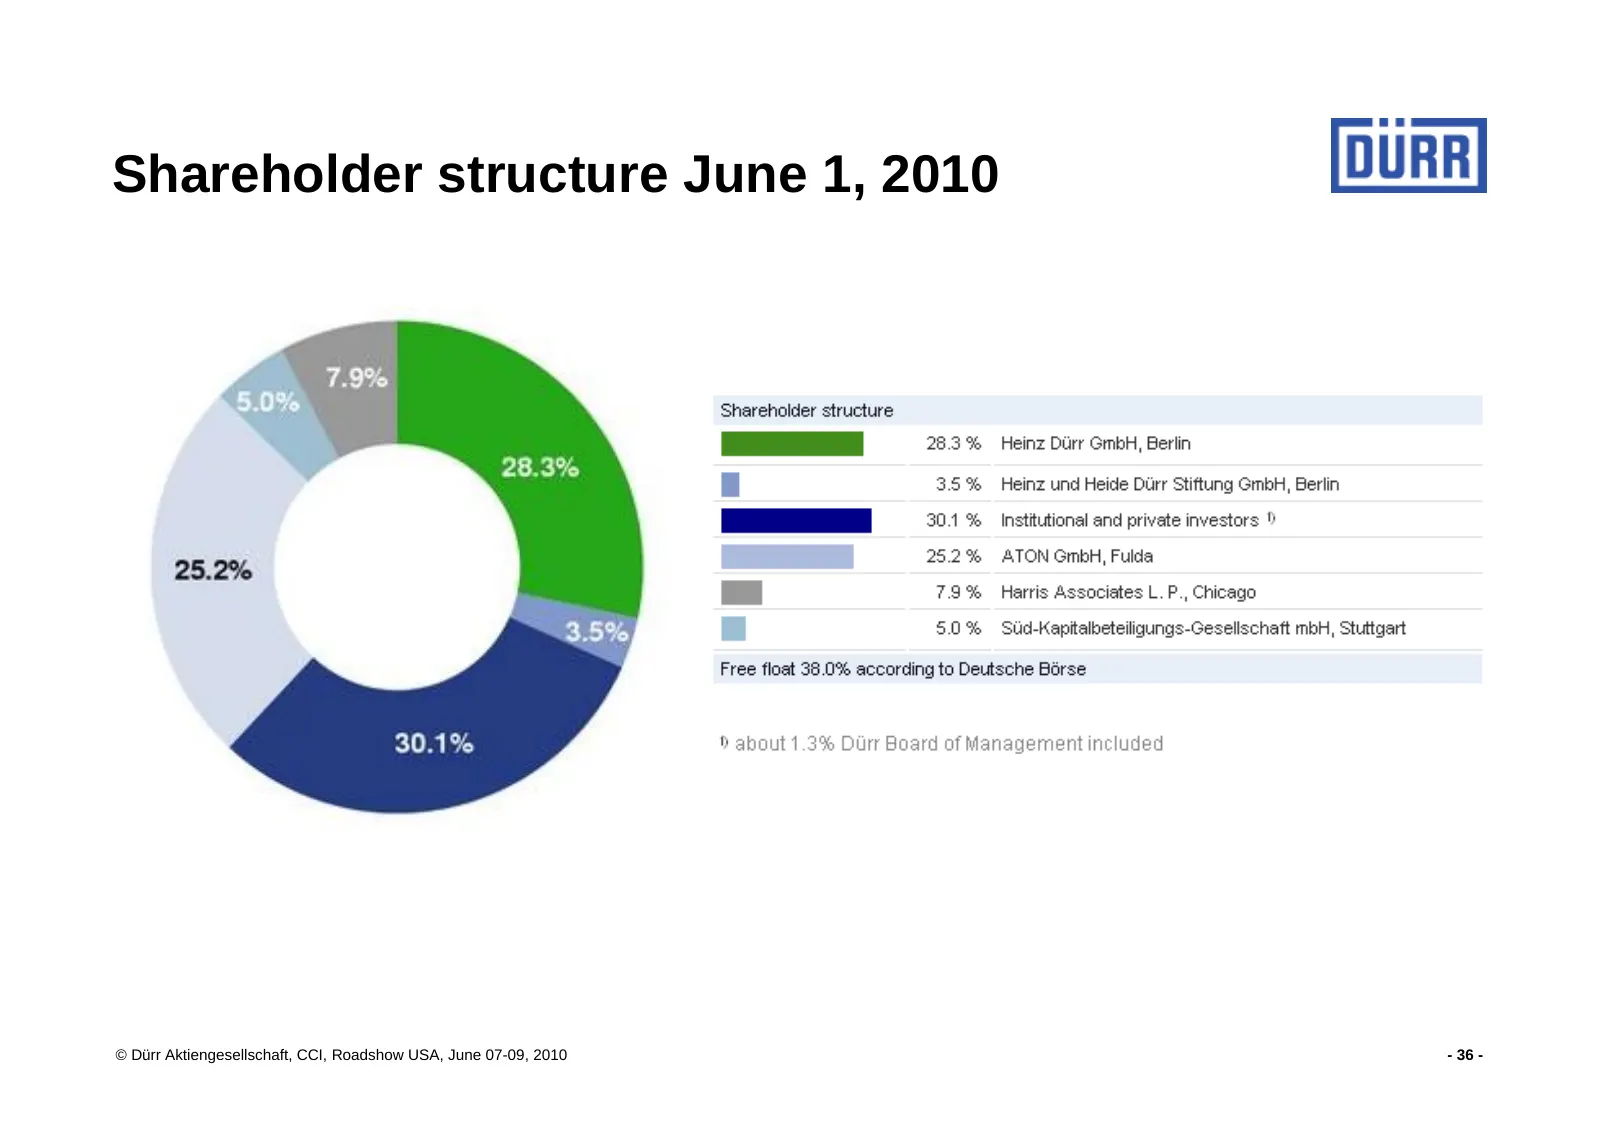
Shareholder structure June 1, 2010 © Dürr Aktiengesellschaft, CCI, Roadshow USA, June 07-09, 2010 - 36 -
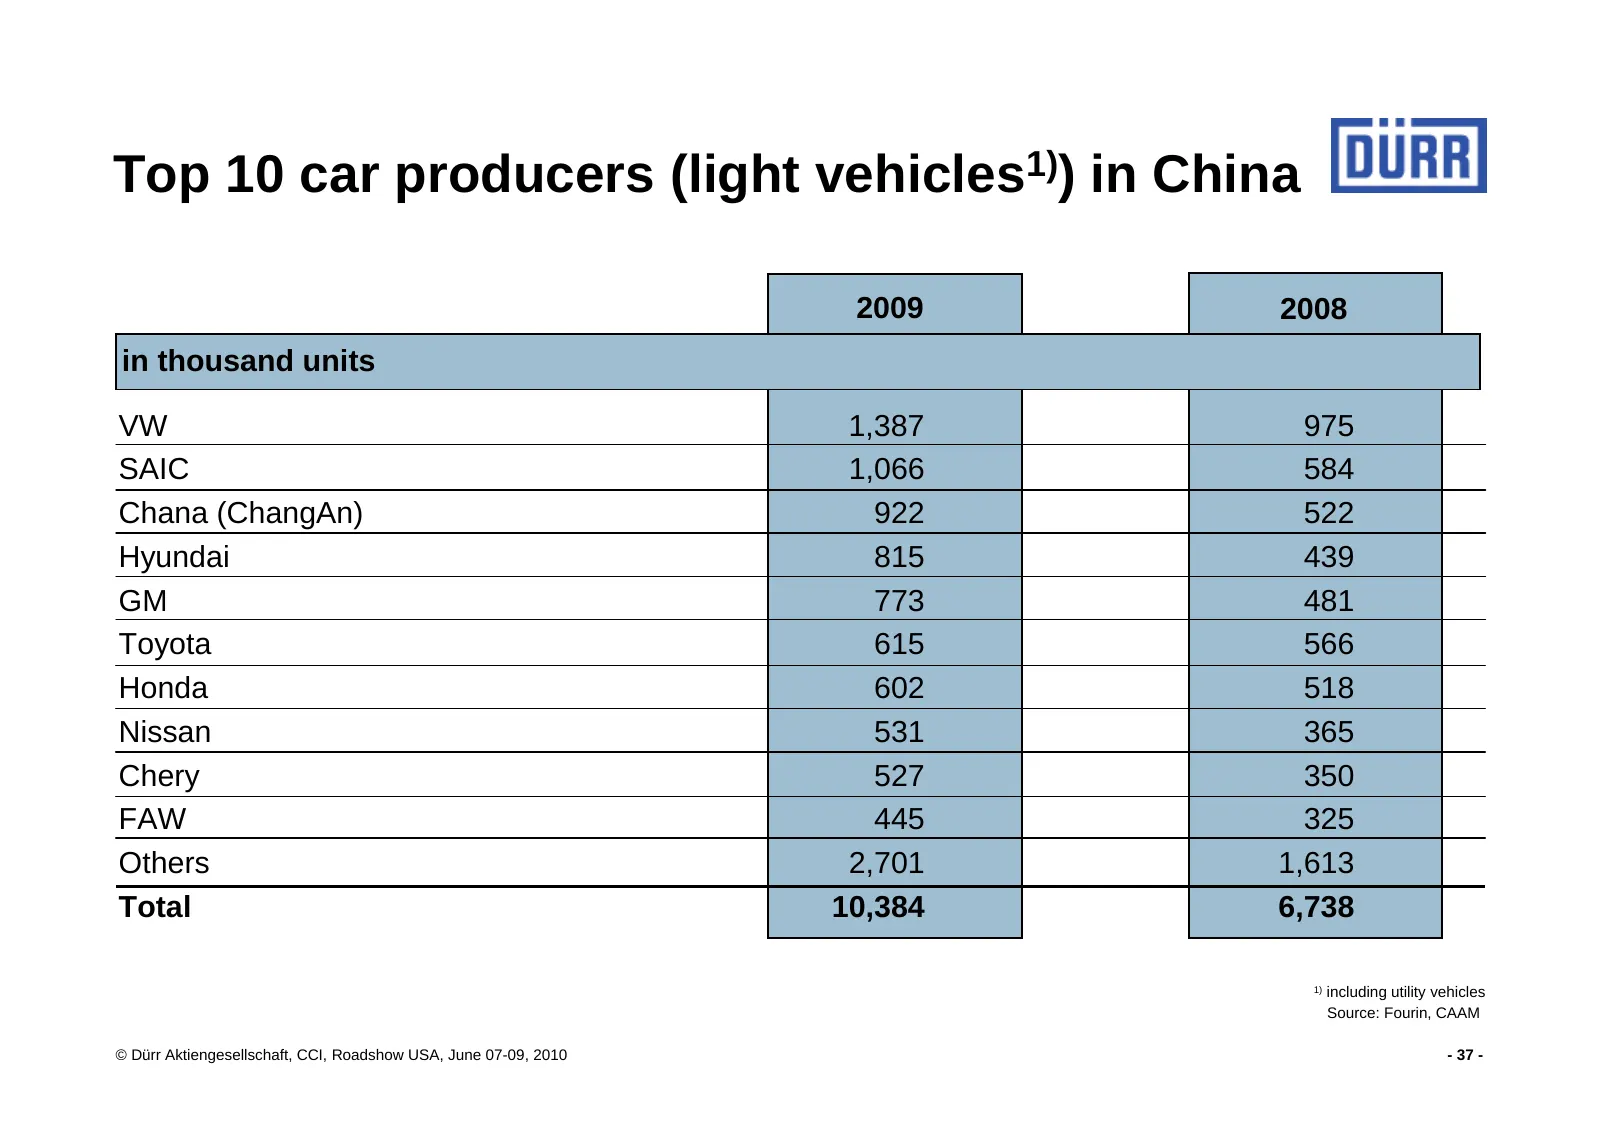
Slide 37: Top 10 car producers in China
Top 10 car producers (light vehicles1)) in China 2009 2008 in thousand units VW 1,387 975 SAIC 1,066 584 Chana (ChangAn) 922 522 Hyundai 815 439 GM 773 481 Toyota 615 566 Honda 602 518 Nissan 531 365 Chery 527 350 FAW 445 325 Others 2,701 1,613 Total 10,384 6,738 1) including utility vehicles Source
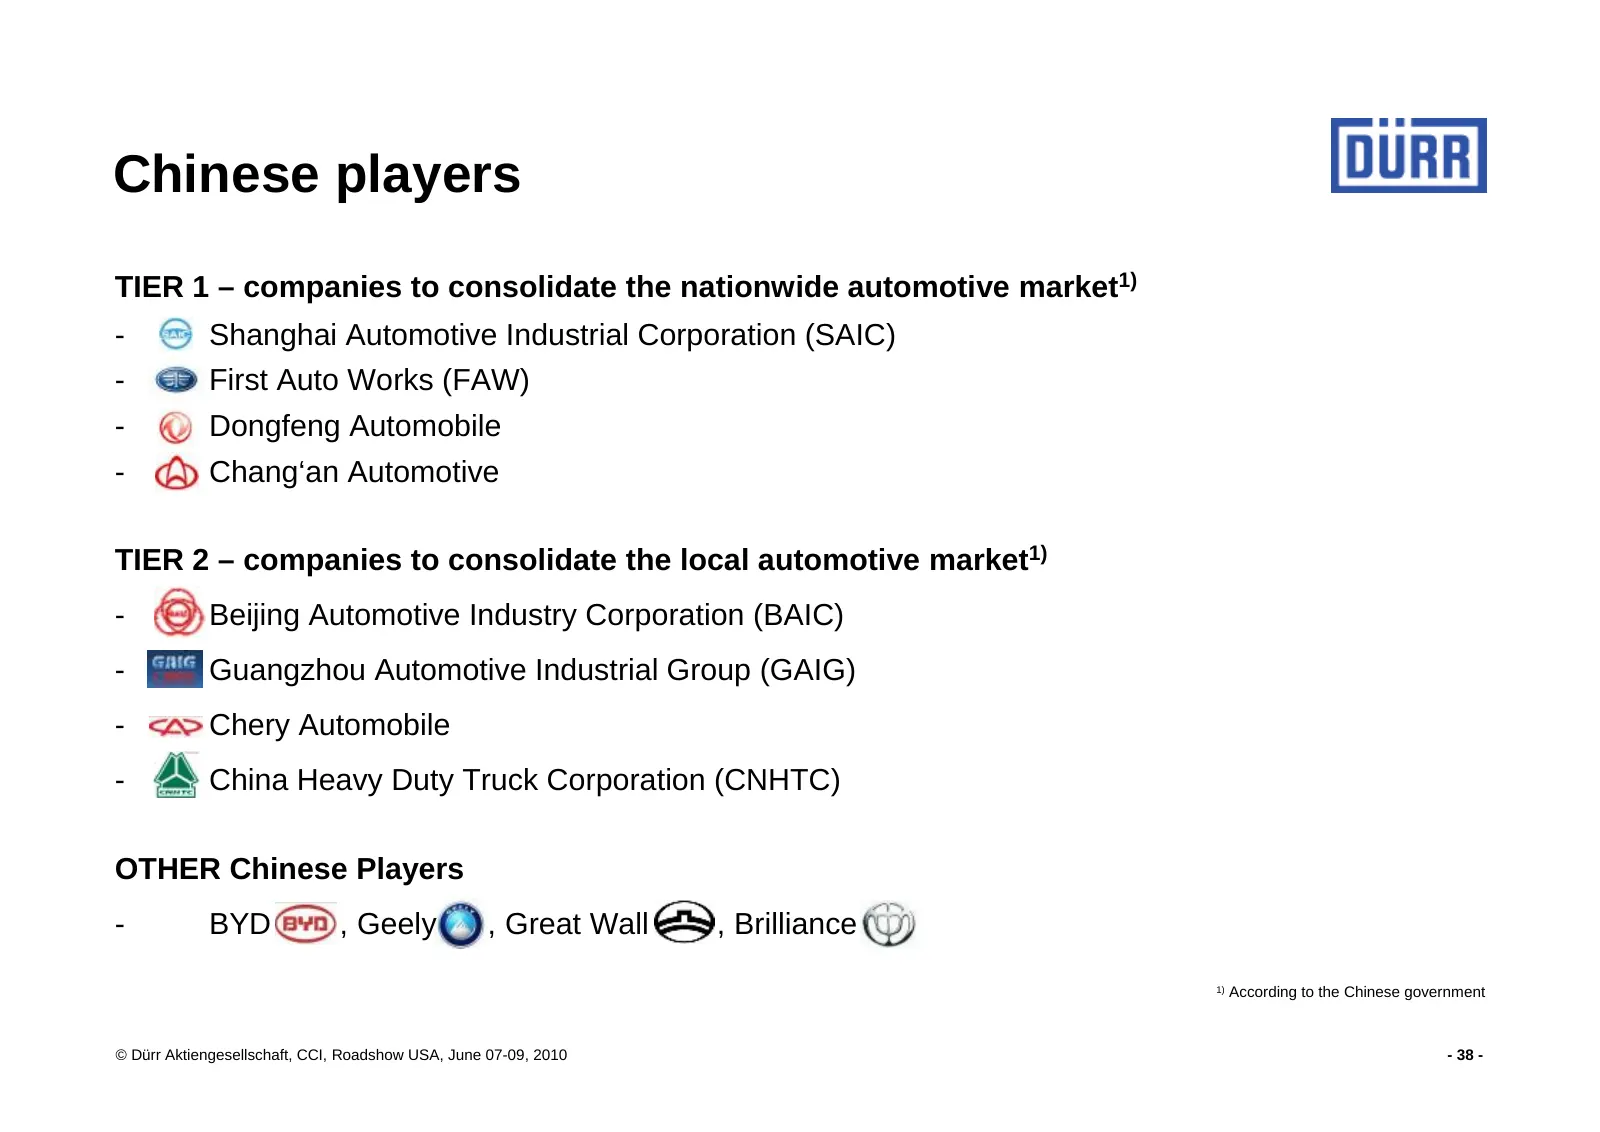
Slide 38: Chinese players
Chinese players TIER 1 – companies to consolidate the nationwide automotive market1) - Shanghai Automotive Industrial Corporation (SAIC) - First Auto Works (FAW) - Dongfeng Automobile - Chang‘an Automotive TIER 2 – companies to consolidate the local automotive market1) - Beijing Automotive Industry
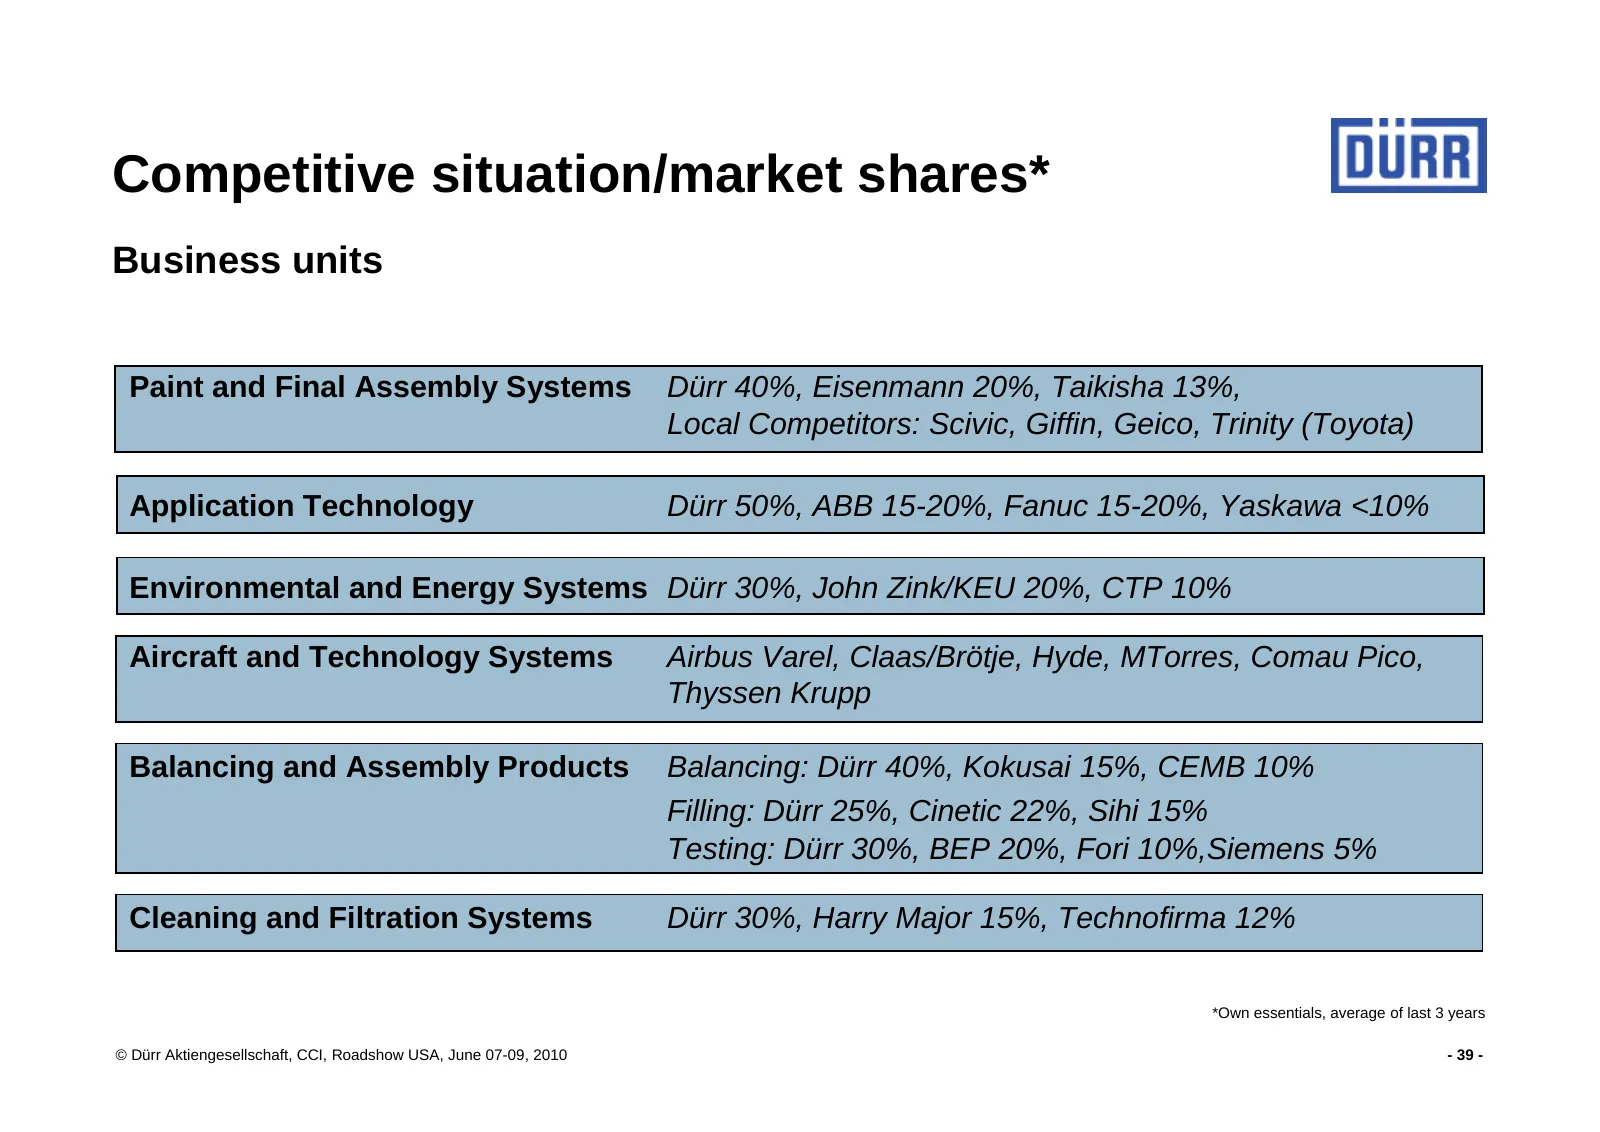
Slide 39: Competitive situation/market shares
Competitive situation/market shares* Business units Paint and Final Assembly Systems Dürr 40%, Eisenmann 20%, Taikisha 13%, Local Competitors: Scivic, Giffin, Geico, Trinity (Toyota) Application Technology Dürr 50%, ABB 15-20%, Fanuc 15-20%, Yaskawa <10% Environmental and Energy Systems Dürr 30%, Jo
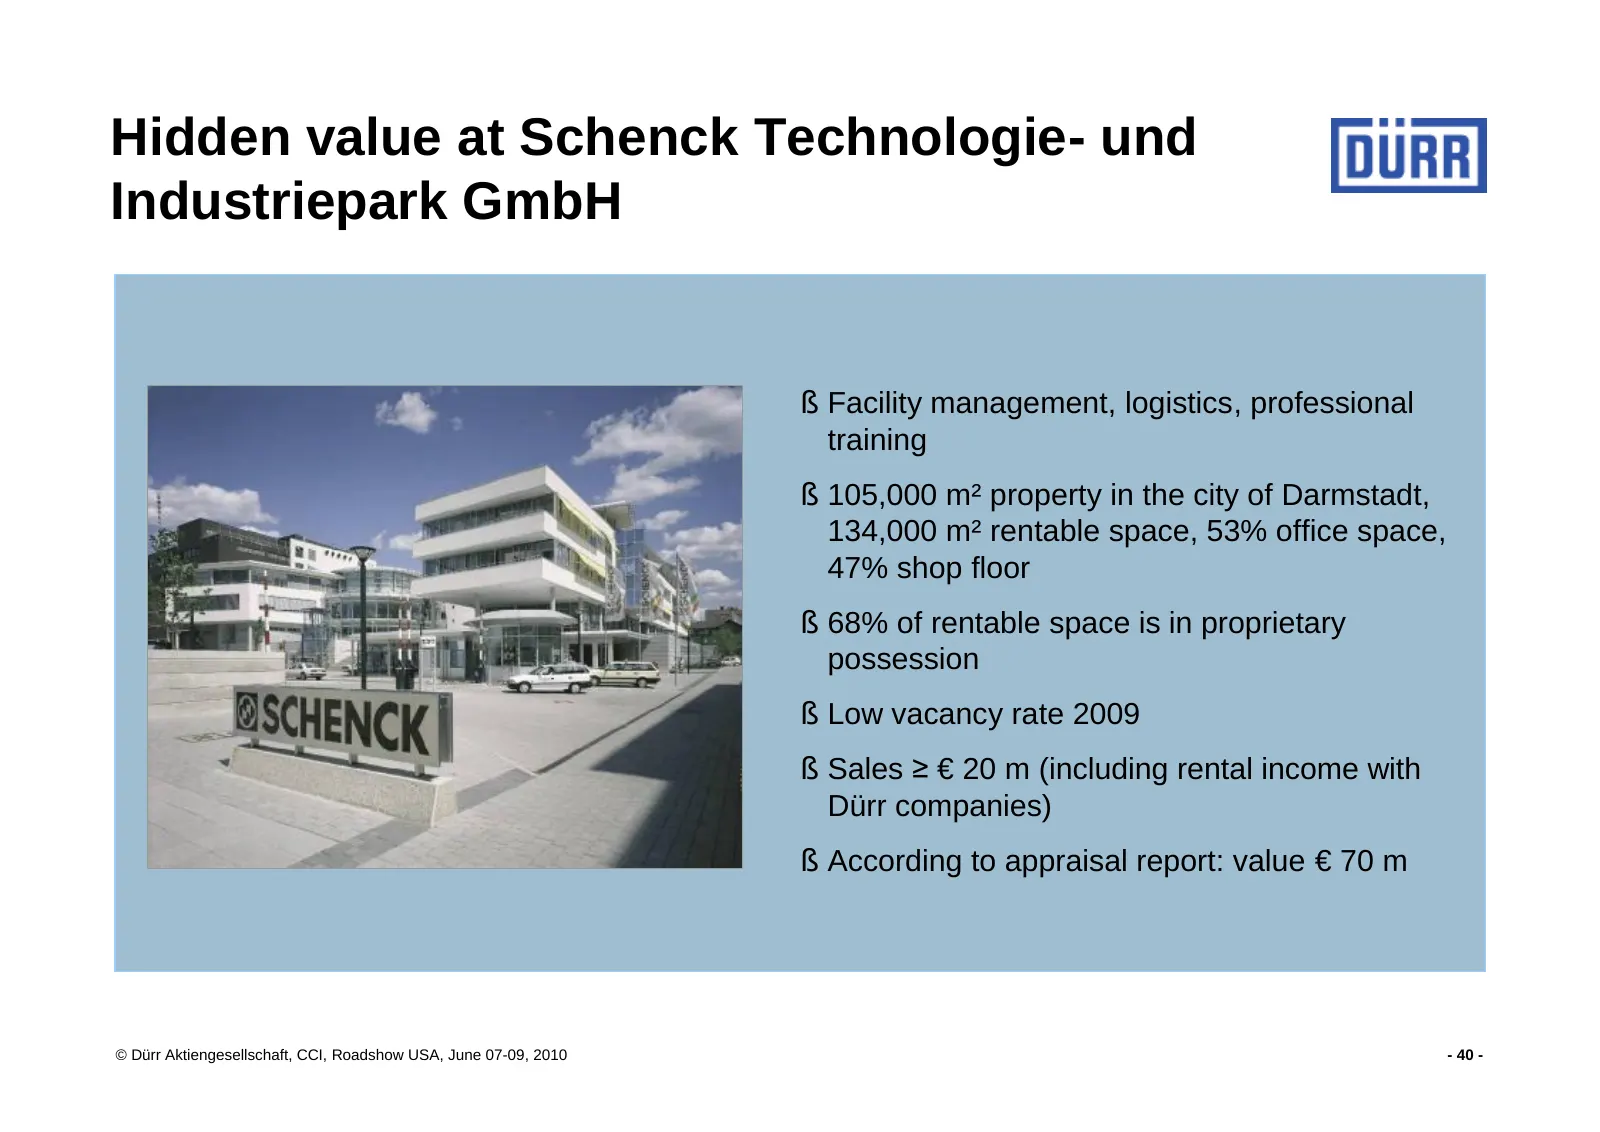
Slide 40: Hidden value at Schenck Technologie- und Industriepark GmbH
Hidden value at Schenck Technologie- und Industriepark GmbH § Facility management, logistics, professional training § 105,000 m² property in the city of Darmstadt, 134,000 m² rentable space, 53% office space, 47% shop floor § 68% of rentable space is in proprietary possession § Low vacancy rate 2009
Source: Internet Archive copy of durr.com
More decks from Durr AG
 Q3 2026 Earnings Presentation33 slides · Nov 12, 2026
 Q2 2026 Earnings Presentation39 slides · Aug 6, 2026
 Q1 2026 Earnings Presentation35 slides · May 12, 2026
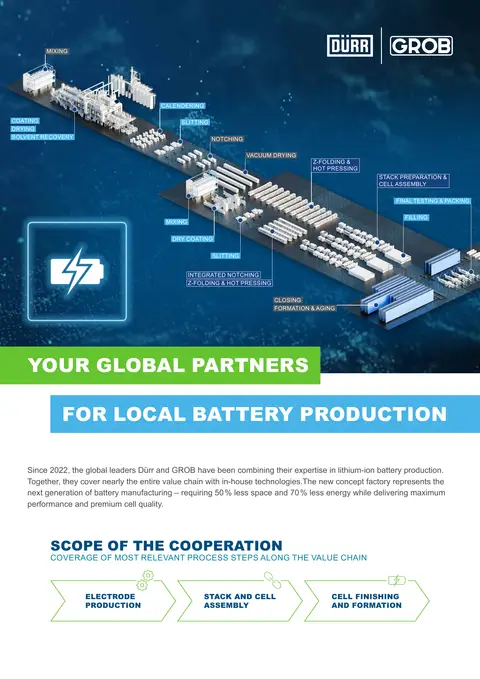 Fact Sheet (2025)2 slides · Dec 2, 2025
 Q3 2025 Earnings Presentation46 slides · Nov 13, 2025
 Q2 2025 Earnings Presentation31 slides · Jul 24, 2025