Xerium Technologies — Imperial Capital Global Opportunities Conference 2014
32 slides from Xerium Technologies's conference presentation, Sep 17, 2014
Slide 1: September 18, 2014
September 18, 2014 Exhibit 99.1
Slide 2: Forward Looking Statements and Non-GAAP Reconciliations
2 Various statements herein and remarks that we may make today about Xerium's future expectations, plans and prospects are forward-looking statements which reflect our current views with respect to future events and financial performance. Statements which include the words “expect,” “intend,” “plan,
Slide 3: Management in Attendance
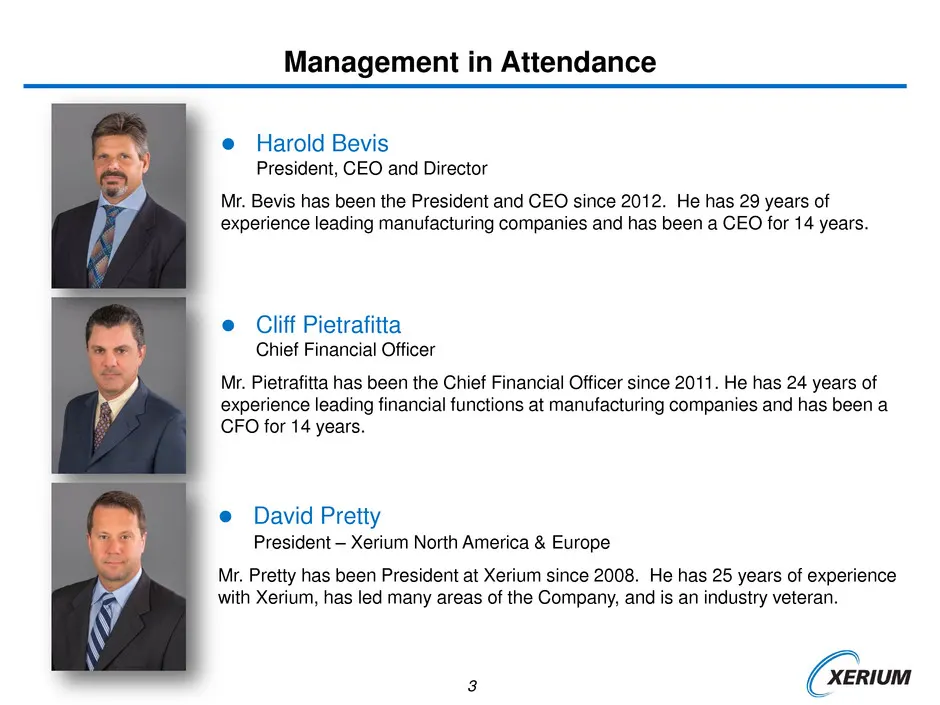
3 Harold Bevis President, CEO and Director Mr. Bevis has been the President and CEO since 2012. He has 29 years of experience leading manufacturing companies and has been a CEO for 14 years. Management in Attendance Cliff Pietrafitta Chief Financial Officer Mr. Pietrafitta has been the Chief Fin
Slide 4: Xerium Technologies, Inc.
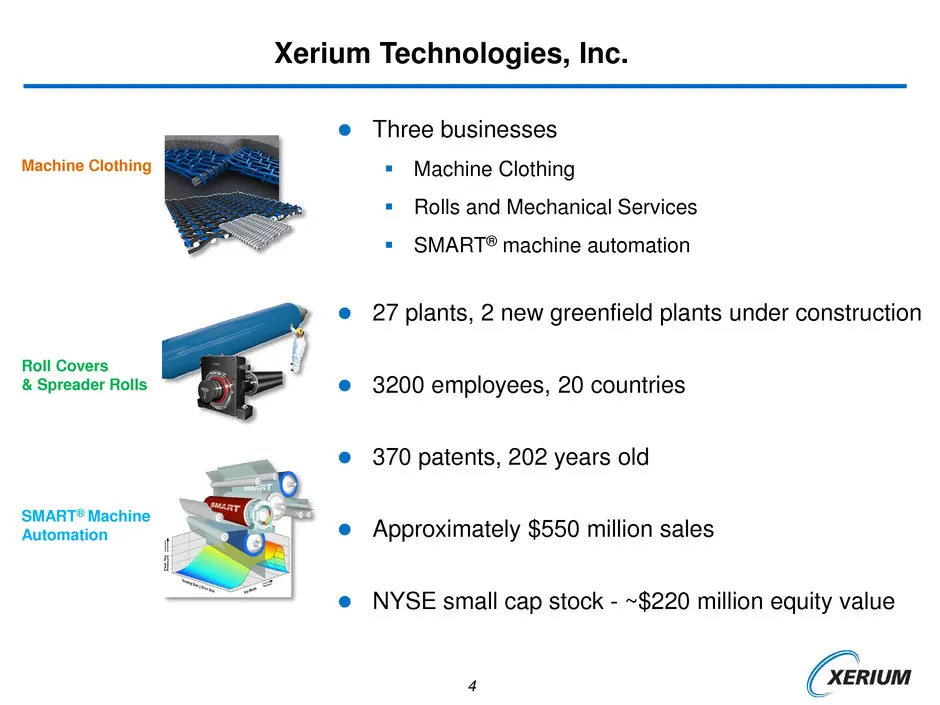
4 Xerium Technologies, Inc. Three businesses Machine Clothing Rolls and Mechanical Services SMART® machine automation 27 plants, 2 new greenfield plants under construction 3200 employees, 20 countries 370 patents, 202 years old Approximately $550 million sales NYSE small cap stock
Slide 5: Xerium is a Long-Term Global Leader But Taking a Fresh Approach to Growth
5 Xerium is a Long-Term Global Leader But Taking a Fresh Approach to Growth
Slide 6: New Team of Seasoned Veterans Driving a New Strategy
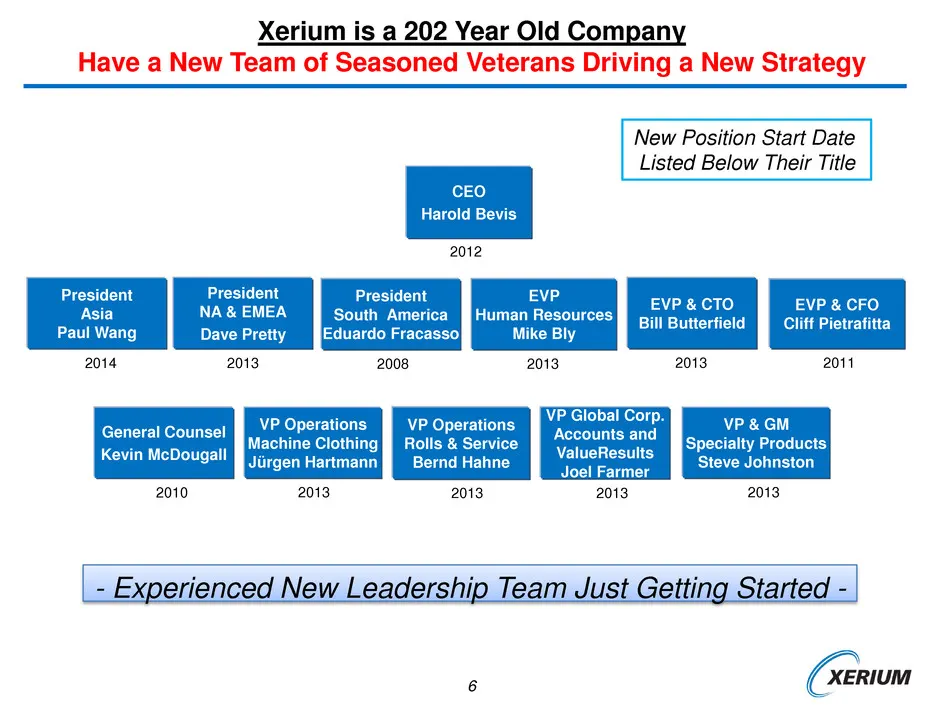
6 CEO Harold Bevis Xerium is a 202 Year Old Company Have a New Team of Seasoned Veterans Driving a New Strategy 2012 2014 President NA & EMEA Dave Pretty 2013 President South America Eduardo Fracasso 2008 EVP Human Resources Mike Bly 2013 EVP & CTO Bill Butterfield 2013 VP Global Corp. Accounts and
Slide 7: New Team Has Tripled the Stock Since It Began Working Together
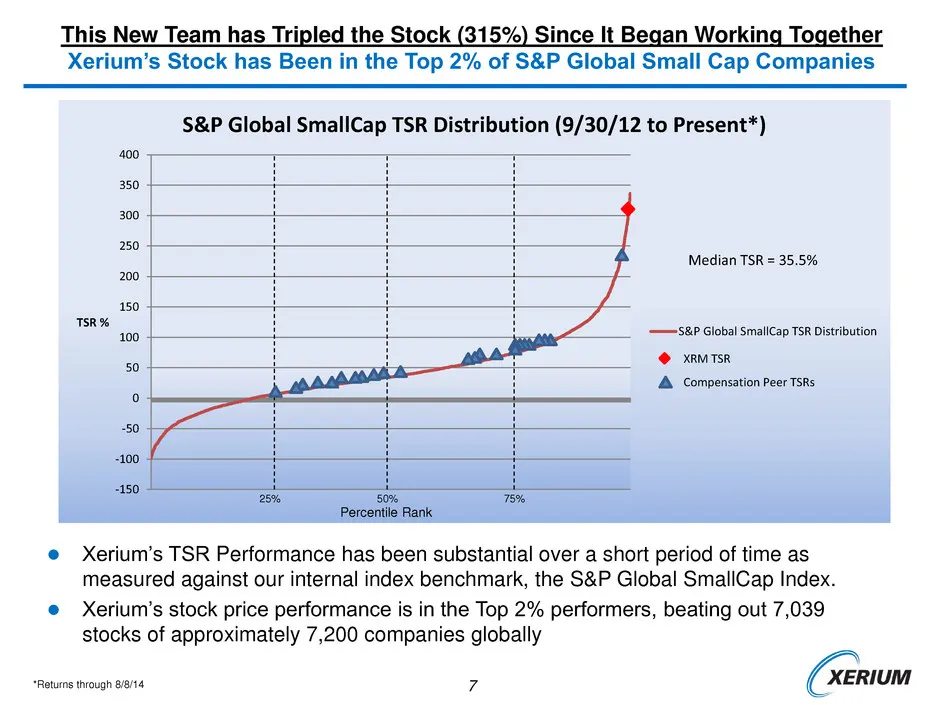
7 Xerium Has Invested To Permanently Lower Its Cost Structure and Improve its Quality in its Core Product and Service Categories This New Team has ripled the Stock (315%) Since It Began Working Together Xerium’s Stock has Been in the Top 2% of S&P Global Small Cap Companies Xerium’s TSR Performanc
Slide 8: The Leadership Team Has Plans to Continue Stock Growth
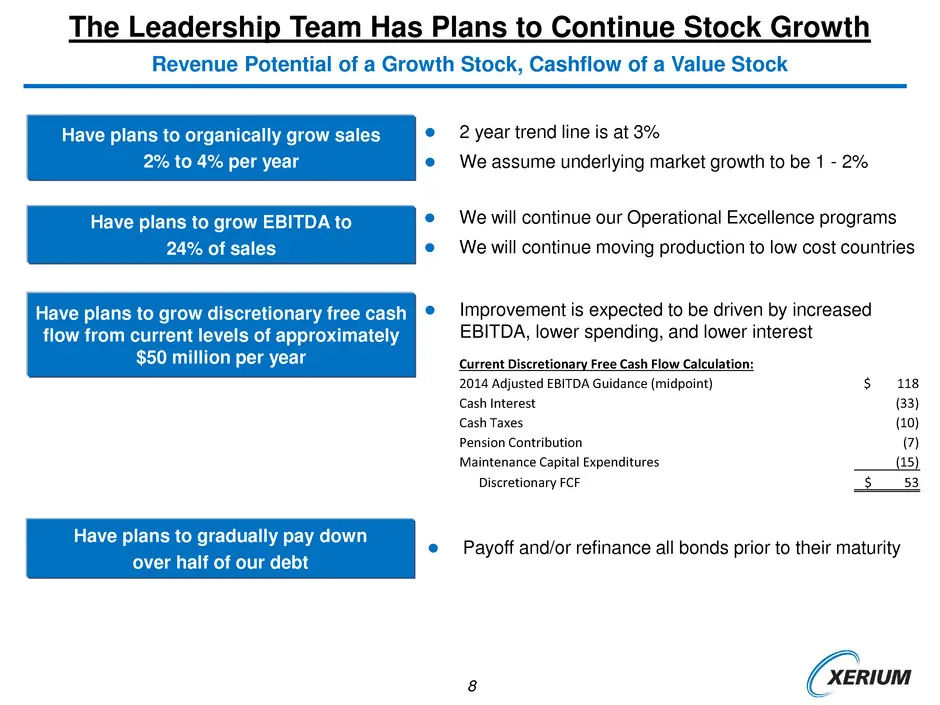
8 2 year trend line is at 3% We assume underlying market growth to be 1 - 2% Have plans to organically grow sales 2% to 4% per year Have plans to grow EBITDA to 24% of sales Have plans to grow discretionary free cash flow from current levels of approximately $50 million per year We will contin
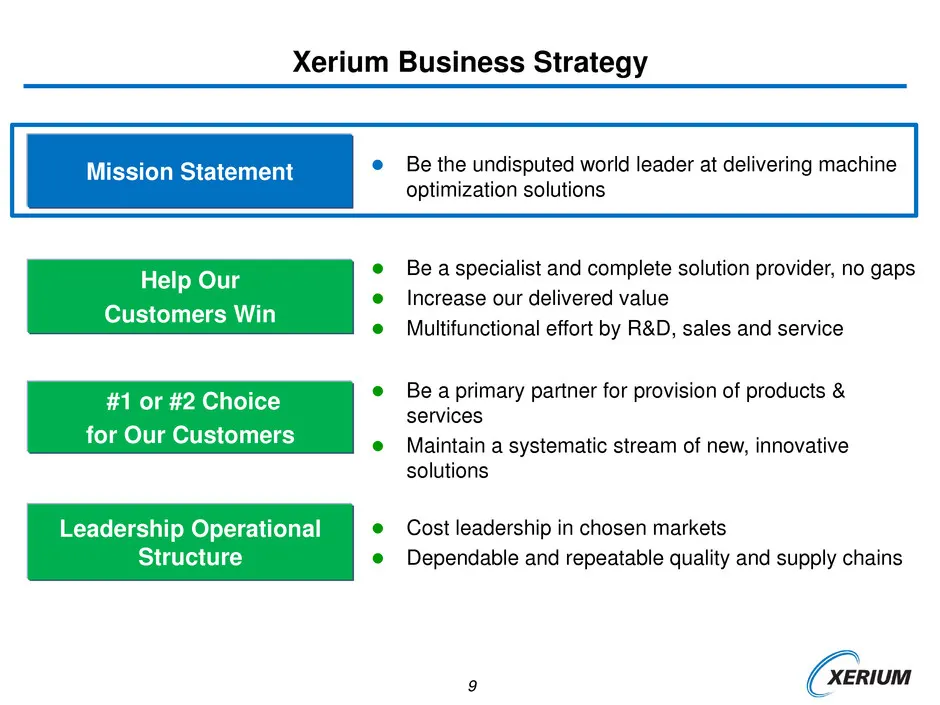
Slide 9: Xerium Business Strategy
9 Help Our Customers Win Be a specialist and complete solution provider, no gaps Increase our delivered value Multifunctional effort by R&D, sales and service Xerium Business Strategy #1 or #2 Choice for Our Customers Leadership Operational Structure Be a primary partner for provision of pro
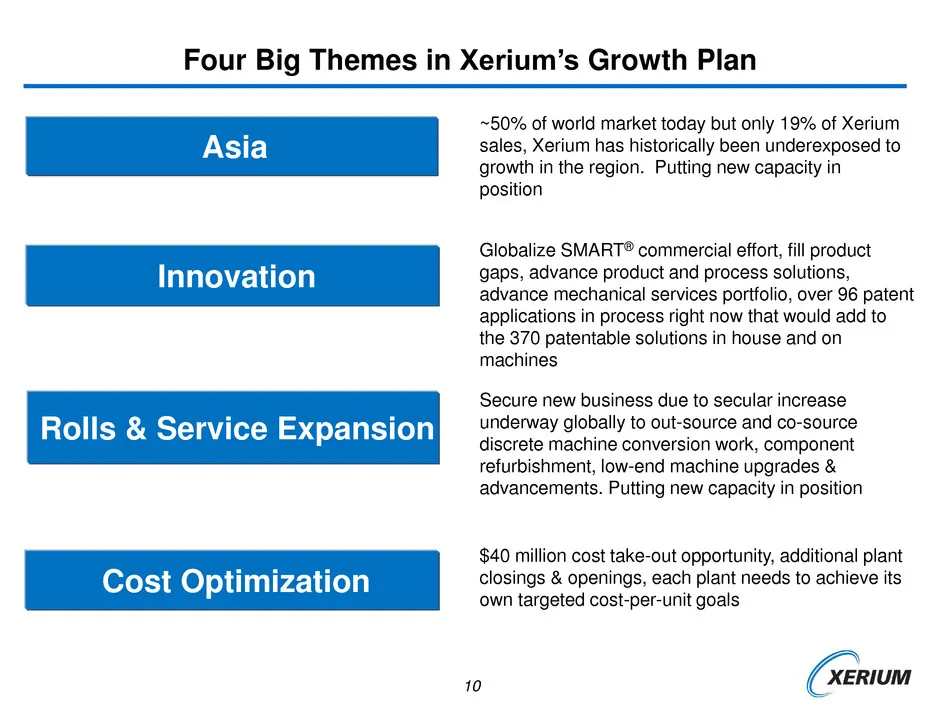
Slide 10: Four Big Themes in Xerium's Growth Plan
10 Asia ~50% of world market today but only 19% of Xerium sales, Xerium has historically been underexposed to growth in the region. Putting new capacity in position Four Big Themes in Xerium’s Growth Plan Cost Optimization $40 million cost take-out opportunity, additional plant closings & openings,
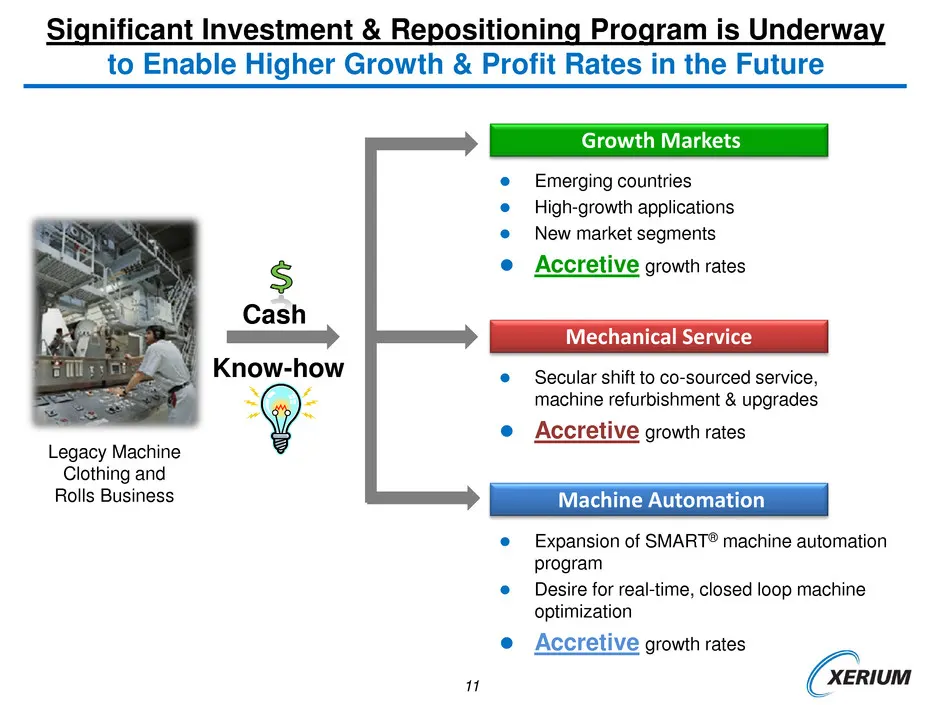
Slide 11: Growth Markets Investment and Repositioning Program
11 Growth Markets Significant Investment & Repositioning Program is Underway to Enable Higher Growth & Profit Rates in the Future Machine Automation Emerging countries High-growth applications New market segments Accretive growth rates Mechanical Service Secular shift to co-sourced service
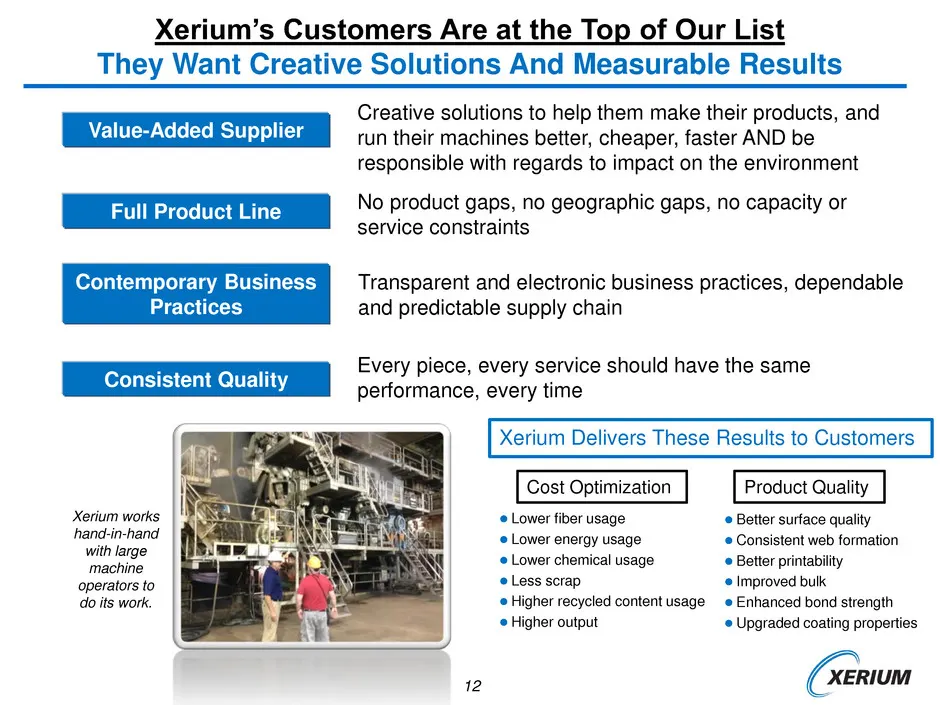
Slide 12: Xerium's Customers Are at the Top of Our List
12 Value-Added Supplier Creative solutions to help them make their products, and run their machines better, cheaper, faster AND be responsible with regards to impact on the environment Xerium’s Customers Are at the Top of Our List They Want Creative Solutions And Measurable Results Full Product Line
Slide 13: Organic Growth Opportunities: ~$4 Billion Addressable Market
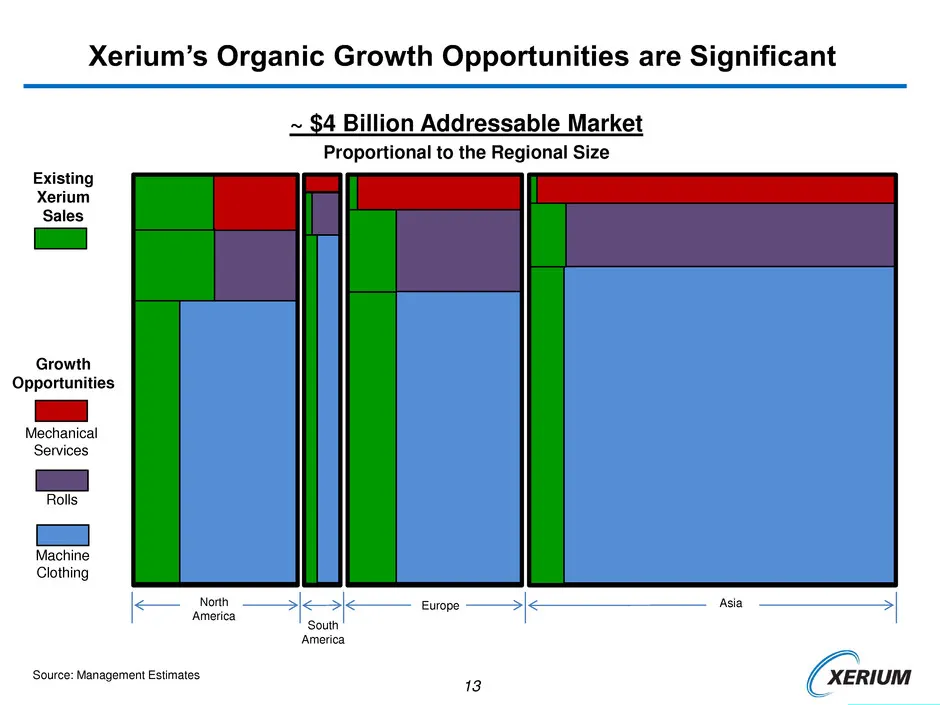
13 Xerium’s Organic Growth Opportunities are Significant ~ $4 Billion Addressable Market Proportional to the Regional Size North America South America Source: Management Estimates Existing Xerium Sales Machine Clothing Rolls Mechanical Services Europe Growth Opportunities Asia South America
Slide 14: Global Paper and Board Market is Large and Growing
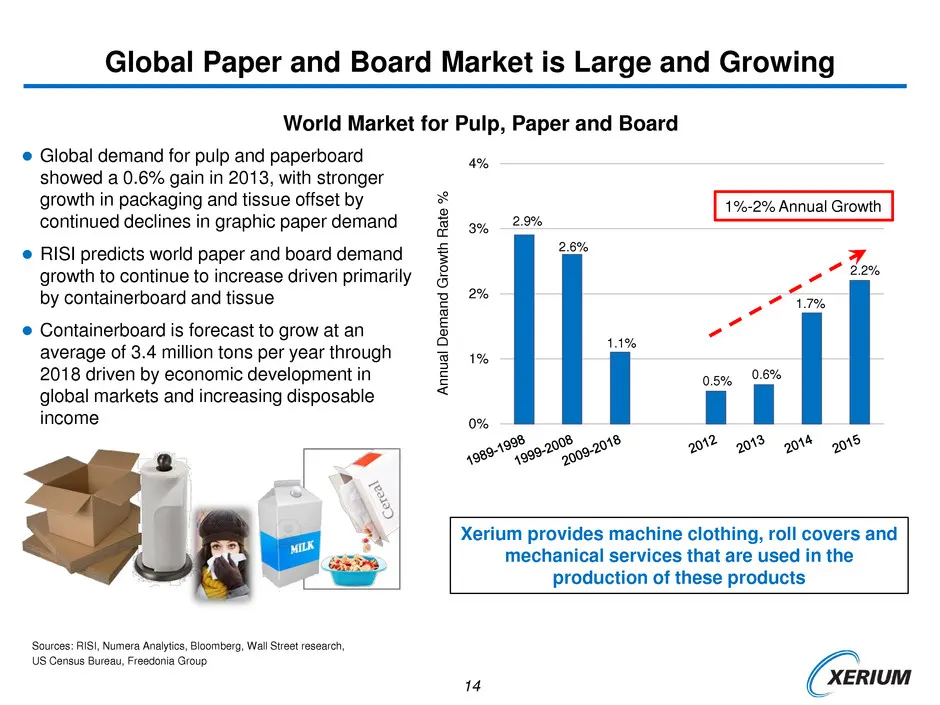
14 2.9% 2.6% 1.1% 0.5% 0.6% 1.7% 2.2% 0% 1% 2% 3% 4% A n n u a l D emand G ro w th R ate % Global Paper and Board Market is Large and Growing Global demand for pulp and paperboard showed a 0.6% gain in 2013, with stronger growth in packaging and tissue offset by continued declines in graphic paper
Slide 15: Pulp, Paper, Board and Tissue Market is Growing But Transforming
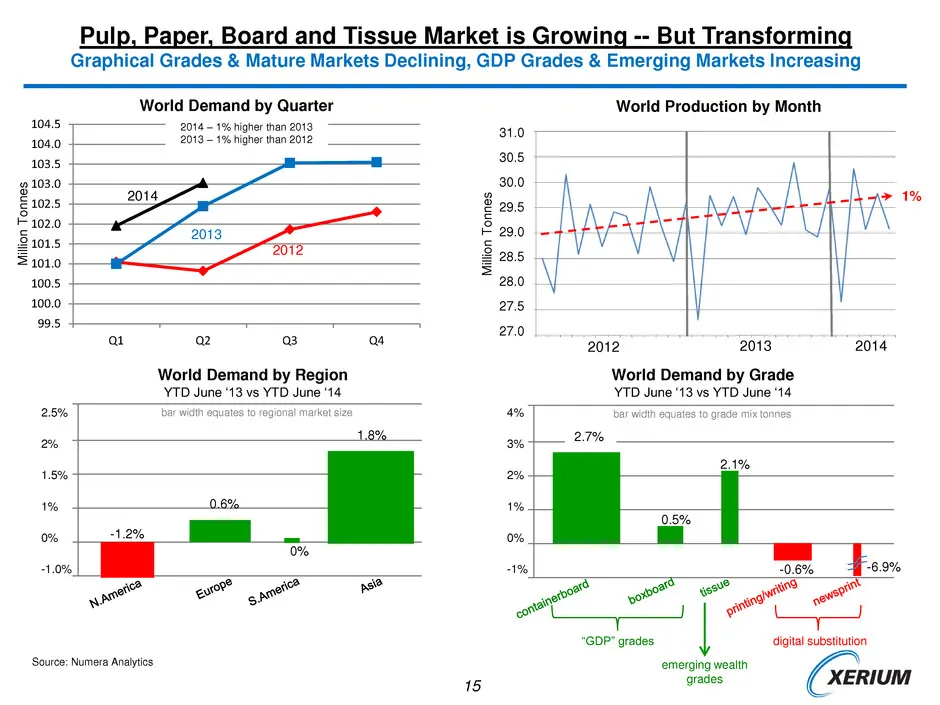
15 99.5 100.0 100.5 101.0 101.5 102.0 102.5 103.0 103.5 104.0 104.5 Q1 Q2 Q3 Q4 Pulp, Paper, Board and Tissue Market is Growing -- But Transforming Graphical Grades & Mature Markets Declining, GDP Grades & Emerging Markets Increasing Source: Numera Analytics World Demand by Quarter 2014 2012 2013 Wo
Slide 16: Fiber Cement Market is Global and Growing
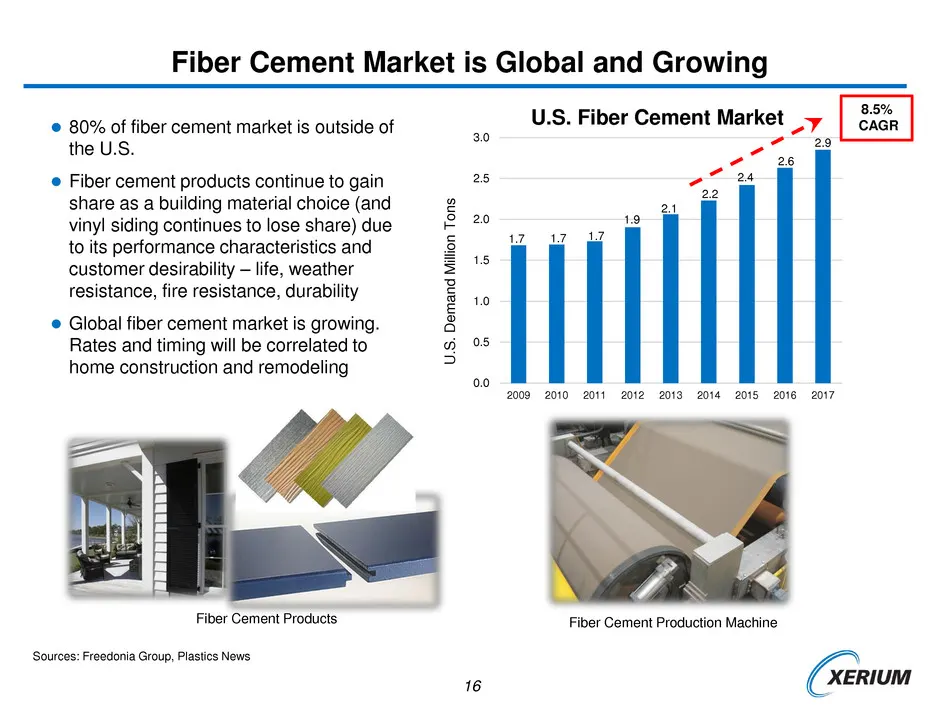
16 Fiber Cement Market is Global and Growing 1.7 1.7 1.7 1.9 2.1 2.2 2.4 2.6 2.9 0.0 0.5 1.0 1.5 2.0 2.5 3.0 2009 2010 2011 2012 2013 2014 2015 2016 2017 U .S . D emand M ill io n T o n s 8.5% CAGR 80% of fiber cement market is outside of the U.S. Fiber cement products continue to gain share as
Slide 17: Nonwoven Market is Global and Growing
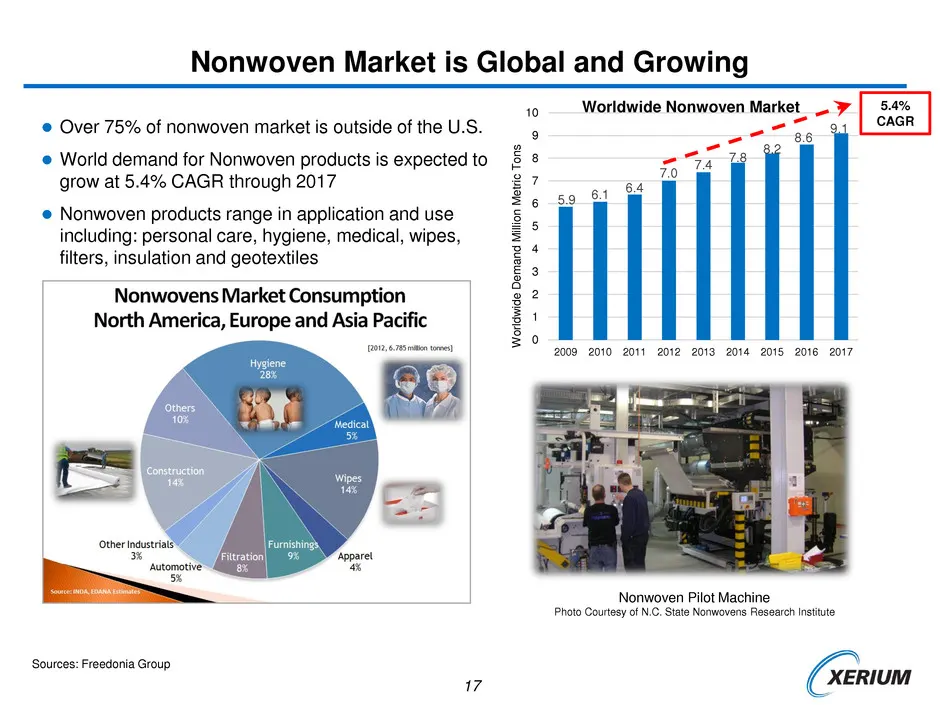
17 Nonwoven Market is Global and Growing 5.9 6.1 6.4 7.0 7.4 7.8 8.2 8.6 9.1 0 1 2 3 4 5 6 7 8 9 10 2009 2010 2011 2012 2013 2014 2015 2016 2017 W o rl d w id e De m a n d M ill io n M e tr ic T o n s 5.4% CAGR Over 75% of nonwoven market is outside of the U.S. World demand for Nonwoven products
Slide 18: Two Years into New Strategy, New Team Delivering Solid Financial Results
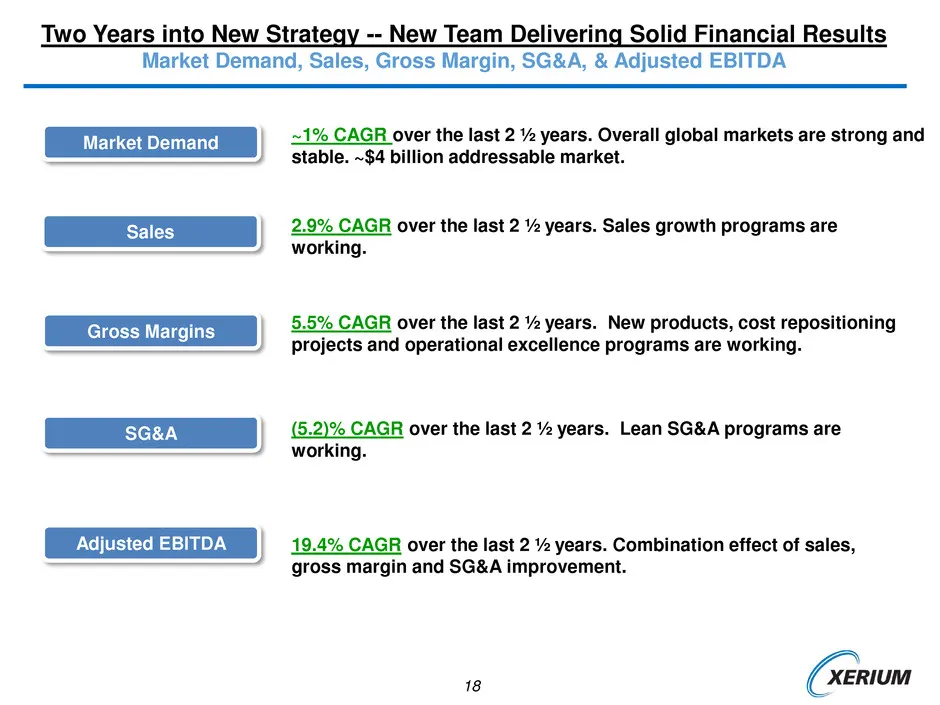
18 Two Years into New Strategy -- New Team Delivering Solid Financial Results Market Demand, Sales, Gross Margin, SG&A, & Adjusted EBITDA Market Demand ~1% CAGR over the last 2 ½ years. Overall global markets are strong and stable. ~$4 billion addressable market. Sales 2.9% CAGR over the last 2 ½ ye
Slide 19: New Team and New Strategy Yielding Strong Financial Returns
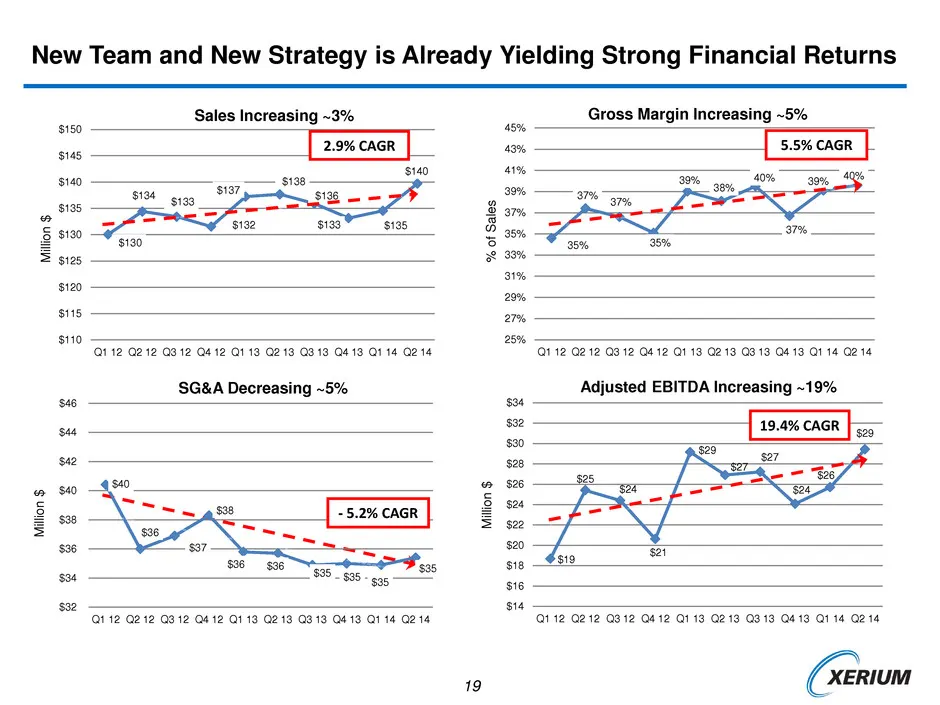
19 New Team and New Strategy is Already Yielding Strong Financial Returns $130 $134 $133 $132 $137 $138 $136 $133 $135 $140 $110 $115 $120 $125 $130 $135 $140 $145 $150 Q1 12 Q2 12 Q3 12 Q4 12 Q1 13 Q2 13 Q3 13 Q4 13 Q1 14 Q2 14 M ill io n $ Sales Increasing ~3% 2.9% CAGR 35% 37% 37% 35% 39% 38% 40%
Slide 20: Adjusted Earnings Per Share Up 54% in Last Twelve Months
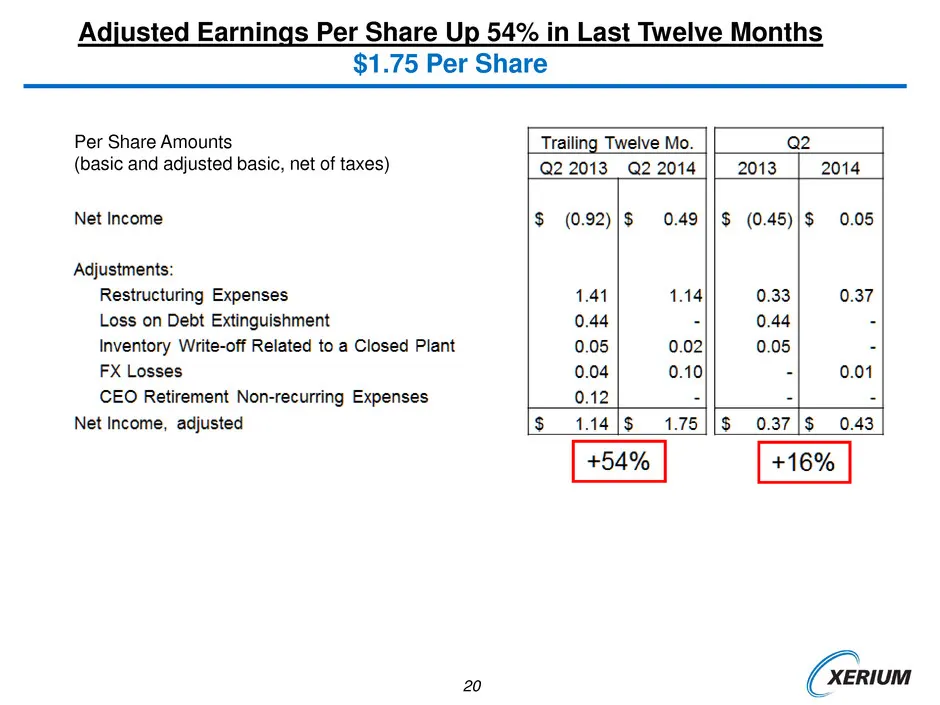
20 Adjusted Earnings Per Share Up 54% in Last Twelve Months $1.75 Per Share +16% Per Share Amounts (basic and adjusted basic, net of taxes)
Slide 21: Strategy is Being Implemented by Specific, Measurable Programs
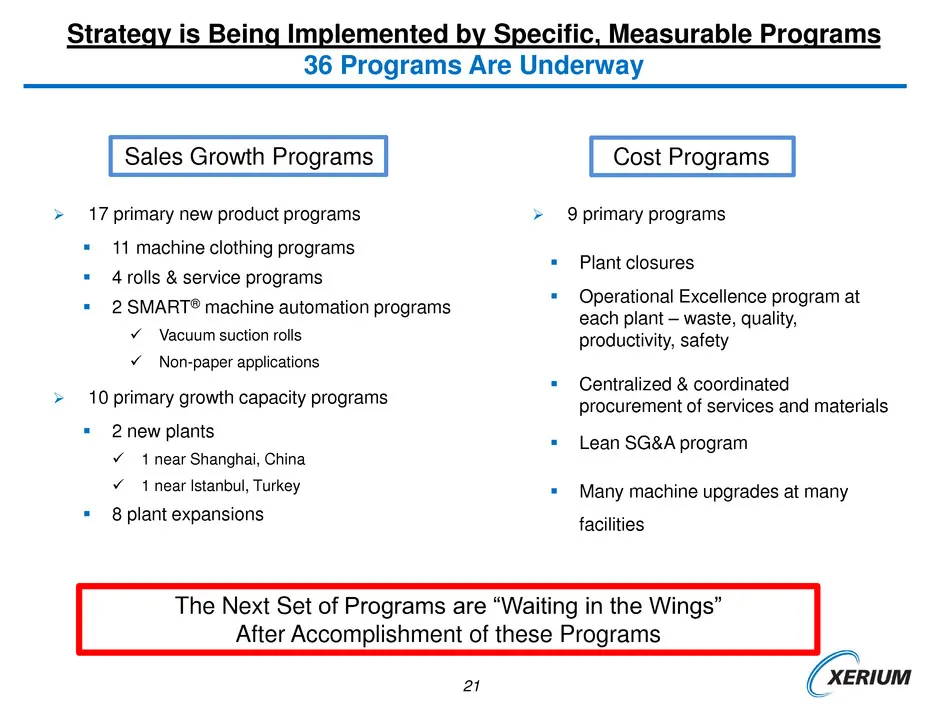
21 17 primary new product programs 11 machine clothing programs 4 rolls & service programs 2 SMART® machine automation programs Vacuum suction rolls Non-paper applications 10 primary growth capacity programs 2 new plants 1 near Shanghai, China 1 near Istanbul, Turkey 8 plant ex
Slide 22: New Leadership Team is Just Getting Started
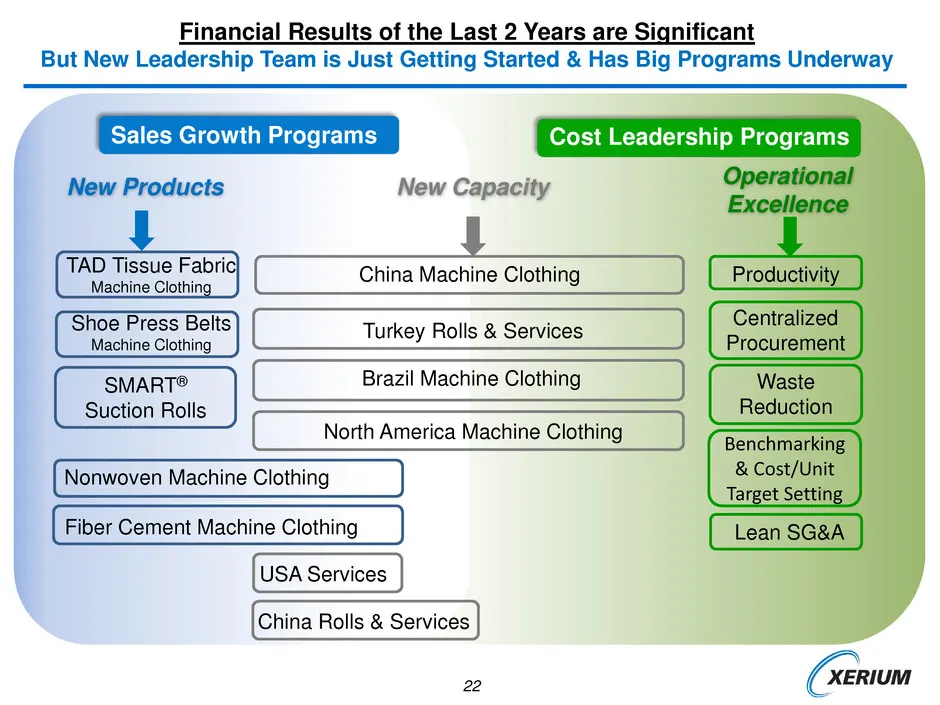
22 Financial Results of the Last 2 Years are Significant But New Leadership Team is Just Getting Started & Has Big Programs Underway Sales Growth Programs New Products New Capacity TAD Tissue Fabric Machine Clothing China Machine Clothing Shoe Press Belts Machine Clothing SMART® Suction Rolls Turkey
Slide 23: Xerium Operational Excellence Program
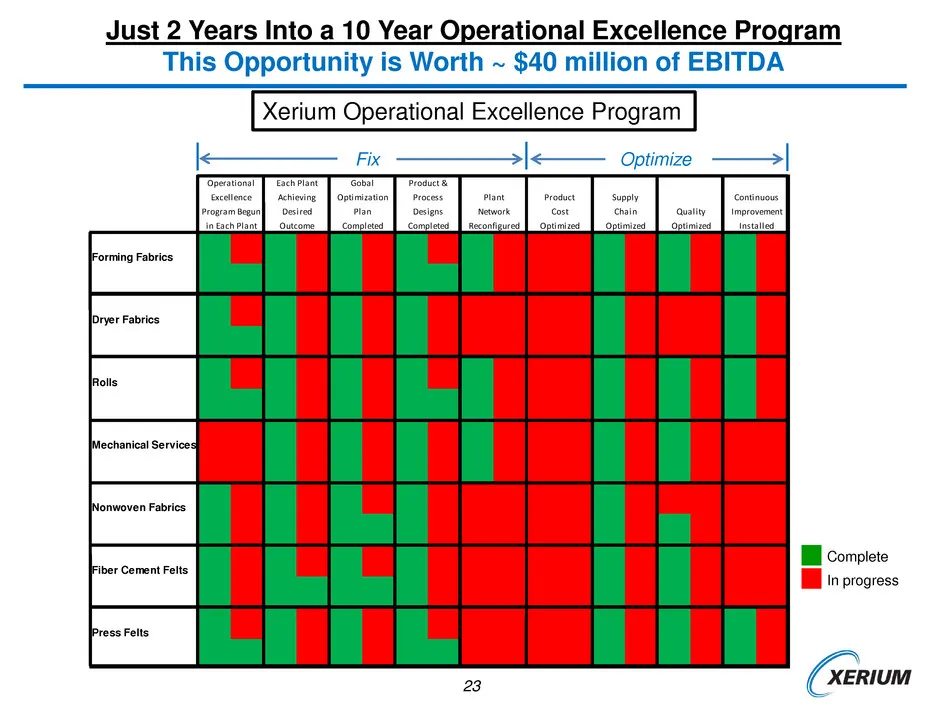
23 Forming Fabrics Dryer Fabrics Rolls Mechanical Services Nonwoven Fabrics Fiber Cement Felts Press Felts Continuous Improvement Installed Plant Network Reconfigured Product Cost Optimized Supply Chain Optimized Quality Optimized Gobal Optimization Plan Completed Product & Process Designs Completed
Slide 24: Programs to Achieve Operational Excellence Goals
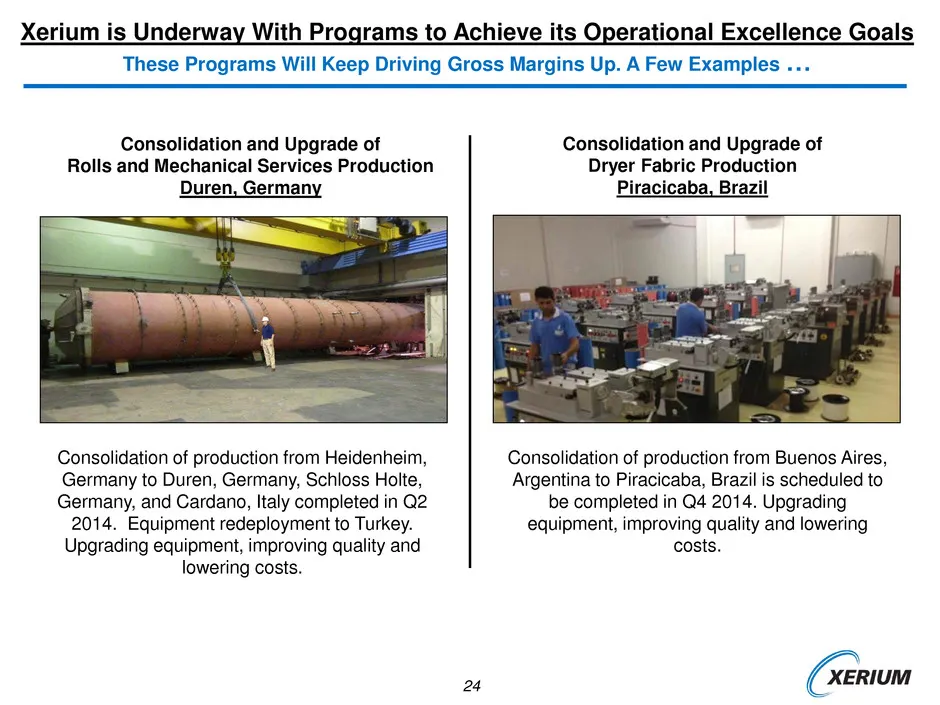
24 Xerium Has Invested To Permanently Lower Its Cost Structure and Improve its Quality in its Core Product and Service Categories Xerium is Underway With Programs to Achieve its Operational Excellence Goals These Programs Will Keep Driving Gross Margins Up. A Few Examples … Specifically, we spent $2
Slide 25: Xerium is Increasing its Industry Leading Innovation Program
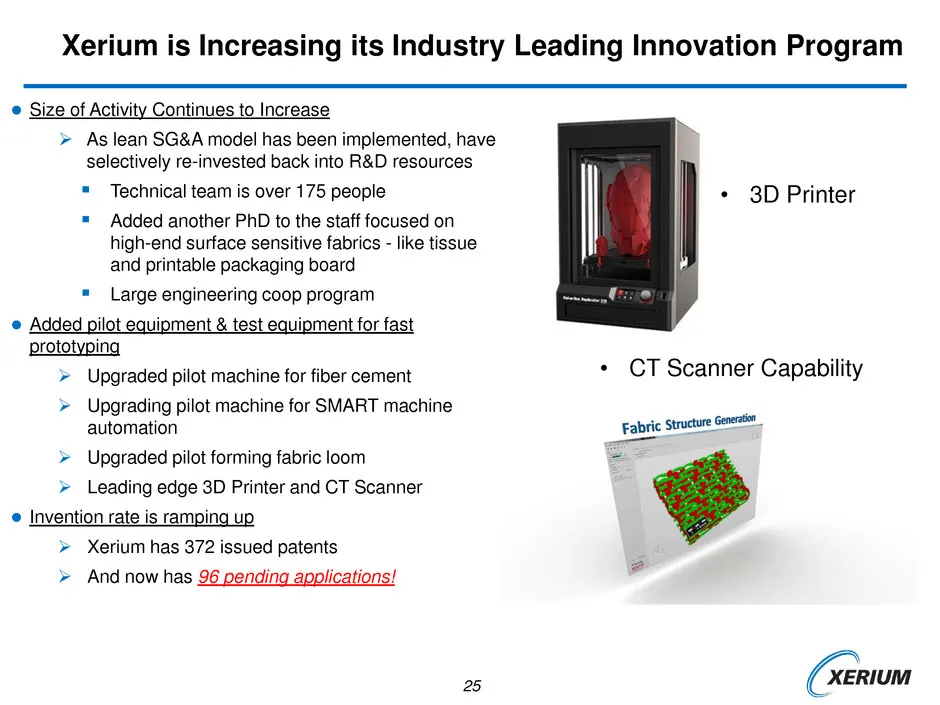
25 Xerium is Increasing its Industry Leading Innovation Program Size of Activity Continues to Increase As lean SG&A model has been implemented, have selectively re-invested back into R&D resources Technical team is over 175 people Added another PhD to the staff focused on high-end surface se
Slide 26: Investing $69 Million to Grow Sales: New Products
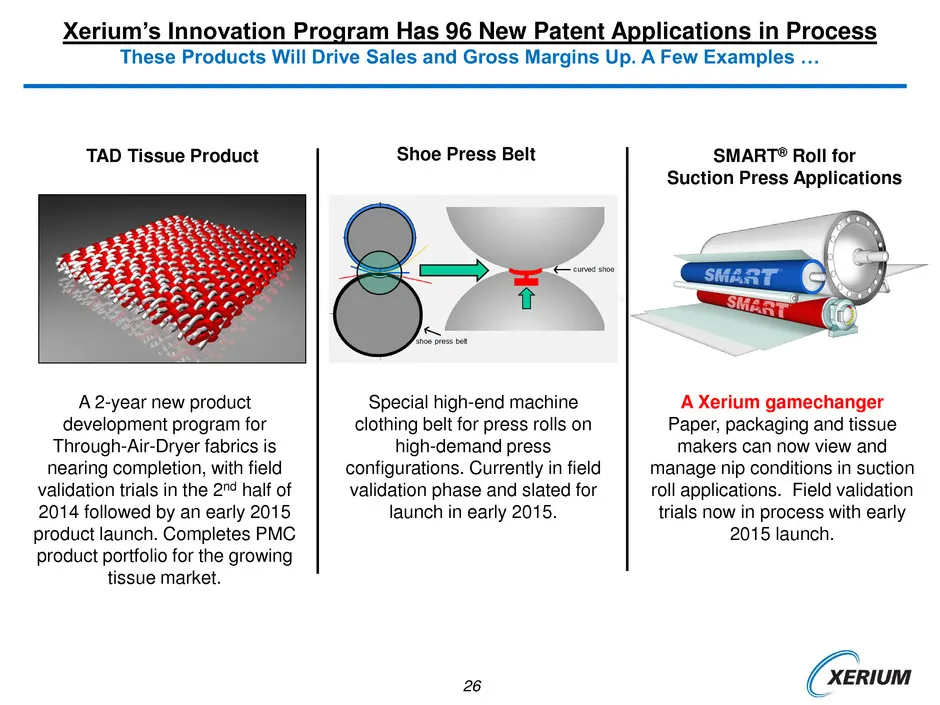
26 Xerium is Investing $69 Million to Grow Sales Over the Next Several Years. Xerium’s Innovation Program Has 96 New Patent Applications in Process These Products Will Drive Sales and Gross Margins Up. A Few Examples … TAD Tissue Product A 2-year new product development program for Through-Air-Dryer
Slide 27: SMART Machine Automation Installations Are Taking Off
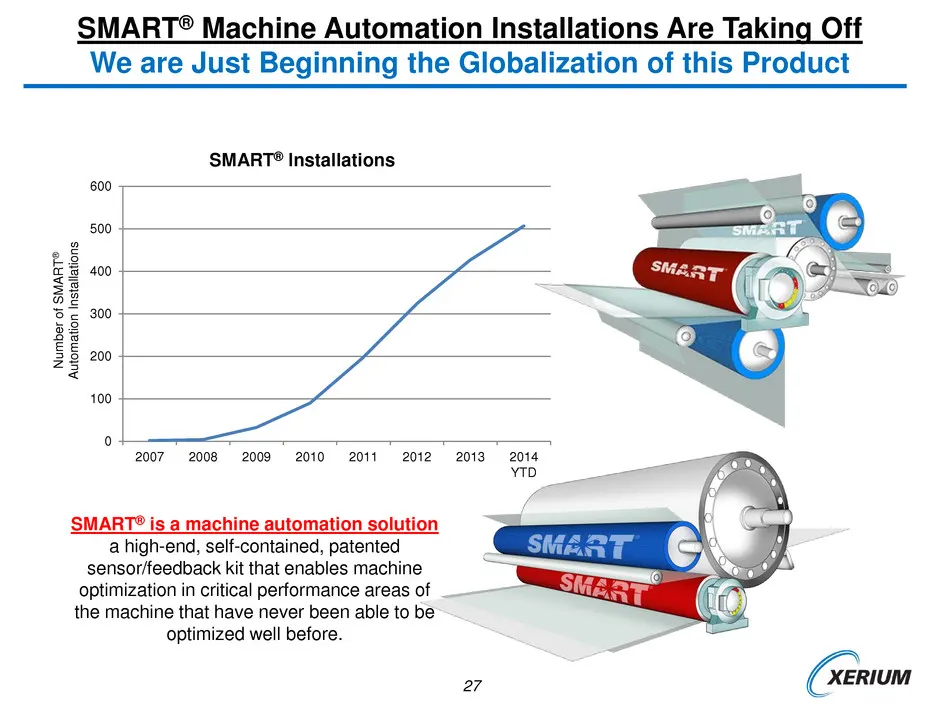
27 0 100 200 300 400 500 600 2007 2008 2009 2010 2011 2012 2013 2014 Nu m b e r o f S M A R T ® A ut o m at io n In s ta llat io n s SMART® Installations SMART® Machine Automation Installations Are Taking Off We are Just Beginning the Globalization of this Product SMART® is a machine automation solu
Slide 28: Global Rolls and Service Expansion is Just Getting Started
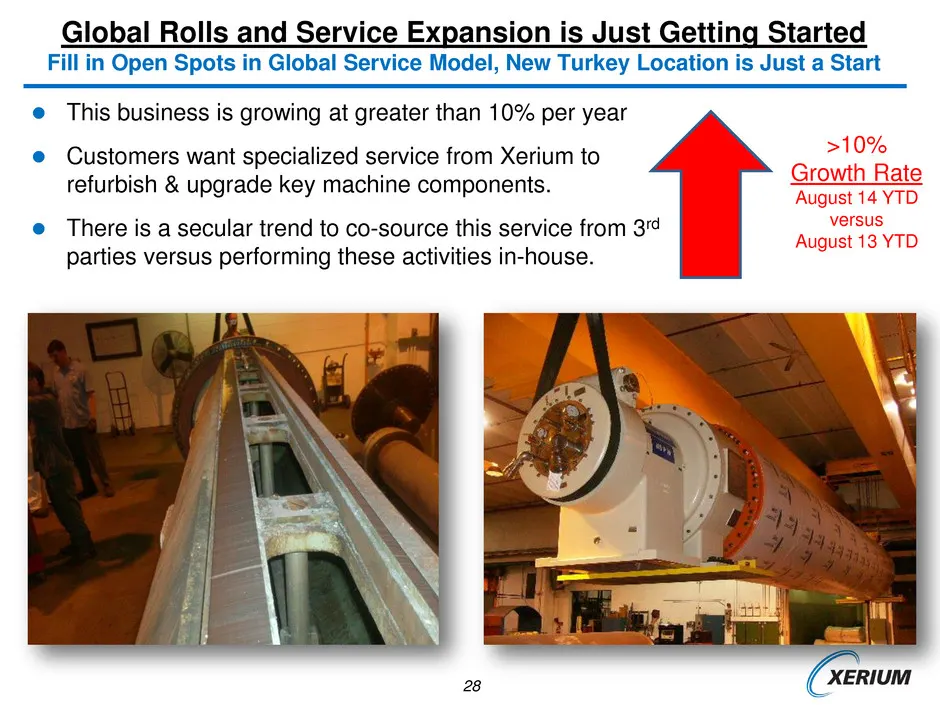
28 Suction Box Completed Suction Roll Global Rolls and Service Expansion is Just Getting Started Fill in Open Spots in Global Service Model, New Turkey Location is Just a Start This business is growing at greater than 10% per year Customers want specialized service from Xerium to refurbish & upg
Slide 29: Investment Program to Grow Sales: Plant Expansions
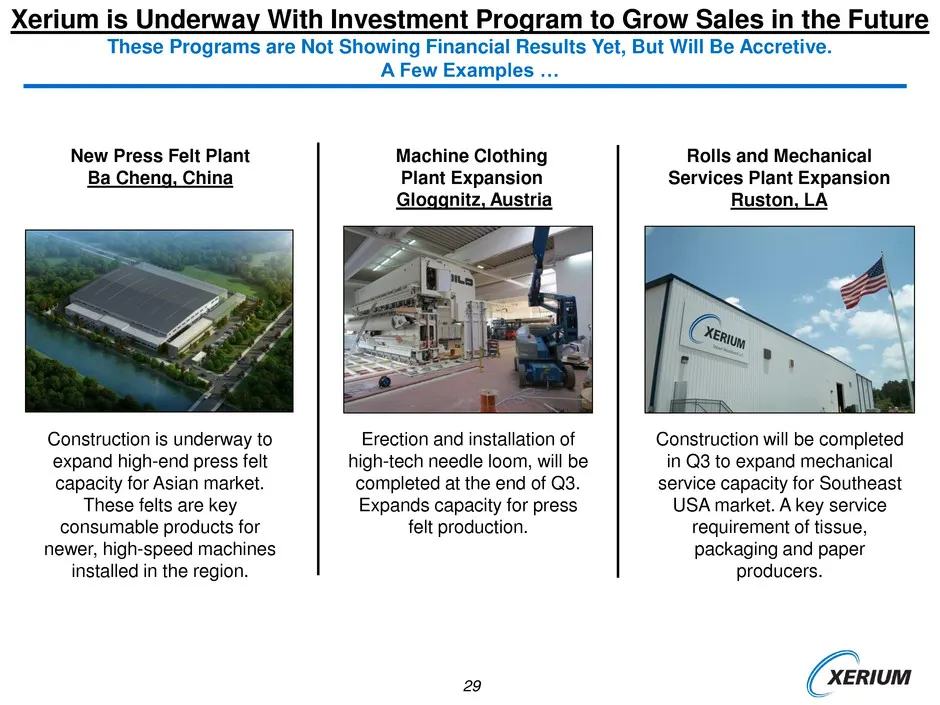
29 Xerium is Investing $69 Million to Grow Sales Over the Next Several Years. Xerium is Underway With Investment Program to Grow Sales in the Future These Programs are Not Showing Financial Results Yet, But Will Be Accretive. A Few Examples … New Press Felt Plant Ba Cheng, China Construction is unde
Slide 30: Xerium's Revenue Growth Potential is High
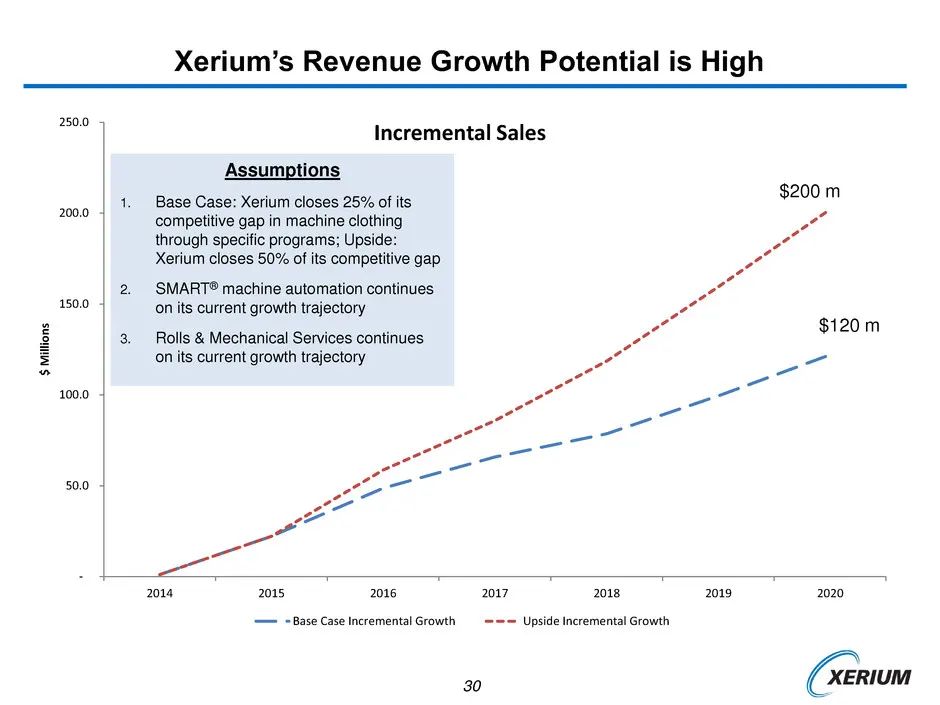
30 - 50.0 100.0 150.0 200.0 250.0 2014 2015 2016 2017 2018 2019 2020 $ M ill io n s Incremental Sales Base Case Incremental Growth Upside Incremental Growth $120 m Xerium’s Revenue Growth Potential is High Assumptions 1. Base Case: Xerium closes 25% of its competitive gap in machine clothing through
Slide 31: Xerium Executive Summary
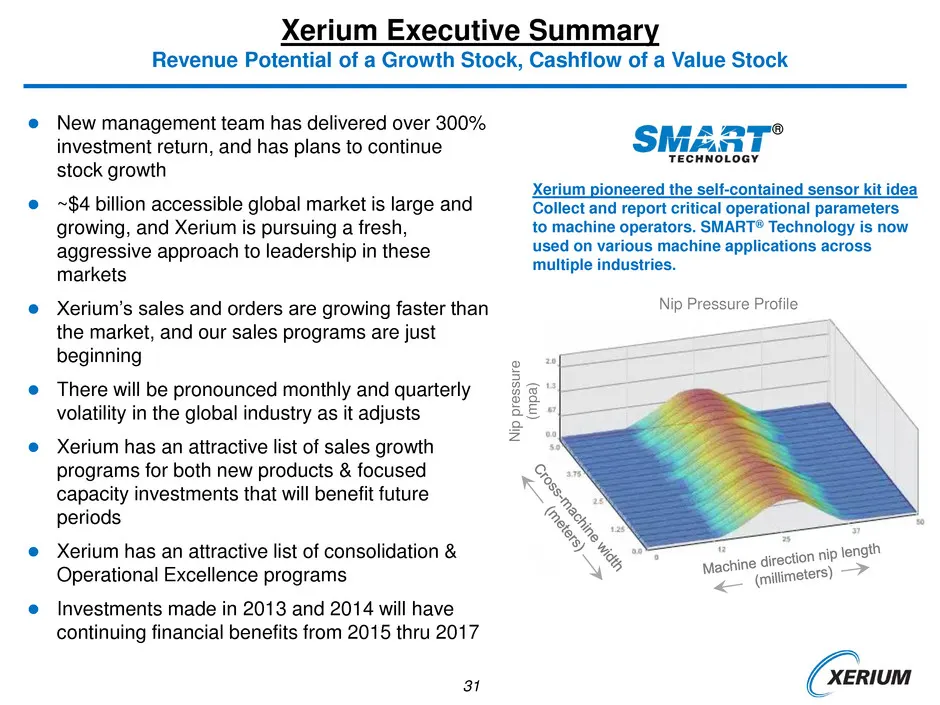
31 New management team has delivered over 300% investment return, and has plans to continue stock growth ~$4 billion accessible global market is large and growing, and Xerium is pursuing a fresh, aggressive approach to leadership in these markets Xerium’s sales and orders are growing faster th
Slide 32: Innovative Performance That Delivers Results
eT | INNOVATIVE PERFORMANCE THAT DELIVERS RESULTS Ic Imperial Capital” GLOBAL OPPORTUNITIES CONFERENCE CONNECT + EXCHANGE « RESULTS September 18, 2014 /
Source: SEC EDGAR · 8-K filed Sep 17, 2014
More decks from Xerium Technologies Inc
 Investor Presentation (March 2017)30 slides · Mar 24, 2017
 Industrials Conference August 201518 slides · Aug 11, 2015
 Investor Presentation (March 2015)23 slides · Mar 18, 2015
 FY2014 Earnings Presentation20 slides · Mar 4, 2015
 Sidoti & Company January 2015 Conference24 slides · Jan 12, 2015
 2014 Jefferies Global Industrials Conference32 slides · Aug 13, 2014