Thyrocare Technologies Ltd · NSE:THYROCARE
Thyrocare Technologies — Q2 FY27 Earnings Presentation
35 slides from Thyrocare Technologies's earnings presentation, Oct 29, 2026
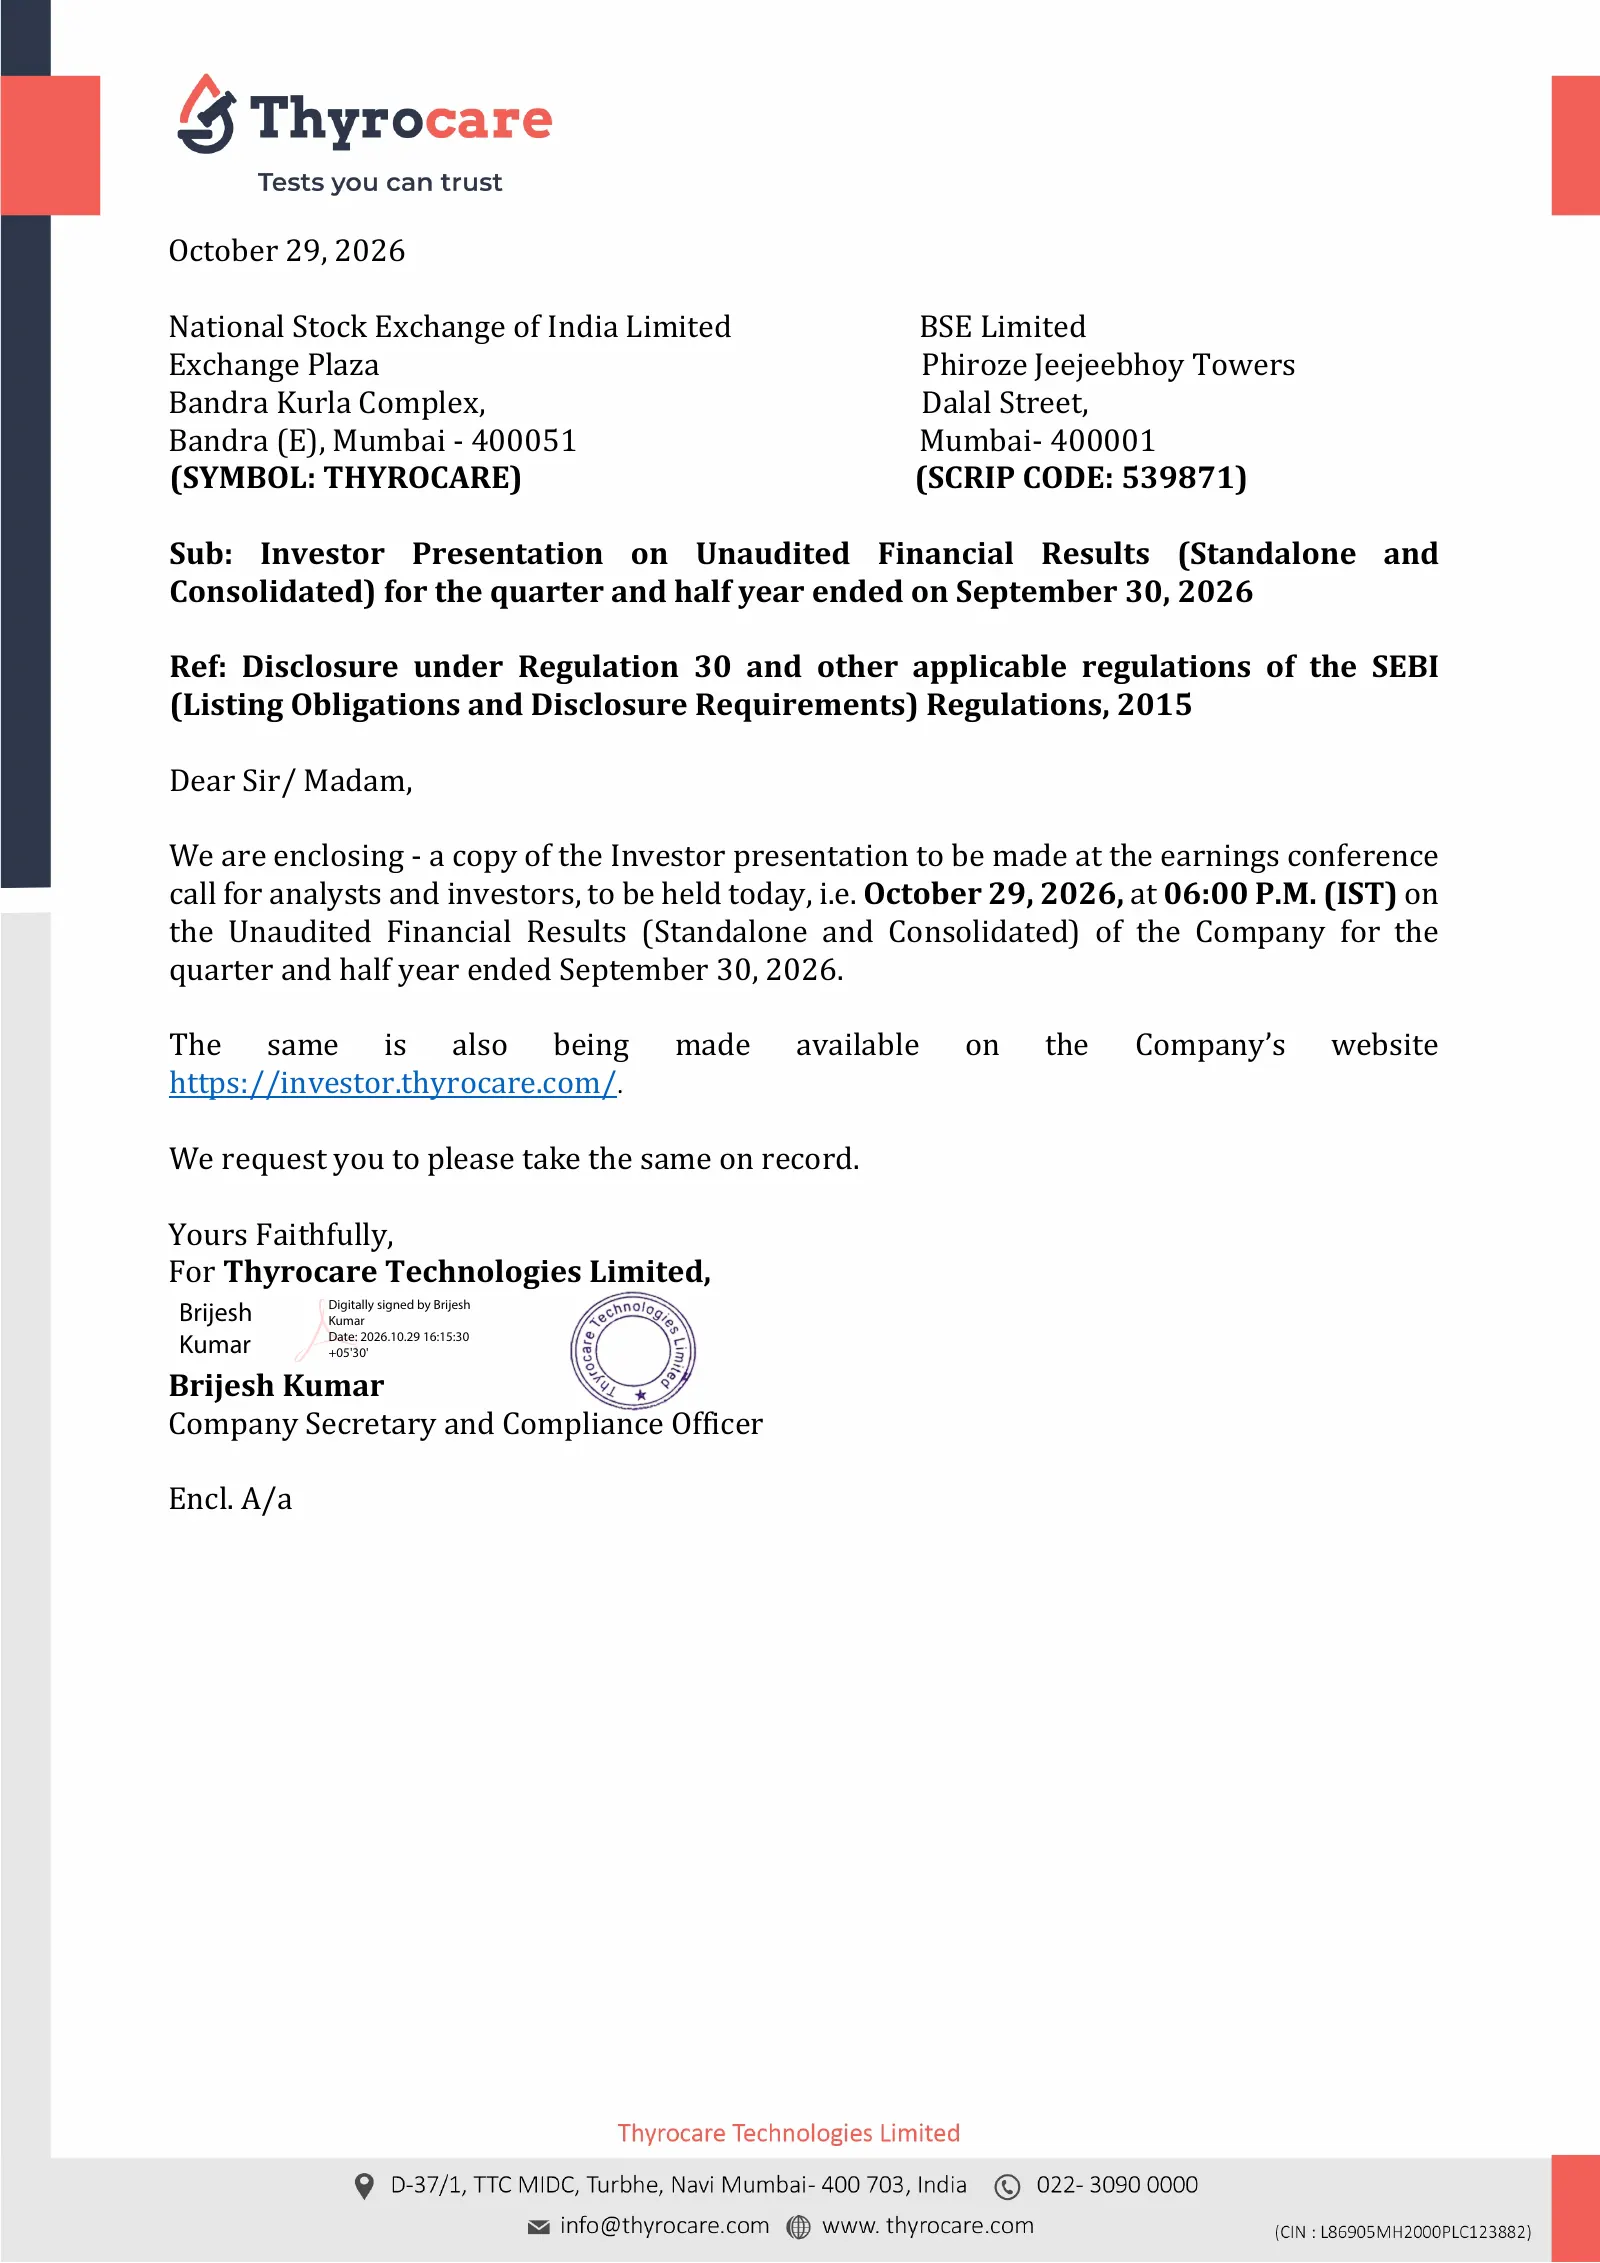
Slide 1: Exchange intimation letter for investor presentation
October 29, 2026 National Stock Exchange of India Limited BSE Limited Exchange Plaza Phiroze Jeejeebhoy Towers Bandra Kurla Complex, Dalal Street, Bandra (E), Mumbai - 400051 Mumbai- 400001 (SYMBOL: THYROCARE) (SCRIP CODE: 539871) Sub: Investor Presentation on Unaudited Financial Results (Standalone

Slide 2: From Routine To Remarkable: Q2 FY27 Earnings Presentation
From Routine To Remarkable: The Next Frontier of Diagnostics Q2 FY27 Earnings Presentation 1
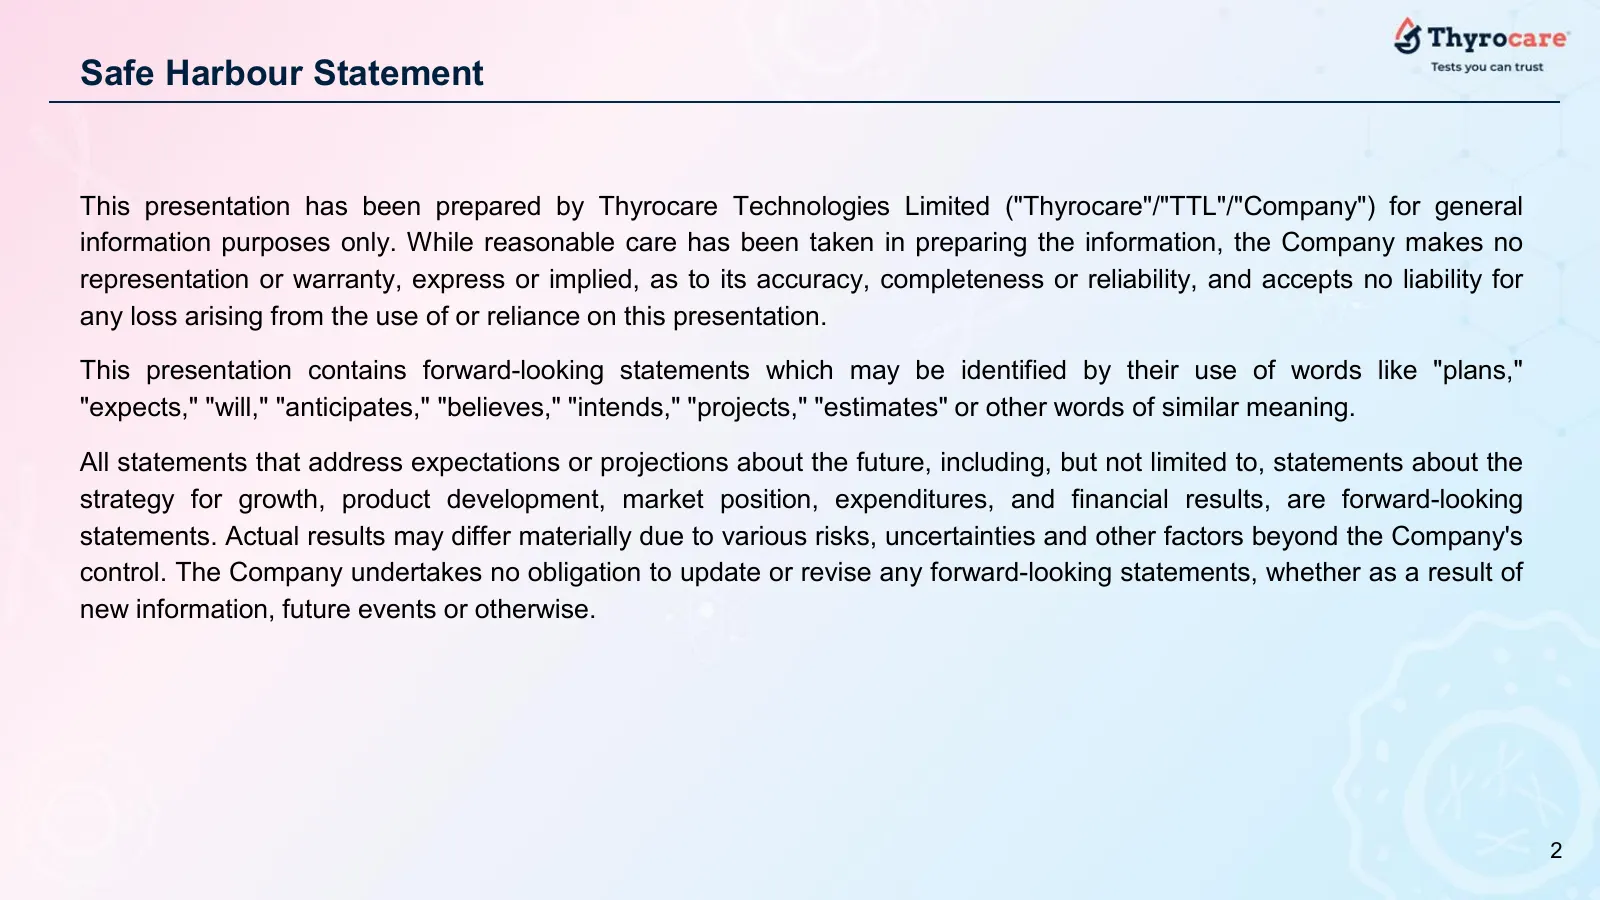
Slide 3: Safe Harbour Statement
Safe Harbour Statement This presentation has been prepared by Thyrocare Technologies Limited ("Thyrocare"/"TTL"/"Company") for general information purposes only. While reasonable care has been taken in preparing the information, the Company makes no representation or warranty, express or implied, as
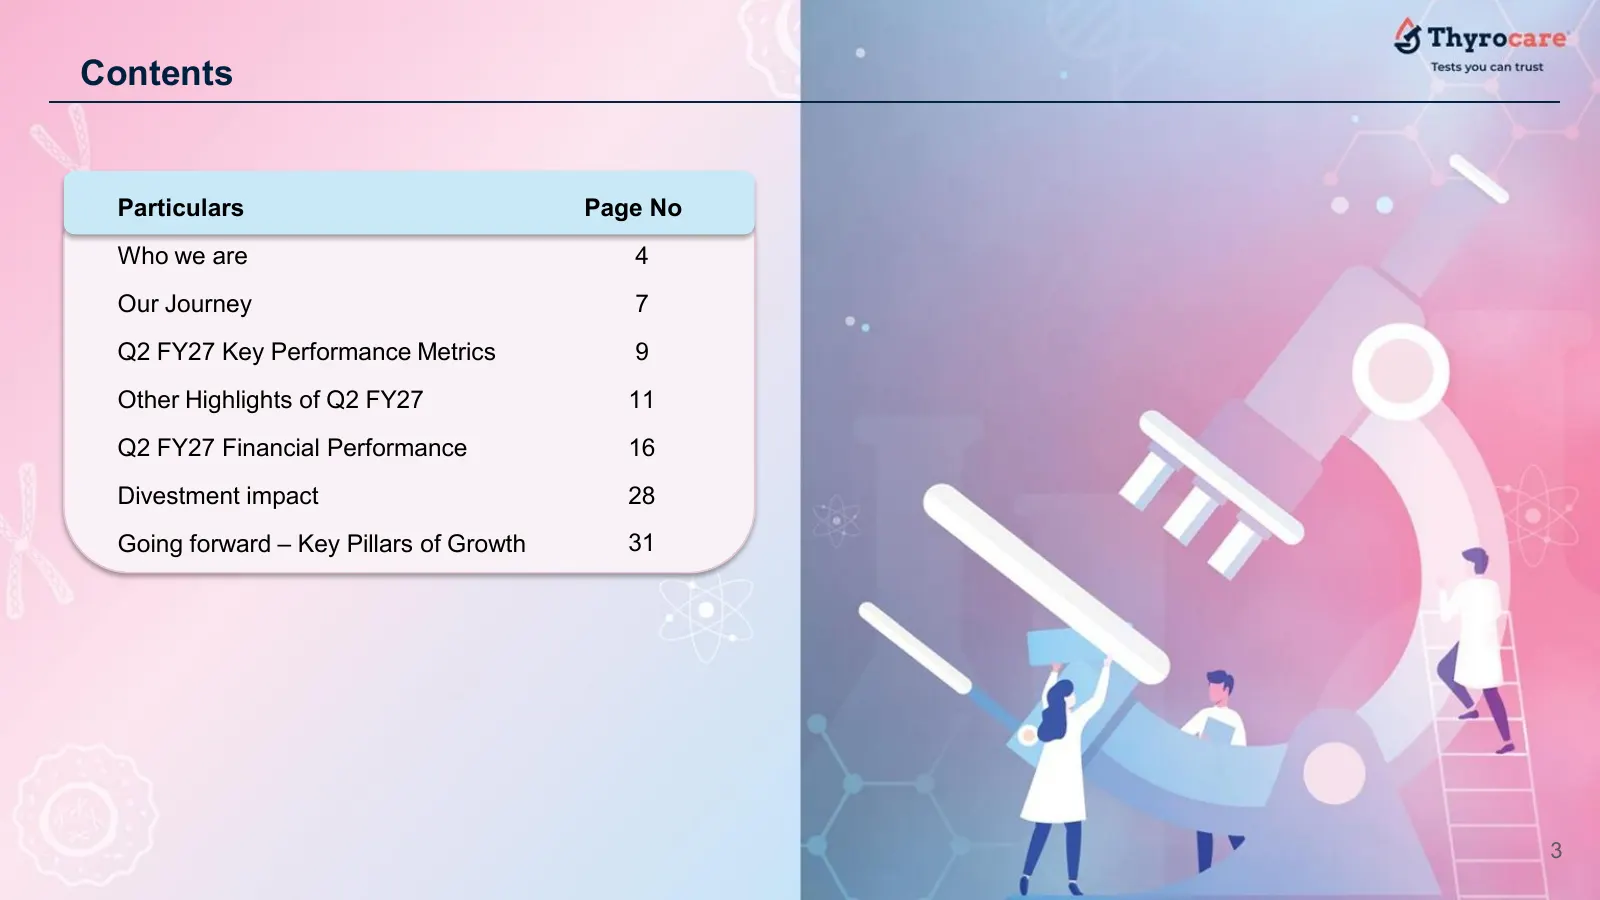
Slide 4: Contents
Contents Particulars Page No Who we are 4 Our Journey 7 Q2 FY27 Key Performance Metrics 9 Other Highlights of Q2 FY27 11 Q2 FY27 Financial Performance 16 Divestment impact 28 Going forward – Key Pillars of Growth 31 3

Slide 5: Who we are
Contents Who we are 4
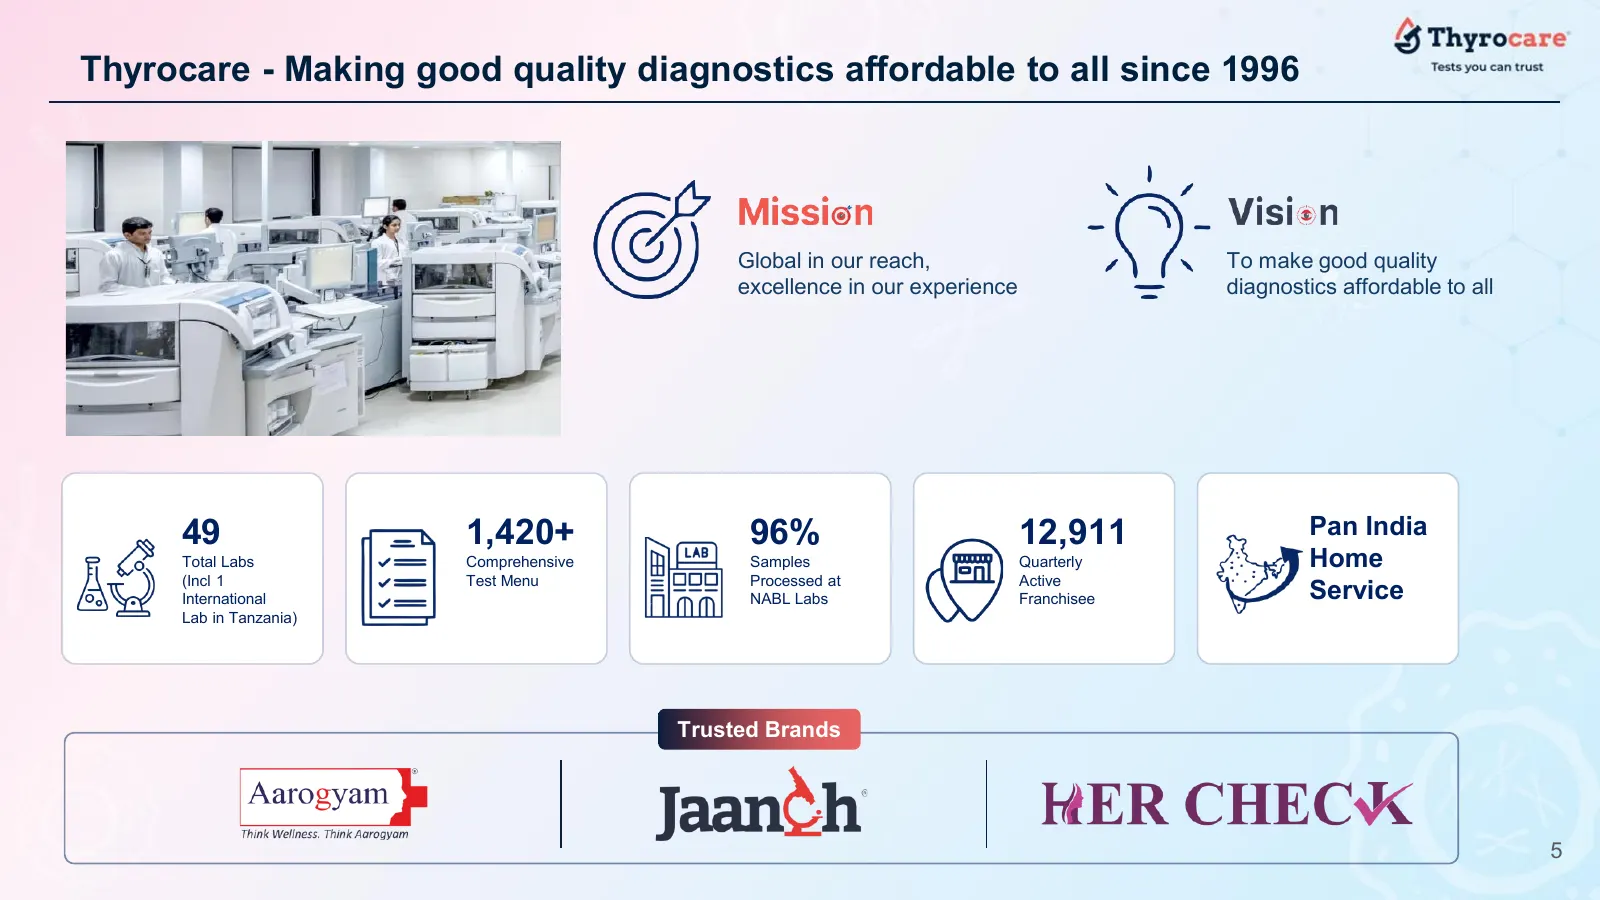
Slide 6: Making good quality diagnostics affordable to all since 1996
Thyrocare - Making good quality diagnostics affordable to all since 1996 Global in our reach, To make good quality excellence in our experience diagnostics affordable to all 49 1,420+ 96% 12,911 Pan India Total Labs Comprehensive Samples Quarterly Home (Incl 1 Test Menu Processed at Active Internati
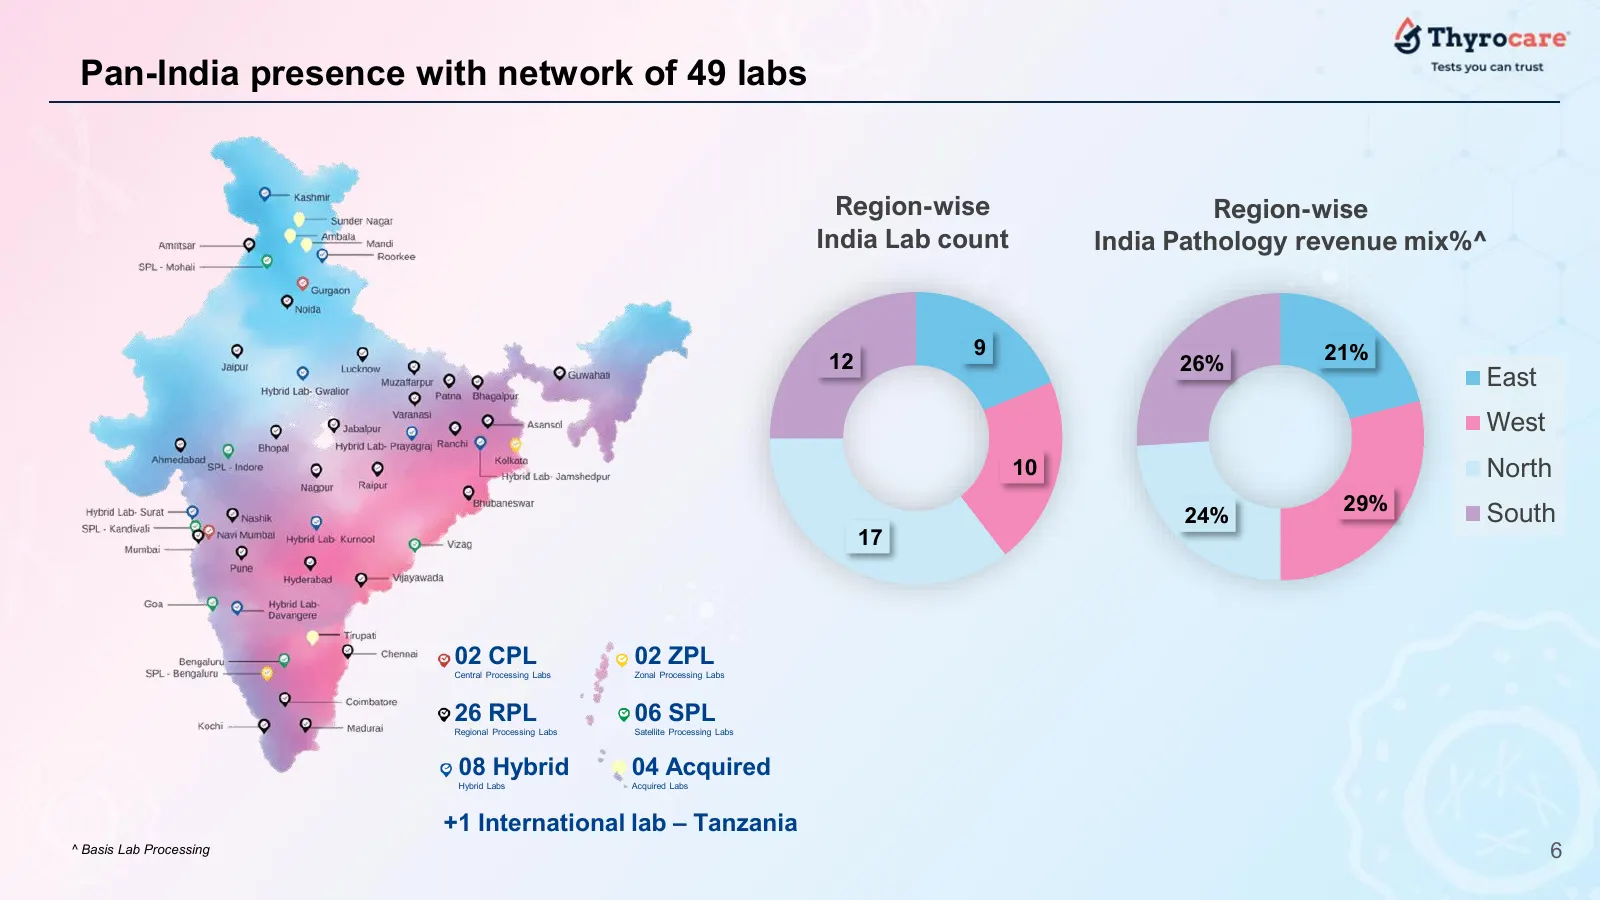
Slide 7: Pan-India presence with network of 49 labs
Pan-India presence with network of 49 labs Region-wise Region-wise India Lab count India Pathology revenue mix%^ 9 21% 12 26% East West 10 North 29% South 24% 17 02 CPL 02 ZPL Central Processing Labs Zonal Processing Labs 26 RPL 06 SPL Regional Processing Labs Satellite Processing Labs 08 Hybrid 04

Slide 8: Our Journey
Contents Our Journey 7
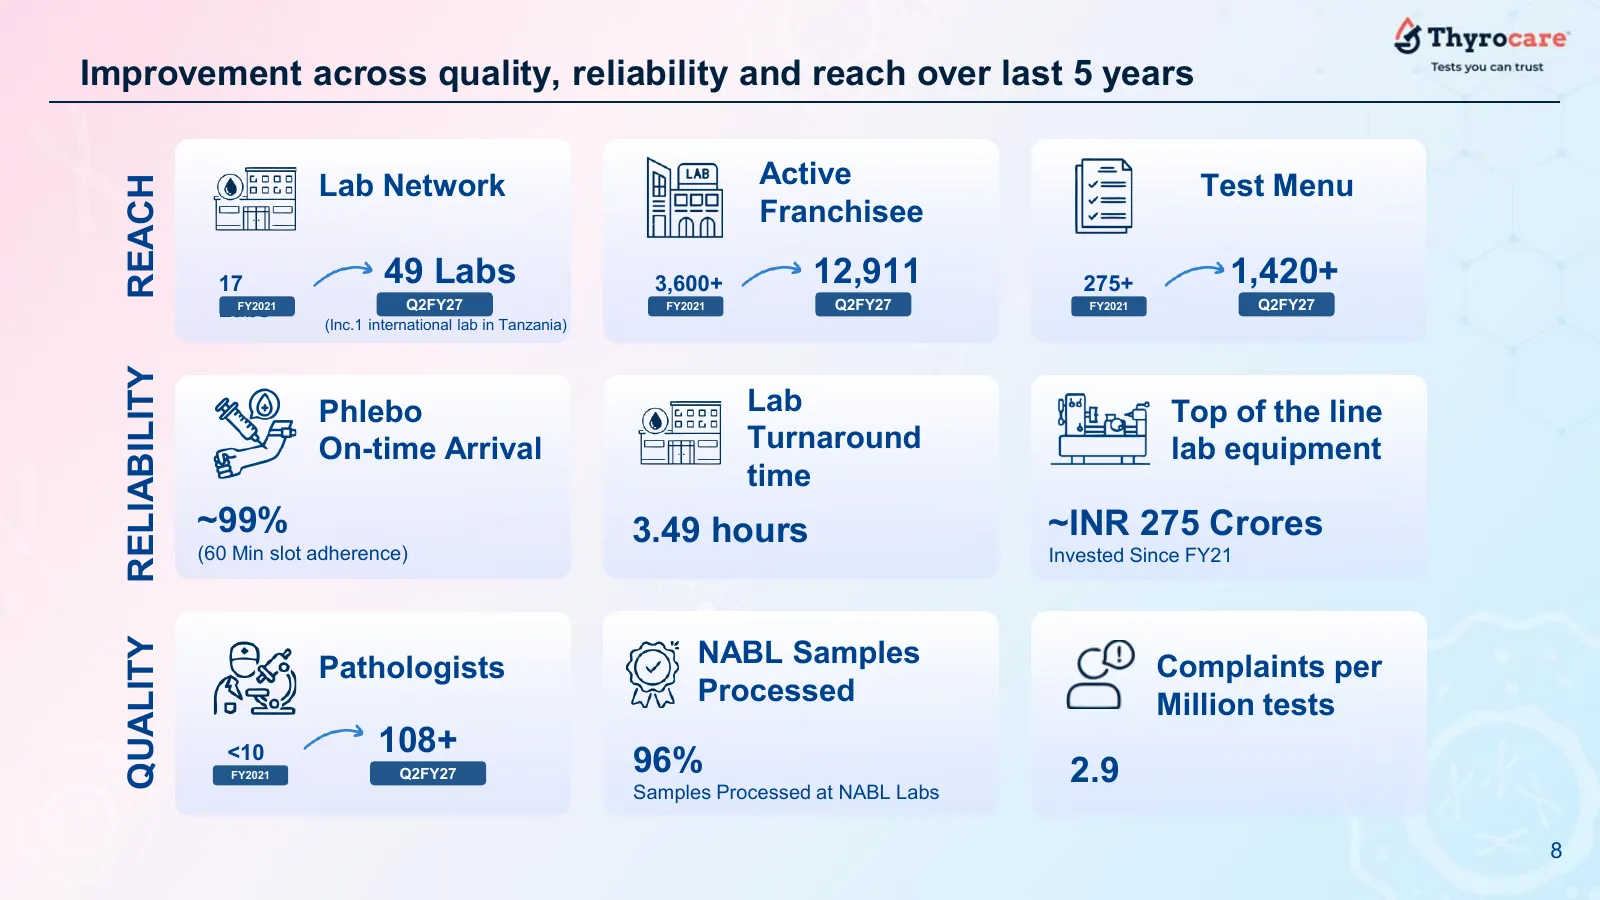
Slide 9: Improvement across quality, reliability and reach over last 5 years
Improvement across quality, reliability and reach over last 5 years Lab Network Active Test Menu REACH Franchisee 17 49 Labs 3,600+ 12,911 275+ 1,420+ Labs FY2021 Q2FY27 FY2021 Q2FY27 FY2021 Q2FY27 (Inc.1 international lab in Tanzania) RELIABILITY Phlebo Lab Top of the line On-time Arrival Turnaroun
Slide 10: Q2 FY27 Key Performance Metrics
Contents Q2 FY27 Key Performance Metrics 9
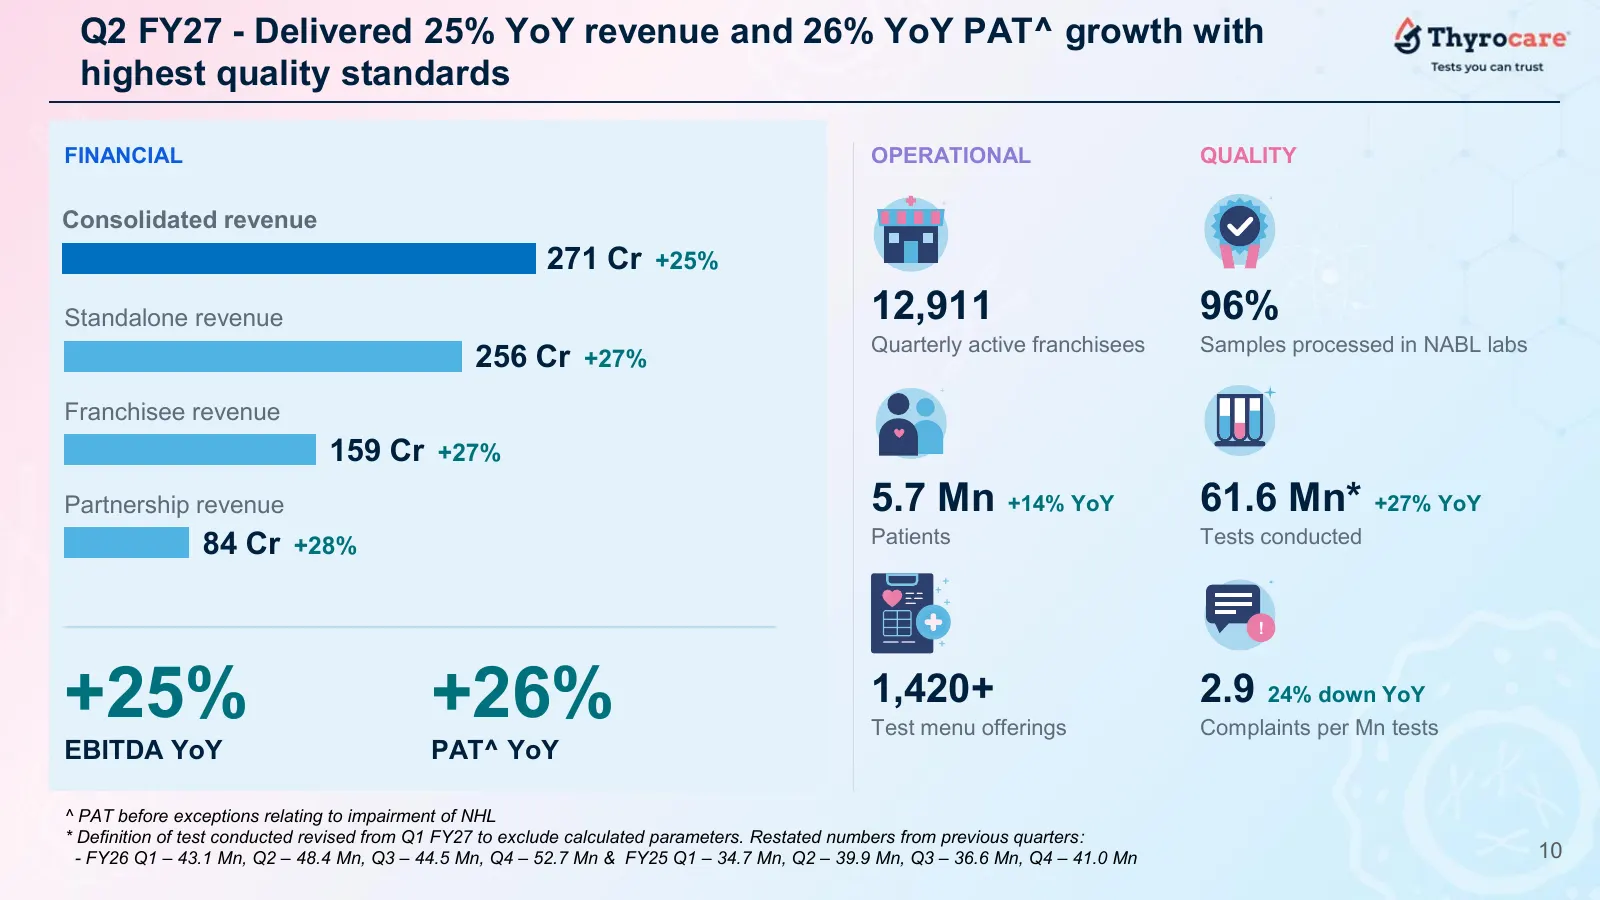
Slide 11: Q2 FY27 - Delivered 25% YoY revenue and 26% YoY PAT growth
Q2 FY27 - Delivered 25% YoY revenue and 26% YoY PAT^ growth with highest quality standards FINANCIAL OPERATIONAL QUALITY Consolidated revenue 271 Cr +25% Standalone revenue 12,911 96% Quarterly active franchisees Samples processed in NABL labs 256 Cr +27% Franchisee revenue 159 Cr +27% Partnership r
Slide 12: Other Highlights of Q2 FY27
Contents Other Highlights of Q2 FY27 11
Slide 13: India's first pregnancy kit with a lab test in every pack
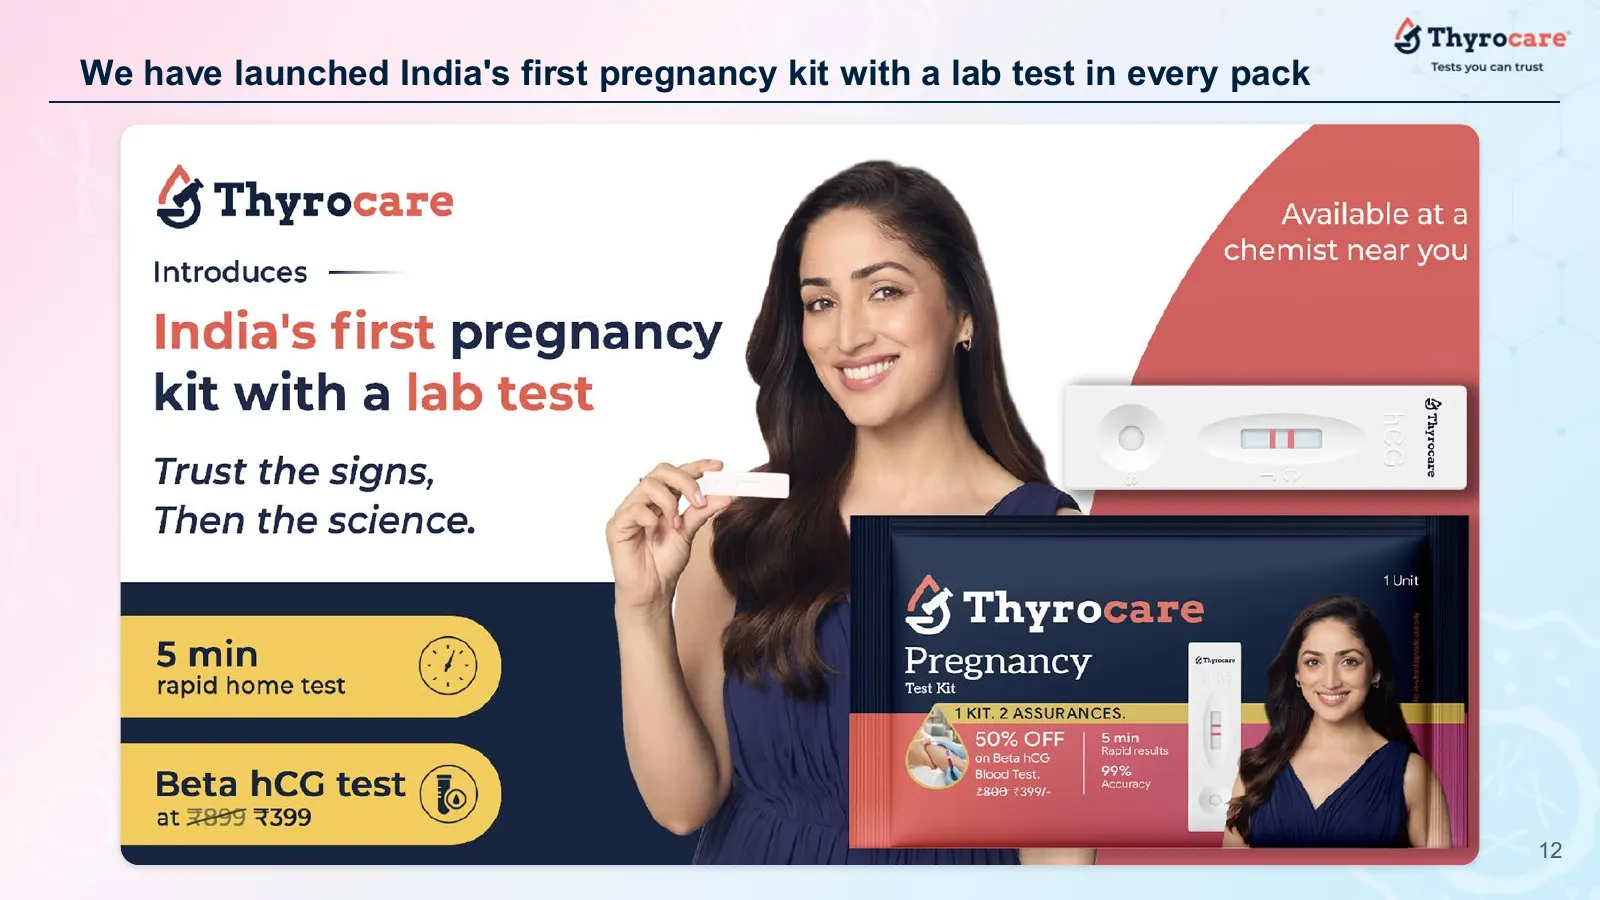
We have launched India's first pregnancy kit with a lab test in every pack 12
Slide 14: 5 new labs launched this quarter
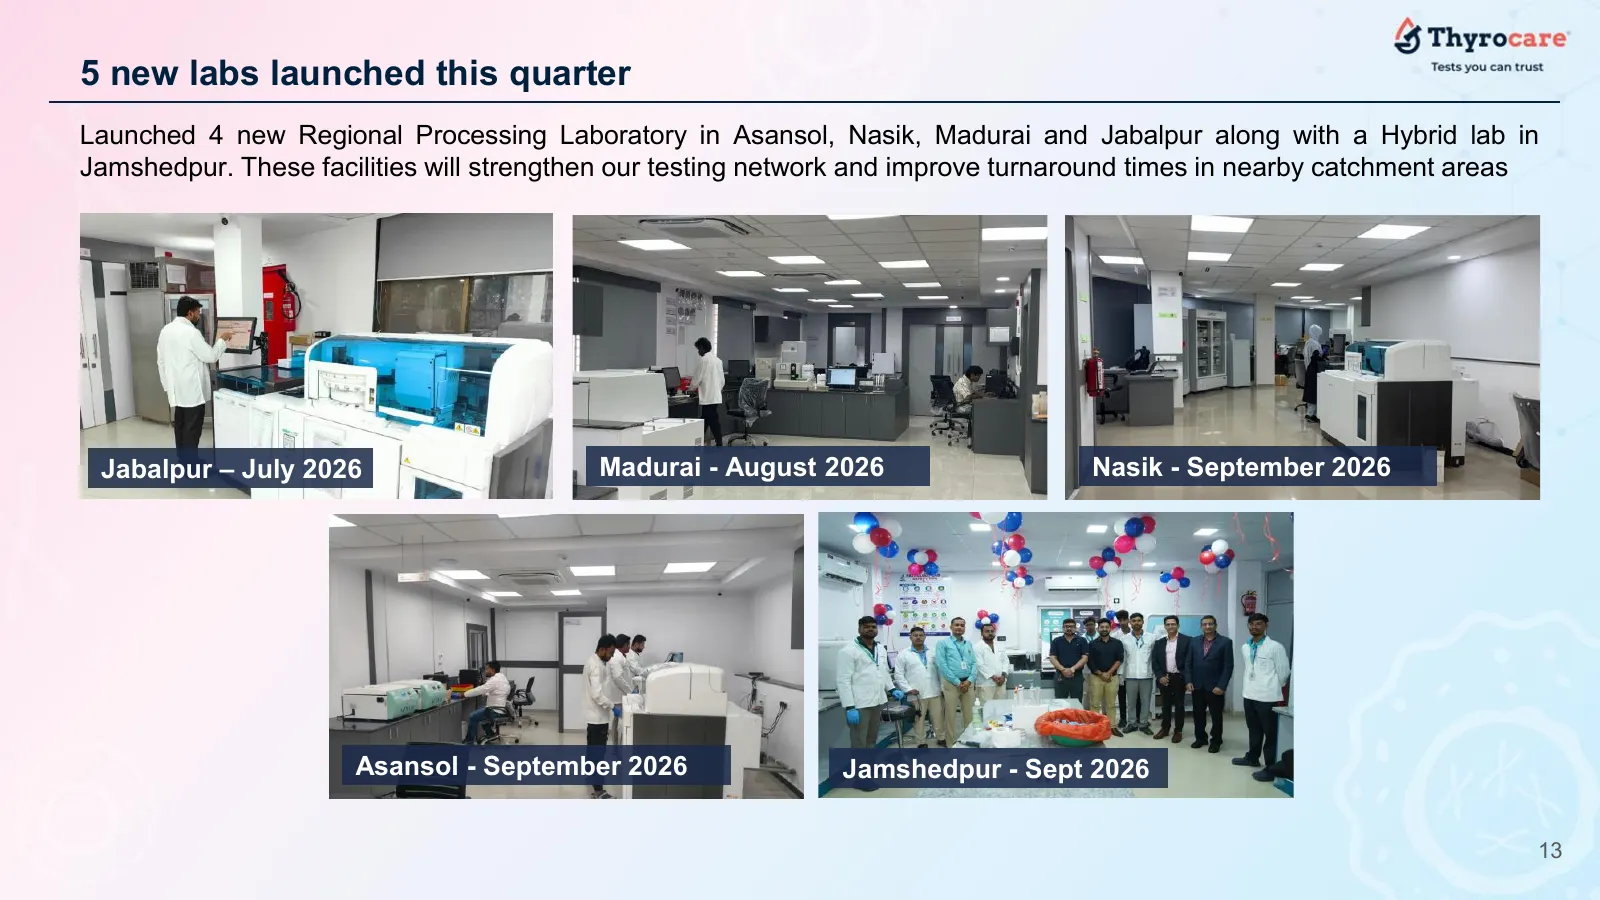
5 new labs launched this quarter Launched 4 new Regional Processing Laboratory in Asansol, Nasik, Madurai and Jabalpur along with a Hybrid lab in Jamshedpur. These facilities will strengthen our testing network and improve turnaround times in nearby catchment areas Jabalpur – July 2026 Madurai - Aug
Slide 15: Strengthening our relationships with channel partners
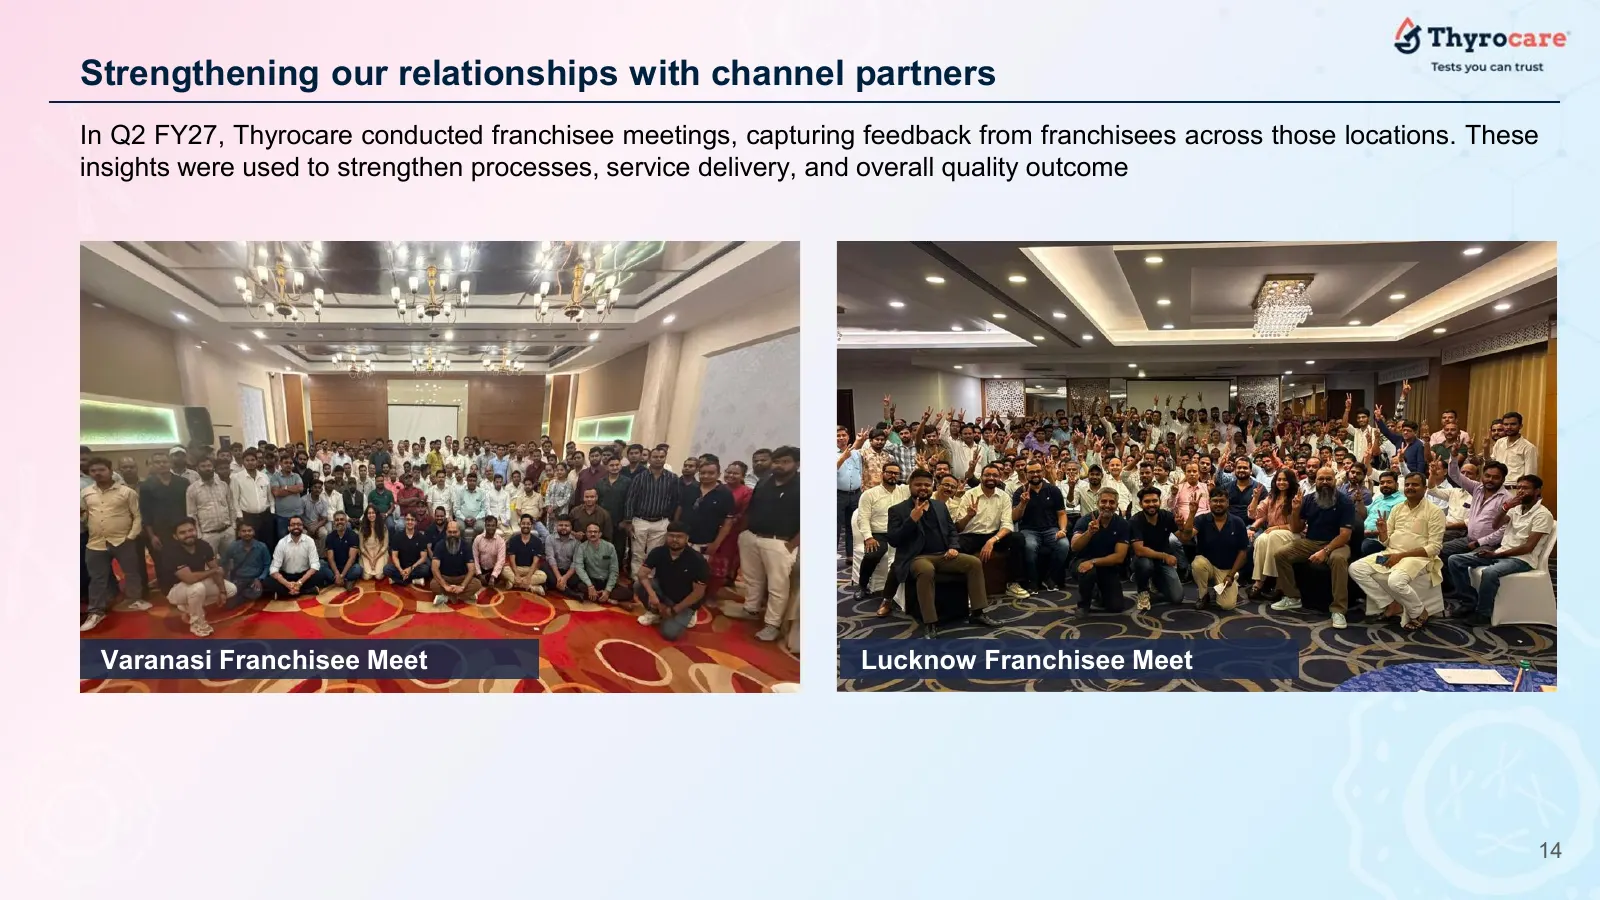
Strengthening our relationships with channel partners In Q2 FY27, Thyrocare conducted franchisee meetings, capturing feedback from franchisees across those locations. These insights were used to strengthen processes, service delivery, and overall quality outcome Varanasi Franchisee Meet Lucknow Fran
Slide 16: Strengthening our relationships with Doctors
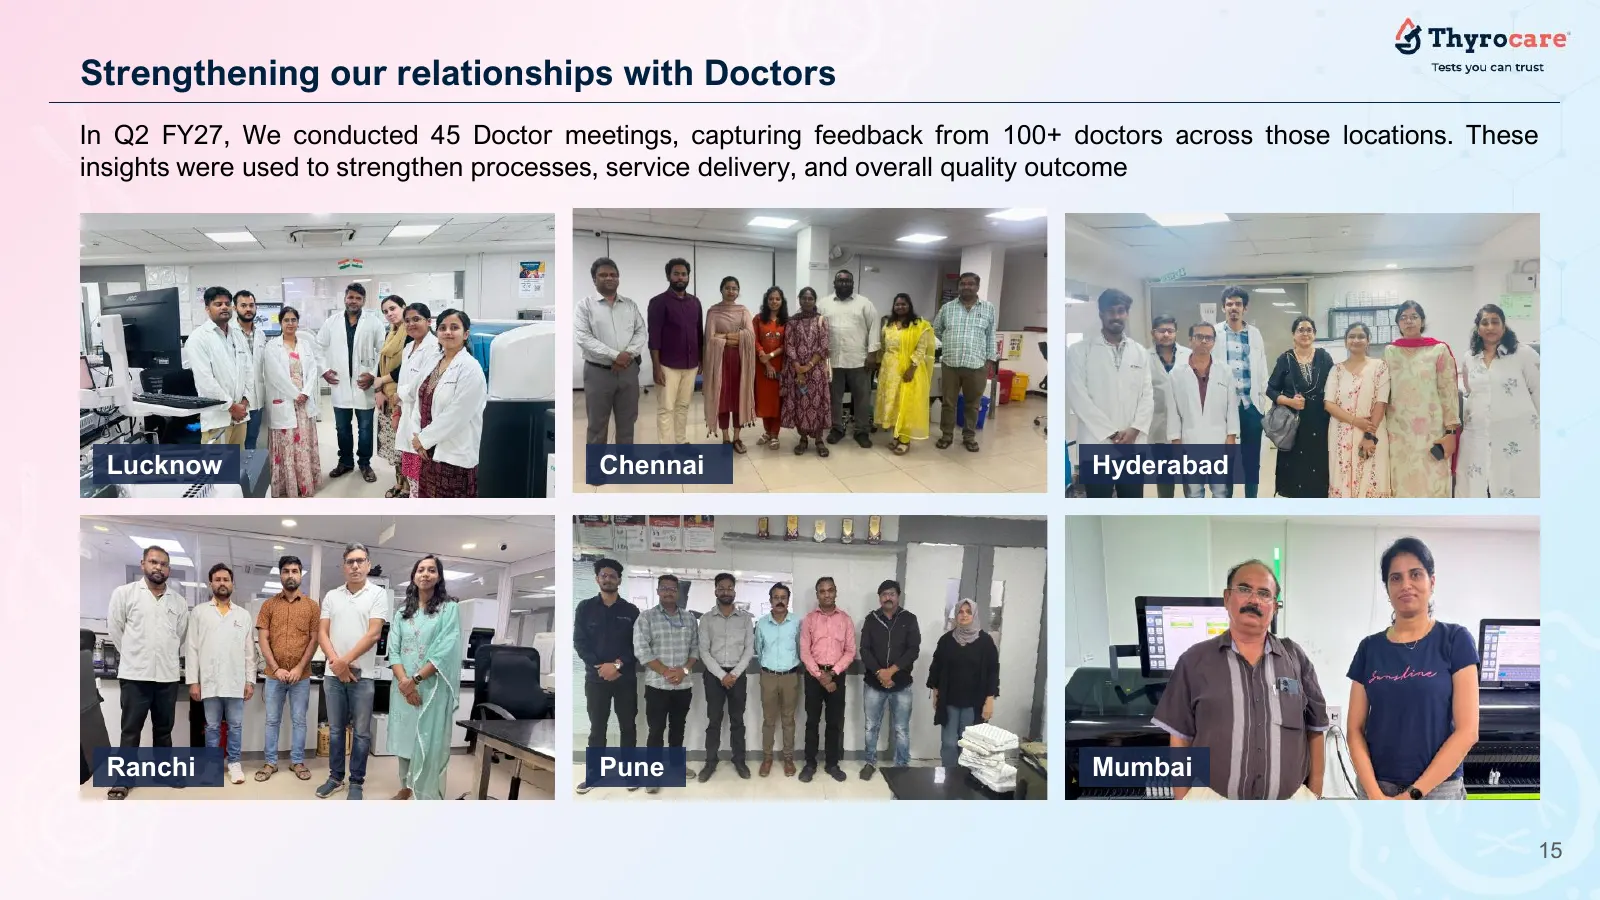
Strengthening our relationships with Doctors In Q2 FY27, We conducted 45 Doctor meetings, capturing feedback from 100+ doctors across those locations. These insights were used to strengthen processes, service delivery, and overall quality outcome Lucknow Chennai Hyderabad Ranchi Pune Mumbai 15
Slide 17: Q2 FY27 Financial Performance
Contents Q2 FY27 Financial Performance 16
Slide 18: Financial Performance Q2 & H1 FY27
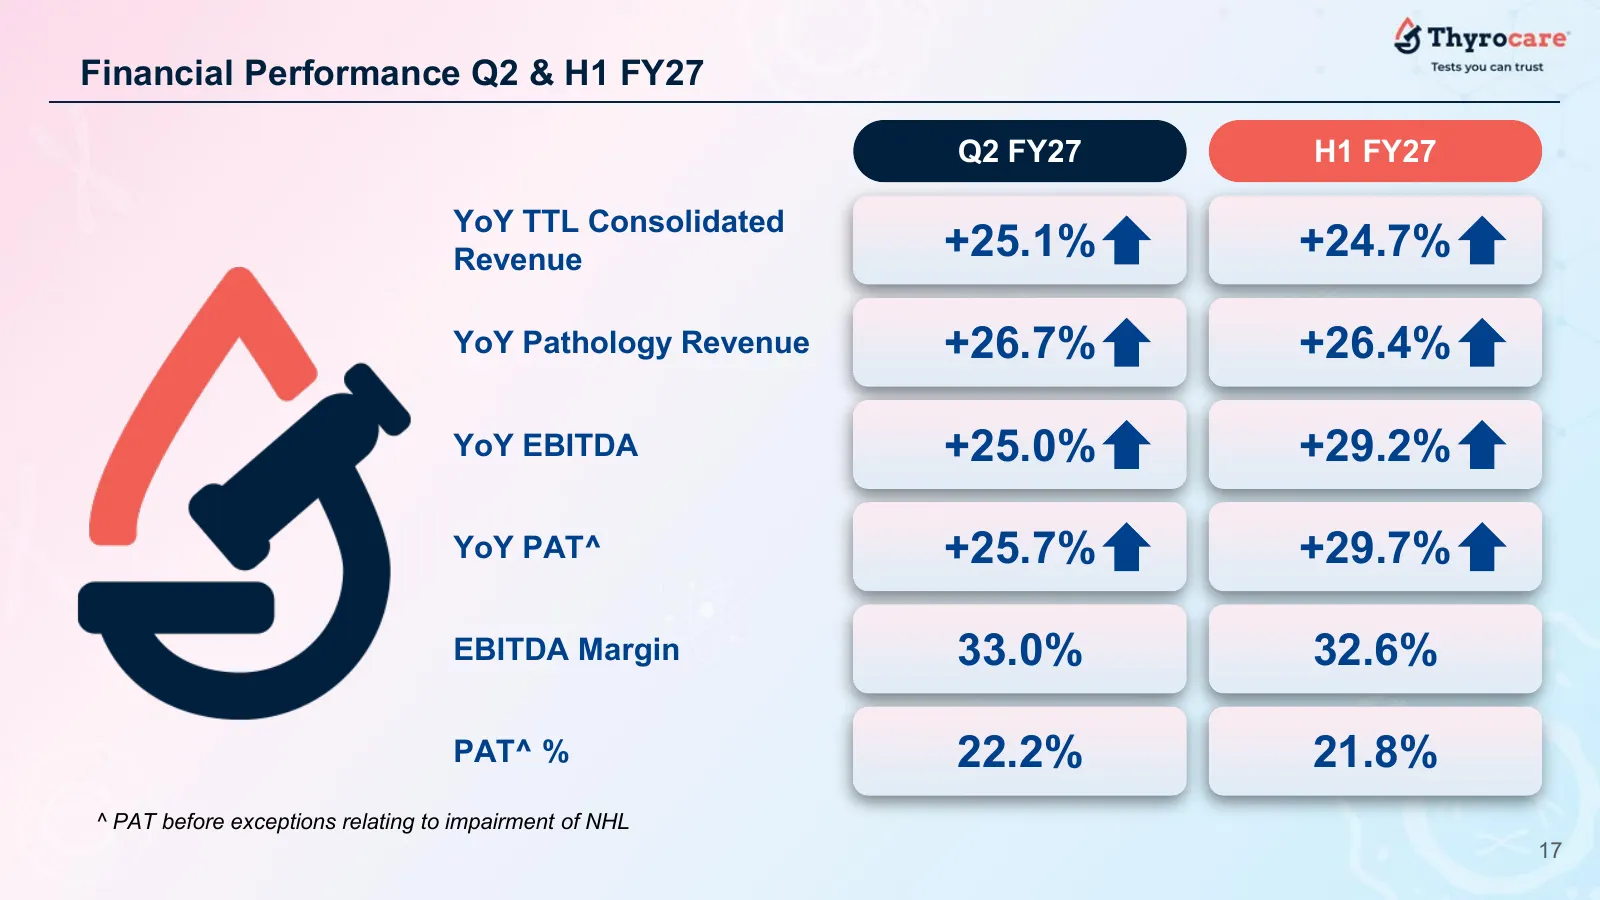
Financial Performance Q2 & H1 FY27 Q2 FY27 H1 FY27 YoY TTL Consolidated Revenue +25.1% +24.7% YoY Pathology Revenue +26.7% +26.4% YoY EBITDA +25.0% +29.2% YoY PAT^ +25.7% +29.7% EBITDA Margin 33.0% 32.6% PAT^ % 22.2% 21.8% ^ PAT before exceptions relating to impairment of NHL 17
Slide 19: 25.1% YoY revenue growth and 25.0% YoY EBITDA growth in Q2 FY27
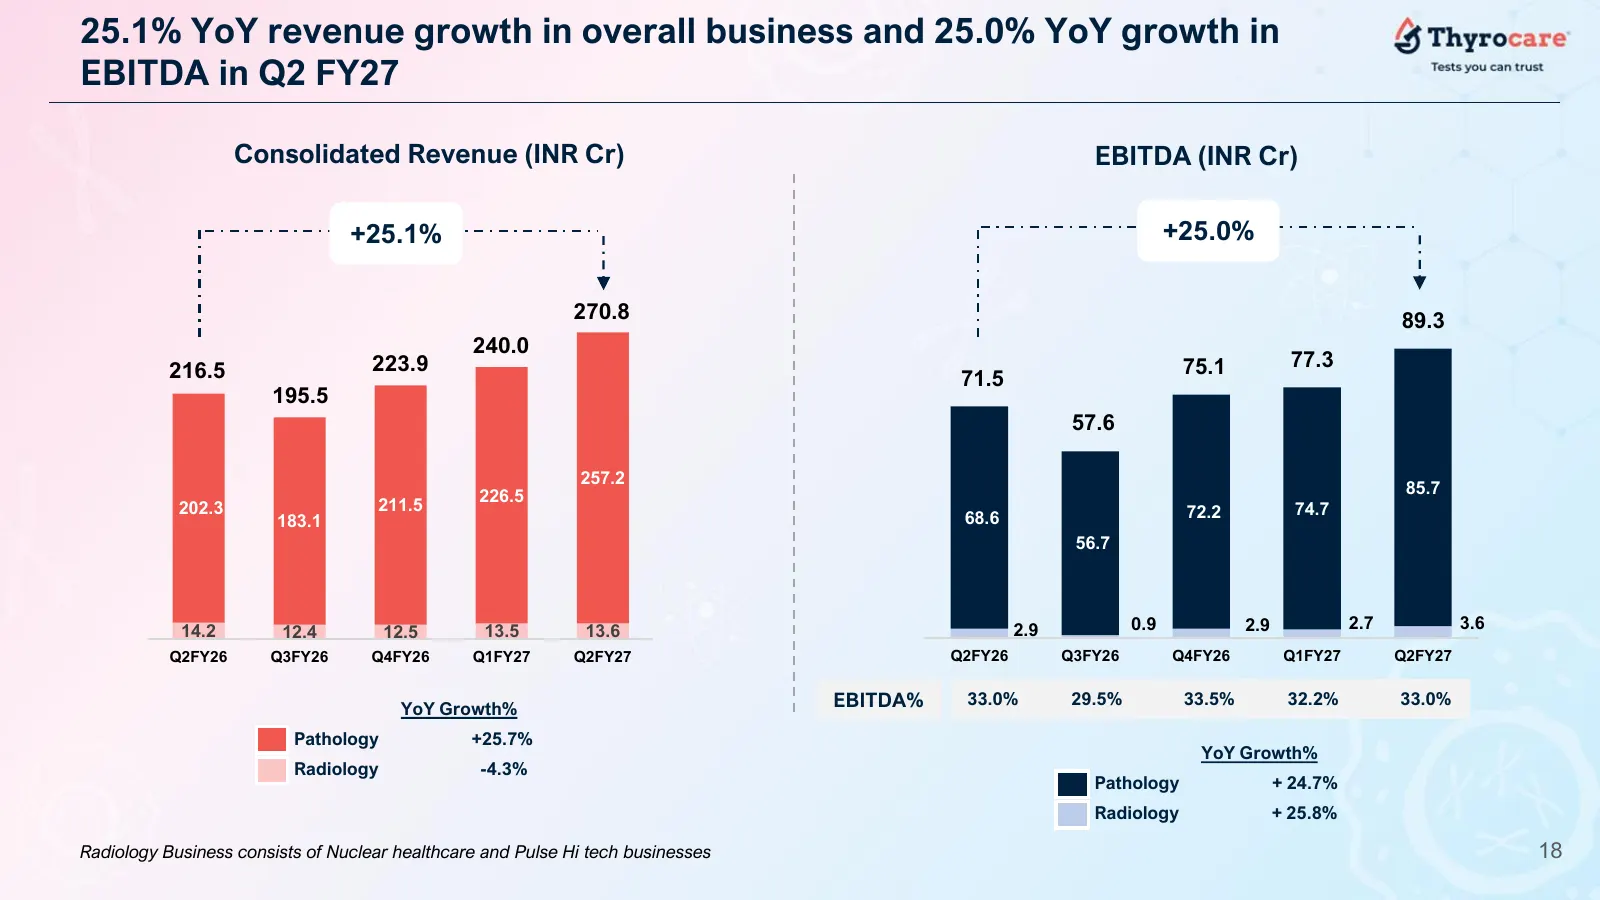
25.1% YoY revenue growth in overall business and 25.0% YoY growth in EBITDA in Q2 FY27 Consolidated Revenue (INR Cr) EBITDA (INR Cr) +25.1% +25.0% 270.8 89.3 240.0 216.5 223.9 75.1 77.3 71.5 195.5 57.6 257.2 226.5 85.7 202.3 211.5 72.2 74.7 183.1 68.6 56.7 14.2 12.4 12.5 13.5 13.6 2.9 0.9 2.9 2.7 3.
Slide 20: Consistent and healthy growth across business verticals
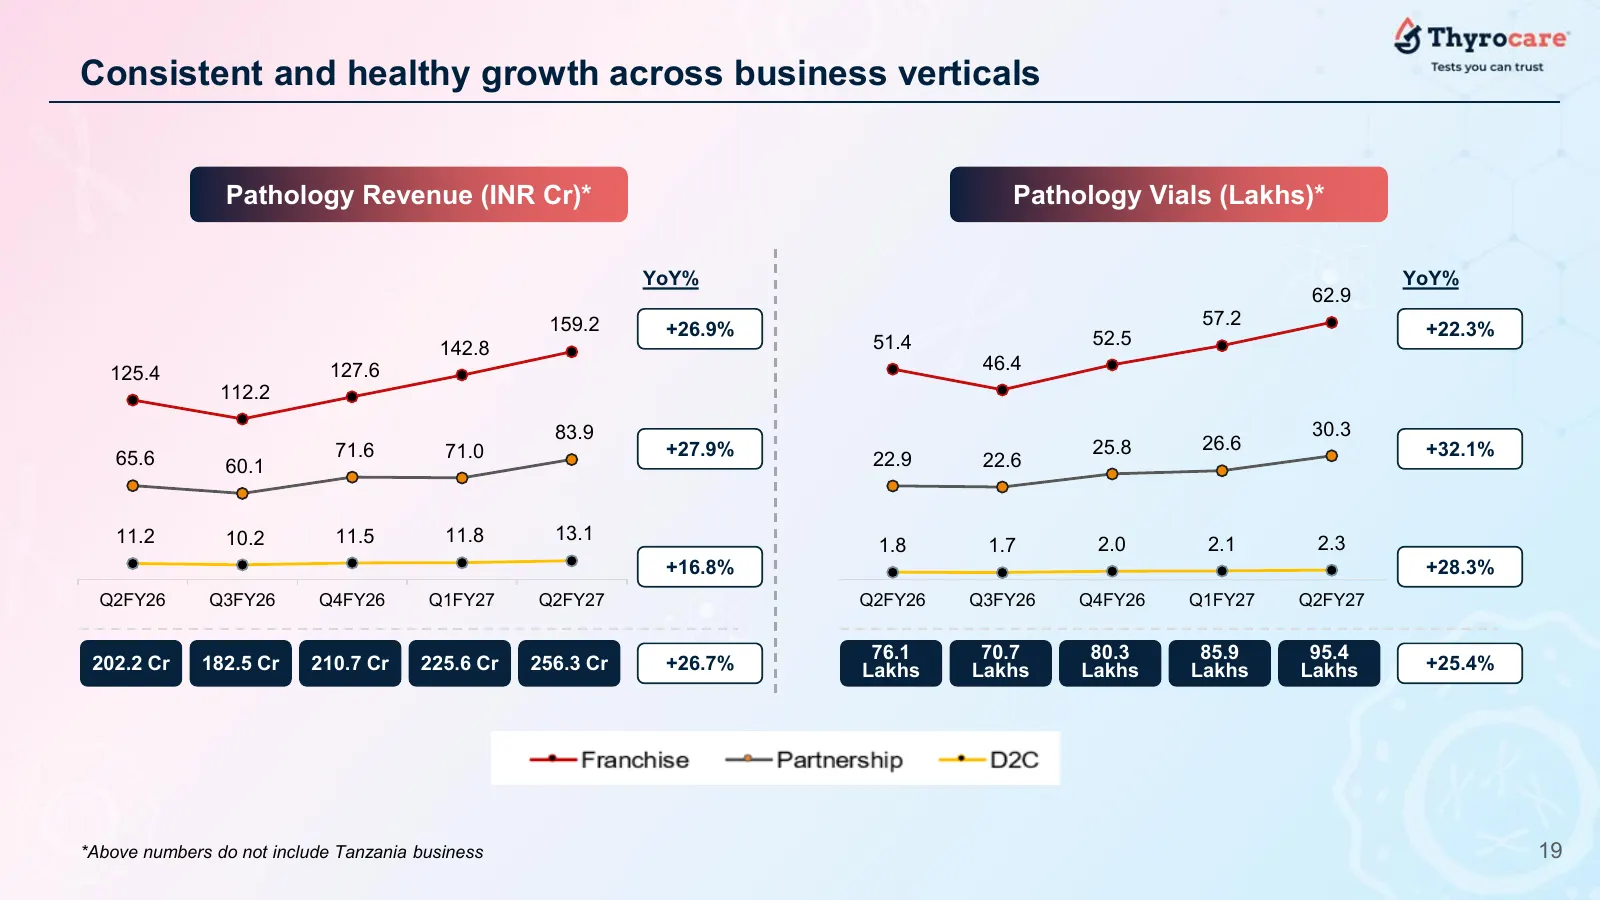
Consistent and healthy growth across business verticals Pathology Revenue (INR Cr)* Pathology Vials (Lakhs)* YoY% YoY% 62.9 159.2 57.2 +26.9% 52.5 +22.3% 142.8 51.4 127.6 46.4 125.4 112.2 83.9 30.3 71.6 71.0 +27.9% 25.8 26.6 +32.1% 65.6 60.1 22.9 22.6 11.2 10.2 11.5 11.8 13.1 2.3 1.8 1.7 2.0 2.1 +16
Slide 21: Strong and consistent growth outlined by key metrics
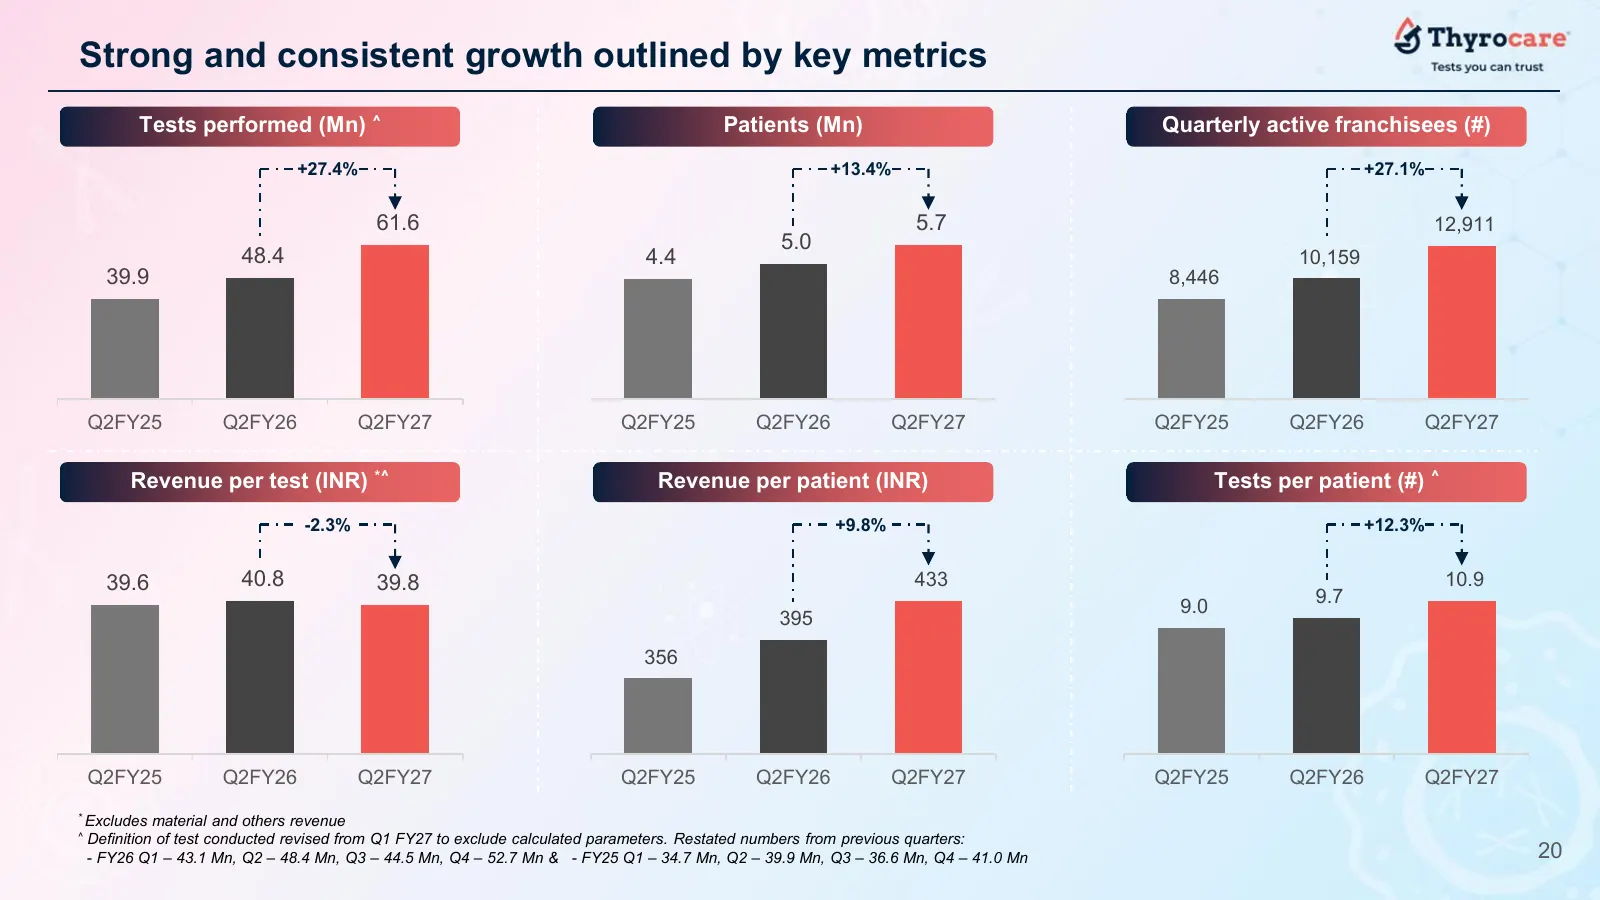
Strong and consistent growth outlined by key metrics Tests performed (Mn) ^ Patients (Mn) Quarterly active franchisees (#) +27.4% +13.4% +27.1% 61.6 5.7 12,911 5.0 48.4 4.4 10,159 39.9 8,446 Q2FY25 Q2FY26 Q2FY27 Q2FY25 Q2FY26 Q2FY27 Q2FY25 Q2FY26 Q2FY27 Revenue per test (INR) *^ Revenue per patient
Slide 22: Consistent franchisee expansion with ~1180 additions in Q2FY27
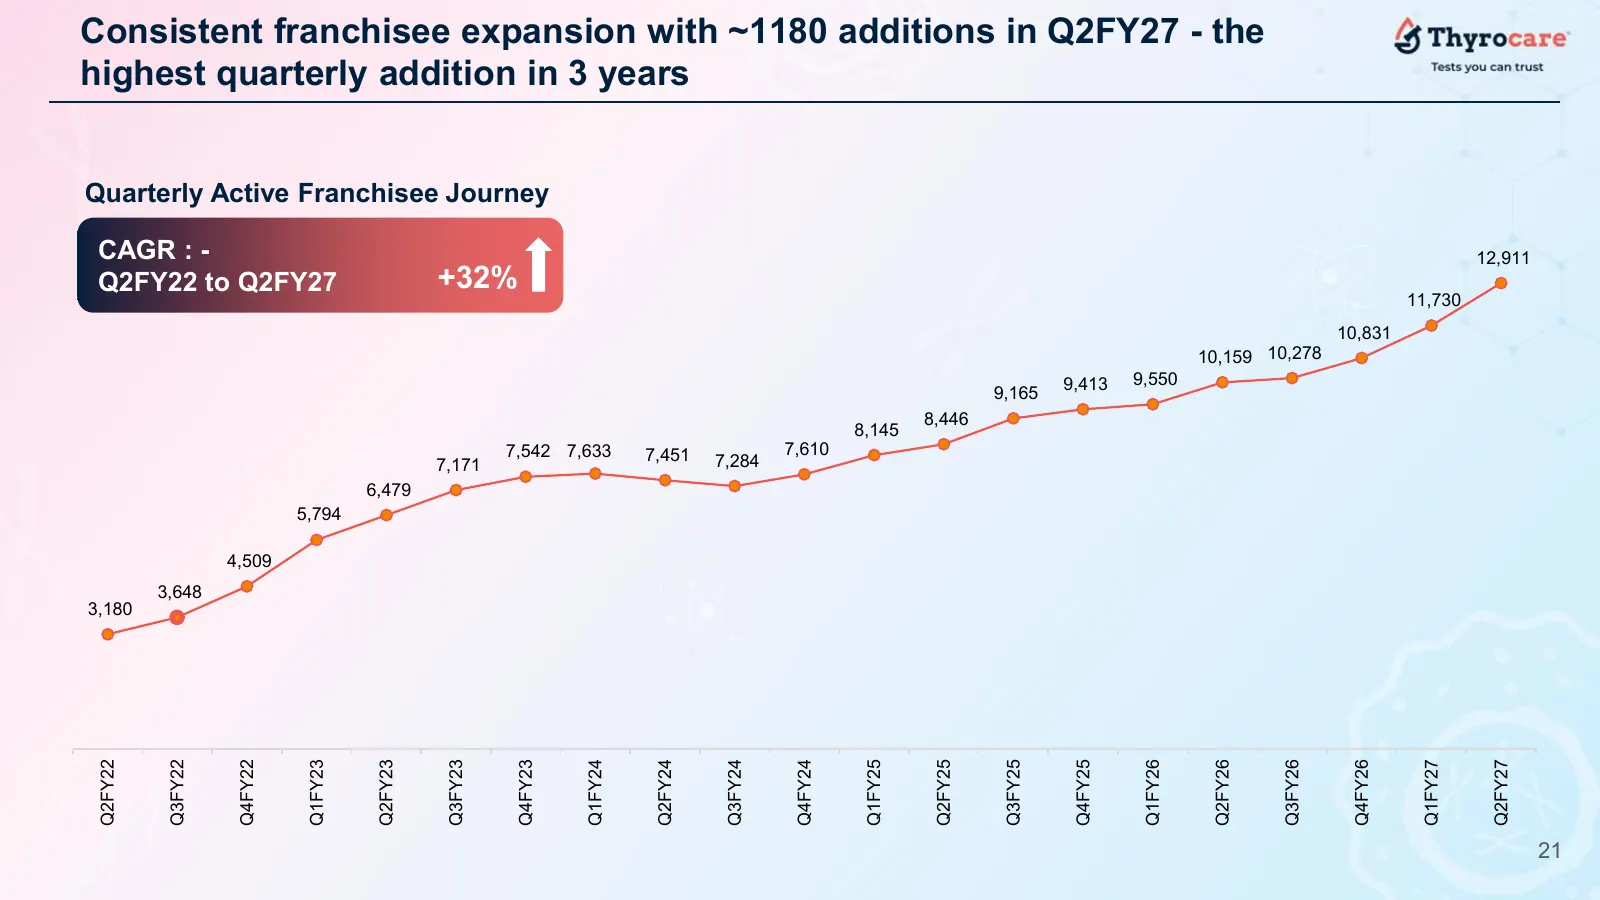
Consistent franchisee expansion with ~1180 additions in Q2FY27 - the highest quarterly addition in 3 years Quarterly Active Franchisee Journey CAGR : - 12,911 Q2FY22 to Q2FY27 +32% 11,730 10,831 10,159 10,278 9,413 9,550 9,165 8,446 8,145 7,542 7,633 7,451 7,610 7,171 7,284 6,479 5,794 4,509 3,648 3
Slide 23: Sustained growth with 21% CAGR over 5 years in Pathology Revenue
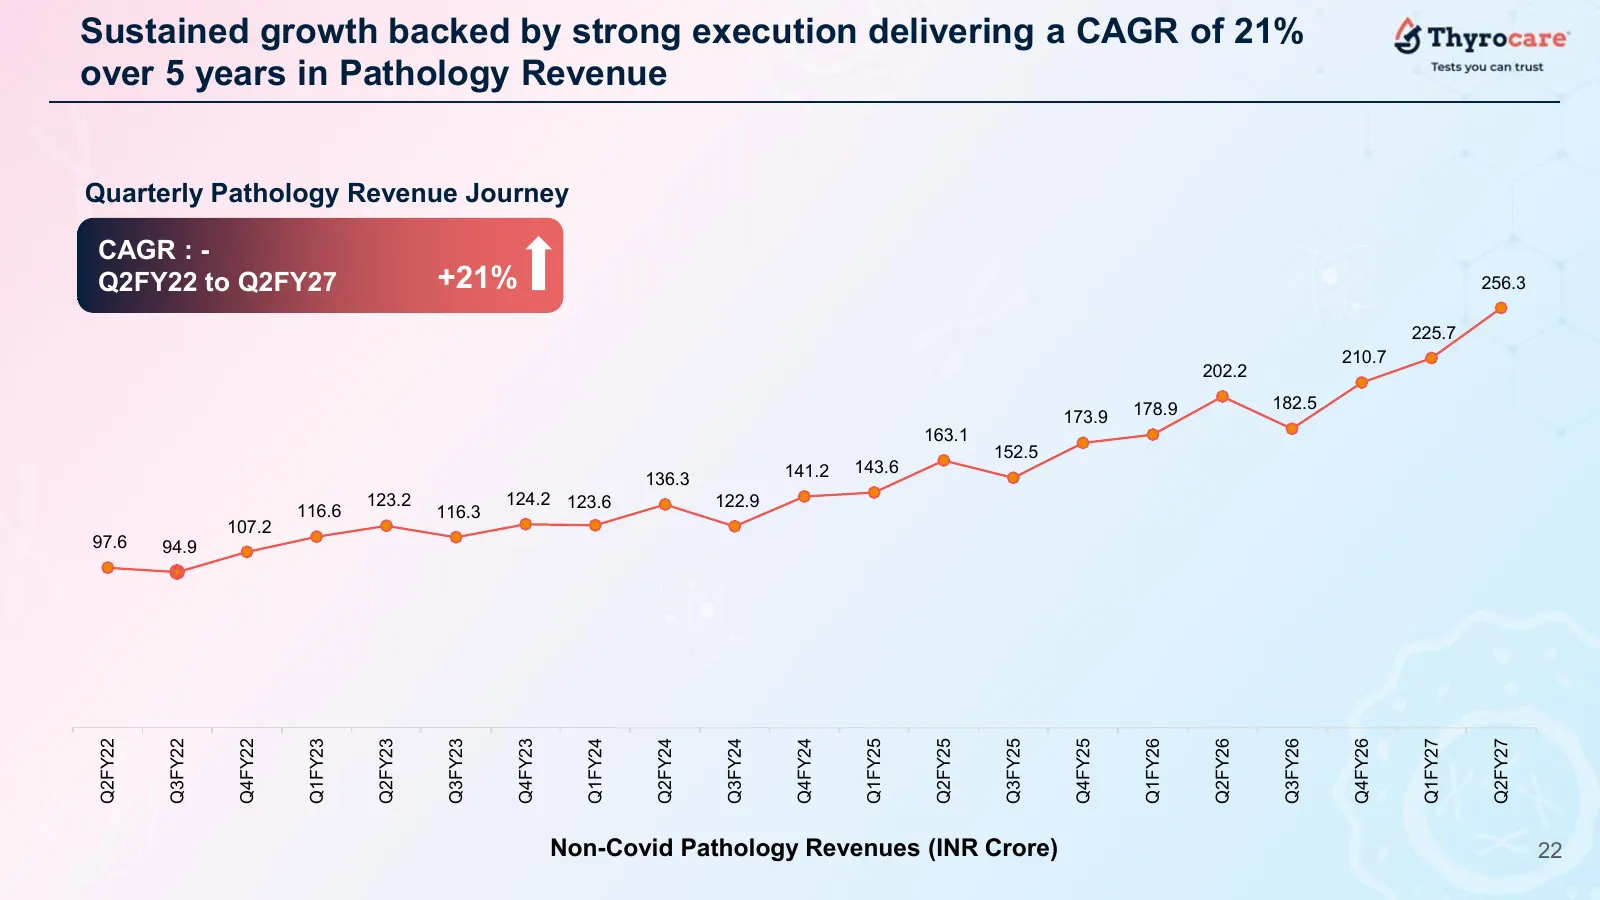
Sustained growth backed by strong execution delivering a CAGR of 21% over 5 years in Pathology Revenue Quarterly Pathology Revenue Journey CAGR : - Q2FY22 to Q2FY27 +21% 256.3 225.7 210.7 202.2 178.9 182.5 173.9 163.1 152.5 141.2 143.6 136.3 123.2 124.2 123.6 122.9 116.6 116.3 107.2 97.6 94.9 Q2FY25
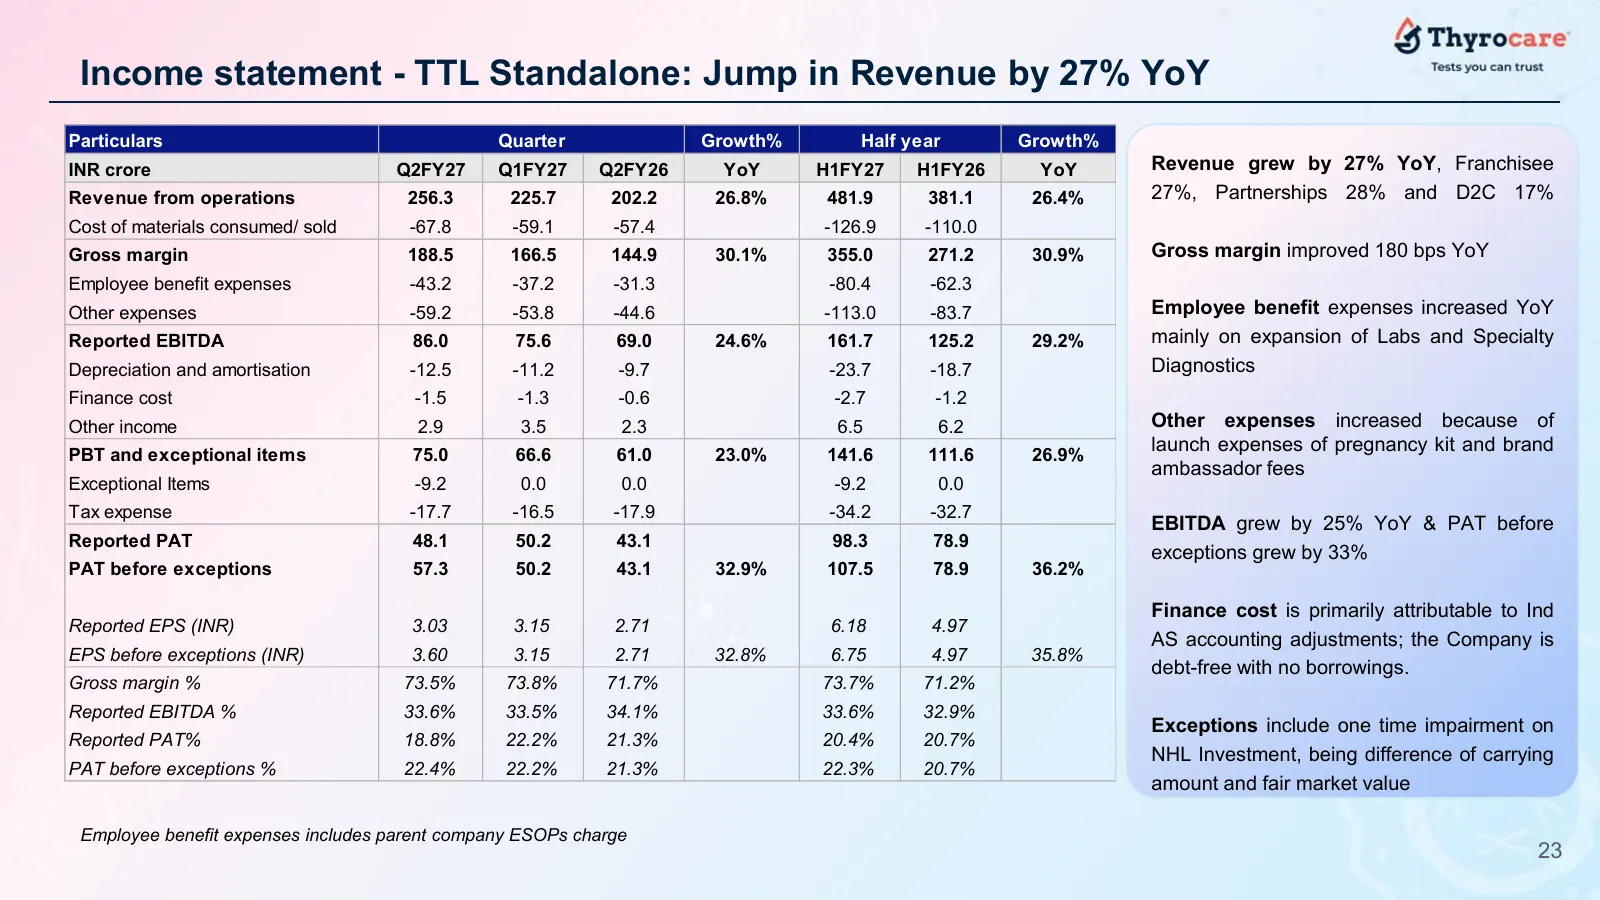
Slide 24: Income statement - TTL Standalone
Income statement - TTL Standalone: Jump in Revenue by 27% YoY Particulars Quarter Growth% Half year Growth% INR crore Q2FY27 Q1FY27 Q2FY26 YoY H1FY27 H1FY26 YoY Revenue grew by 27% YoY, Franchisee Revenue from operations 256.3 225.7 202.2 26.8% 481.9 381.1 26.4% 27%, Partnerships 28% and D2C 17% Cos
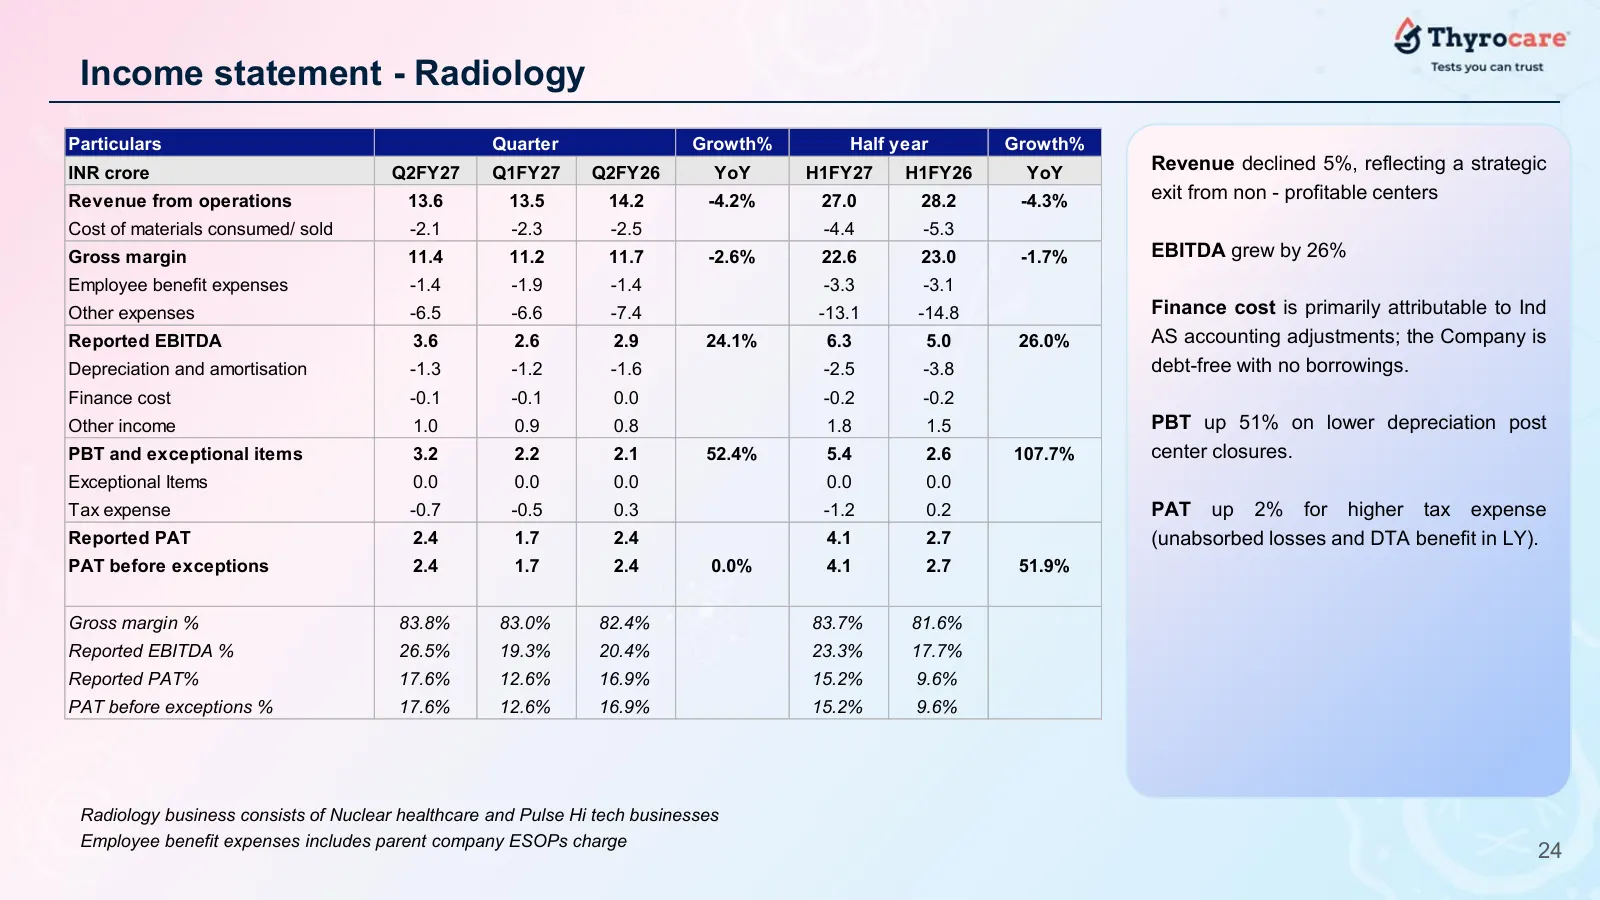
Slide 25: Income statement - Radiology
Income statement - Radiology Particulars Quarter Growth% Half year Growth% INR crore Q2FY27 Q1FY27 Q2FY26 YoY H1FY27 H1FY26 YoY Revenue declined 5%, reflecting a strategic Revenue from operations 13.6 13.5 14.2 -4.2% 27.0 28.2 -4.3% exit from non - profitable centers Cost of materials consumed/ sold
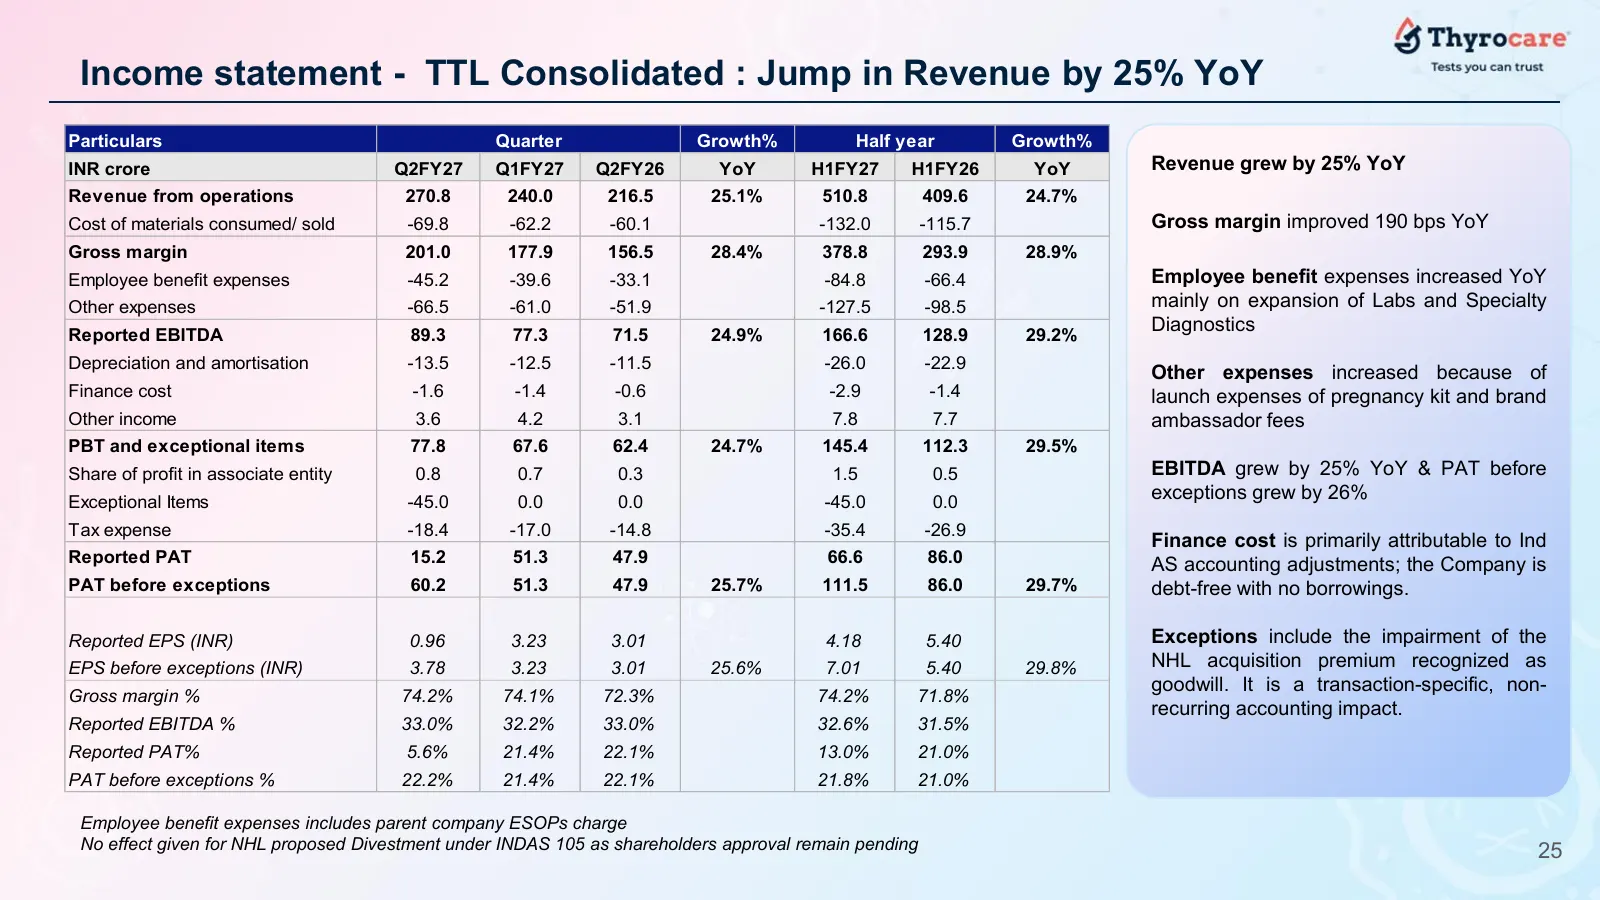
Slide 26: Income statement - TTL Consolidated
Income statement - TTL Consolidated : Jump in Revenue by 25% YoY Particulars Quarter Growth% Half year Growth% INR crore Q2FY27 Q1FY27 Q2FY26 YoY H1FY27 H1FY26 YoY Revenue grew by 25% YoY Revenue from operations 270.8 240.0 216.5 25.1% 510.8 409.6 24.7% Cost of materials consumed/ sold -69.8 -62.2 -
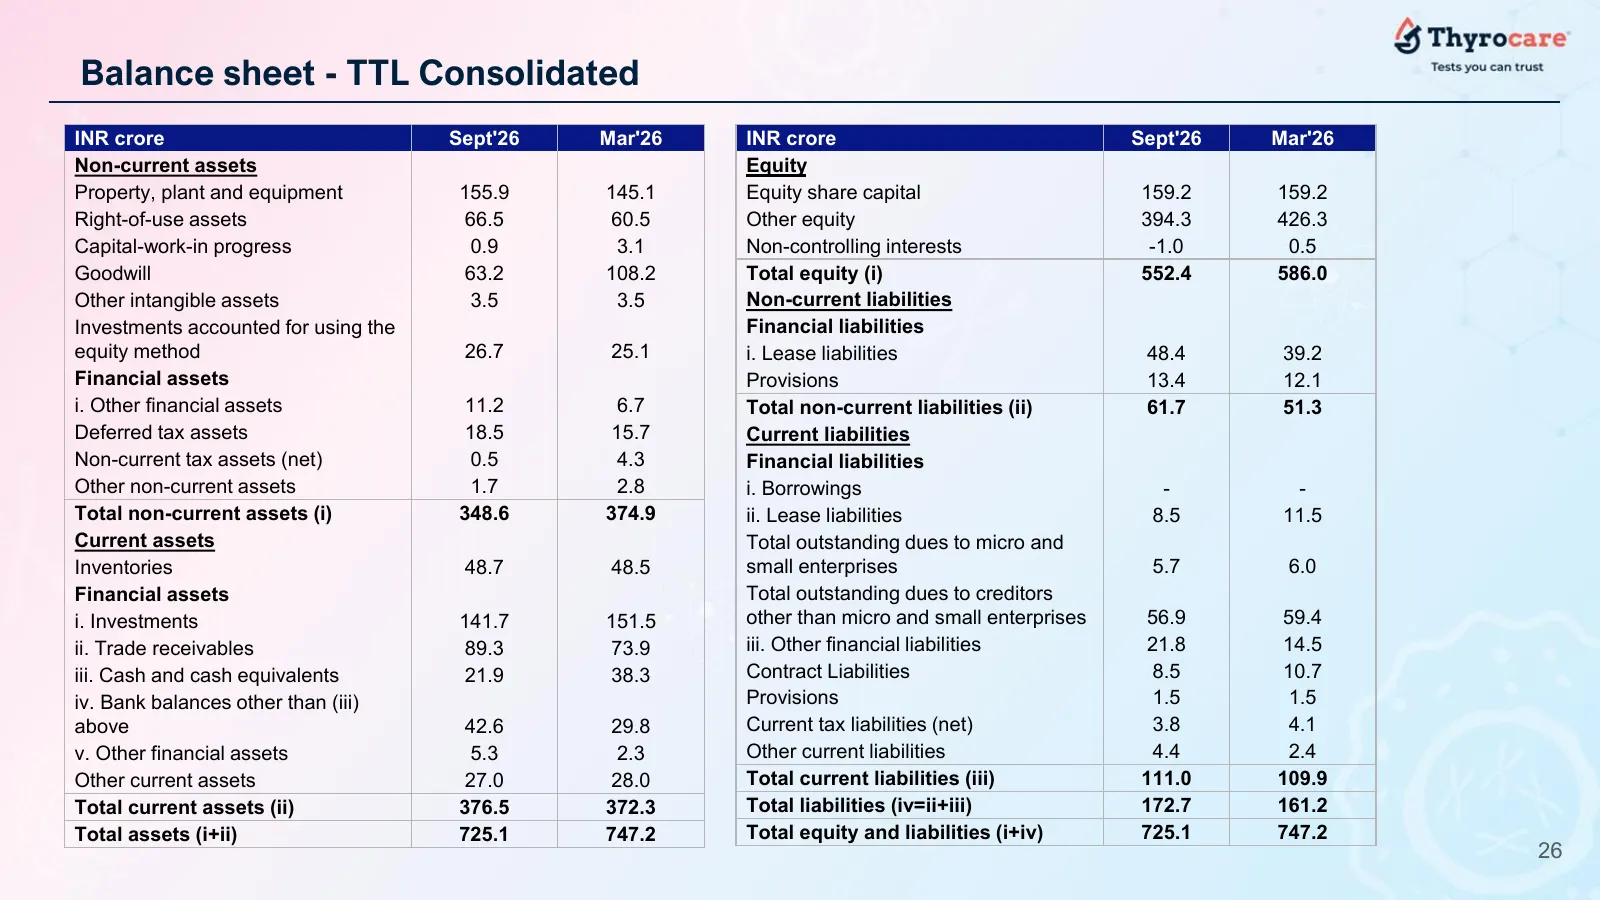
Slide 27: Balance sheet - TTL Consolidated
Balance sheet - TTL Consolidated INR crore Sept'26 Mar'26 INR crore Sept'26 Mar'26 Non-current assets Equity Property, plant and equipment 155.9 145.1 Equity share capital 159.2 159.2 Right-of-use assets 66.5 60.5 Other equity 394.3 426.3 Capital-work-in progress 0.9 3.1 Non-controlling interests -1
Slide 28: Cashflow sheet - TTL Consolidated
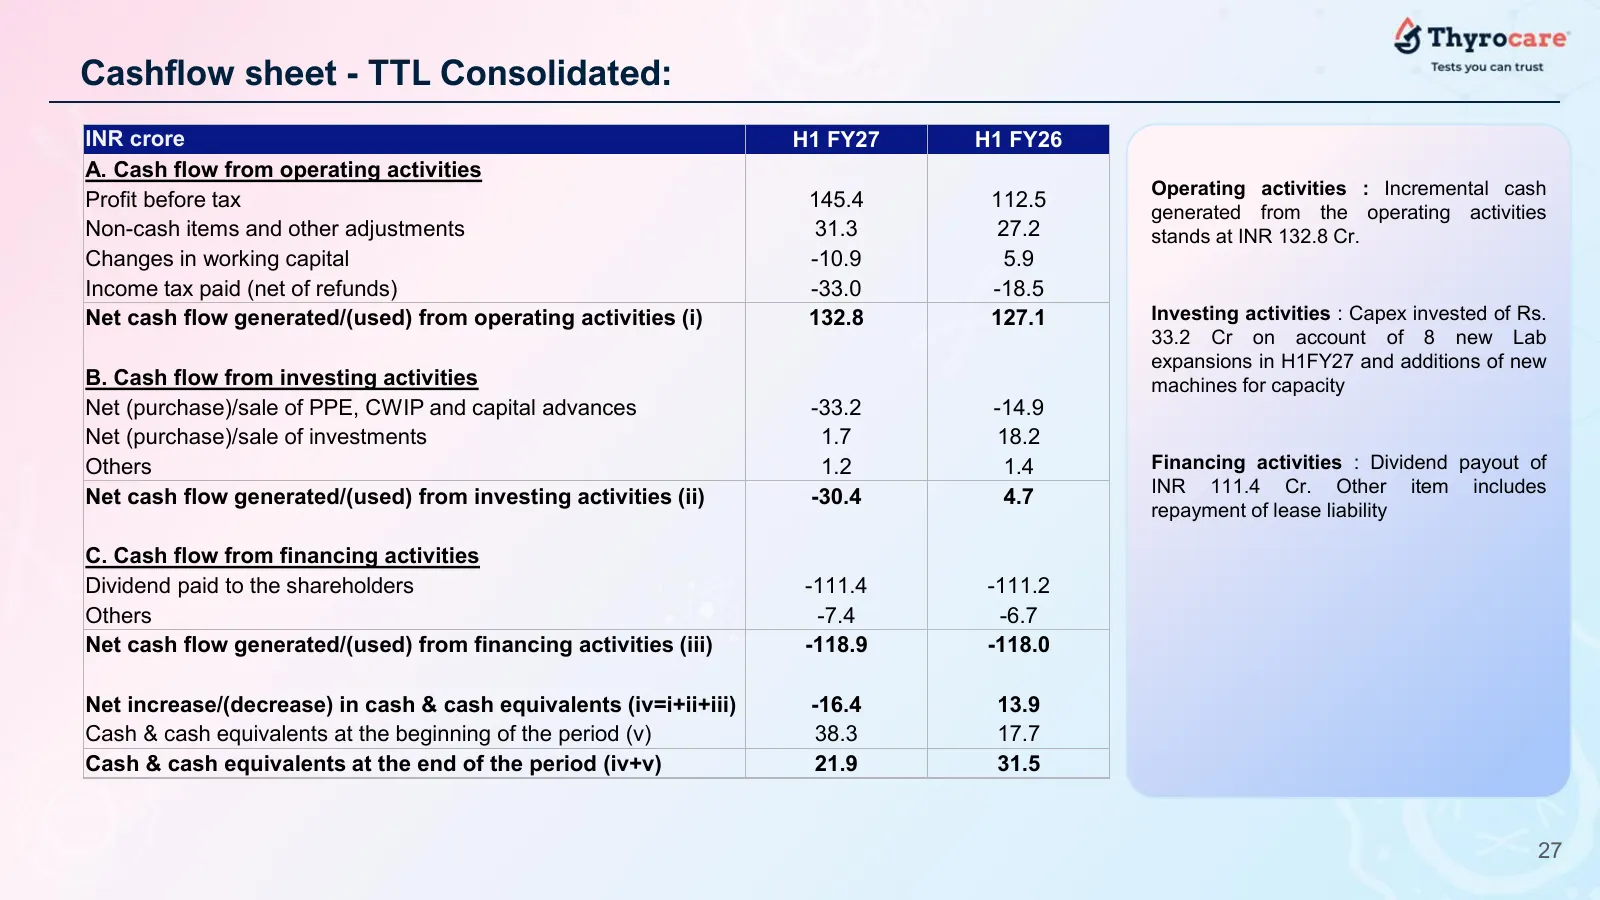
Cashflow sheet - TTL Consolidated: INR crore H1 FY27 H1 FY26 A. Cash flow from operating activities Operating activities : Incremental cash Profit before tax 145.4 112.5 generated from the operating activities Non-cash items and other adjustments 31.3 27.2 stands at INR 132.8 Cr. Changes in working
Slide 29: Divestment impact
Contents Divestment impact 28
Slide 30: Divestment of Nuclear Healthcare (NHL): INR 141.4 Cr sale
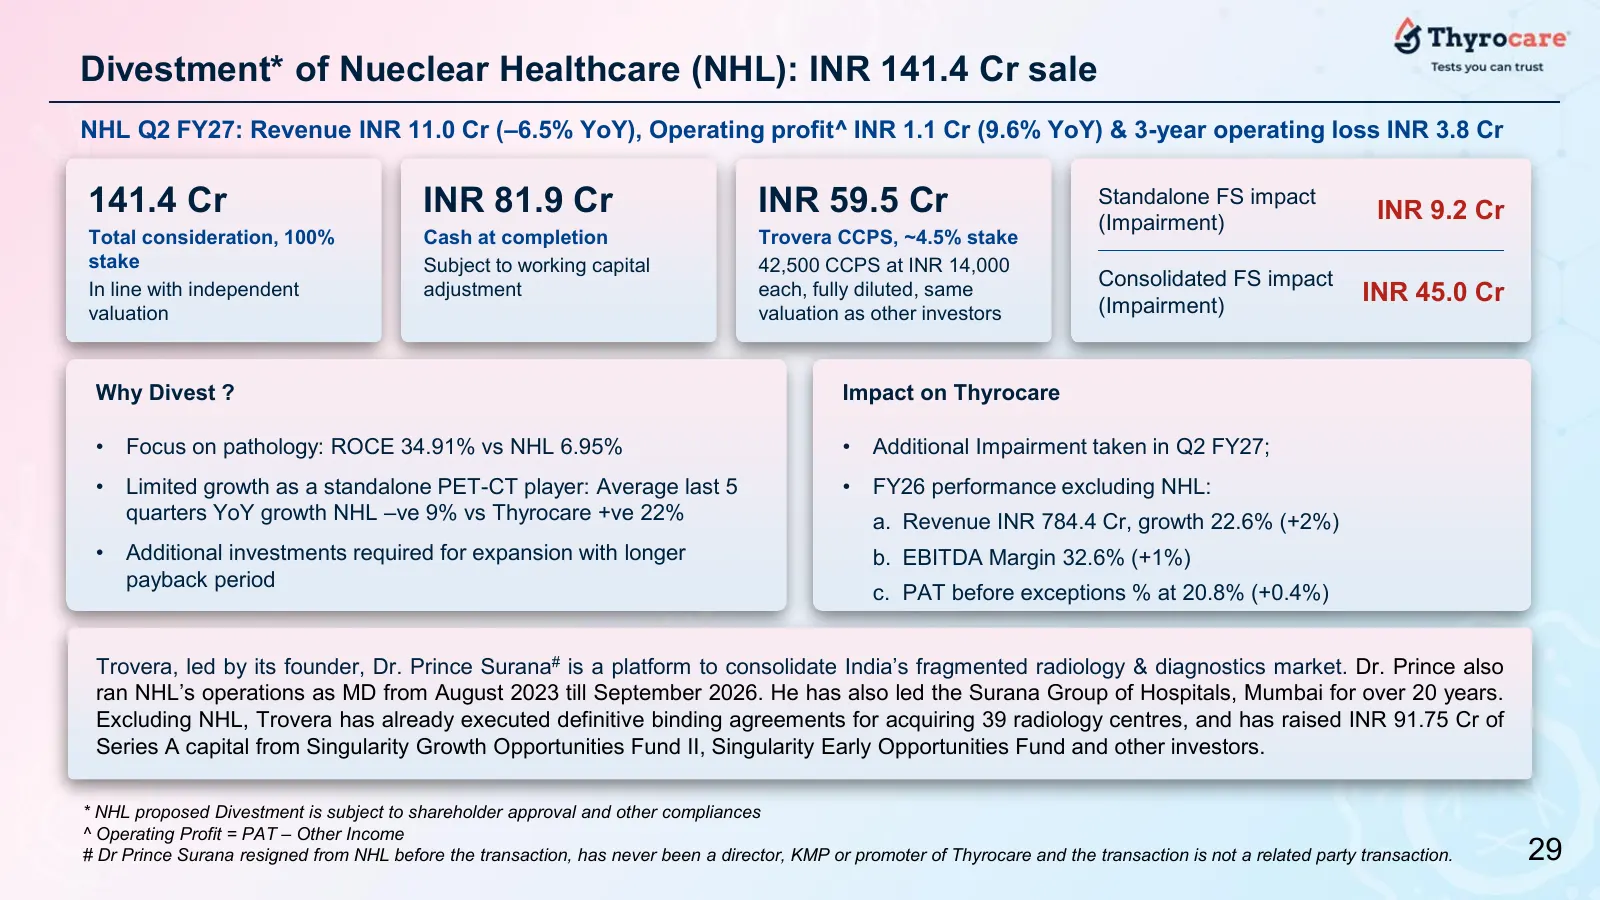
Divestment* of Nueclear Healthcare (NHL): INR 141.4 Cr sale NHL Q2 FY27: Revenue INR 11.0 Cr (–6.5% YoY), Operating profit^ INR 1.1 Cr (9.6% YoY) & 3-year operating loss INR 3.8 Cr 141.4 Cr INR 81.9 Cr INR 59.5 Cr Standalone FS impact INR 9.2 Cr (Impairment) Total consideration, 100% Cash at complet
Slide 31: Consolidated Historical numbers showing NHL impact
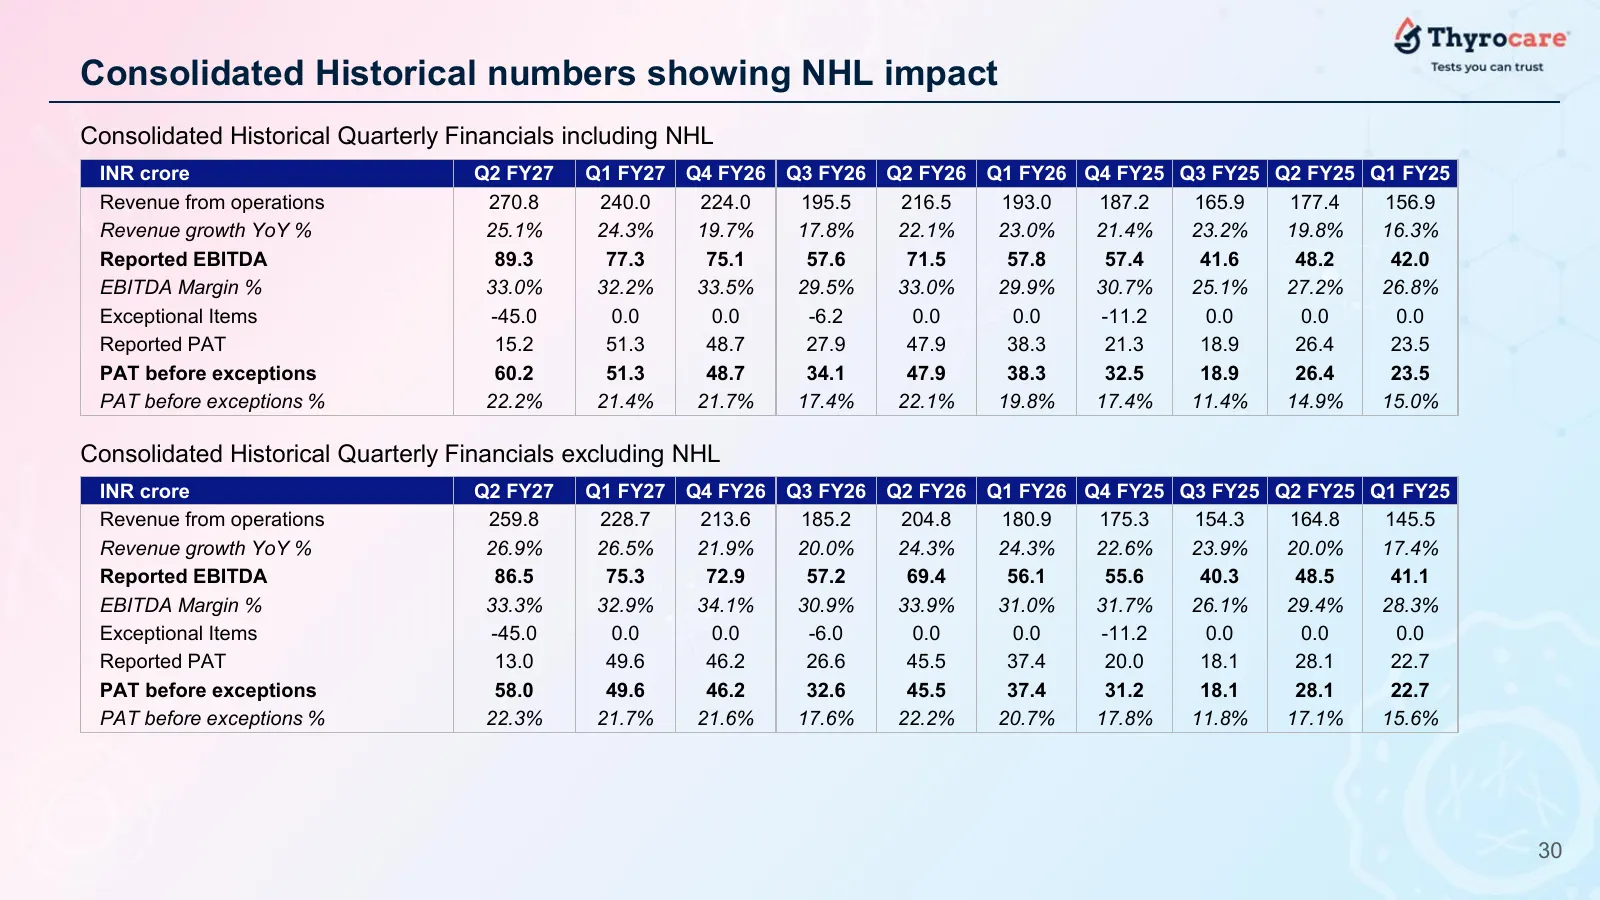
Consolidated Historical numbers showing NHL impact Consolidated Historical Quarterly Financials including NHL INR crore Q2 FY27 Q1 FY27 Q4 FY26 Q3 FY26 Q2 FY26 Q1 FY26 Q4 FY25 Q3 FY25 Q2 FY25 Q1 FY25 Revenue from operations 270.8 240.0 224.0 195.5 216.5 193.0 187.2 165.9 177.4 156.9 Revenue growth Y

Slide 32: Going forward – Key Pillars of Growth
Contents Going forward – Key Pillars of Growth 31
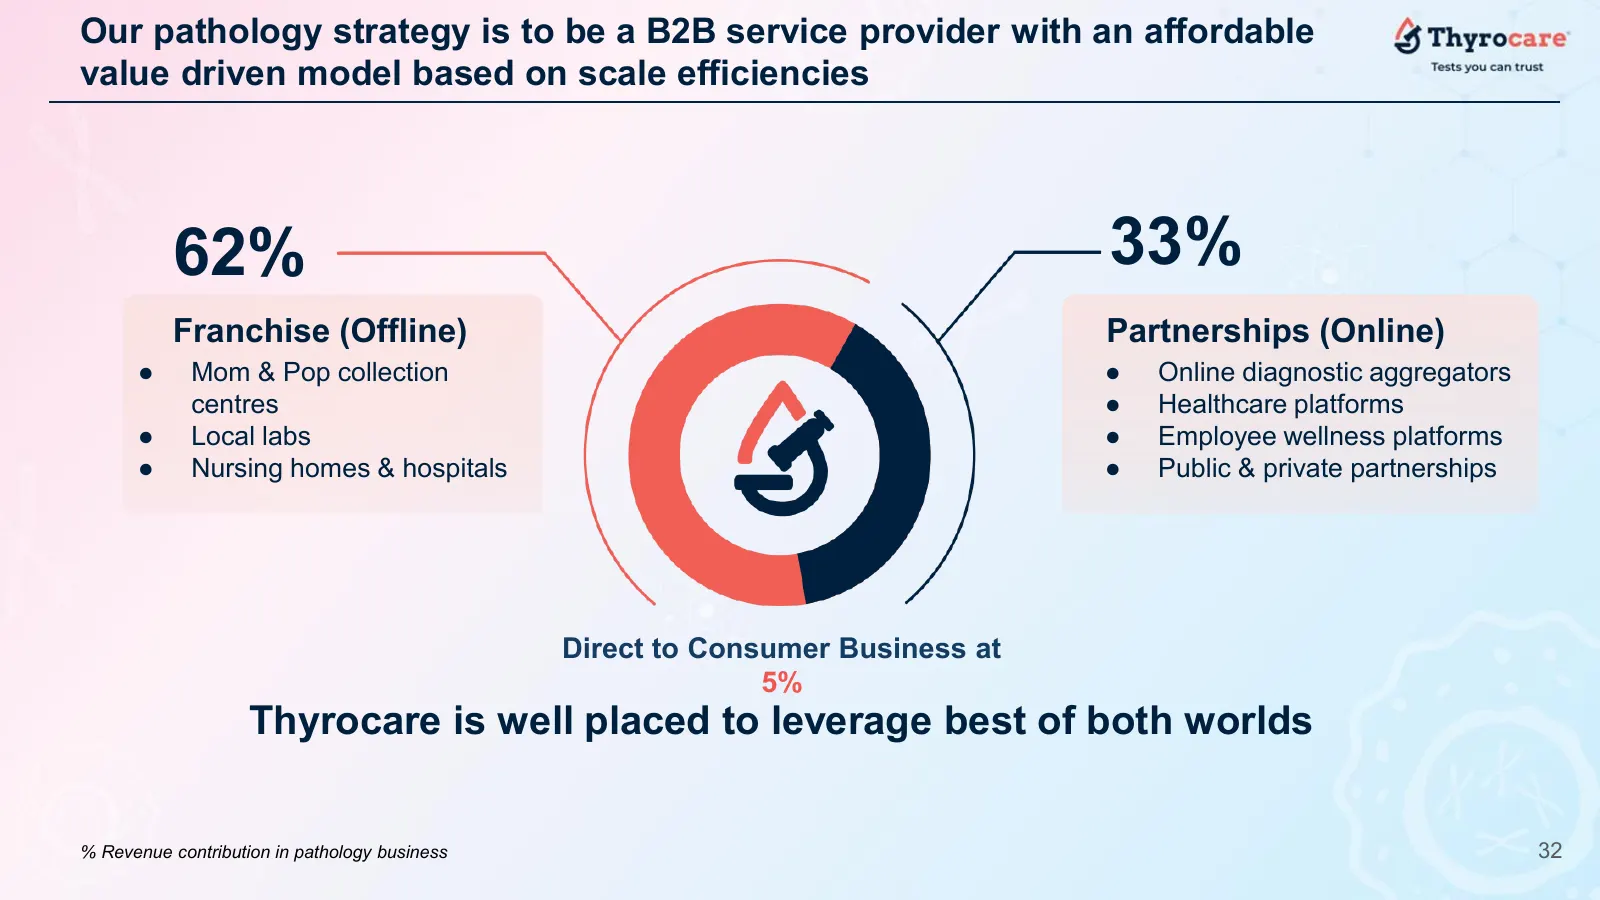
Slide 33: Thyrocare is well placed to leverage best of both worlds
Our pathology strategy is to be a B2B service provider with an affordable value driven model based on scale efficiencies 62% 33% Franchise (Offline) Partnerships (Online) ● Mom & Pop collection ● Online diagnostic aggregators centres ● Healthcare platforms ● Local labs ● Employee wellness platforms
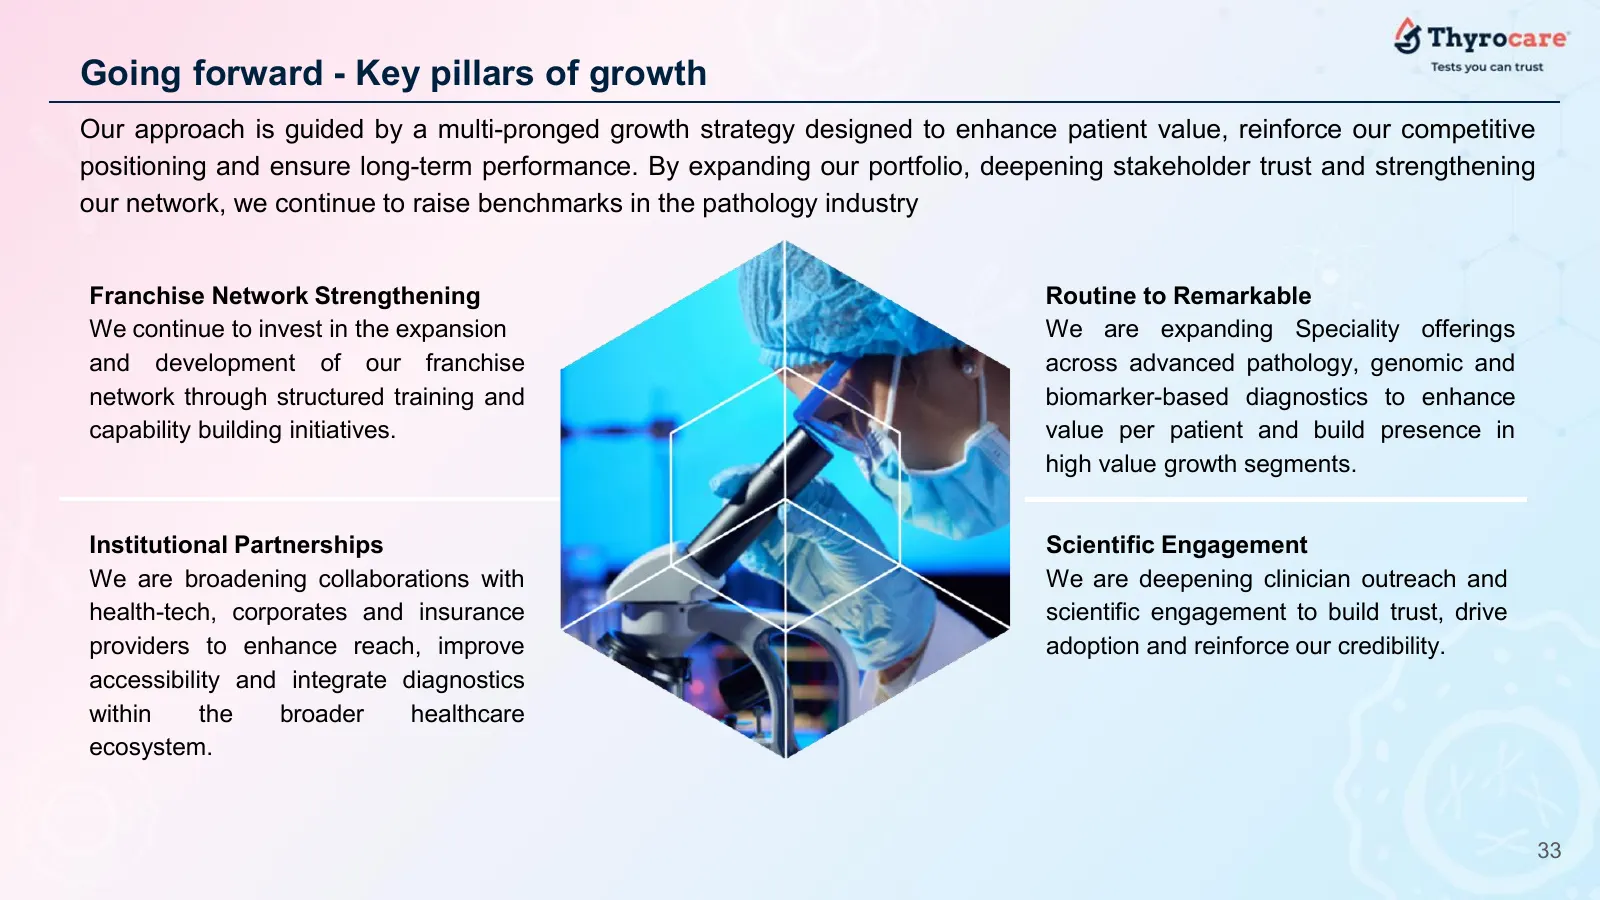
Slide 34: Going forward - Key pillars of growth
Going forward - Key pillars of growth Our approach is guided by a multi-pronged growth strategy designed to enhance patient value, reinforce our competitive positioning and ensure long-term performance. By expanding our portfolio, deepening stakeholder trust and strengthening our network, we continu
Slide 35: Thank You
Thank You For Any queries, please reach out to investor_relations@thyrocare.com 34
Source: NSE filing, Oct 29, 2026
More decks from Thyrocare Technologies Ltd
 Q1 FY27 Earnings Presentation26 slides · Jul 23, 2026
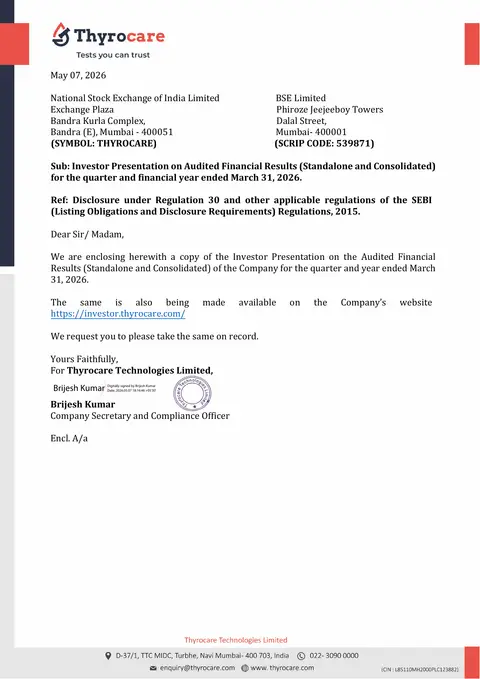 Q4 FY26 Earnings Presentation31 slides · May 7, 2026
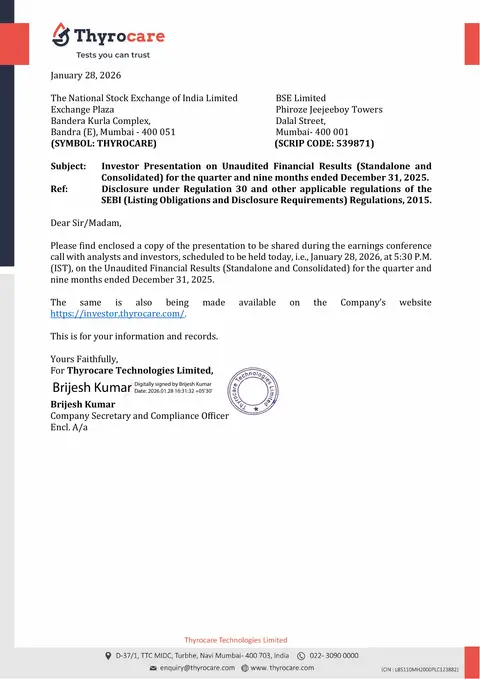 Q3 FY26 Earnings Presentation29 slides · Jan 28, 2026
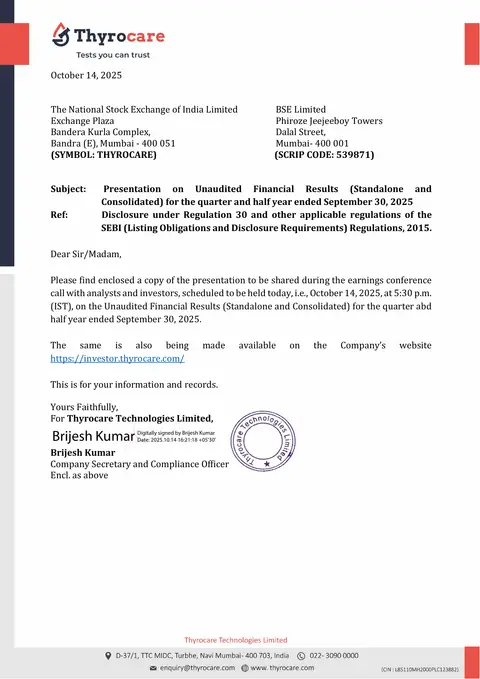 Q2 FY26 Earnings Presentation28 slides · Oct 14, 2025
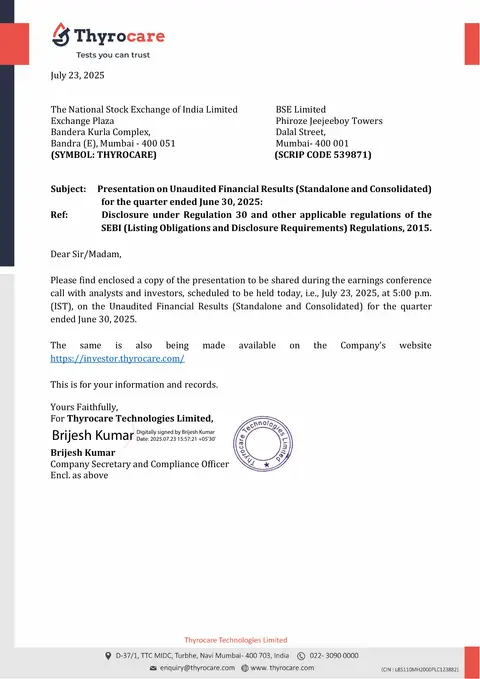 Q1 FY26 Earnings Presentation26 slides · Jul 23, 2025
 Q1 FY26 Earnings Presentation25 slides · July 2025