Capita plc · LSE:CPI
Capita — FY2012 Earnings Presentation
63 slides from Capita's earnings presentation, Feb 28, 2013

Slide 1: Results for the year ended 31 December 2012
Results for the year ended 31 December 2012 Full year results presentation 28 February 2013
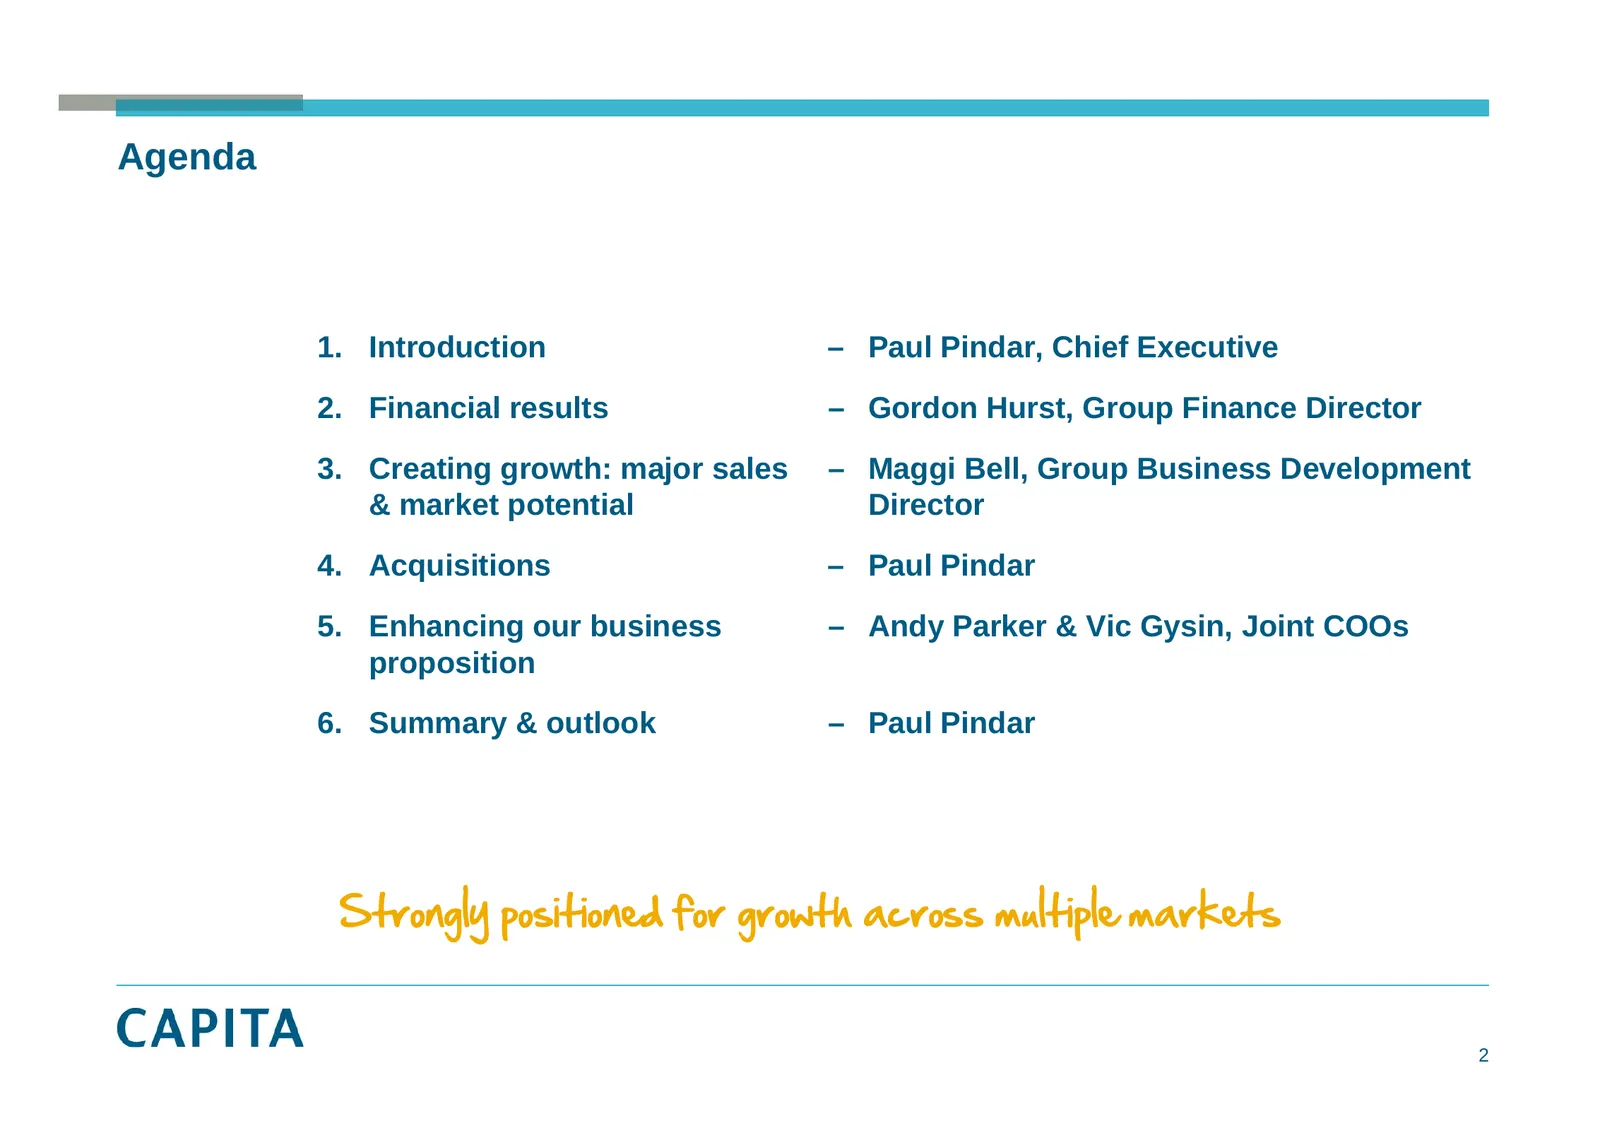
Slide 2: Agenda
Agenda 1. Introduction – Paul Pindar, Chief Executive 2. Financial results – Gordon Hurst, Group Finance Director 3. Creating growth: major sales – Maggi Bell, Group Business Development & market potential Director 4 Acquisitions 4. – Paul Pindar 5. Enhancing our business – Andy Parker & Vic Gysin,
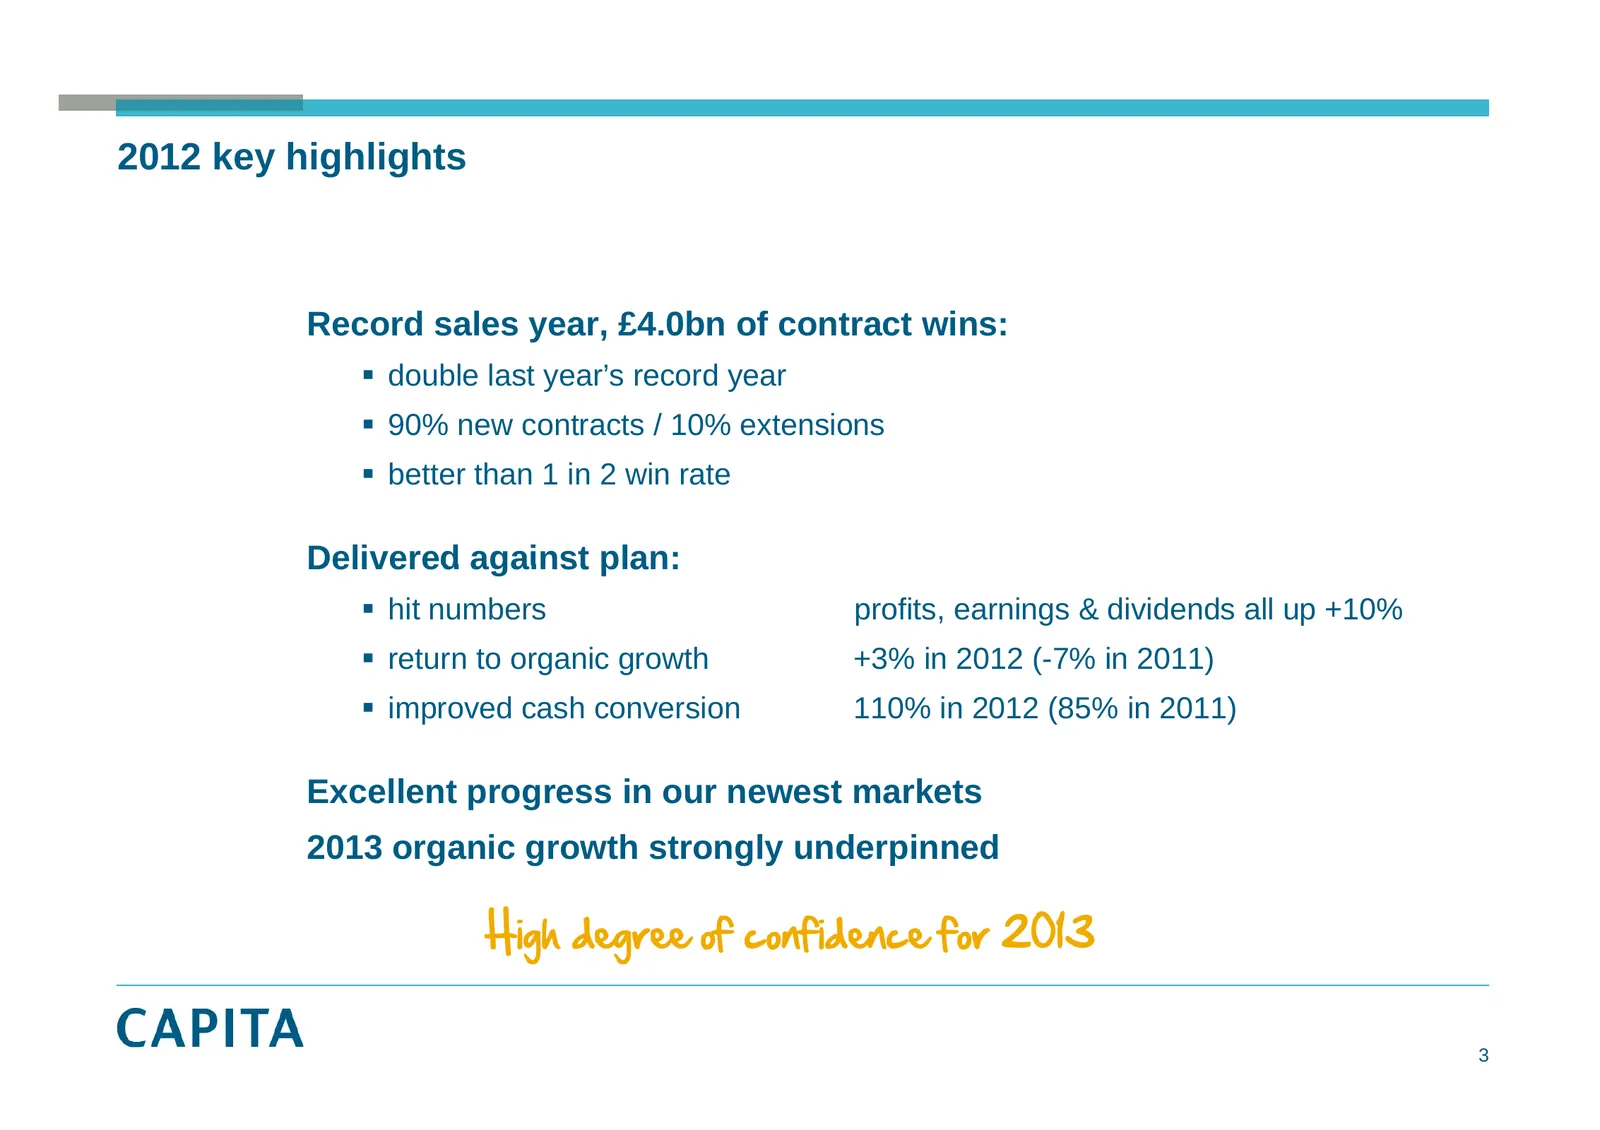
Slide 3: 2012 key highlights
2012 key highlights Record sales year, £4.0bn of contract wins: double last year’s record year 90% new contracts / 10% extensions better than 1 in 2 win rate Delivered against plan: hit numbers profits, earnings & dividends all up +10% return to organic growth +3% in 2012 (-7% in 2011) i
Slide 4: Financial results
Financial results Gordon Hurst Group Finance Director
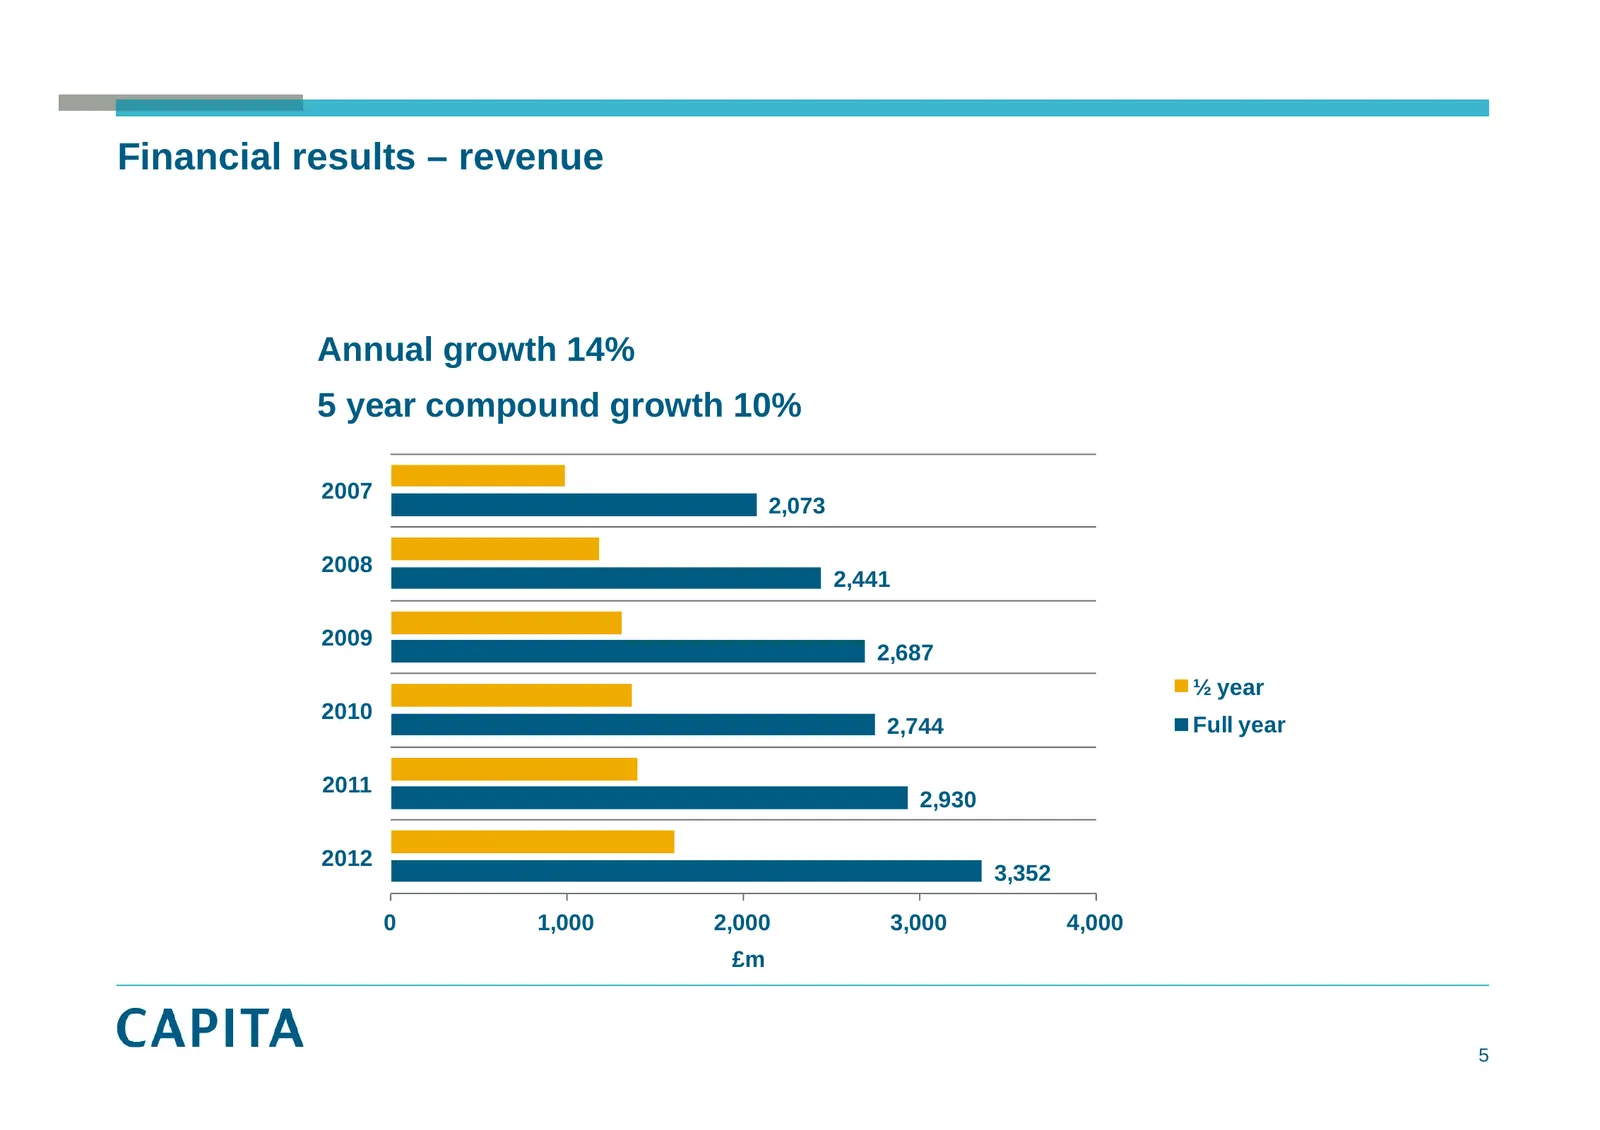
Slide 5: Financial results – revenue
Financial results – revenue Annual growth 14% 5 year compound growth 10% 2007 2,073 2008 2,441 2009 2,687 ½ year 2010 2,744 Full year 2011 2,930 2012 3,352 0 1,000 2,000 3,000 4,000 £m 5
Slide 6: Financial results – revenue by market
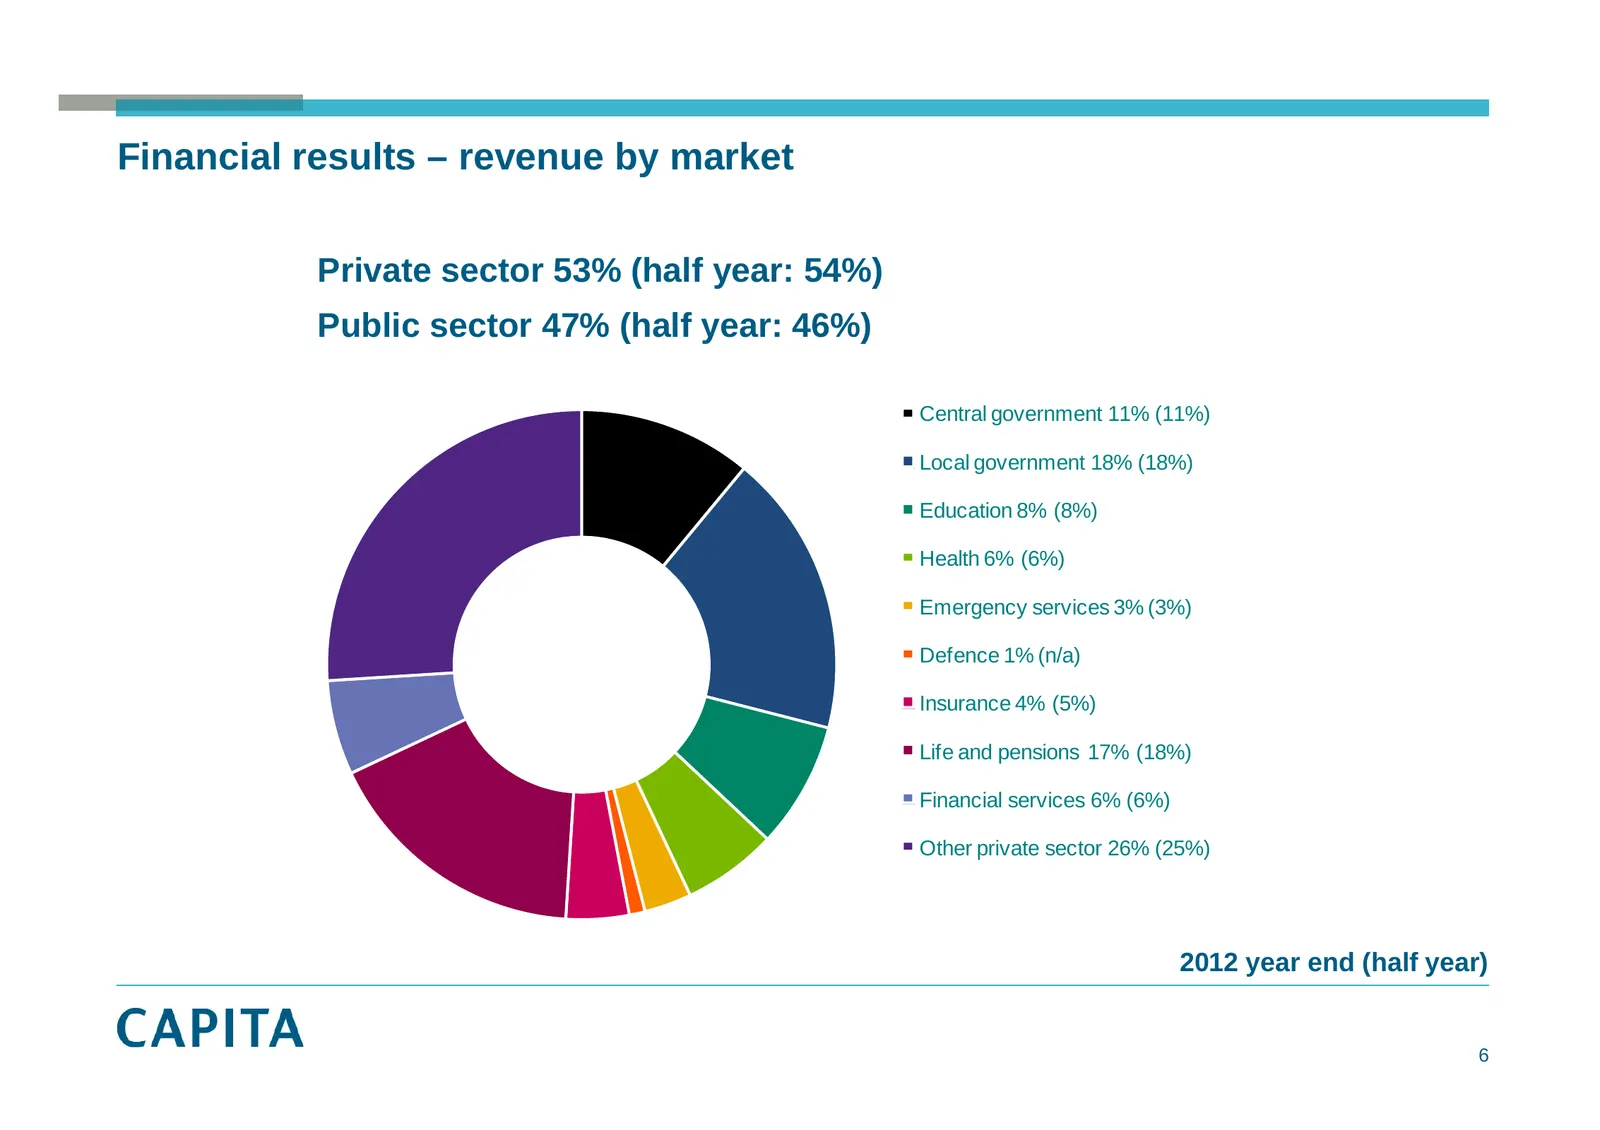
Financial results – revenue by market Private sector 53% (half year: 54%) Public sector 47% (half year: 46%) Central government 11% (11%) Local government 18% (18%) Education 8% (8%) Health 6% (6%) Emergency services 3% (3%) Defence 1% (n/a) Insurance 4% (5%) Life and pensions 17% (18%) Financial se
Slide 7: Financial results – revenue growth
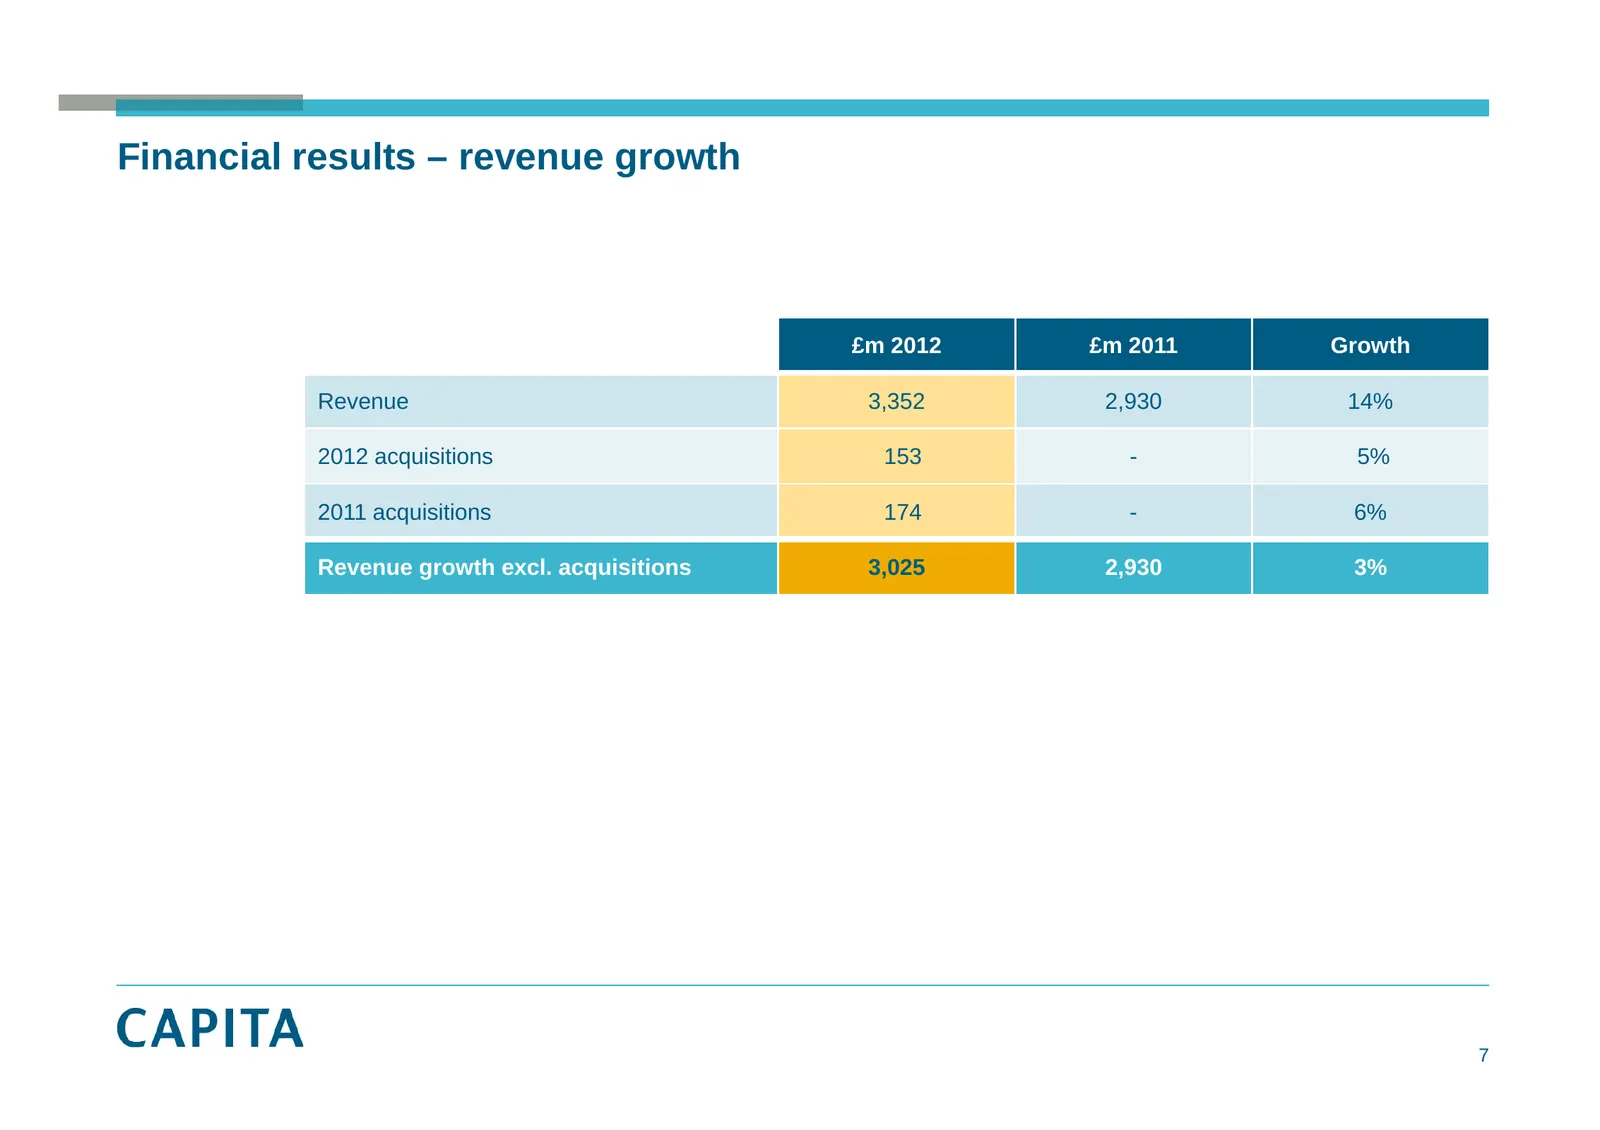
Financial results – revenue growth £m 2012 £m 2011 Growth Revenue 3,352 2,930 14% 2012 acquisitions 153 - 5% 2011 acquisitions 174 - 6% Revenue growth excl. excl acquisitions 3 025 3,025 2 930 2,930 3% 7
Slide 8: Financial results – underlying profit before tax
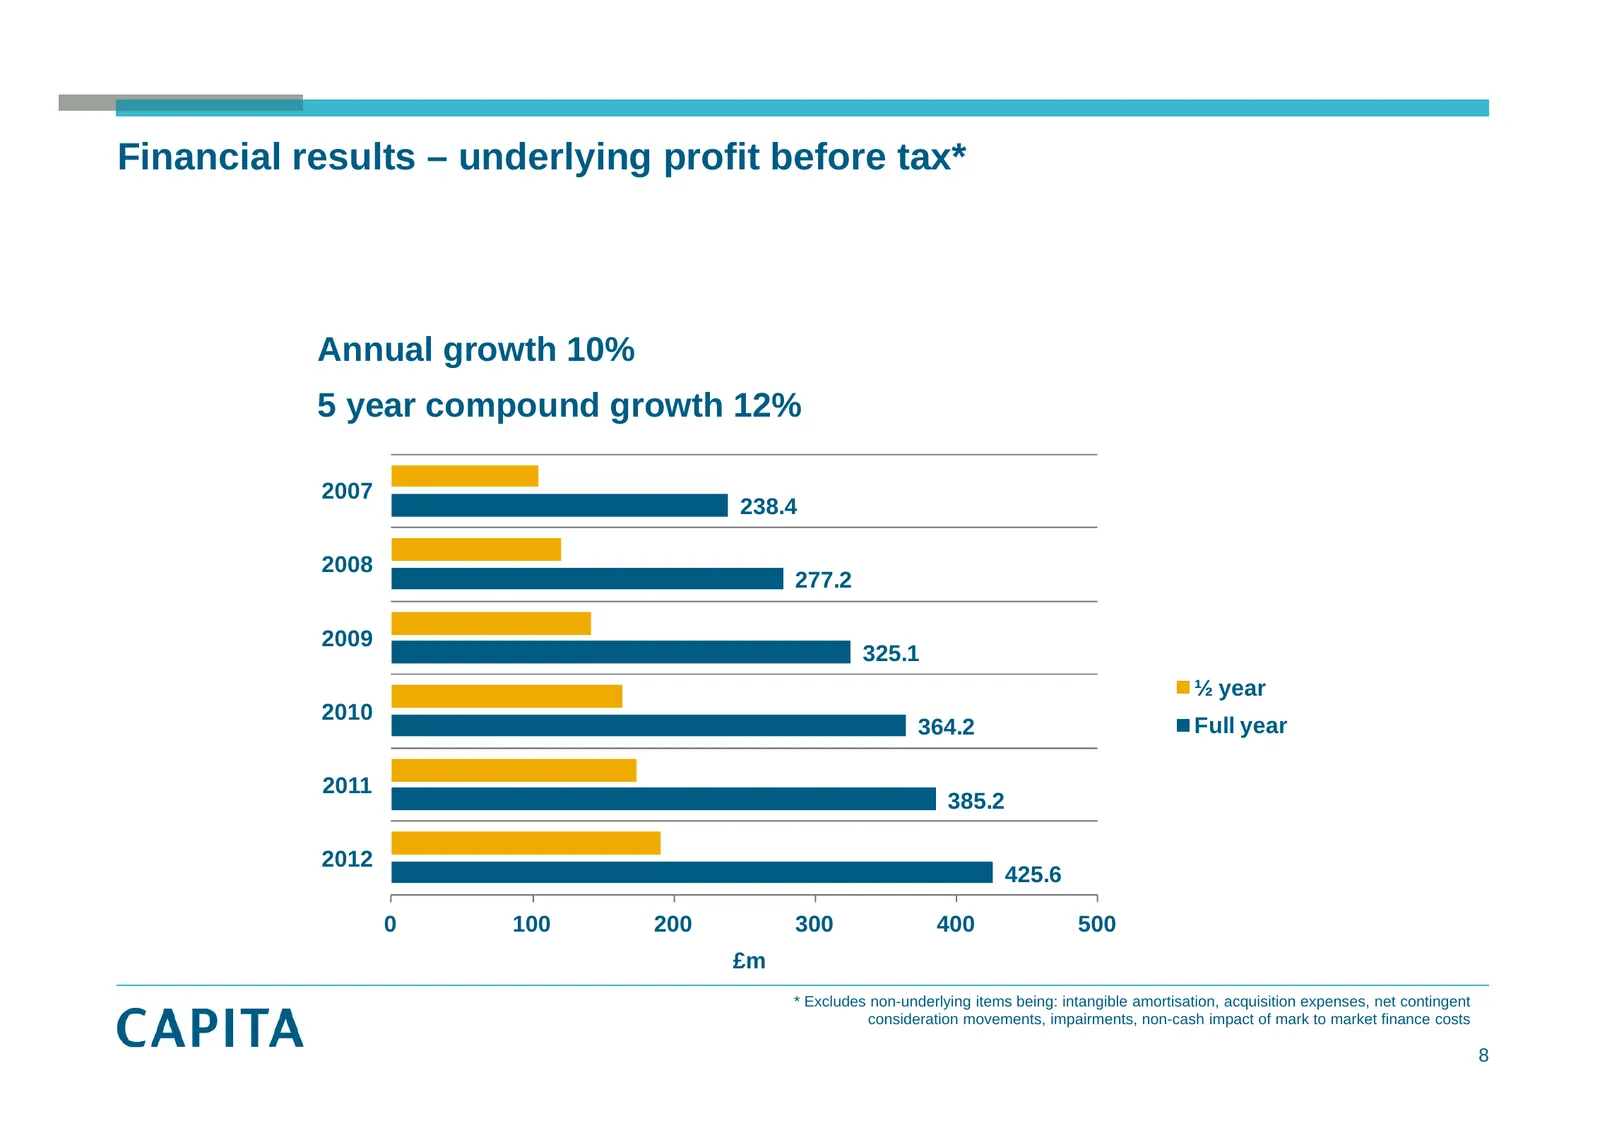
Financial results – underlying profit before tax* Annual growth 10% 5 year compound growth 12% 2007 238.4 2008 277.2 2009 325.1 ½ year 2010 364.2 Full year 2011 385.2 2012 425.6 0 100 200 300 400 500 £m * Excludes non-underlying items being: intangible amortisation, acquisition expenses, net conting
Slide 9: Financial results – underlying operating profit
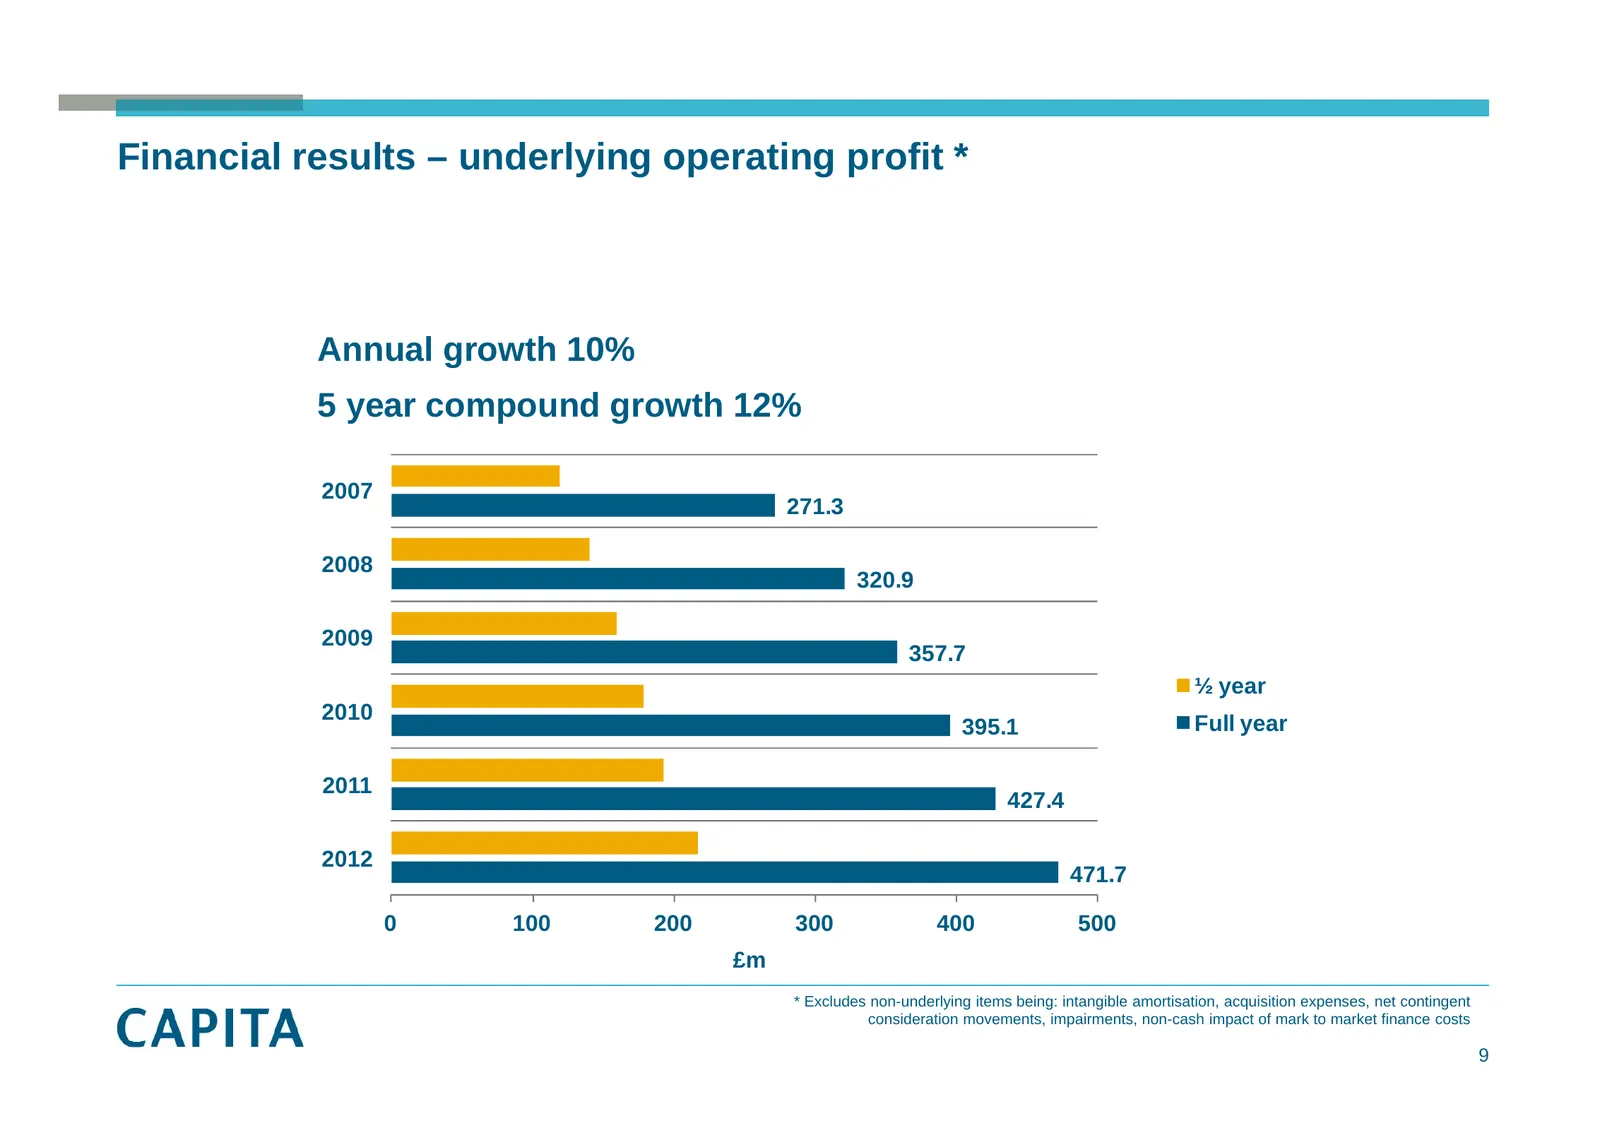
Financial results – underlying operating profit * Annual growth 10% 5 year compound growth 12% 2007 271.3 2008 320.9 2009 357.7 ½ year 2010 395.1 Full year 2011 427.4 2012 471.7 0 100 200 300 400 500 £m * Excludes non-underlying items being: intangible amortisation, acquisition expenses, net conting
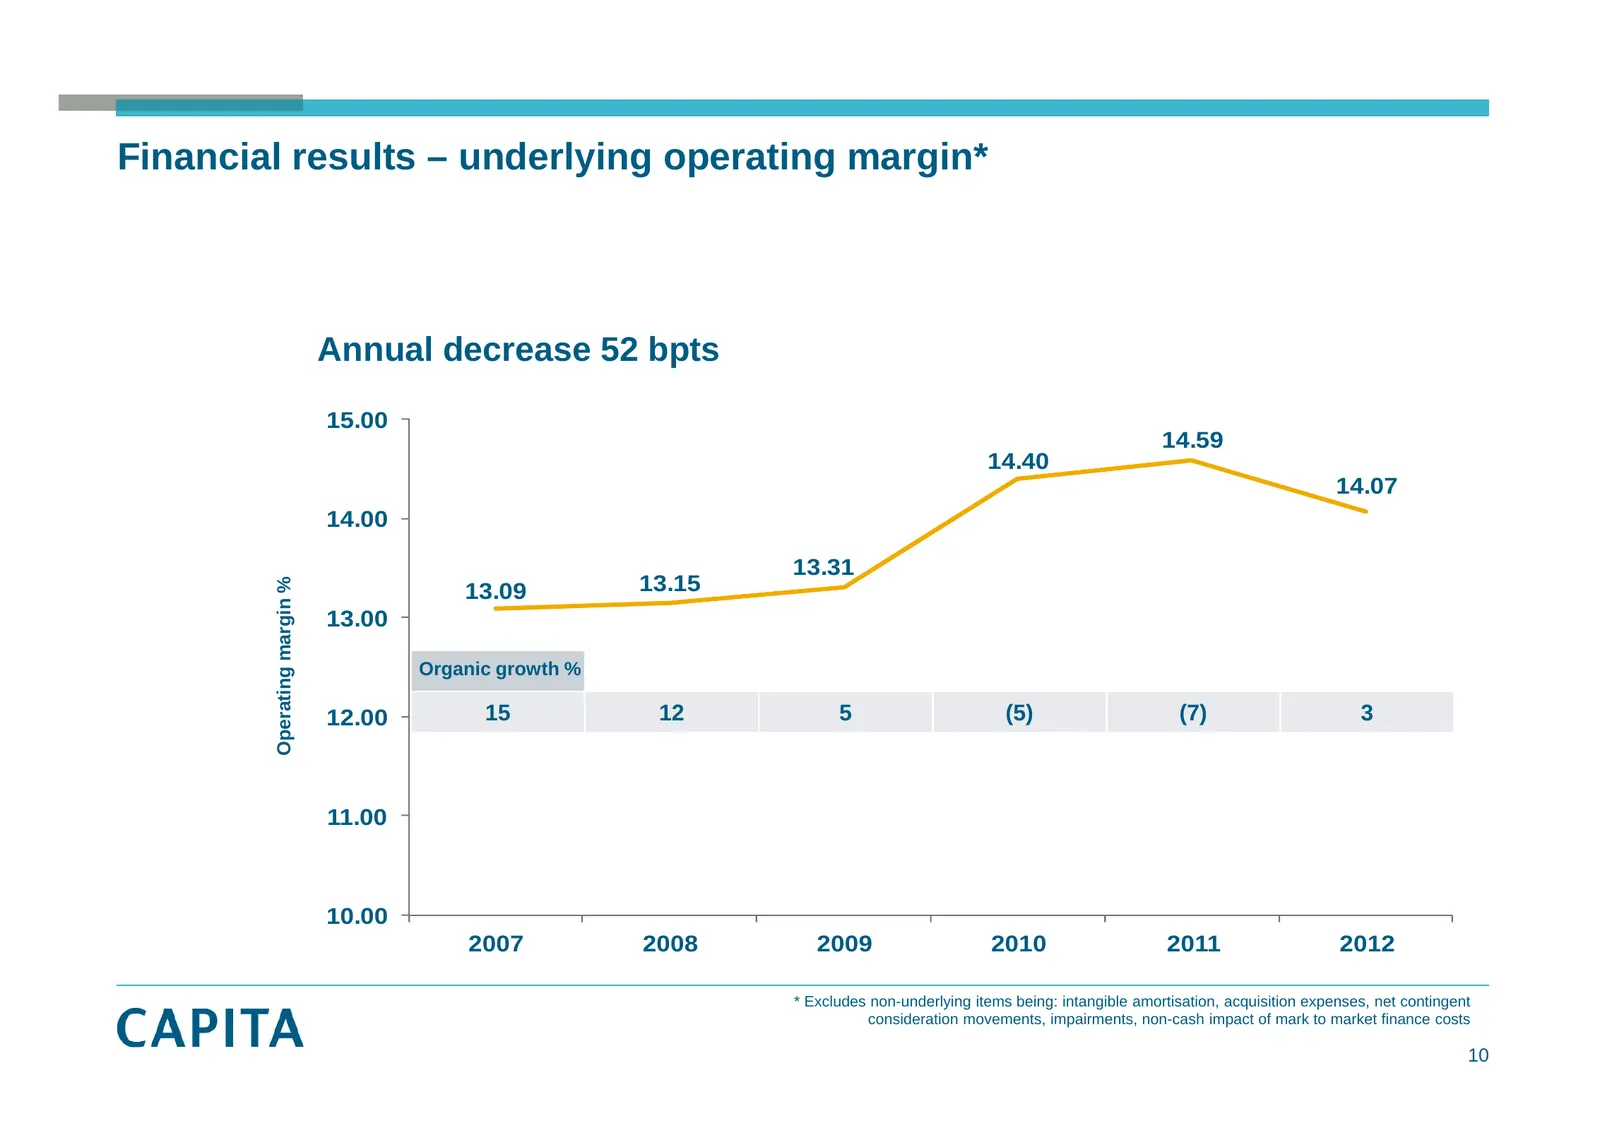
Slide 10: Financial results – underlying operating margin
Financial results – underlying operating margin* Annual decrease 52 bpts 15.00 14 59 14.59 14.40 14.07 14.00 13 31 13.31 13.15 Operatiing margin % 13.09 13.00 Organic growth % 12.00 15 12 5 (5) (7) 3 11 00 11.00 10.00 2007 2008 2009 2010 2011 2012 * Excludes non-underlying items being: intangible am
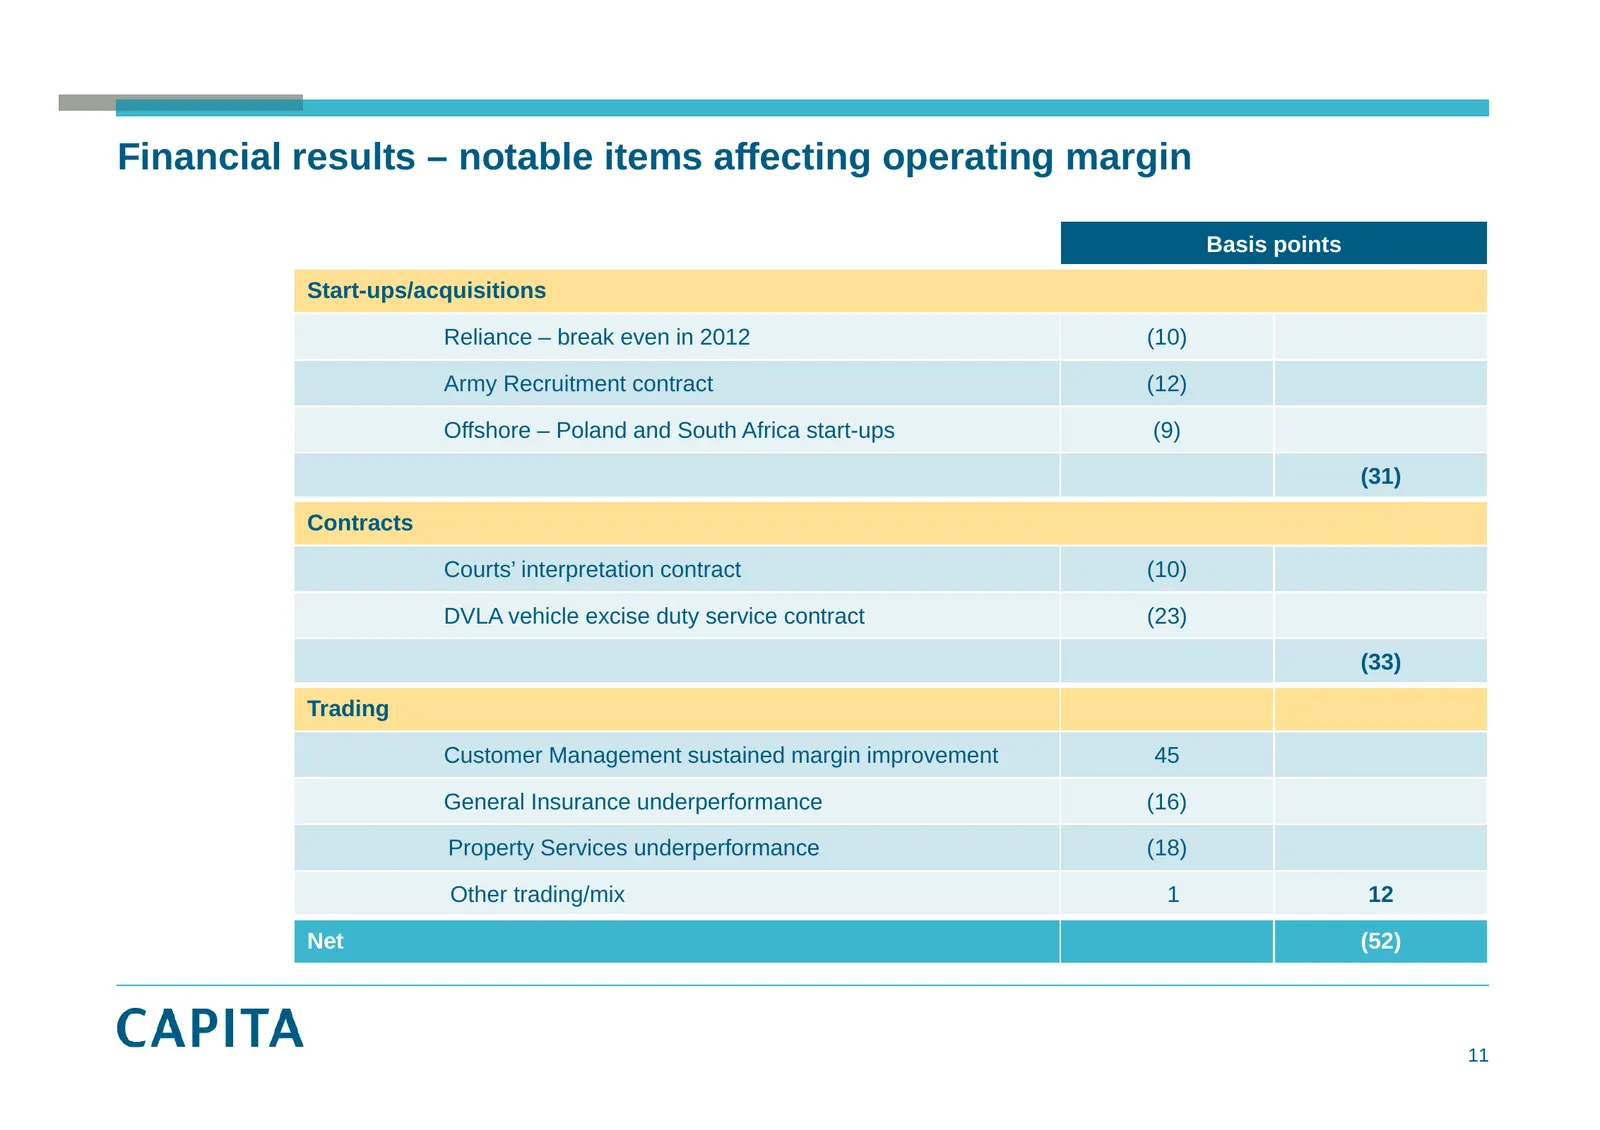
Slide 11: Financial results – notable items affecting operating margin
Financial results – notable items affecting operating margin Basis points Start-ups/acquisitions Reliance – break even in 2012 (10) Army Recruitment contract (12) Offshore – Poland and South Africa start start-ups ups (9) (31) Contracts C t ’ iinterpretation Courts’ t t ti contract t t (10) DVLA veh
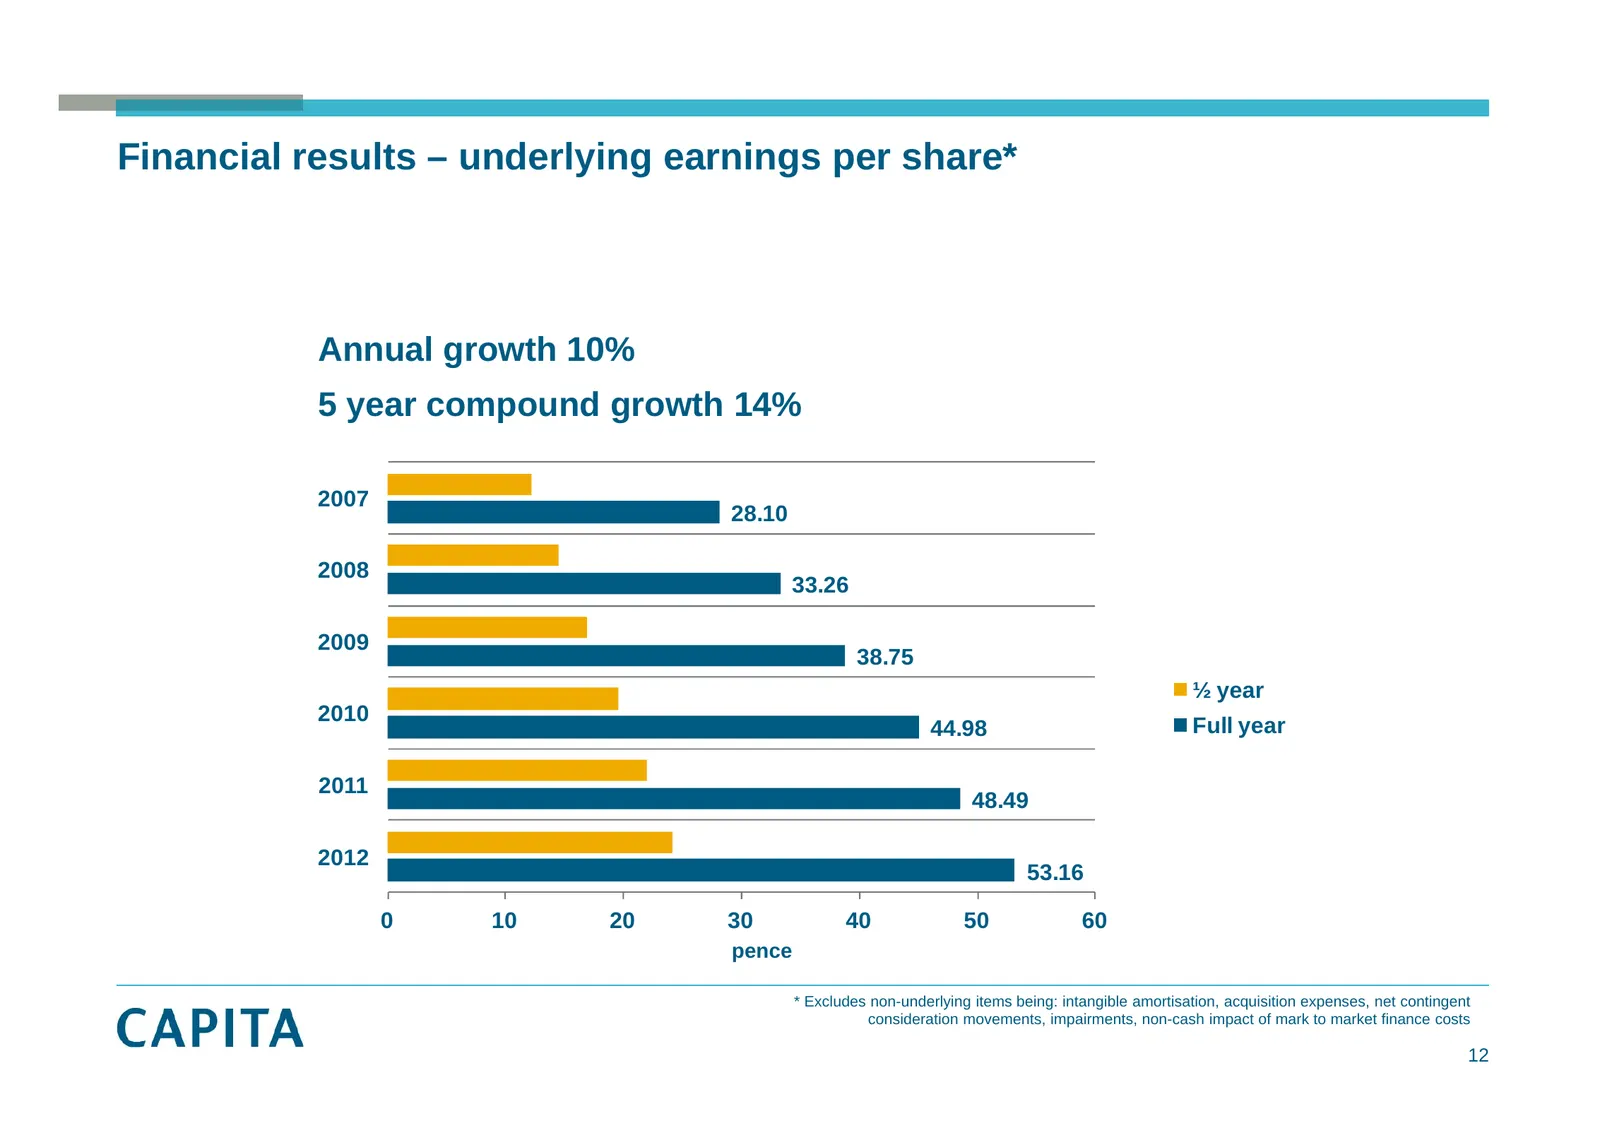
Slide 12: Financial results – underlying earnings per share
Financial results – underlying earnings per share* Annual growth 10% 5 year compound growth 14% 2007 28.10 2008 33.26 2009 38.75 ½ year 2010 44.98 Full year 2011 48.49 2012 53.16 0 10 20 30 40 50 60 £pence £m * Excludes non-underlying items being: intangible amortisation, acquisition expenses, net c
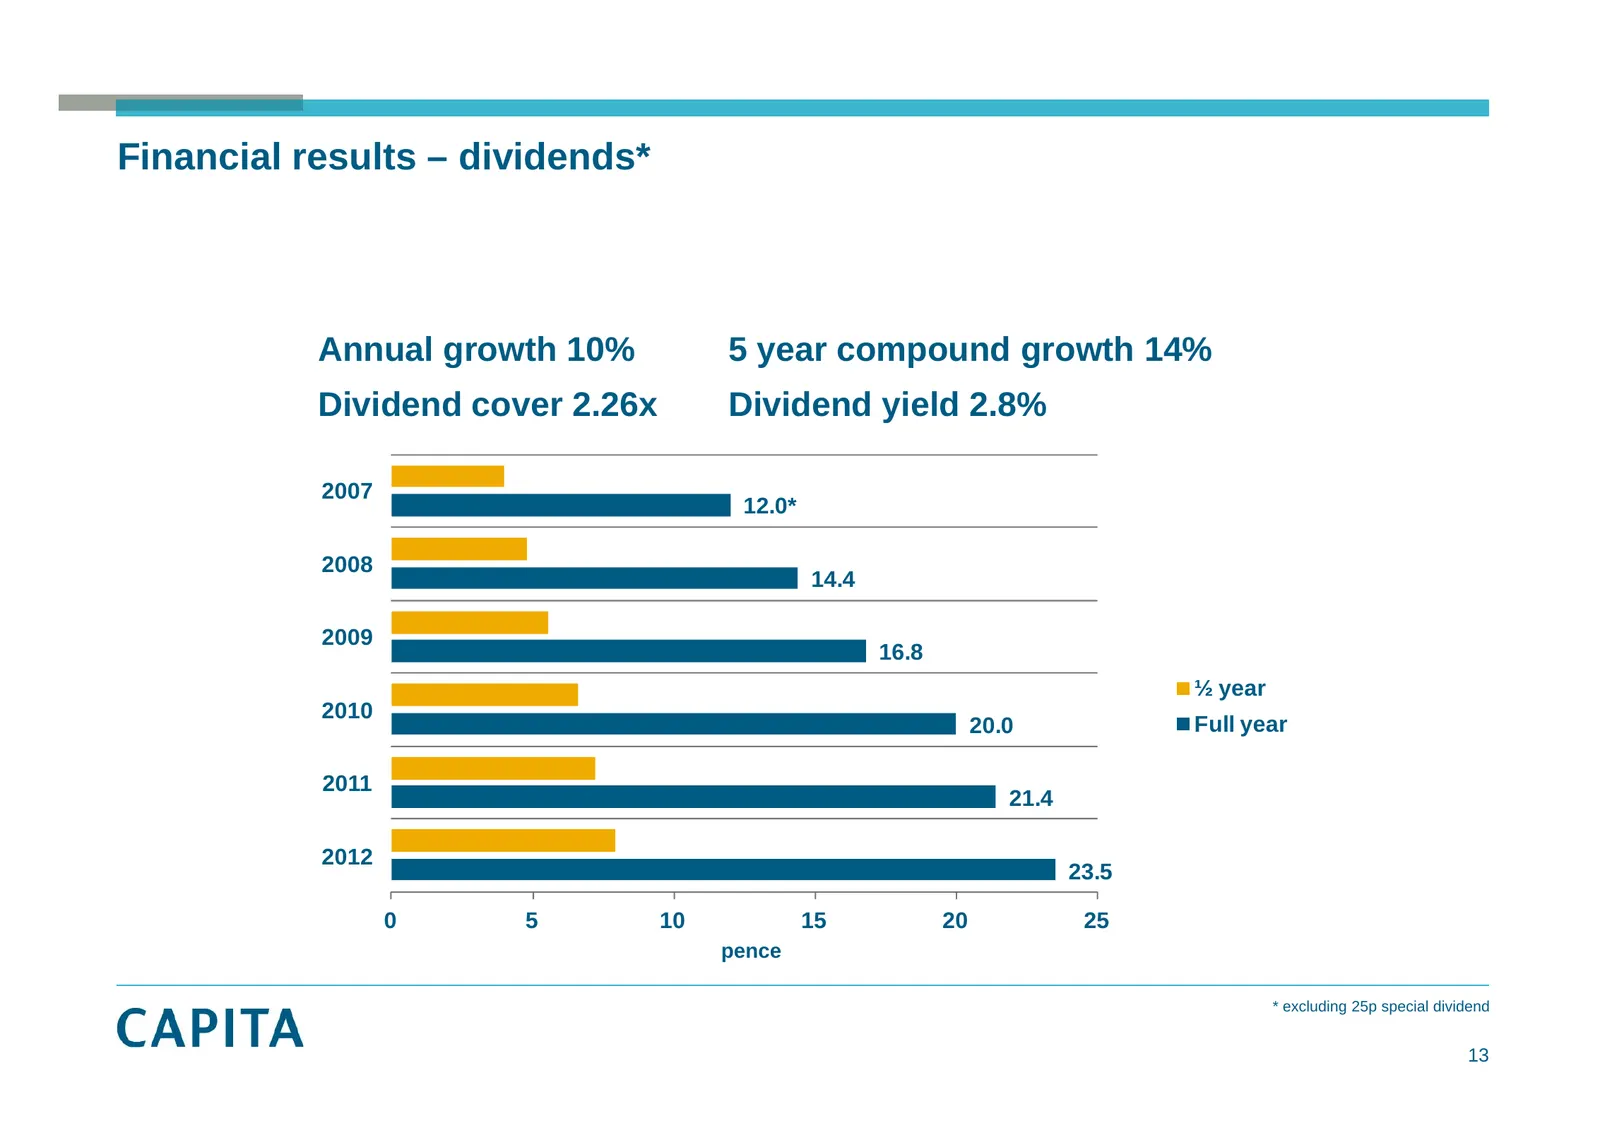
Slide 13: Financial results – dividends
Financial results – dividends* Annual growth 10% 5 year compound growth 14% Dividend cover 2.26x Dividend yield 2.8% 2007 12.0* 2008 14.4 2009 16.8 ½ year 2010 20.0 Full year 2011 21.4 2012 23.5 0 5 10 15 20 25 pence £ £m * excluding 25p special dividend 13
Slide 14: Financial results – cash flow statement
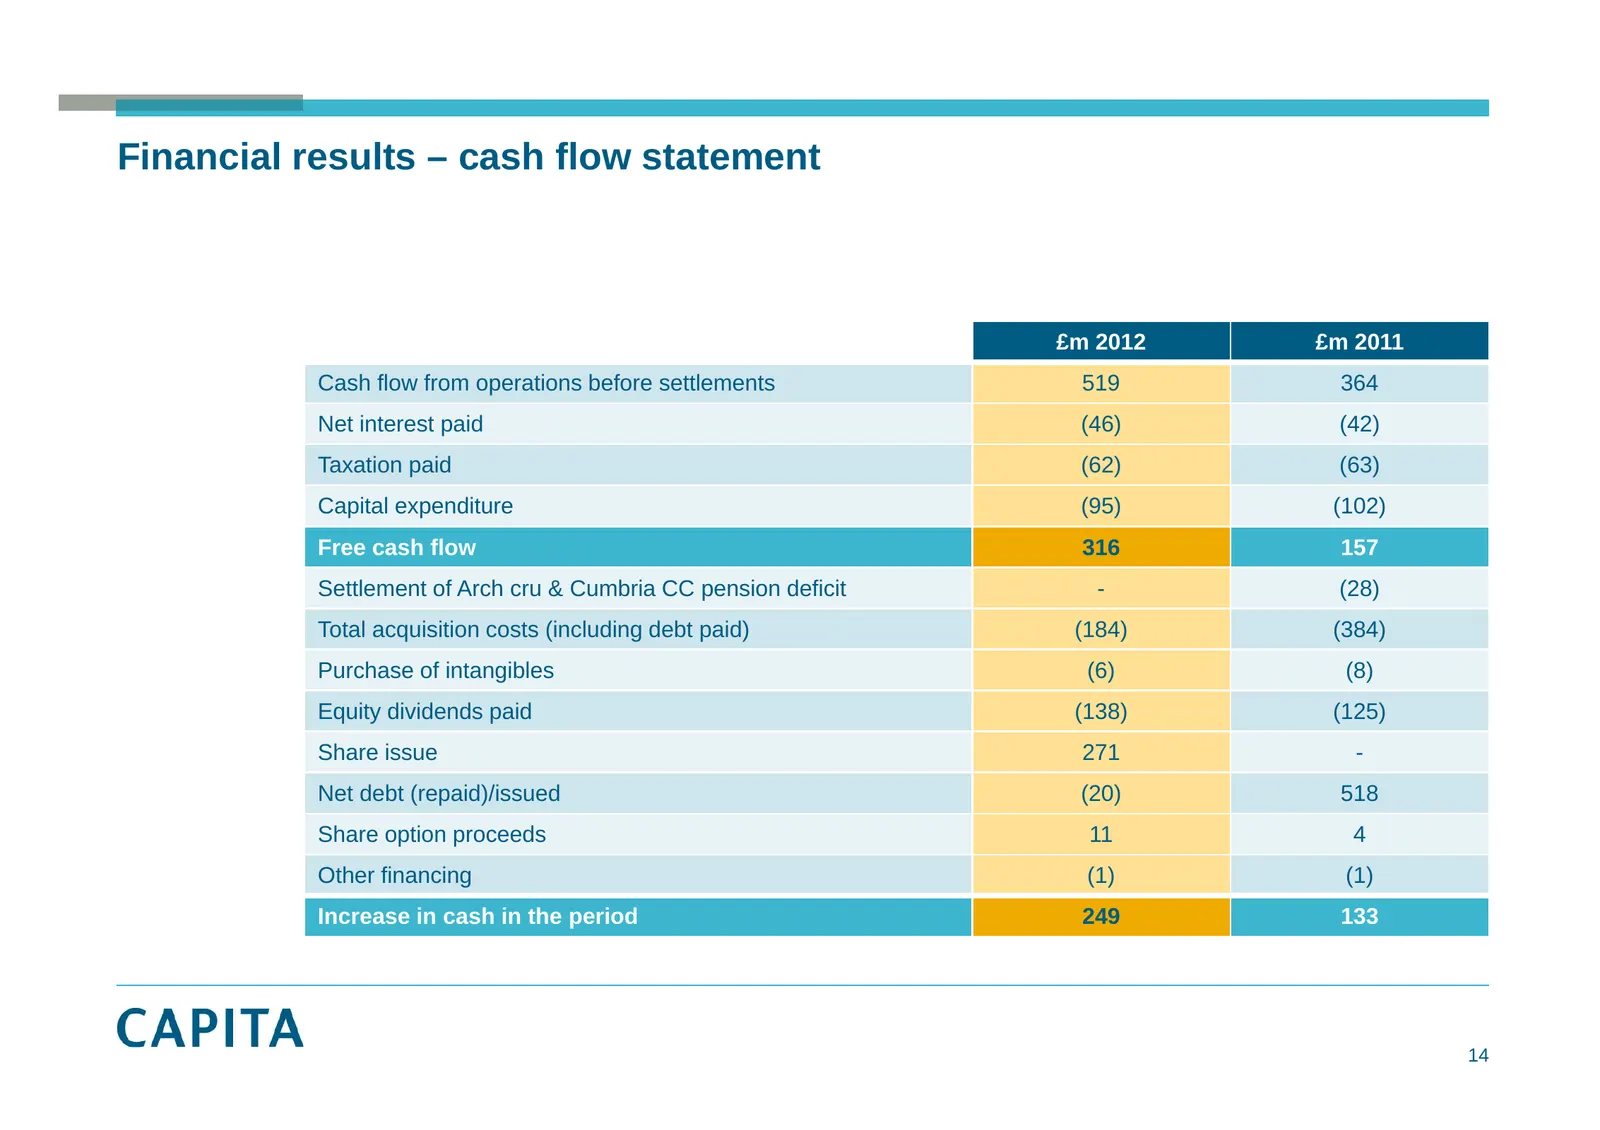
Financial results – cash flow statement £m 2012 £m 2011 Cash flow from operations before settlements 519 364 Net interest paid ((46)) ((42)) Taxation paid (62) (63) Capital expenditure (95) (102) Free cash flow 316 157 Settlement of Arch cru & Cumbria CC pension deficit - (28) Total acquisition cost
Slide 15: Financial results – cash flow from operating activities
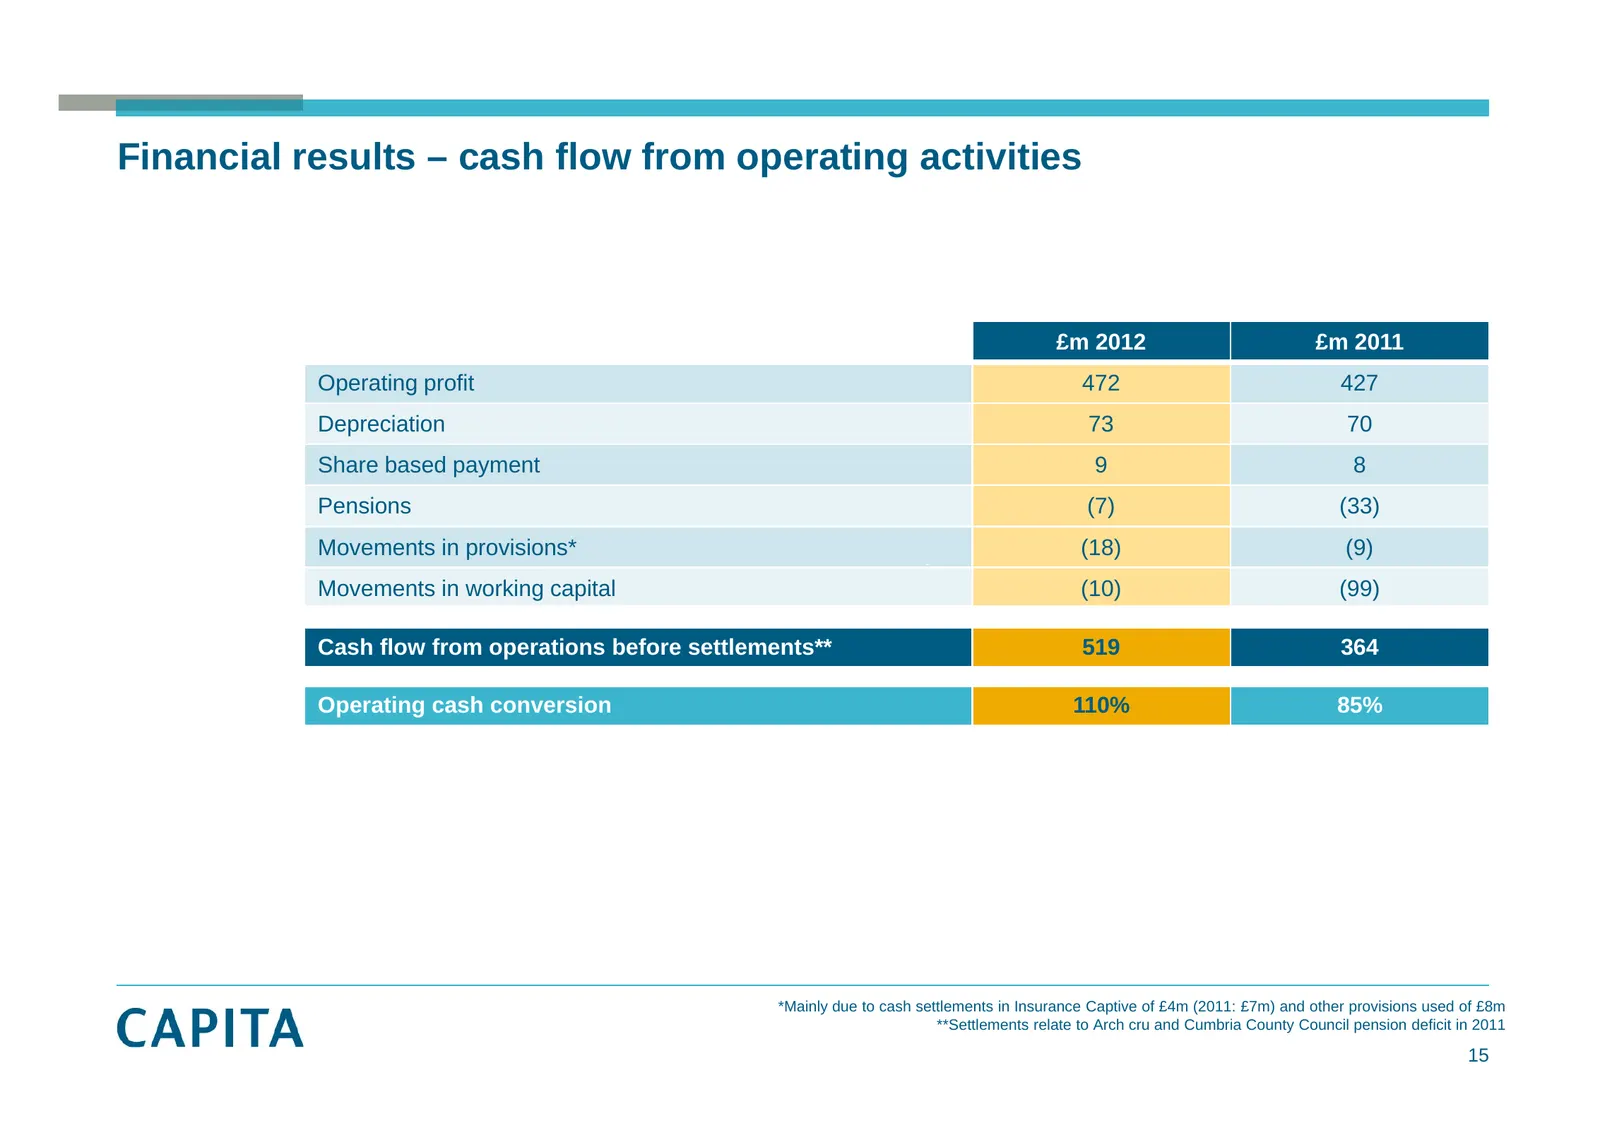
Financial results – cash flow from operating activities £m 2012 £m 2011 Operating profit 472 427 Depreciation 73 70 Share based payment 9 8 Pensions (7) (33) Movements in provisions* (18) (9) Movements in working capital (10) (99) Cash flow from operations before settlements** 519 364 Operating cash
Slide 16: Cash – a change of emphasis
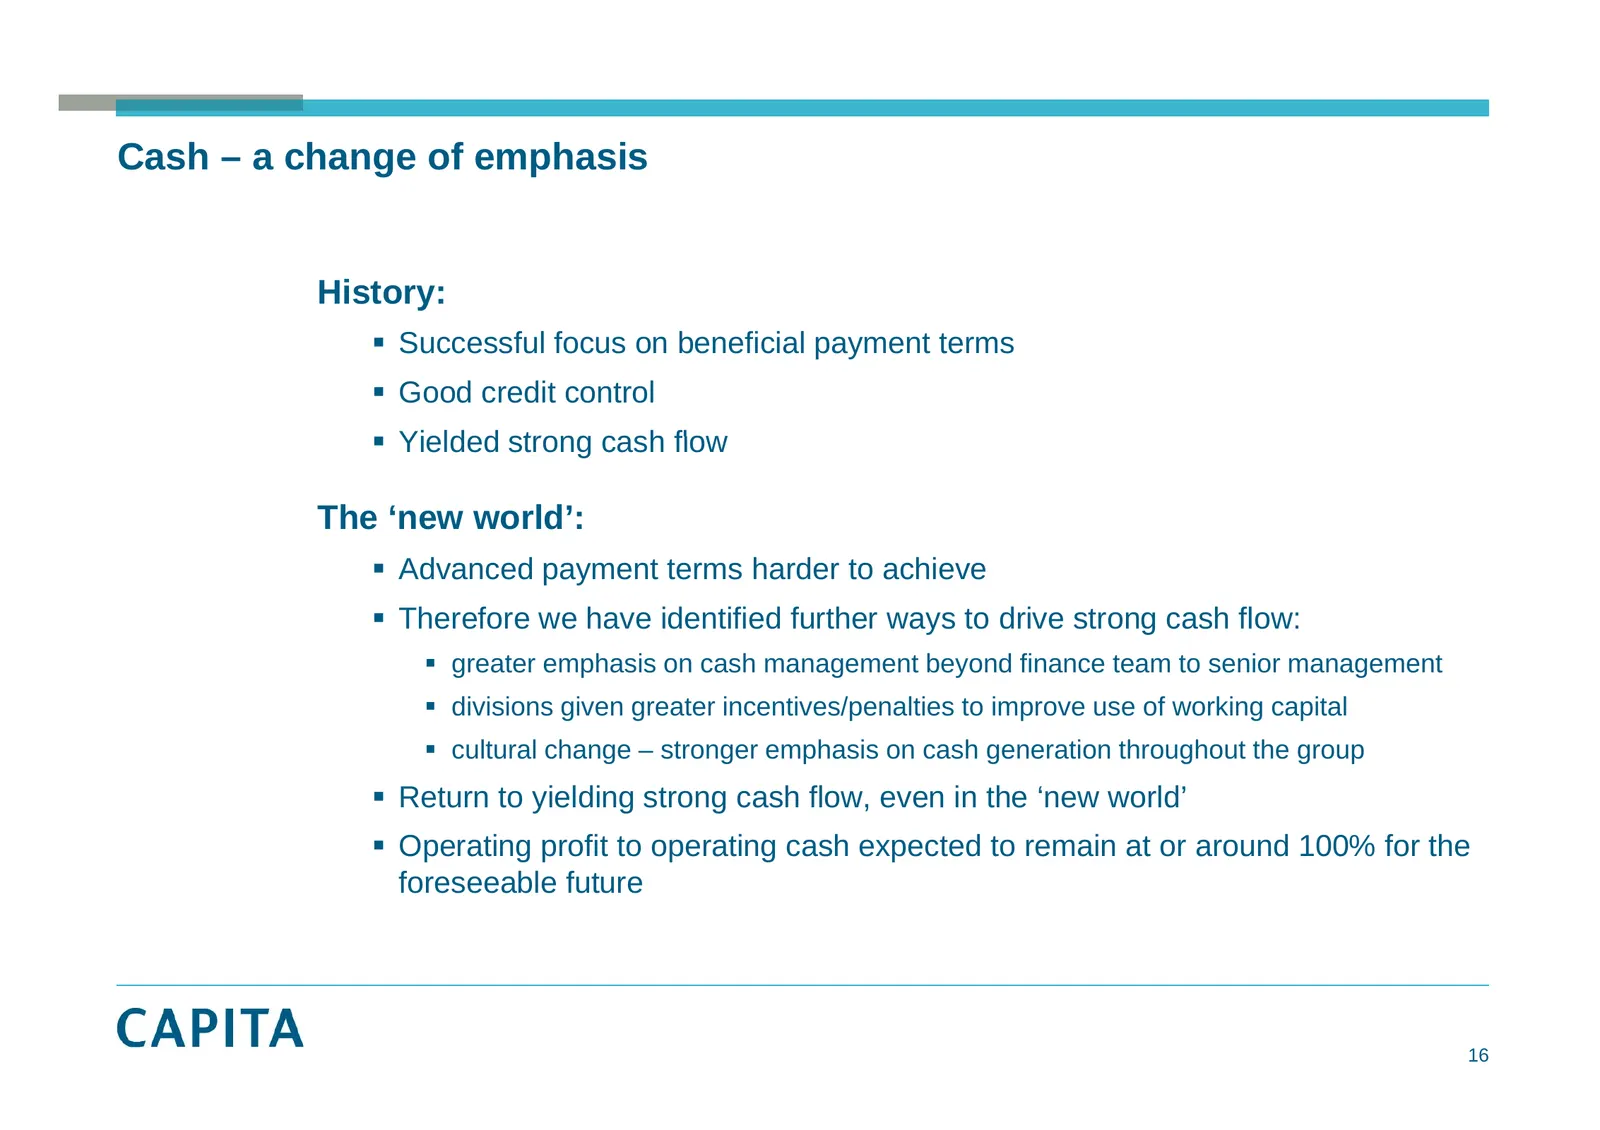
Cash – a change of emphasis History: y Successful focus on beneficial payment terms Good credit control Yielded strong cash flow The ‘new world’: Advanced payment terms harder to achieve Therefore we have identified further ways to drive strong cash flow: greater emphasis on cash managem
Slide 17: Financial results – capex as % turnover
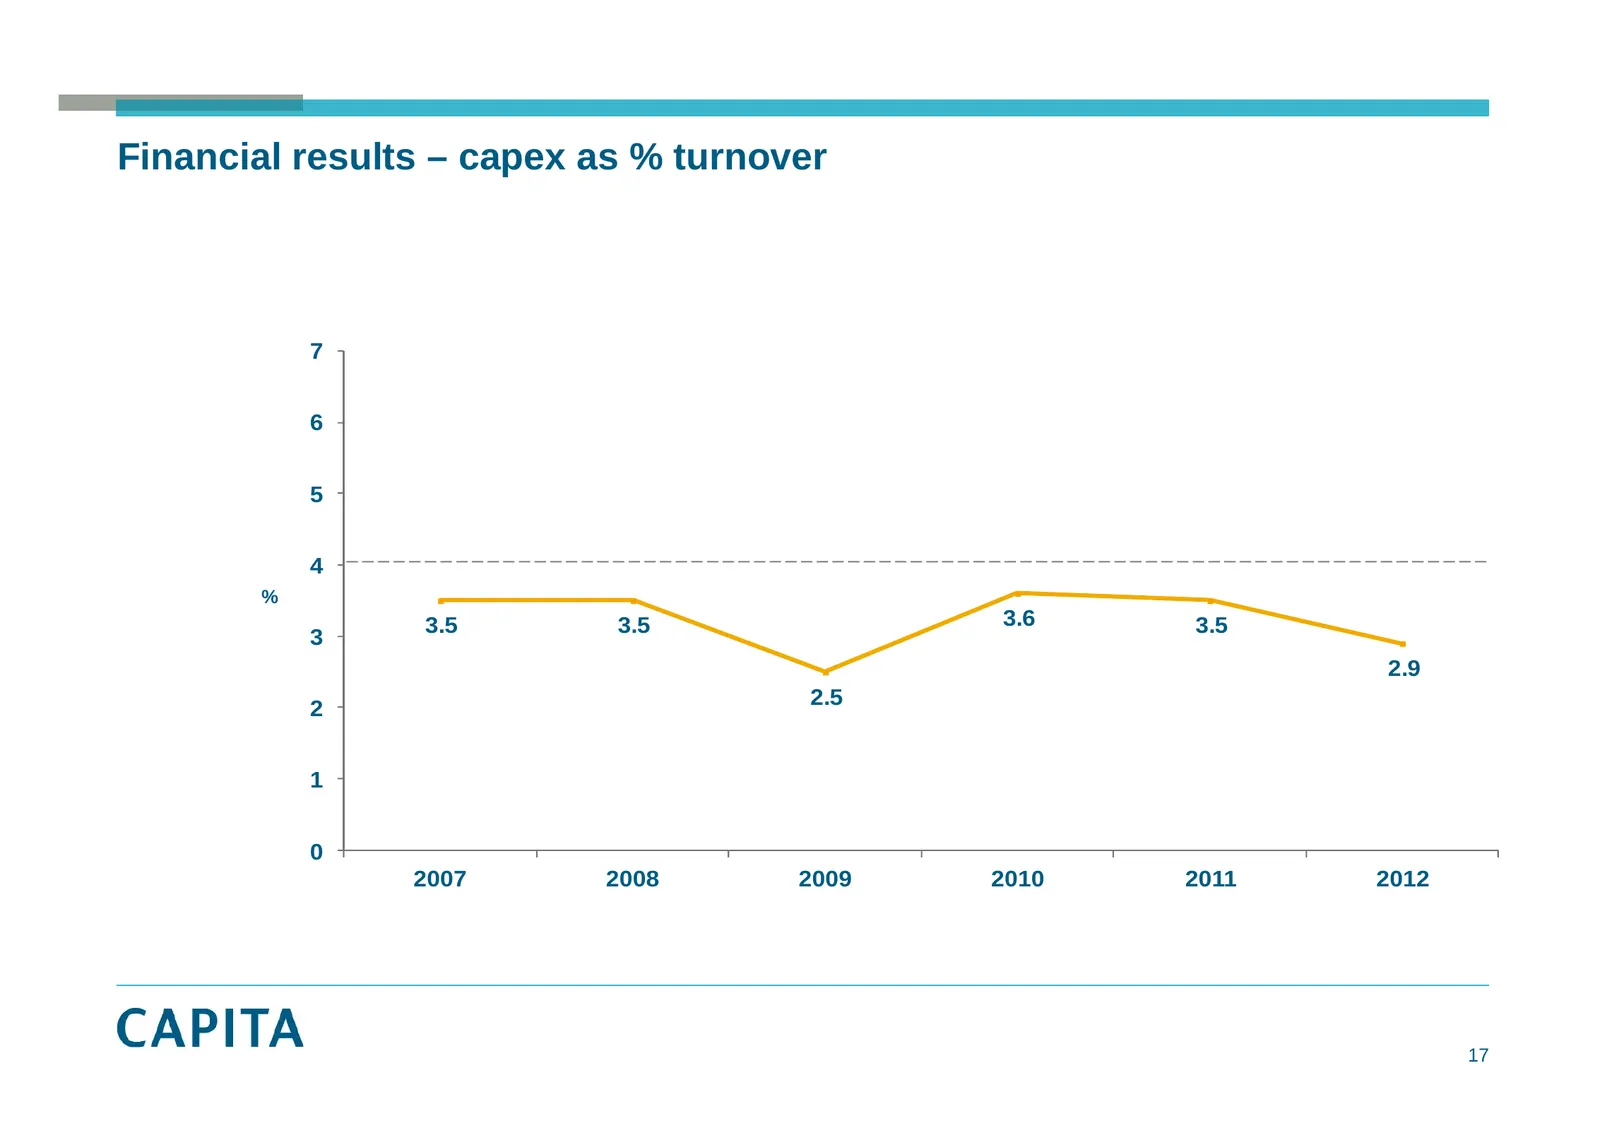
Financial results – capex as % turnover 7 6 5 4 % 3.5 3.5 3.6 3.5 3 2.9 25 2.5 2 1 0 2007 2008 2009 2010 2011 2012 17
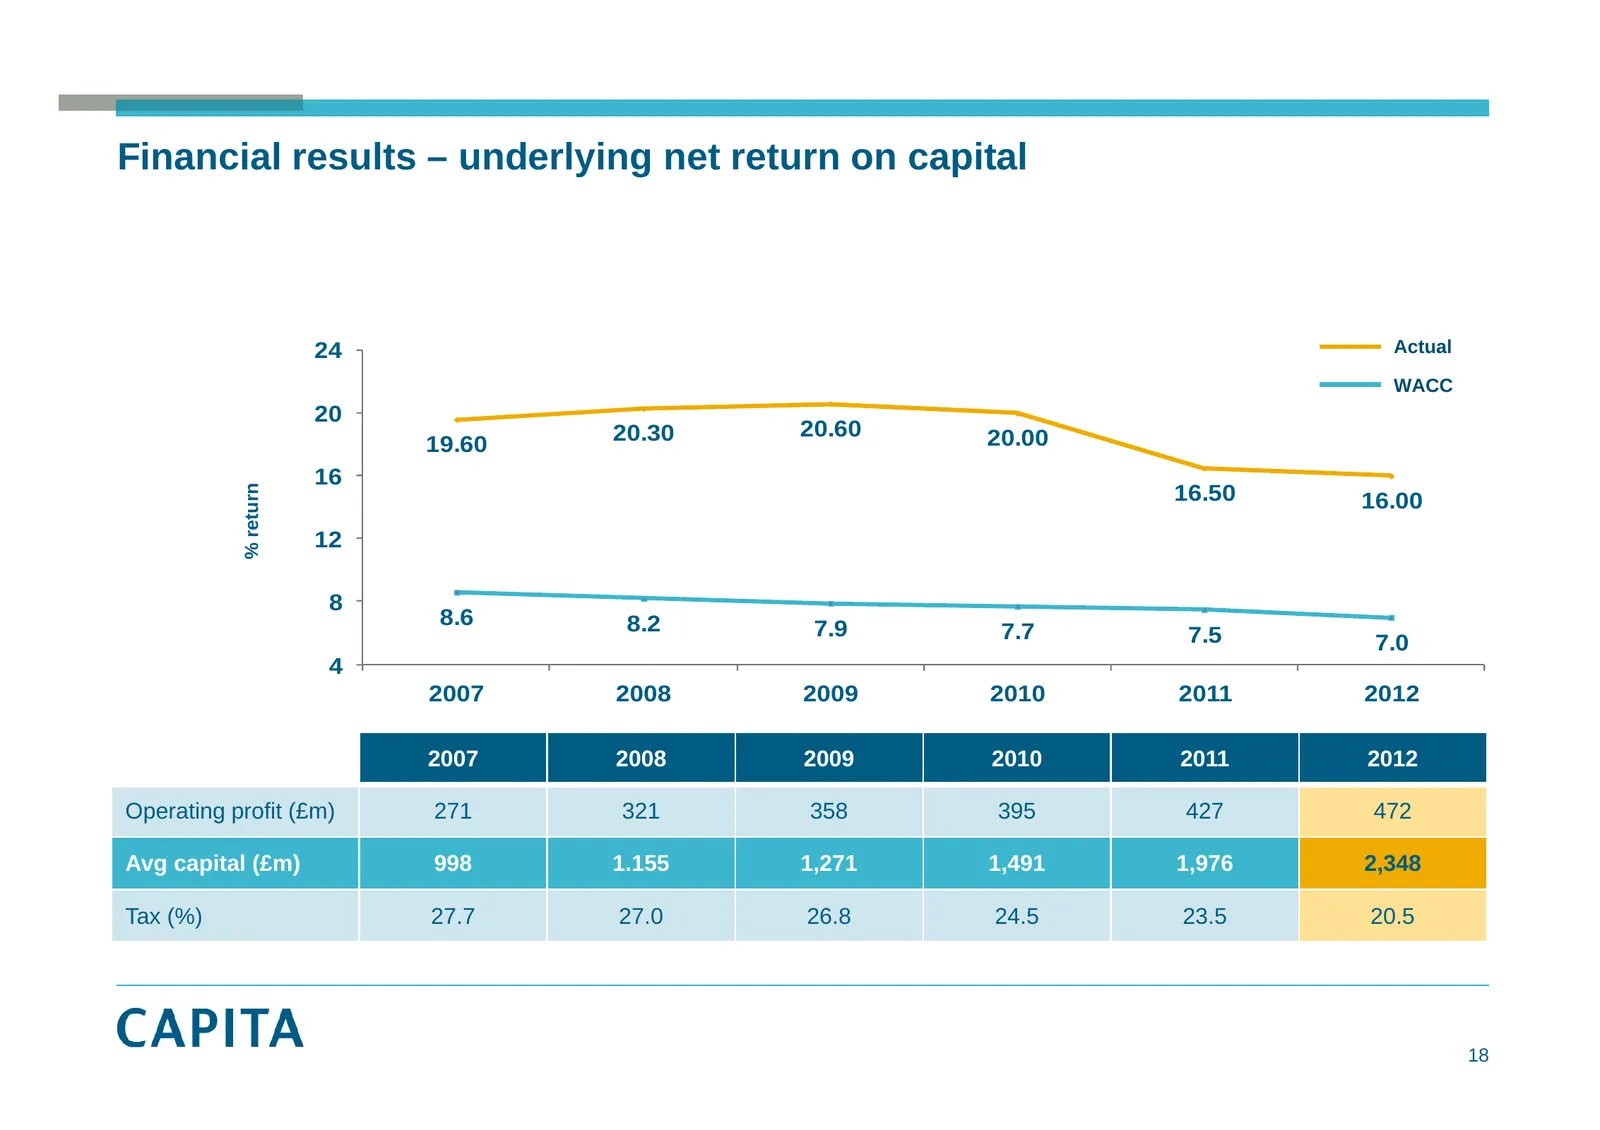
Slide 18: Financial results – underlying net return on capital
Financial results – underlying net return on capital 24 Actual WACC 20 20 30 20.30 20.60 0 60 20 00 20.00 19 60 19.60 16 % return 16.50 16.00 12 8 8.6 8.2 7.9 7.7 7.5 7.0 4 2007 2008 2009 2010 2011 2012 2007 2008 2009 2010 2011 2012 Operating p gpprofit ((£m)) 271 321 358 395 427 472 Avg capital (£m
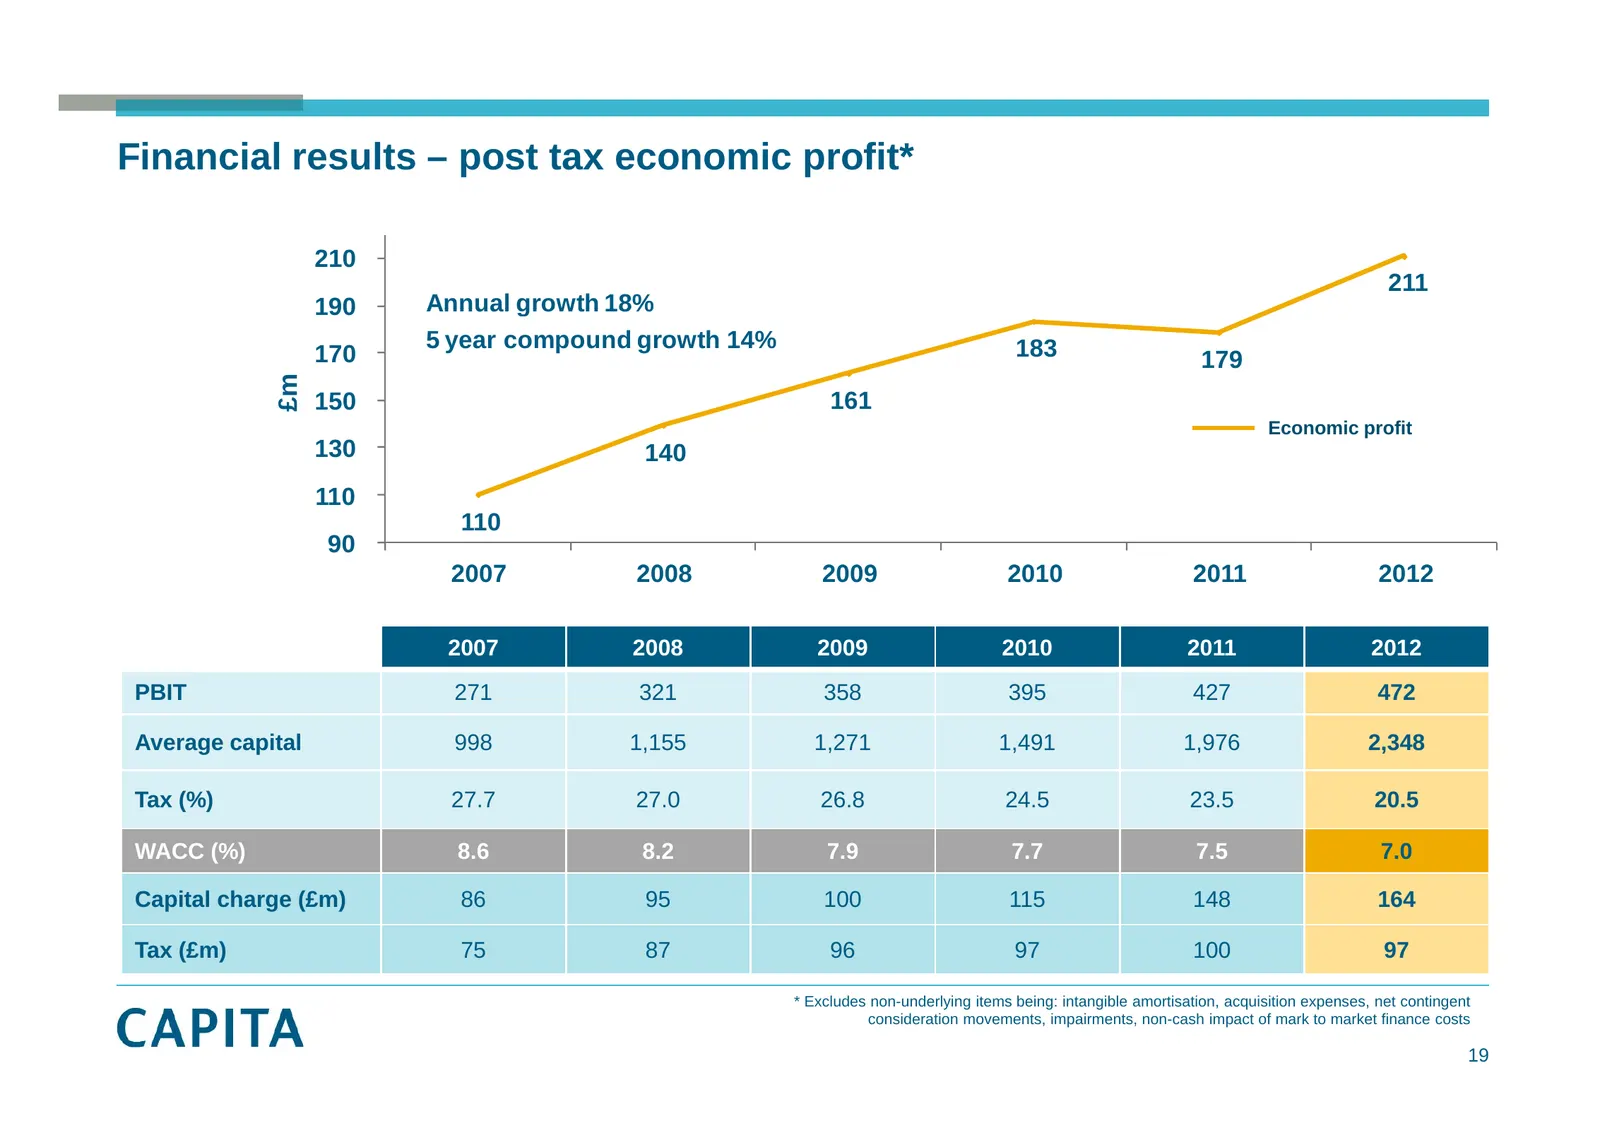
Slide 19: Financial results – post tax economic profit
Financial results – post tax economic profit* 210 211 190 Annual growth 18% 5 year compound growth 14% 183 170 179 £m 150 161 Economic p profit 130 140 110 110 90 2007 2008 2009 2010 2011 2012 2007 2008 2009 2010 2011 2012 PBIT 271 321 358 395 427 472 Average capital 998 1,155 1,271 1,491 1,976 2,34
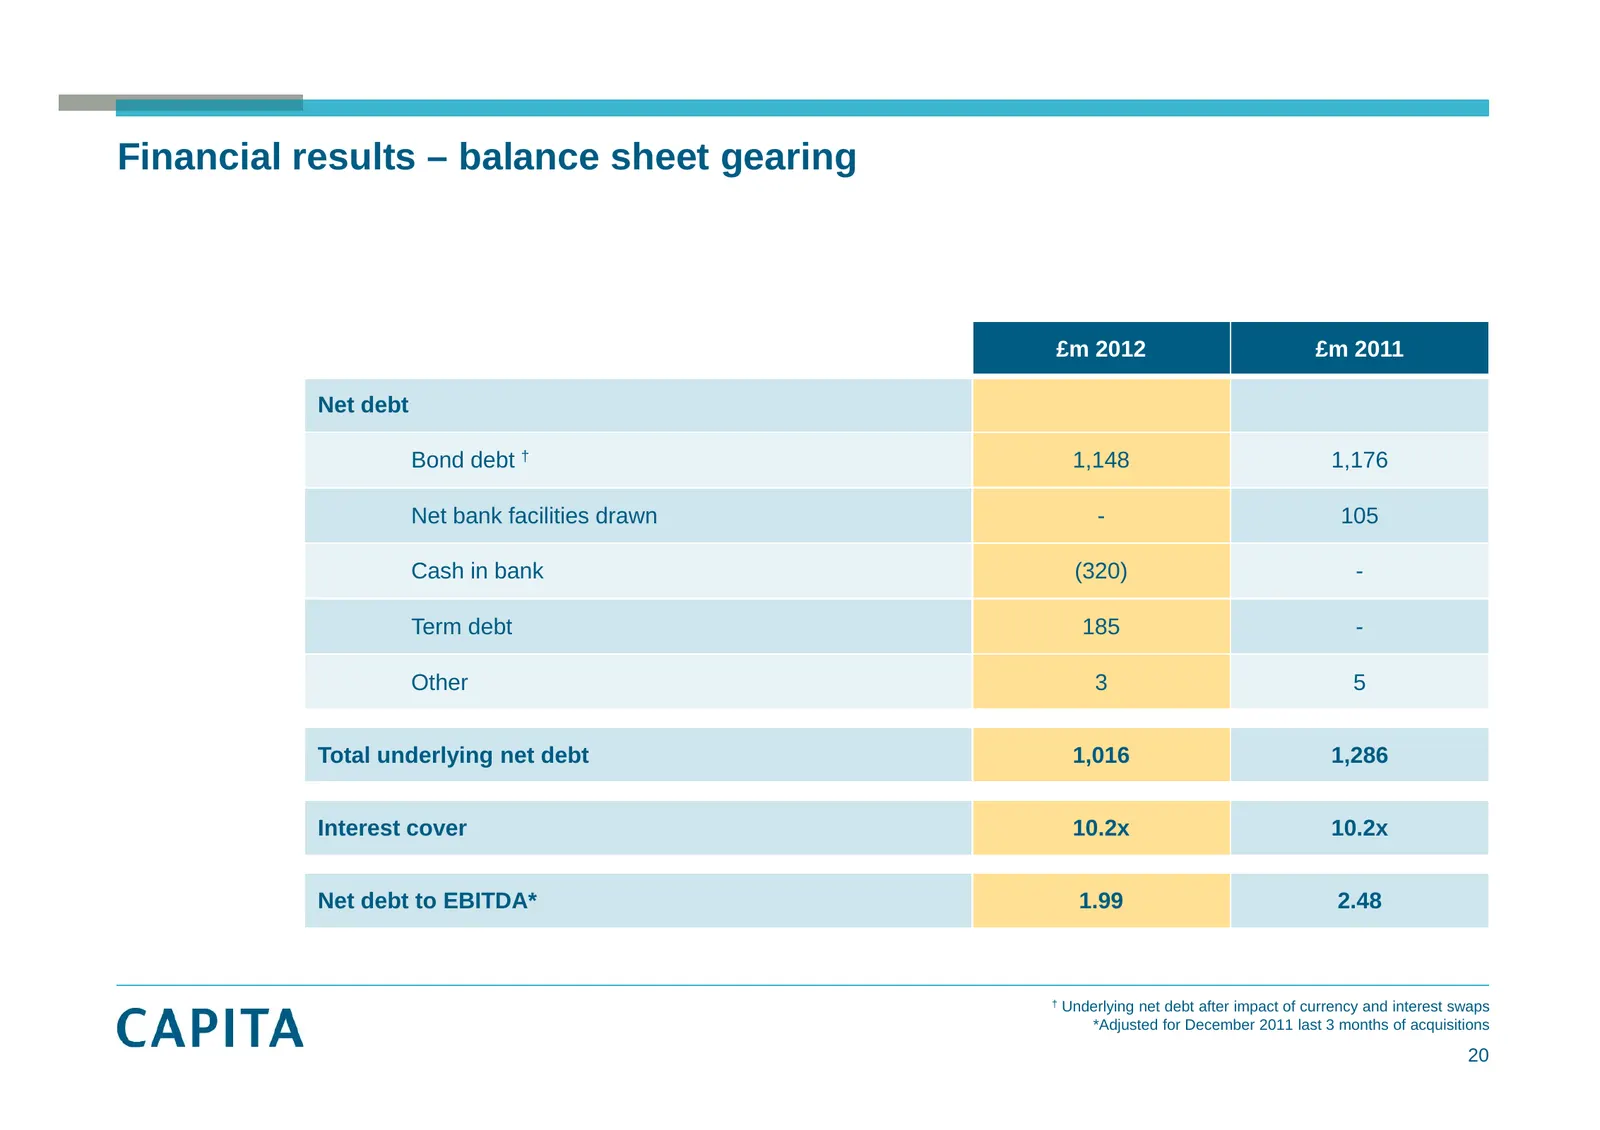
Slide 20: Financial results – balance sheet gearing
Financial results – balance sheet gearing £m 2012 £m 2011 Net debt Bond debt † 1,148 1,176 Net bank facilities drawn - 105 C h in Cash i b bank k (320) - Term debt 185 - Other 3 5 Total underlying net debt 1,016 1,286 I t Interest t cover 10 2 10.2x 10 2 10.2x Net debt to EBITDA* 1.99 2.48 † Underly
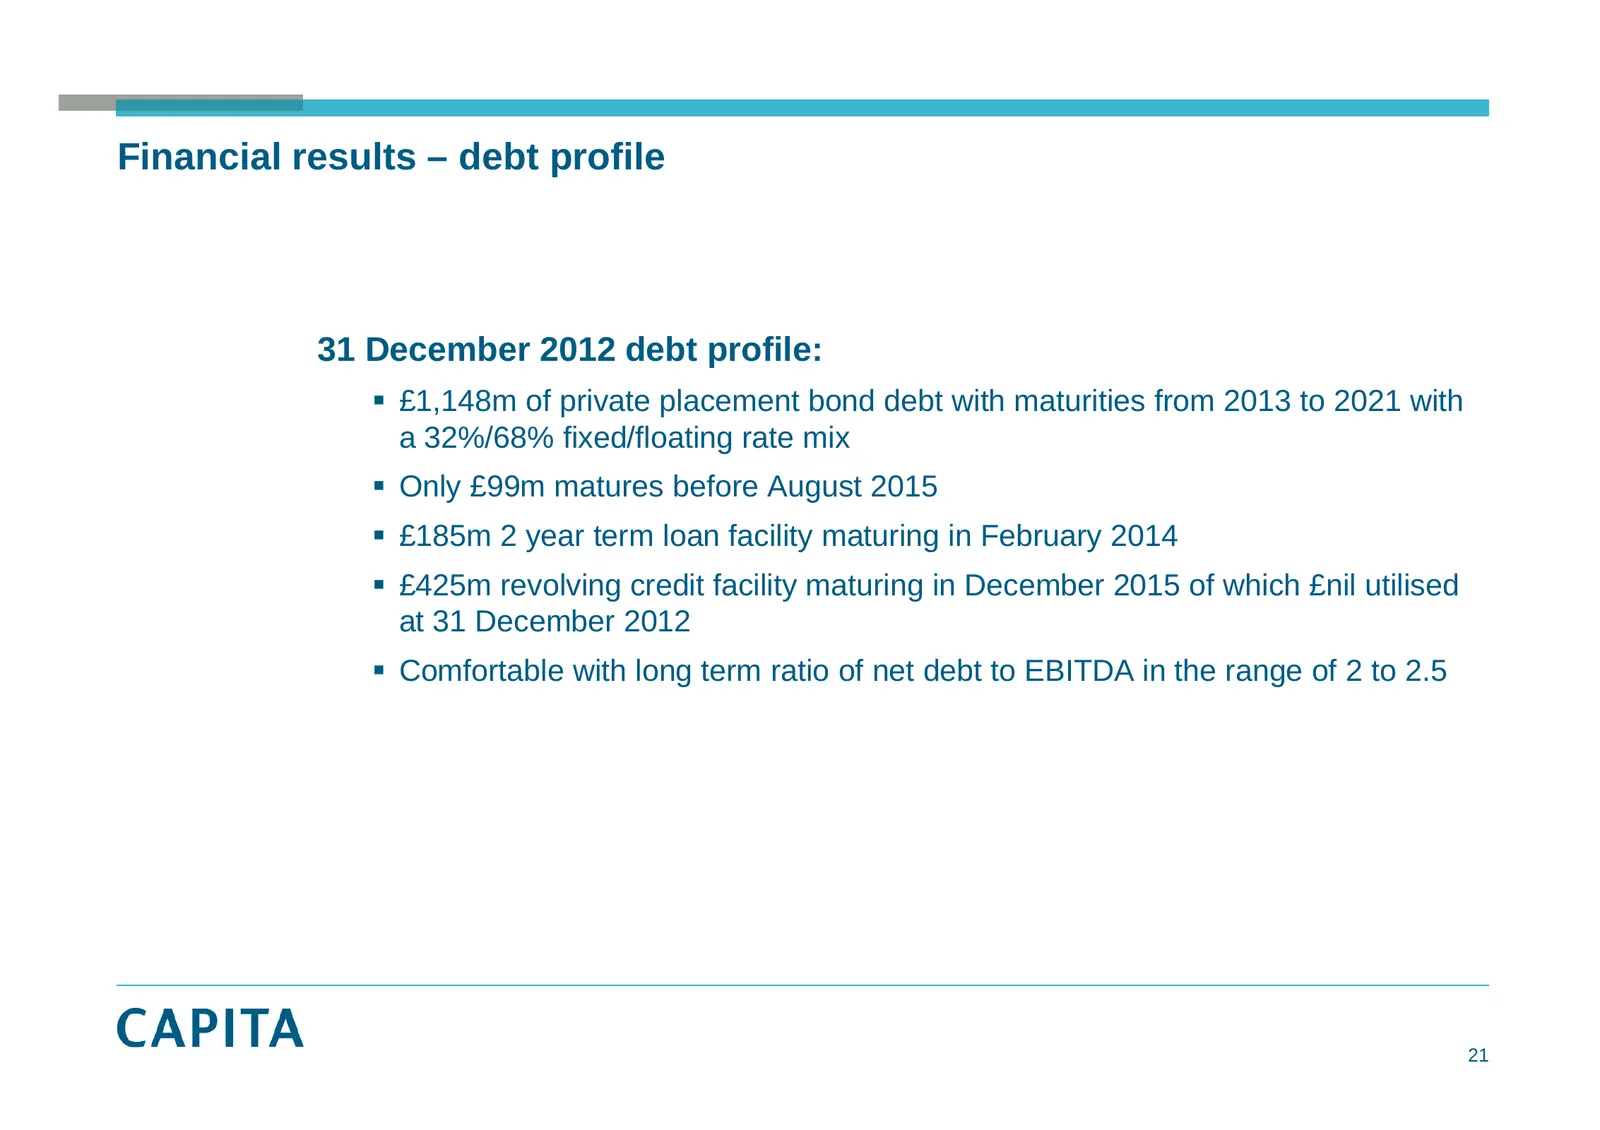
Slide 21: Financial results – debt profile
Financial results – debt profile 31 December 2012 debt profile: £1,148m of private placement bond debt with maturities from 2013 to 2021 with a 32%/68% fixed/floating rate mix Only £99m matures before August 2015 £185m 2 year term loan facility maturing in February 2014 £425m revolving credi
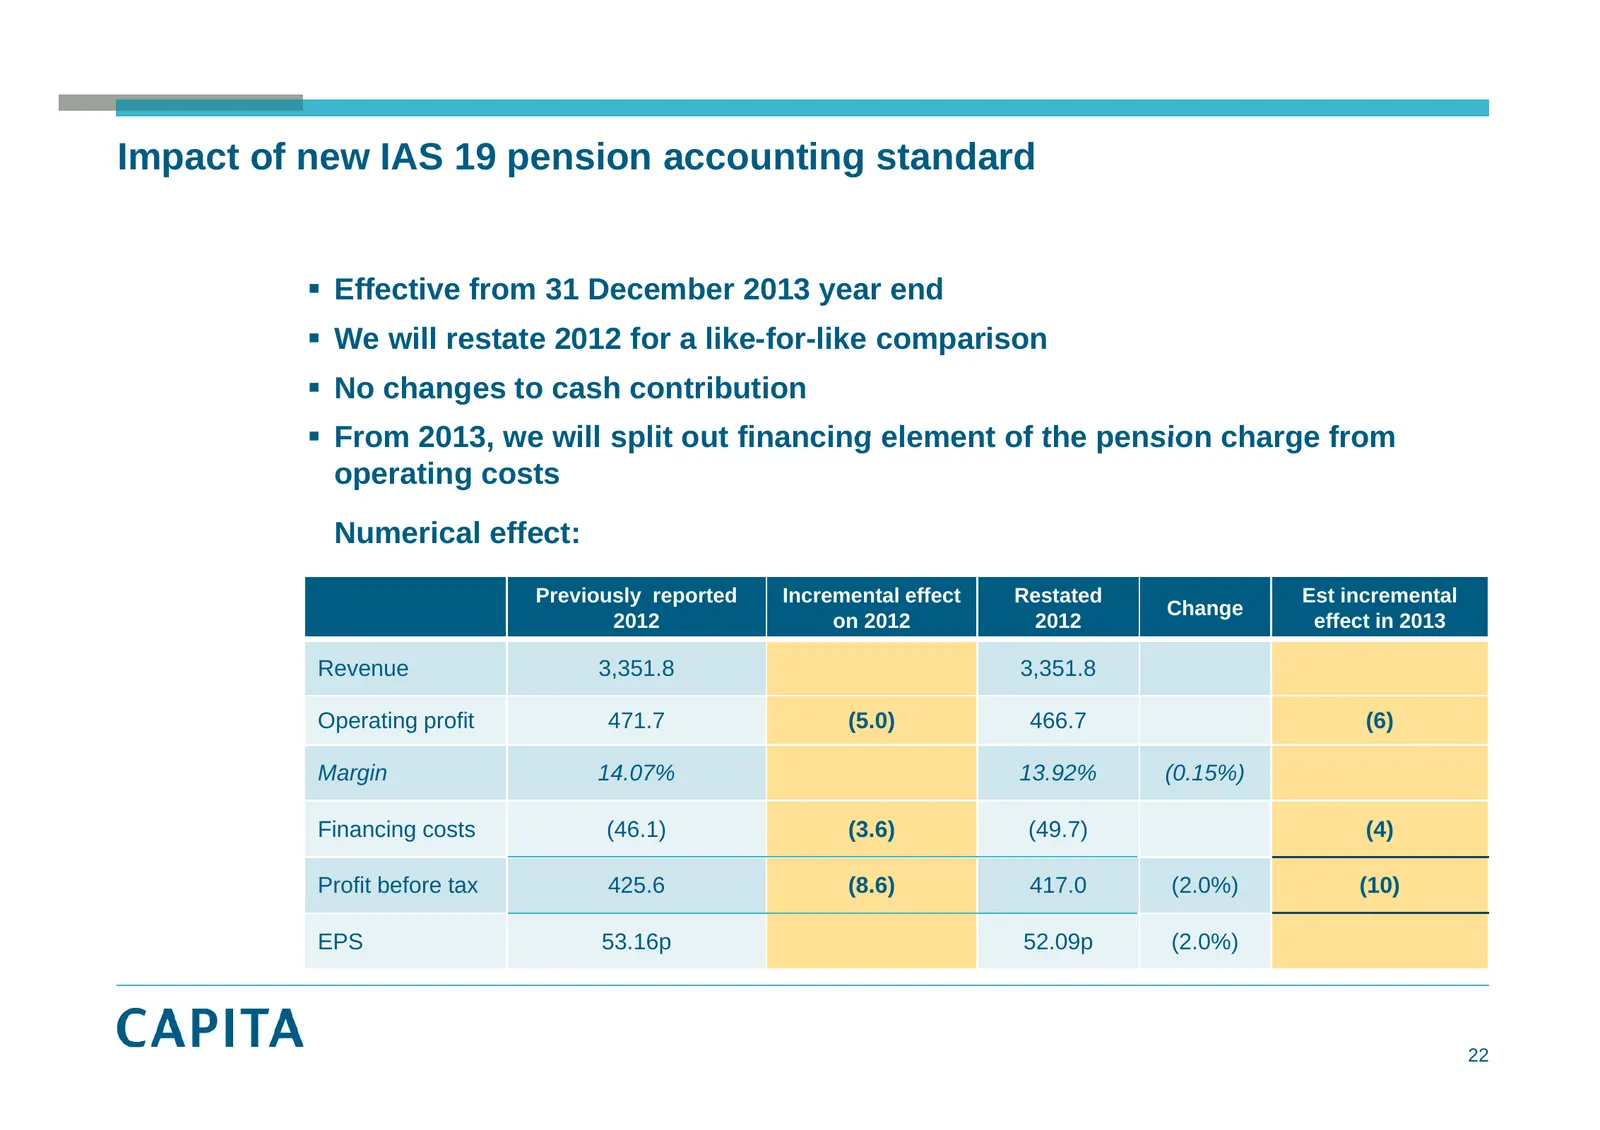
Slide 22: Impact of new IAS 19 pension accounting standard
Impact of new IAS 19 pension accounting standard Effective from 31 December 2013 year end We will restate 2012 for a like-for-like comparison No changes to cash contribution From 2013 2013, we will split out financing element of the pension charge from operating costs Numerical effect: Previ
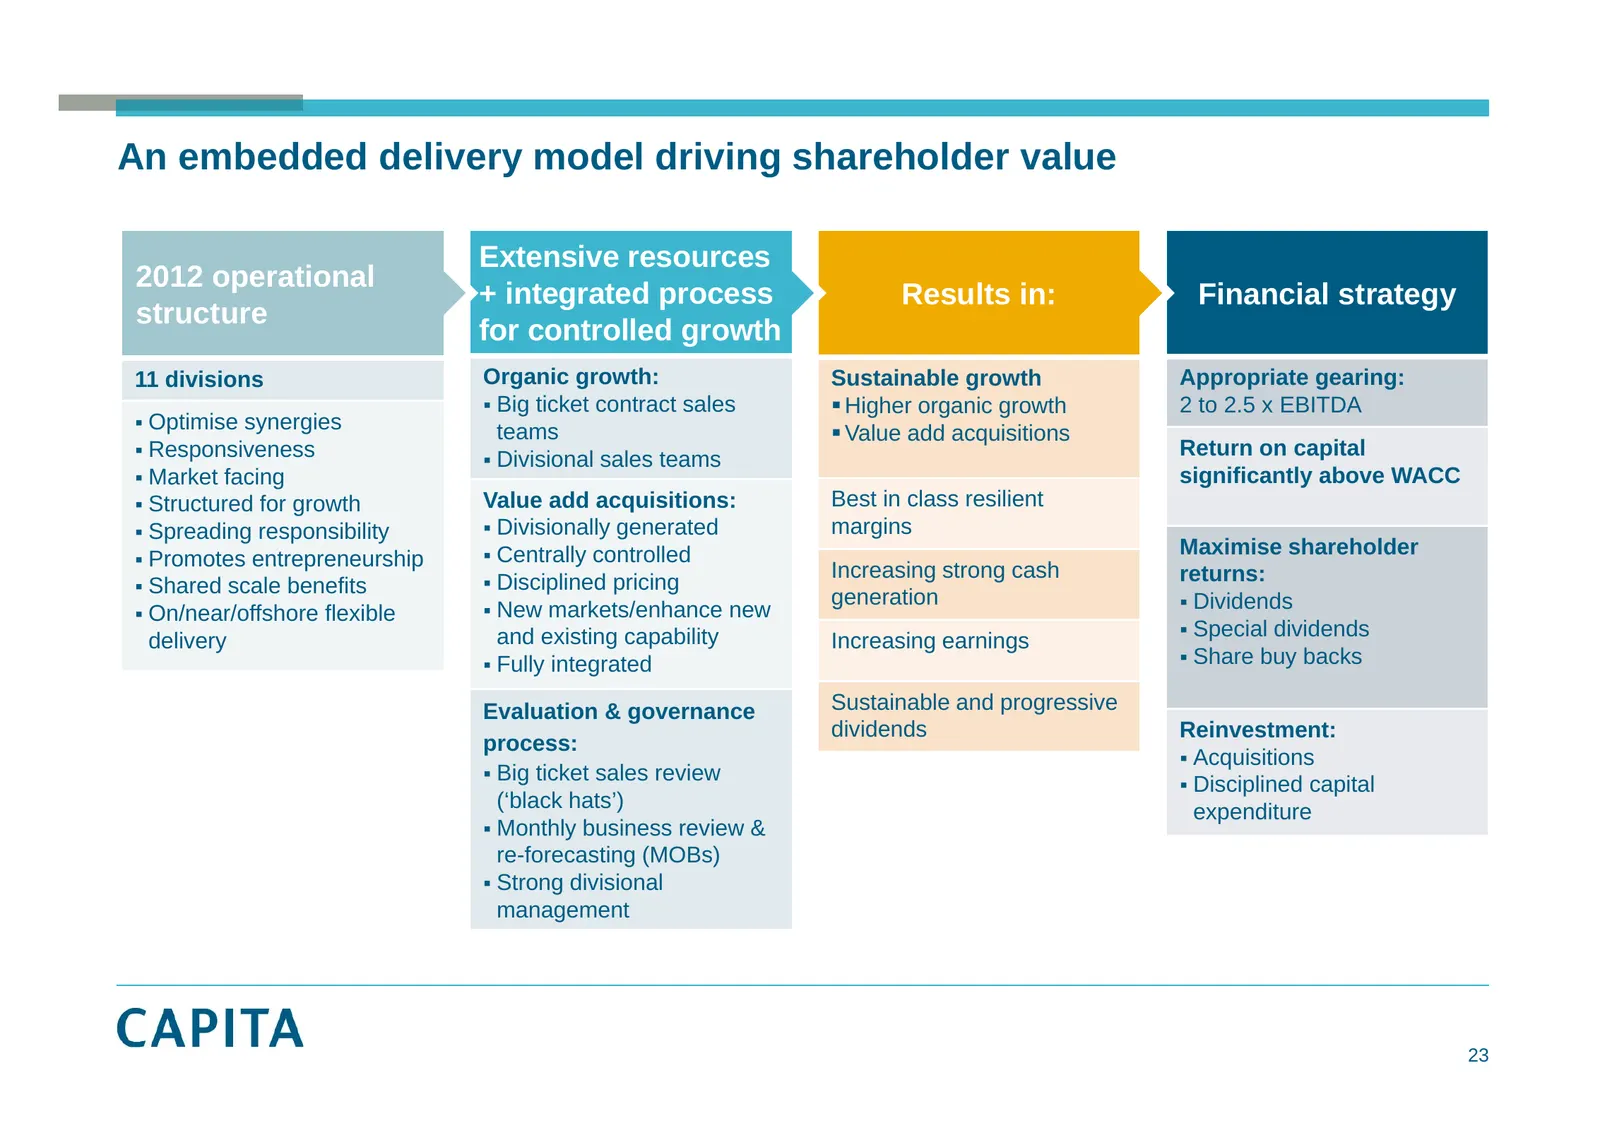
Slide 23: An embedded delivery model driving shareholder value
An embedded delivery model driving shareholder value Extensive resources 2012 operational + integrated g process p Results in: Financial strategy gy structure for controlled growth 11 divisions Organic growth: Sustainable growth Appropriate gearing: Big ticket contract sales Higher organic growt
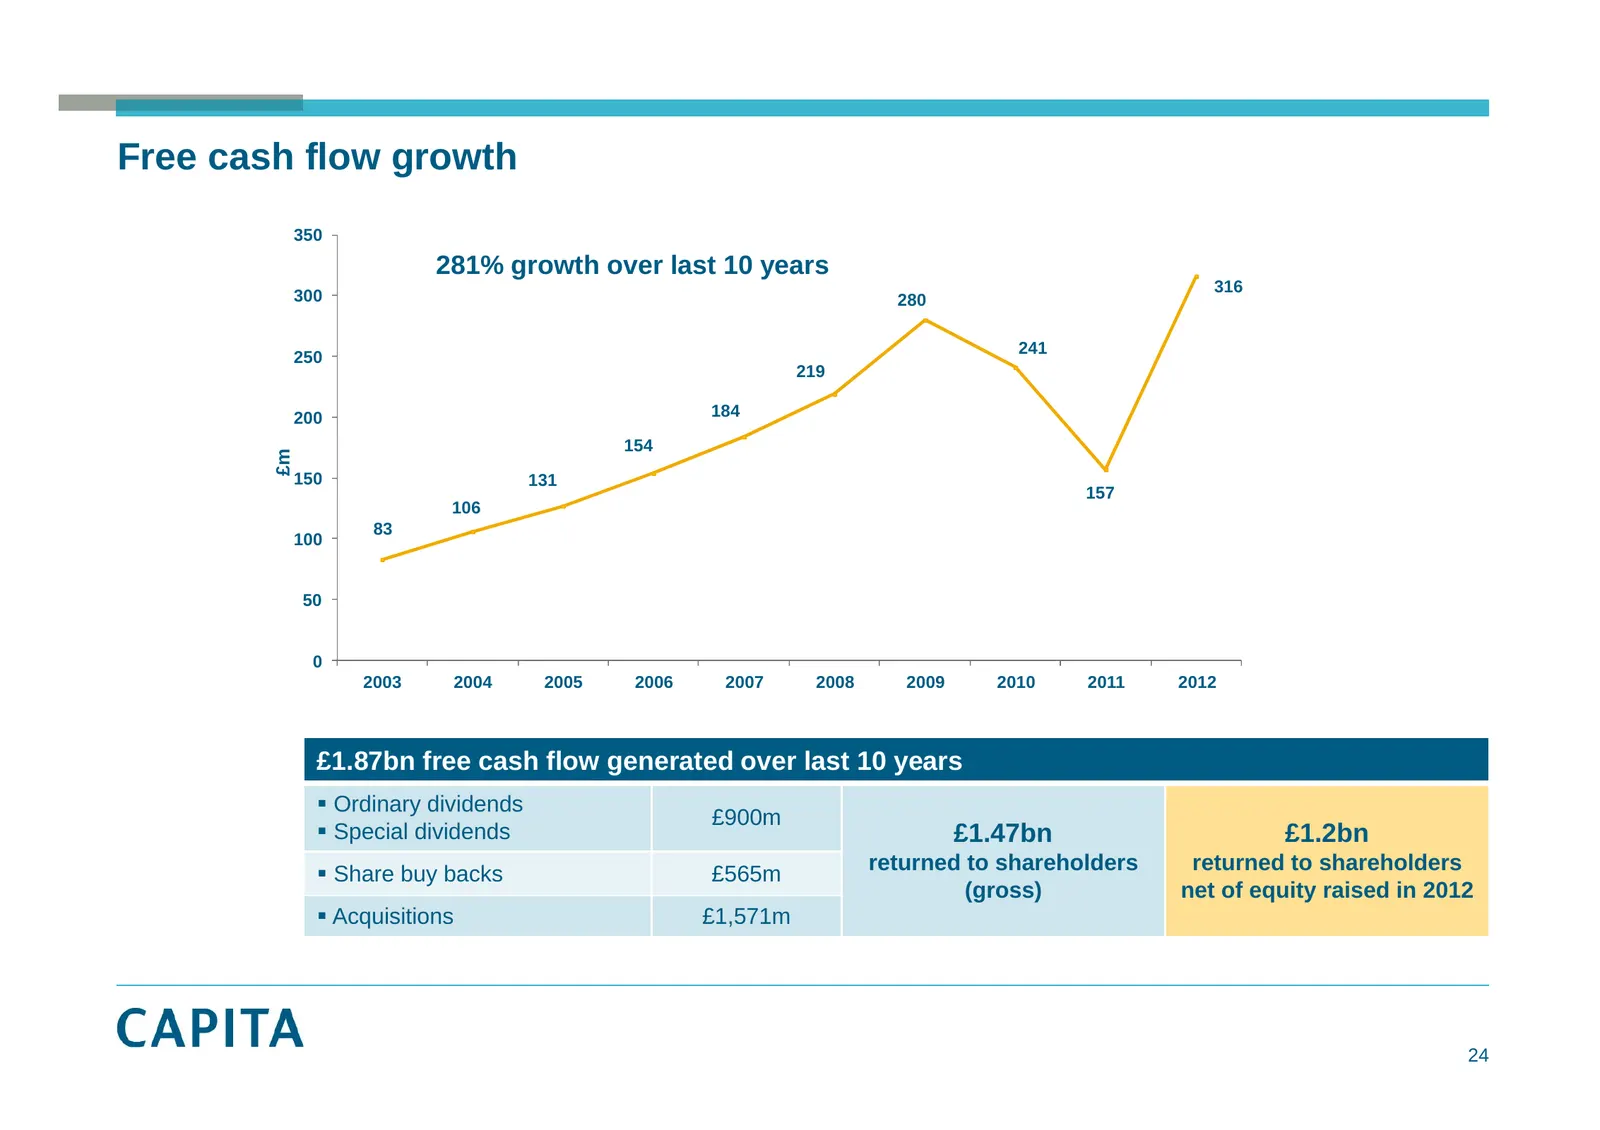
Slide 24: Free cash flow growth
Free cash flow growth 350 281% growth over last 10 years 316 300 280 241 250 219 200 184 154 £m 150 131 157 106 83 100 50 0 2003 2004 2005 2006 2007 2008 2009 2010 2011 2012 £1.87bn free cash flow generated over last 10 years Ordinary dividends £900m Special dividends £1.47bn £1.2bn returned to
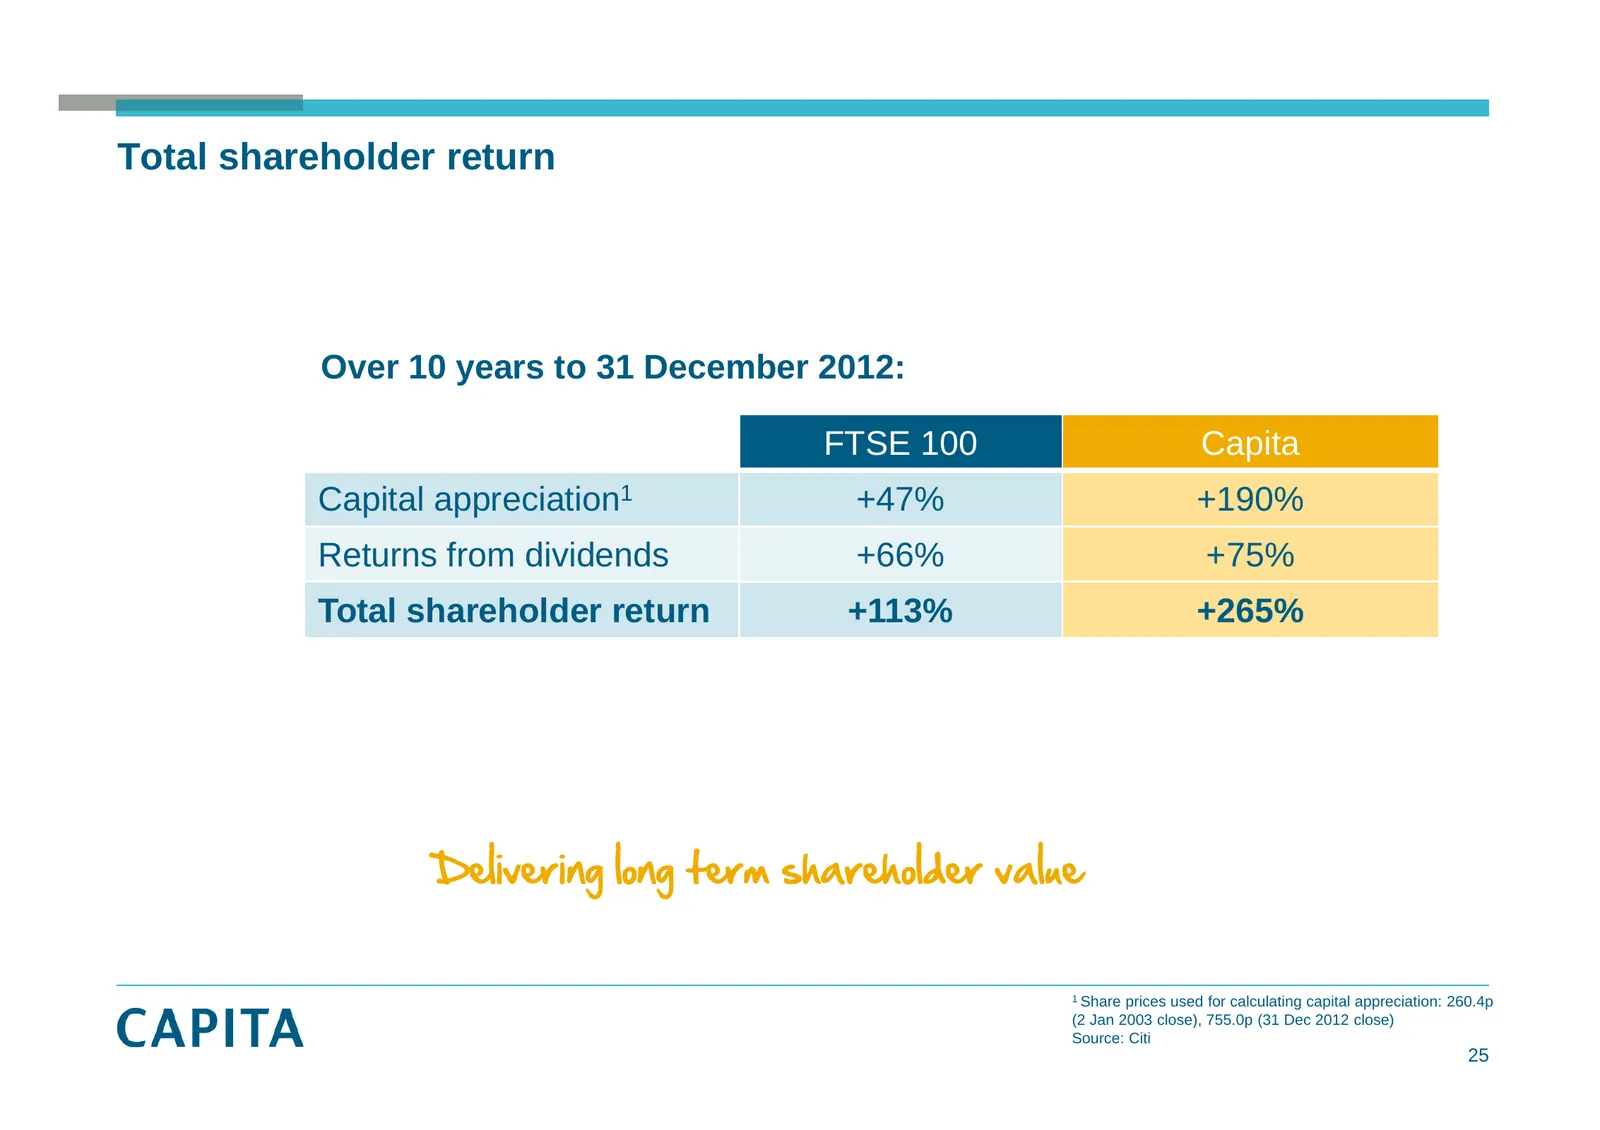
Slide 25: Delivering long term shareholder value
Total shareholder return Over 10 years to 31 December 2012: FTSE 100 C it Capita Capital appreciation1 +47% +190% Returns from dividends +66% 66% +75% 75% Total shareholder return +113% +265% Delivering long term shareholder value 1 Share prices used for calculating capital appreciation: 260.4p (2 J

Slide 26: Creating growth: Major sales & market potential
Creating growth: Major sales & market potential Maggi Bell Group Business Development Director
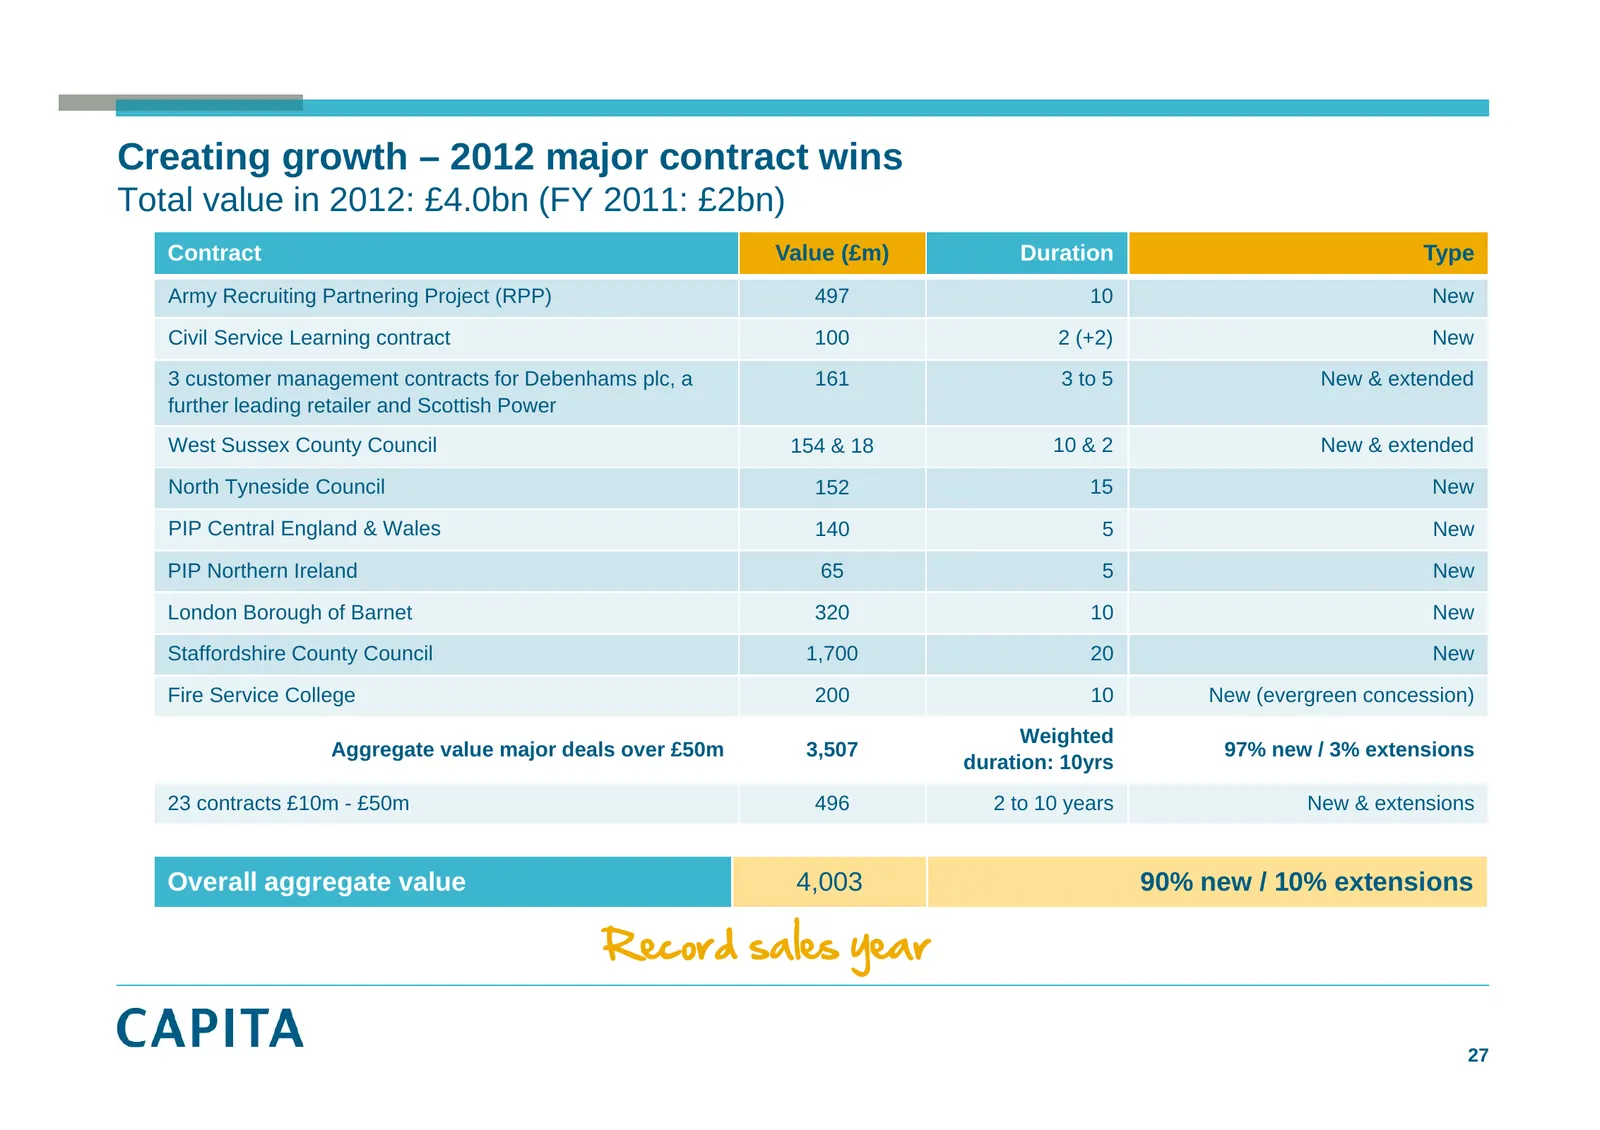
Slide 27: Creating growth – 2012 major contract wins
Creating growth – 2012 major contract wins Total value in 2012: £4.0bn (FY 2011: £2bn) Contract Value (£m) Duration Type Army Recruiting Partnering Project (RPP) 497 10 New Civil Service Learning contract 100 2 (+2) New 3 customer management contracts for Debenhams plc, a 161 3 to 5 New & extended f
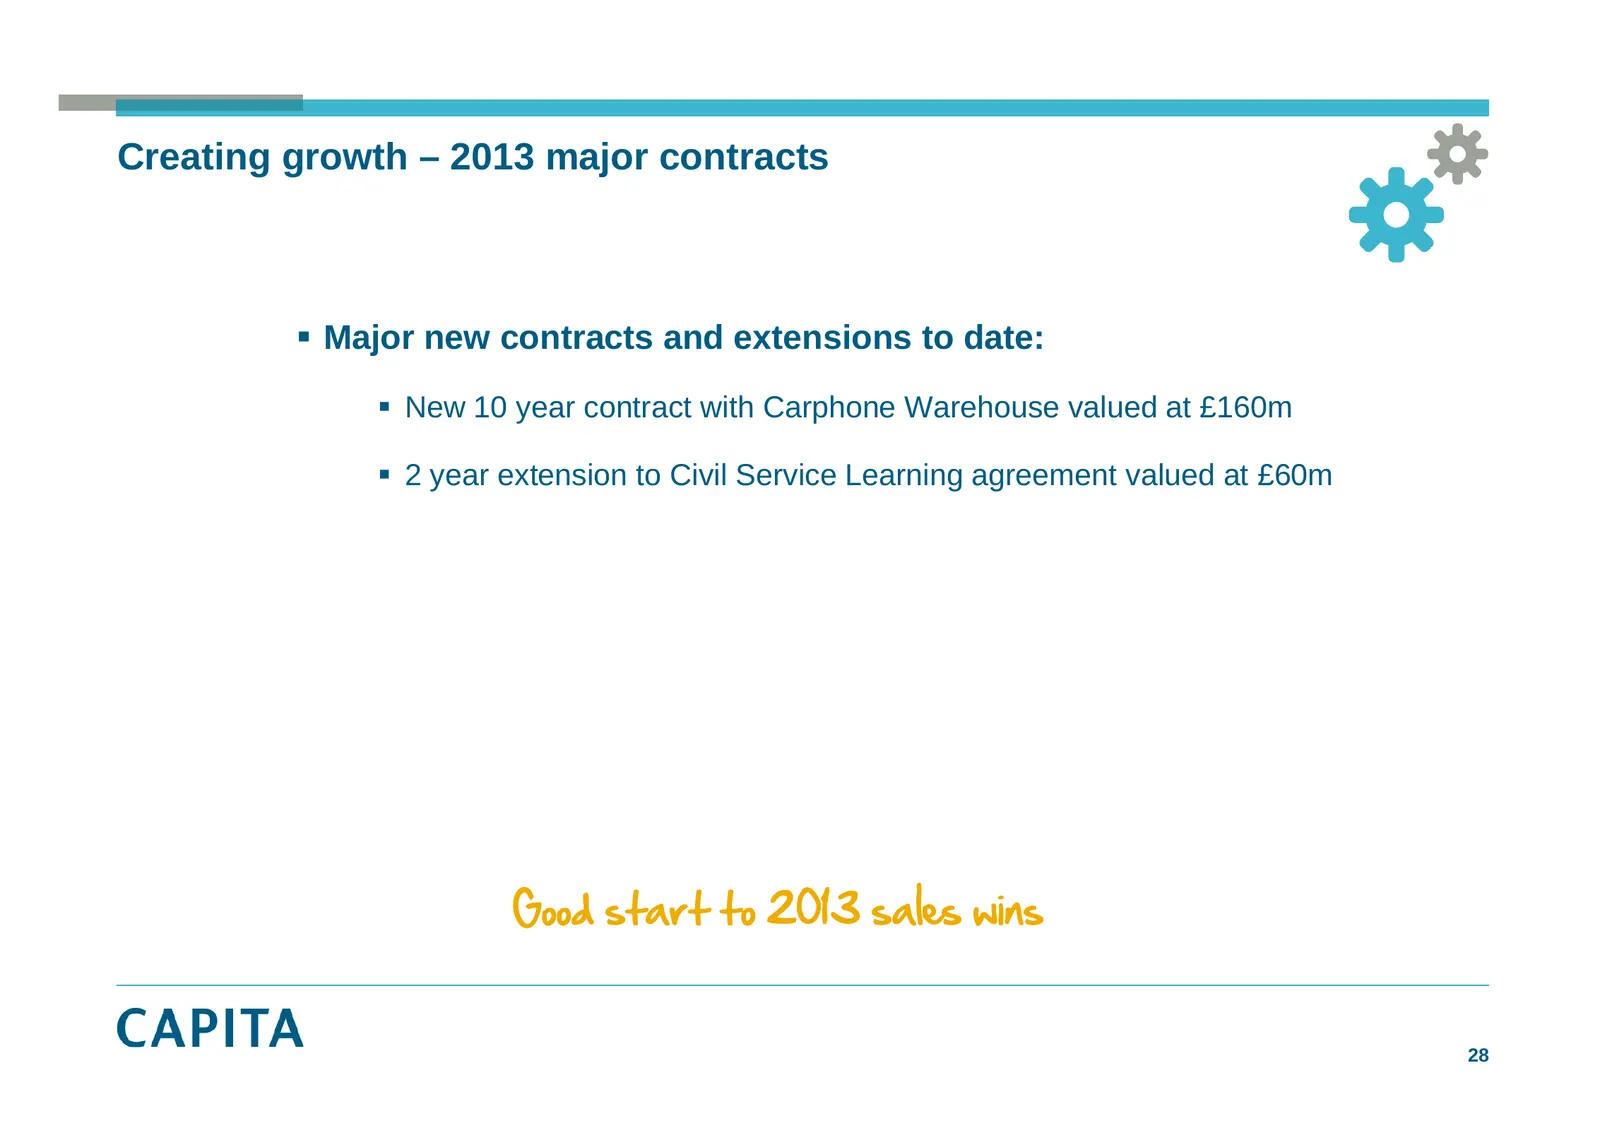
Slide 28: Creating growth – 2013 major contracts
Creating growth – 2013 major contracts Major new contracts and extensions to date: New 10 year contract with Carphone Warehouse valued at £160m 2 year extension to Civil Service Learning agreement valued at £60m Good start to 2013 sales wins 28
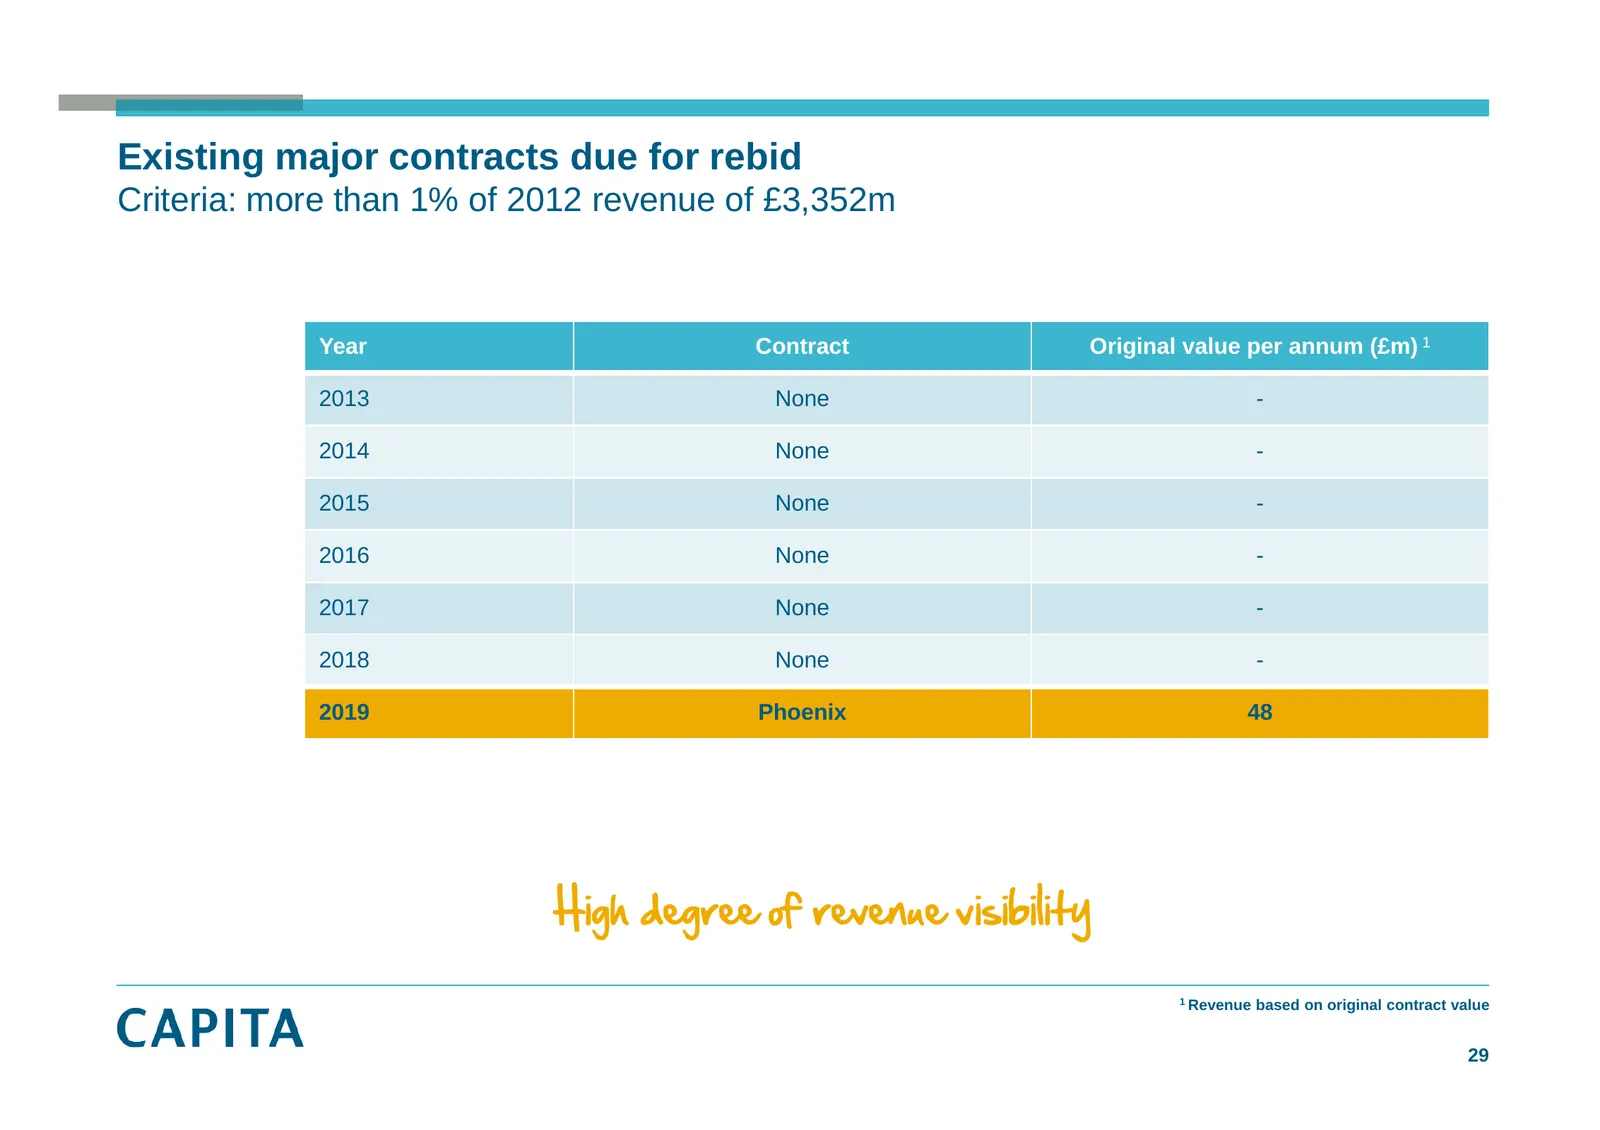
Slide 29: Existing major contracts due for rebid
Existing major contracts due for rebid Criteria: more than 1% of 2012 revenue of £3,352m Year Contract Original value per annum (£m) 1 2013 None - 2014 None - 2015 None - 2016 None - 2017 None - 2018 None - 2019 Phoenix 48 High degree of revenue visibility 1 Revenue based on original contract value
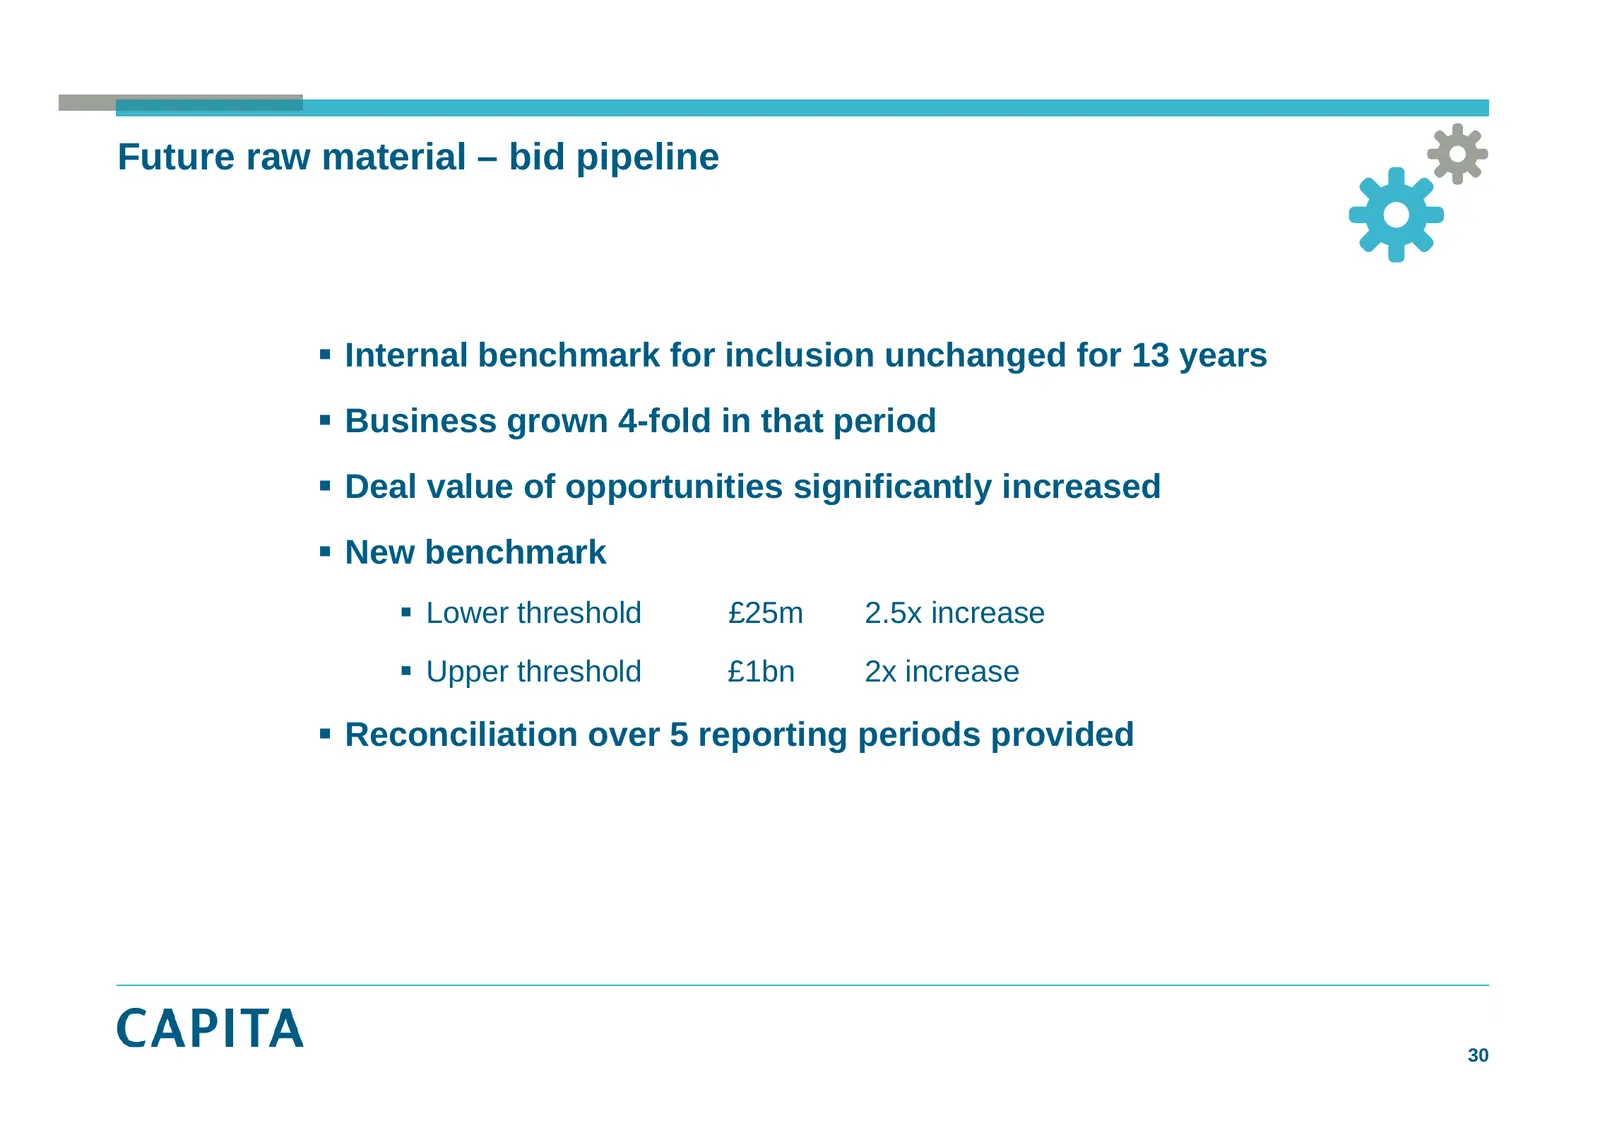
Slide 30: Future raw material – bid pipeline
Future raw material – bid pipeline Internal benchmark for inclusion unchanged for 13 years Business g grown 4-fold in that p period Deal value of opportunities significantly increased New benchmark Lower threshold £25m 2.5x increase Upper threshold £1bn 2x increase Reconciliation over
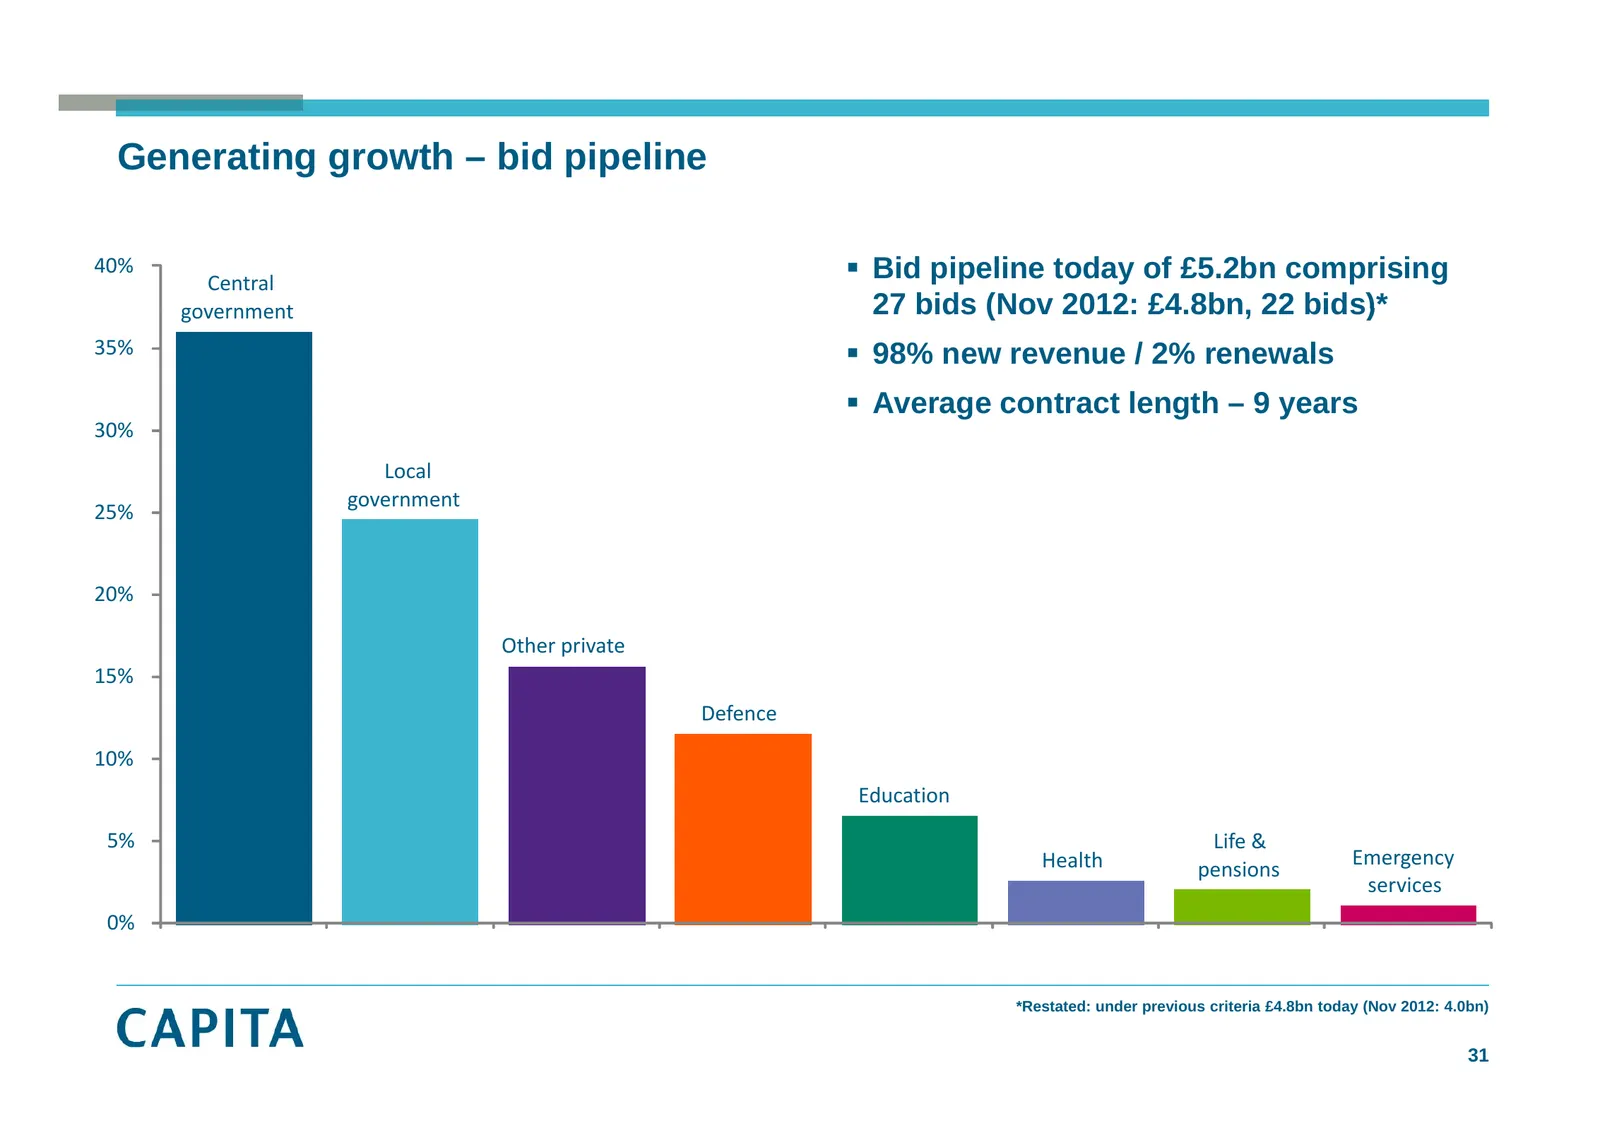
Slide 31: Generating growth – bid pipeline
Generating growth – bid pipeline 40% Central Bid pipeline today of £5.2bn comprising government 27 bids (Nov 2012: £4 £4.8bn, 8bn 22 bids)* bids) 35% 98% new revenue / 2% renewals Average contract length – 9 years 30% Local government 25% 20% Other private 15% Defence 10% Education 5% Life & H
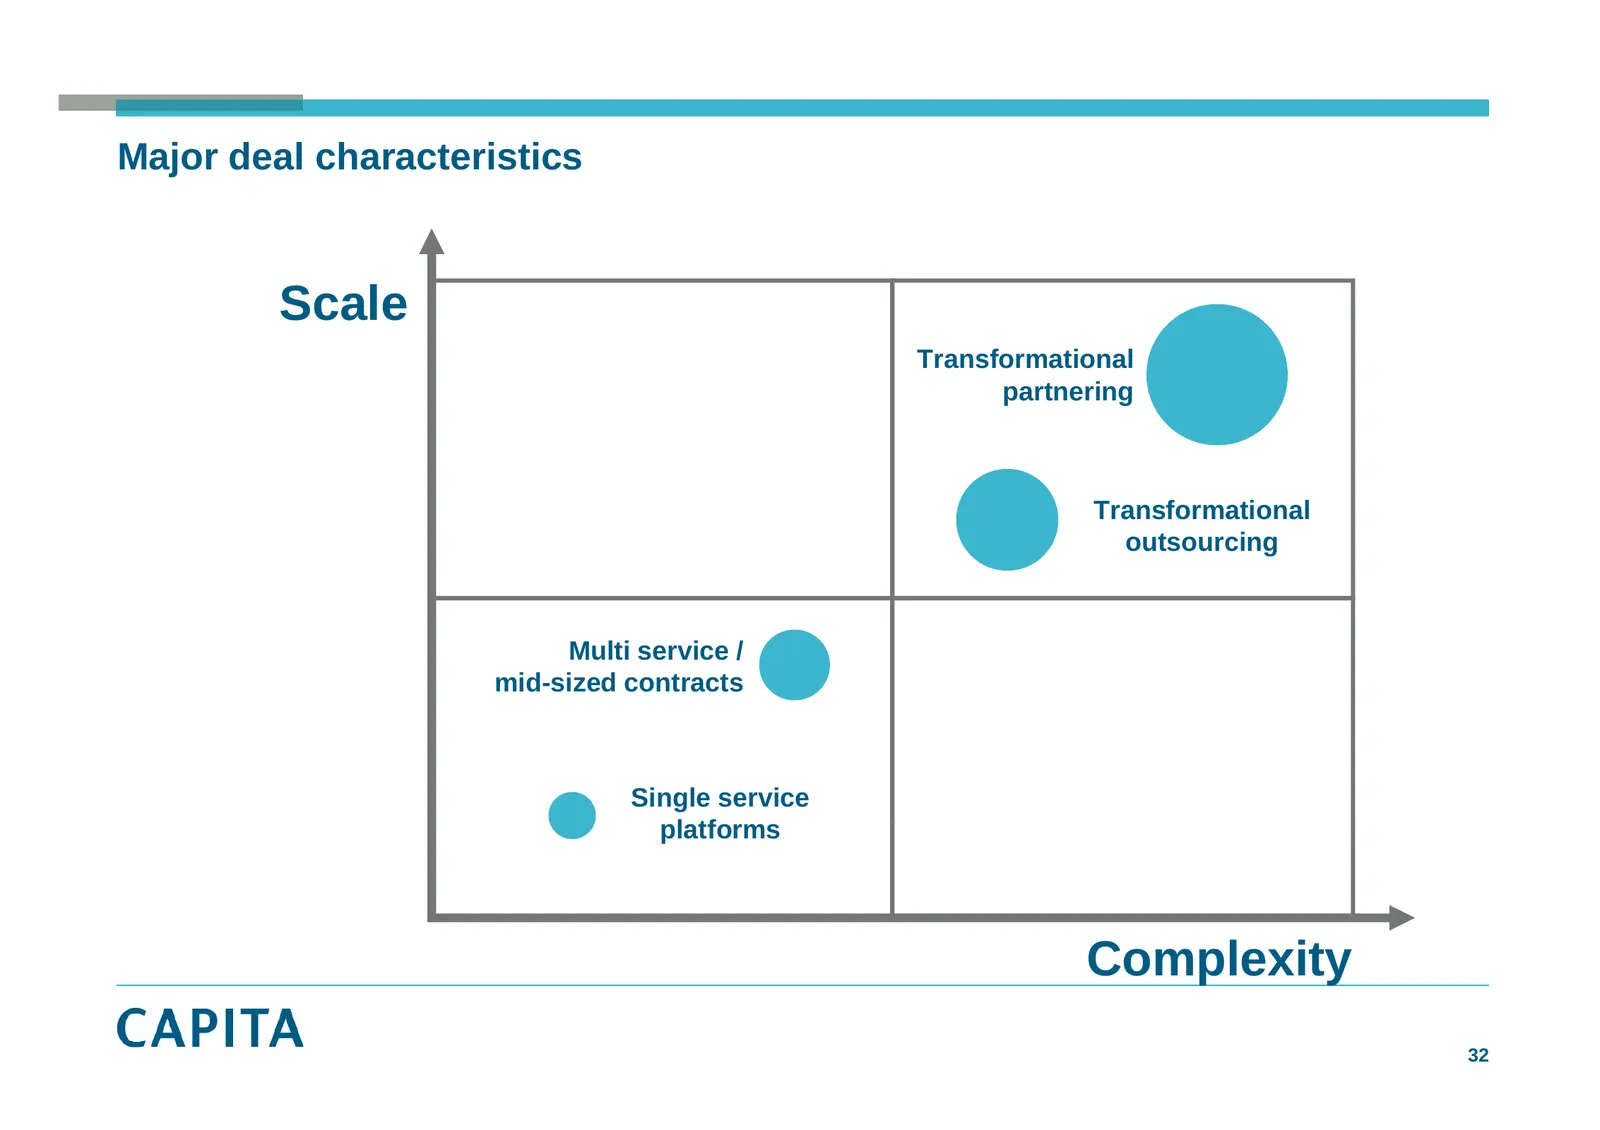
Slide 32: Major deal characteristics
Major deal characteristics Scale Transformational partnering Transformational outsourcing Multi service / mid-sized contracts Single service platforms l tf Comple it Complexity 32
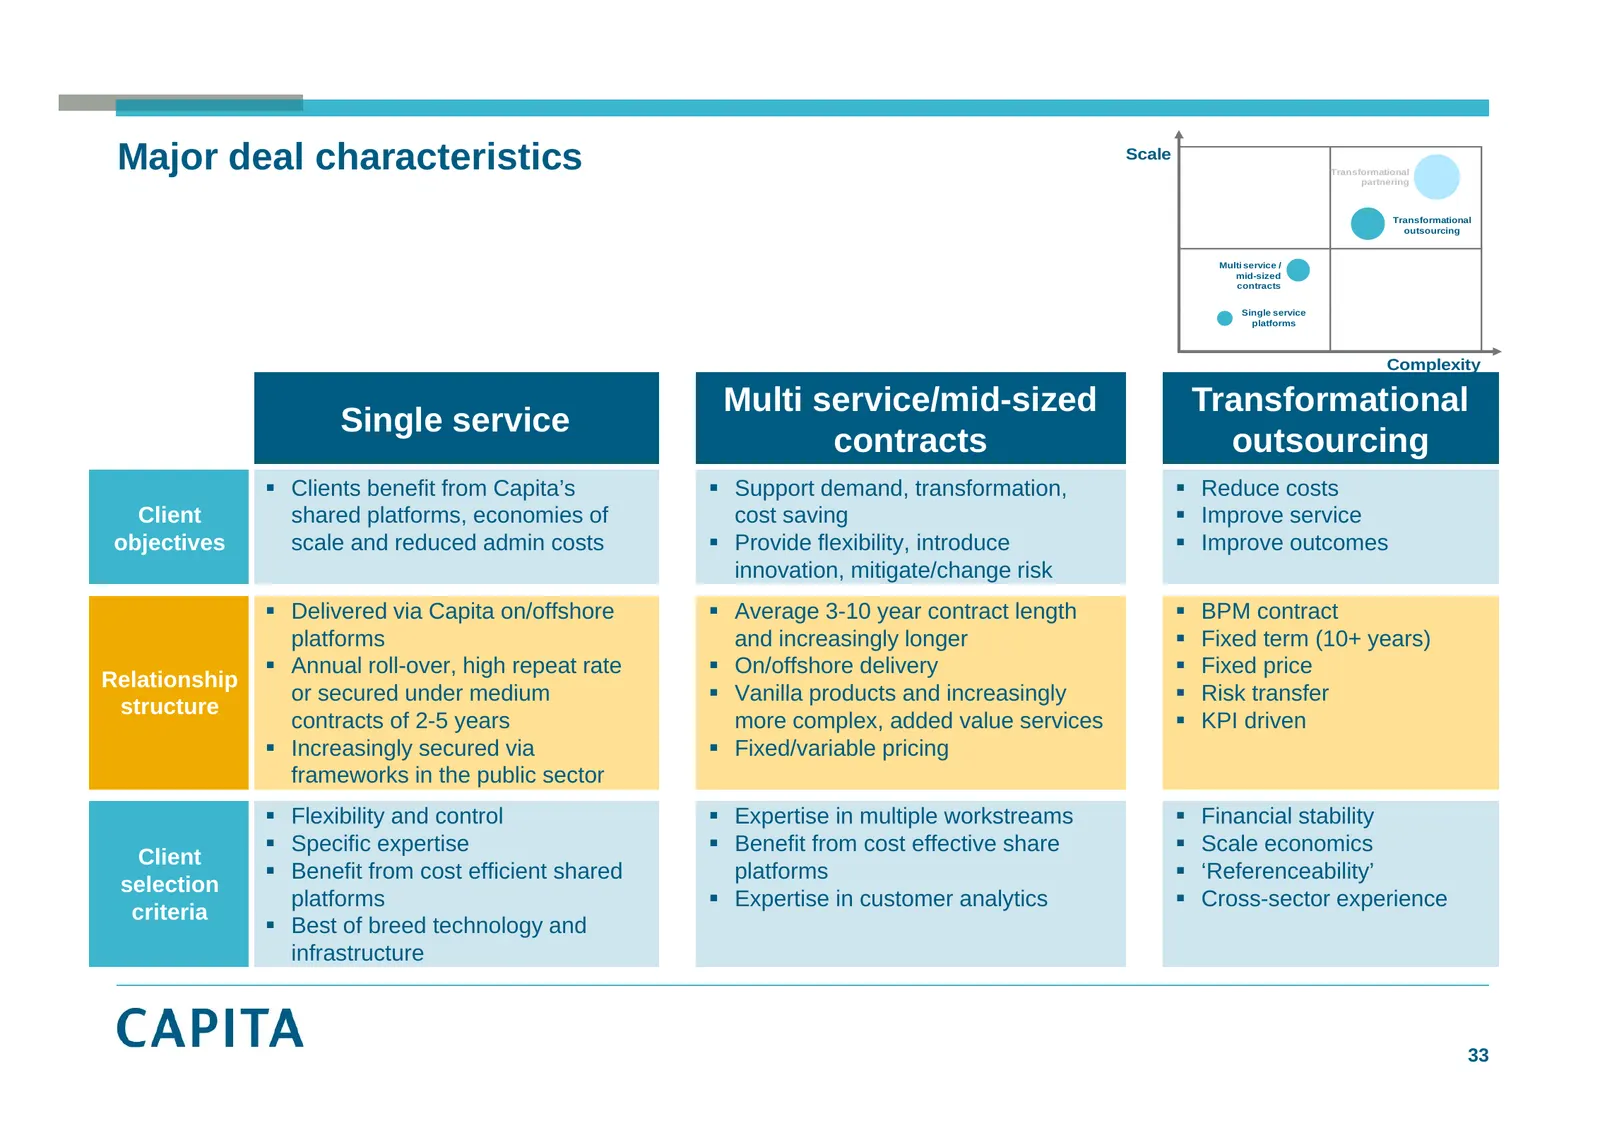
Slide 33: Major deal characteristics
Major deal characteristics Scale Transformational t i partnering Transformational outsourcing Multi service / mid-sized contracts Single service platforms Complexity Multi service/mid-sized Transformational Single g service contracts outsourcing Clients benefit from Capita’s Support demand, tran
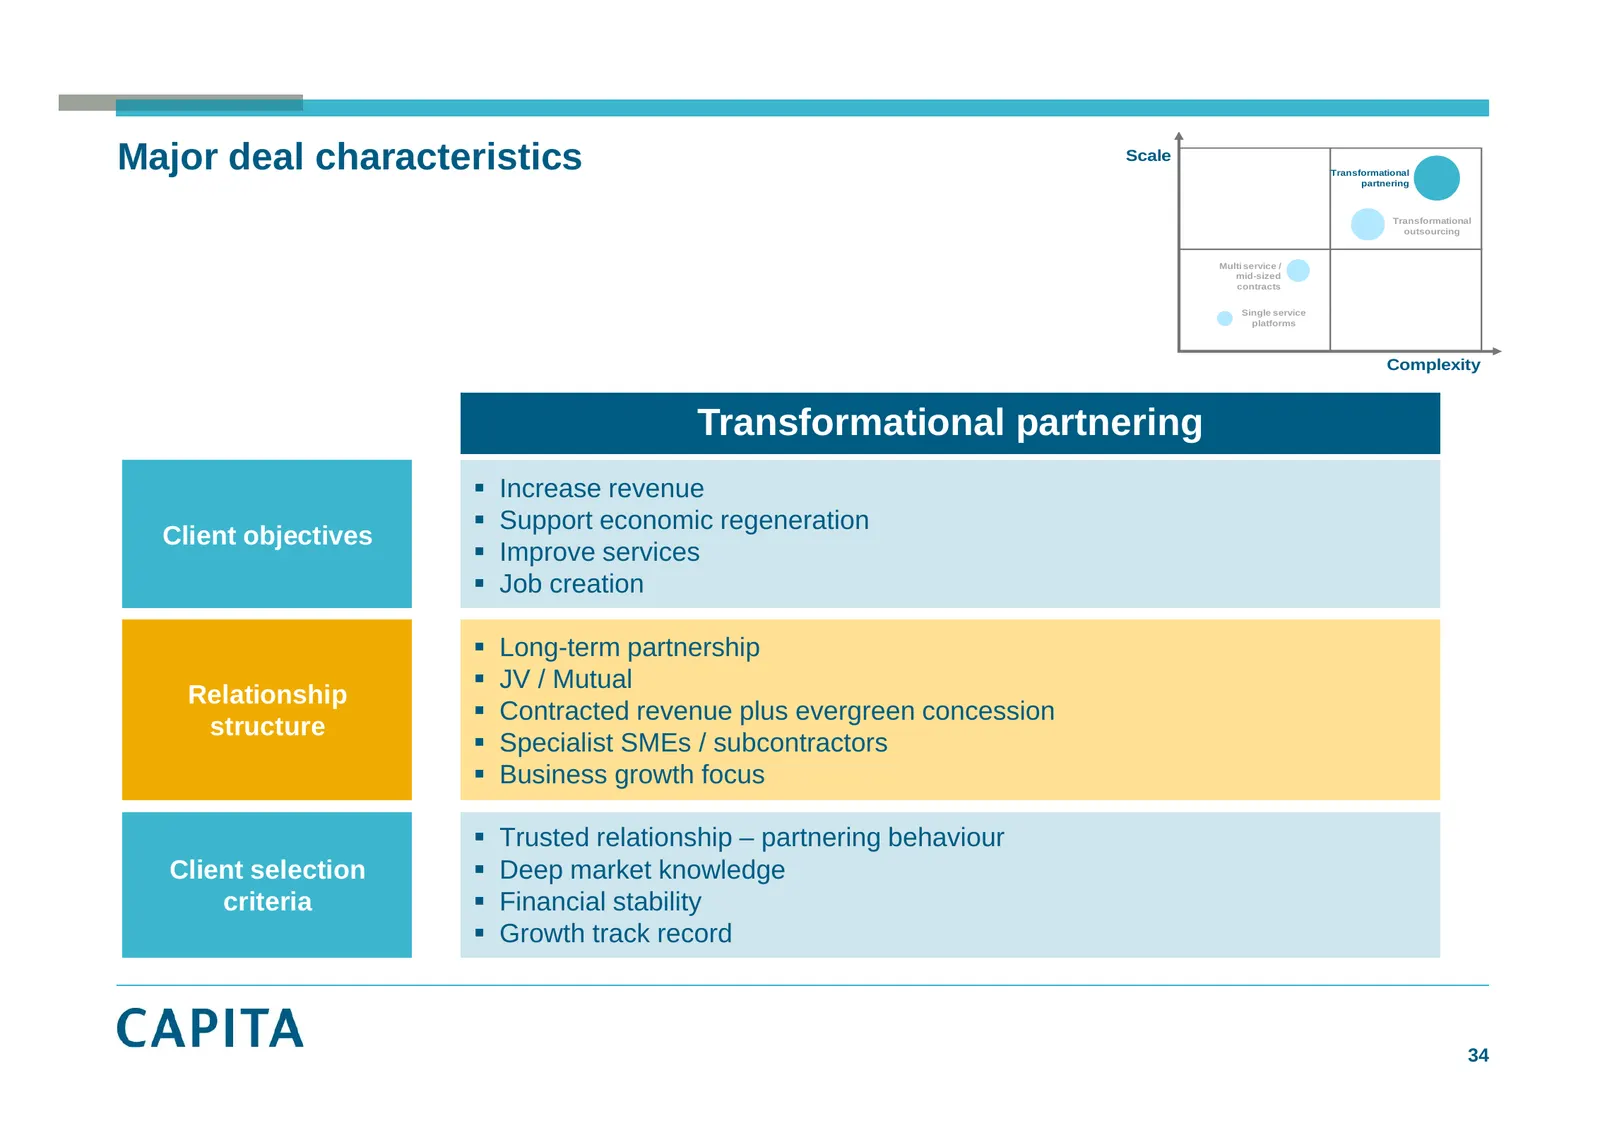
Slide 34: Major deal characteristics – transformational partnering
Major deal characteristics Scale Transformational partnering Transformational outsourcing Multi service / mid-sized contracts Single service platforms Complexity Transformational p partnering g Increase revenue Support economic regeneration Client objectives Improve p services Job creation
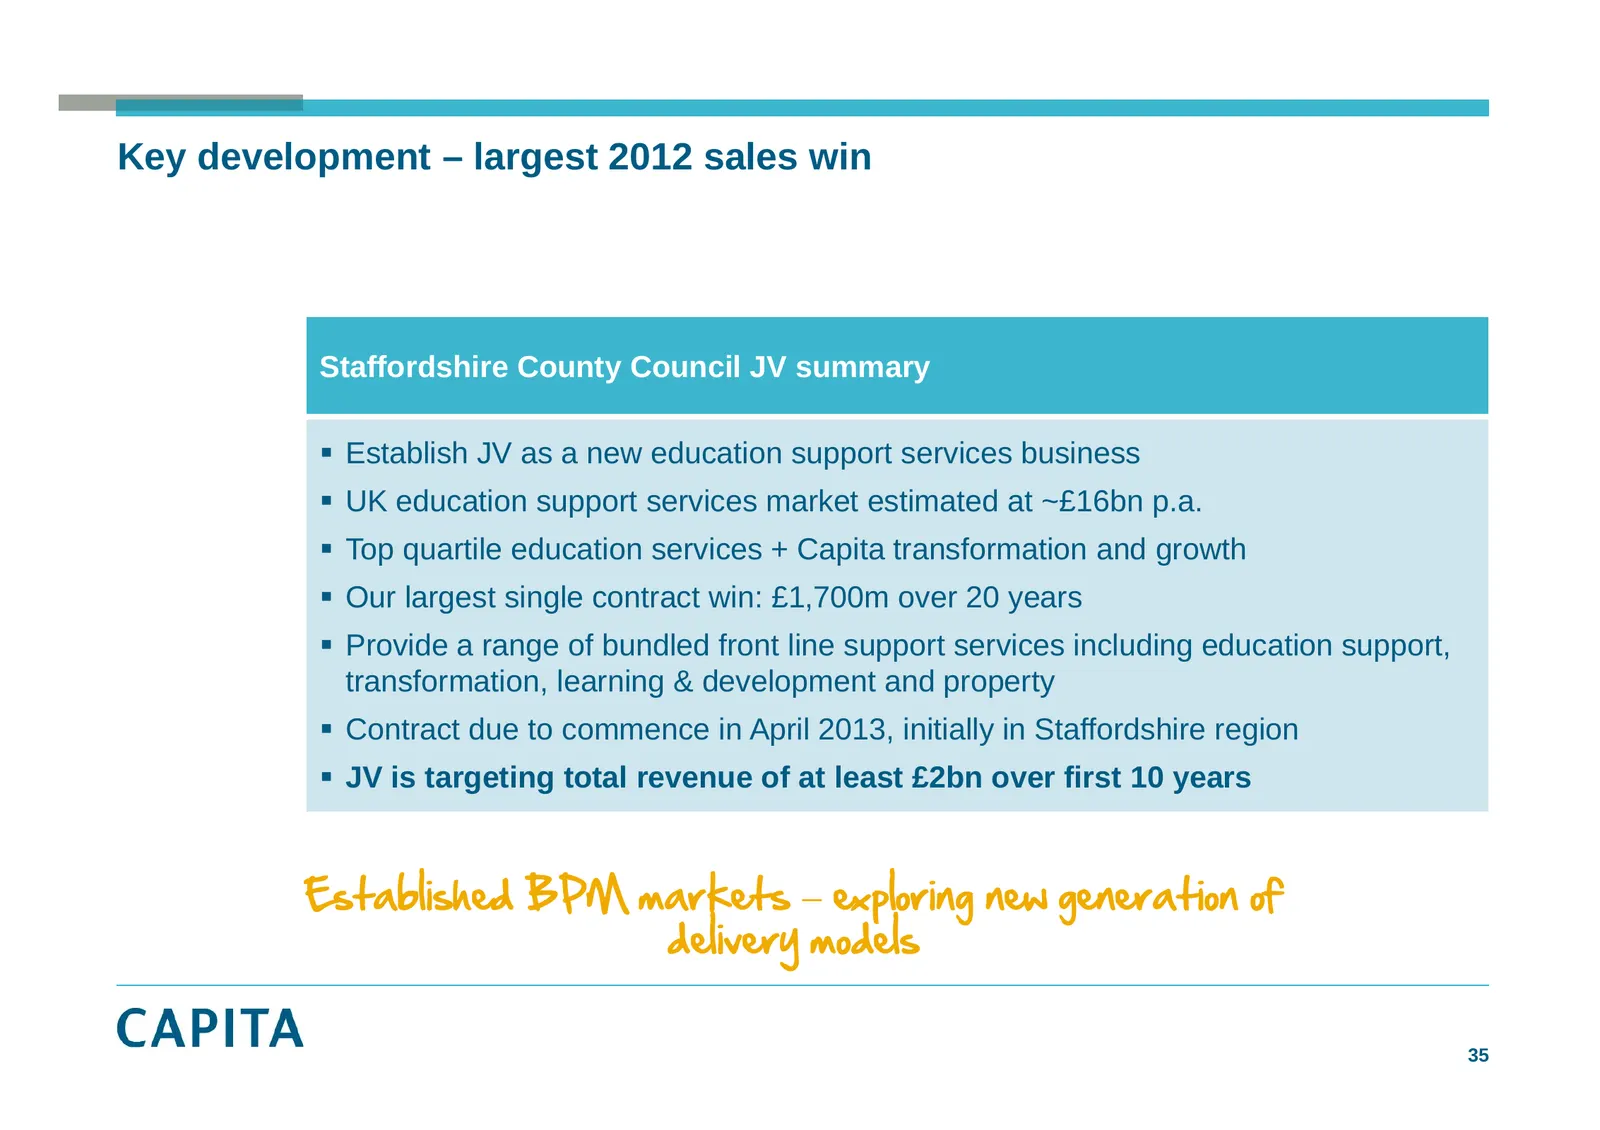
Slide 35: Staffordshire County Council JV summary
Key development – largest 2012 sales win Staffordshire County Council JV summary Establish JV as a new education support services business UK education support services market estimated at ~£16bn p.a. Top pqquartile education services + Capita p transformation and g growth Our largest single
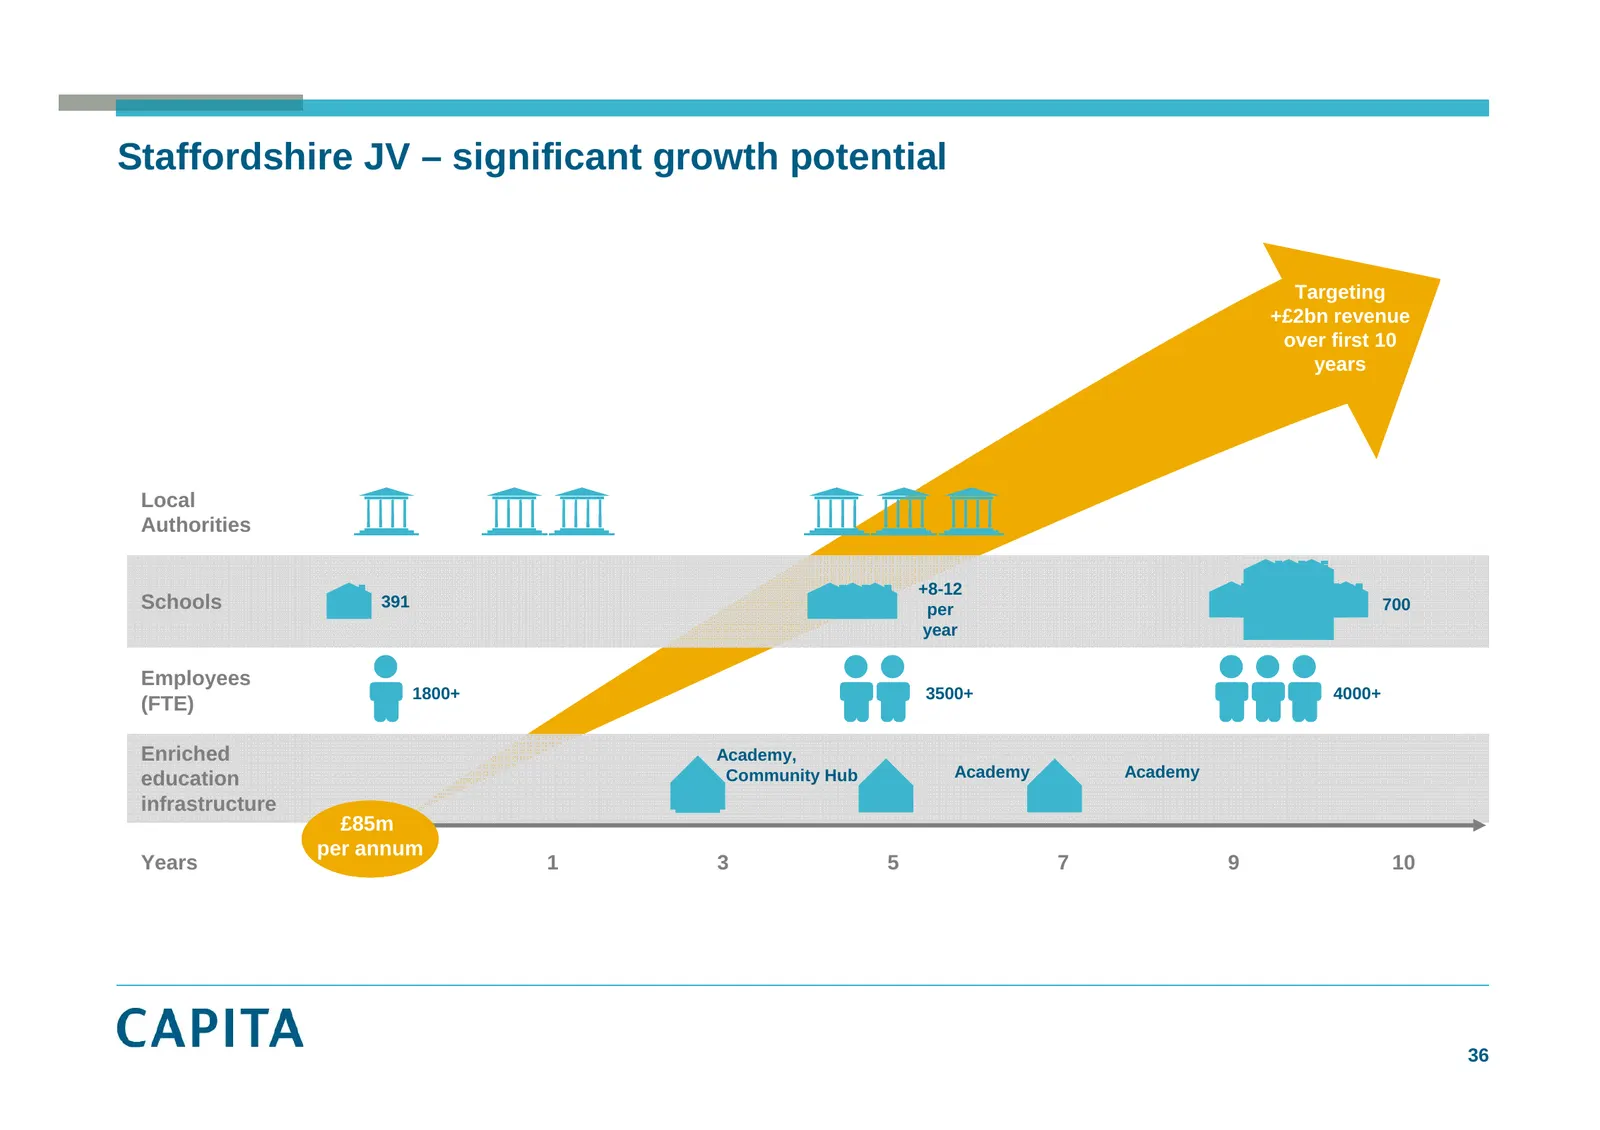
Slide 36: Staffordshire JV – significant growth potential
Staffordshire JV – significant growth potential Targeting +£2bn revenue over first 10 years Local Authorities +8-12 Schools 391 per 700 year Employees 1800+ 3500+ 4000+ (FTE) Enriched Academy, education Community Hub Academy Academy infrastructure £85m per annum Years 0 1 3 5 7 9 10 36
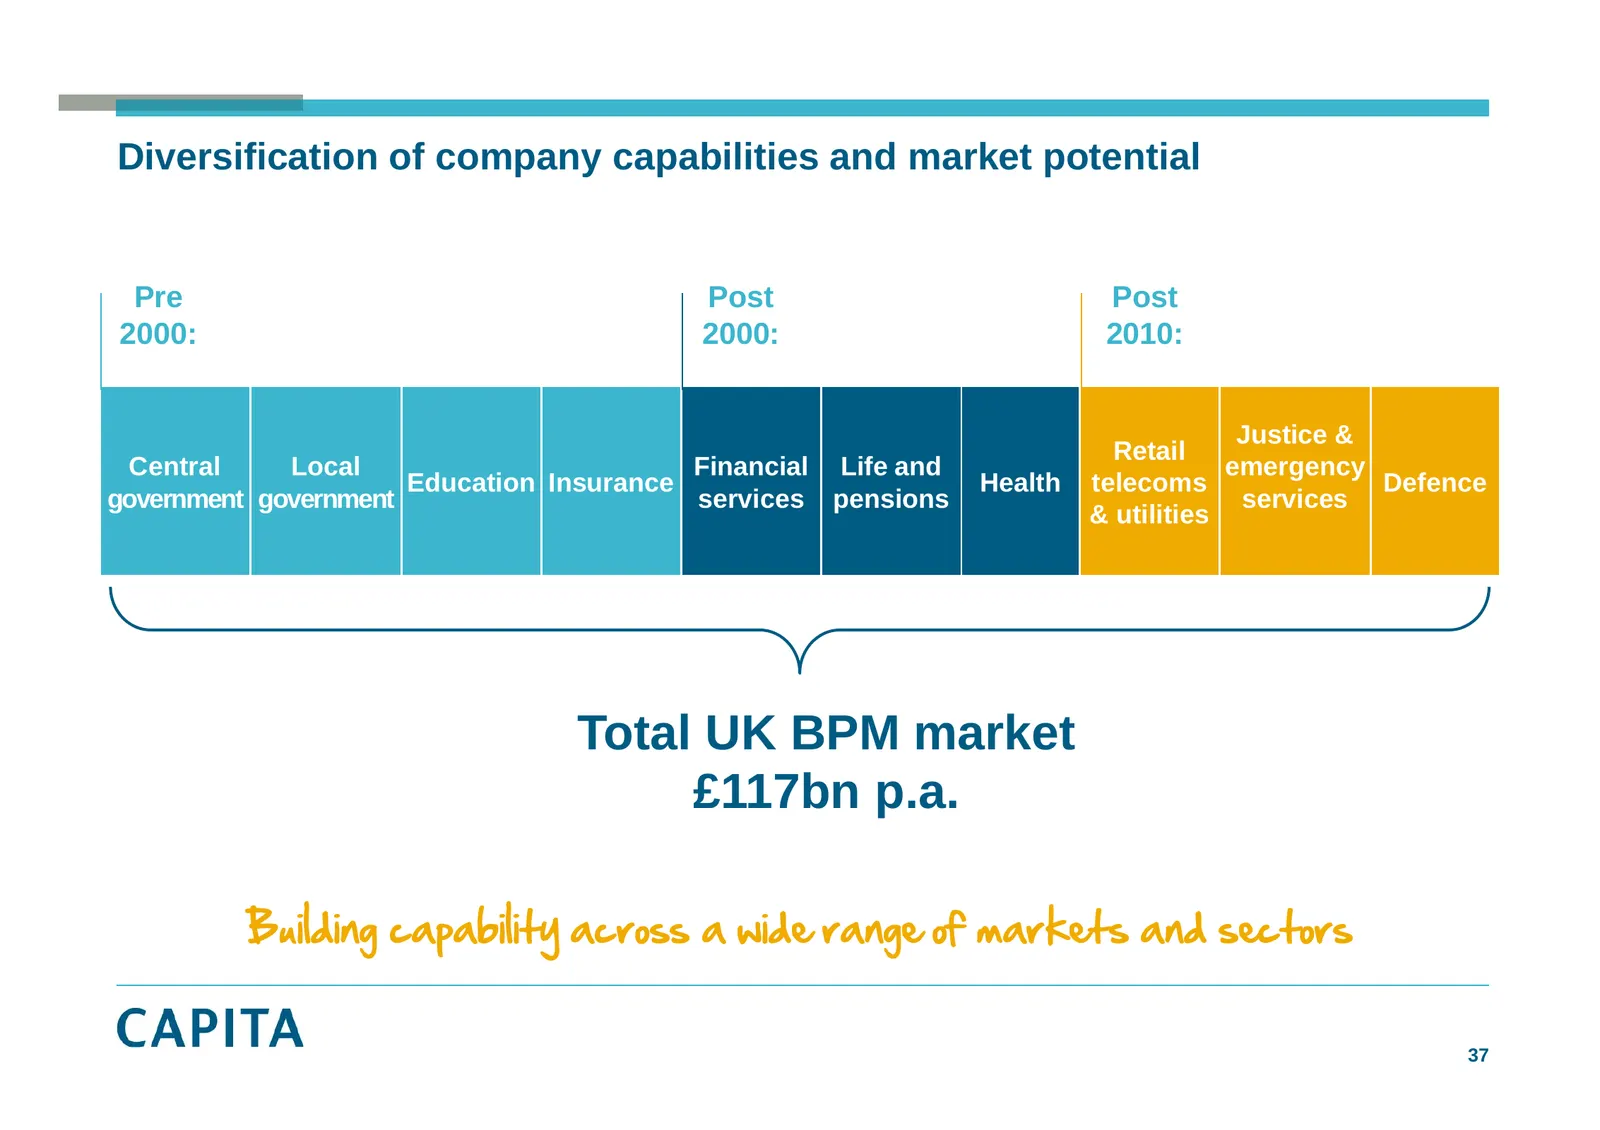
Slide 37: Building capability across a wide range of markets
Diversification of company capabilities and market potential Pre Post Post 2000: 2000: 2010: Justice & Retail Central Local Financial Life and emergency Education Insurance Health telecoms Defence government government services pensions services & utilities Total UK BPM market £117bn p.a. Buildingg
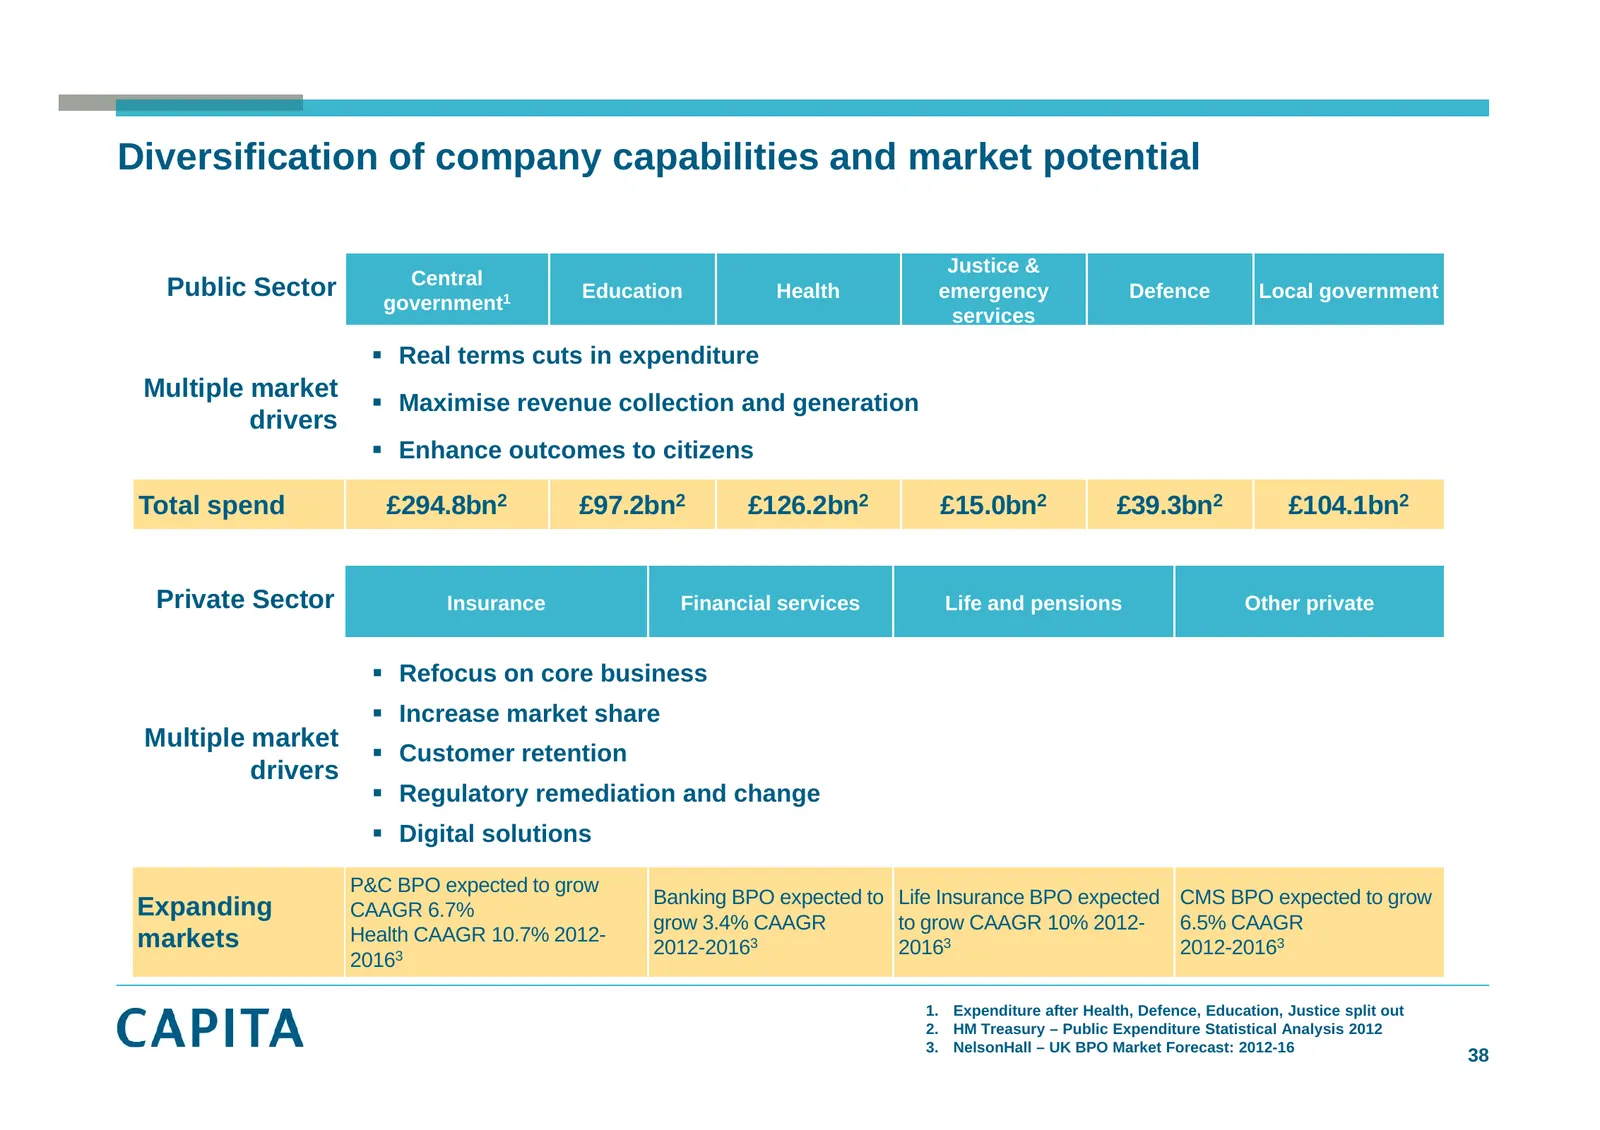
Slide 38: Diversification of company capabilities and market potential
Diversification of company capabilities and market potential Justice & Central Public Sector Education Health emergency Defence Local government government1 services i Real terms cuts in expenditure Multiple market Maximise revenue collection and generation drivers Enhance outcomes to citizens
Slide 39: Acquisitions
Acquisitions Paul Pindar Chief Executive
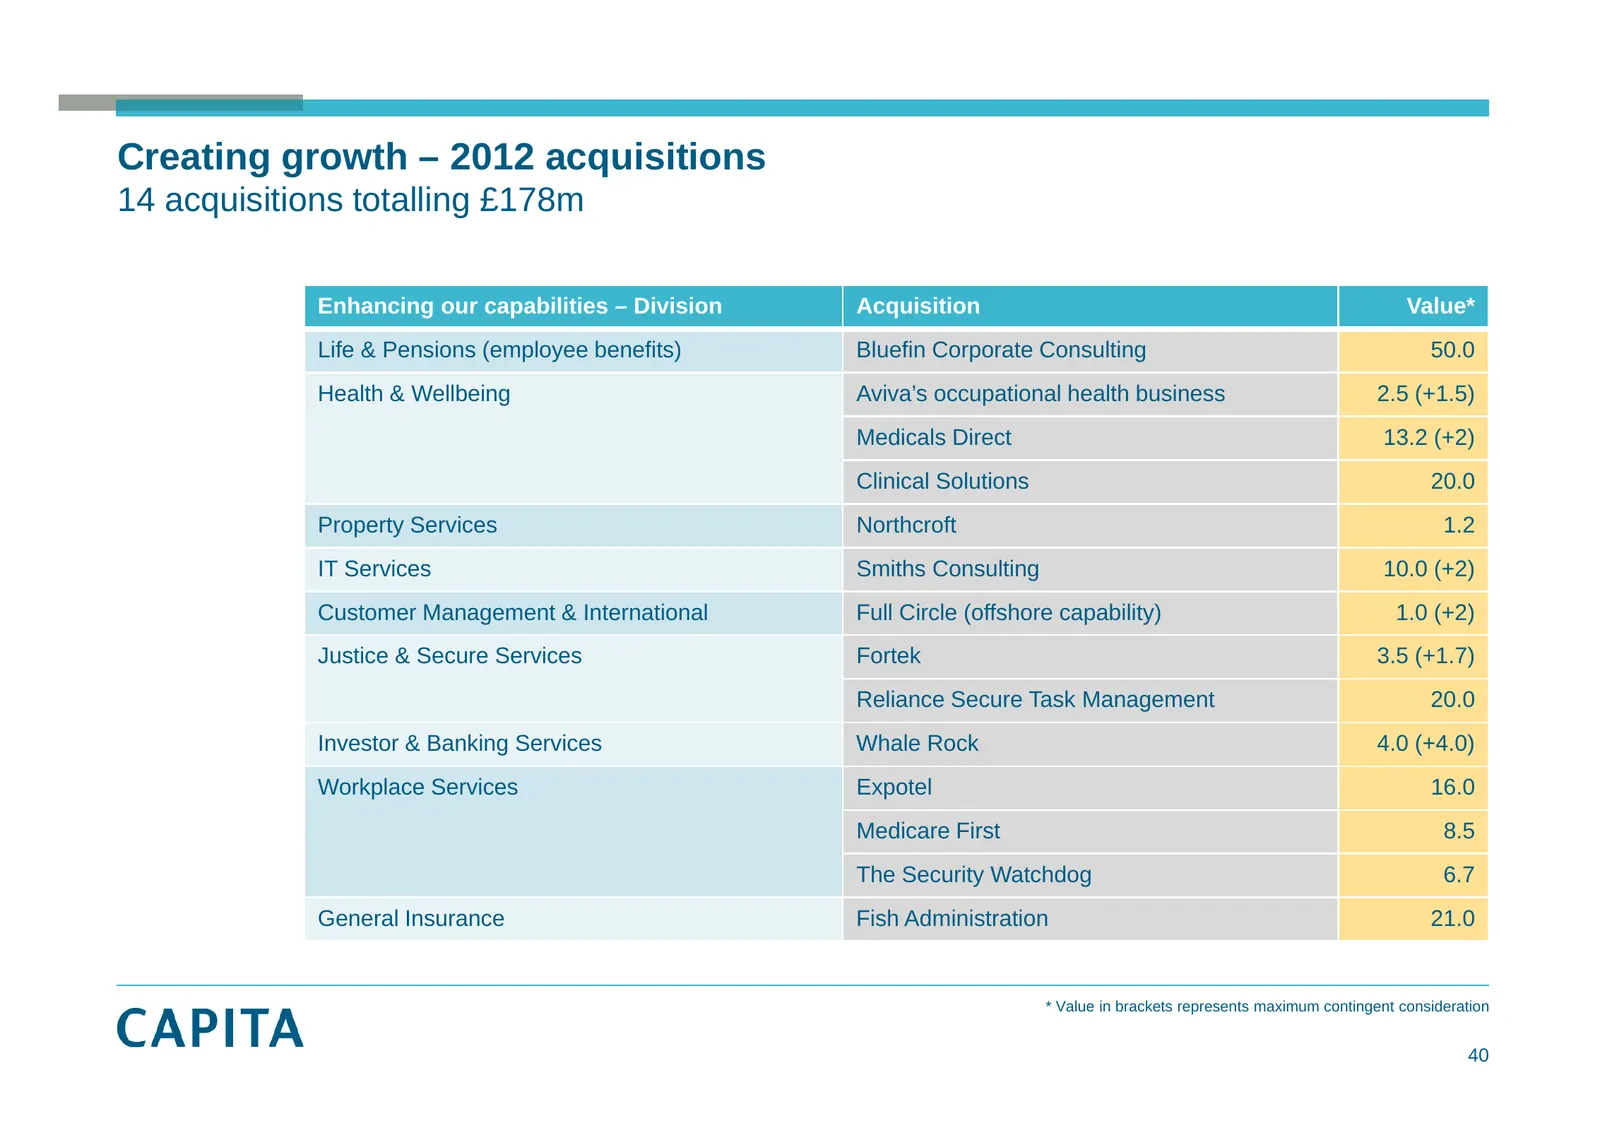
Slide 40: Creating growth – 2012 acquisitions
Creating growth – 2012 acquisitions 14 acquisitions totalling £178m Enhancing our capabilities – Division Acquisition Value* Value Life & Pensions (employee benefits) Bluefin Corporate Consulting 50.0 Health & Wellbeing Aviva’s occupational health business 2.5 (+1.5) Medicals Direct 13 2 (+2) 13.2 C
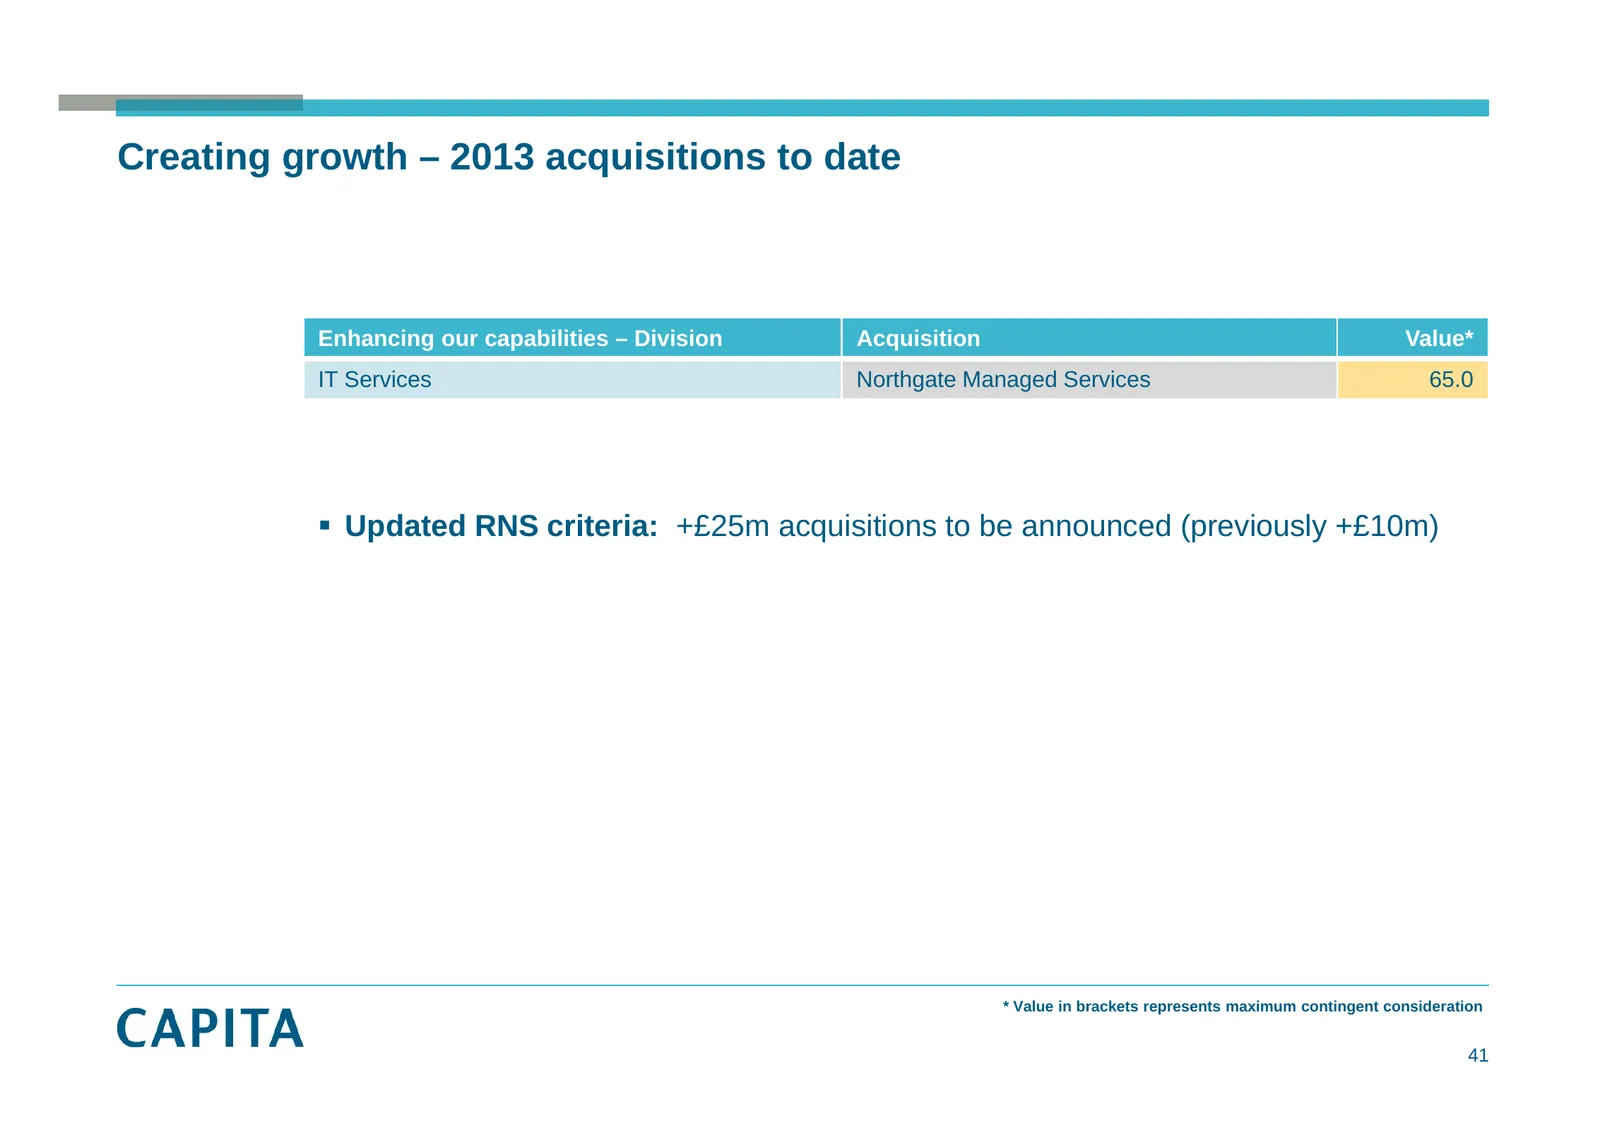
Slide 41: Creating growth – 2013 acquisitions to date
Creating growth – 2013 acquisitions to date Enhancing our capabilities – Division Acquisition Value* IT Services Northgate Managed Services 65.0 Updated RNS criteria: +£25m acquisitions to be announced (previously +£10m) * Value in brackets represents maximum contingent consideration 41
Slide 42: Enhancing our business proposition
Enhancing our business proposition Andy Parker Joint COO
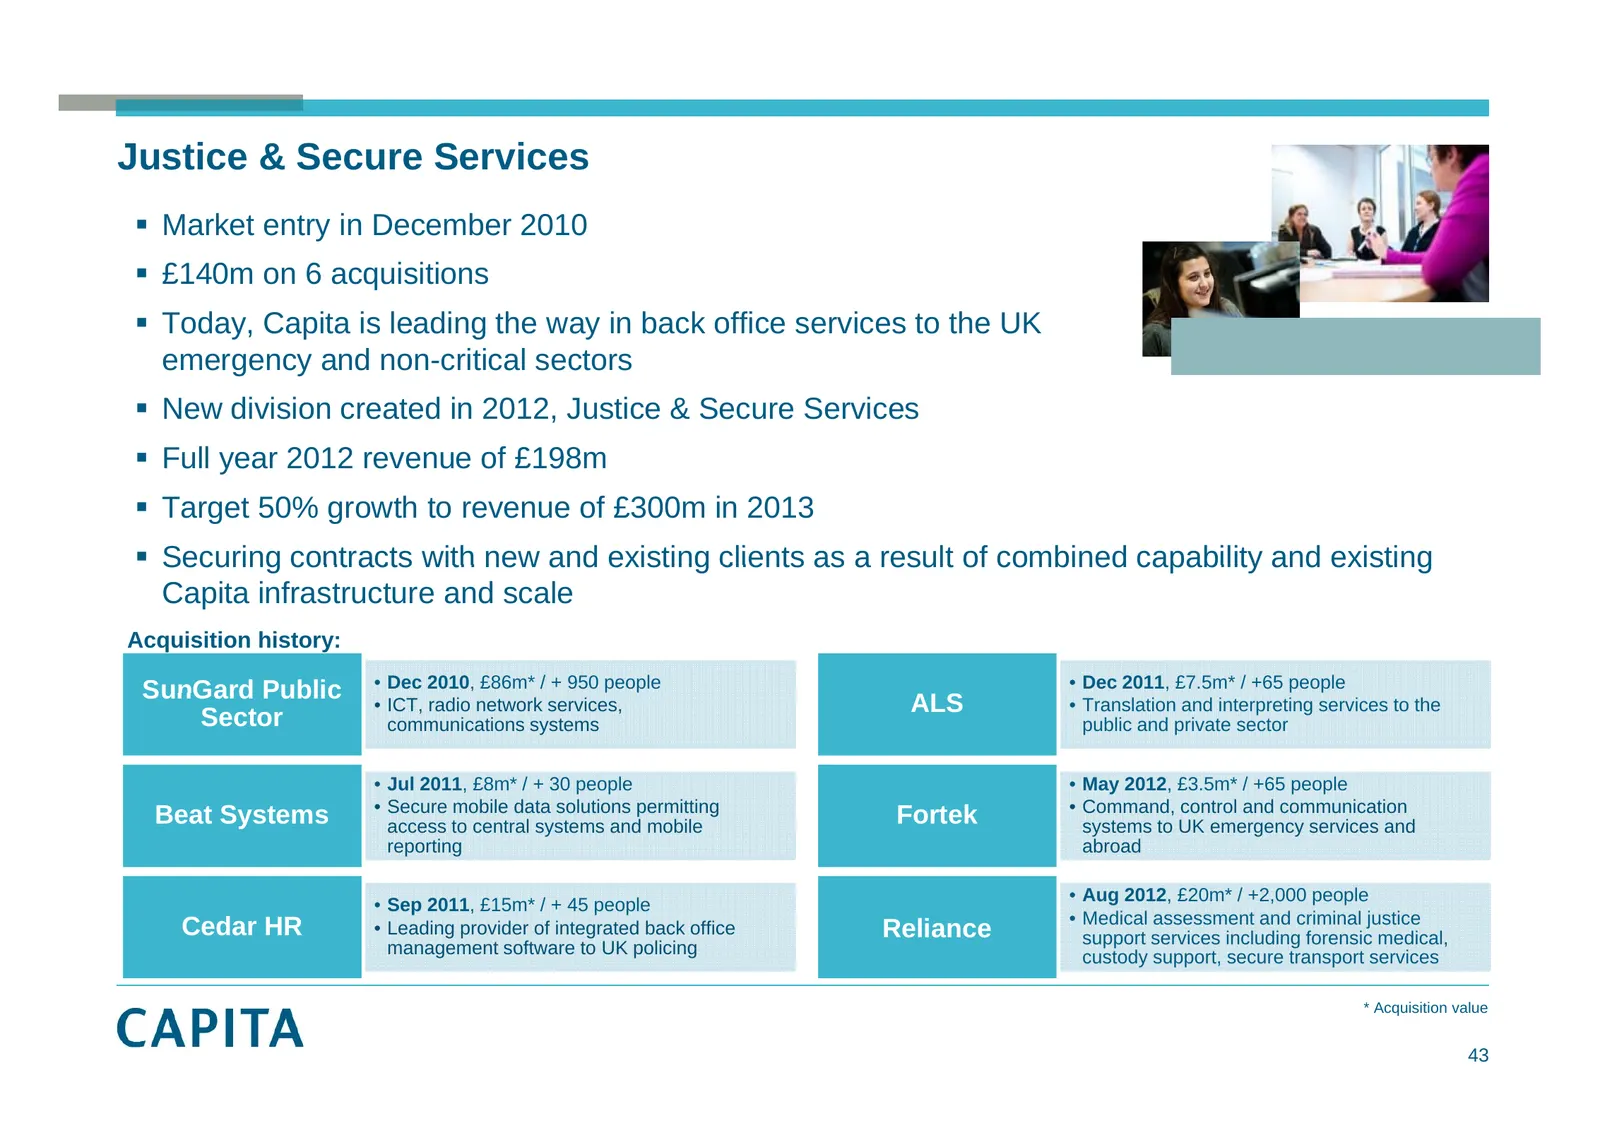
Slide 43: Justice & Secure Services
Justice & Secure Services Market entry in December 2010 £140m on 6 acquisitions Today, Capita is leading the way in back office services to the UK emergency and non-critical sectors New division created in 2012, Justice & Secure Services Full year 2012 revenue of £198m Target 50% growth
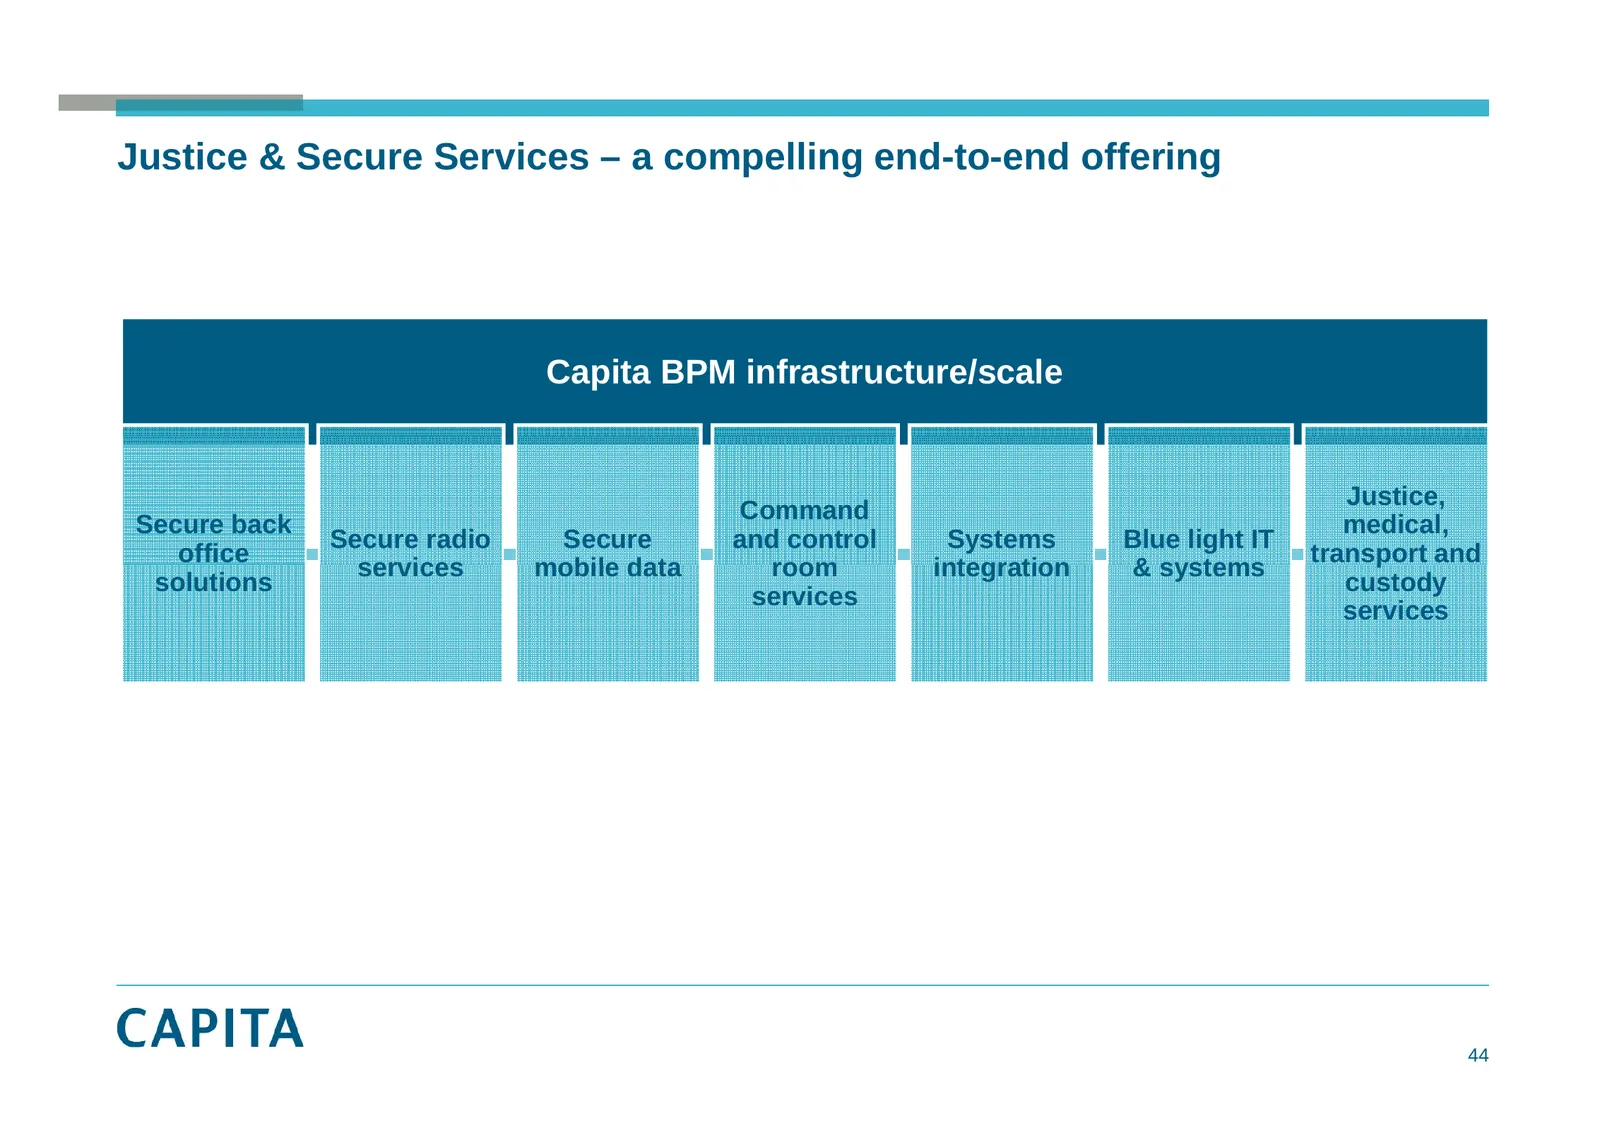
Slide 44: Justice & Secure Services – end-to-end offering
Justice & Secure Services – a compelling end-to-end offering Capita BPM infrastructure/scale Justice, Command Secure back medical, Secure radio Secure and control Systems Blue light IT office transport p and services mobile data room integration & systems solutions custody services services 44
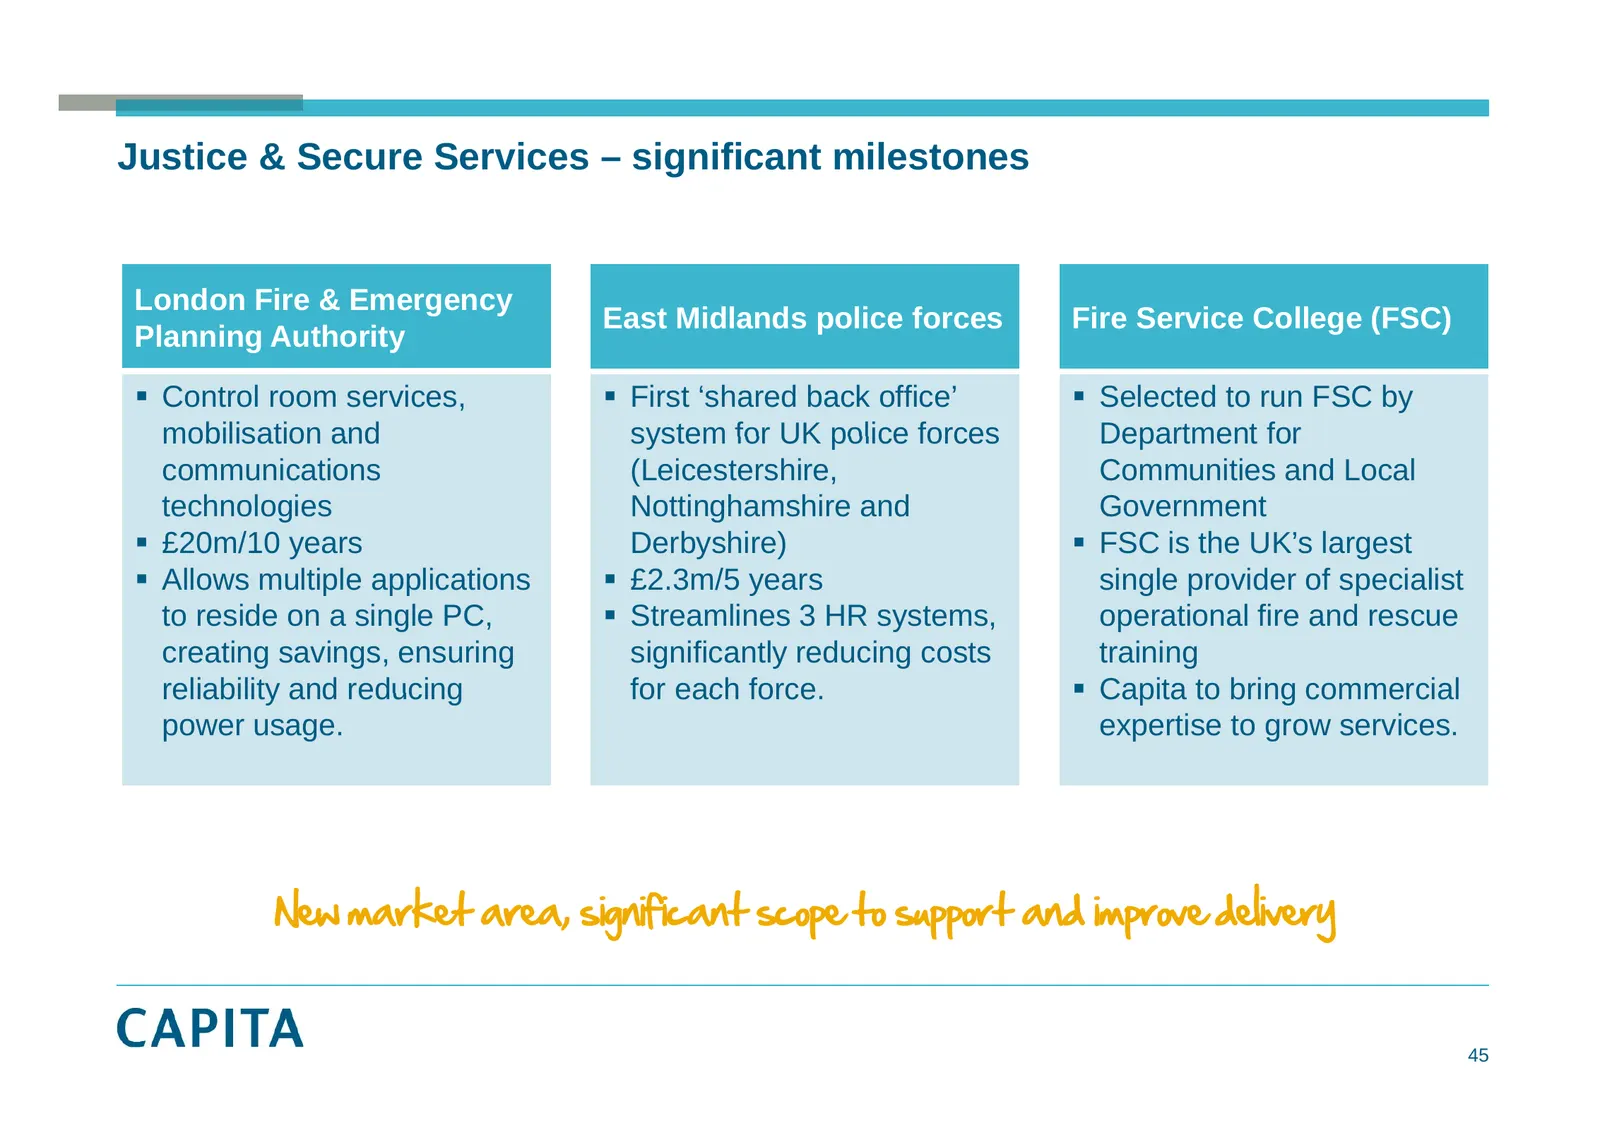
Slide 45: Justice & Secure Services – significant milestones
Justice & Secure Services – significant milestones London Fire & Emergency E t Midlands East Midl d police li forces f Fi Service Fire S i College C ll (FSC) Planning Authority Control room services, First ‘shared back office’ Selected to run FSC by mobilisation and system for UK police forces
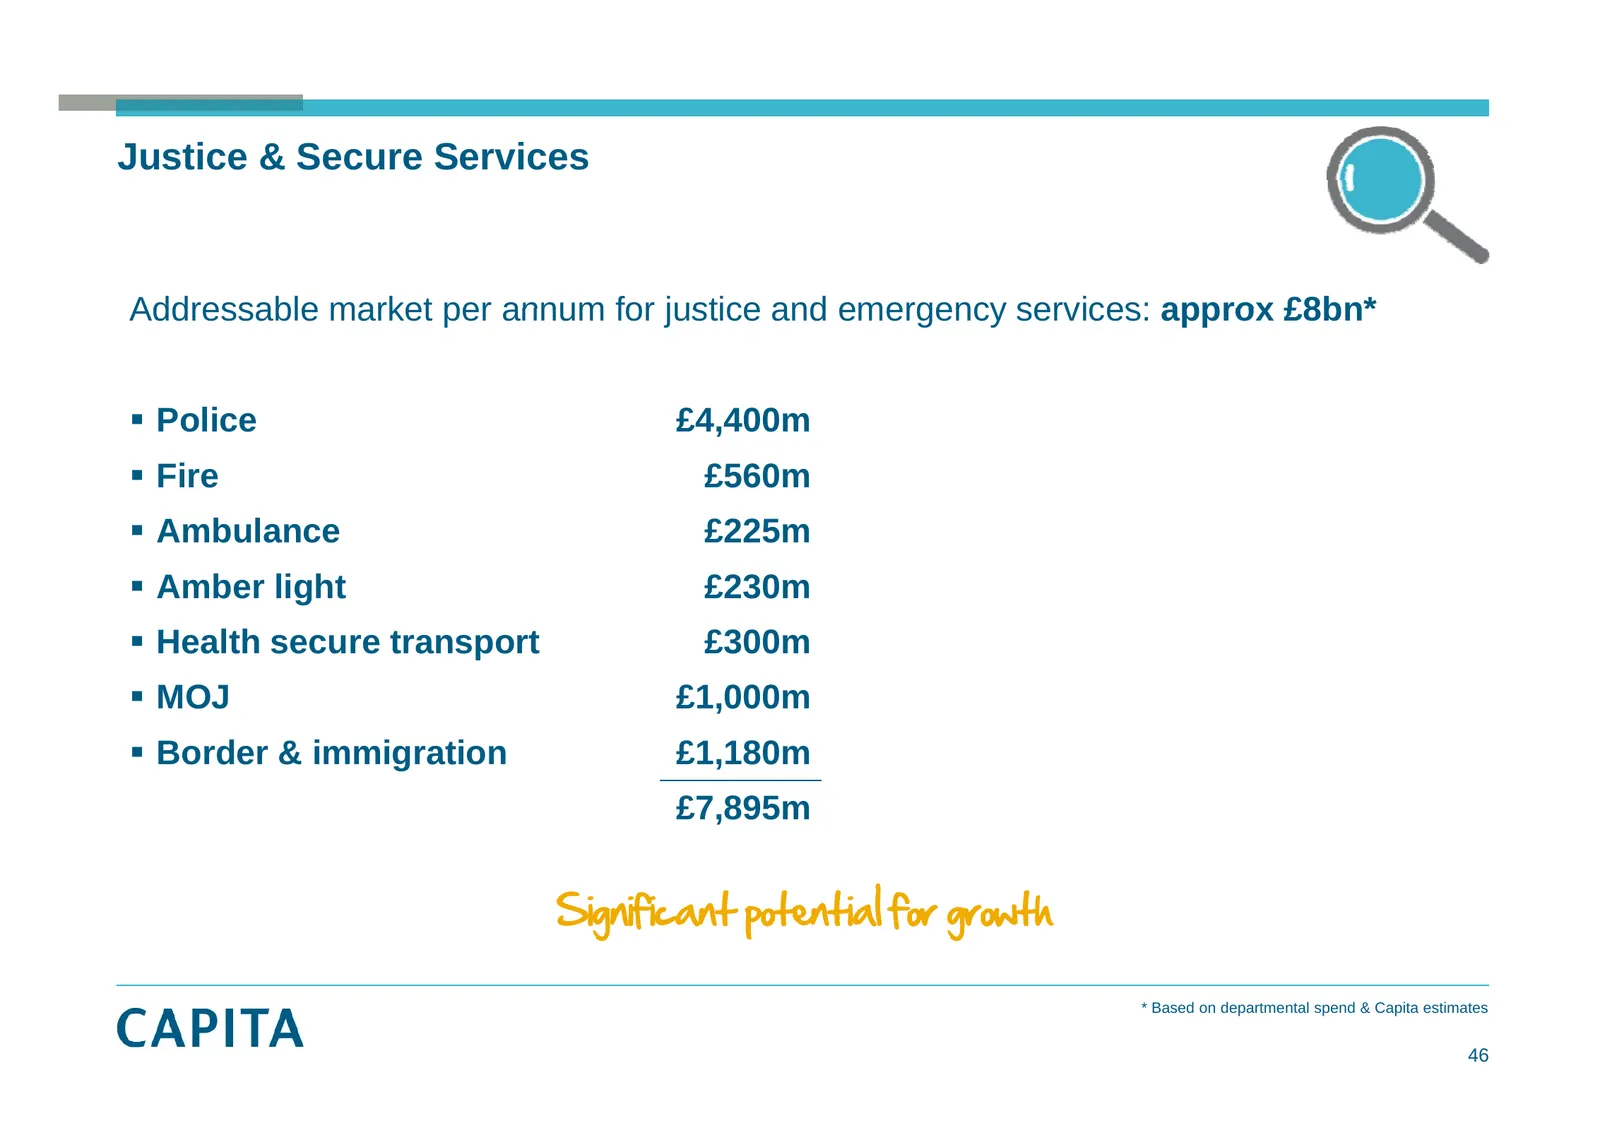
Slide 46: Justice & Secure Services – significant potential for growth
Justice & Secure Services Addressable market per annum for justice and emergency services: approx £8bn £8bn* Police £4,400m , Fire £560m Ambulance £225m Amber light £230m Health secure transport £300m MOJ £1 000m £1,000m Border & immigration £1,180m £7,895m , Significant potential for
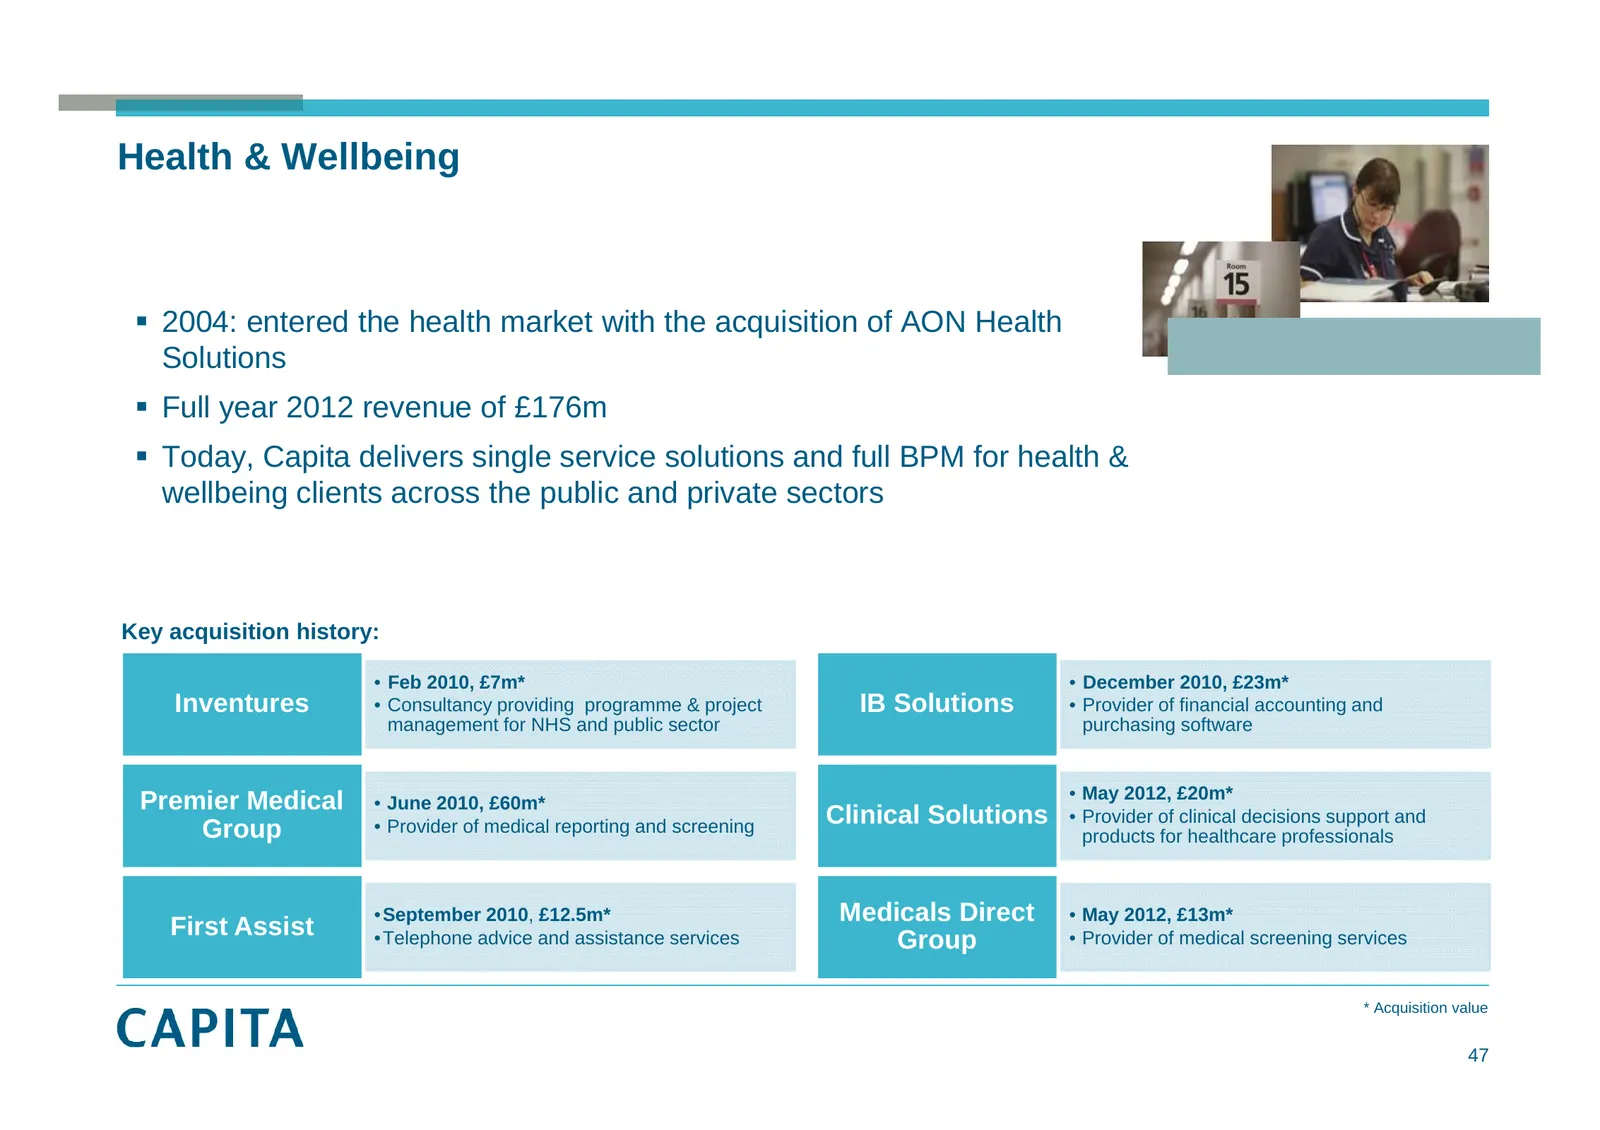
Slide 47: Health & Wellbeing
Health & Wellbeing 2004: entered the health market with the acquisition of AON Health Solutions Full year 2012 revenue of £176m Today, Capita delivers single service solutions and full BPM for health & wellbeing clients across the public and private sectors Key acquisition history: • Feb 2010,
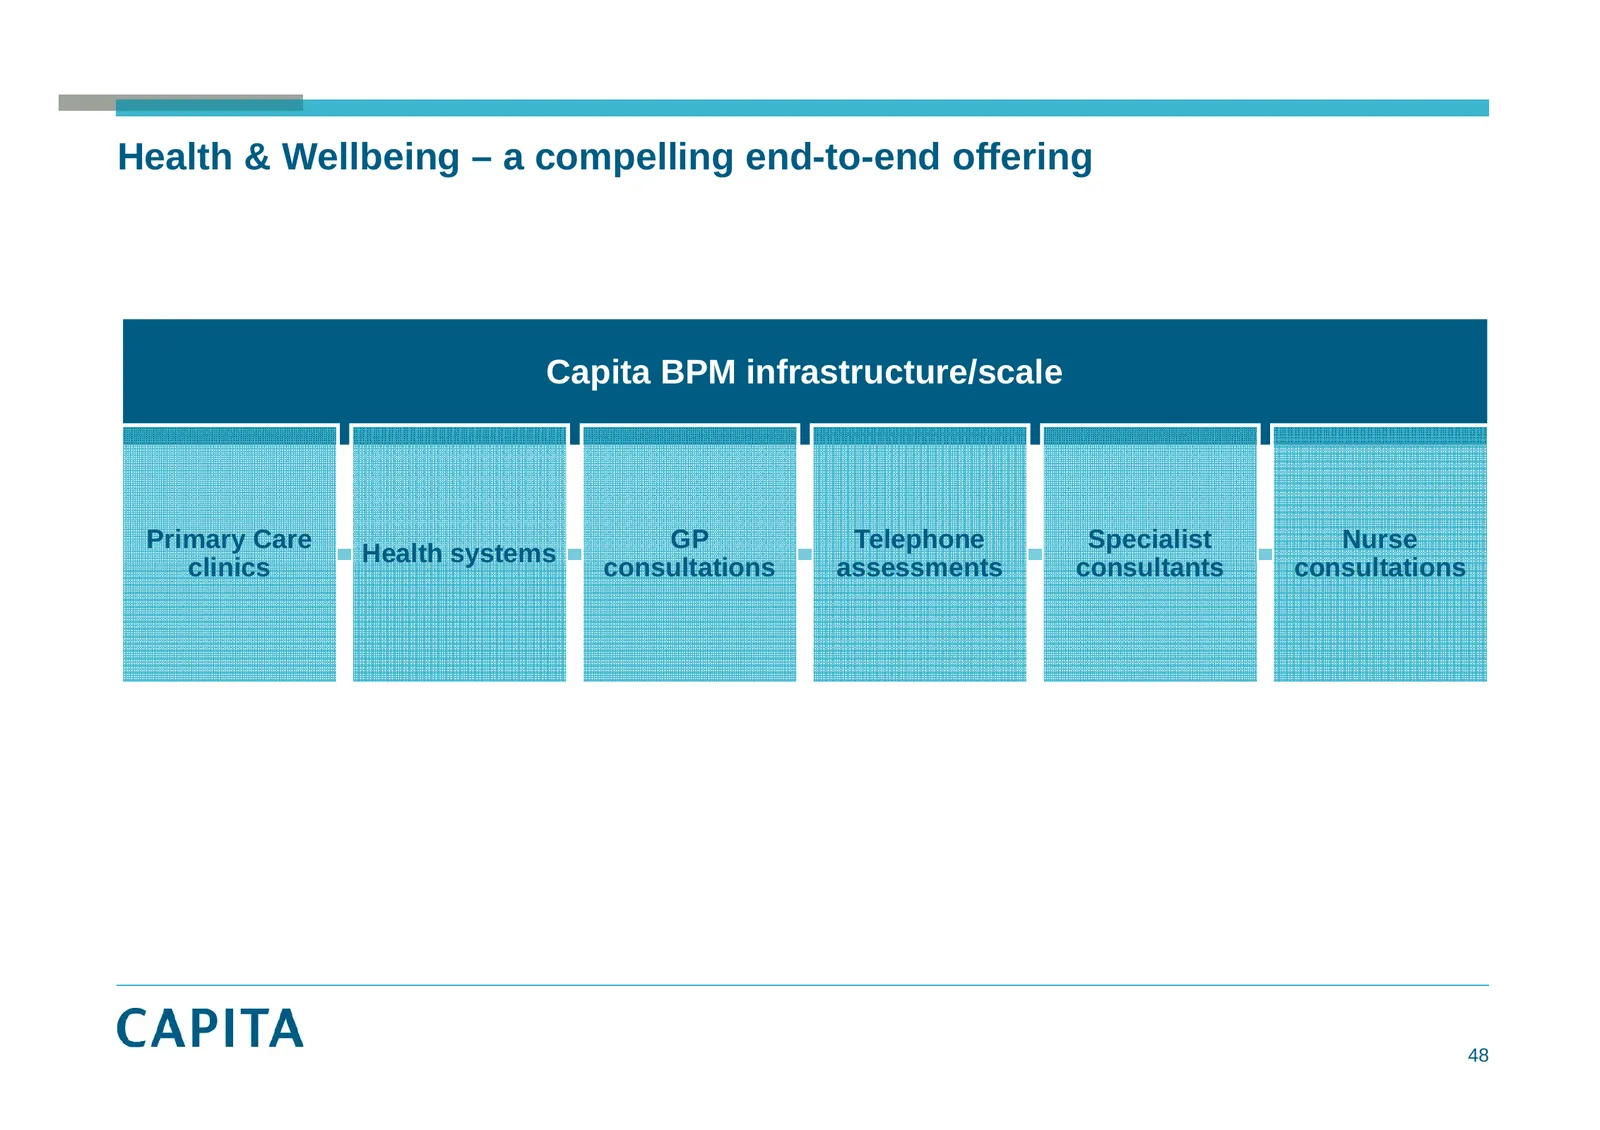
Slide 48: Health & Wellbeing – end-to-end offering
Health & Wellbeing – a compelling end-to-end offering Capita BPM infrastructure/scale Primary Care GP Telephone Specialist Nurse Health systems y clinics consultations assessments consultants consultations 48
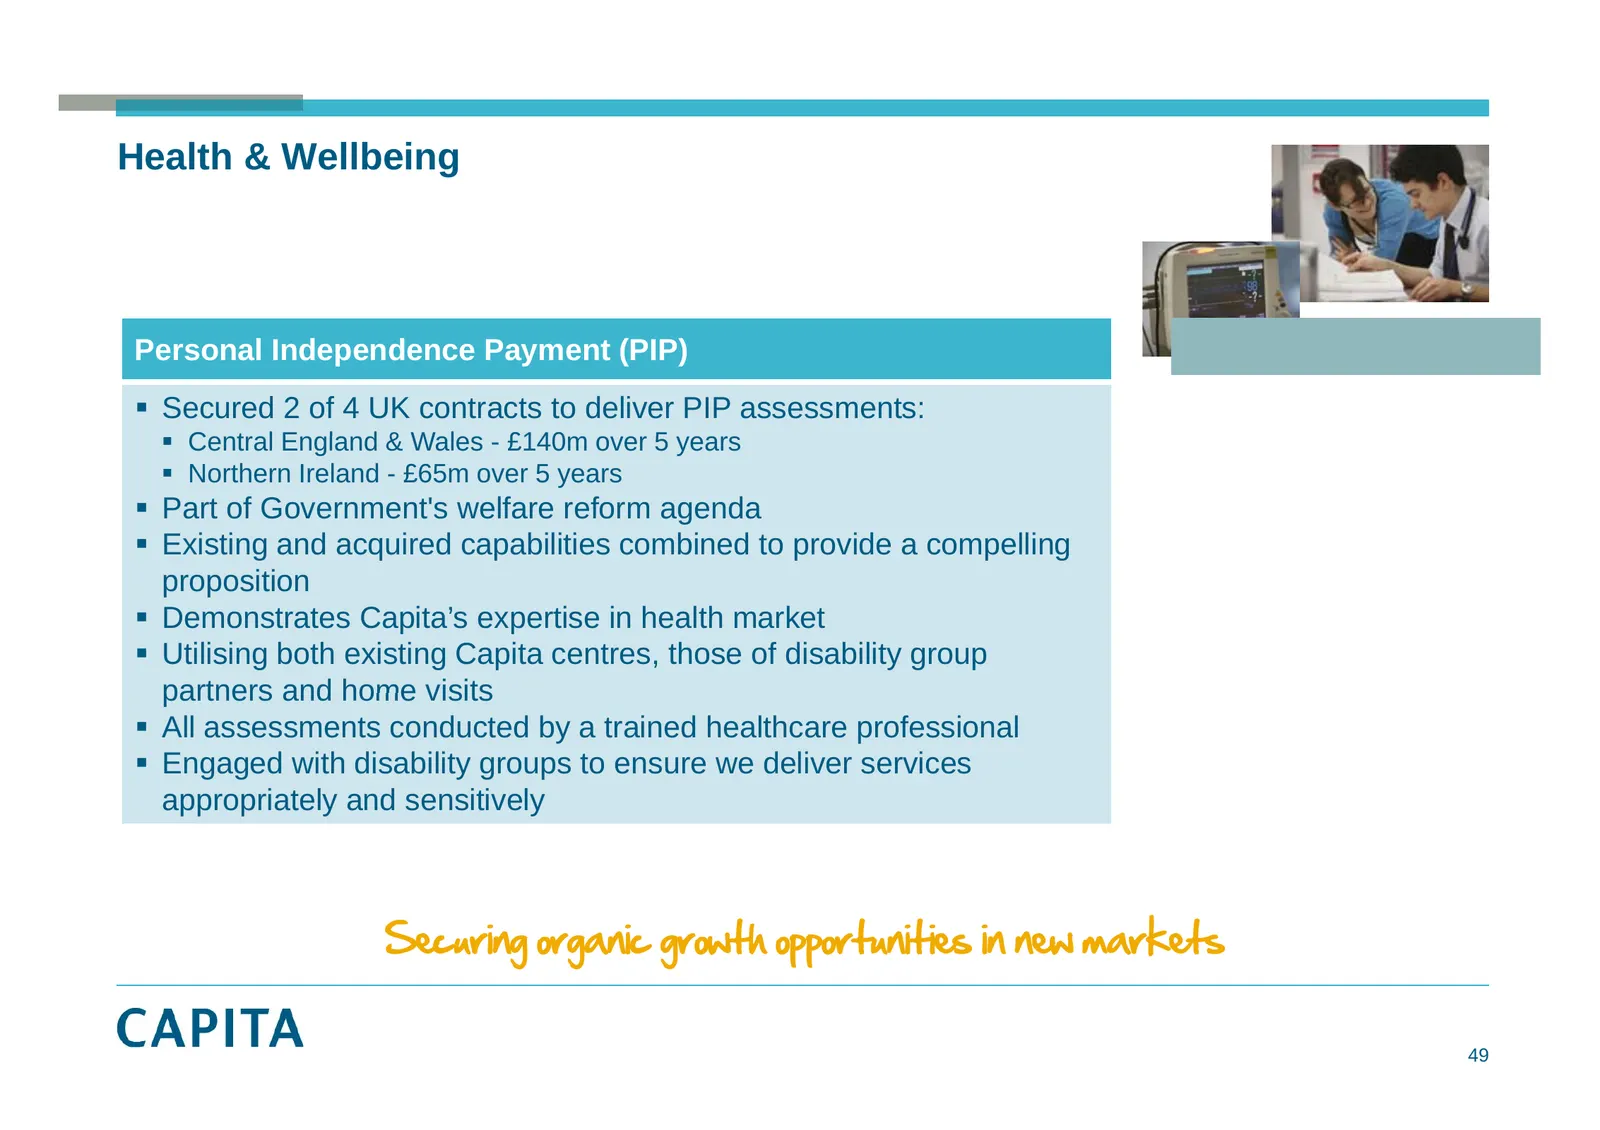
Slide 49: Health & Wellbeing – Personal Independence Payment
Health & Wellbeing Personal Independence Payment (PIP) Secured 2 of 4 UK contracts to deliver PIP assessments: Central C t l England E l d&W Wales l - £140m £140 over 5 years Northern Ireland - £65m over 5 years Part of Government's welfare reform agenda Existing and acquired capabilities
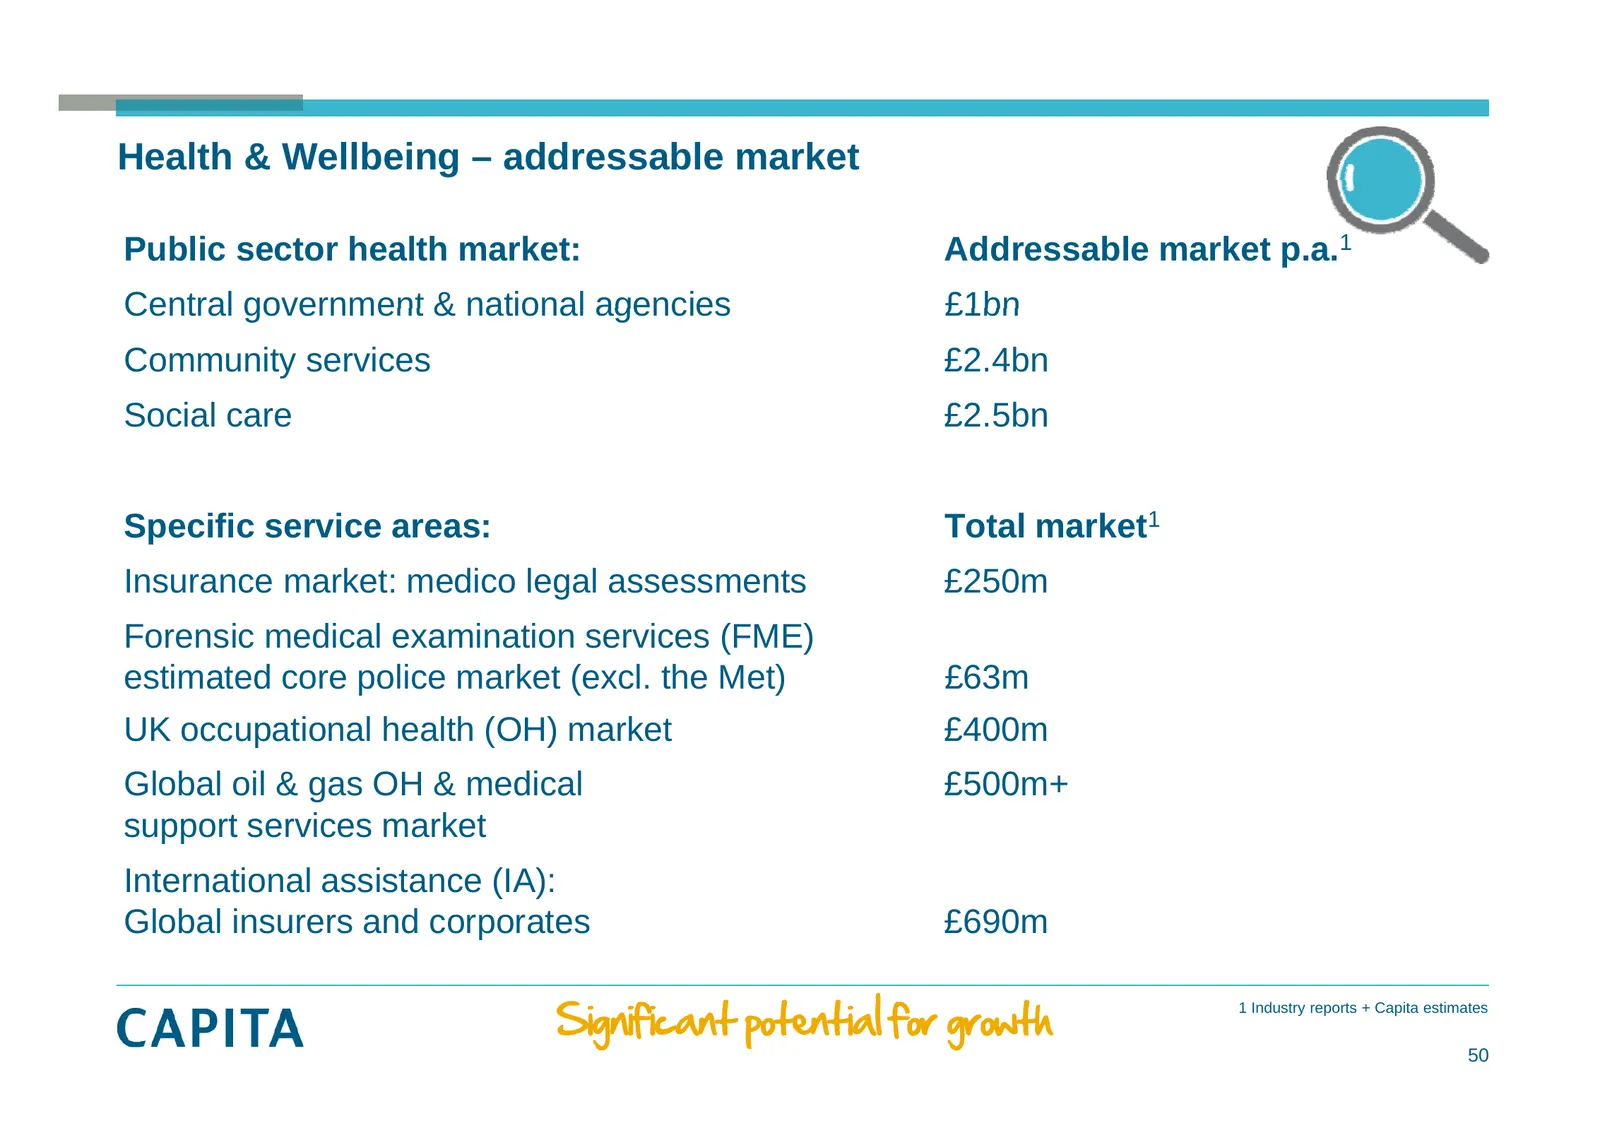
Slide 50: Health & Wellbeing – addressable market
Health & Wellbeing – addressable market Public sector health market: Addressable market p.a.1 Central government & national agencies £1bn Community services £2.4bn Social care £2.5bn Specific service areas: Total market1 Insurance market: medico legal assessments £250m Forensic medical examination s
Slide 51: Enhancing our business proposition
Enhancing our business proposition Vic Gysin Joint COO
Slide 52: Customer service and debt management
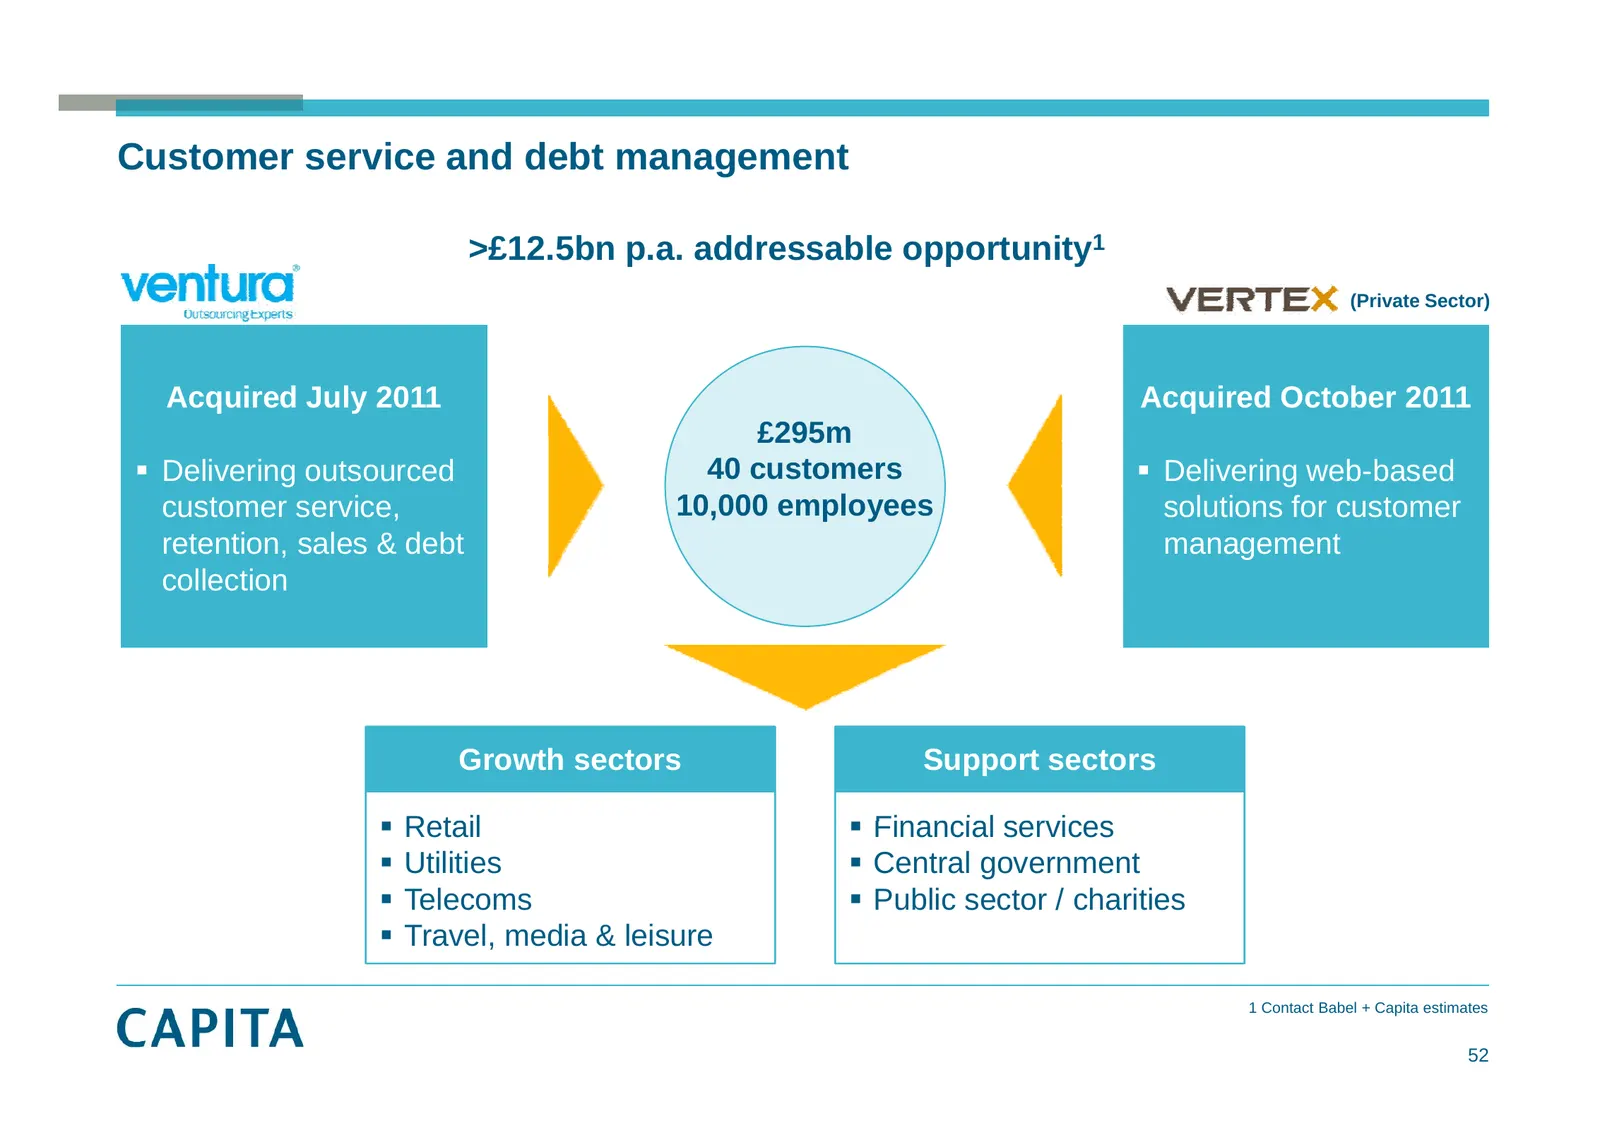
Customer service and debt management >£12.5bn p.a. addressable opportunity1 ((Private Sector)) Acquired July 2011 Acquired October 2011 £295m Delivering outsourced 40 customers Delivering web-based customer service, 10,000 employees solutions for customer retention, sales & debt management colle
Slide 53: Leveraging our scale & specialist Group skills
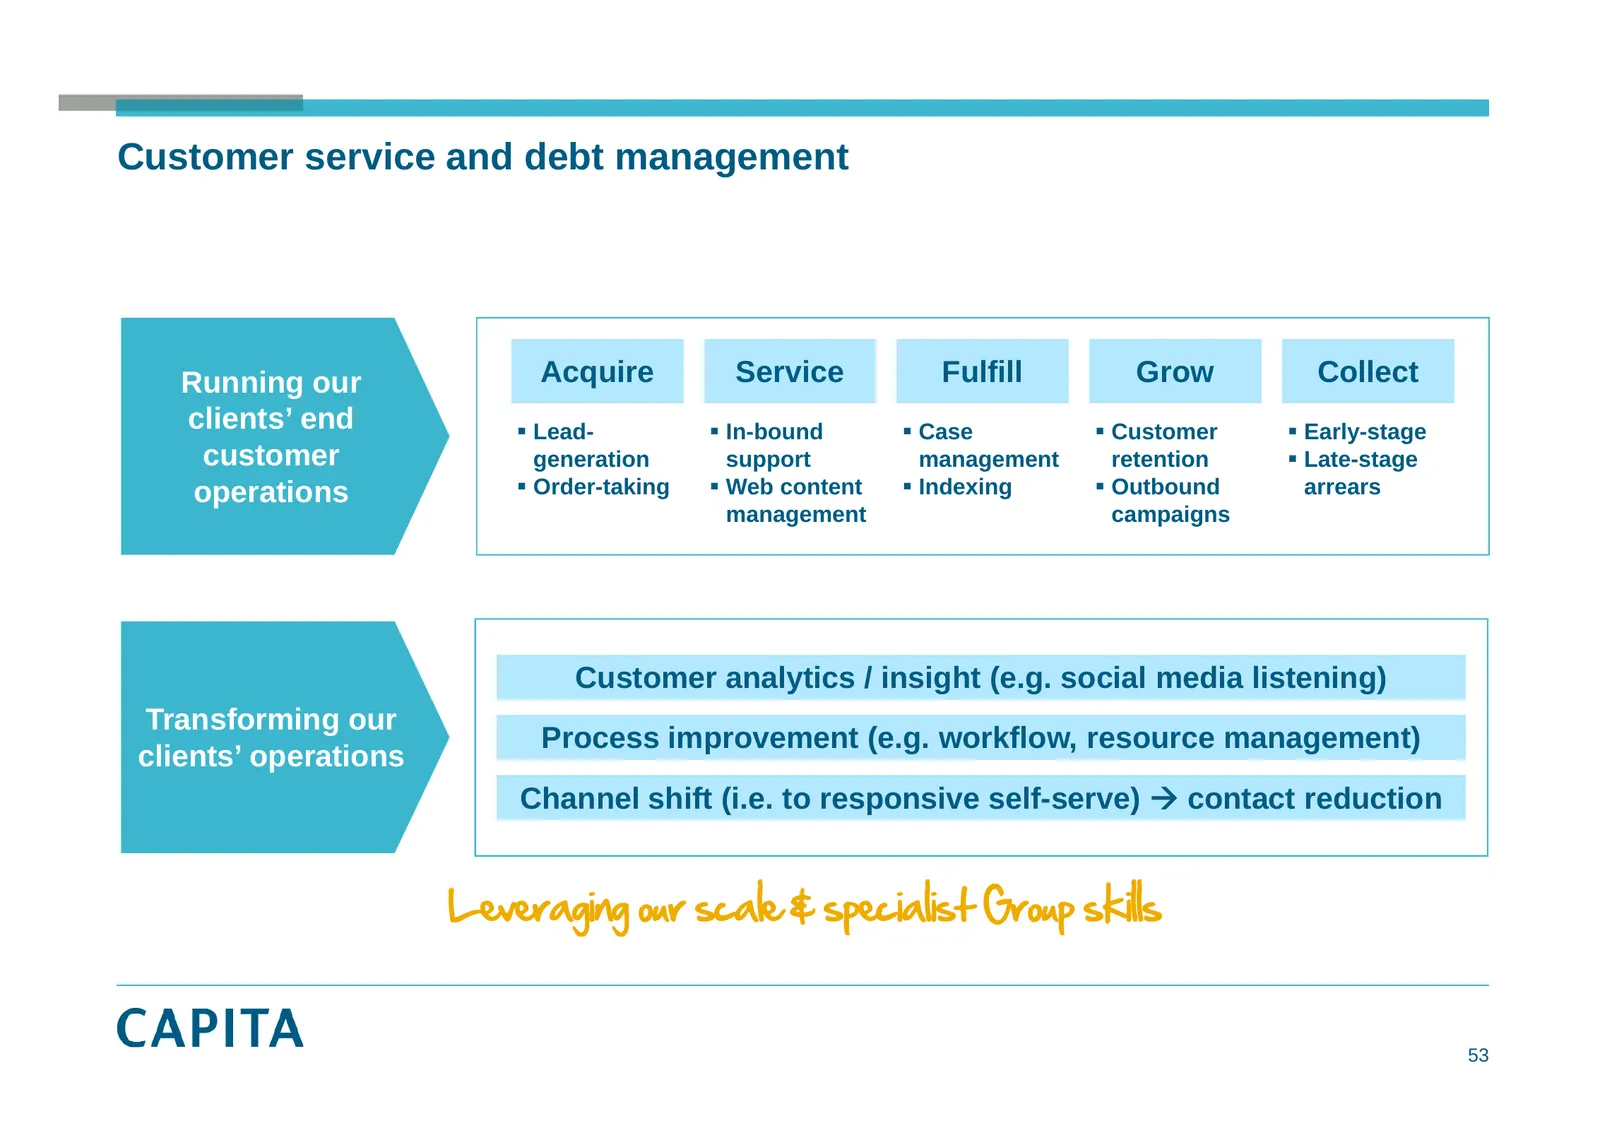
Customer service and debt management Running our Acquire Service Fulfill Grow Collect clients’ end Lead Lead- In In-bound bound Case Customer Early Early-stage stage customer generation support management retention Late-stage operations Order-taking Web content Indexing Outbound
Slide 54: Near & offshore delivery
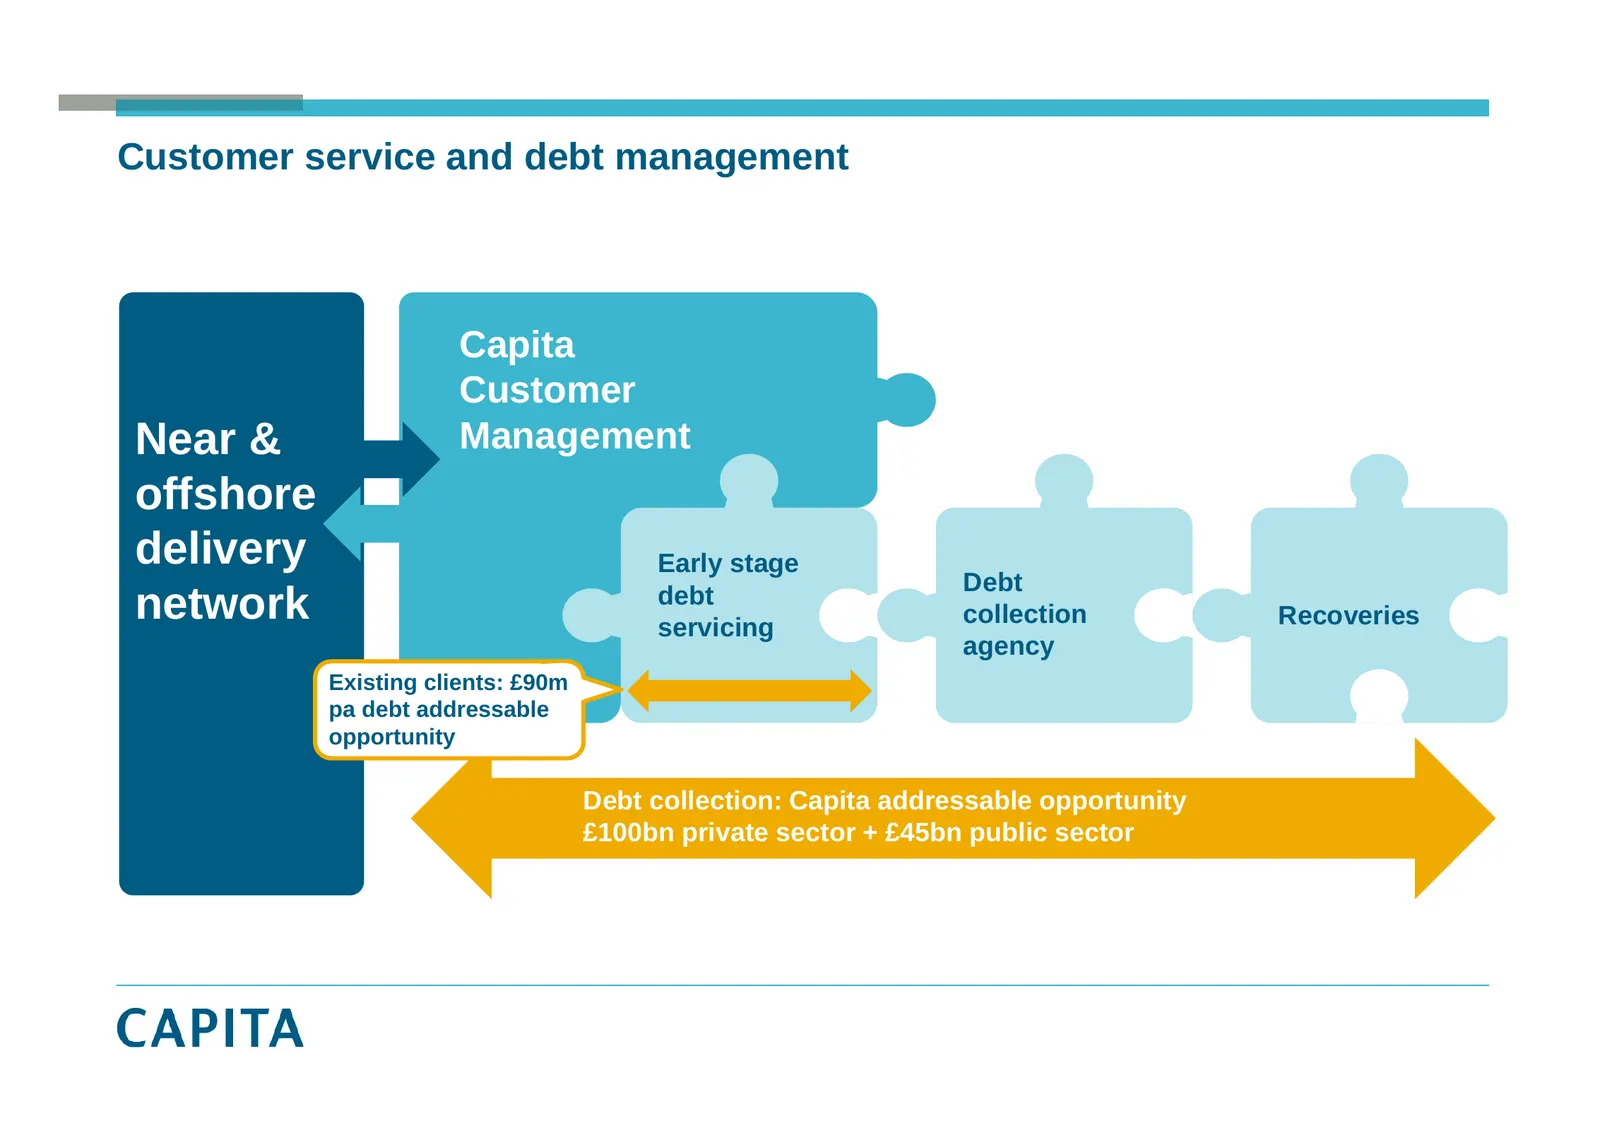
Customer service and debt management Capita Customer Near & Management offshore delivery y Early stage Early debt stage Debt network debt servicing collection Recoveries servicing agency Existing g clients: £90m pa debt addressable opportunity Debt collection: Capita addressable opportunity £100bn p
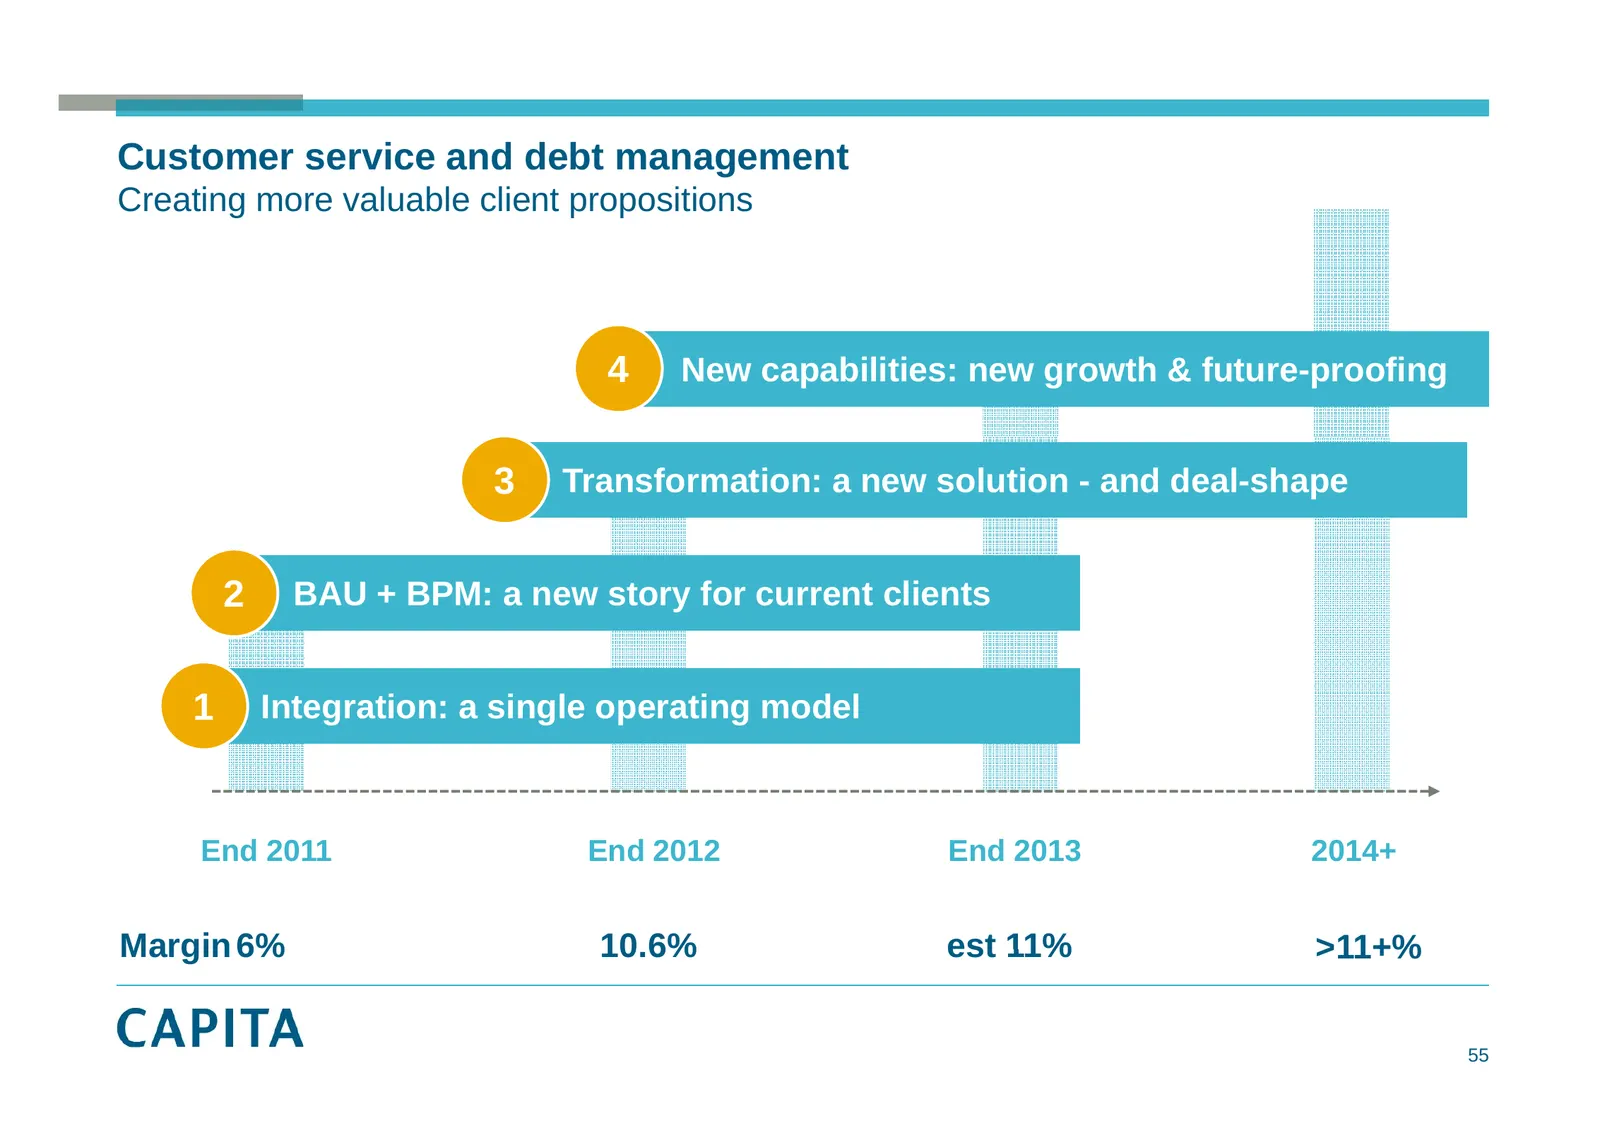
Slide 55: Creating more valuable client propositions
Customer service and debt management Creating more valuable client propositions 4 28m New capabilities: new growth & future-proofing 3 23m Transformation: a new solution - and deal-shape 15 15m 2 BAU + BPM: a new story for current clients 1 Integration: a single operating model End 2011 End 2012 End
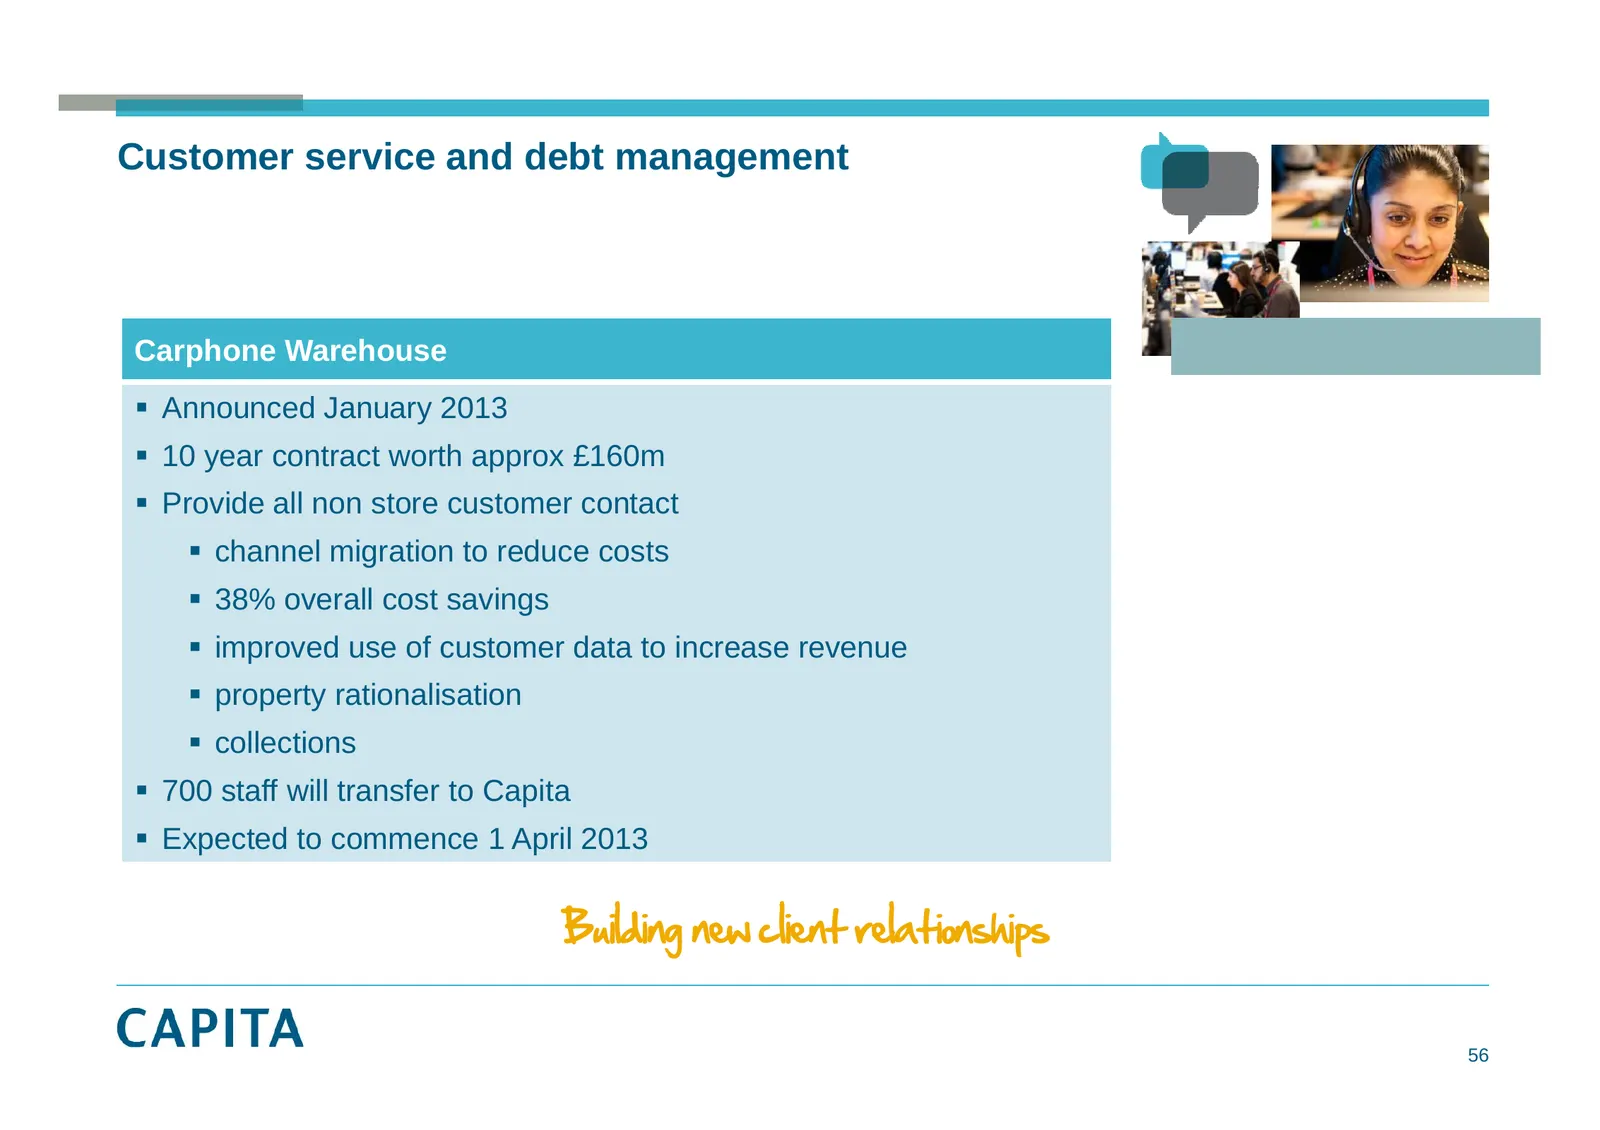
Slide 56: Carphone Warehouse – building new client relationships
Customer service and debt management Carphone Warehouse Announced January 2013 10 year contract worth approx £160m Provide all non store customer contact channel migration g to reduce costs 38% overall cost savings improved use of customer data to increase revenue property rationalisat

Slide 57: Summary & outlook
Summary & outlook Paul Pindar Chief Executive
Slide 58: Investment in people & processes
Investment in people & processes Combining entrepreneurial focus with industrialised processes Further embedding key financial, operations and governance procedures Continuing to strengthen senior management: 2 new divisional directors recruited 31 senior operations managers 5 senior com
Slide 59: Committed to creating shareholder value
Strongly positioned Highly g y visible future revenues via medium to long g term major j contracts Clear, achievable growth profile Market M k t lleader d – unrivalled i ll d capability bilit and d scale l Attractive and growing end markets Diversified risk across customers and sectors C

Slide 60: Appendix
Results for the year ended 31 December 2012 Appendix
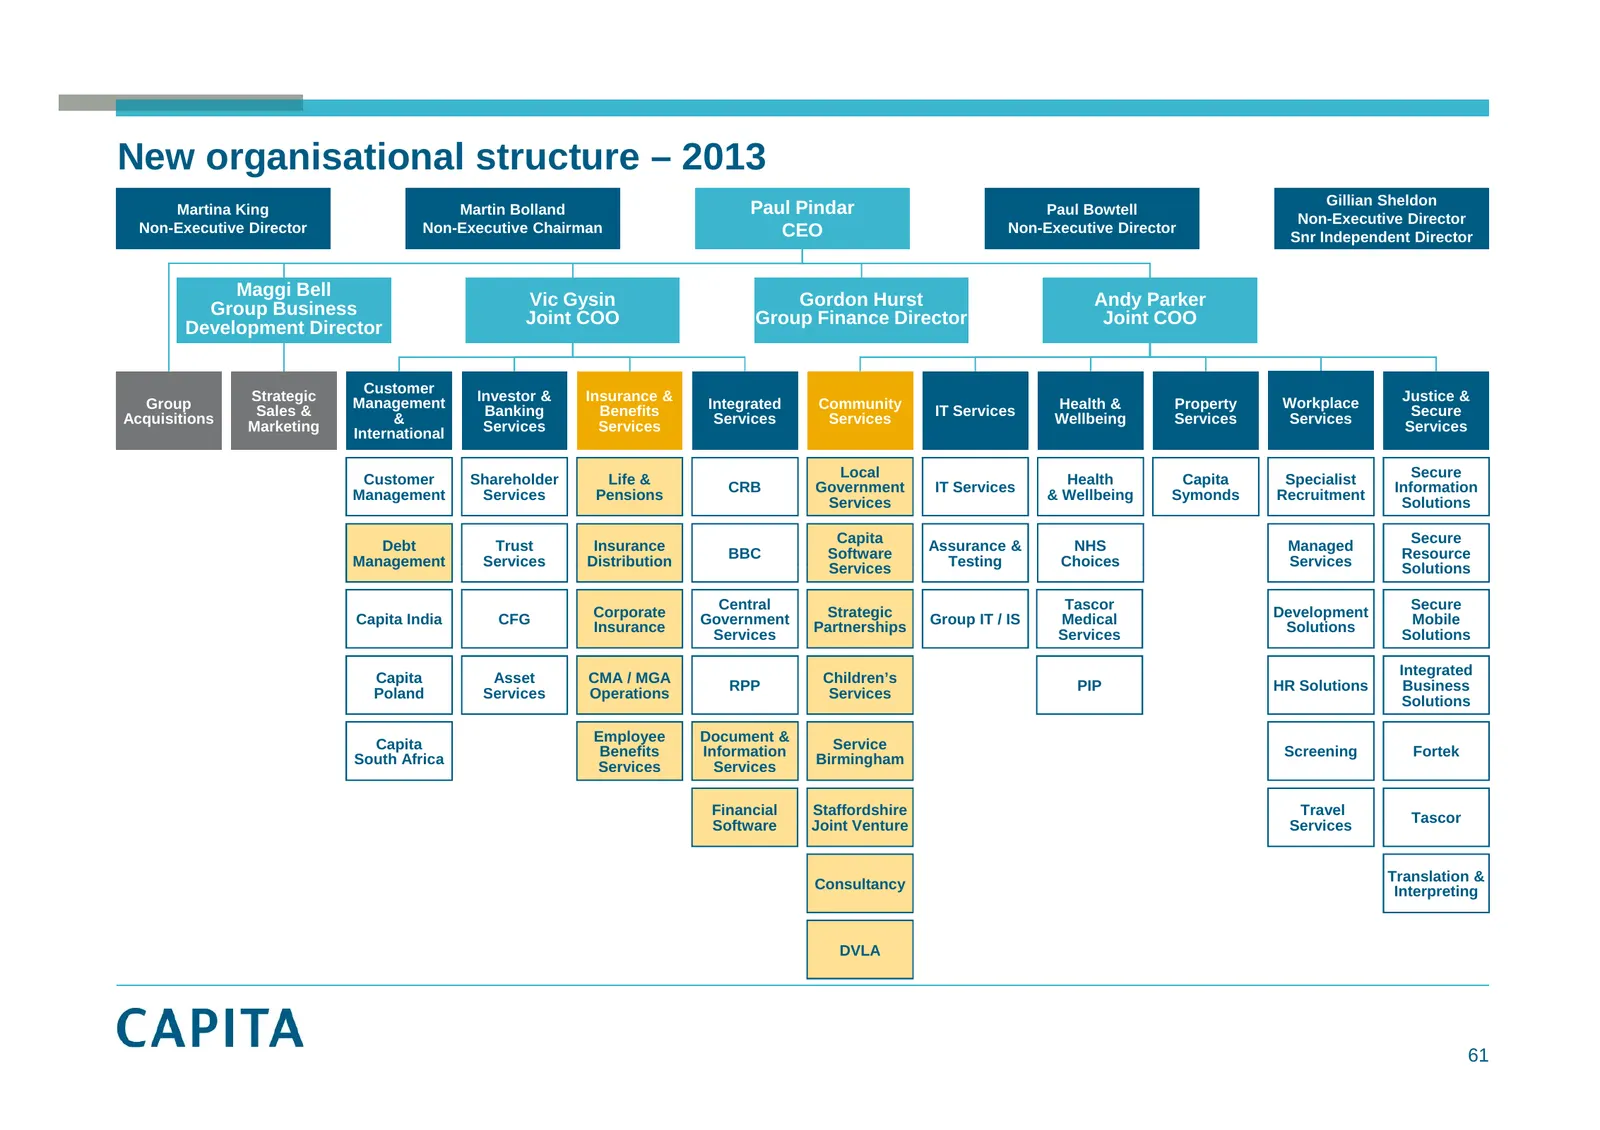
Slide 61: New organisational structure – 2013
New organisational structure – 2013 Gillian Sheldon Martina King Martin Bolland Paul Pindar Paul Bowtell Non-Executive Director Non-Executive Director Non-Executive Chairman CEO Non-Executive Director Snr Independent Director Maggi Bell Vic Gysin y Gordon Hurst Andyy Parker Group Business Joint COO
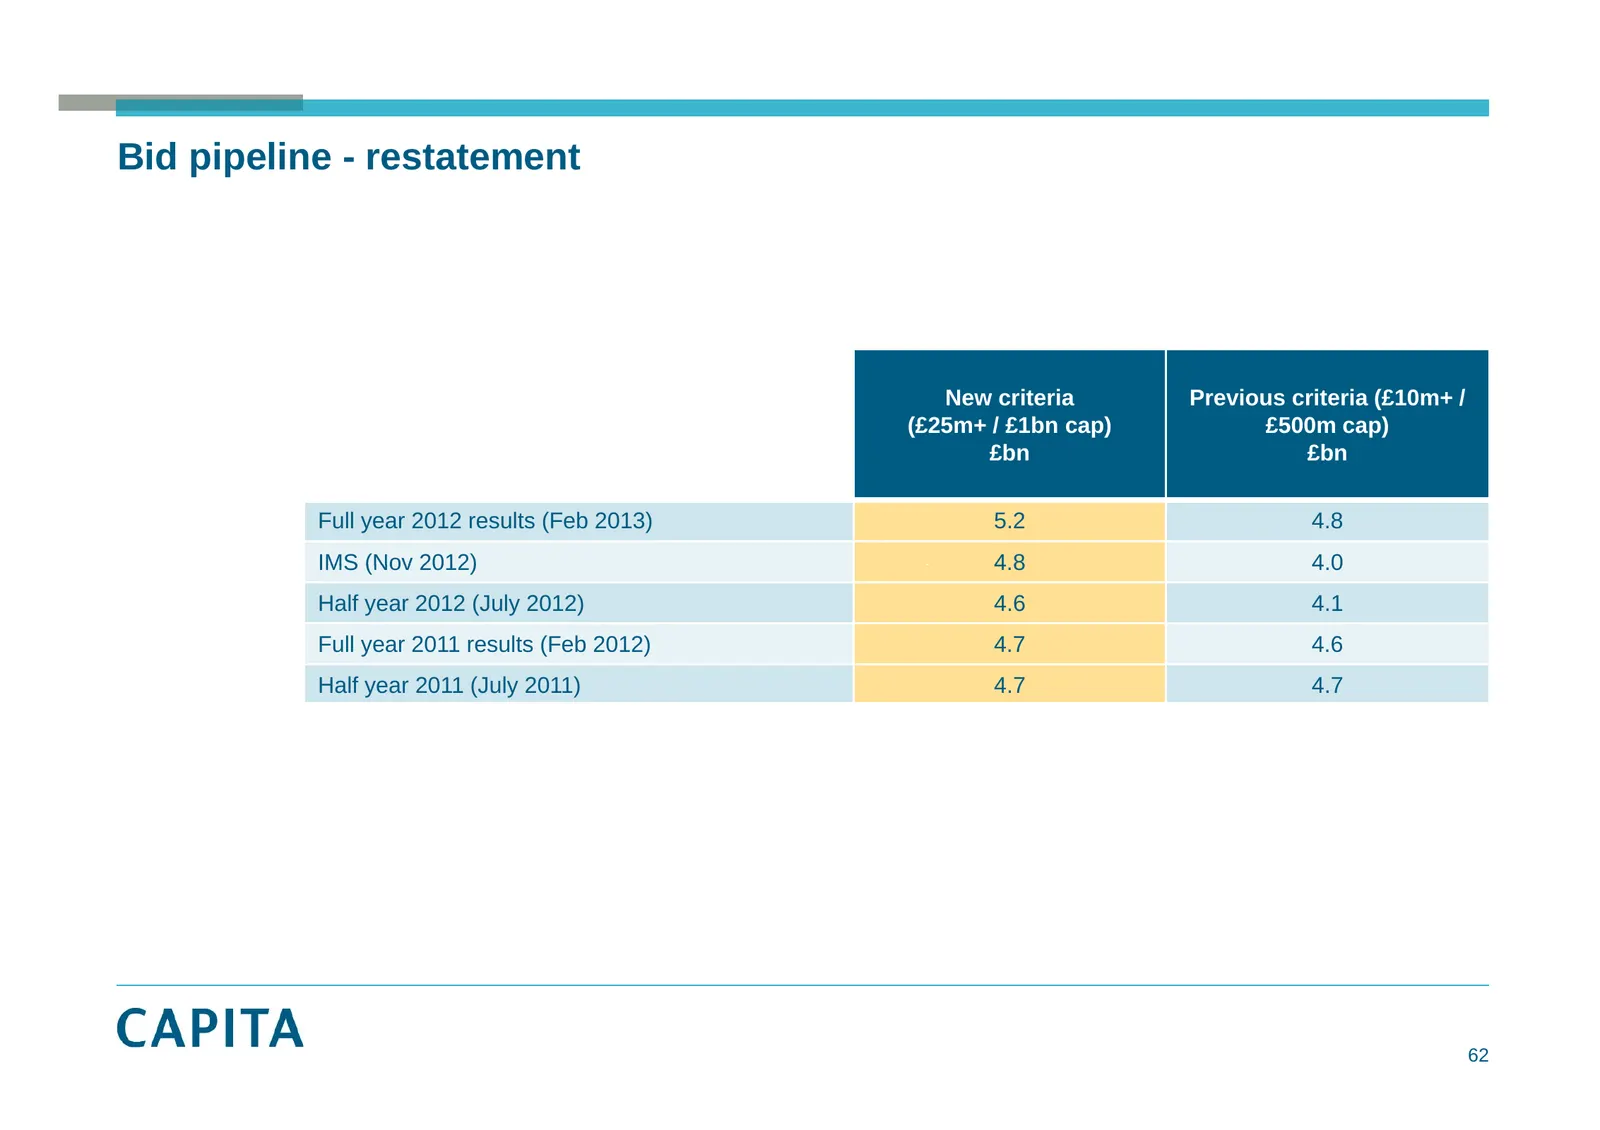
Slide 62: Bid pipeline - restatement
Bid pipeline - restatement New criteria Previous criteria (£10m+ / ((£25m+ / £1bn cap) p) £500m cap) p) £bn £bn Full year 2012 results (Feb 2013) 5.2 4.8 IMS (Nov 2012) 48 4.8 40 4.0 Half year 2012 (July 2012) 4.6 4.1 Full year 2011 results (Feb 2012) 4.7 4.6 Half a yea year 2011 0 (Ju (July y 2011)

Slide 63: Results for the year ended 31 December 2012
Results for the year ended 31 December 2012
Source: Internet Archive copy of investors.capita.com
More decks from Capita plc
 H1 2026 Earnings Presentation44 slides · Aug 4, 2026
 FY2025 Earnings Presentation46 slides · March 2026
 Merger or Acquisition (March 2026)10 slides · March 2026
 H1 2025 Earnings Presentation51 slides · August 2025
 FY2024 Earnings Presentation44 slides · March 2025
 H1 2024 Earnings Presentation33 slides · Aug 1, 2024