Raute Oyj Class A · OMXHEX:RAUTE
Raute Oyj Class A — Q3 2009 Earnings Presentation
20 slides from Raute Oyj Class A's earnings presentation, Oct 27, 2009
Slide 1: Interim Report 1 January - 30 September 2009
Interim Report 1 January - 30 September 2009 27 October 2009 Tapani Kiiski, President and CEO www.raute.com
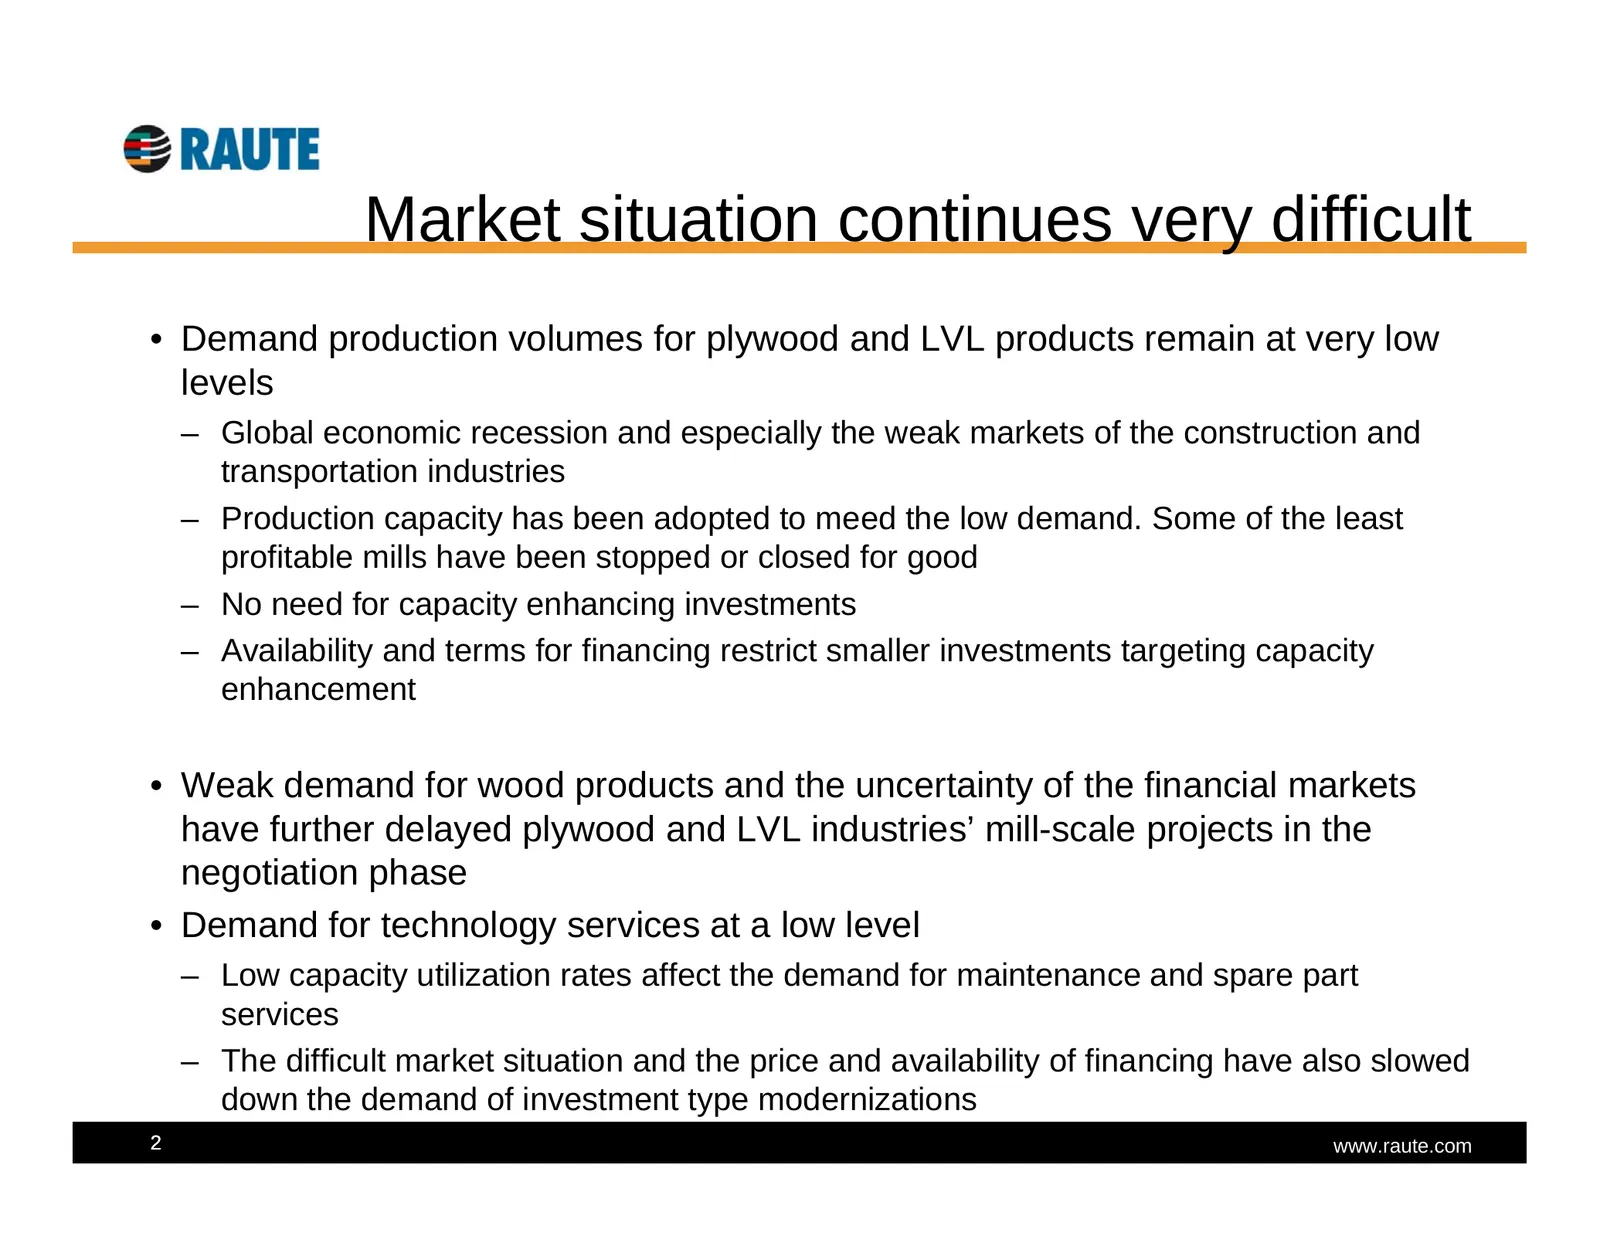
Slide 2: Market situation continues very difficult
Market situation continues very difficult • Demand production volumes for plywood and LVL products remain at very low levels – Global economic recession and especially the weak markets of the construction and transportation industries – Production capacity has been adopted to meed the low demand. So
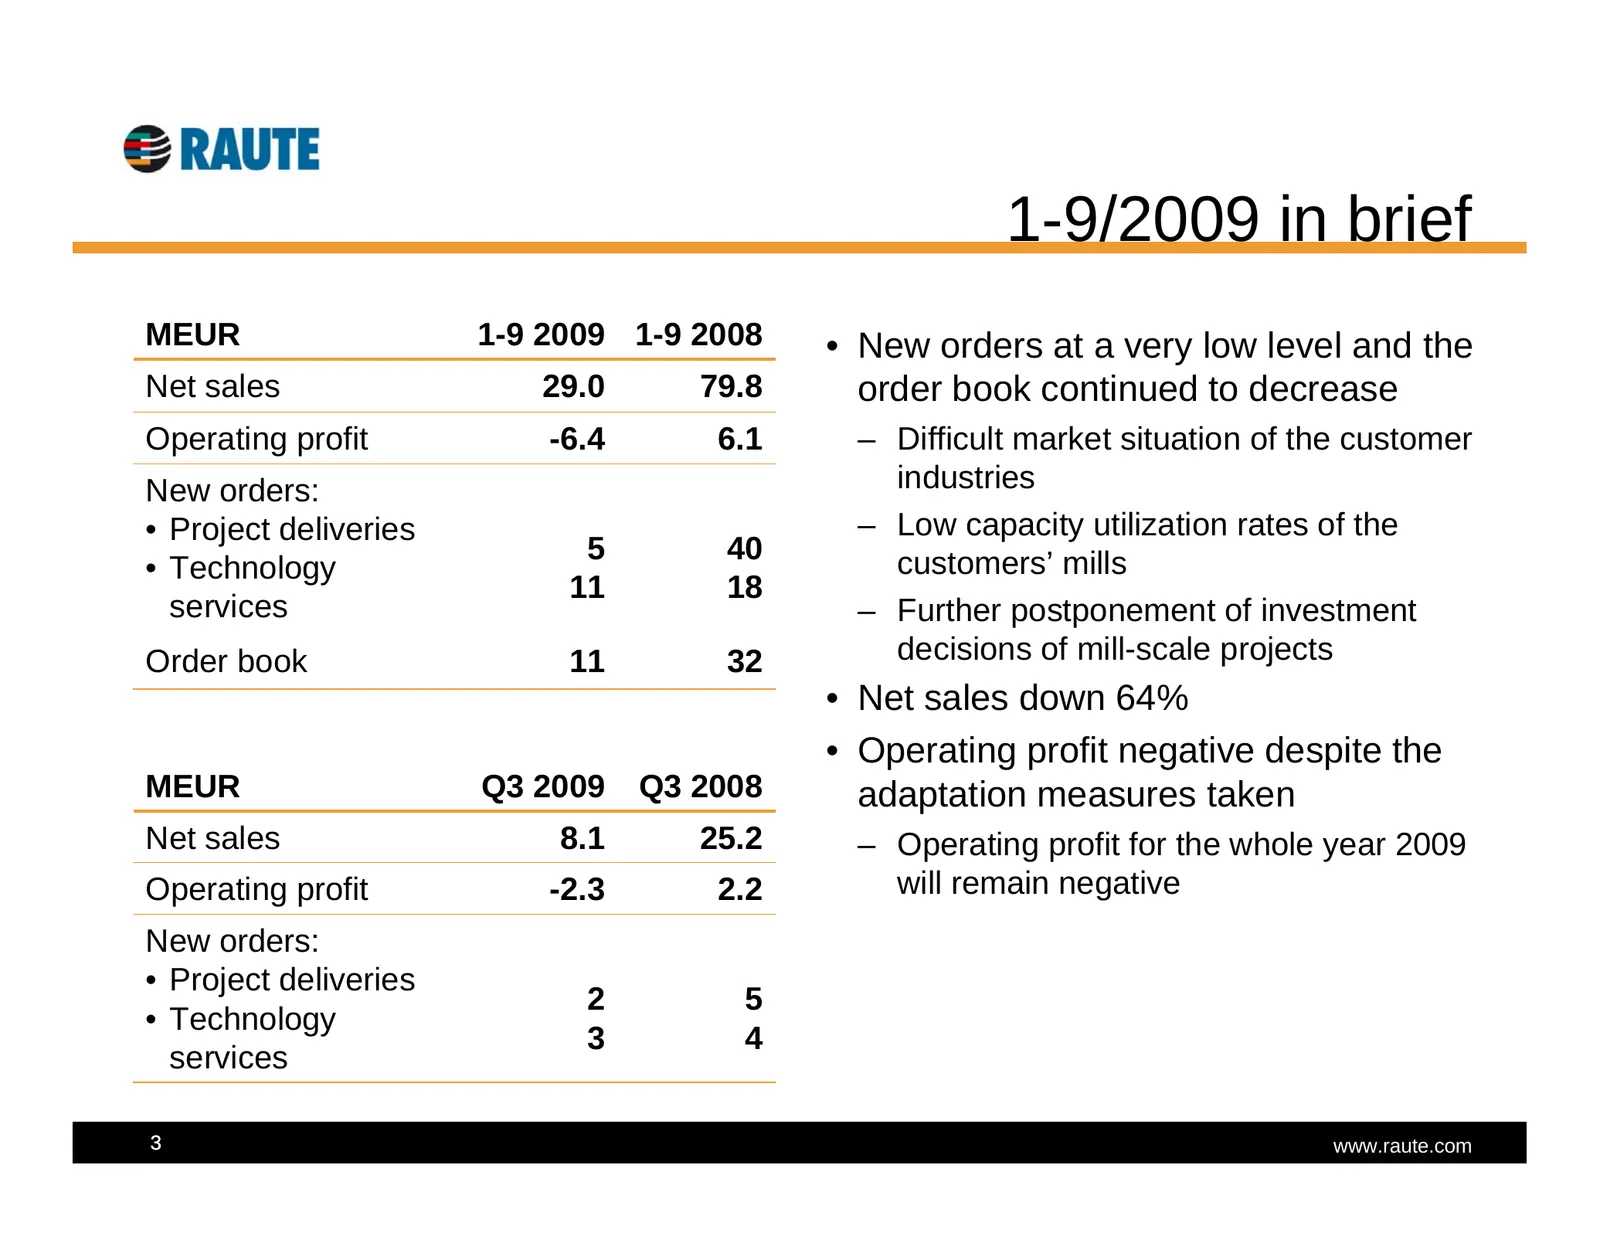
Slide 3: 1-9/2009 in brief
1-9/2009 in brief MEUR 1-9 2009 1-9 2008 • New orders at a very low level and the Net sales 29.0 79.8 order book continued to decrease Operating profit -6.4 6.1 – Difficult market situation of the customer New orders: industries • Project deliveries – Low capacity utilization rates of the 5 40 custo
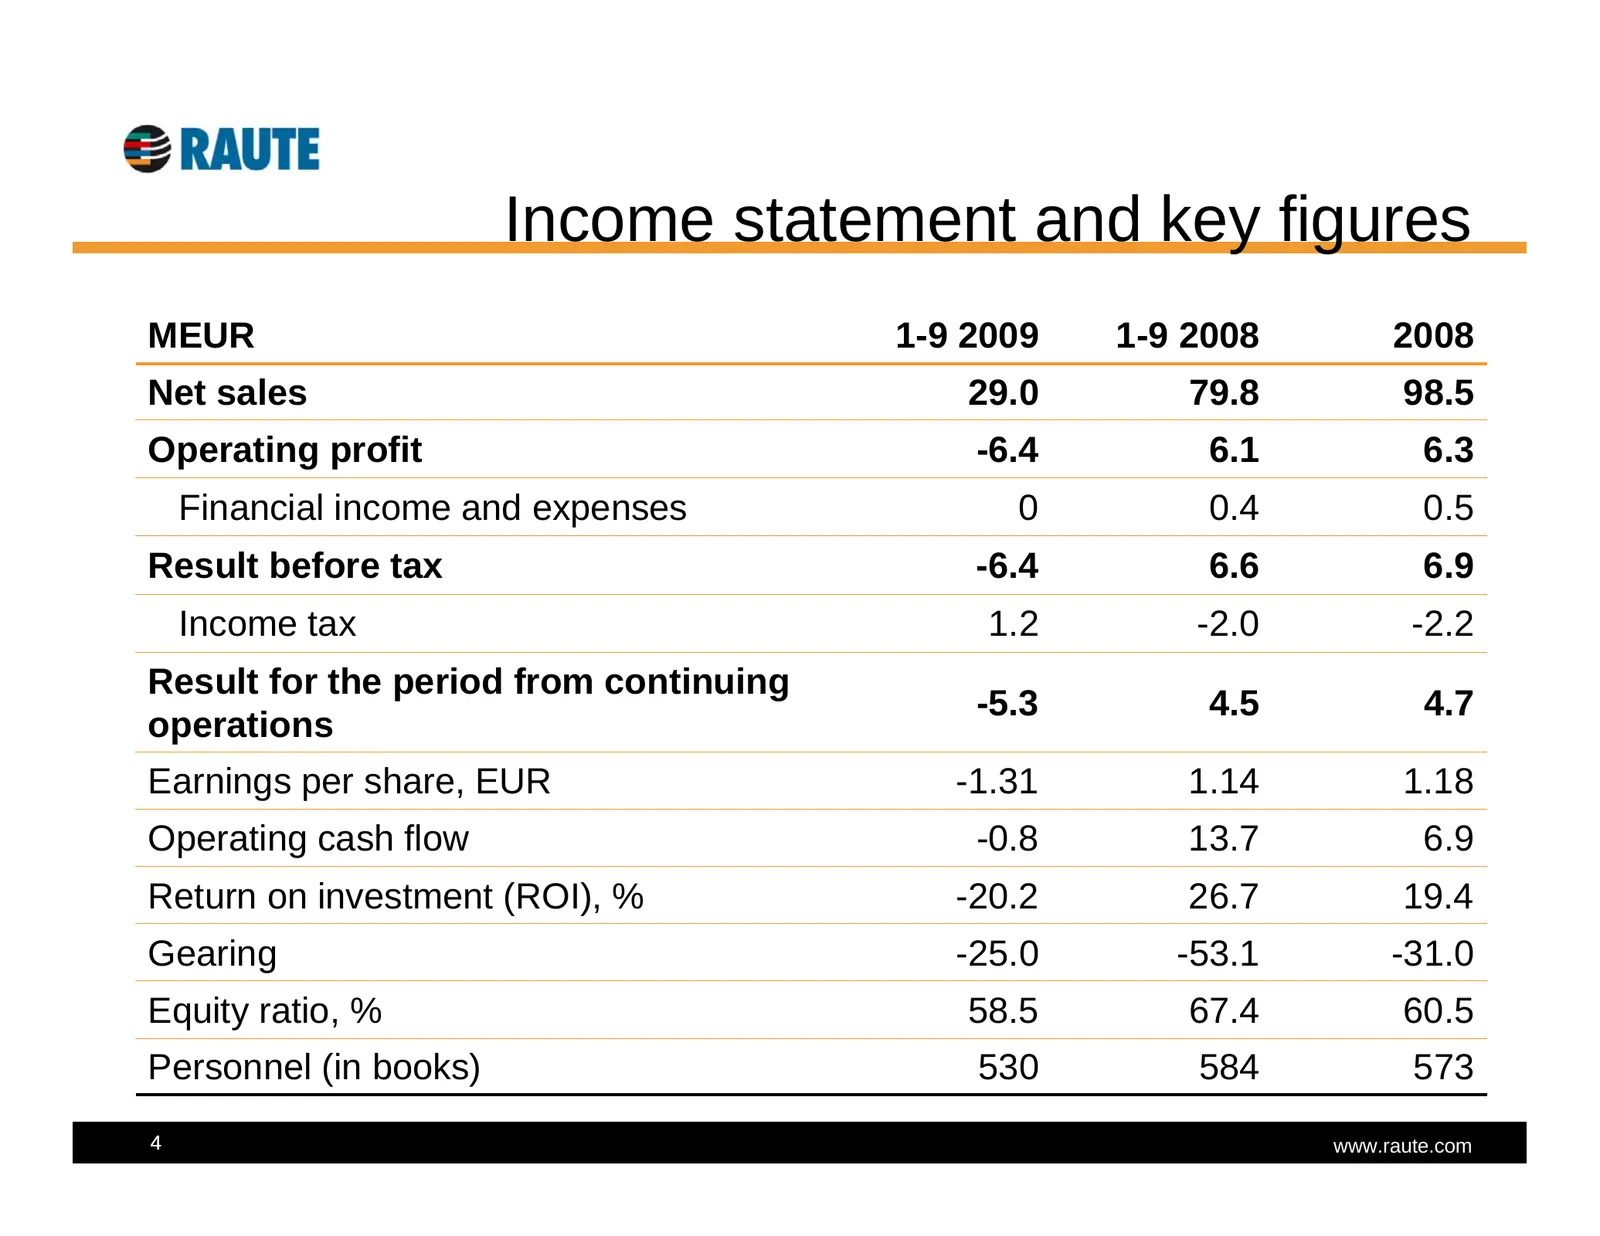
Slide 4: Income statement and key figures
Income statement and key figures MEUR 1-9 2009 1-9 2008 2008 Net sales 29.0 79.8 98.5 Operating profit -6.4 6.1 6.3 Financial income and expenses 0 0.4 0.5 Result before tax -6.4 6.6 6.9 Income tax 1.2 -2.0 -2.2 Result for the period from continuing -5.3 4.5 4.7 operations Earnings per share, EUR -1
Slide 5: Balance sheet
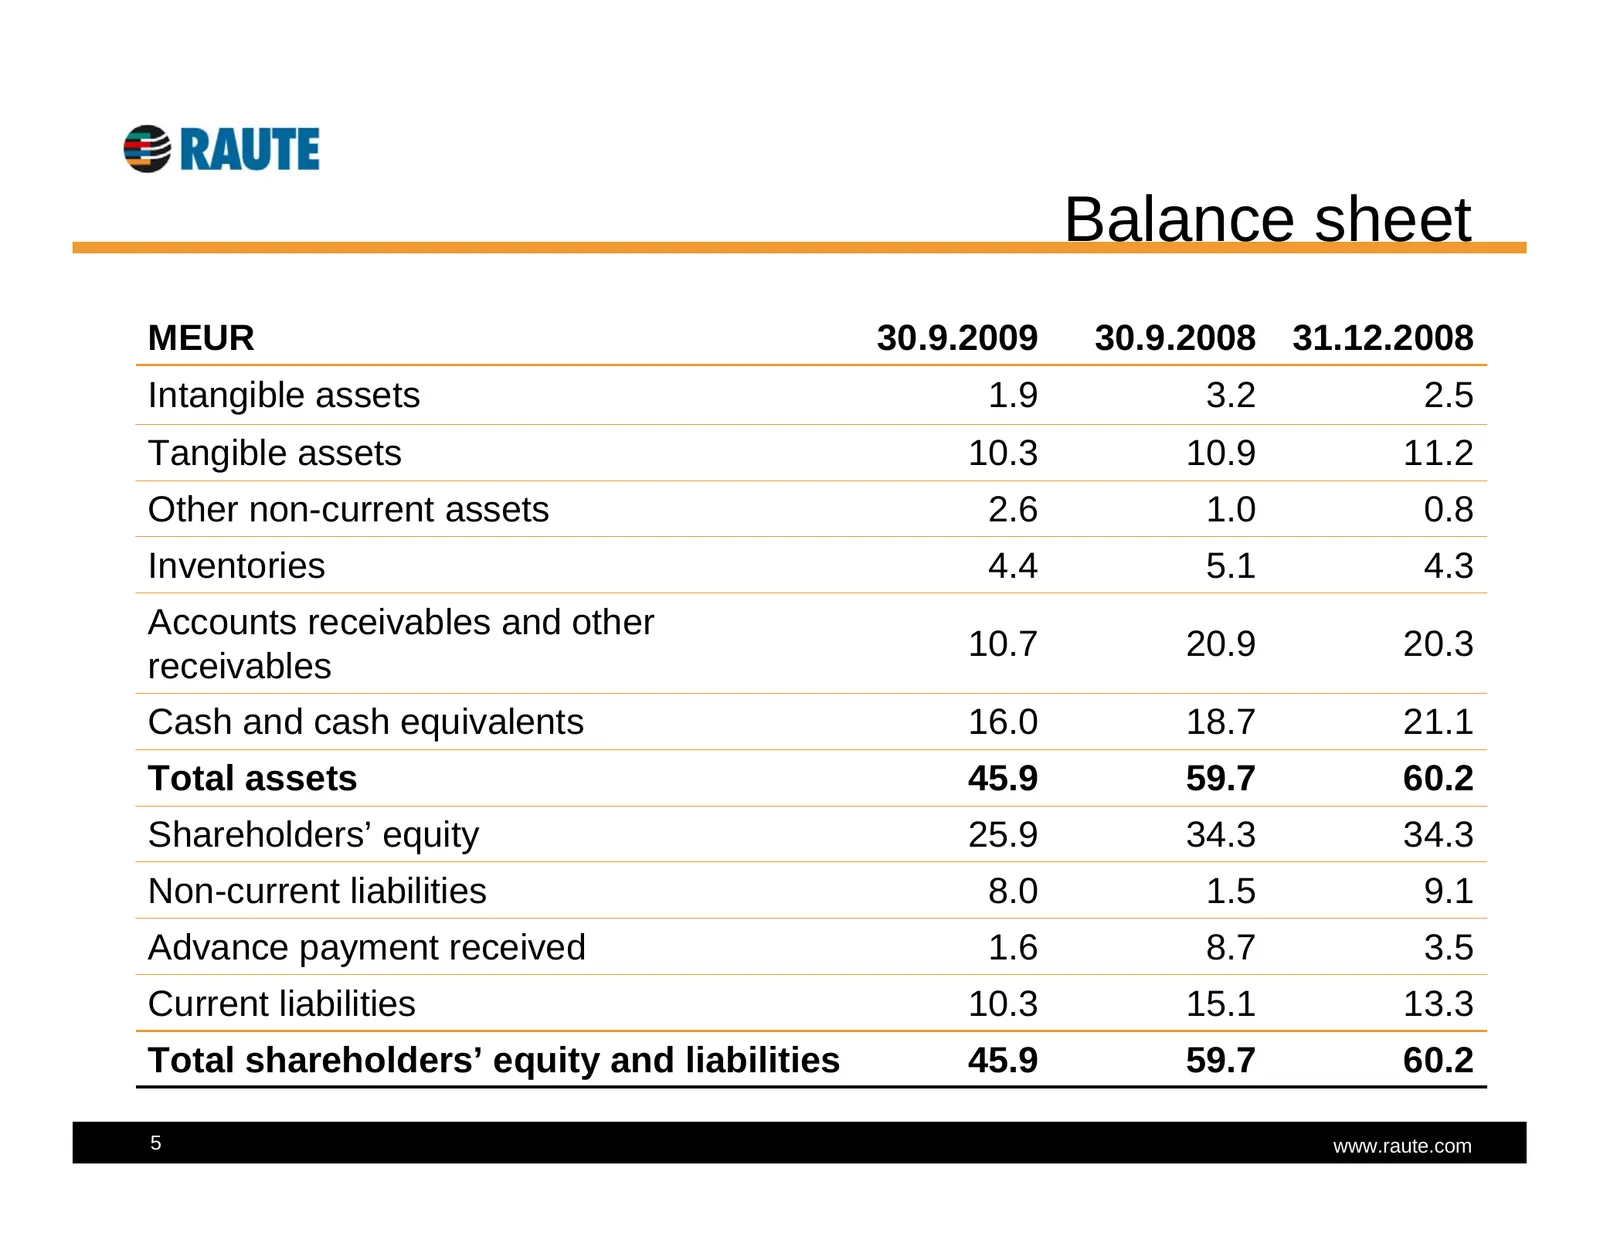
Balance sheet MEUR 30.9.2009 30.9.2008 31.12.2008 Intangible assets 1.9 3.2 2.5 Tangible assets 10.3 10.9 11.2 Other non-current assets 2.6 1.0 0.8 Inventories 4.4 5.1 4.3 Accounts receivables and other 10.7 20.9 20.3 receivables Cash and cash equivalents 16.0 18.7 21.1 Total assets 45.9 59.7 60.2 S
Slide 6: New orders
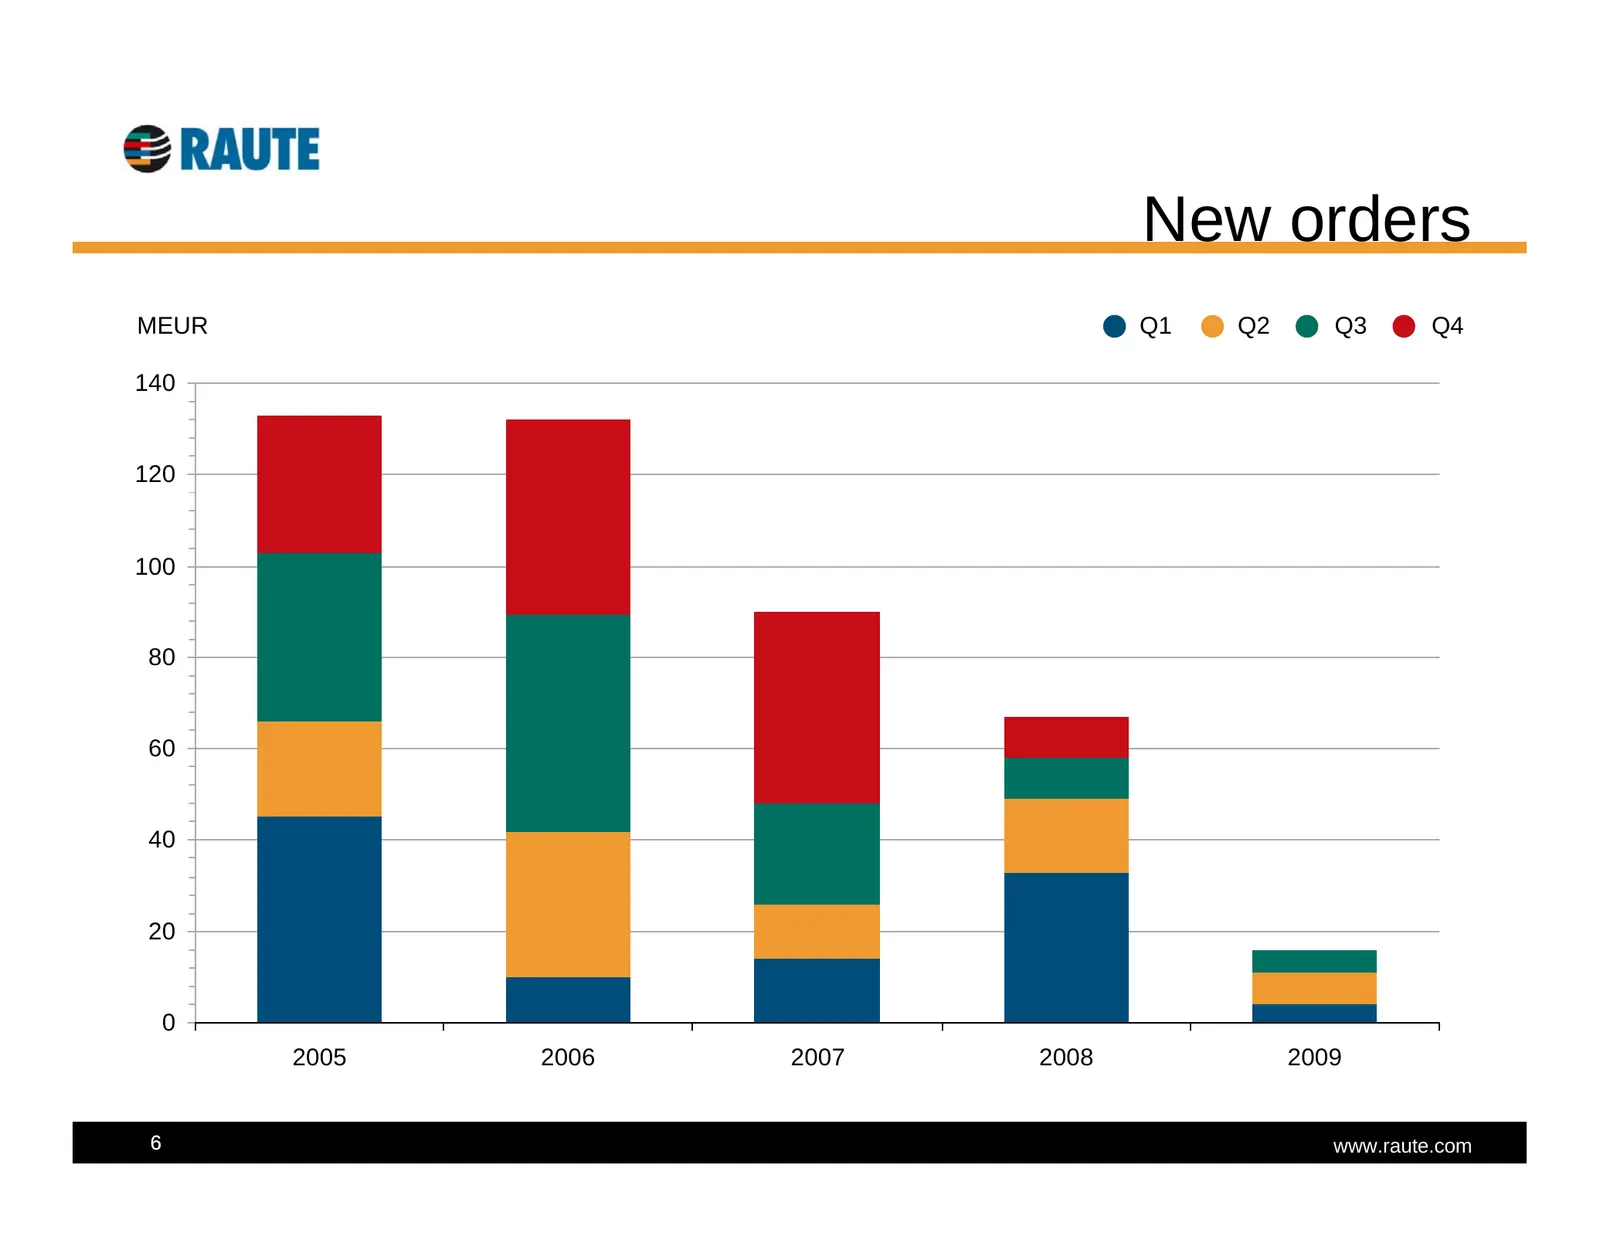
New orders MEUR Q1 Q2 Q3 Q4 140 120 100 80 60 40 20 0 2005 2006 2007 2008 2009 6 www.raute.com
Slide 7: Order book
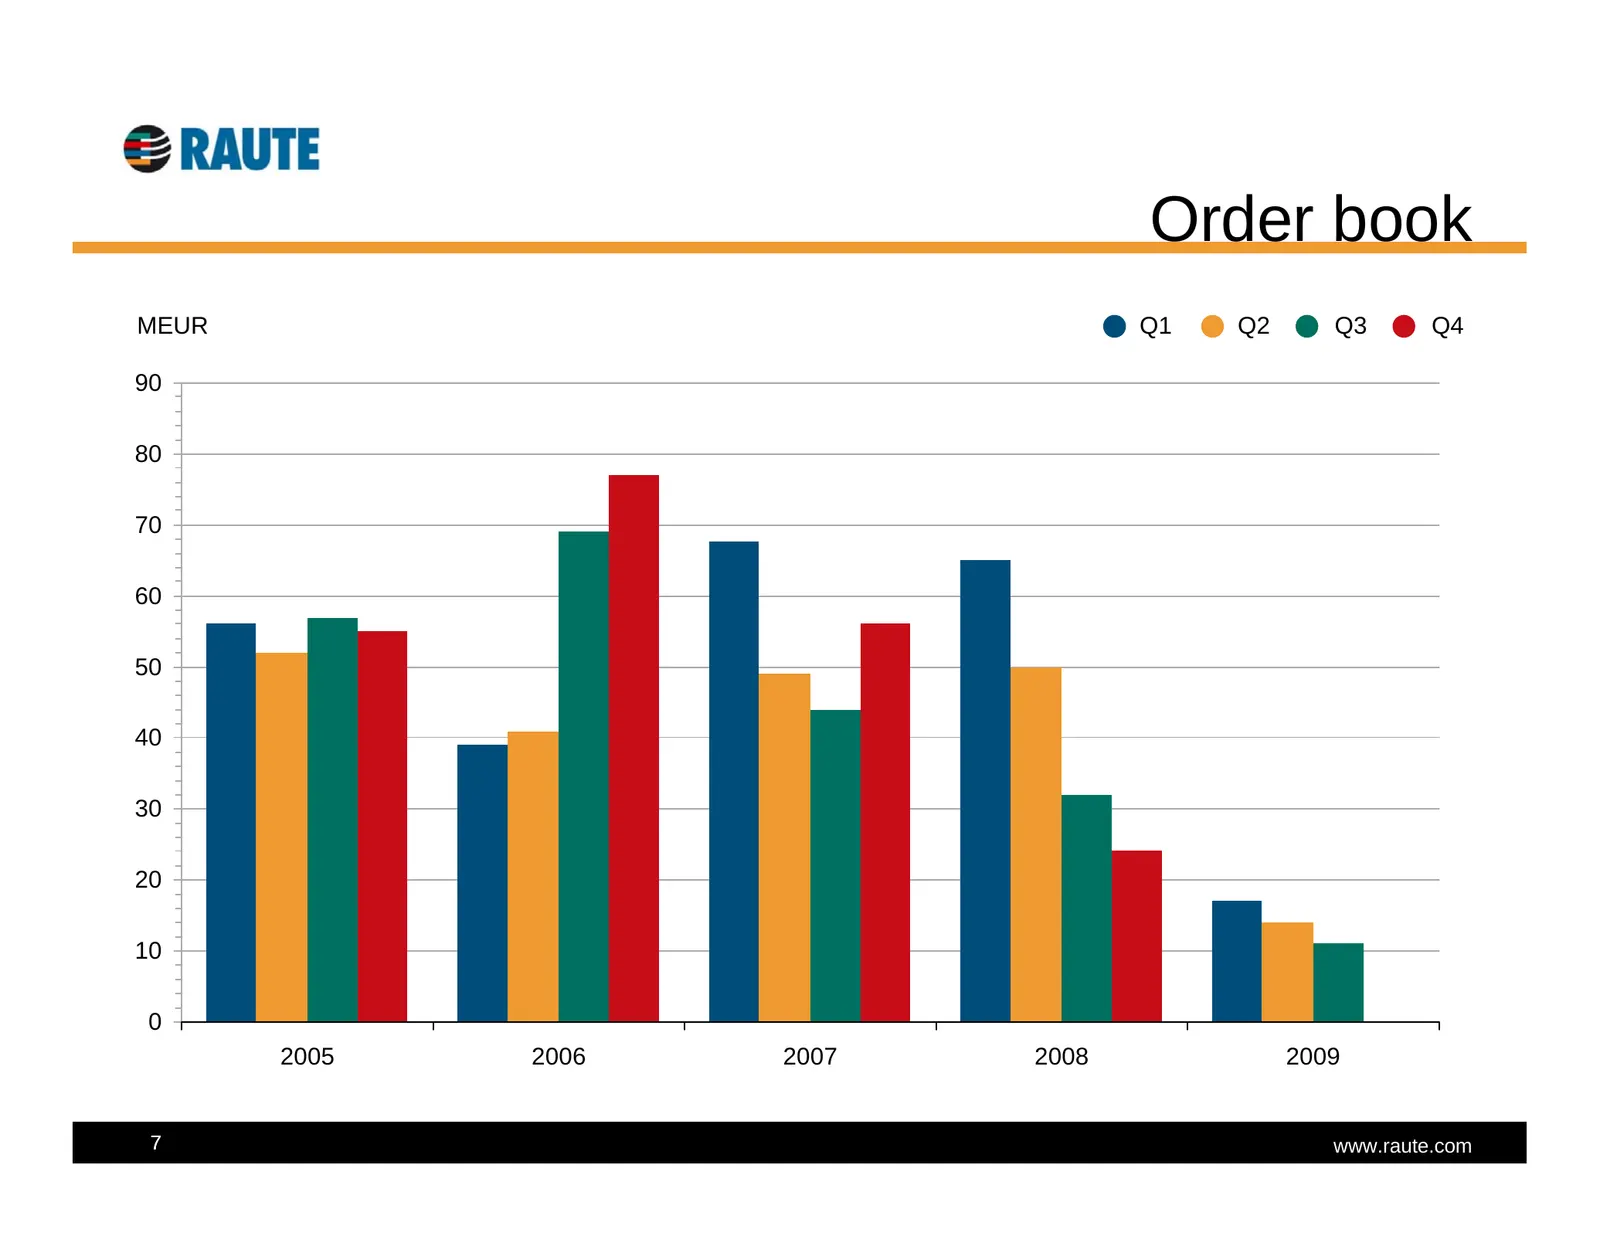
Order book MEUR Q1 Q2 Q3 Q4 90 80 70 60 50 40 30 20 10 0 2005 2006 2007 2008 2009 7 www.raute.com
Slide 8: Net sales
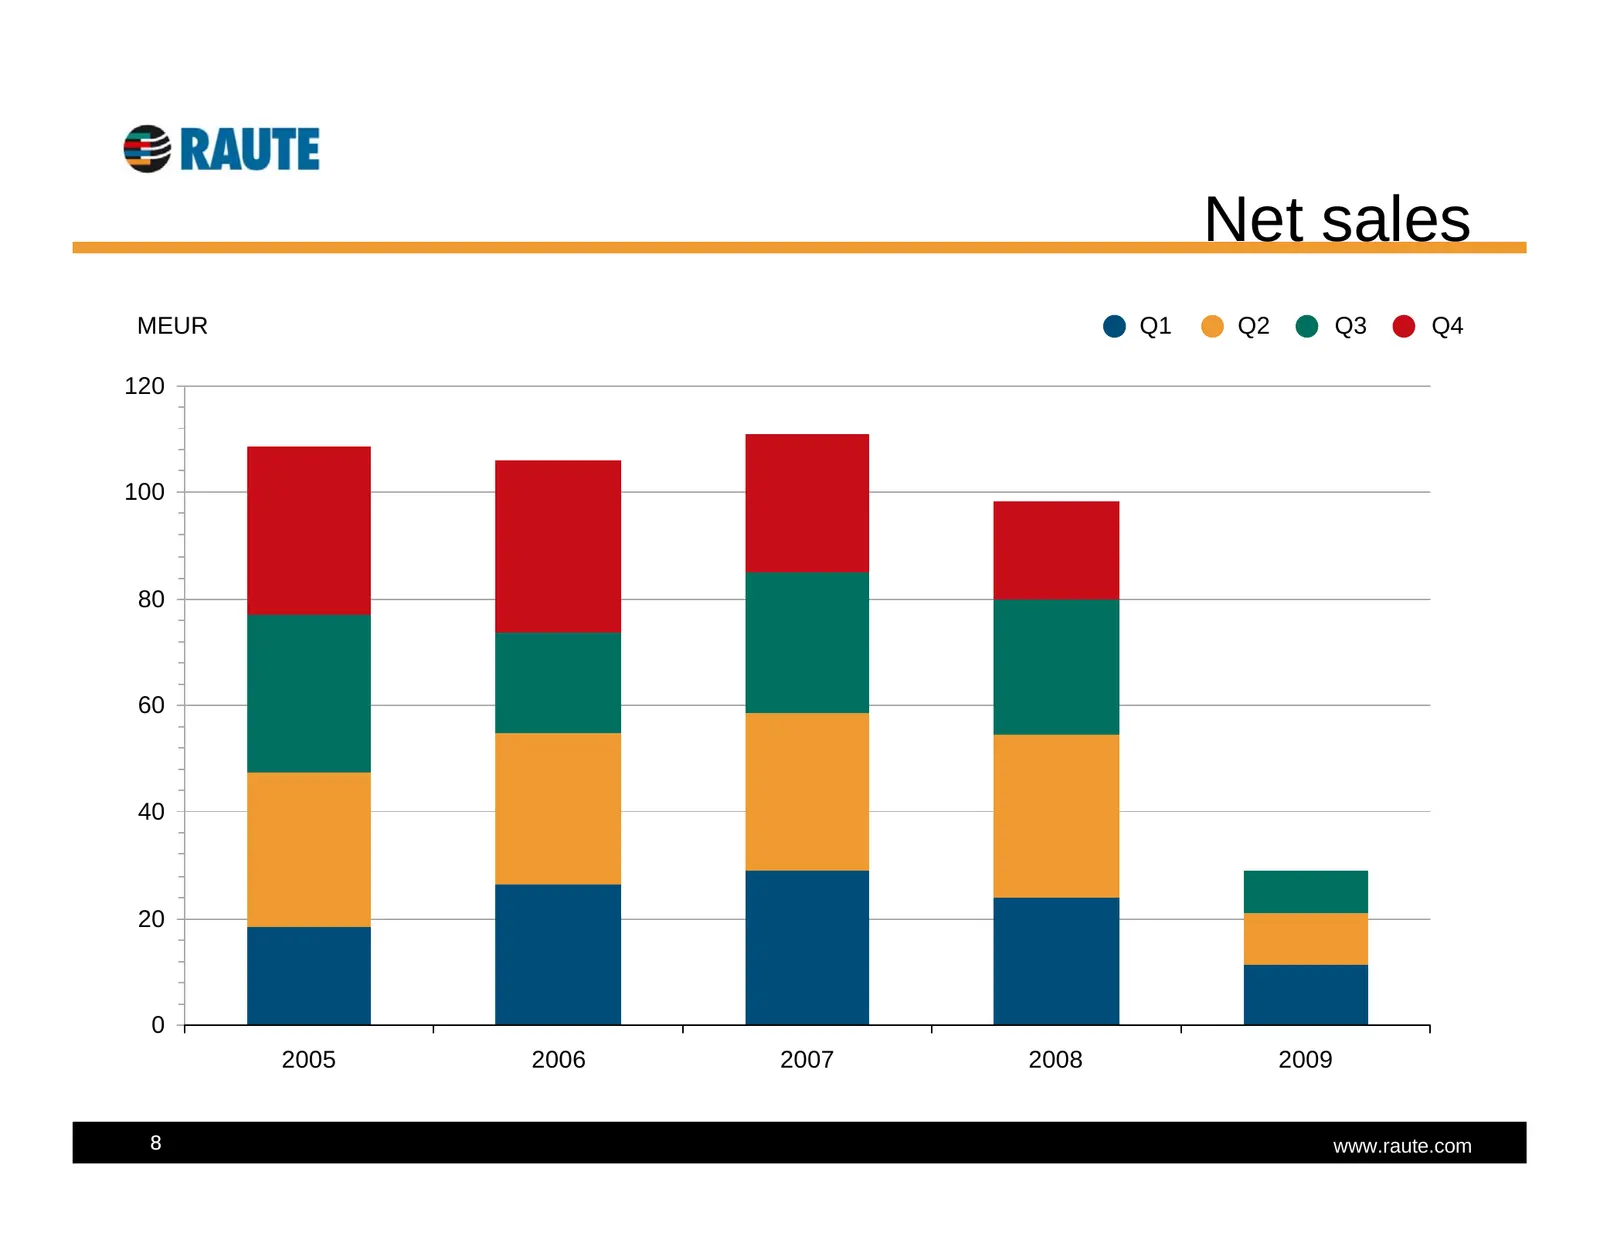
Net sales MEUR Q1 Q2 Q3 Q4 120 100 80 60 40 20 0 2005 2006 2007 2008 2009 8 www.raute.com
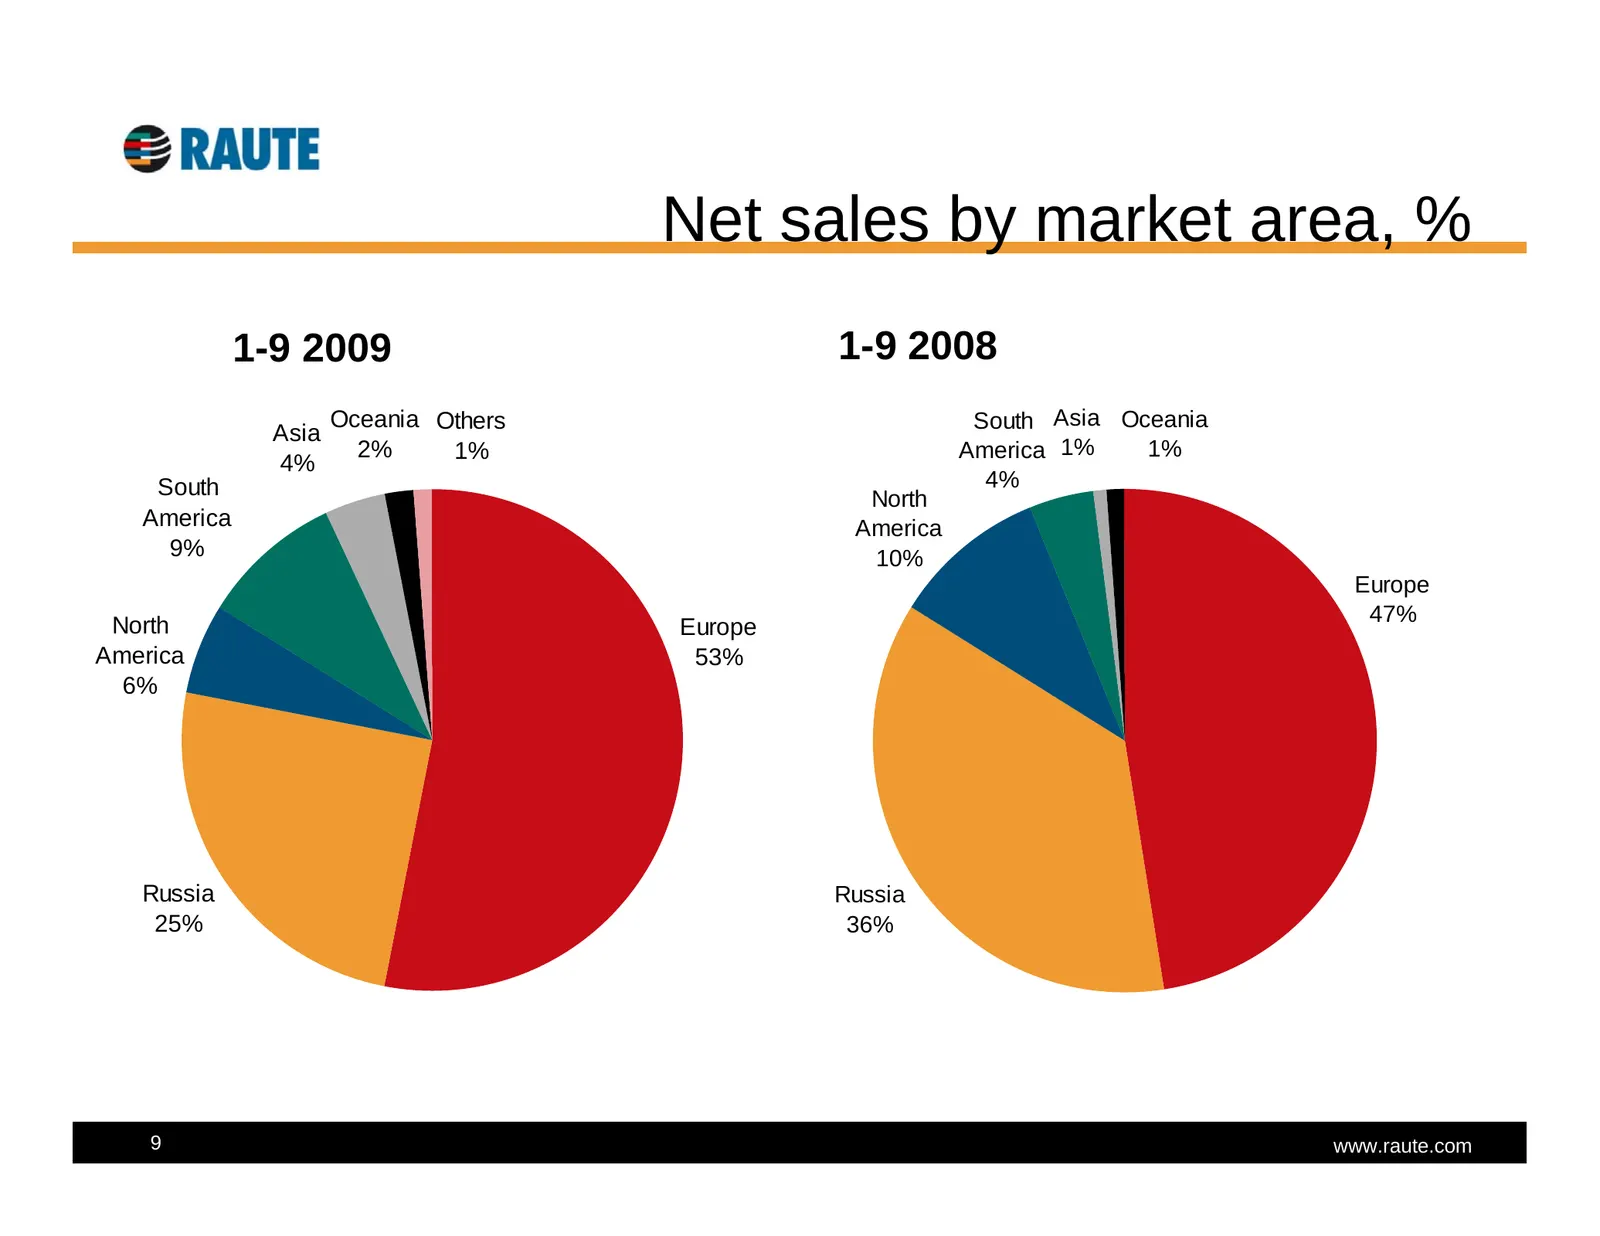
Slide 9: Net sales by market area, %
Net sales by market area, % 1-9 2009 1-9 2008 Oceania Others South Asia Oceania Asia 2% 1% America 1% 1% 4% South 4% North America America 9% 10% Europe North 47% Europe America 53% 6% Russia Russia 25% 36% 9 www.raute.com
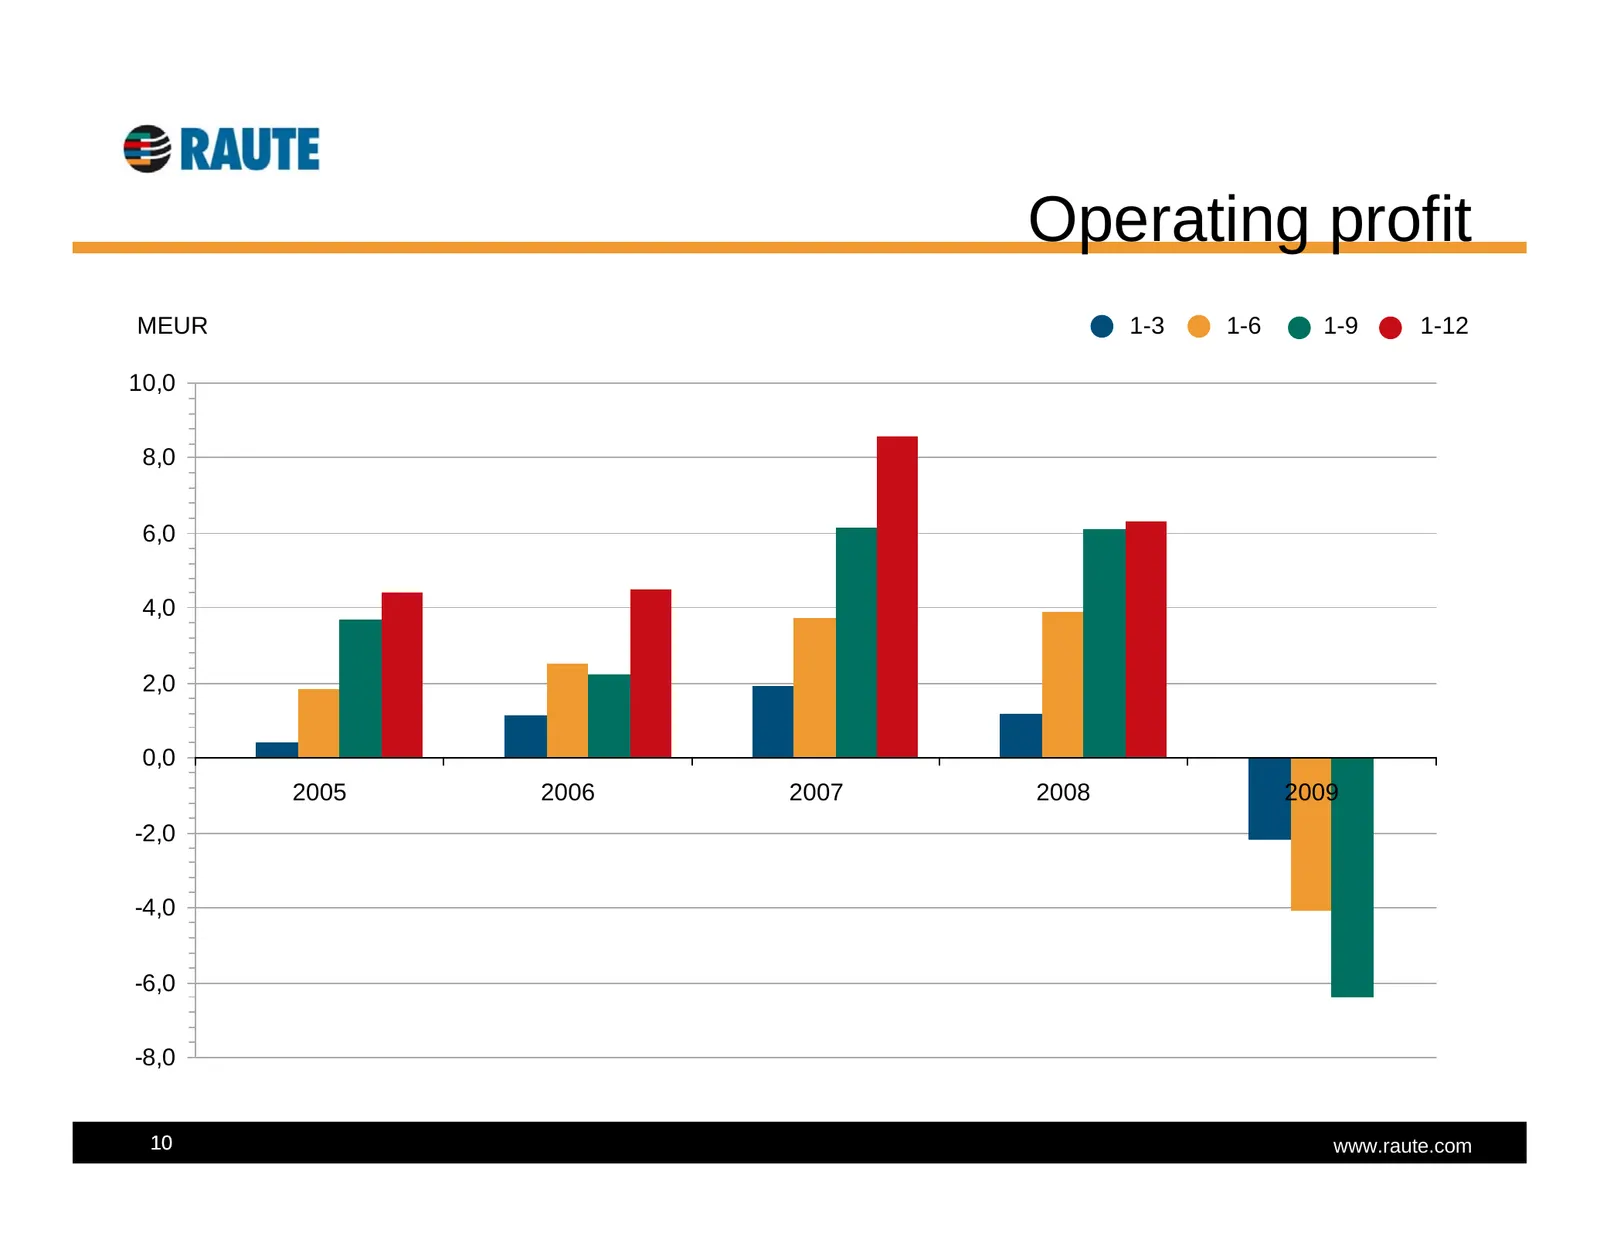
Slide 10: Operating profit
Operating profit MEUR 1-3 1-6 1-9 1-12 10,0 8,0 6,0 4,0 2,0 0,0 2005 2006 2007 2008 2009 -2,0 -4,0 -6,0 -8,0 10 www.raute.com
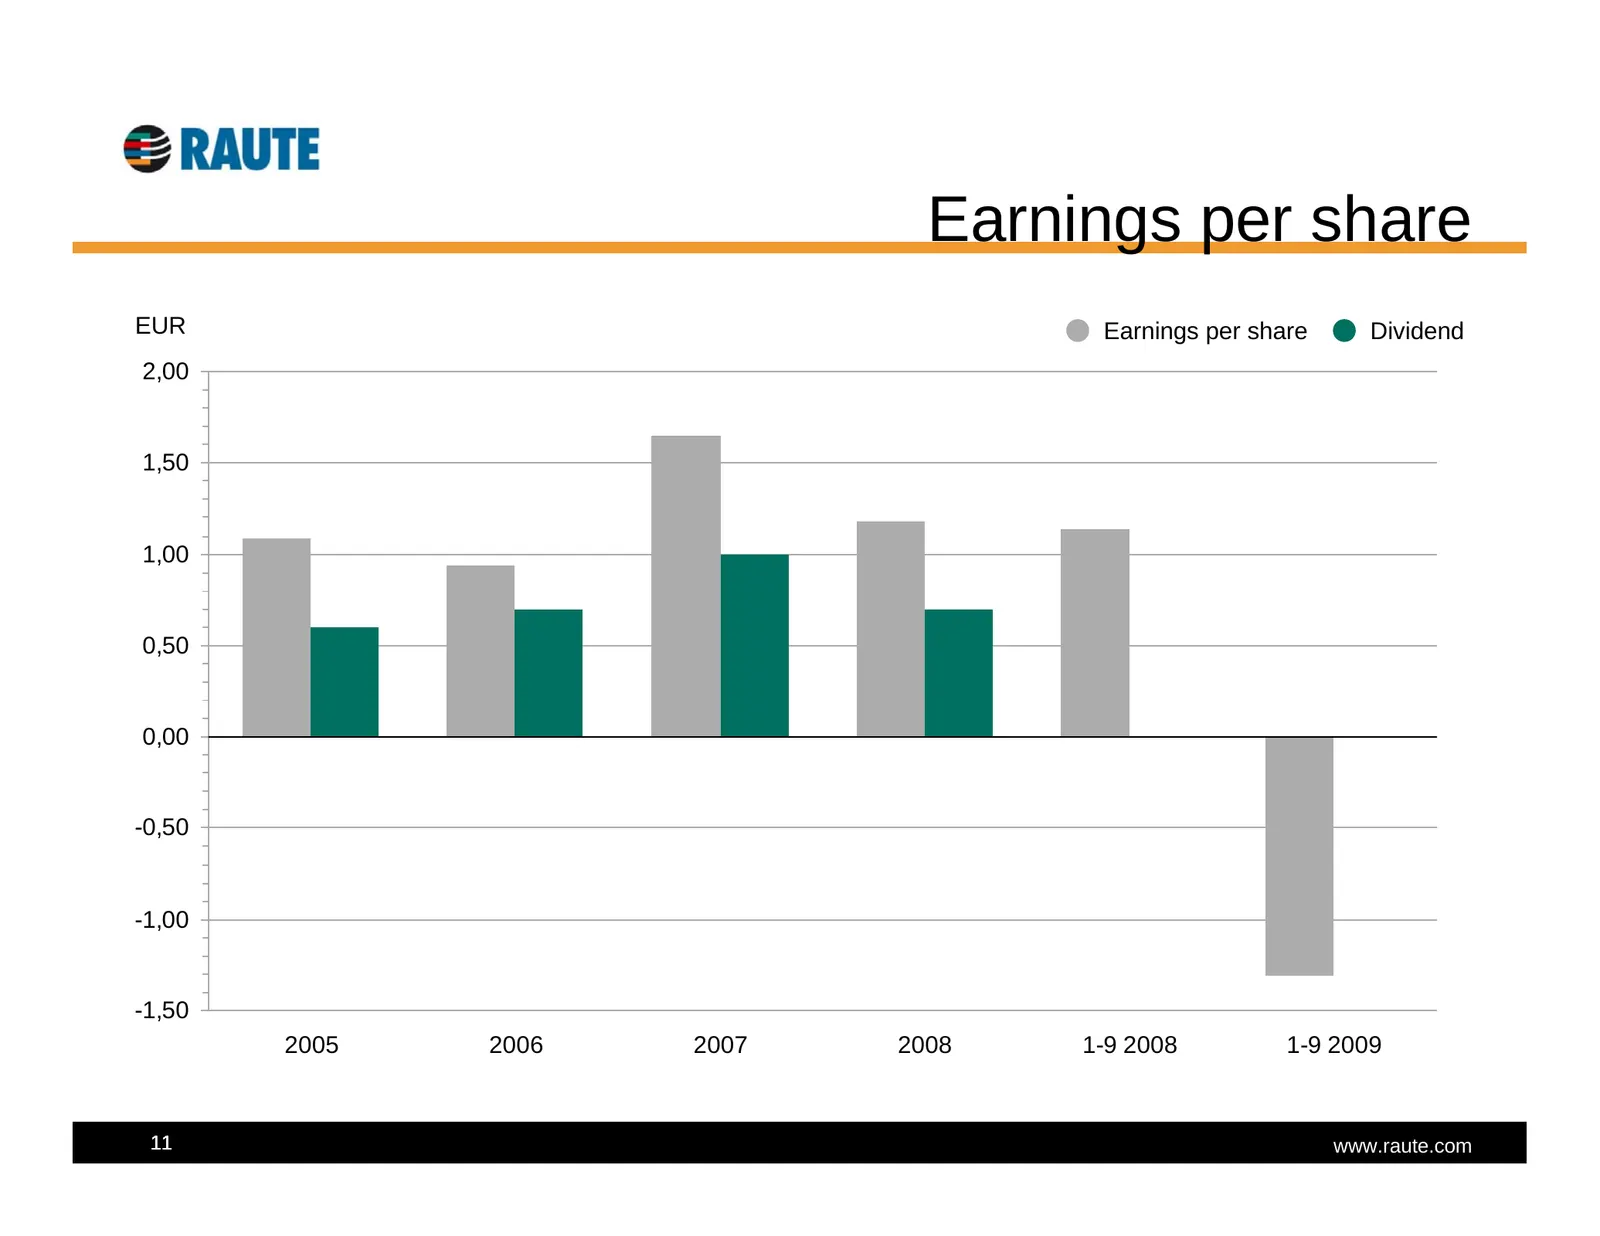
Slide 11: Earnings per share
Earnings per share EUR Earnings per share Dividend 2,00 1,50 1,00 0,50 0,00 -0,50 -1,00 -1,50 2005 2006 2007 2008 1-9 2008 1-9 2009 11 www.raute.com
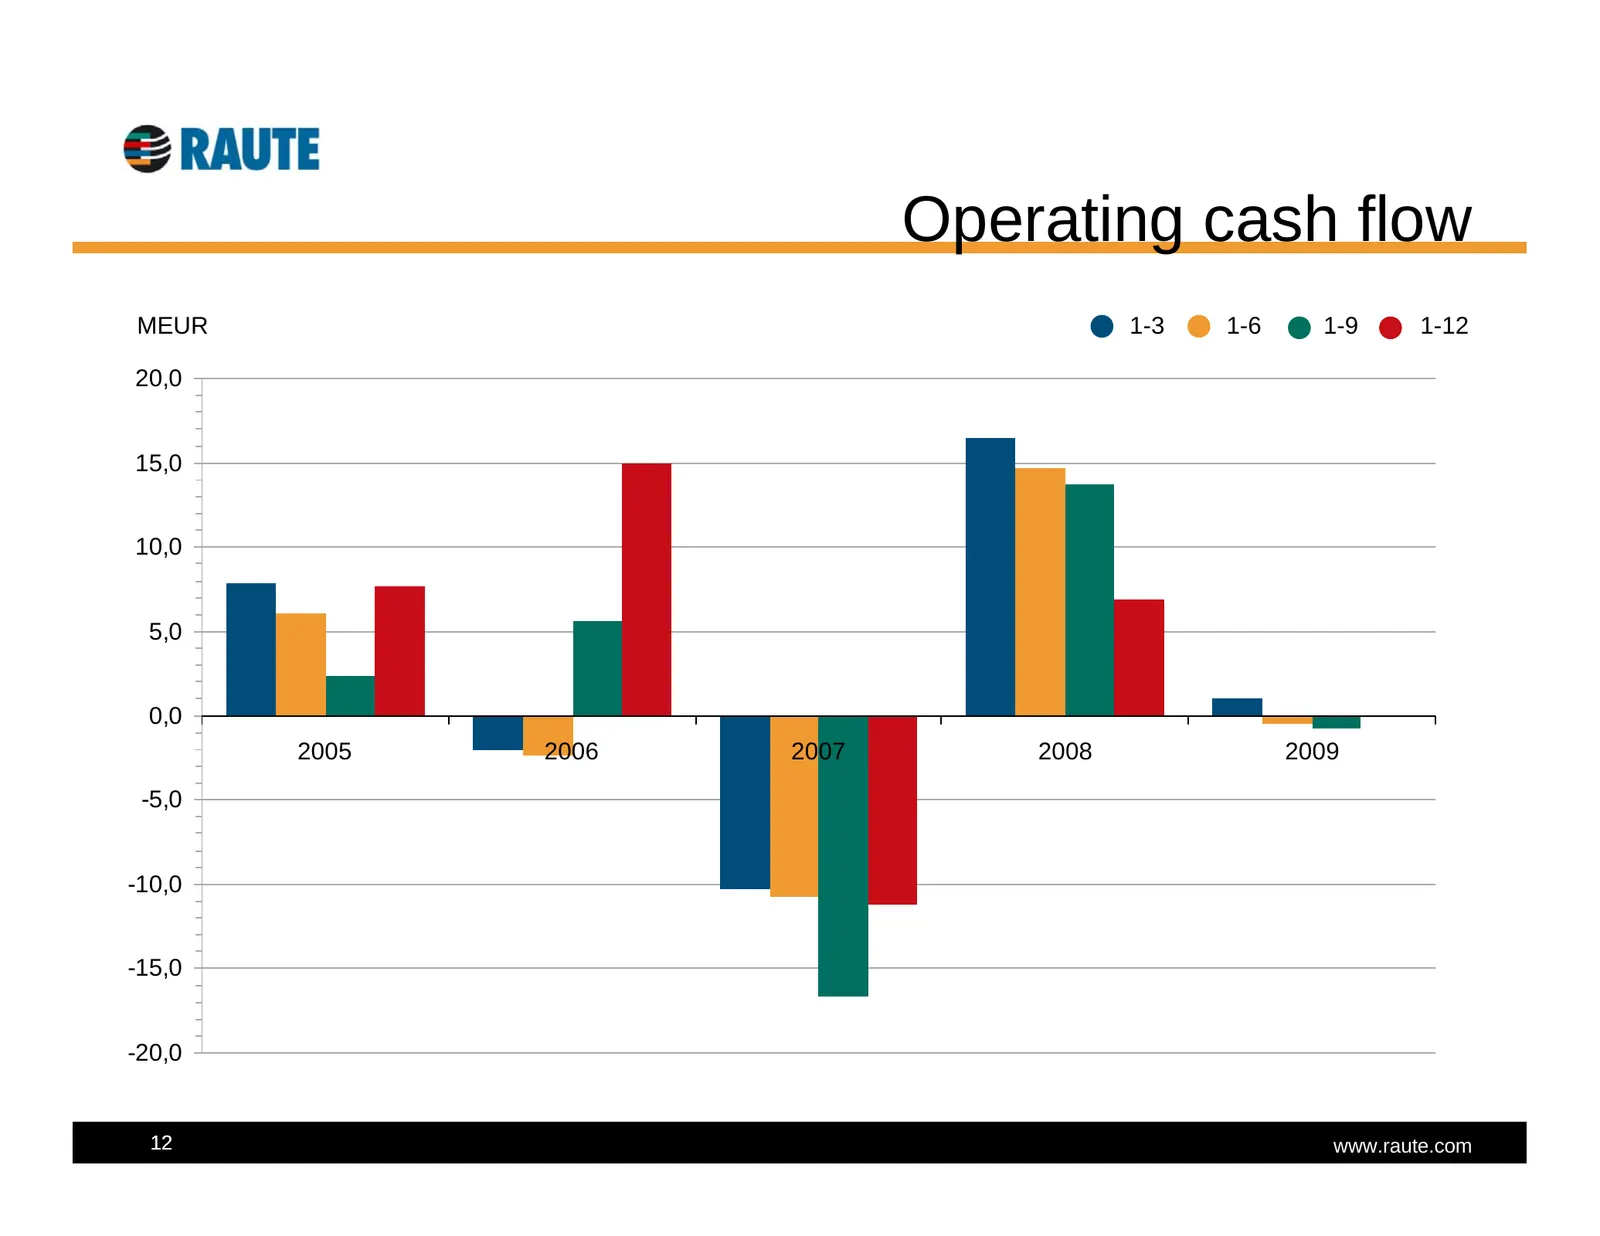
Slide 12: Operating cash flow
Operating cash flow MEUR 1-3 1-6 1-9 1-12 20,0 15,0 10,0 5,0 0,0 2005 2006 2007 2008 2009 -5,0 -10,0 -15,0 -20,0 12 www.raute.com
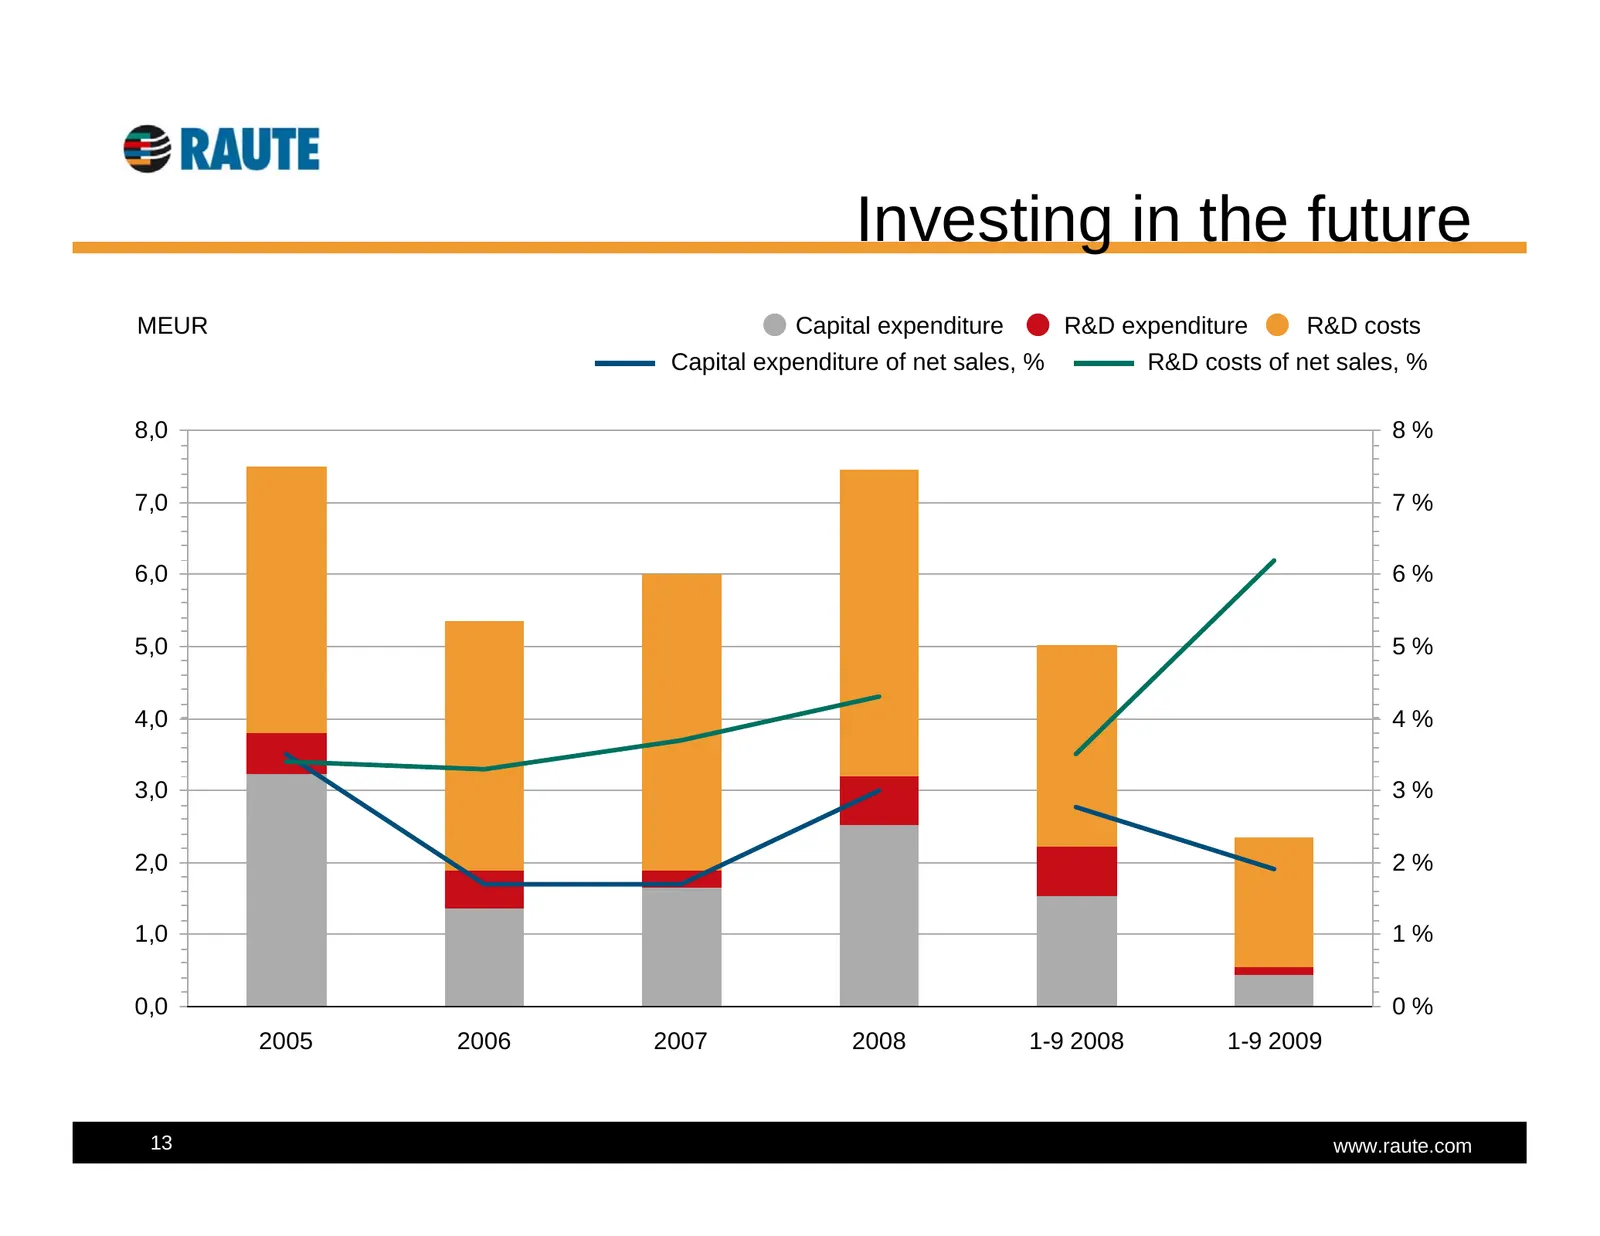
Slide 13: Investing in the future
Investing in the future MEUR Capital expenditure R&D expenditure R&D costs Capital expenditure of net sales, % R&D costs of net sales, % 8,0 8% 7,0 7% 6,0 6% 5,0 5% 4,0 4% 3,0 3% 2,0 2% 1,0 1% 0,0 0% 2005 2006 2007 2008 1-9 2008 1-9 2009 13 www.raute.com
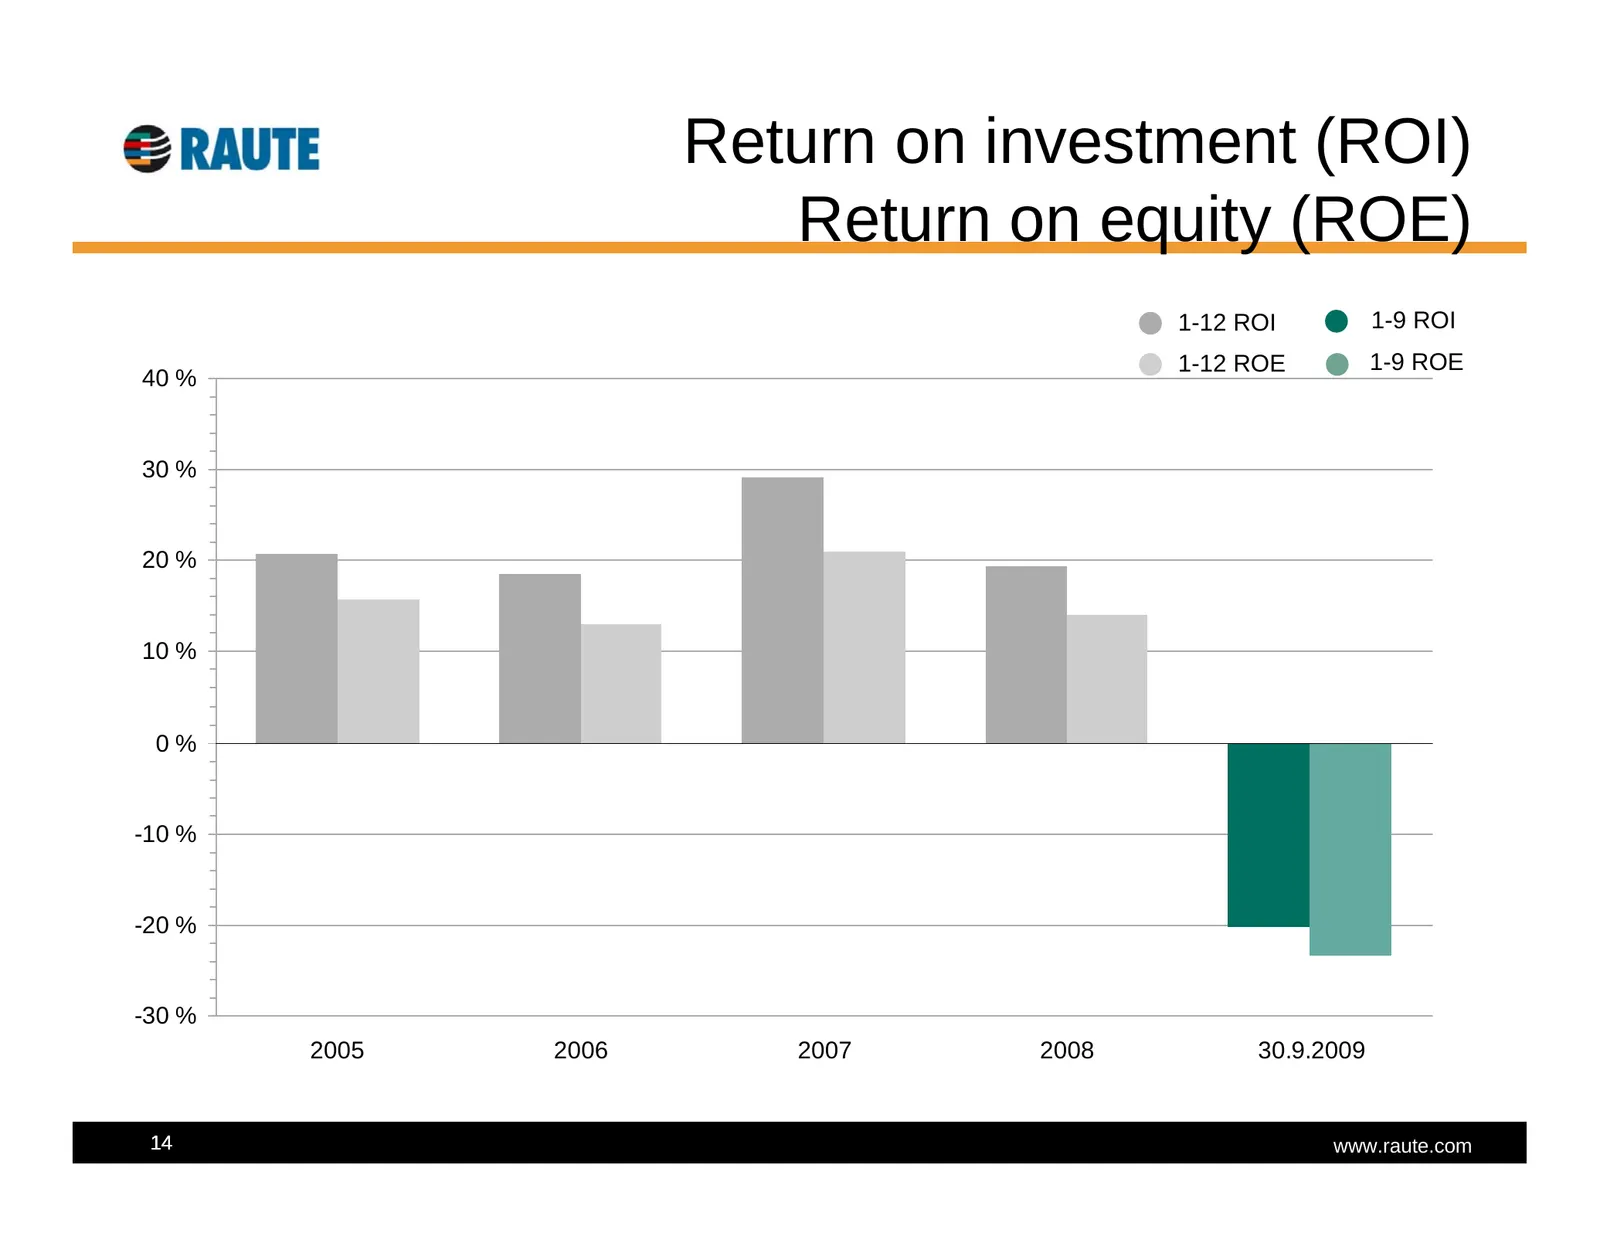
Slide 14: Return on investment (ROI) Return on equity (ROE)
Return on investment (ROI) Return on equity (ROE) 1-12 ROI 1-9 ROI 1-12 ROE 1-9 ROE 40 % 30 % 20 % 10 % 0% -10 % -20 % -30 % 2005 2006 2007 2008 30.9.2009 14 www.raute.com
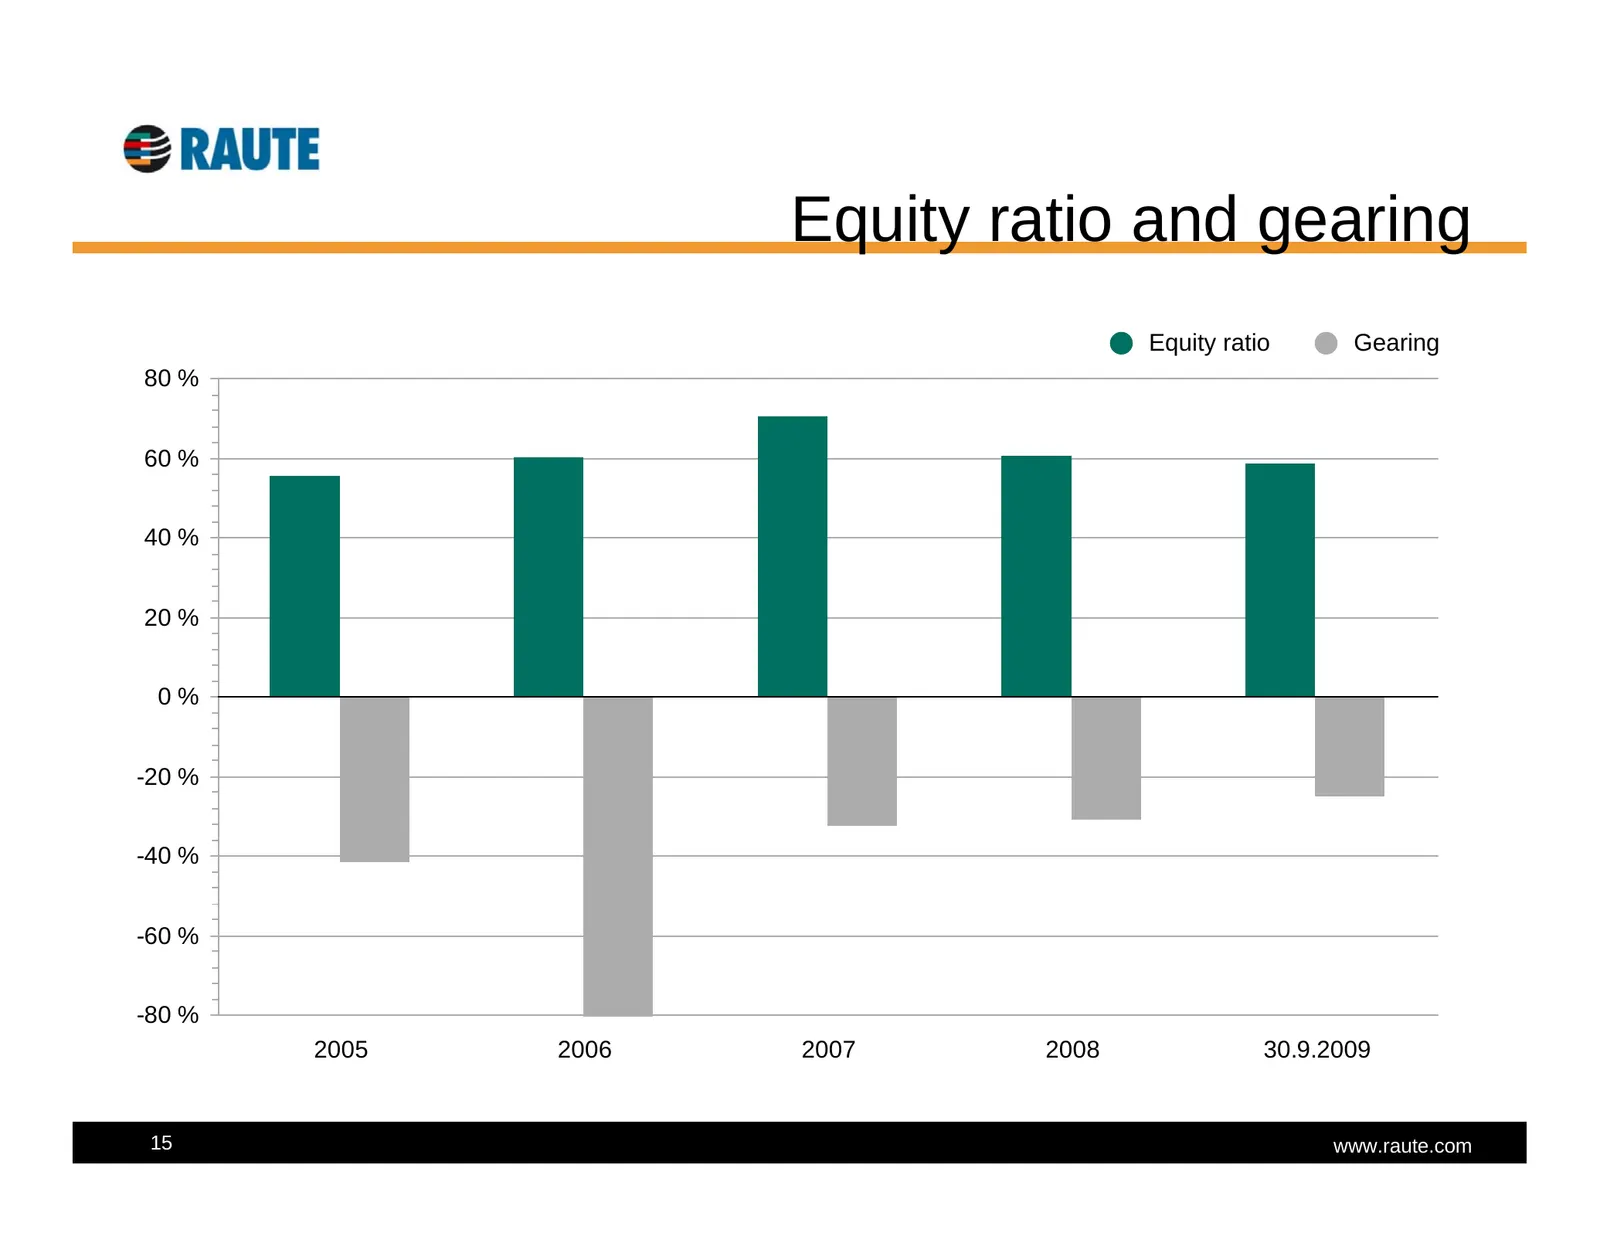
Slide 15: Equity ratio and gearing
Equity ratio and gearing Equity ratio Gearing 80 % 60 % 40 % 20 % 0% -20 % -40 % -60 % -80 % 2005 2006 2007 2008 30.9.2009 15 www.raute.com
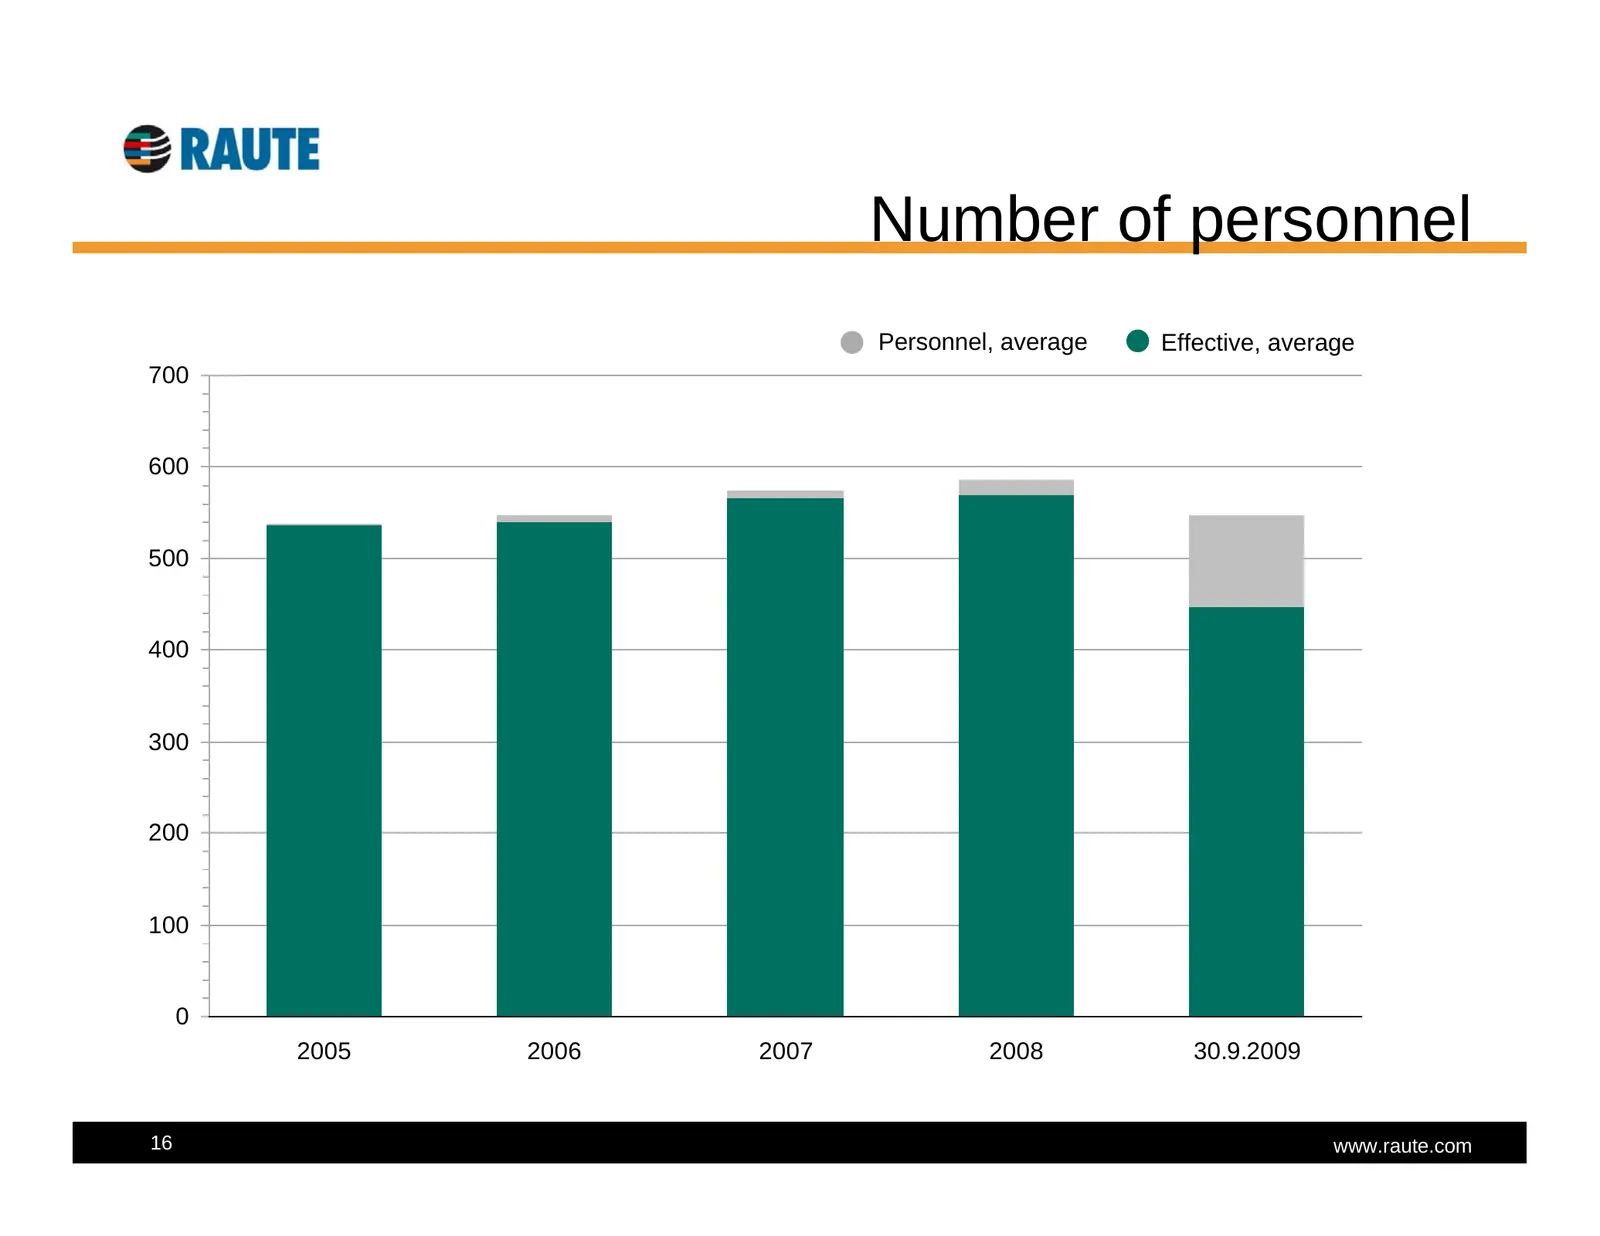
Slide 16: Number of personnel
Number of personnel Personnel, average Effective, average 700 600 500 400 300 200 100 0 2005 2006 2007 2008 30.9.2009 16 www.raute.com
Slide 17: Shareholders
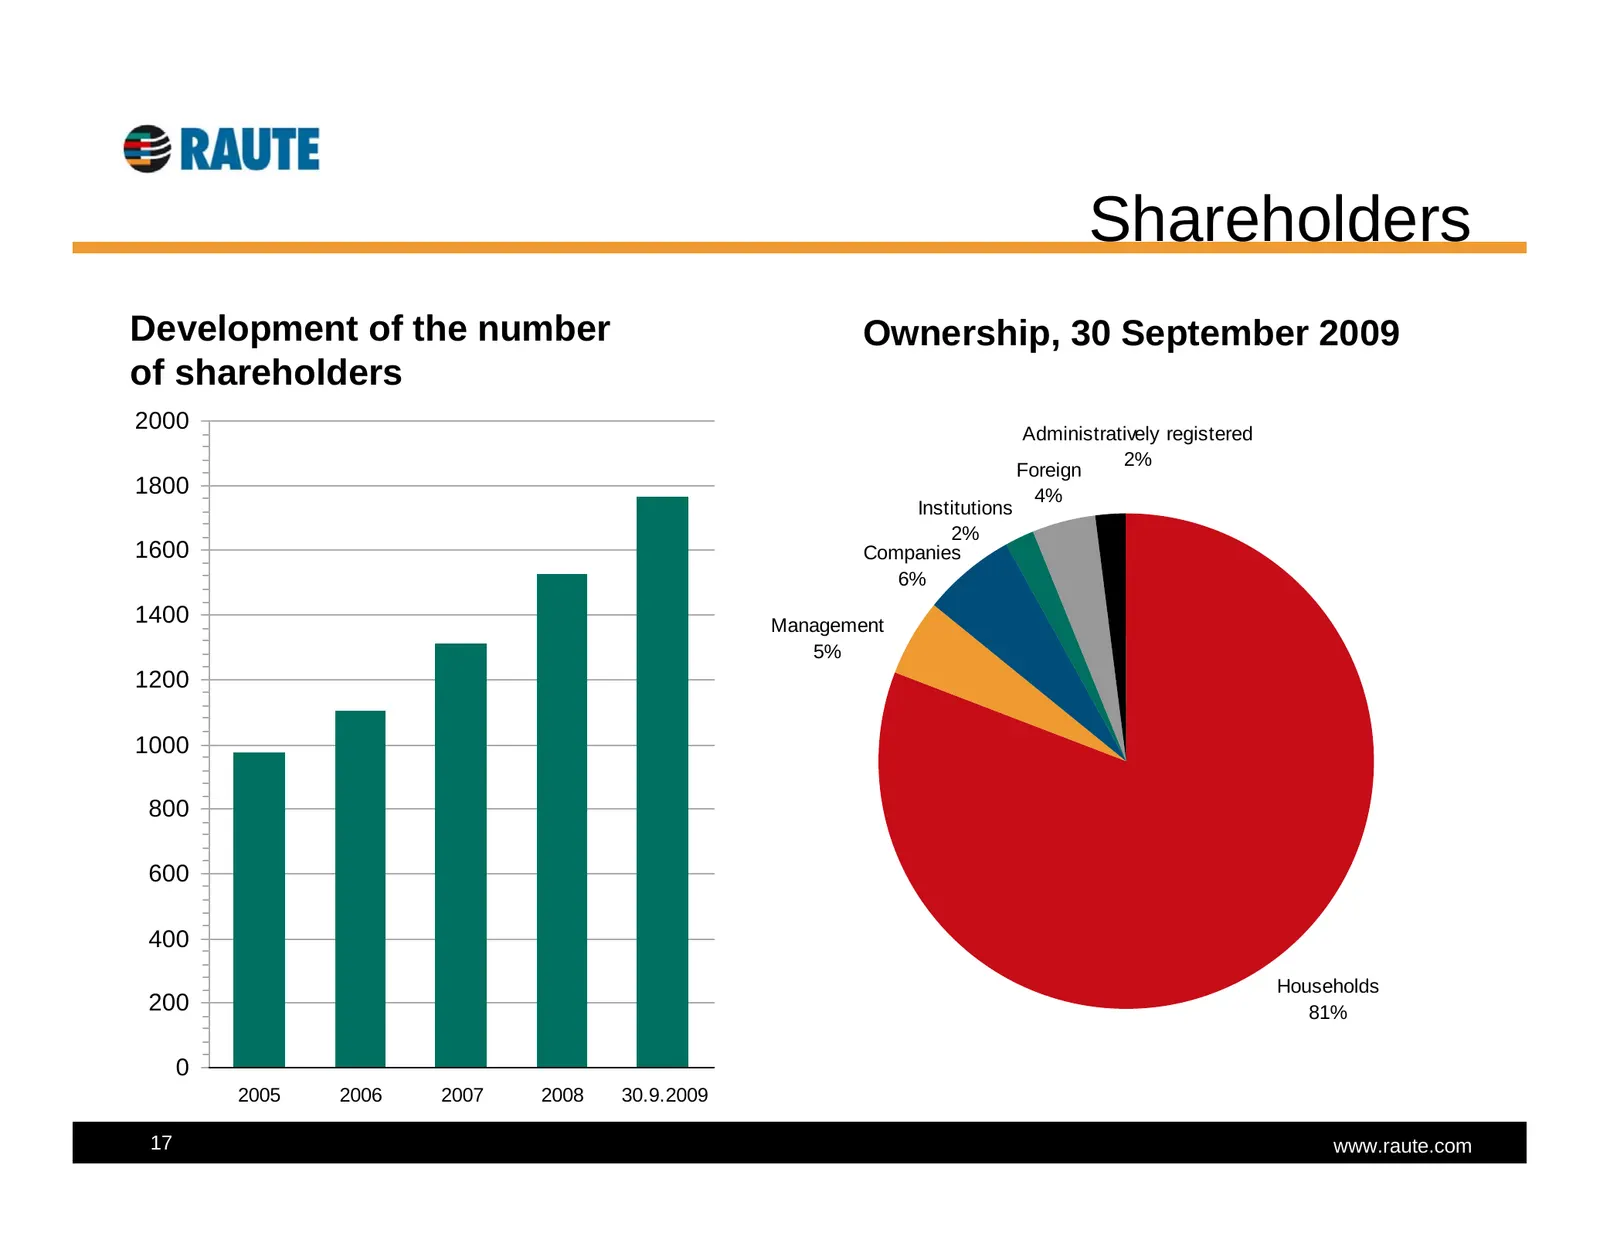
Shareholders Development of the number Ownership, 30 September 2009 of shareholders 2000 Administratively registered 2% Foreign 1800 4% Institutions 2% 1600 Companies 6% 1400 Management 5% 1200 1000 800 600 400 Households 200 81% 0 2005 2006 2007 2008 30.9.2009 17 www.raute.com
Slide 18: Market value
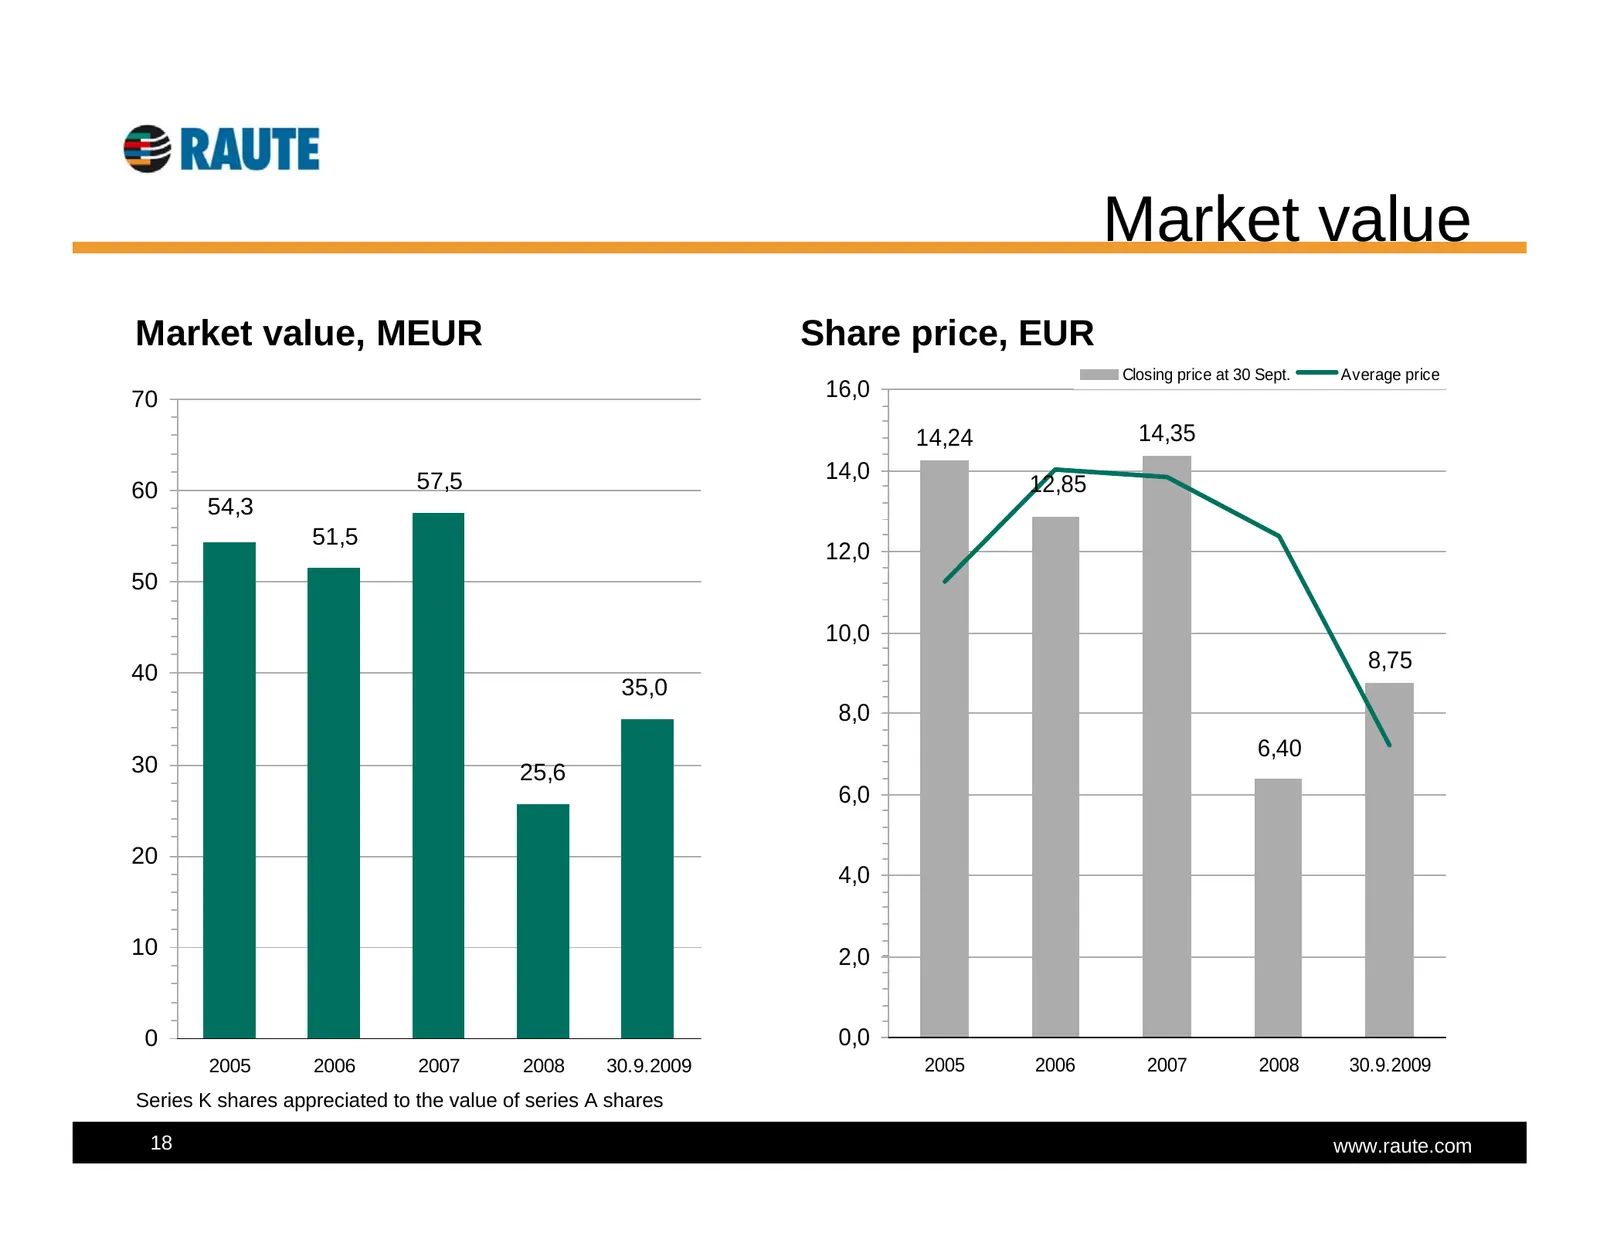
Market value Market value, MEUR Share price, EUR Closing price at 30 Sept. Average price 70 16,0 14,24 14,35 57,5 14,0 60 12,85 54,3 51,5 12,0 50 10,0 40 8,75 35,0 8,0 6,40 30 25,6 6,0 20 4,0 10 2,0 0 0,0 2005 2006 2007 2008 30.9.2009 2005 2006 2007 2008 30.9.2009 Series K shares appreciated to the
Slide 19: Outlook for 2009
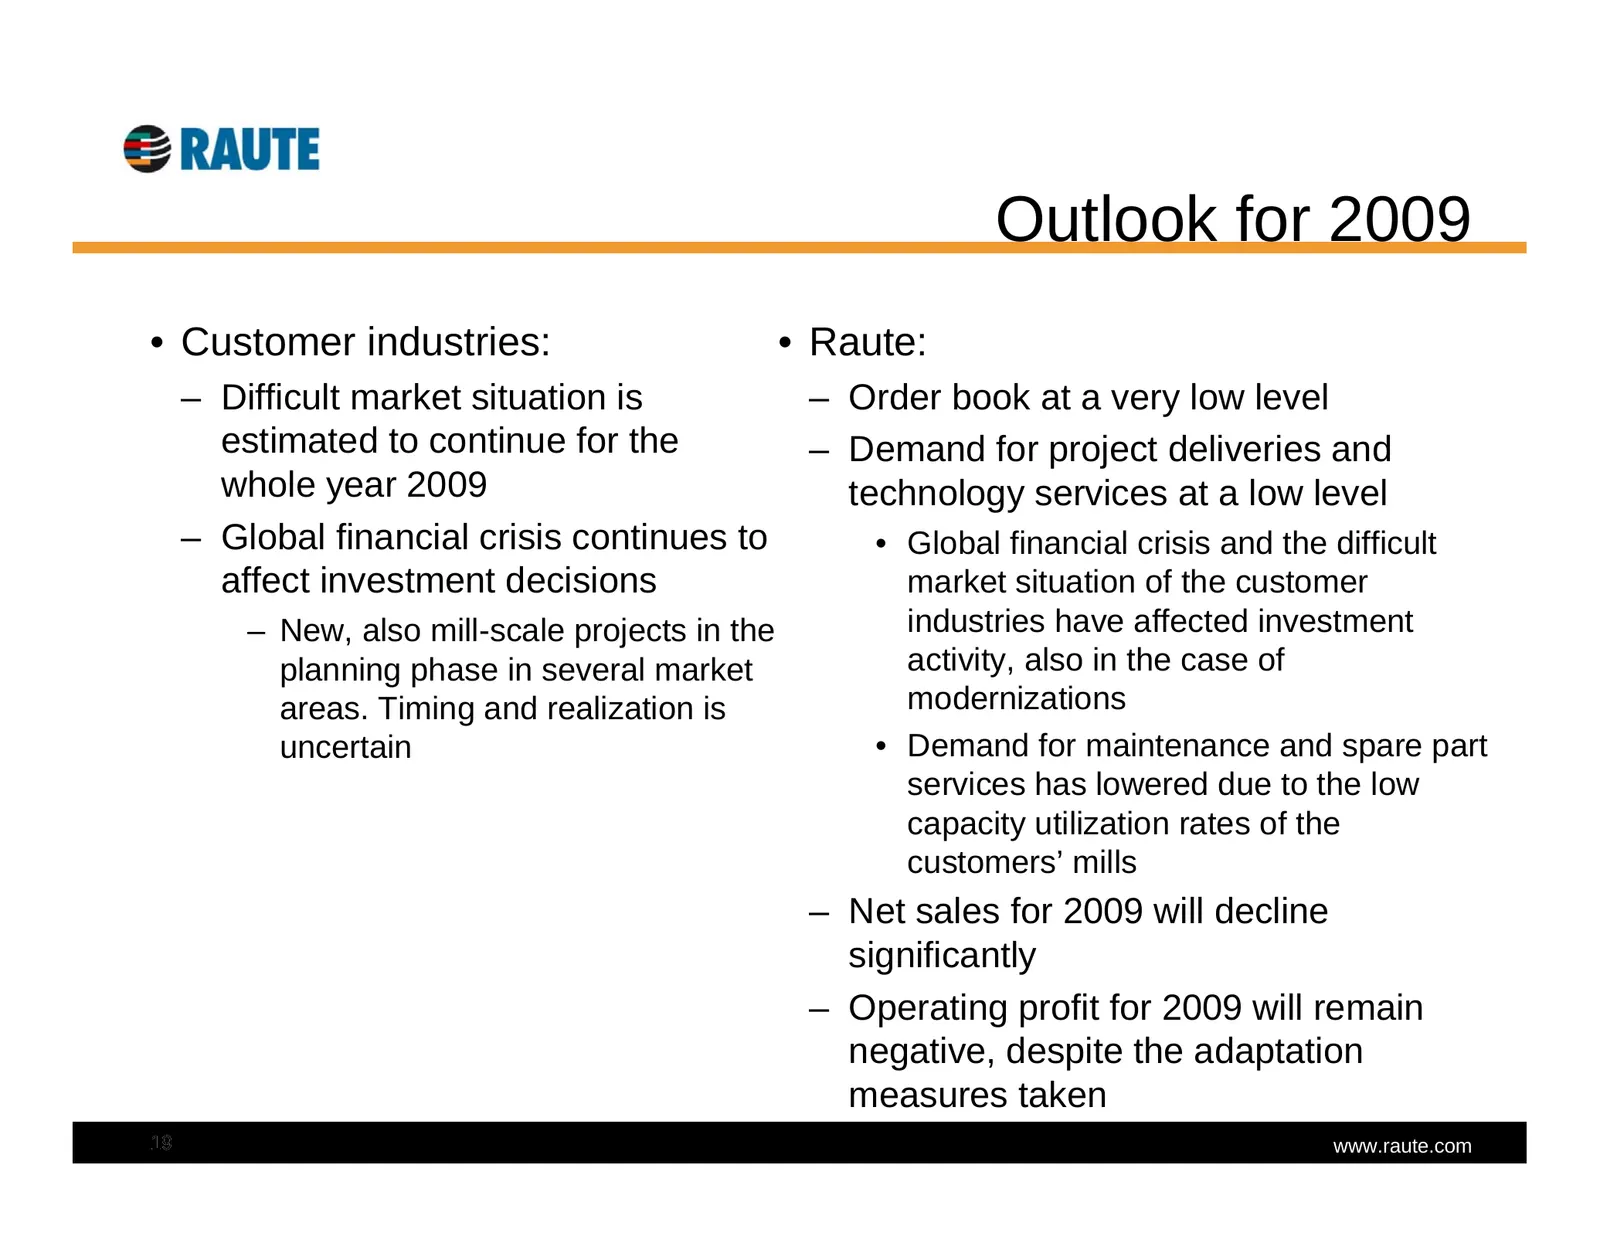
Outlook for 2009 • Customer industries: • Raute: – Difficult market situation is – Order book at a very low level estimated to continue for the – Demand for project deliveries and whole year 2009 technology services at a low level – Global financial crisis continues to • Global financial crisis and
Slide 20: Contact information
Contact information Tapani Kiiski President and CEO +358 400 814 148 tapani.kiiski@raute.com Arja Hakala CFO +358 400 710 387 arja.hakala@raute.com www.raute.com
Source: Internet Archive copy of raute.com
More decks from Raute Oyj Class A
 H1 2026 Earnings Presentation29 slides · Aug 12, 2026
 Q1 2026 Earnings Presentation29 slides · May 7, 2026
 FY2025 Earnings Presentation30 slides · Feb 12, 2026
 Q3 2025 Earnings Presentation29 slides · Oct 30, 2025
 H1 2025 Earnings Presentation29 slides · Aug 12, 2025
 Q1 2025 Earnings Presentation29 slides · May 7, 2025