Allegiance Bancshares — Investor Presentation (December 2015)
16 slides from Allegiance Bancshares's investor presentation, Dec 14, 2015
Slide 1: Investor Presentation December 2015
“Jl" AllegianceBancshares NASDAQ: ABTX Investor Presentation December 2015
Slide 2: Safe Harbor Statement
Safe Harbor Statement = “Safe Harbor pects,” “anticipates,” “intends,” ‘projects,’ ‘estimates,’ \” ‘should, “would,” “may” and actors a 424(b)(4) Foim $-1 36) that We AllegianceBancshares, Inc.
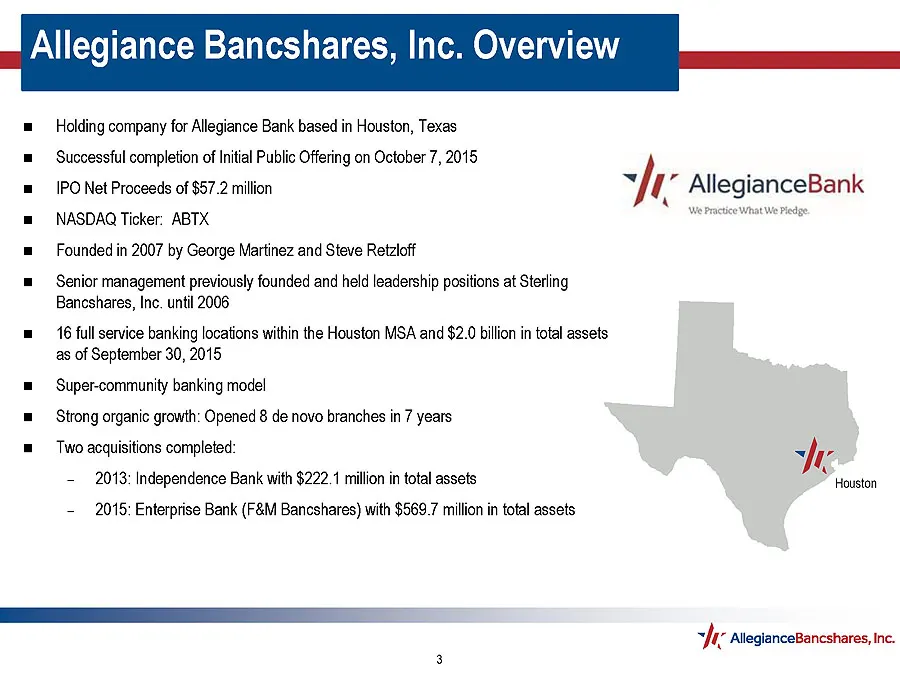
Slide 3: Allegiance Bancshares, Inc. Overview
Allegiance Bancshares, Inc. Overview a Texas m= IPONet Proceeds of $57.2 million Wh ” AllegianceBank = NASDAQ Ticker: ABTX We racic Wedge . ; = Senior management previ Bancshares, Ine. until 2006 as of September 30, 2015 = Super-community banking model = Two acquisitions completed: / & a Lie oF Hous
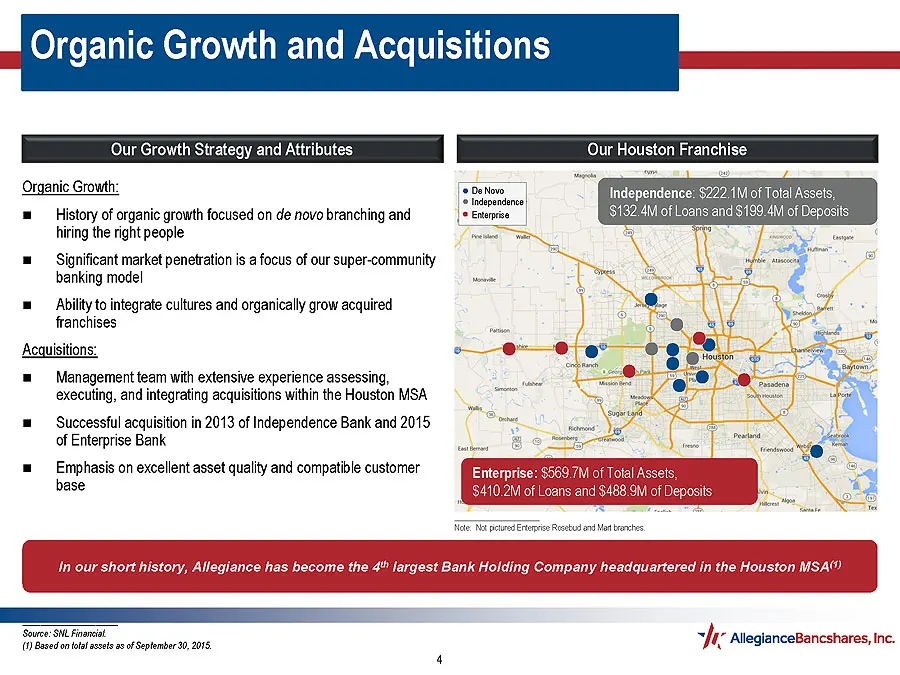
Slide 4: Organic Growth and Acquisitions
Organic Growth and Acquisitions Our Growth Strategy and Attributes Our Houston Franchise Organic Growth: . $222.1M of Total hiring the right people banking model franchises Acauisitions: = Management team with extensive experience assessing, executing, and integrating acquisitions within the Houston
Slide 5: Experienced Leadership
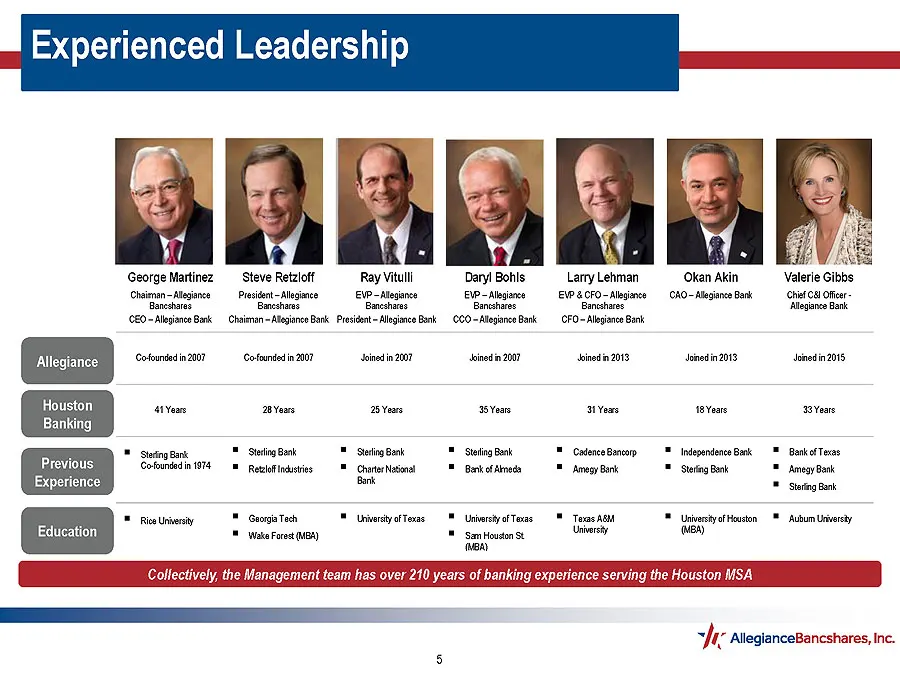
Experienced Leadership iE Fal G yy fed i 2, HEY y ee she George Martinez Steve Retaloff Ray Vtul DarBotls —LaryLehman Okan Aki Valerle Gibbs Otsinn-AleincePig-Aasne EPA Aine SIPEEFO“ Mies 10-Aasion kU sae poring unten meh Smens ea “hibit Chinn Age Bak Pr Ages Be 600 Mogre Bok FO Ao Sink Cofaniein26?
Slide 6: Our Super-community Banking Strategy
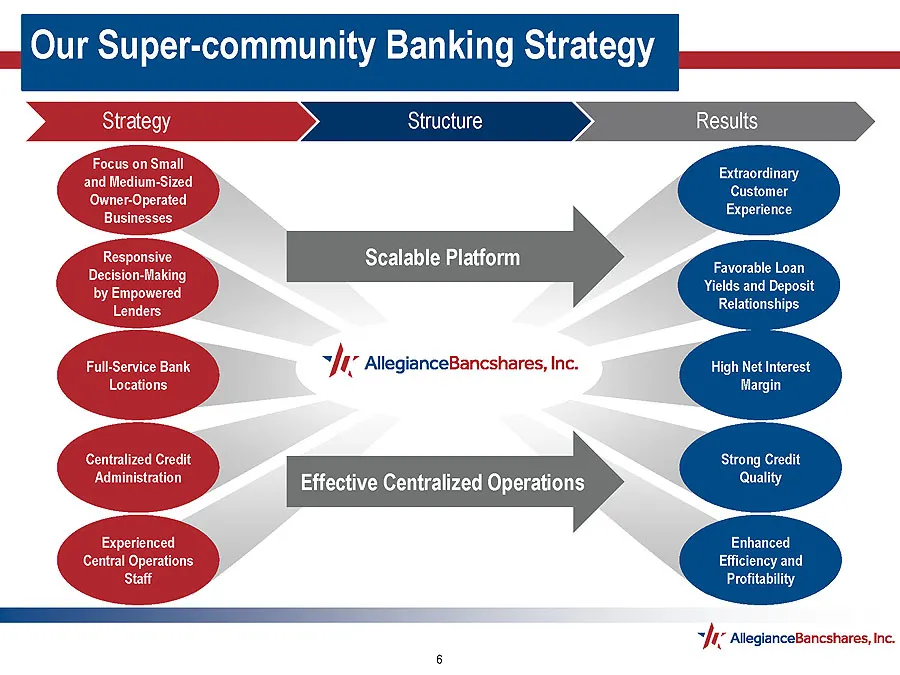
Our Super-community Banking Strategy Extraordinary Customer Experience Scalable Platform Favorable Loa Yields and Deposit Relationships AllegianceBancsha High Net Interest Margin Strong Credit Effective Centralized Operations ually, Enhanced Efficiency and Profitability Jy Allegiancet
Slide 7: Financial Highlights
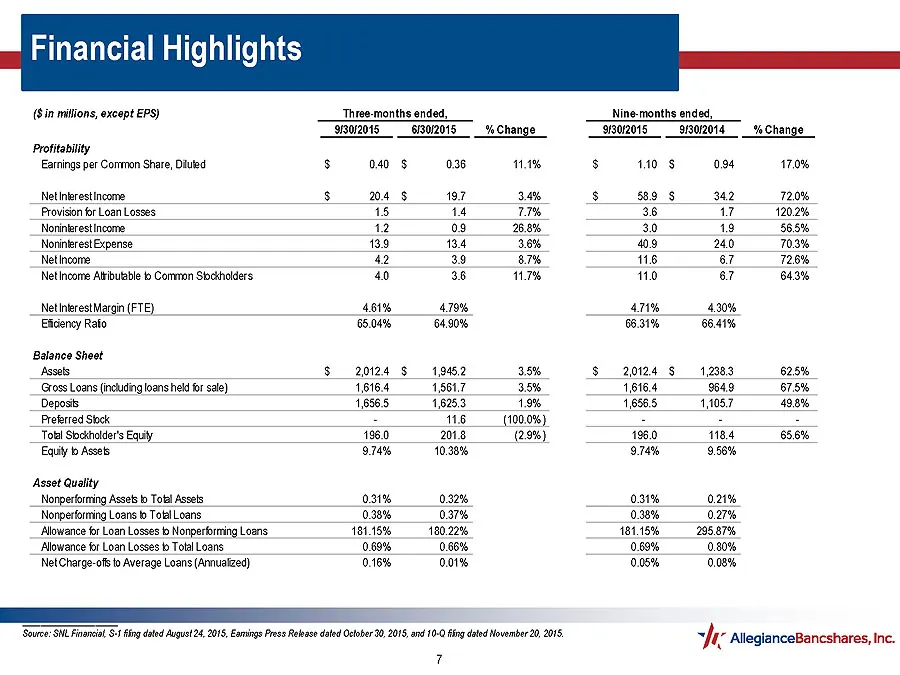
Financial Highlights (Sin mitions, except EPS) Three-months ended, Nine-months ended, 973012015 61302015 __ % Change ‘302015 _ 91802018 __% Change Profitability Earnings per Common Share, Diluted S040 $038 11.1% Ss 10 $084 170% Inierestincome Sas t97 3.4% S89 $342 720 rove fron Loree 15 14 7.7% 36 4
Slide 8: Historical Balance Sheet Growth
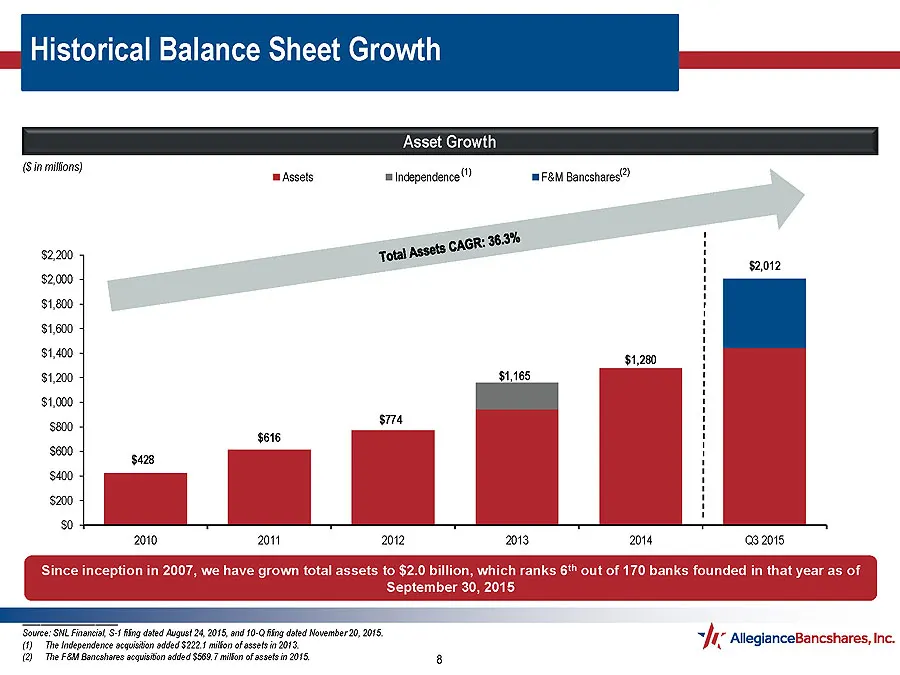
Historical Balance Sheet Growth (Sinmitfons) Assets 1 Independence” ‘F&M Bancshares sz Foal Assets CAGR: 36.3% $2,012 $1,200 $1,200 $1,165 $616 2010 2011 2012 2013 2014 82015, ng dtd August 24, 2015, ond 10-0 ng dated Novenber20, 206 4 an “nea vn ie! toe (2) The Fadl Bancshares sousion added $560.7
Slide 9: Continued Organic Loan Growth
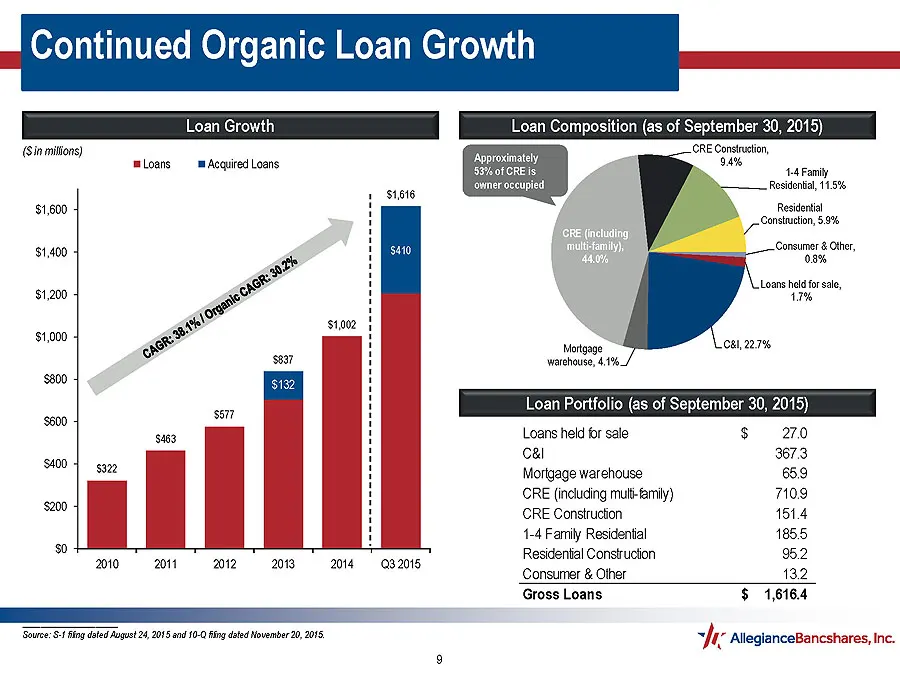
Continued Organic Loan Growth ‘oan Growth Loan Composition (as of September 30, 2015) ; oC (Siamilions) ion Loans m Acquired Loans asta’ ‘onmer occupied ——__Rosidonal, 11.5% s1616 $1,600 , Resident constuction, 58% - ¥ Consuar & ter, $1,400 mae $1,200 1% $1002 sr009 Motgage Cal, 22.7% warehause, 4.1
Slide 10: Strong Credit Quality
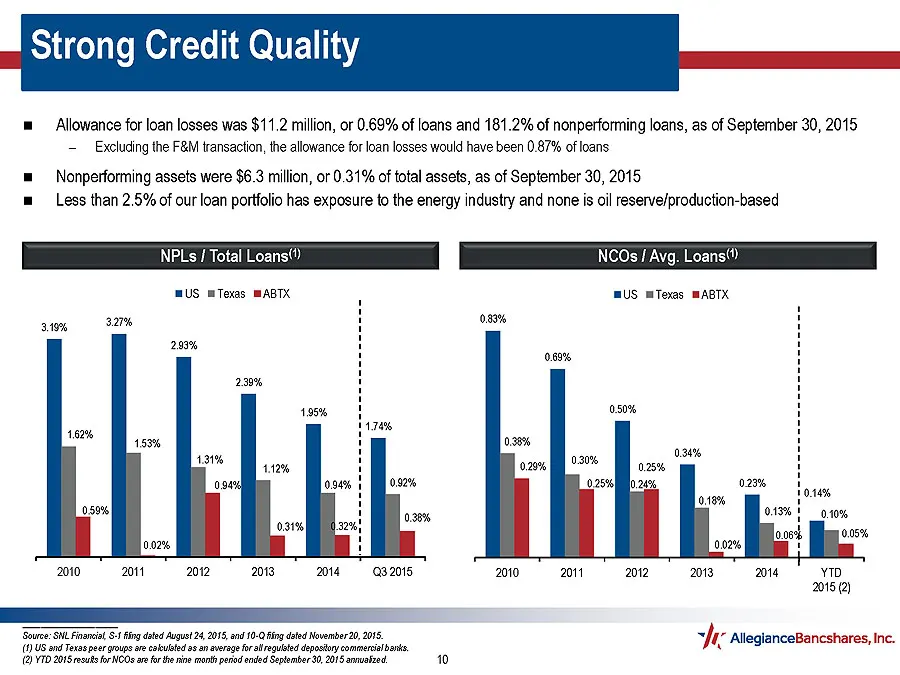
Strong Credit Quality 1% of total assets, as of September 30, 2015 NPLs / Total Loans‘) NCOs / Avg. Loans“ US mTexas MABTX MUS mTexas MABTX 2010 2011 2012 2013, ora 082015, 2010 201 2012 2013 214 yD 2015 (2) Toe mei ly tt opt 2095 eb 1g ted ete 8. she atesancoBaneshares ne Ge enng geen tm aepensane
Slide 11: Improved Deposit Sourcing and Composition
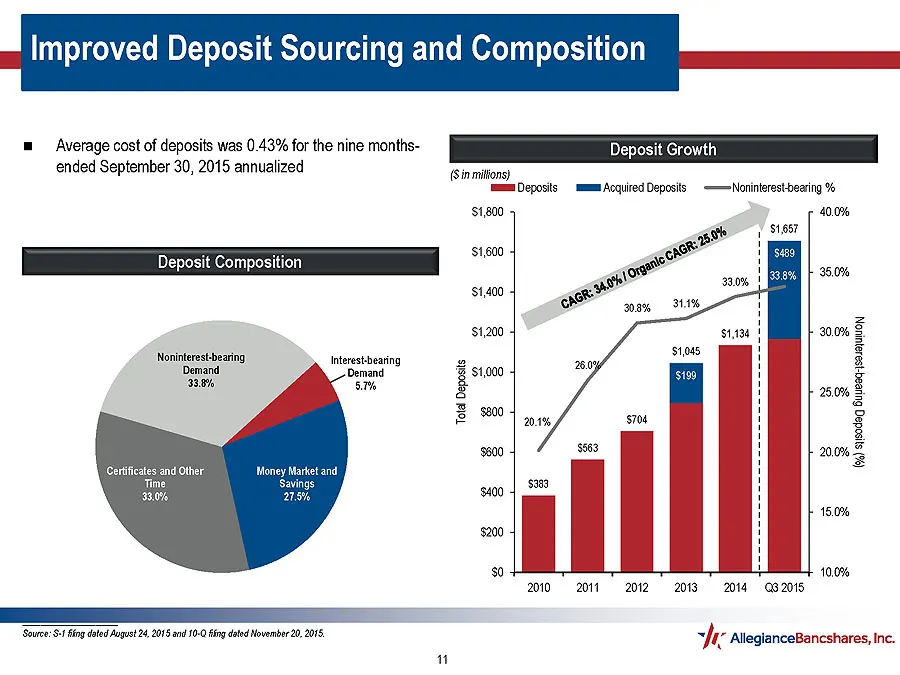
Improved Deposit Sourcing and Composition Deposit Growth ended September 30, 2015 annualized Te) Deposits mM Acquired Deposits +——=Noninterest-bearing % 800 o% a se 1.600 1 Deposit Composition eo ' eso 1400 eo A 20.8% 1.00 soon § Noninterest-be H vintrst bearing iterestbeang 2 FI Demand Demand % $1,
Slide 12: Net Interest Income Growth and Improved Efficiency
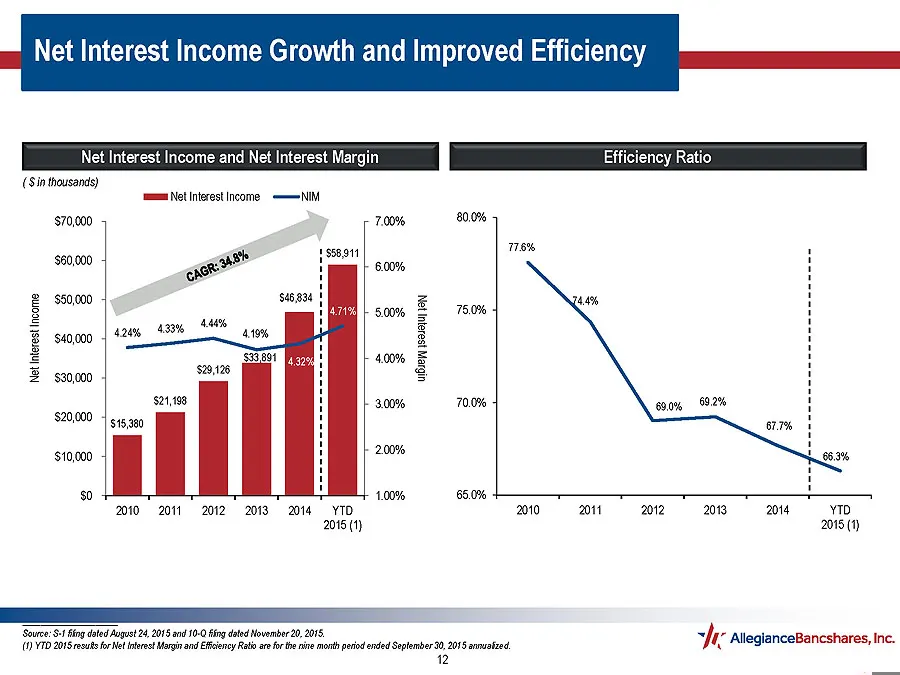
Net Interest Income Growth and Improved Efficiency Net Interest Income and Net Interest Margin Efficiency Ratio (Sin thousands) ‘mm Net Interest Income —=NIM $70,000 Sa 178% 75.0% Net Interest Income FS 8 uuBreys6.eU aN 10 20 2012-2013 214 YTD yIo 2016 (1) 2015 (1) ‘Source: $-1 fing dated August 24,
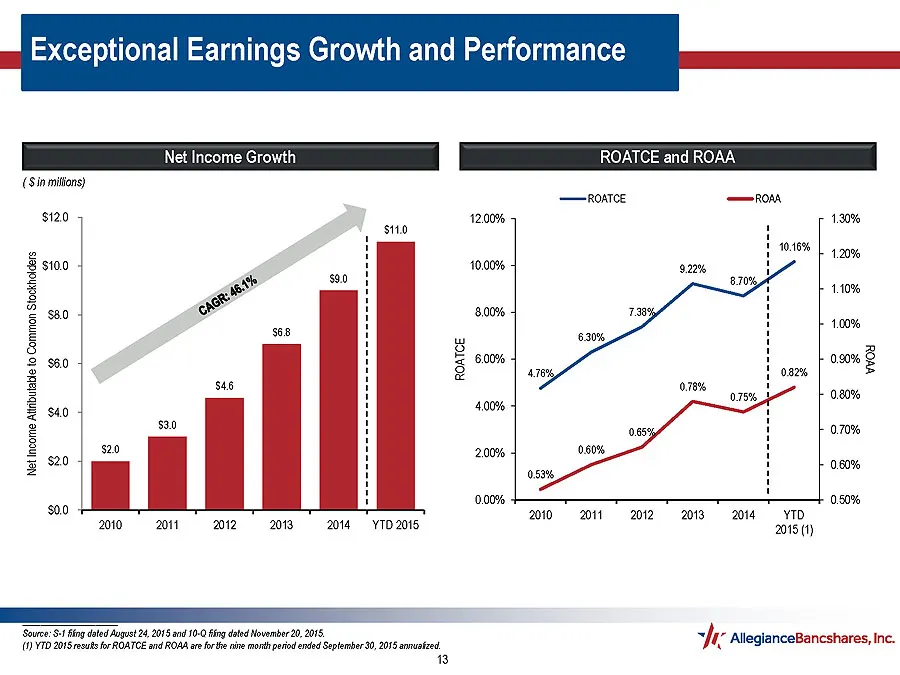
Slide 13: Exceptional Earnings Growth and Performance
Exceptional Earnings Growth and Performance Net Income Growth ROATCE and ROAA (Sinmions) —roatoe $120 120% g $ sioo 10.00% F g 880 800% g 8 8 = 600% 2 90 F a 2 suo 400% i £ 2.00% 5 920 210 it 20120130 “yD 2018(1) ‘Source: $-1 fing dated August 24,2015 and 10-0 fing dated November 20,2015. / - (1) ¥1
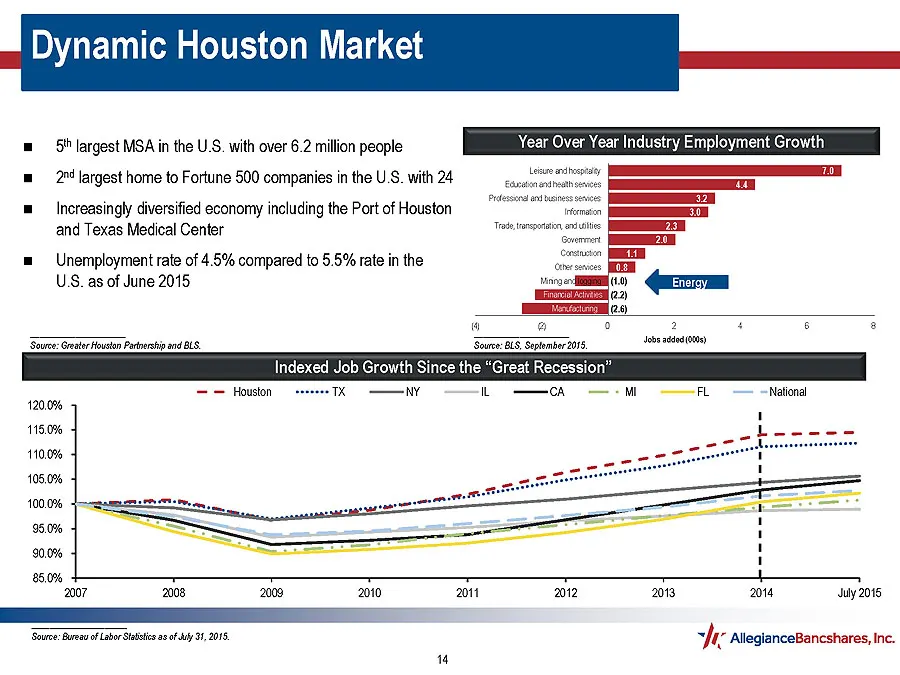
Slide 14: Dynamic Houston Market
Dynamic Houston Market ' i il Year Over Year Industry Employment Growth . and Texas Medical Center P| U.S. as of June 2015, @ ° 2 ‘Seare:Greatr Houston Parsi ond BLS. Scare: BLS Soplober 2015 ba tied) Indexed Job Growth Since the “Great Recession” = = Houston esses TX NY, Lo CA ML National 2008 2000
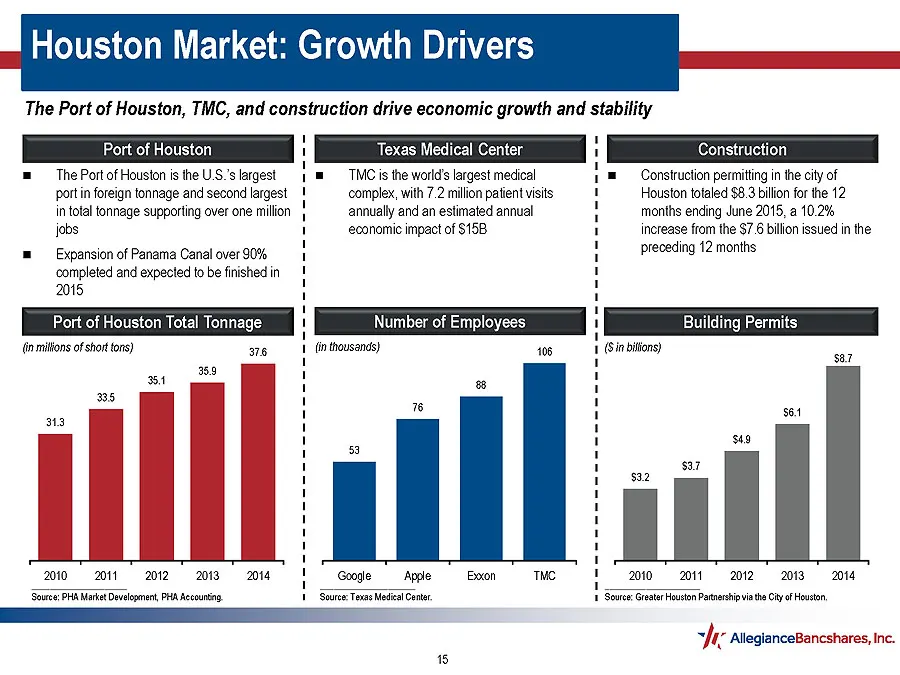
Slide 15: Houston Market: Growth Drivers
ouston Market: Growth Drivers TMC, Port of Houston Texas Medical Center Const m= The Port of Houston is the US's largest TMC is the world’ largest medical = Construction permitting inthe city of port in foreign tonnage and second largest complex, with 7.2 milion patient visits Houston totaled $8 3 b
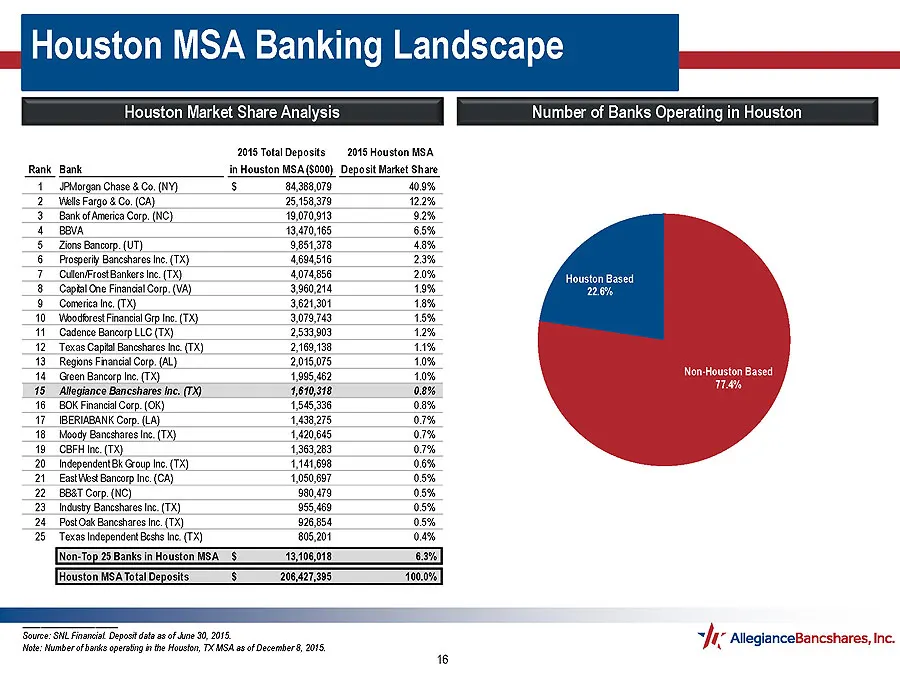
Slide 16: Houston MSA Banking Landscape
Houston MSA Banking Landscape Houston Market Share Analysis Number of Banks Operating in Houston 2015 Total Deposits 2018 Houston MSA Rank Bank in Houston MSA ($000) Deposit Market Share ‘Phlorgan Chase & Co. (NY) 8 84,386 079 409% ies Fargo & Co, (CA) 25,158,379 22% Bank of America Carp, (NC) 19070
Source: SEC EDGAR · 8-K filed Dec 14, 2015
More decks from Allegiance Bancshares Inc
 Q2 2022 Earnings Presentation16 slides · Jul 29, 2022
 Q1 2022 Earnings Presentation19 slides · Apr 28, 2022
 FY2021 Earnings Presentation18 slides · Jan 28, 2022
 Q4 2021 Earnings Presentation19 slides · Jan 28, 2022
 Merger or Acquisition (November 2021)28 slides · Nov 8, 2021
 Q3 2021 Earnings Presentation17 slides · Oct 28, 2021