Scatec ASA · OSL:SCATC
Scatec ASA — Q4 2021 Earnings Presentation
27 slides from Scatec ASA's earnings presentation, February 2022
Slide 1: Fourth quarter 2021: High development activity and robust cash flow
Fourth quarter 2021 High development activity and robust cash flow
Slide 2: Disclaimer
Disclaimer The following presentation is being made only to, and is only directed at, persons to whom such presentation may lawfully be communicated (’relevant persons’). Any person who is not a relevant person should not rely, act or make assessment on the basis of this presentation or anything inc
Slide 3: Agenda
Agenda • Project update and market outlook Raymond Carlsen, CEO • Financial review Mikkel Tørud, CFO • Summary Raymond Carlsen, CEO 3
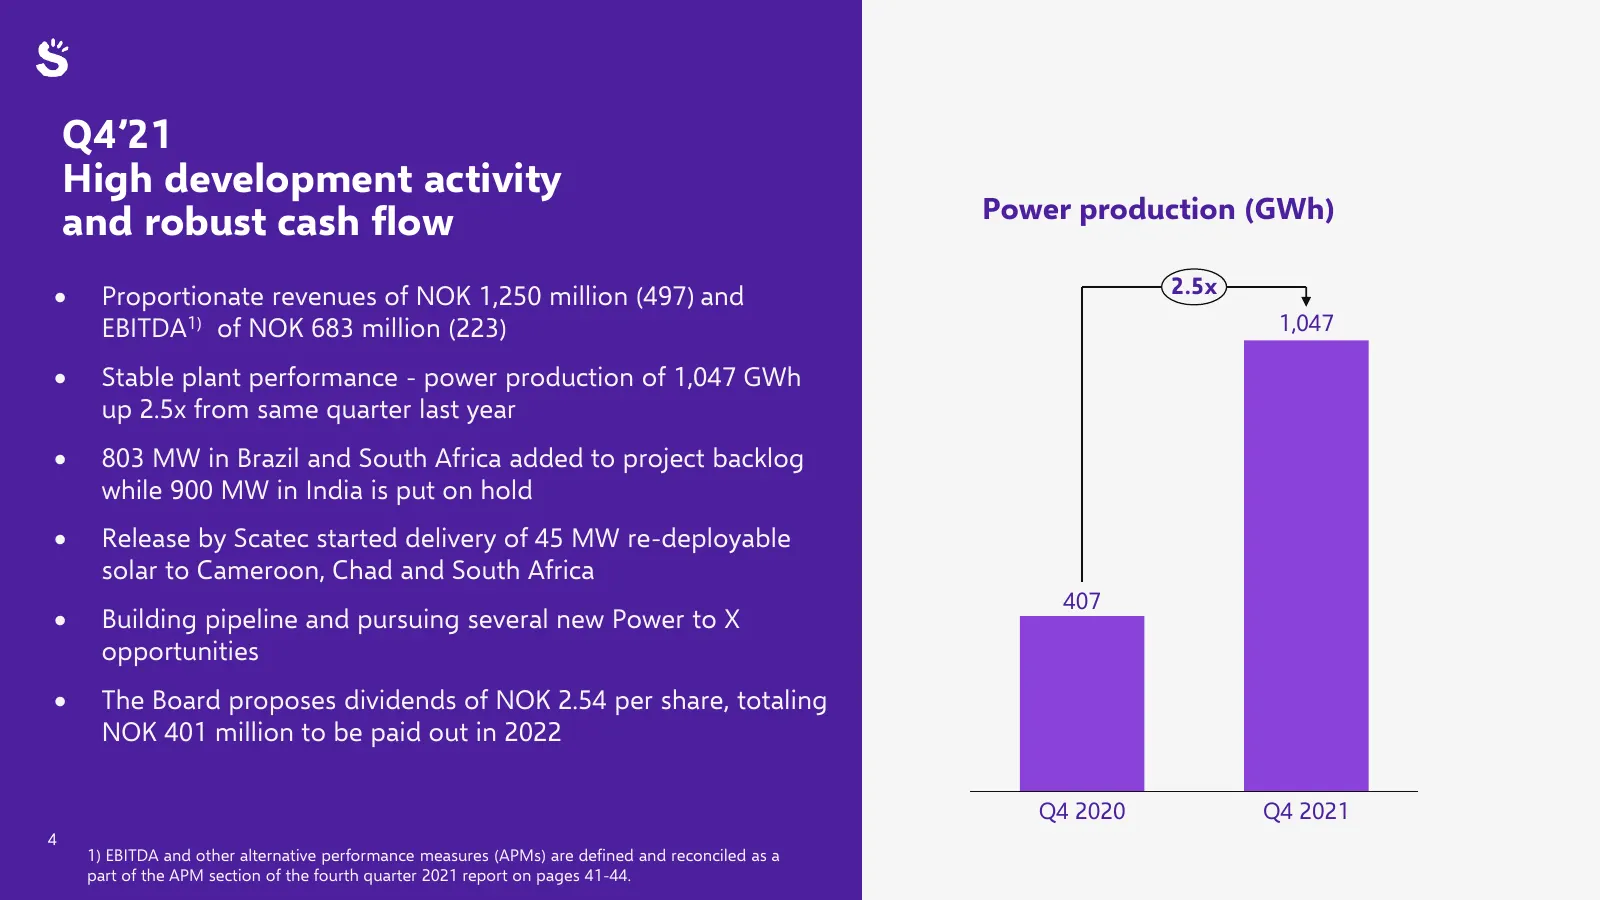
Slide 4: Q4'21 High development activity and robust cash flow
Q4’21 High development activity Power production (GWh) and robust cash flow • Proportionate revenues of NOK 1,250 million (497) and 2.5x EBITDA1) of NOK 683 million (223) 1,047 • Stable plant performance - power production of 1,047 GWh up 2.5x from same quarter last year • 803 MW in Brazil and South
Slide 5: 2021 Summary: Strong production- and pipeline growth
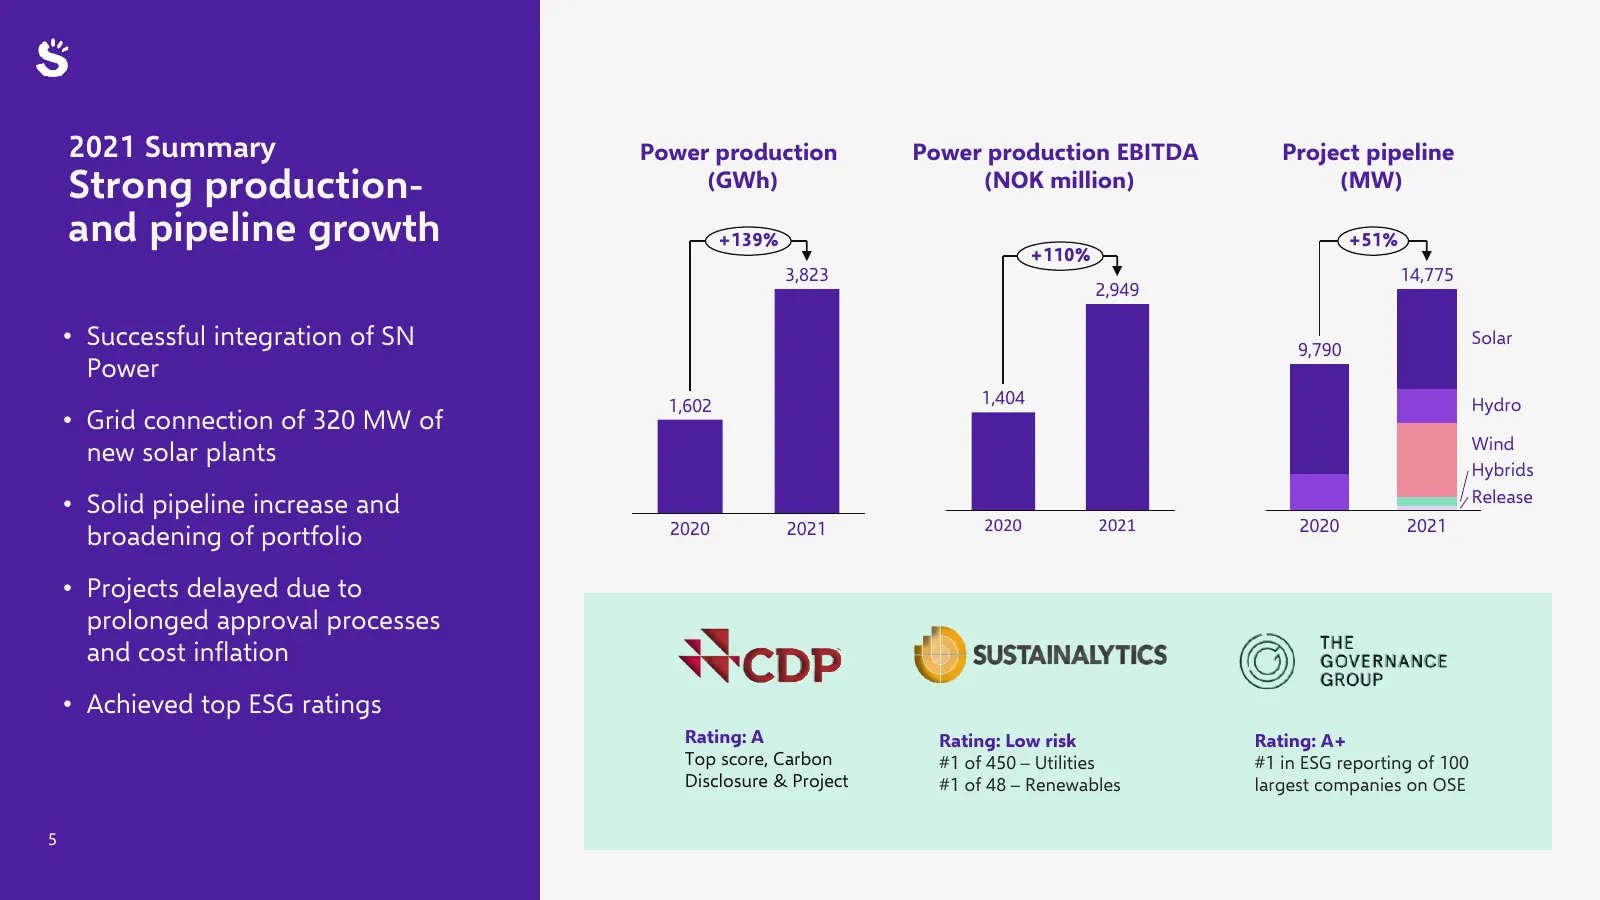
2021 Summary Power production Power production EBITDA Project pipeline Strong production- (GWh) (NOK million) (MW) and pipeline growth +139% +51% +110% 3,823 14,775 2,949 • Successful integration of SN 9,790 Solar Power 1,602 1,404 Hydro • Grid connection of 320 MW of Wind new solar plants Hybrids R
Slide 6: Developing a large pipeline across technologies in core markets
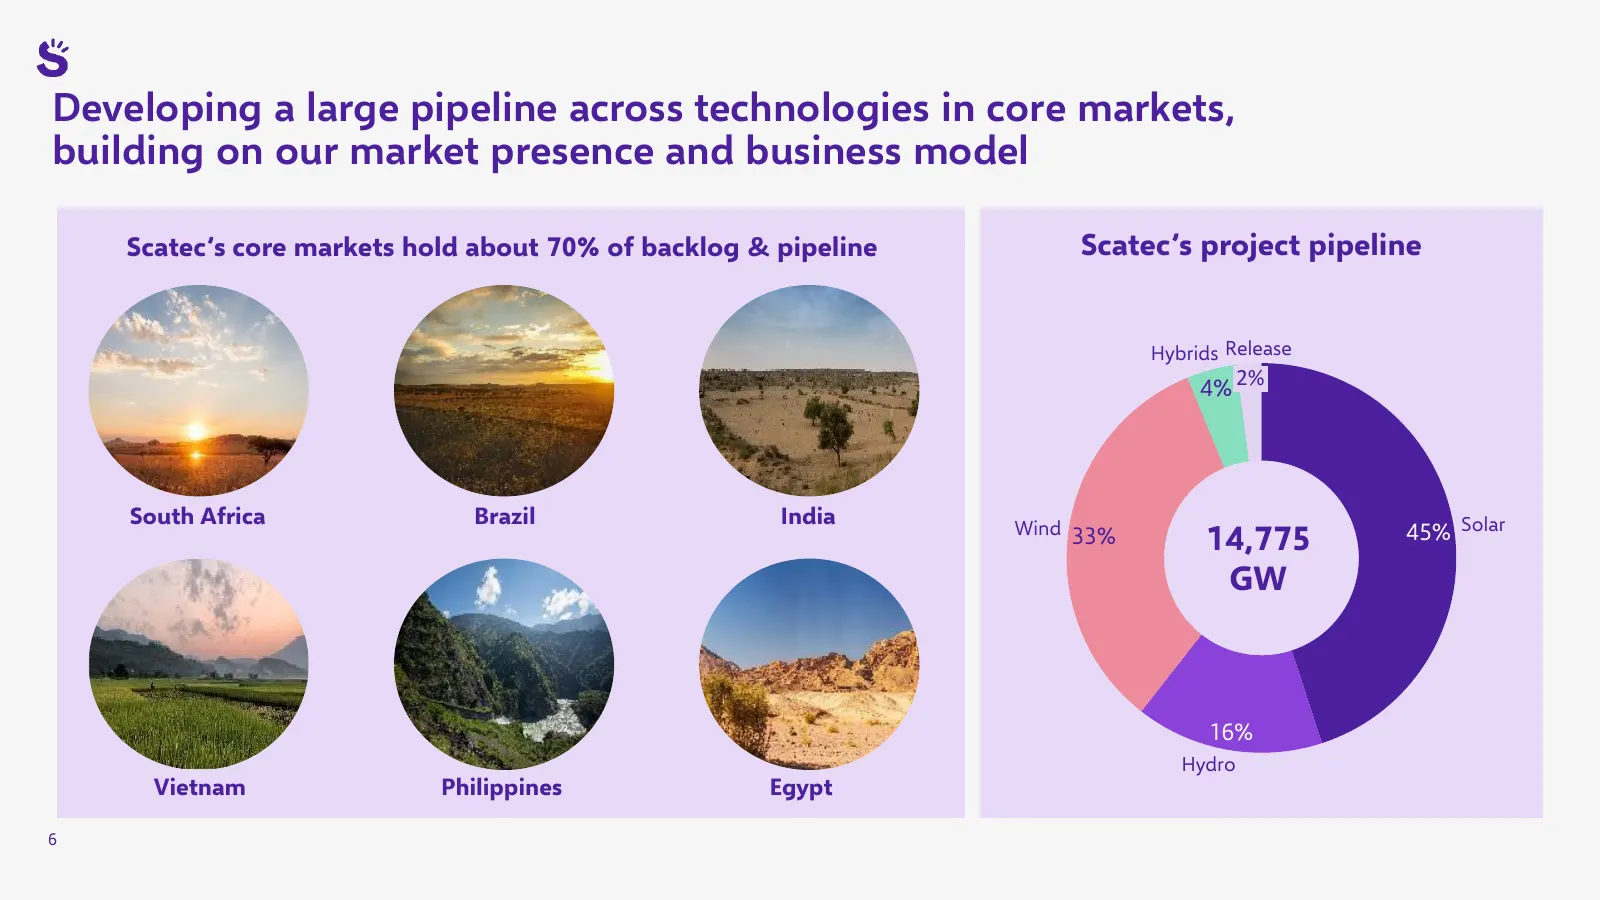
Developing a large pipeline across technologies in core markets, building on our market presence and business model Scatec’s core markets hold about 70% of backlog & pipeline Scatec’s project pipeline Hybrids Release 4% 2% South Africa Brazil India Wind 33% 14,775 45% Solar GW 16% Hydro Vietnam Phil
Slide 7: Project backlog update: 803 MW in Brazil and South Africa added to backlog
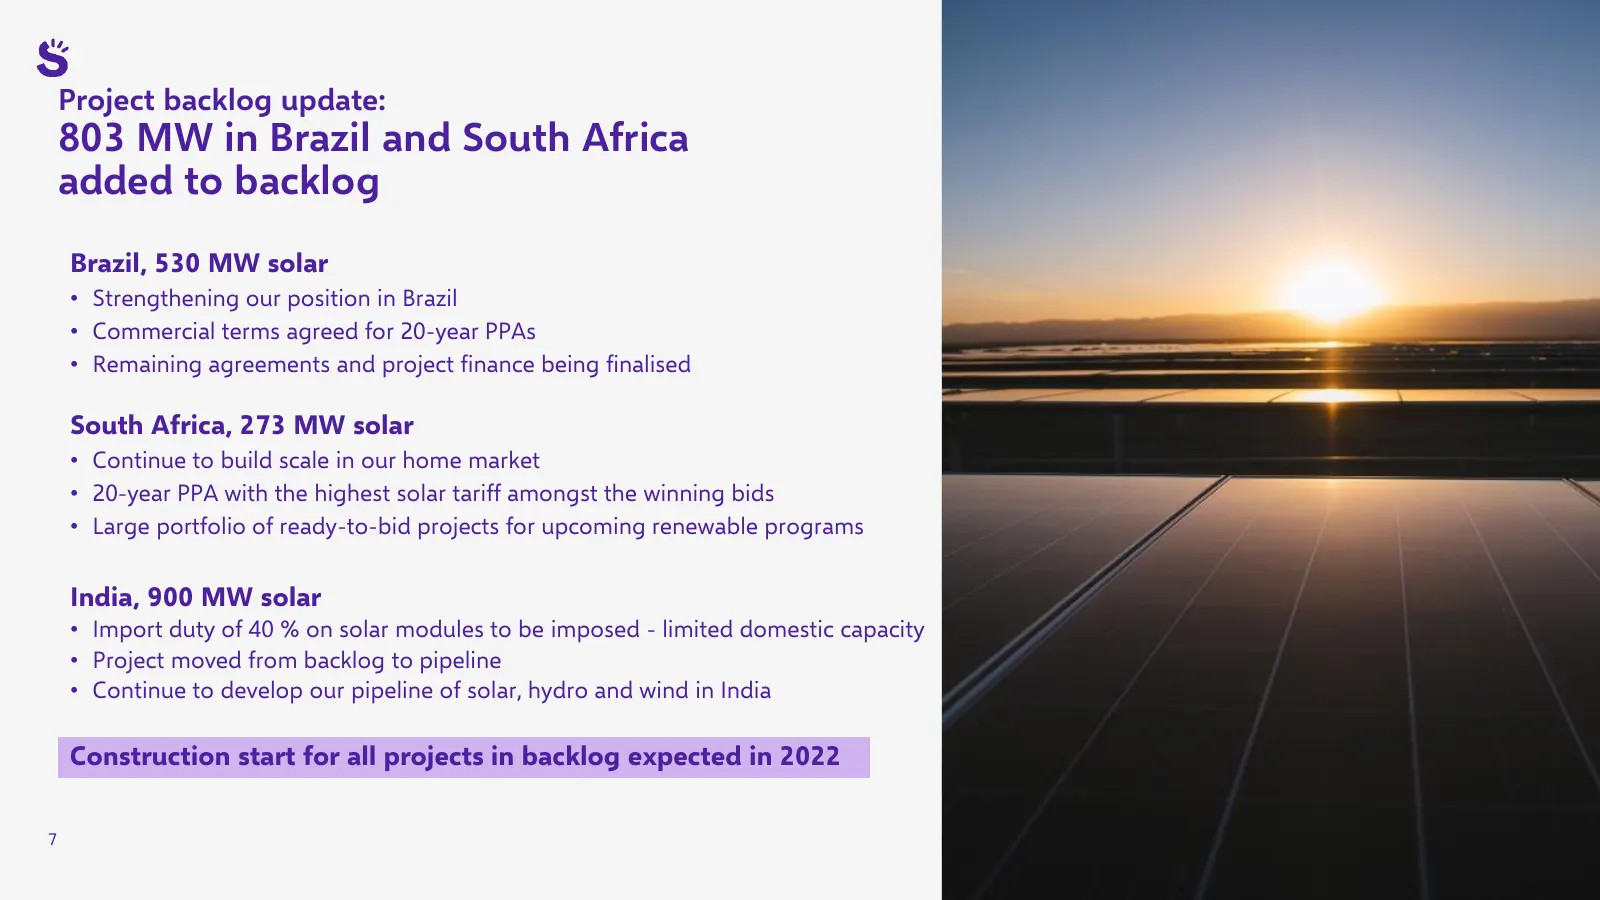
Project backlog update: 803 MW in Brazil and South Africa added to backlog Brazil, 530 MW solar • Strengthening our position in Brazil • Commercial terms agreed for 20-year PPAs • Remaining agreements and project finance being finalised South Africa, 273 MW solar • Continue to build scale in our hom
Slide 8: Project backlog update: Preparing for construction start for 540 MW in South Africa
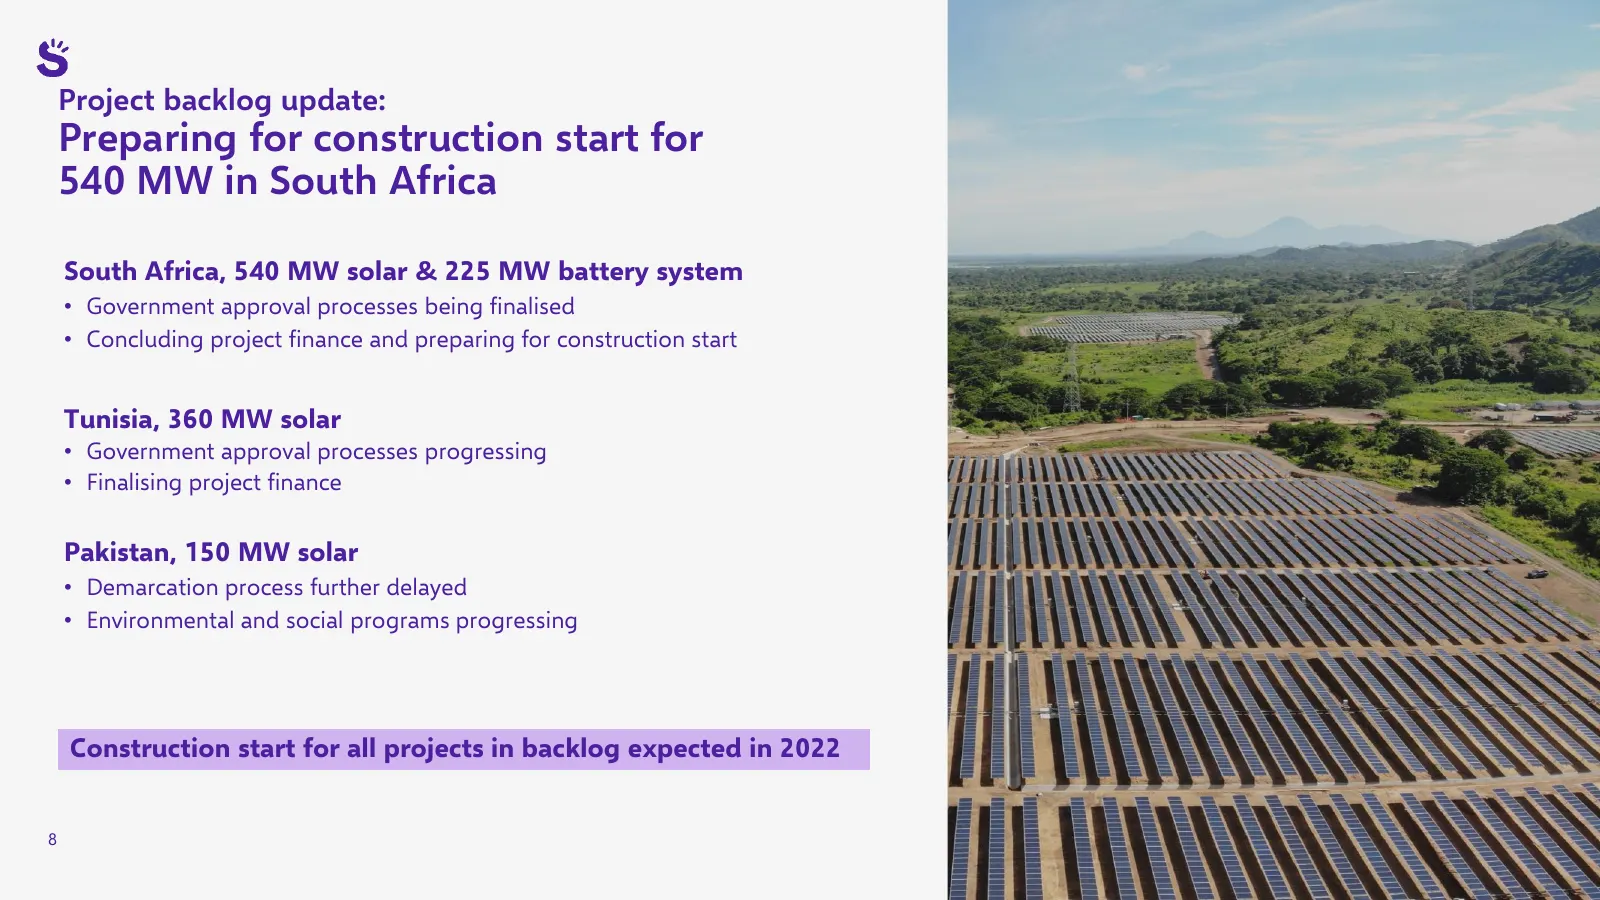
Project backlog update: Preparing for construction start for 540 MW in South Africa South Africa, 540 MW solar & 225 MW battery system • Government approval processes being finalised • Concluding project finance and preparing for construction start Tunisia, 360 MW solar • Government approval process
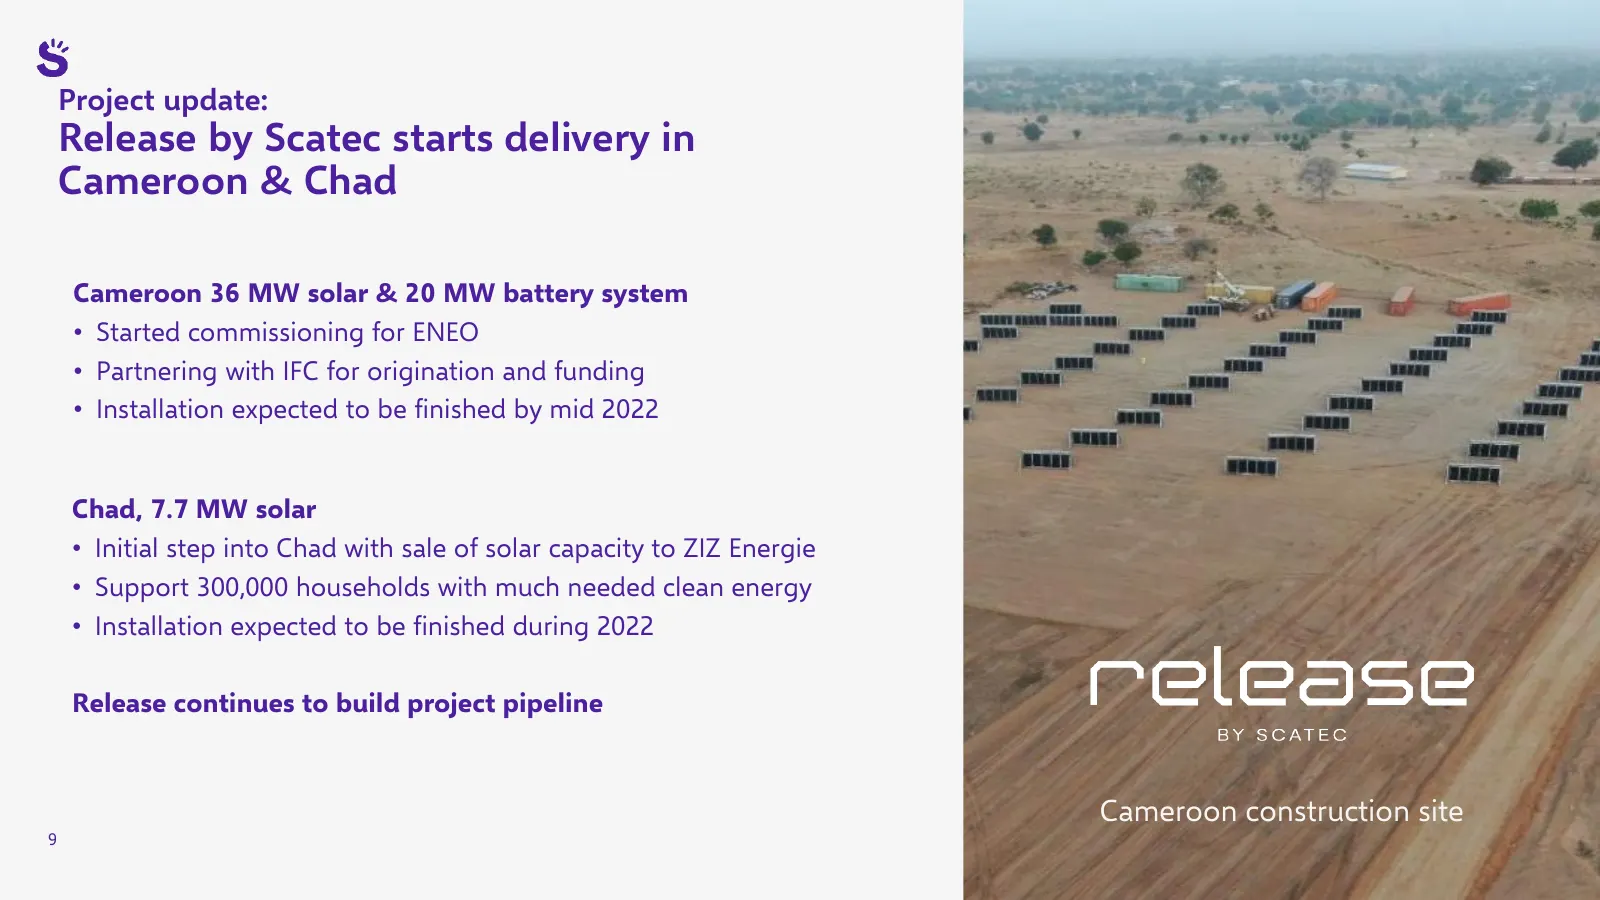
Slide 9: Project update: Release by Scatec starts delivery in Cameroon & Chad
Project update: Release by Scatec starts delivery in Cameroon & Chad Cameroon 36 MW solar & 20 MW battery system • Started commissioning for ENEO • Partnering with IFC for origination and funding • Installation expected to be finished by mid 2022 Chad, 7.7 MW solar • Initial step into Chad with sale
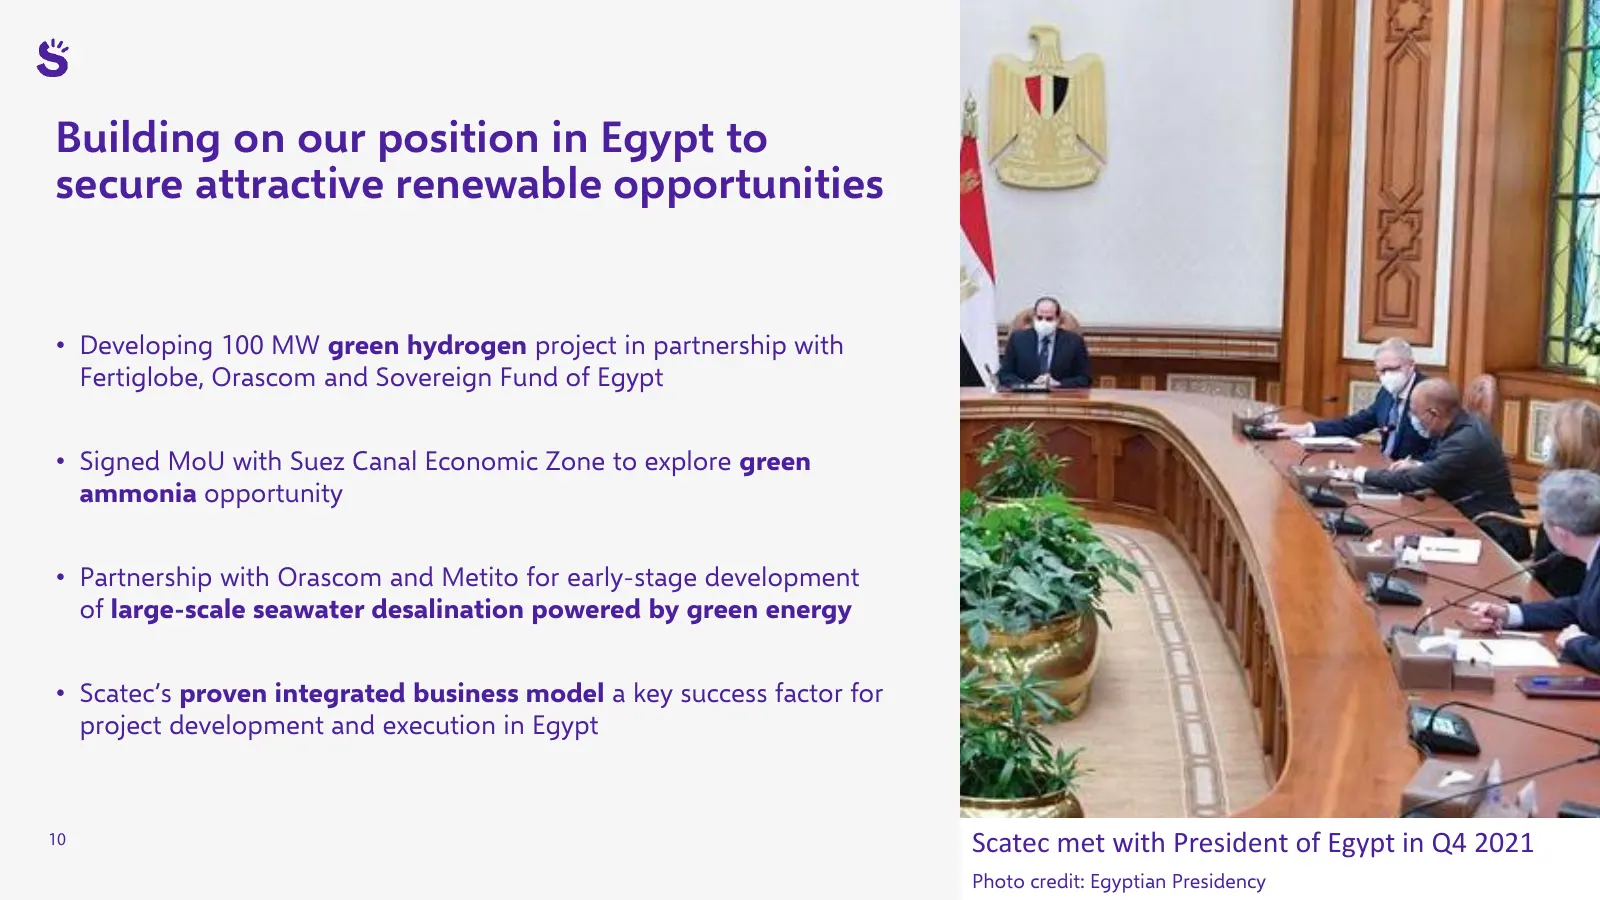
Slide 10: Building on our position in Egypt to secure attractive renewable opportunities
Building on our position in Egypt to secure attractive renewable opportunities • Developing 100 MW green hydrogen project in partnership with Fertiglobe, Orascom and Sovereign Fund of Egypt • Signed MoU with Suez Canal Economic Zone to explore green ammonia opportunity • Partnership with Orascom and
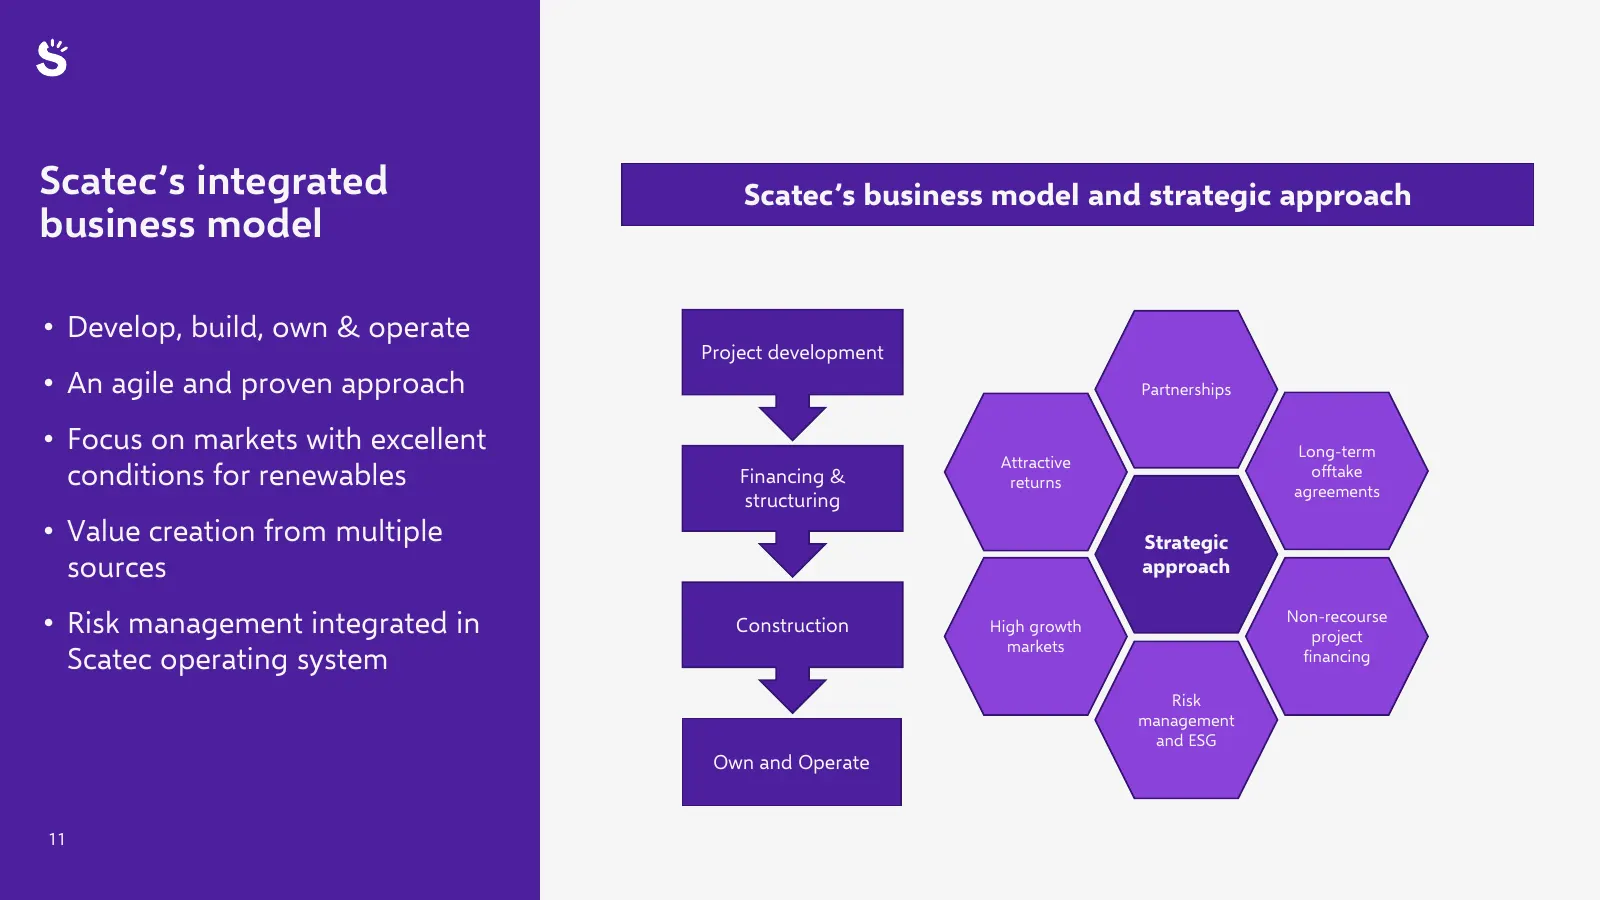
Slide 11: Scatec's integrated business model
Scatec’s integrated Scatec’s business model and strategic approach business model • Develop, build, own & operate Project development • An agile and proven approach Partnerships • Focus on markets with excellent Long-term Attractive conditions for renewables Financing & returns offtake agreements st
Slide 12: Update on Ukraine
Update on Ukraine • The geopolitical situation in Ukraine is challenging • Scatec is closely monitoring the situation • Preparing for several scenarios with a dedicated team • Primary focus on safeguarding our personnel 12

Slide 13: Financial review
Financial review Mikkel Tørud, CFO 13
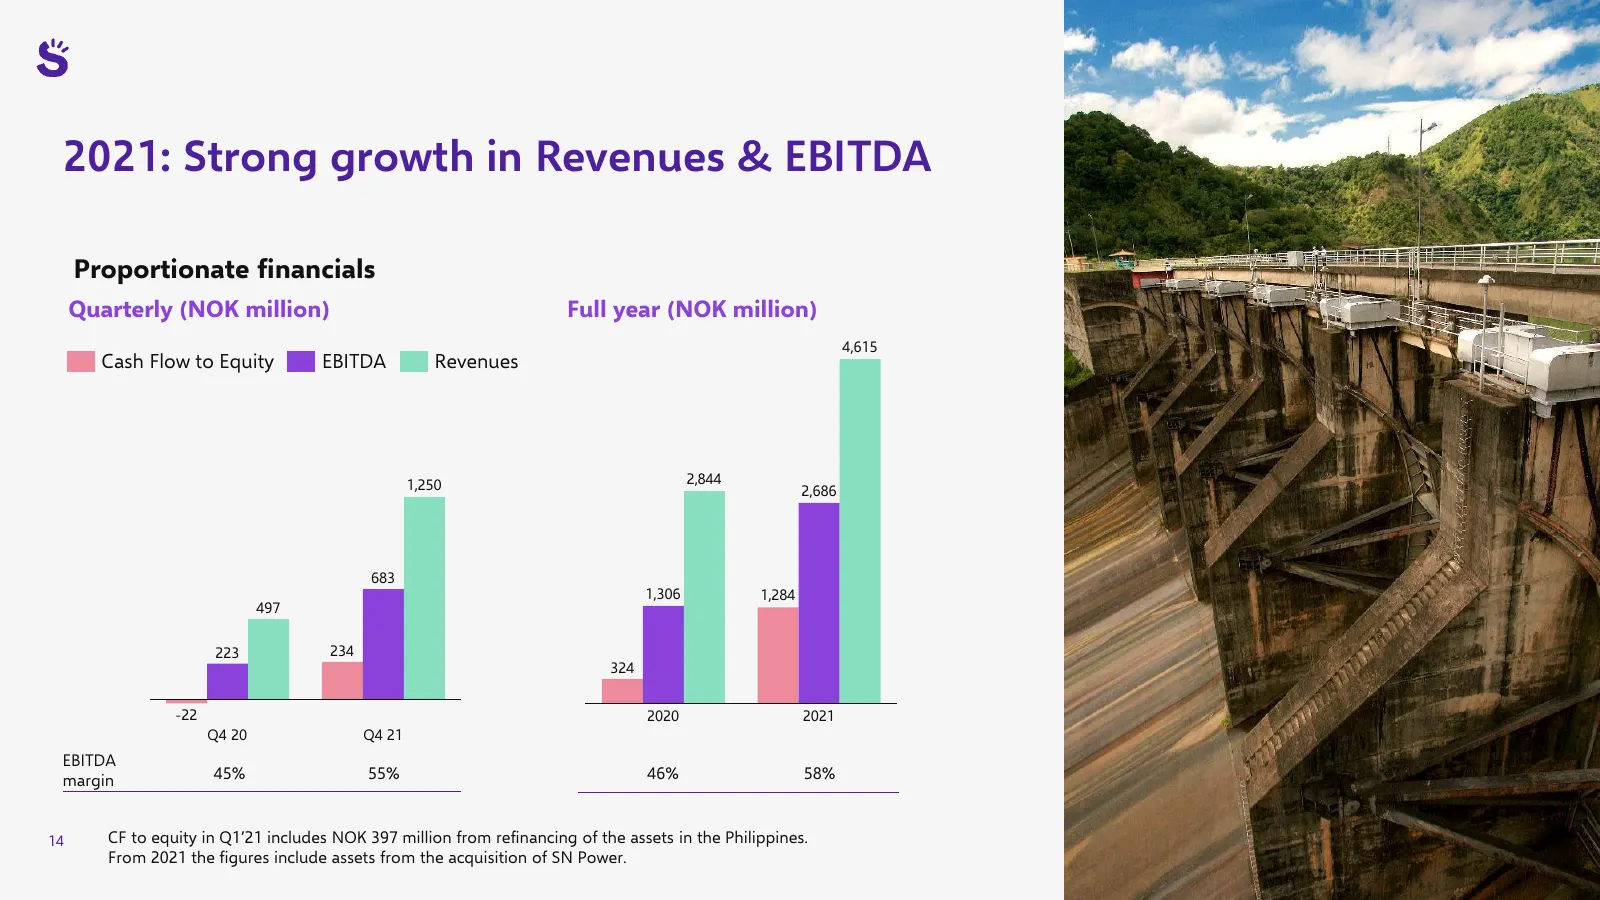
Slide 14: 2021: Strong growth in Revenues & EBITDA
2021: Strong growth in Revenues & EBITDA Proportionate financials Quarterly (NOK million) Full year (NOK million) 4,615 Cash Flow to Equity EBITDA Revenues 1,250 2,844 2,686 683 1,306 1,284 497 223 234 324 -22 2020 2021 Q4 20 Q4 21 EBITDA margin 45% 55% 46% 58% 14 CF to equity in Q1’21 includes NOK
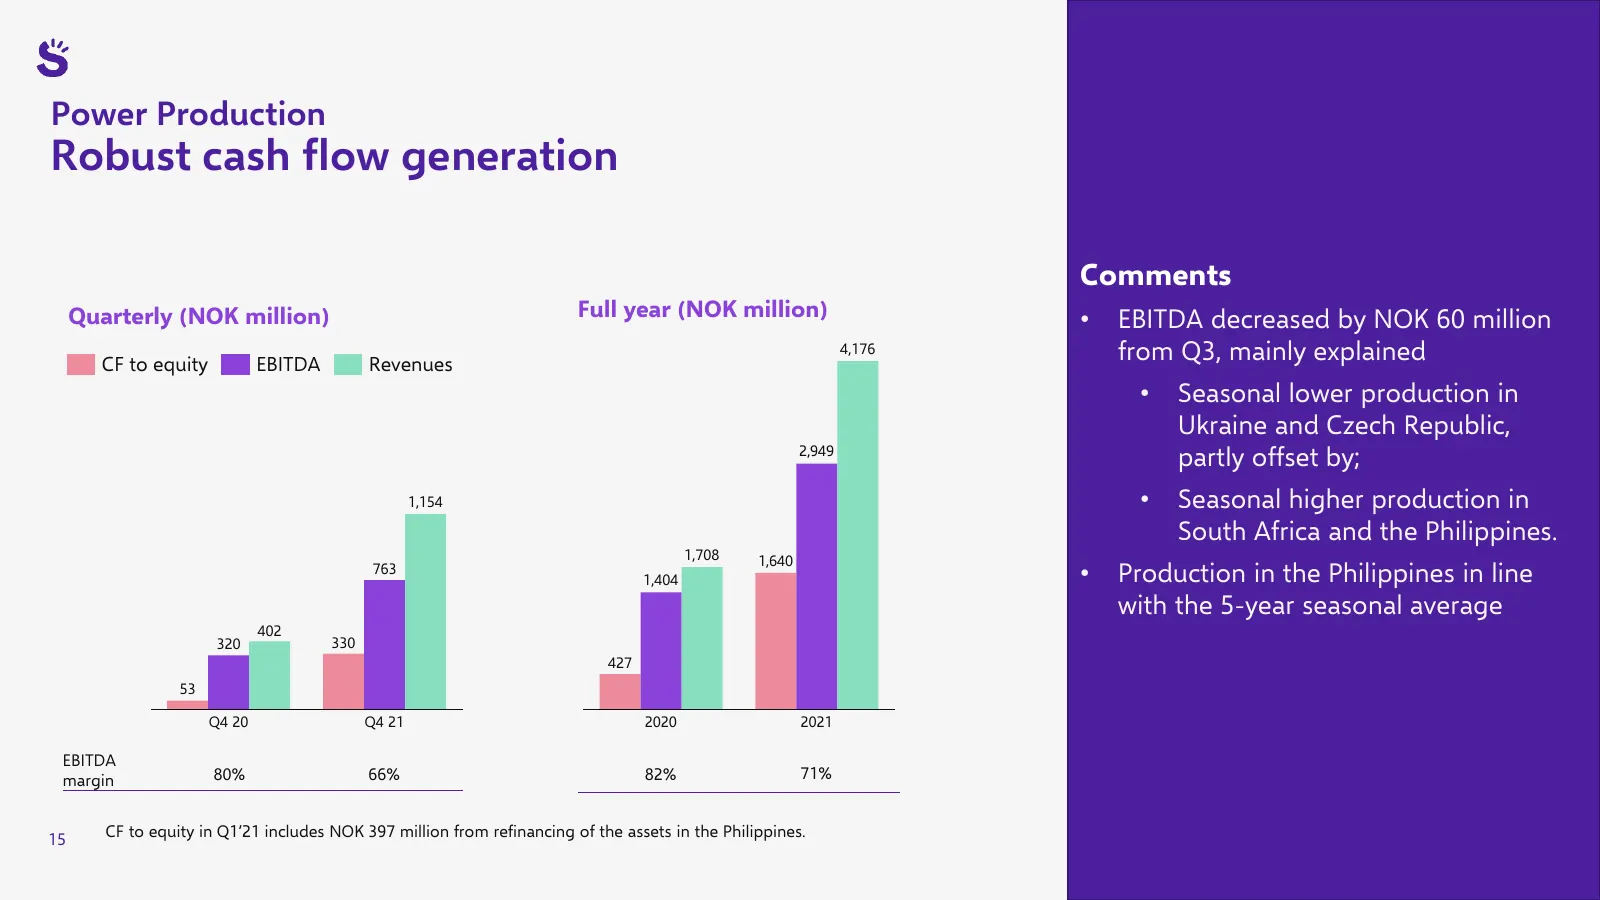
Slide 15: Power Production: Robust cash flow generation
Power Production Robust cash flow generation Comments Quarterly (NOK million) Full year (NOK million) • EBITDA decreased by NOK 60 million CF to equity EBITDA Revenues 4,176 from Q3, mainly explained • Seasonal lower production in Ukraine and Czech Republic, 2,949 partly offset by; 1,154 • Seasonal
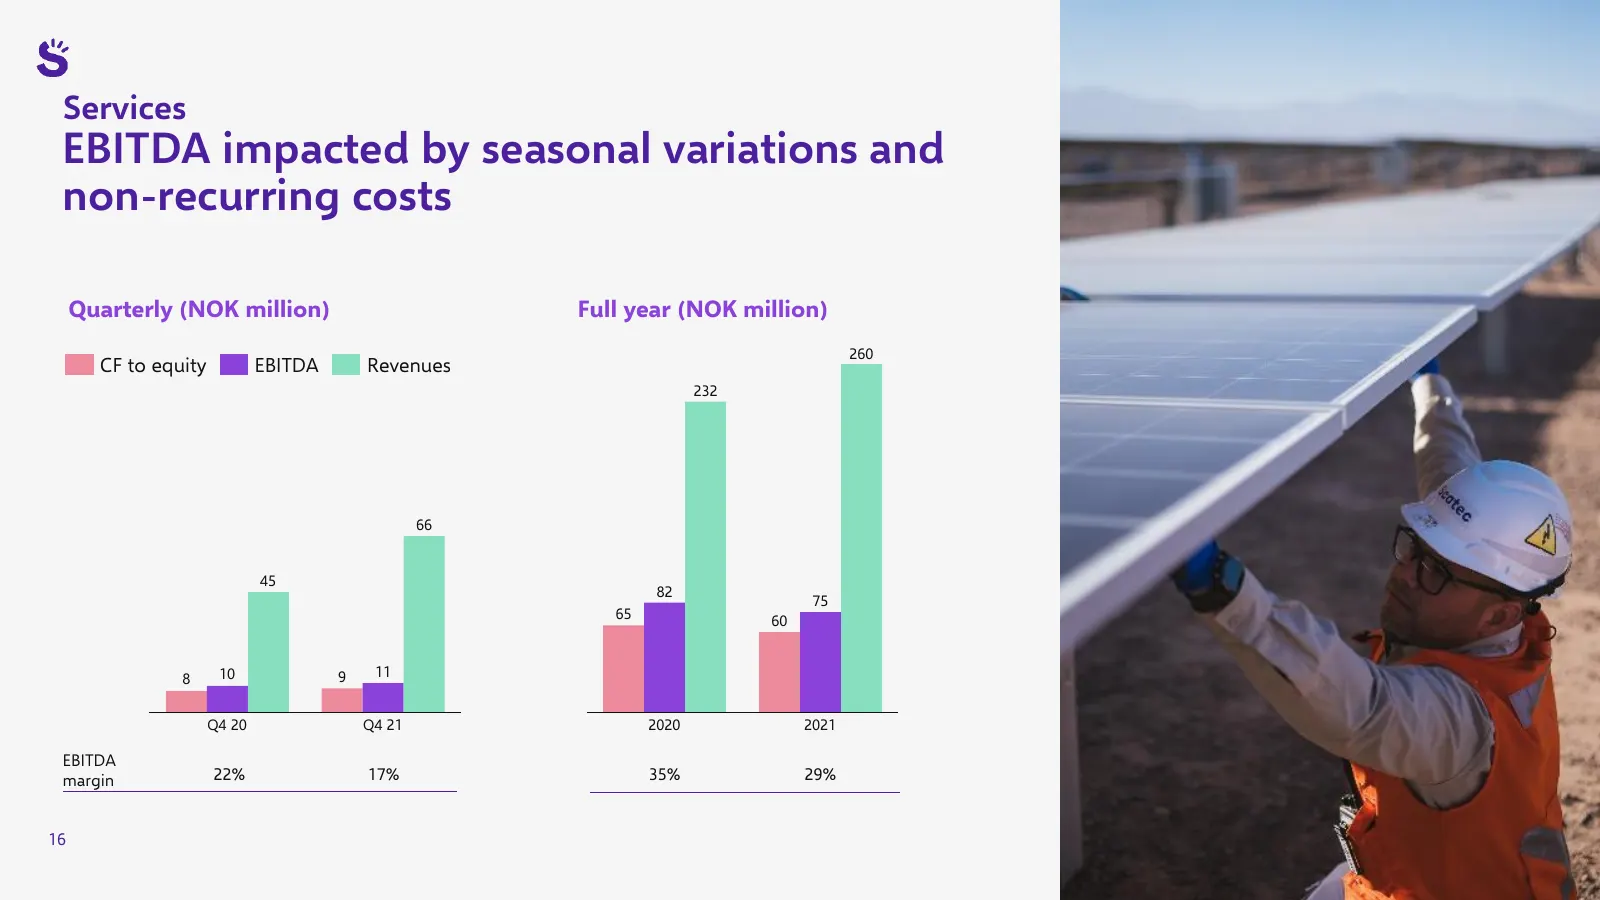
Slide 16: Services: EBITDA impacted by seasonal variations and non-recurring costs
Services EBITDA impacted by seasonal variations and non-recurring costs Quarterly (NOK million) Full year (NOK million) 260 CF to equity EBITDA Revenues 232 66 45 82 75 65 60 10 9 11 8 Q4 20 Q4 21 2020 2021 EBITDA margin 22% 17% 35% 29% 16
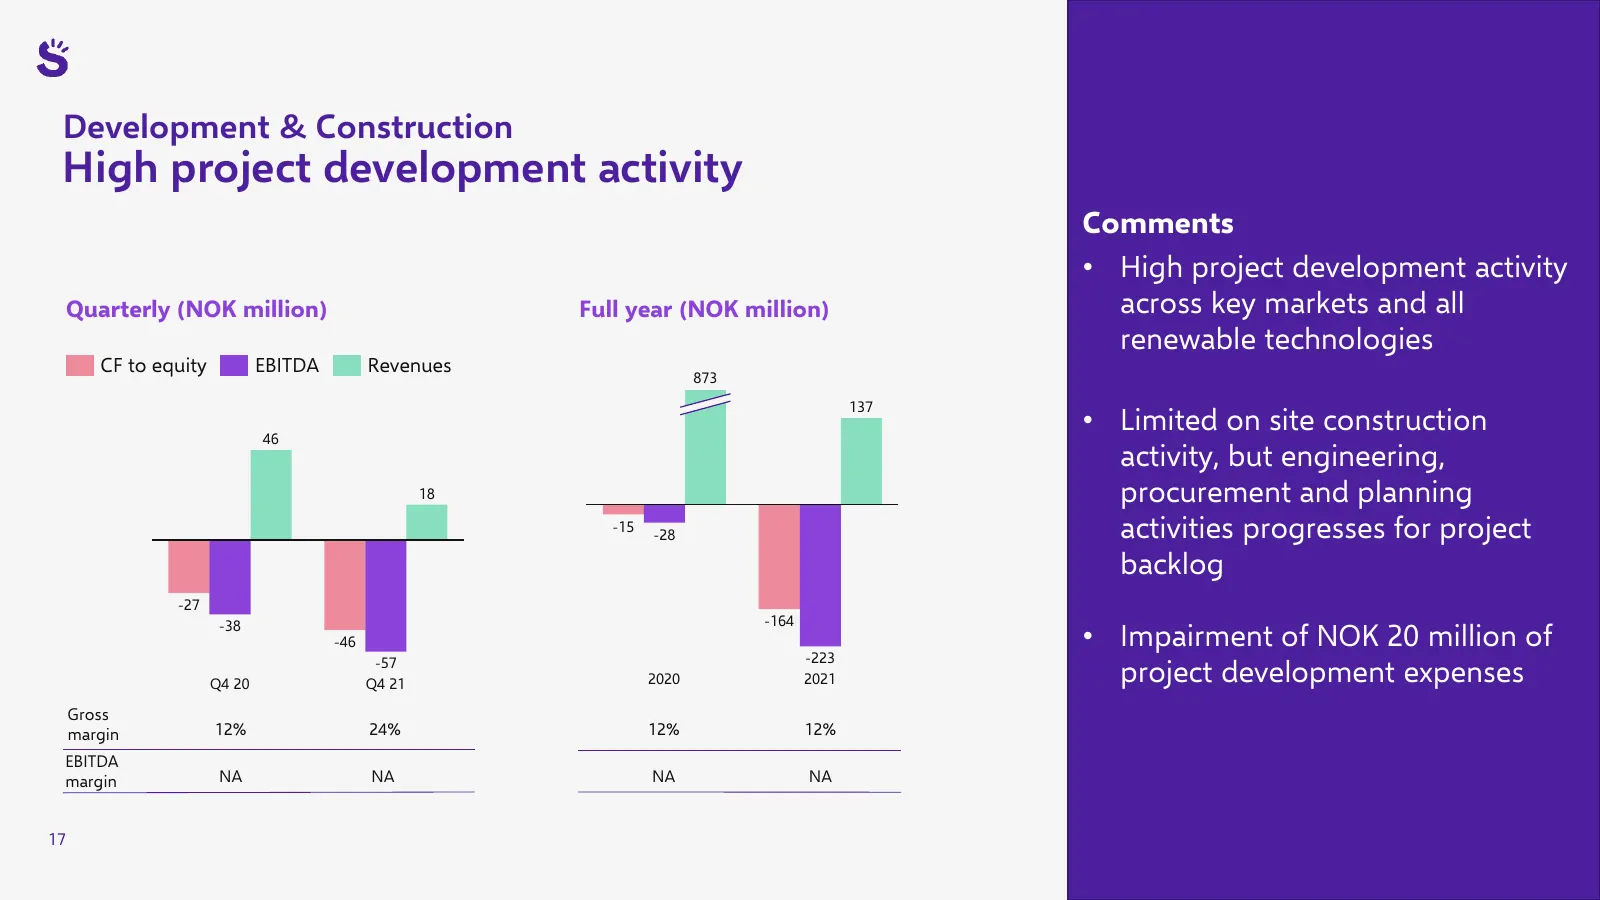
Slide 17: Development & Construction: High project development activity
Development & Construction High project development activity Comments • High project development activity Quarterly (NOK million) Full year (NOK million) across key markets and all renewable technologies CF to equity EBITDA Revenues 873 137 46 • Limited on site construction activity, but engineering
Slide 18: A solid financial position
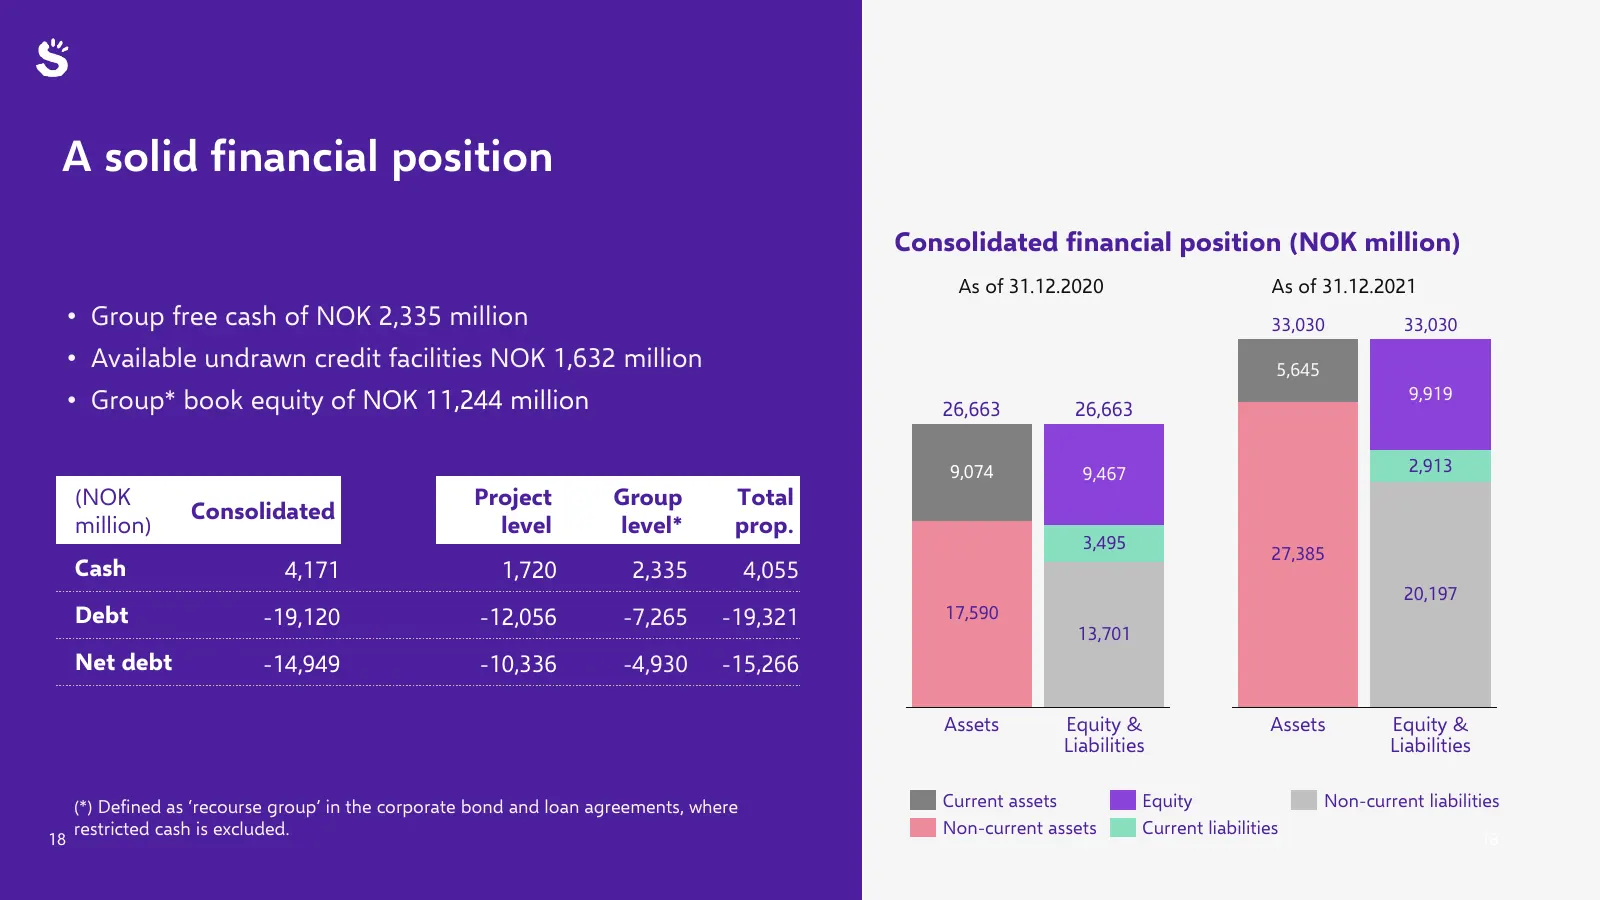
A solid financial position Consolidated financial position (NOK million) As of 31.12.2020 As of 31.12.2021 • Group free cash of NOK 2,335 million 33,030 33,030 • Available undrawn credit facilities NOK 1,632 million 5,645 9,919 • Group* book equity of NOK 11,244 million 26,663 26,663 9,074 9,467 2,9
Slide 19: Q4'21 movement of the Group's free cash
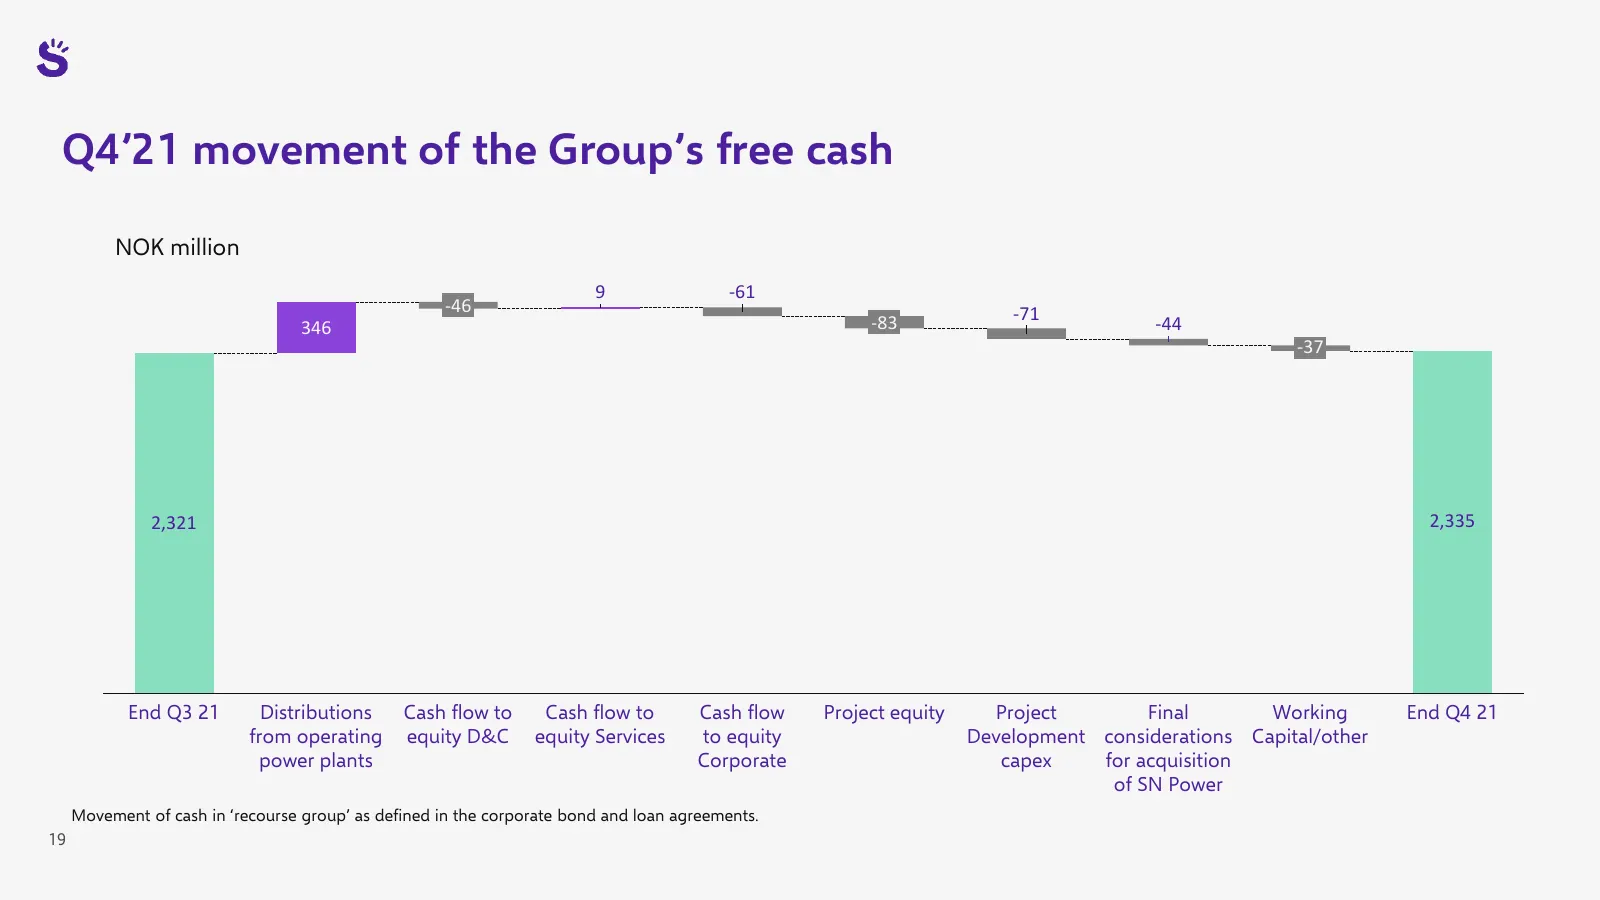
Q4’21 movement of the Group’s free cash NOK million 9 -61 -46 -71 346 -83 -44 -37 2,321 2,335 End Q3 21 Distributions Cash flow to Cash flow to Cash flow Project equity Project Final Working End Q4 21 from operating equity D&C equity Services to equity Development considerations Capital/other power
Slide 20: 2021 dividend proposal
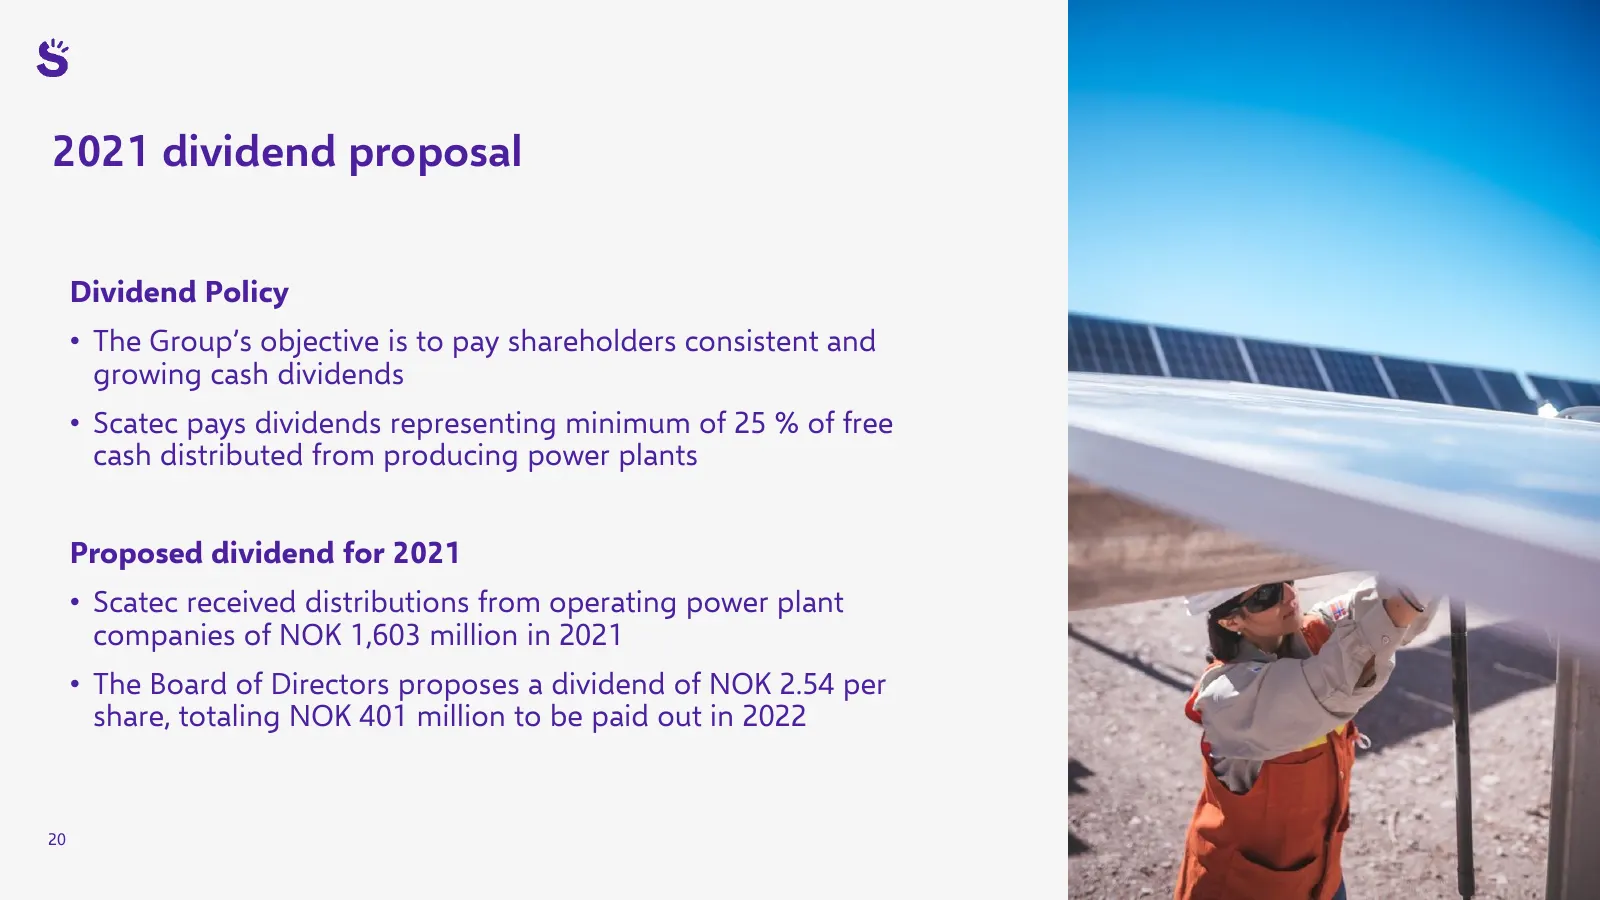
2021 dividend proposal Dividend Policy • The Group’s objective is to pay shareholders consistent and growing cash dividends • Scatec pays dividends representing minimum of 25 % of free cash distributed from producing power plants Proposed dividend for 2021 • Scatec received distributions from operat
Slide 21: Scatec's assets expected to be compliant with the EU Taxonomy
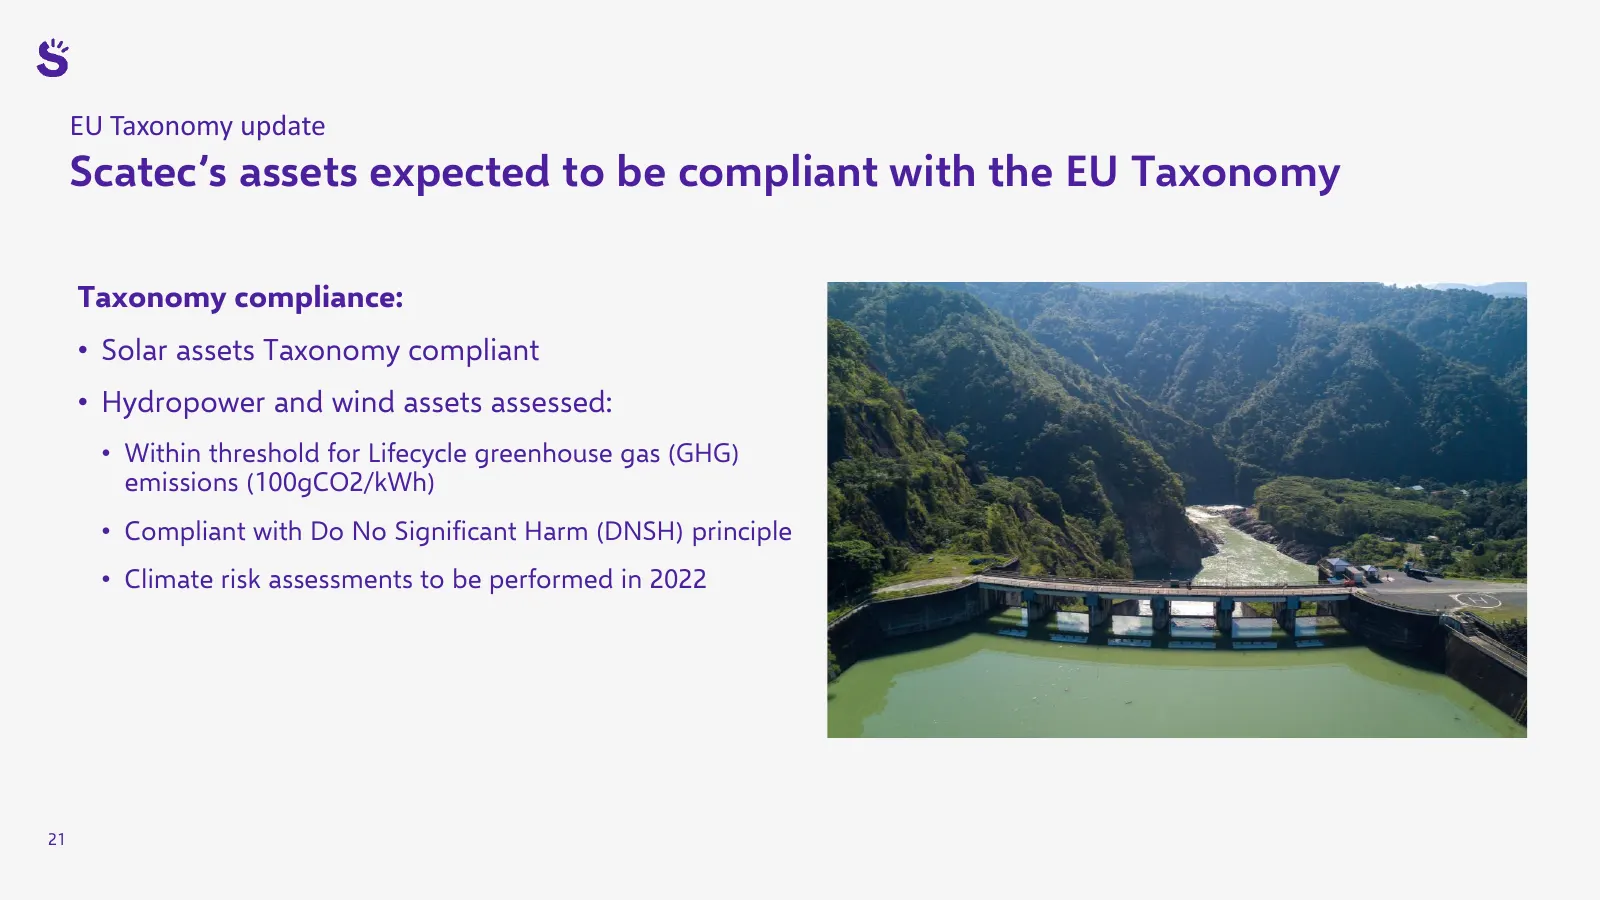
EU Taxonomy update Scatec’s assets expected to be compliant with the EU Taxonomy Taxonomy compliance: • Solar assets Taxonomy compliant • Hydropower and wind assets assessed: • Within threshold for Lifecycle greenhouse gas (GHG) emissions (100gCO2/kWh) • Compliant with Do No Significant Harm (DNSH)
Slide 22: Recap: Value creation in Scatec's integrated business model
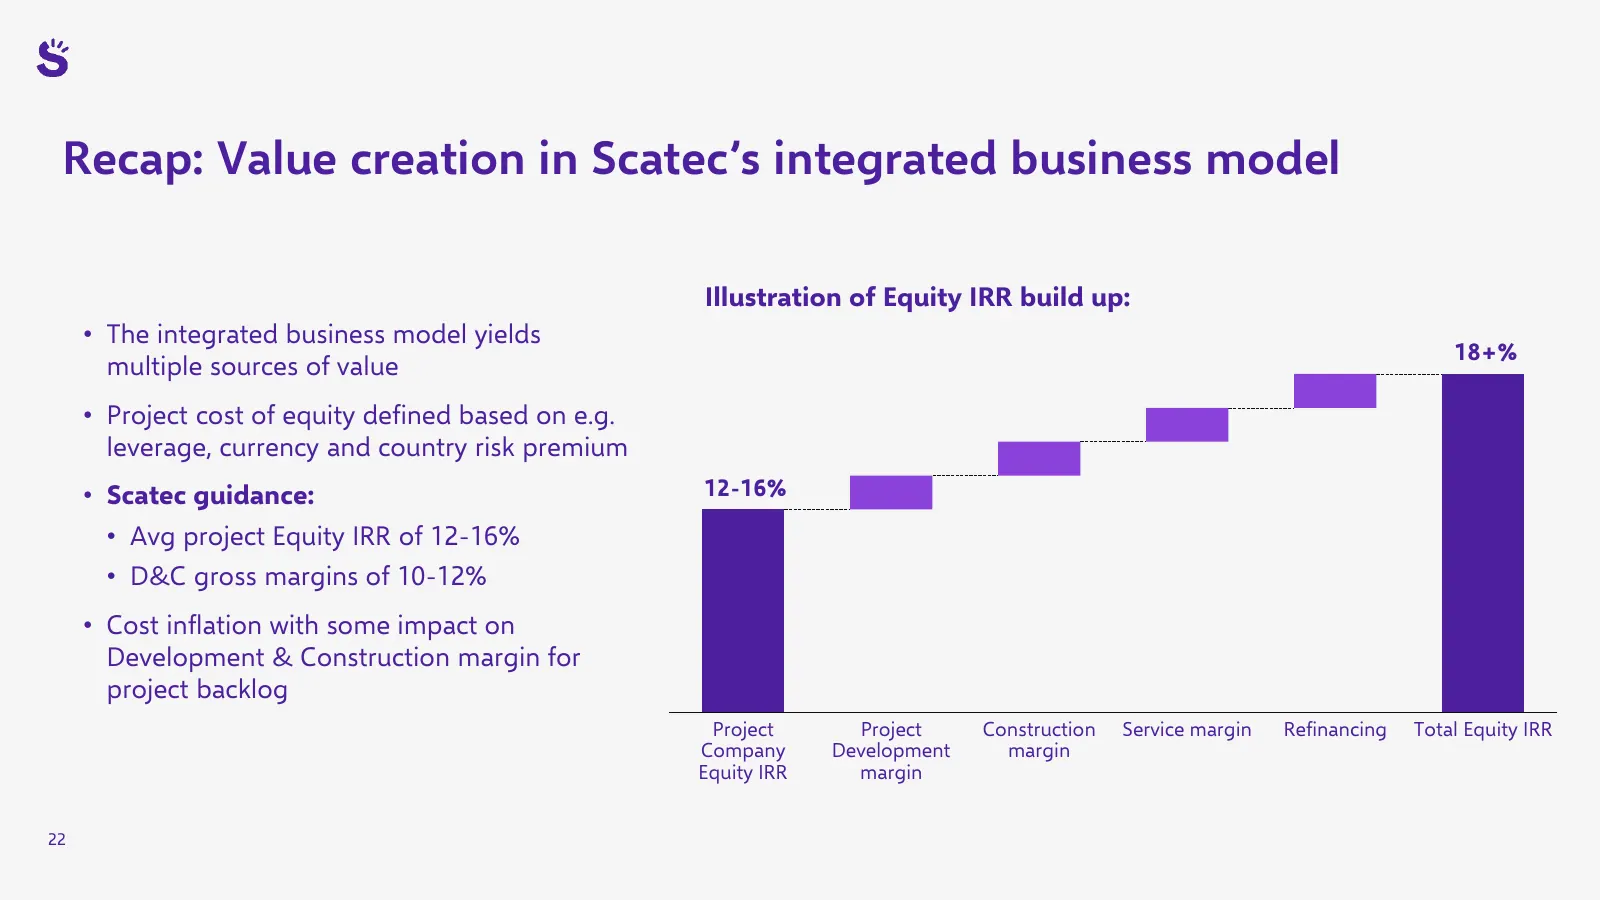
Recap: Value creation in Scatec’s integrated business model Illustration of Equity IRR build up: • The integrated business model yields 18+% multiple sources of value • Project cost of equity defined based on e.g. leverage, currency and country risk premium • Scatec guidance: 12-16% • Avg project Eq
Slide 23: 2022 guidance
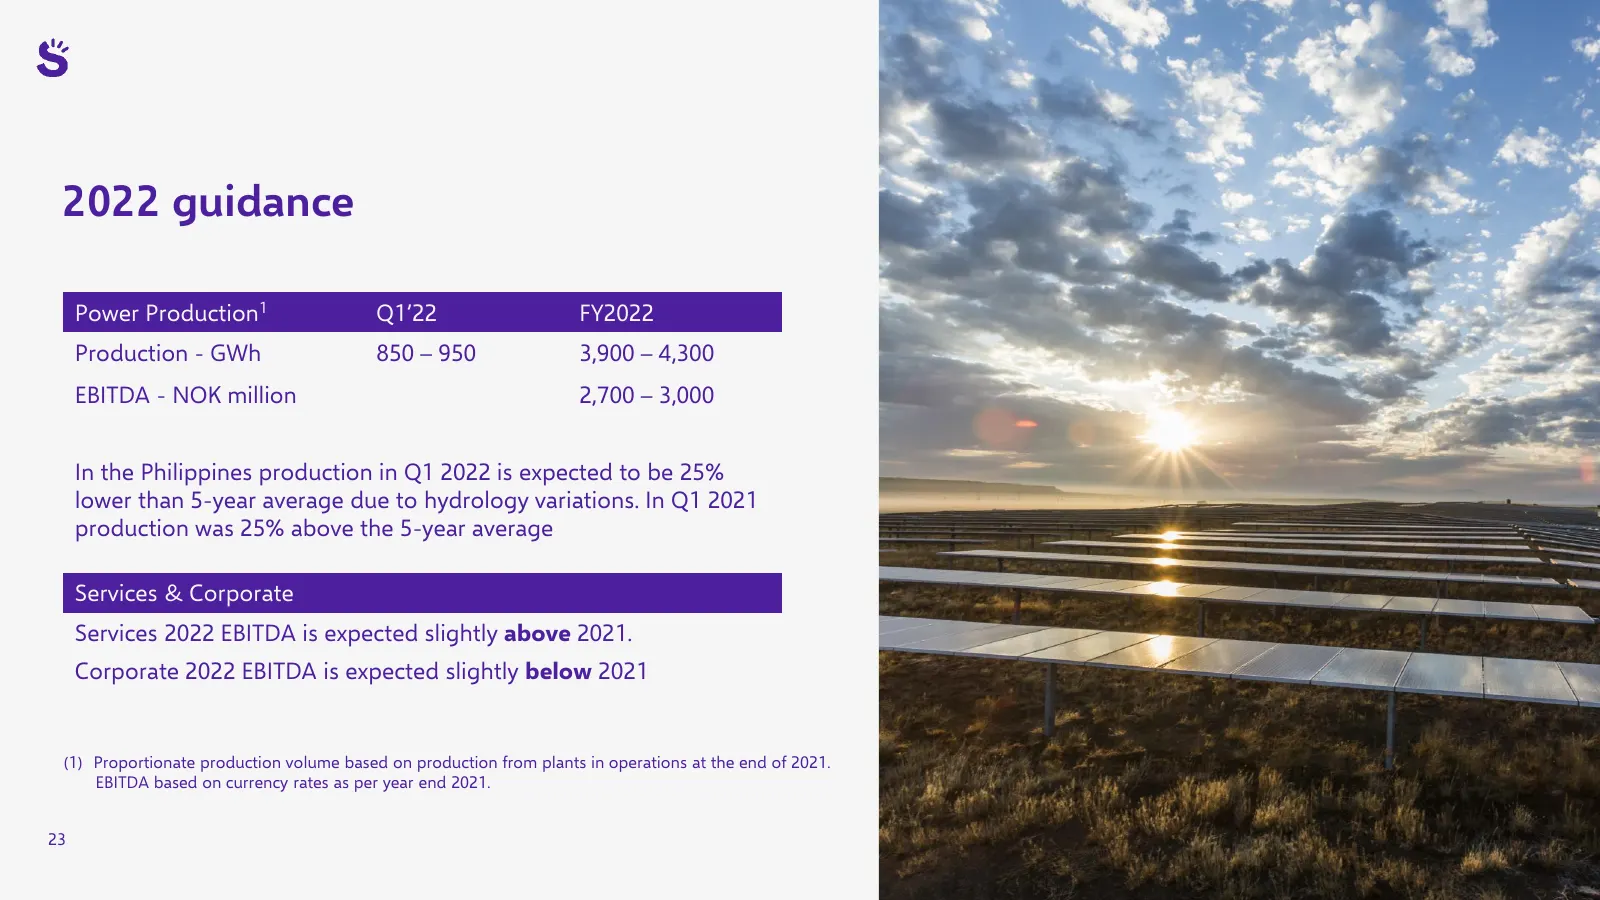
2022 guidance Power Production1 Q1’22 FY2022 Production - GWh 850 – 950 3,900 – 4,300 EBITDA - NOK million 2,700 – 3,000 INSERT PICTURE In the Philippines production in Q1 2022 is expected to be 25% lower than 5-year average due to hydrology variations. In Q1 2021 production was 25% above the 5-year
Slide 24: Summary
Summary Raymond Carlsen, CEO 24
Slide 25: A renewable solution provider well positioned for further growth
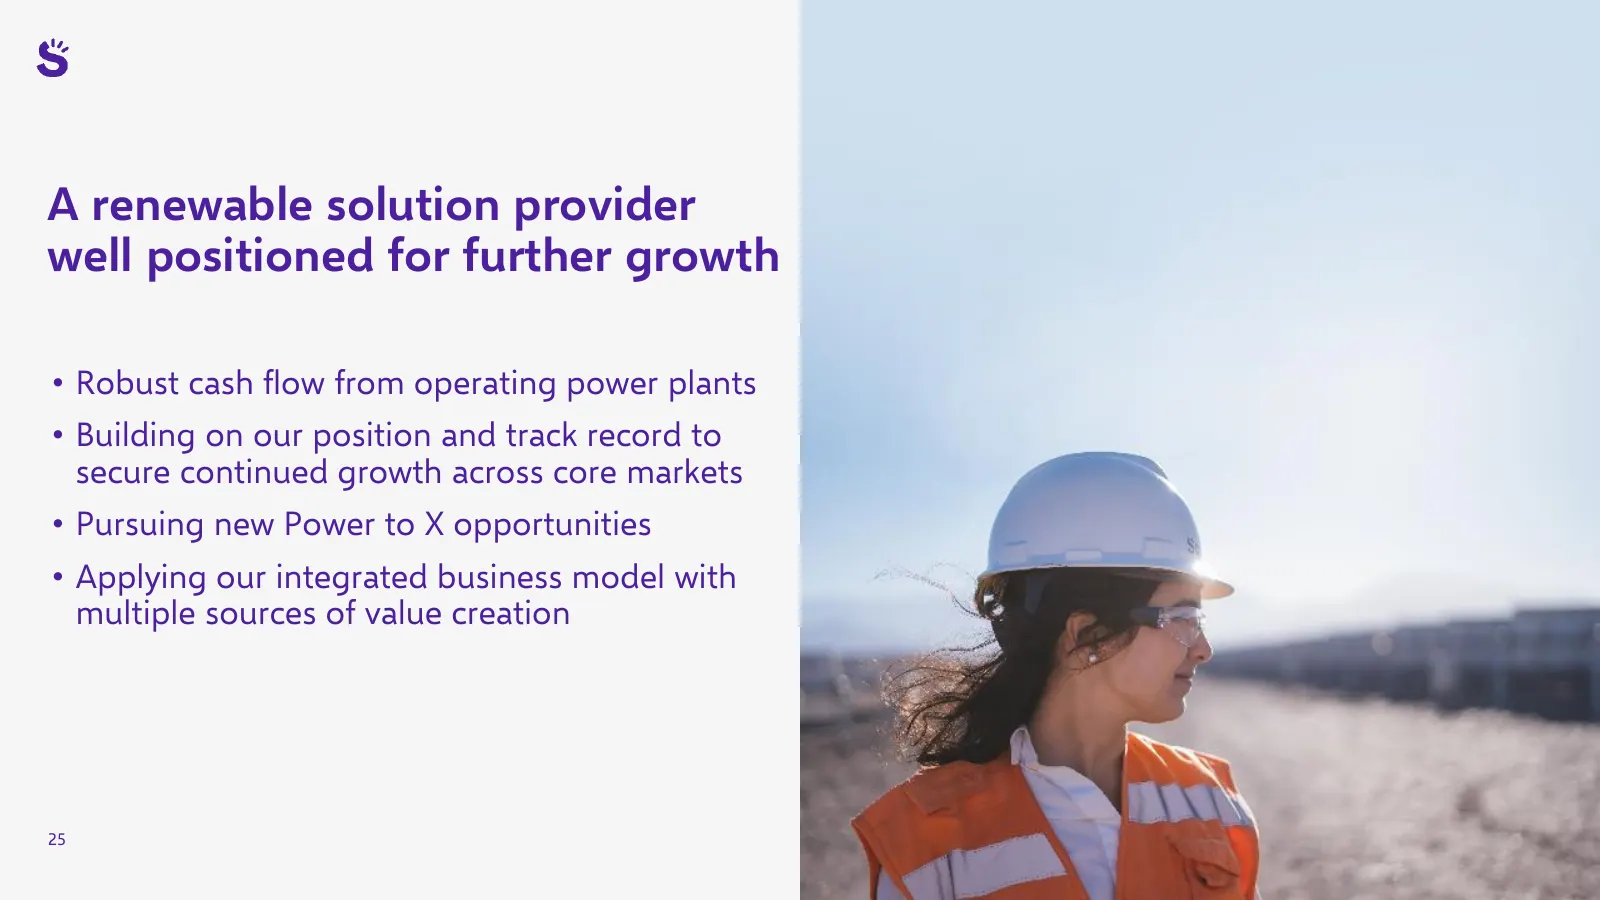
A renewable solution provider well positioned for further growth • Robust cash flow from operating power plants • Building on our position and track record to secure continued growth across core markets • Pursuing new Power to X opportunities • Applying our integrated business model with multiple so
Slide 26: Scatec improving our future
Scate improving our future
Slide 27: Our asset portfolio
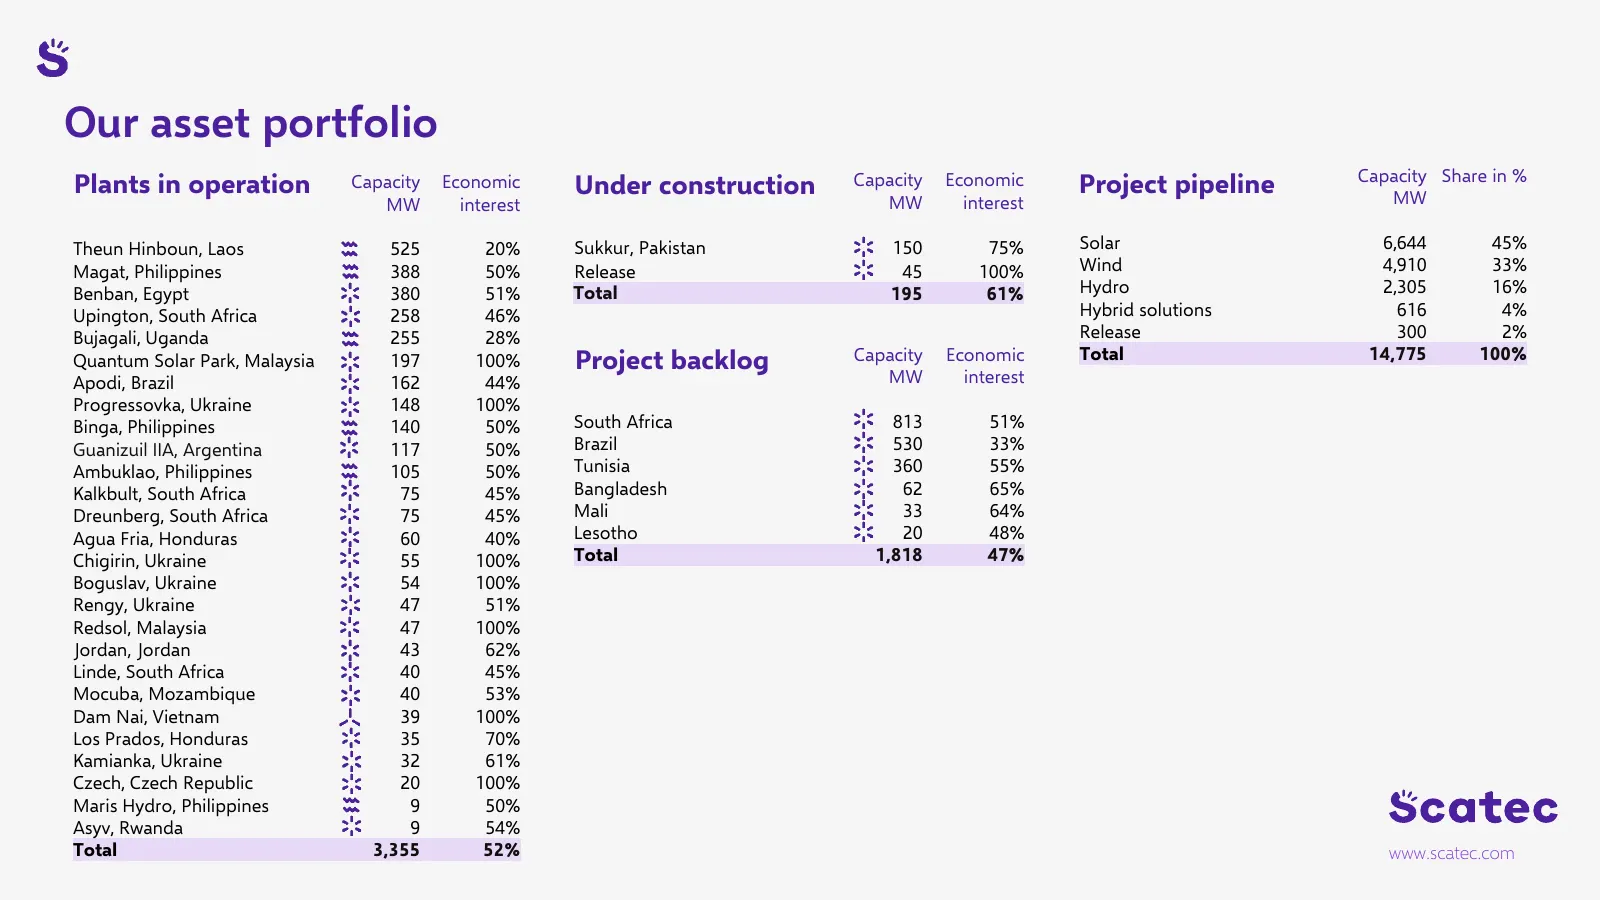
Our asset portfolio Capacity Share in % Plants in operation Capacity Economic Under construction Capacity Economic Project pipeline MW MW interest MW interest Theun Hinboun, Laos 525 20% Sukkur, Pakistan 150 75% Solar 6,644 45% Magat, Philippines 388 50% Release 45 100% Wind 4,910 33% Benban, Egypt
Source: Internet Archive copy of scatec.com
More decks from Scatec ASA
 Q3 2026 Earnings Presentation32 slides · Oct 30, 2026
 Q2 2026 Earnings Presentation23 slides · Aug 21, 2026
 Investor Presentation (August 2026)22 slides · August 2026
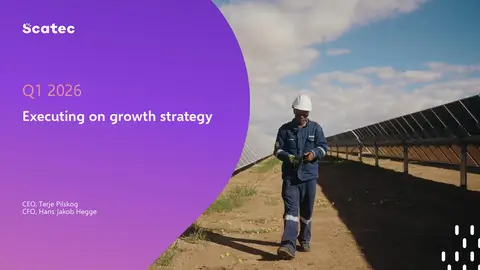 Q1 2026 Earnings Presentation23 slides · May 6, 2026
 Investor Presentation (March 2026)22 slides · March 2026
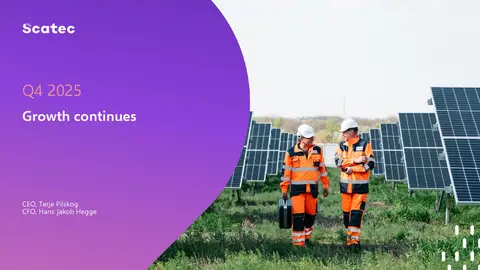 Q4 2025 Earnings Presentation24 slides · Jan 30, 2026