Radcom Ltd. · NASDAQ:RDCM
Radcom — Q4 2018 Earnings Presentation
11 slides from Radcom's earnings presentation, 2019

Slide 1: Reference Slides Earnings Call for Q4-18
Reference Slides Earnings Call for Q4-18
Slide 2: Safe Harbor Provision
Certain statements made herein that use words such as “estimate” , “project” , “intend”, SAFE “expect”, “believe”, "may", "might", "predict", "potential", "anticipate", "plan" or similar expressions are intended to identify forward-looking statements within the meaning of the HARBOR Private Securiti
Slide 3: Overview
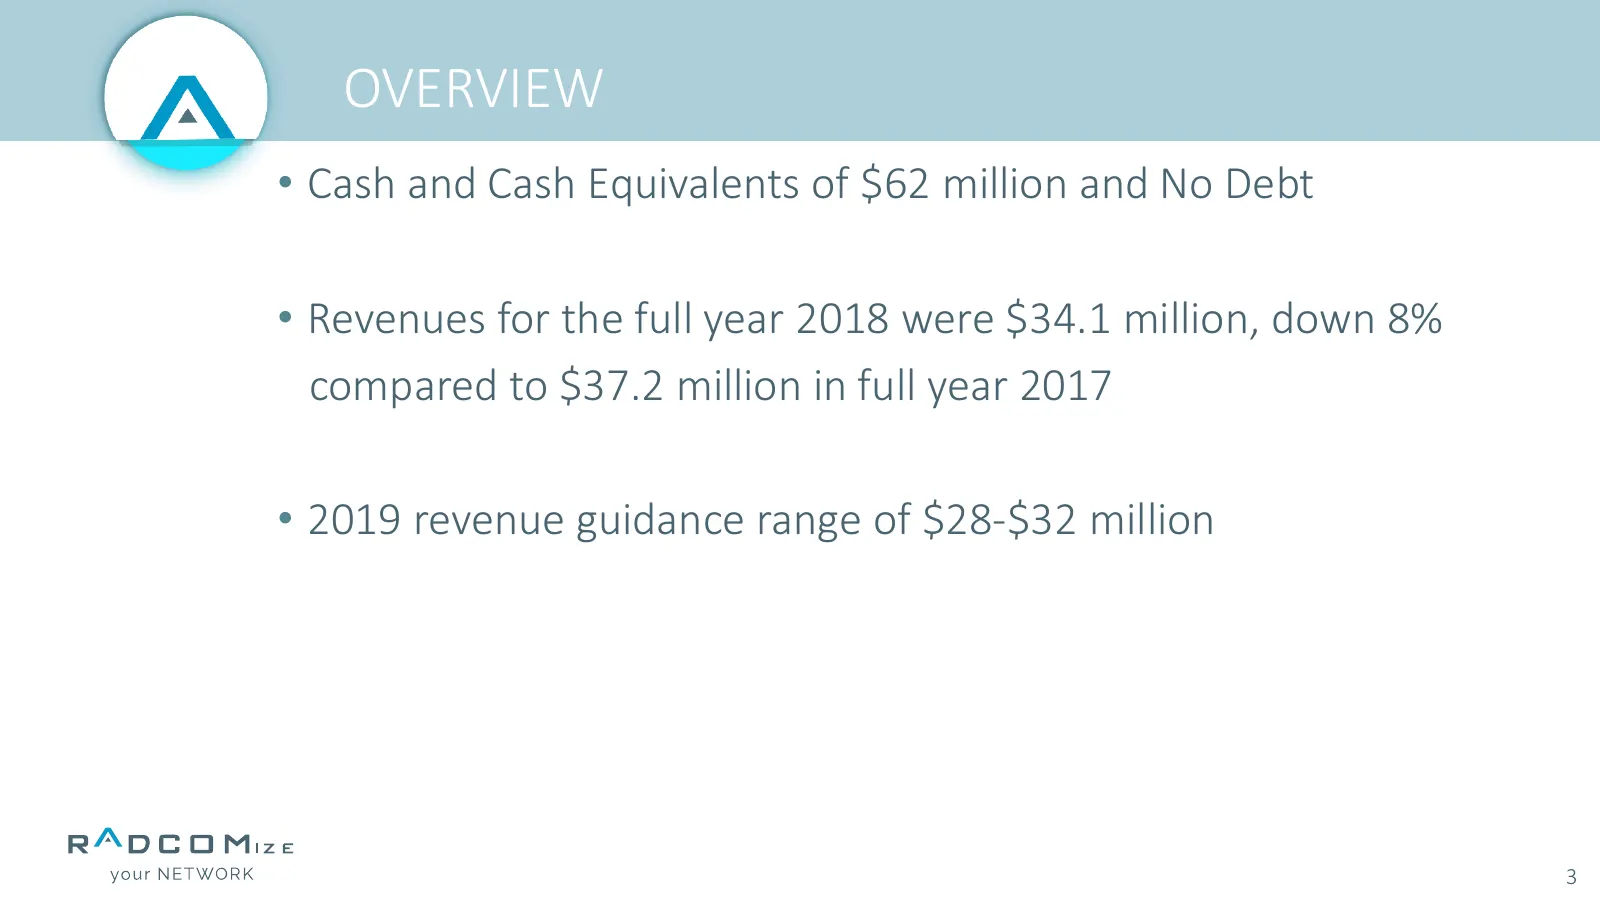
OVERVIEW • Cash and Cash Equivalents of $62 million and No Debt • Revenues for the full year 2018 were $34.1 million, down 8% compared to $37.2 million in full year 2017 • 2019 revenue guidance range of $28-$32 million 3

Slide 4: Fourth Quarter 2018 Financial Results
Fourth Quarter 2018 Financial Results
Slide 5: Consolidated Statement of Operations (GAAP)
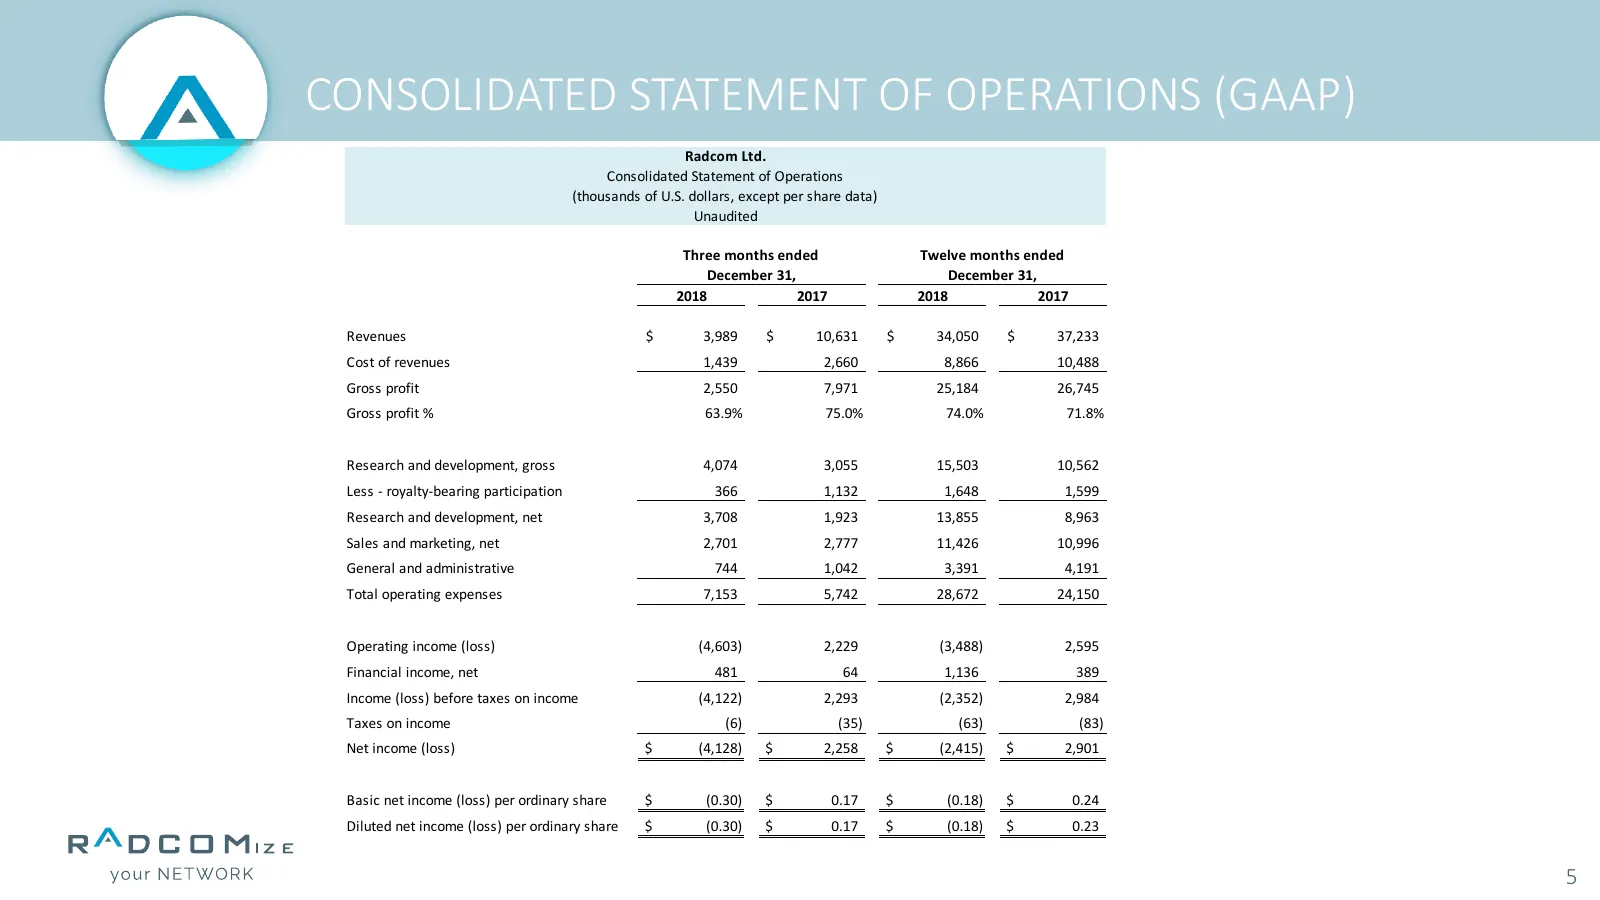
CONSOLIDATED STATEMENT OF OPERATIONS (GAAP) Radcom Ltd. Consolidated Statement of Operations (thousands of U.S. dollars, except per share data) Unaudited Three months ended Twelve months ended December 31, December 31, 2018 2017 2018 2017 Revenues $ 3,989 $ 10,631 $ 34,050 $ 37,233 Cost of revenues
Slide 6: Consolidated Statement of Operations (Non-GAAP)
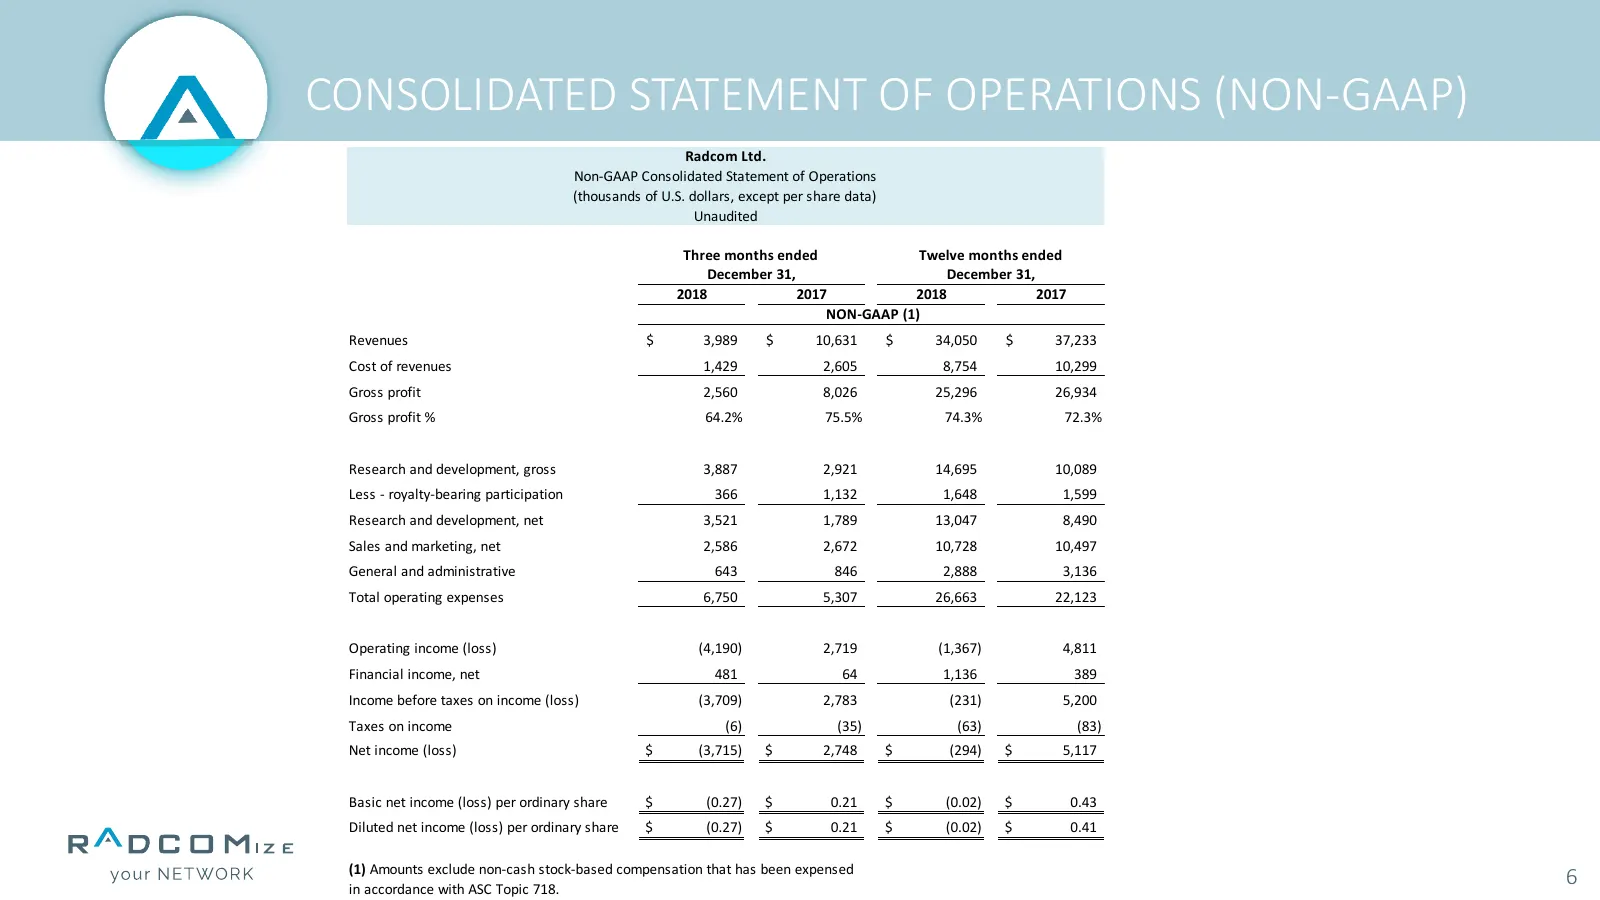
CONSOLIDATED STATEMENT OF OPERATIONS (NON-GAAP) Radcom Ltd. Non-GAAP Consolidated Statement of Operations (thousands of U.S. dollars, except per share data) Unaudited Three months ended Twelve months ended December 31, December 31, 2018 2017 2018 2017 NON-GAAP (1) Revenues $ 3,989 $ 10,631 $ 34,050
Slide 7: Operating Expenses (GAAP)
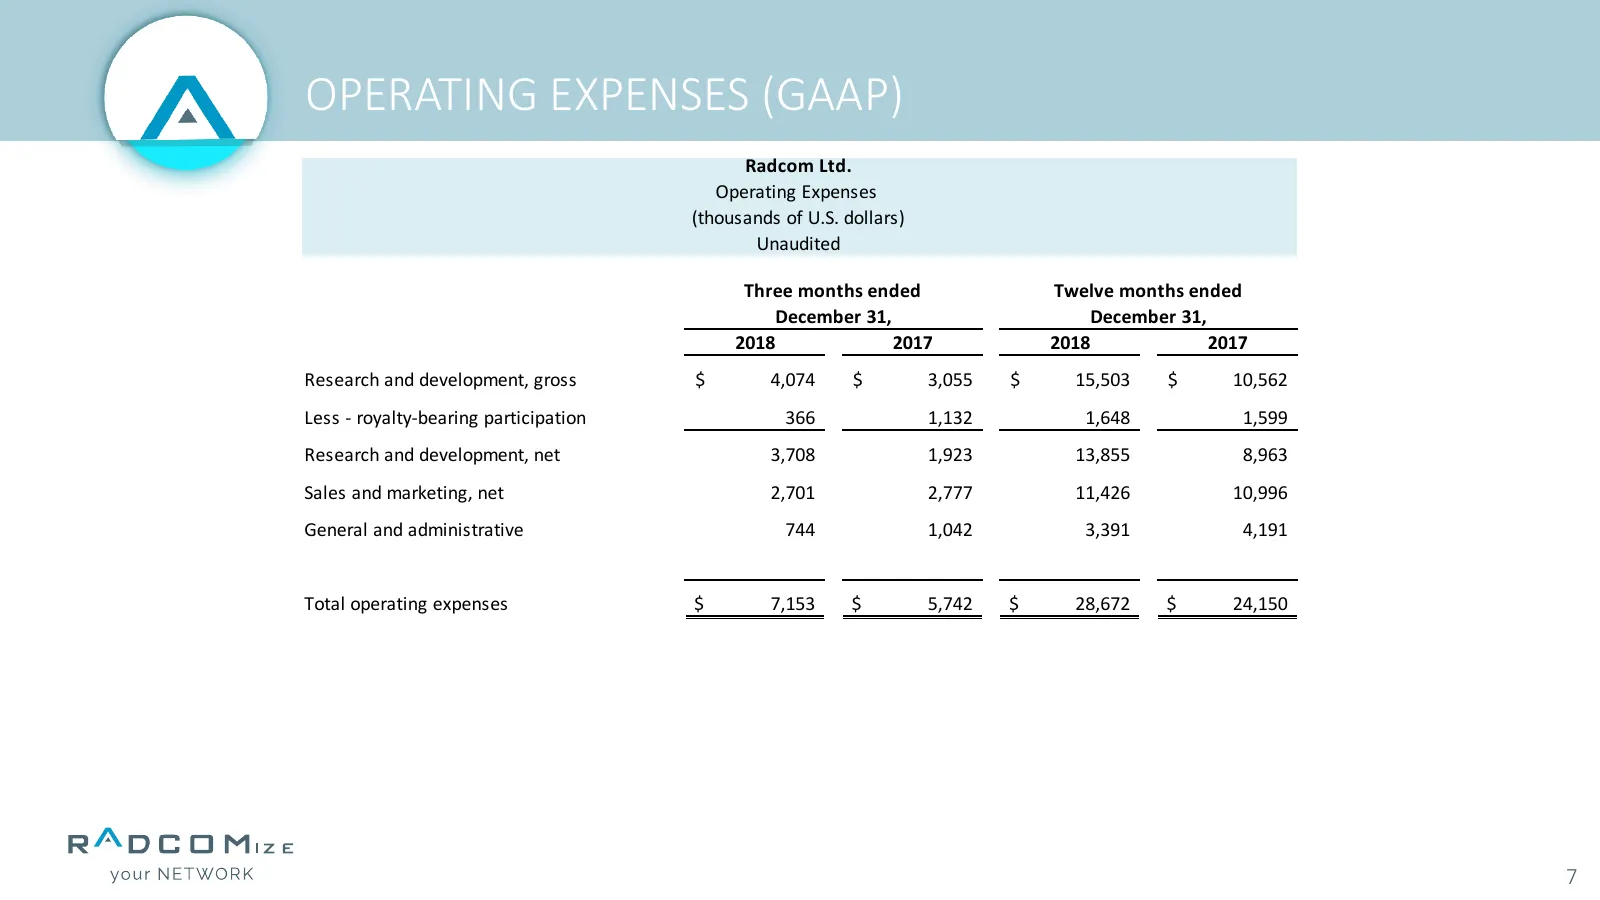
OPERATING EXPENSES (GAAP) Radcom Ltd. Operating Expenses (thousands of U.S. dollars) Unaudited Three months ended Twelve months ended December 31, December 31, 2018 2017 2018 2017 Research and development, gross $ 4,074 $ 3,055 $ 15,503 $ 10,562 Less - royalty-bearing participation 366 1,132 1,648 1
Slide 8: Operating Expenses (Non-GAAP)
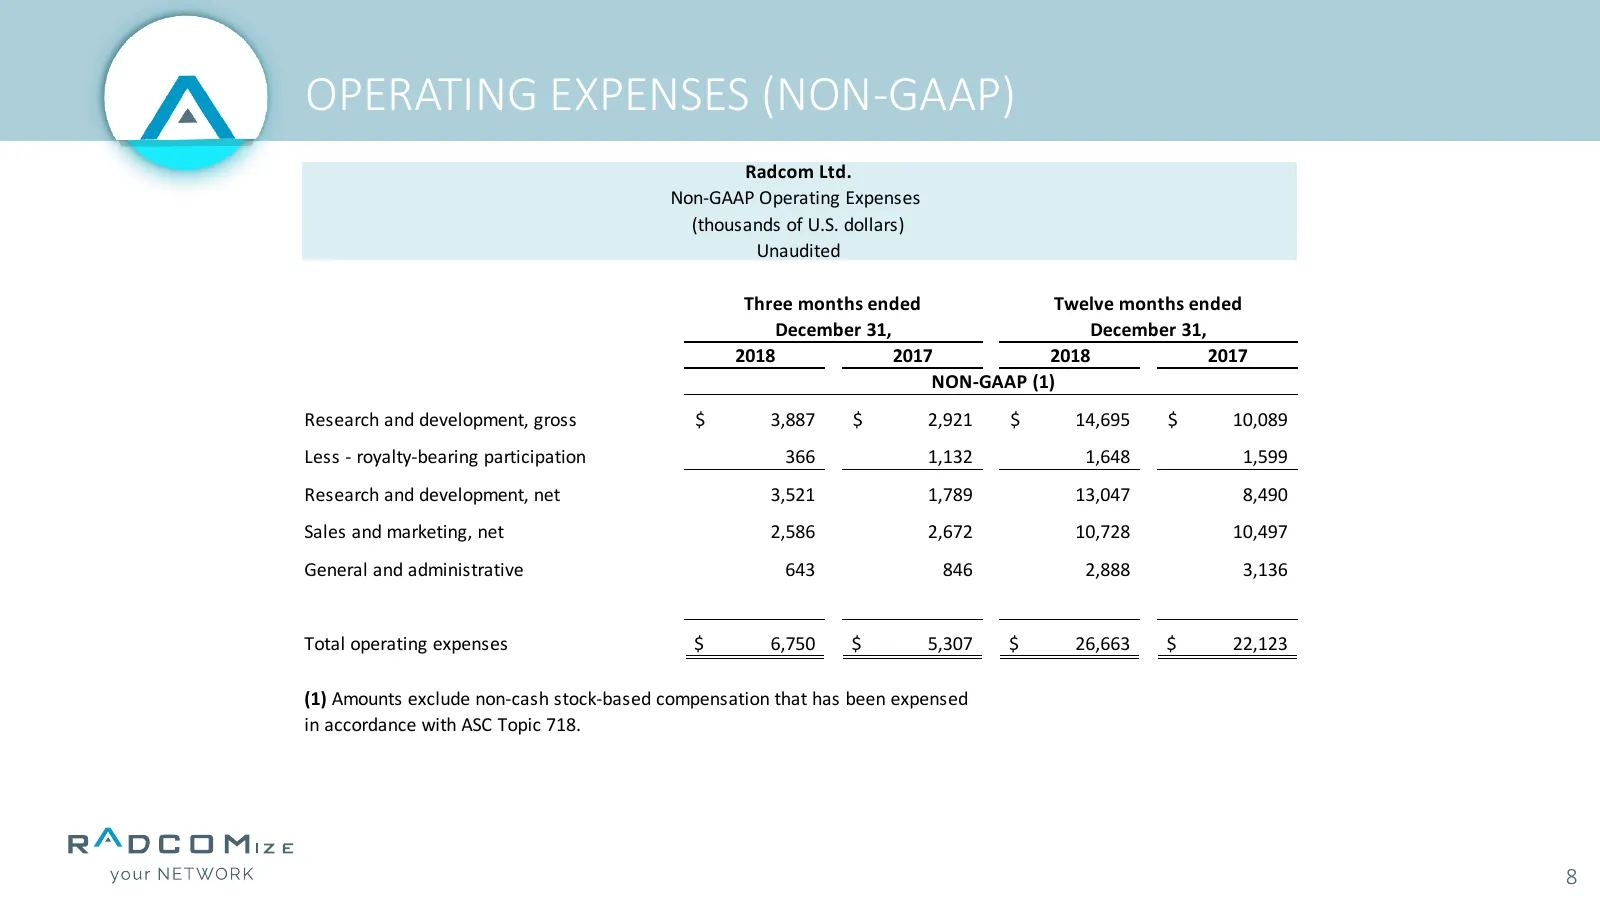
OPERATING EXPENSES (NON-GAAP) Radcom Ltd. Non-GAAP Operating Expenses (thousands of U.S. dollars) Unaudited Three months ended Twelve months ended December 31, December 31, 2018 2017 2018 2017 NON-GAAP (1) Research and development, gross $ 3,887 $ 2,921 $ 14,695 $ 10,089 Less - royalty-bearing parti
Slide 9: Consolidated Balance Sheets
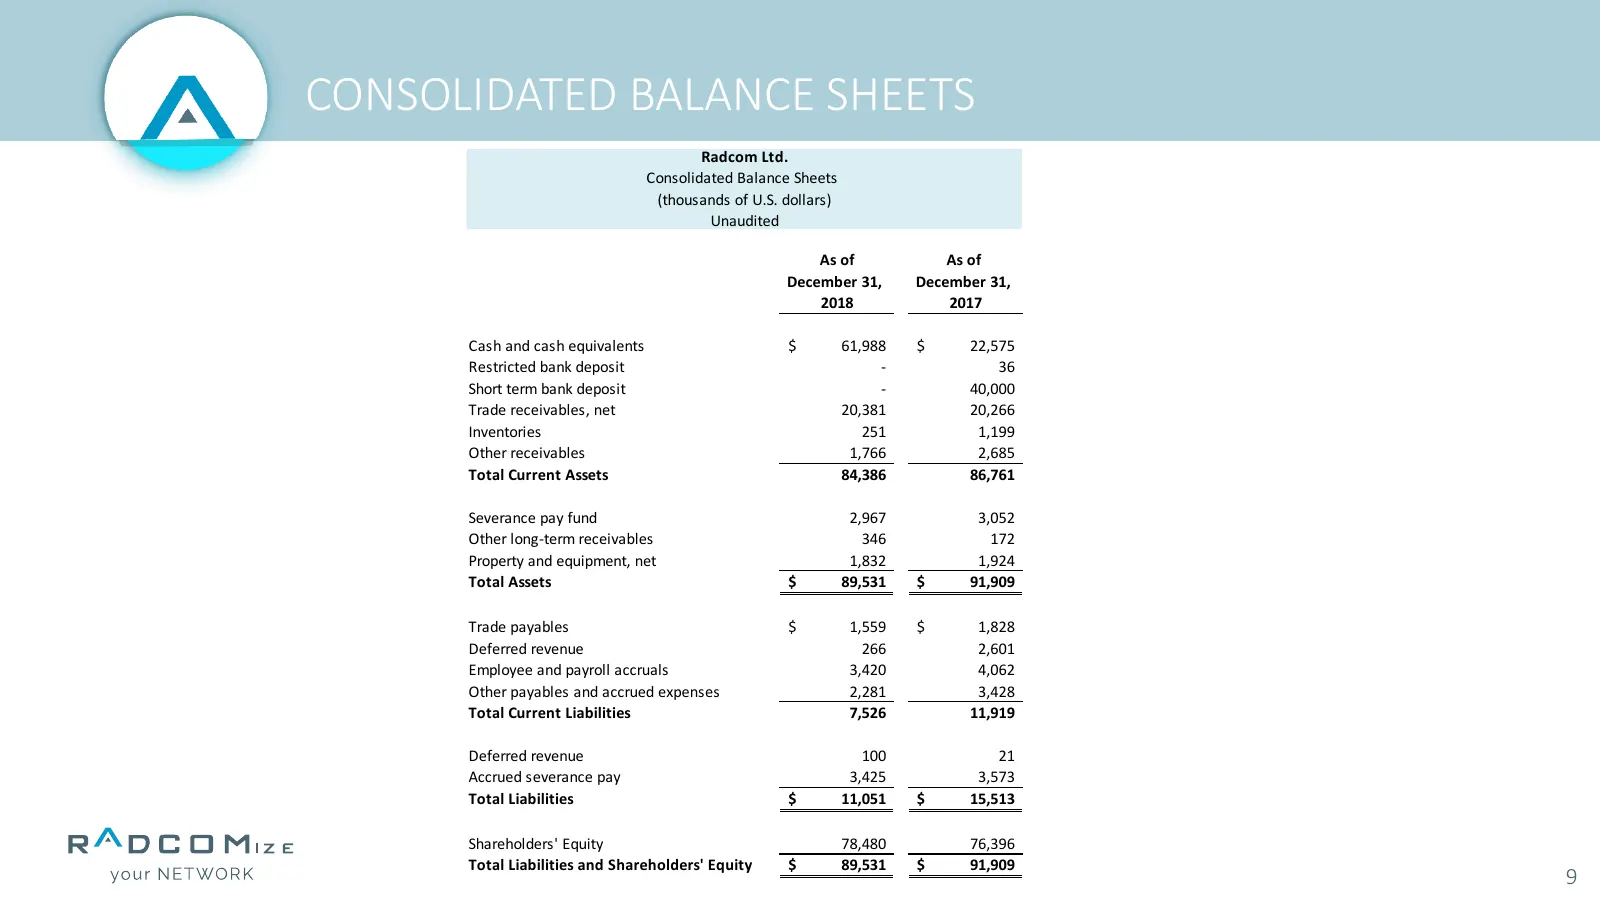
CONSOLIDATED BALANCE SHEETS Radcom Ltd. Consolidated Balance Sheets (thousands of U.S. dollars) Unaudited As of As of December 31, December 31, 2018 2017 Cash and cash equivalents $ 61,988 $ 22,575 Restricted bank deposit - 36 Short term bank deposit - 40,000 Trade receivables, net 20,381 20,266 Inv
Slide 10: Current Assets vs. Current Liabilities ($M)
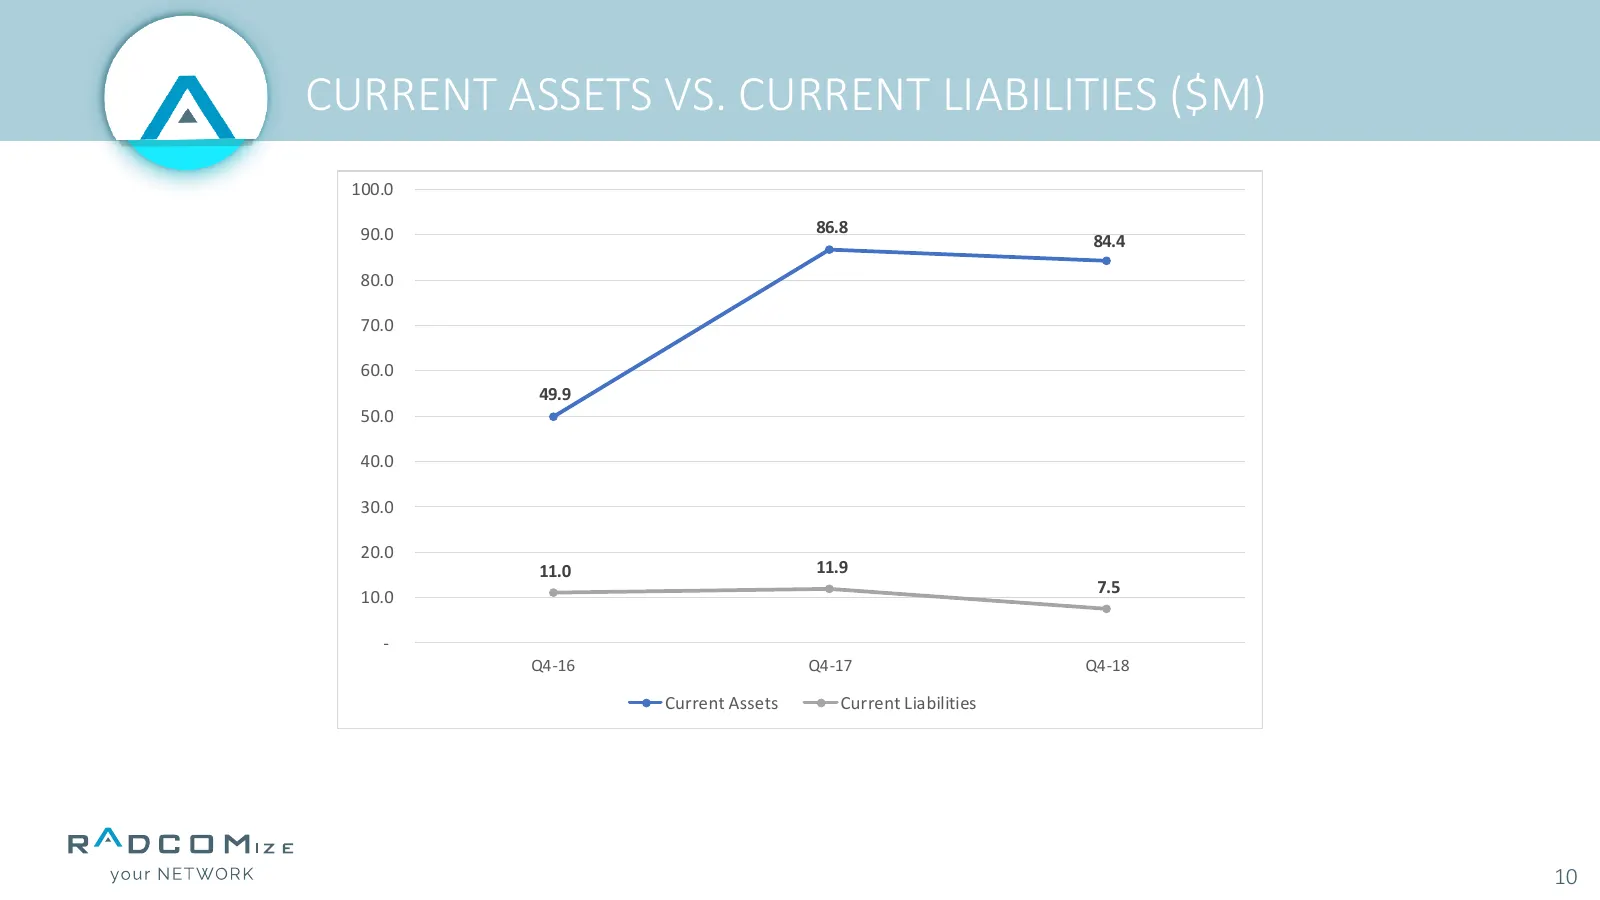
CURRENT ASSETS VS. CURRENT LIABILITIES ($M) 100.0 90.0 86.8 84.4 80.0 70.0 60.0 49.9 50.0 40.0 30.0 20.0 11.0 11.9 7.5 10.0 - Q4-16 Q4-17 Q4-18 Current Assets Current Liabilities 10

Slide 11: All rights reserved. Proprietary information of RADCOM Ltd.
All rights reserved. This presentation contains proprietary information of RADCOM Ltd. Without the express prior written permission of RADCOM Ltd., no part of the contents hereof may be used for any other purpose, disclosed to persons or firms outside the recipient company, or reproduced by any mean
Source: Internet Archive copy of radcom.com
More decks from Radcom Ltd.
 Q3 2026 Earnings Presentation25 slides · Nov 11, 2026
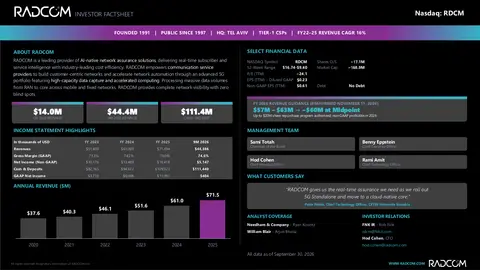 Fact Sheet (November 2026)1 slide · Nov 11, 2026
 Investor Presentation (November 2026)18 slides · November 2026
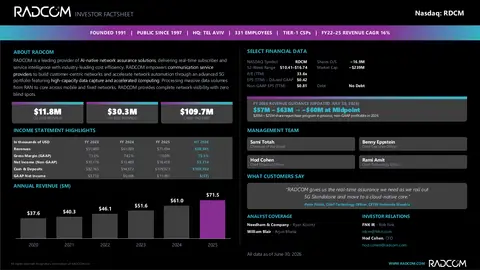 Fact Sheet (October 2026)1 slide · October 2026
 Q2 2026 Earnings Presentation28 slides · Aug 12, 2026
 Investor Presentation (August 2026)19 slides · August 2026