CrossFirst Bankshares — Investor Presentation (May 2021)
25 slides from CrossFirst Bankshares's investor presentation, May 18, 2021

Slide 1: Texas Field Trip Investor Presentation May 19th, 2021
Texas Field Trip I N V E S T O R P R E S E N T A T I O N M A Y 1 9 t h , 2 0 2 1

Slide 2: Forward-Looking Statements
2 FORWARD-LOOKING STATEMENTS. This presentation and oral statements made during this meeting contain forward-looking statements. These forward- looking statements reflect our current views with respect to, among other things, future events and our financial performance. These statements are often, b
Slide 3: Other Senior Executives
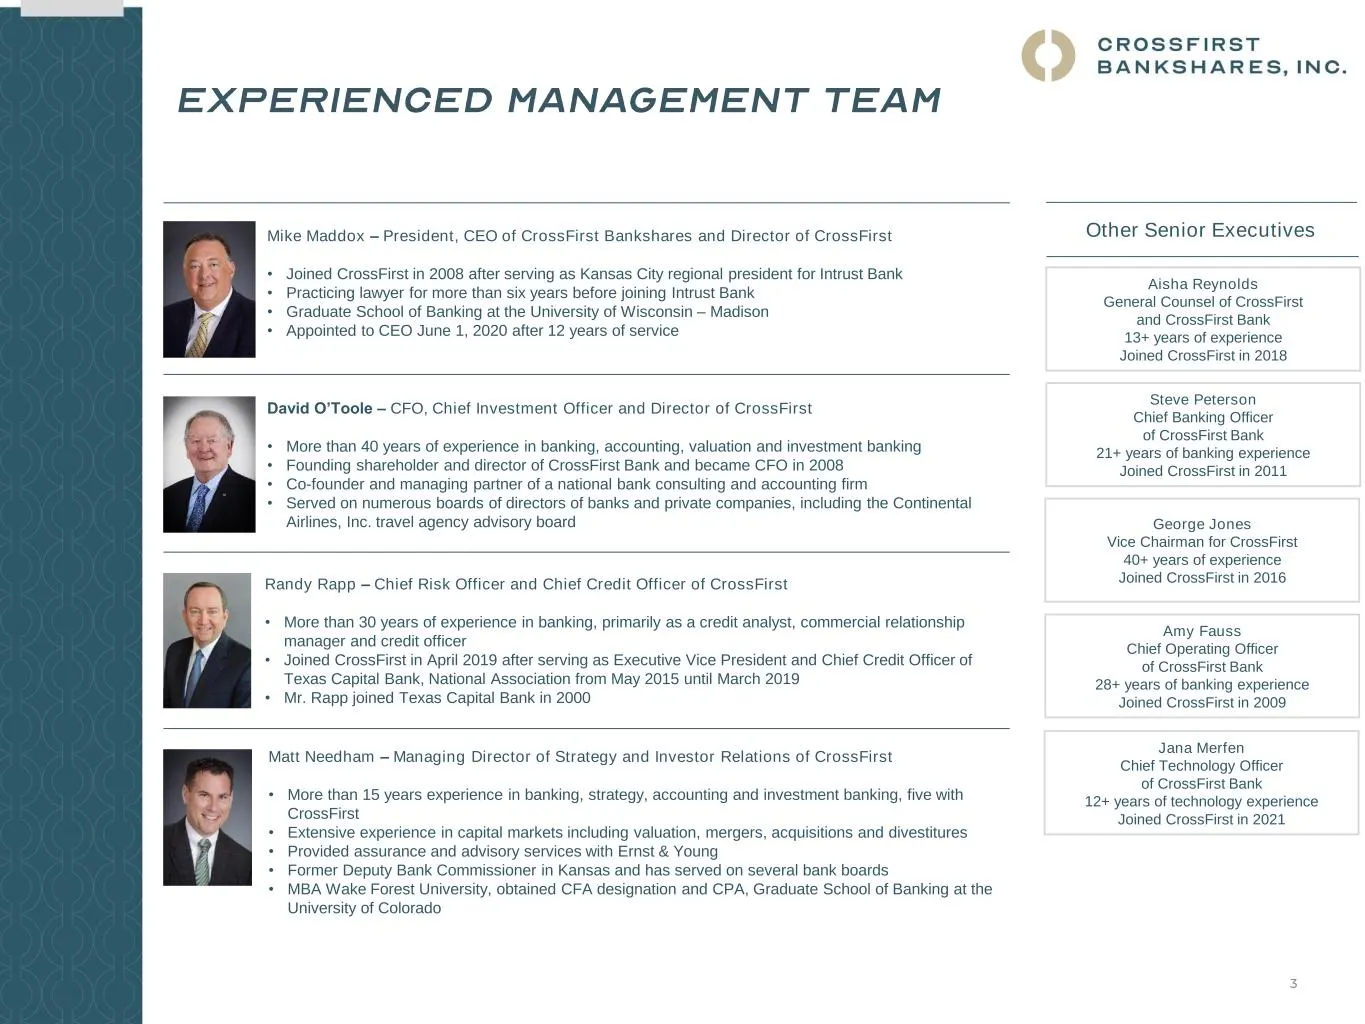
3 Other Senior Executives Amy Fauss Chief Operating Officer of CrossFirst Bank 28+ years of banking experience Joined CrossFirst in 2009 Aisha Reynolds General Counsel of CrossFirst and CrossFirst Bank 13+ years of experience Joined CrossFirst in 2018 Matt Needham – Managing Director of Strategy and
Slide 4: Q1 2021 Highlights
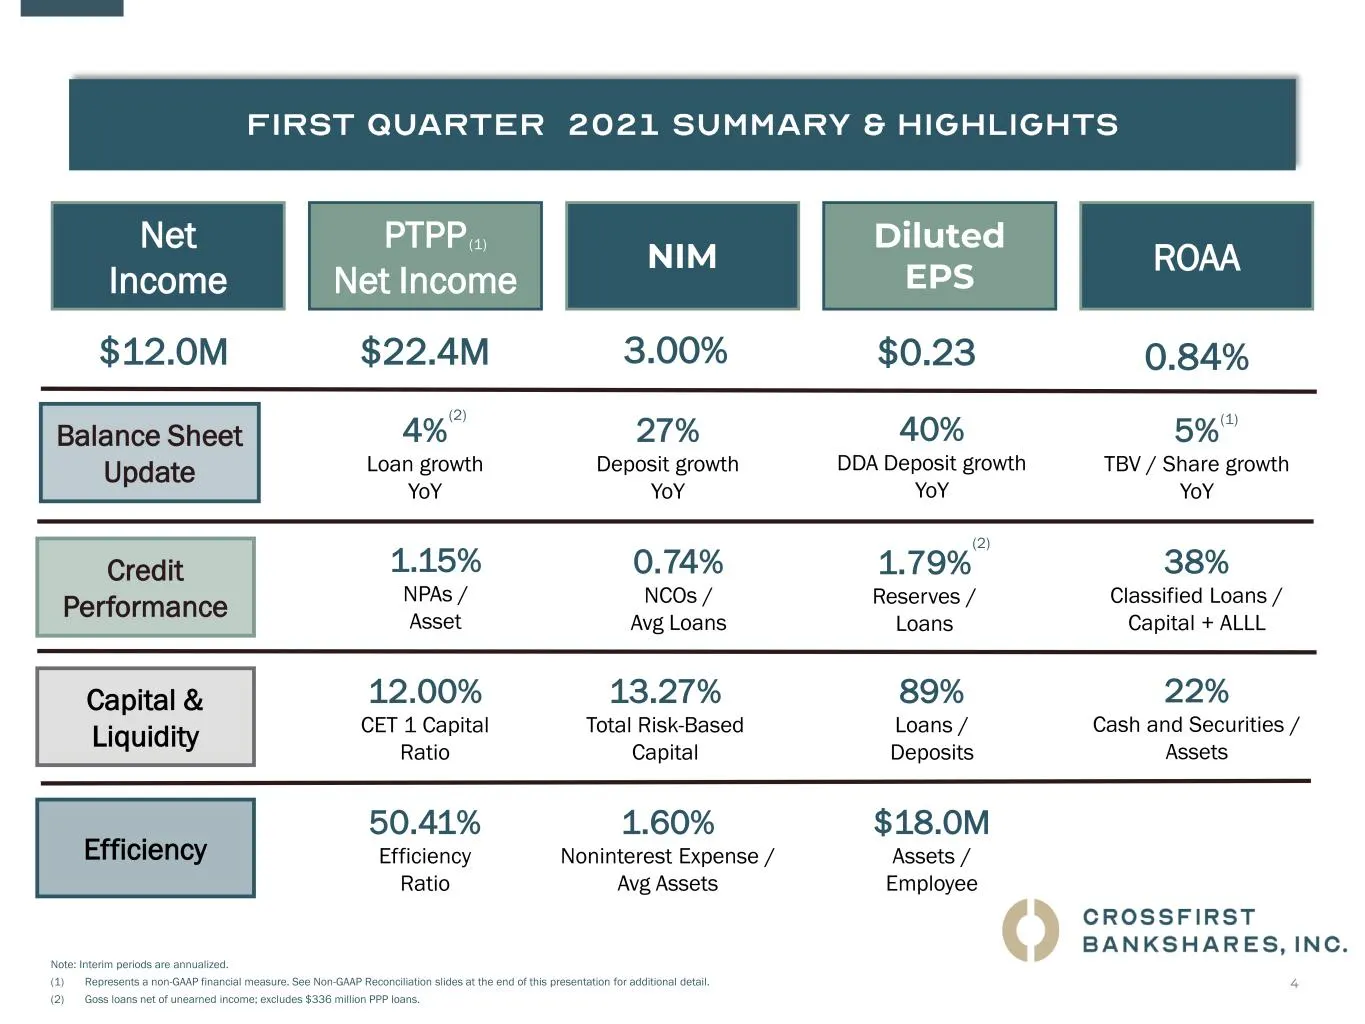
4 Net Income PTPP Net Income NIM Diluted EPS ROAA $12.0M $22.4M 3.00% 0.84% 4 Note: Interim periods are annualized. (1) Represents a non-GAAP financial measure. See Non-GAAP Reconciliation slides at the end of this presentation for additional detail. (2) Goss loans net of unearned income; excludes $
Slide 5: Tangible Book Value and Price/TBV
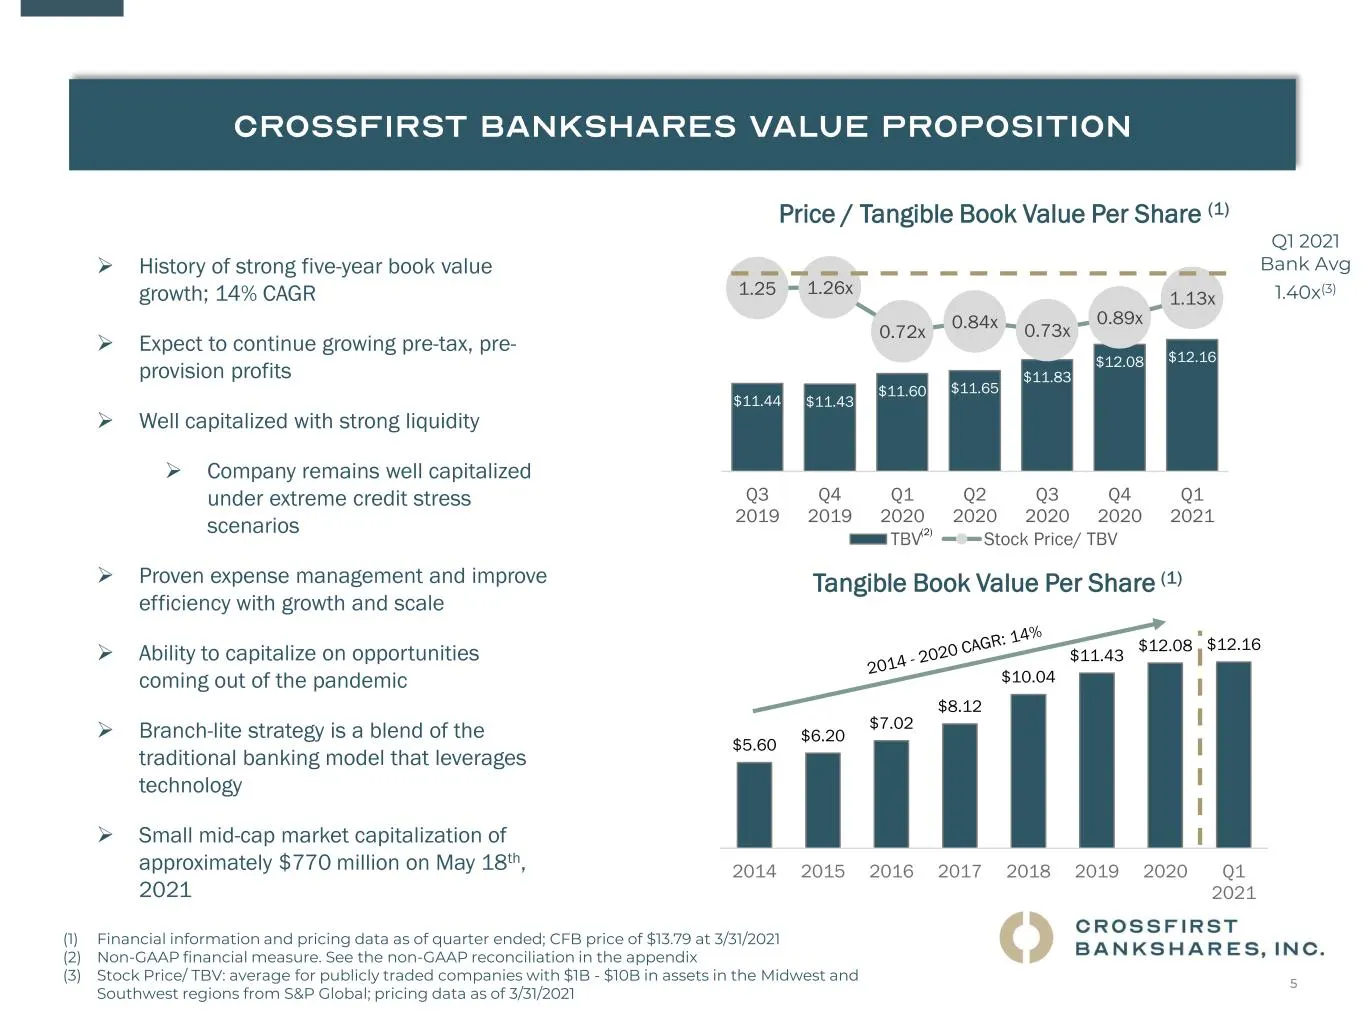
5 $11.44 $11.43 $11.60 $11.65 $11.83 $12.08 $12.16 1.25 1.26x 0.72x 0.84x 0.73x 0.89x 1.13x -1.00 -0.50 0.00 0.50 1.00 1.50 2.00 10 10.5 11 11.5 12 12.5 13 13.5 14 Q3 2019 Q4 2019 Q1 2020 Q2 2020 Q3 2020 Q4 2020 Q1 2021 TBV Stock Price/ TBV 5 ➢ History of strong five-year book value growth; 14% CAGR
Slide 6: Company Overview and Markets
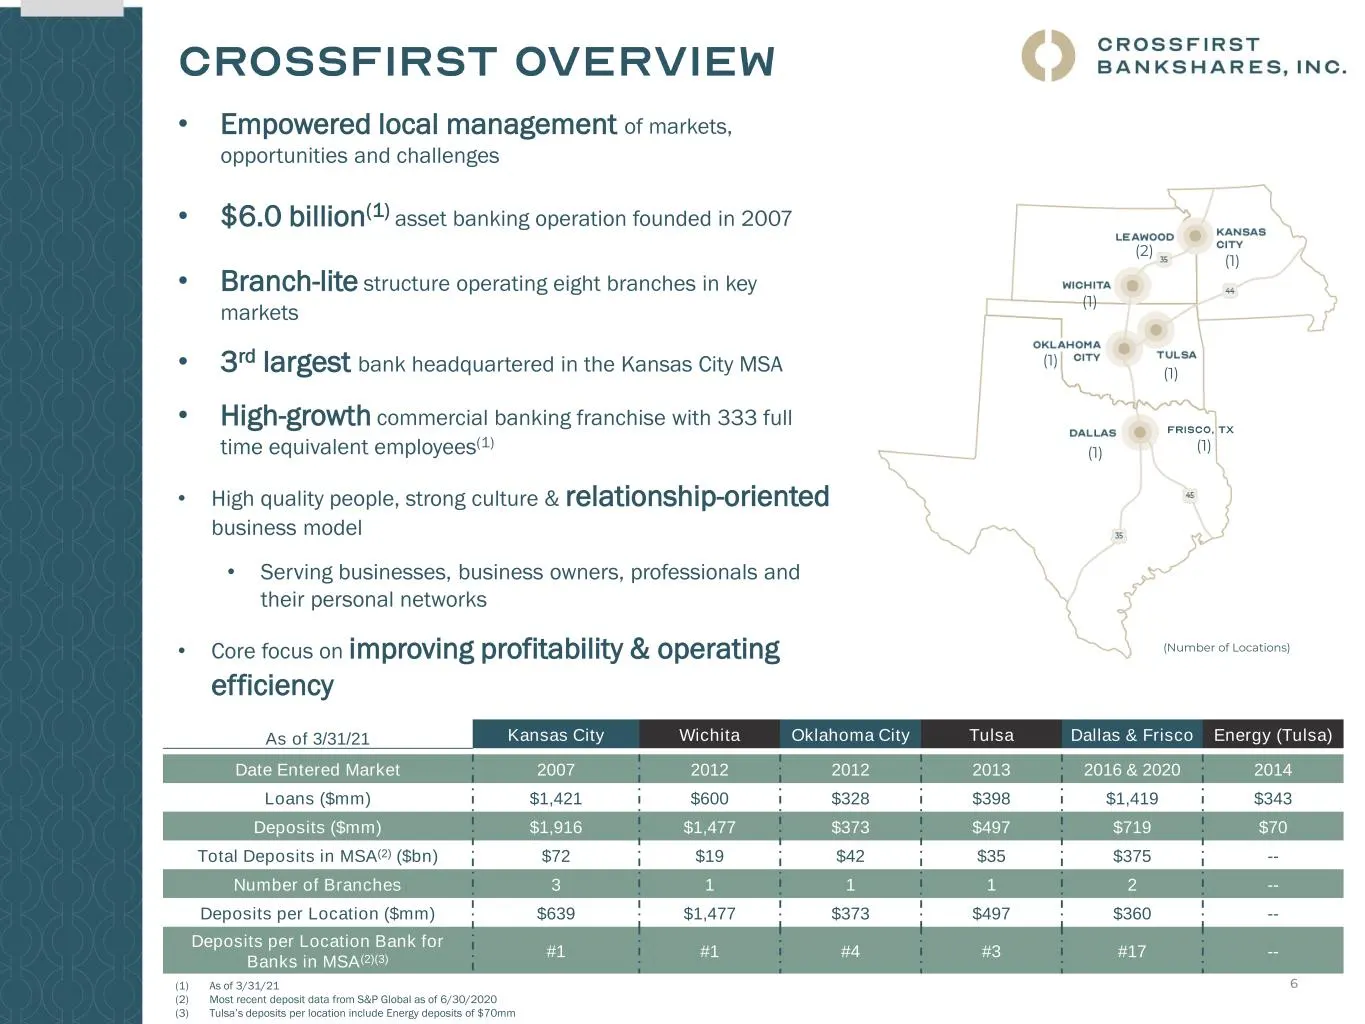
6 • Empowered local management of markets, opportunities and challenges • $6.0 billion(1) asset banking operation founded in 2007 • Branch-lite structure operating eight branches in key markets • 3rd largest bank headquartered in the Kansas City MSA • High-growth commercial banking franchise with 33
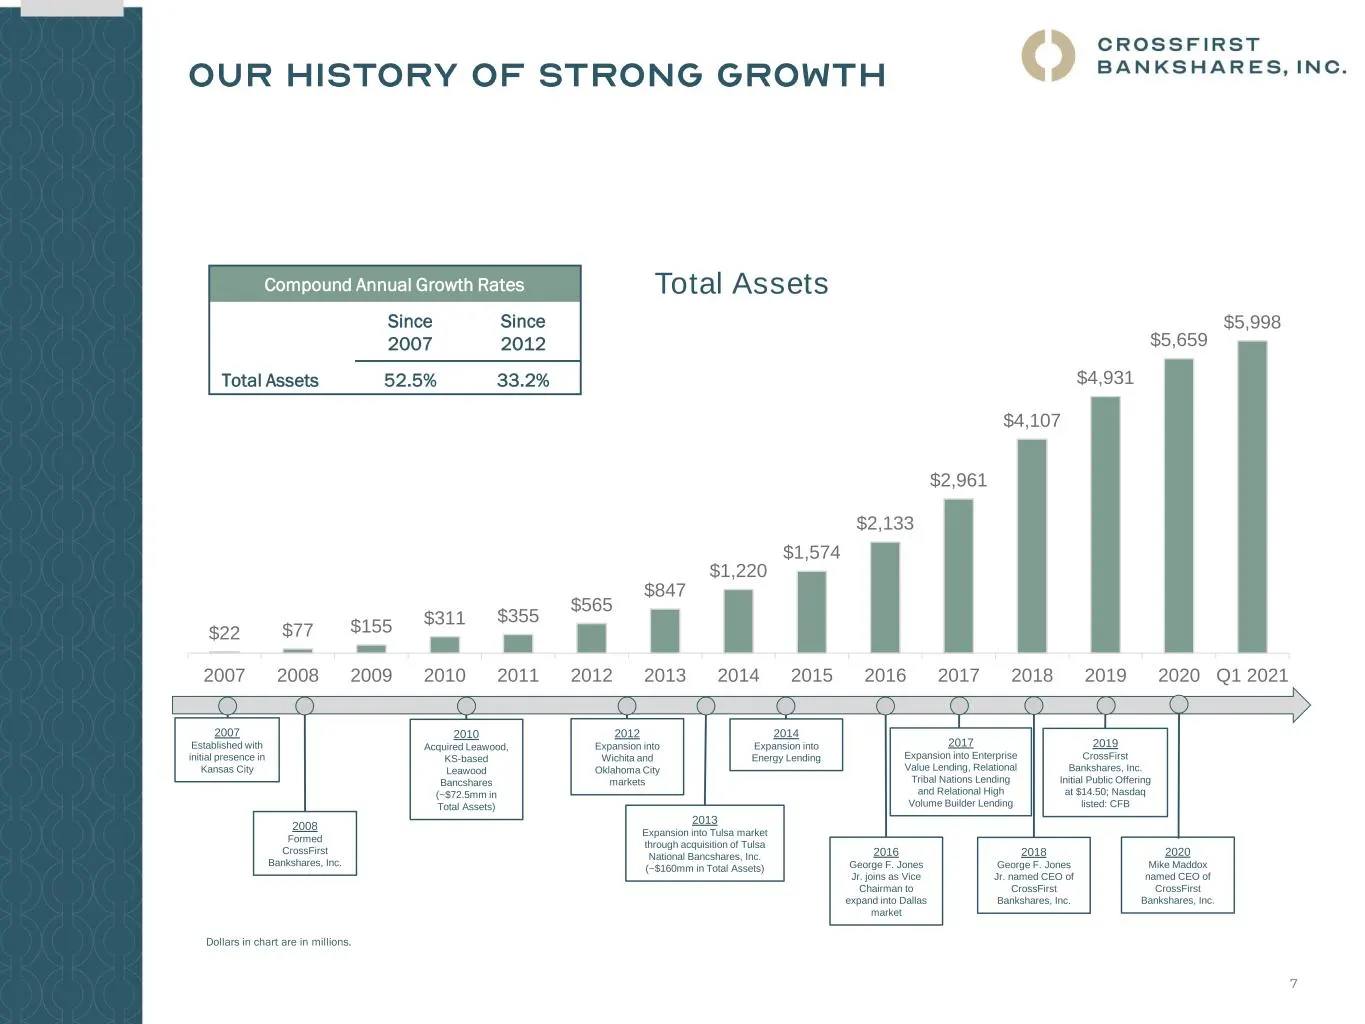
Slide 7: History and Total Asset Growth
7 2017 Expansion into Enterprise Value Lending, Relational Tribal Nations Lending and Relational High Volume Builder Lending $22 $77 $155 $311 $355 $565 $847 $1,220 $1,574 $2,133 $2,961 $4,107 $4,931 $5,659 $5,998 2007 2008 2009 2010 2011 2012 2013 2014 2015 2016 2017 2018 2019 2020 Q1 2021 Total As
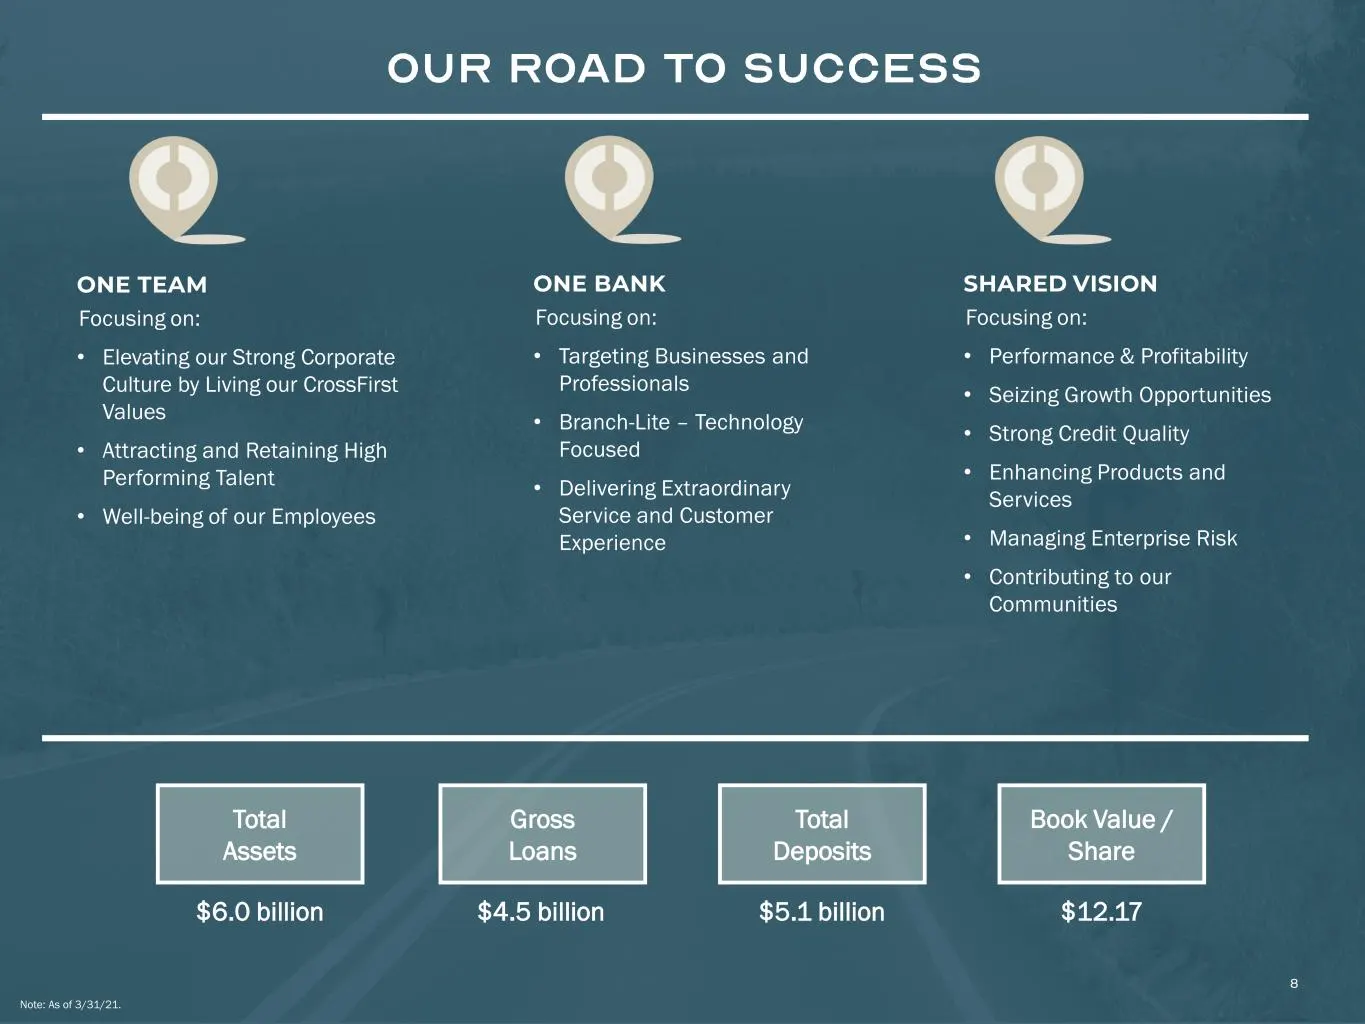
Slide 8: One Bank, One Team, Shared Vision
8 Total Assets Total Deposits Book Value / Share $6.0 billion Gross Loans $4.5 billion $5.1 billion $12.17 SHARED VISION Focusing on: • Performance & Profitability • Seizing Growth Opportunities • Strong Credit Quality • Enhancing Products and Services • Managing Enterprise Risk • Contributing to ou
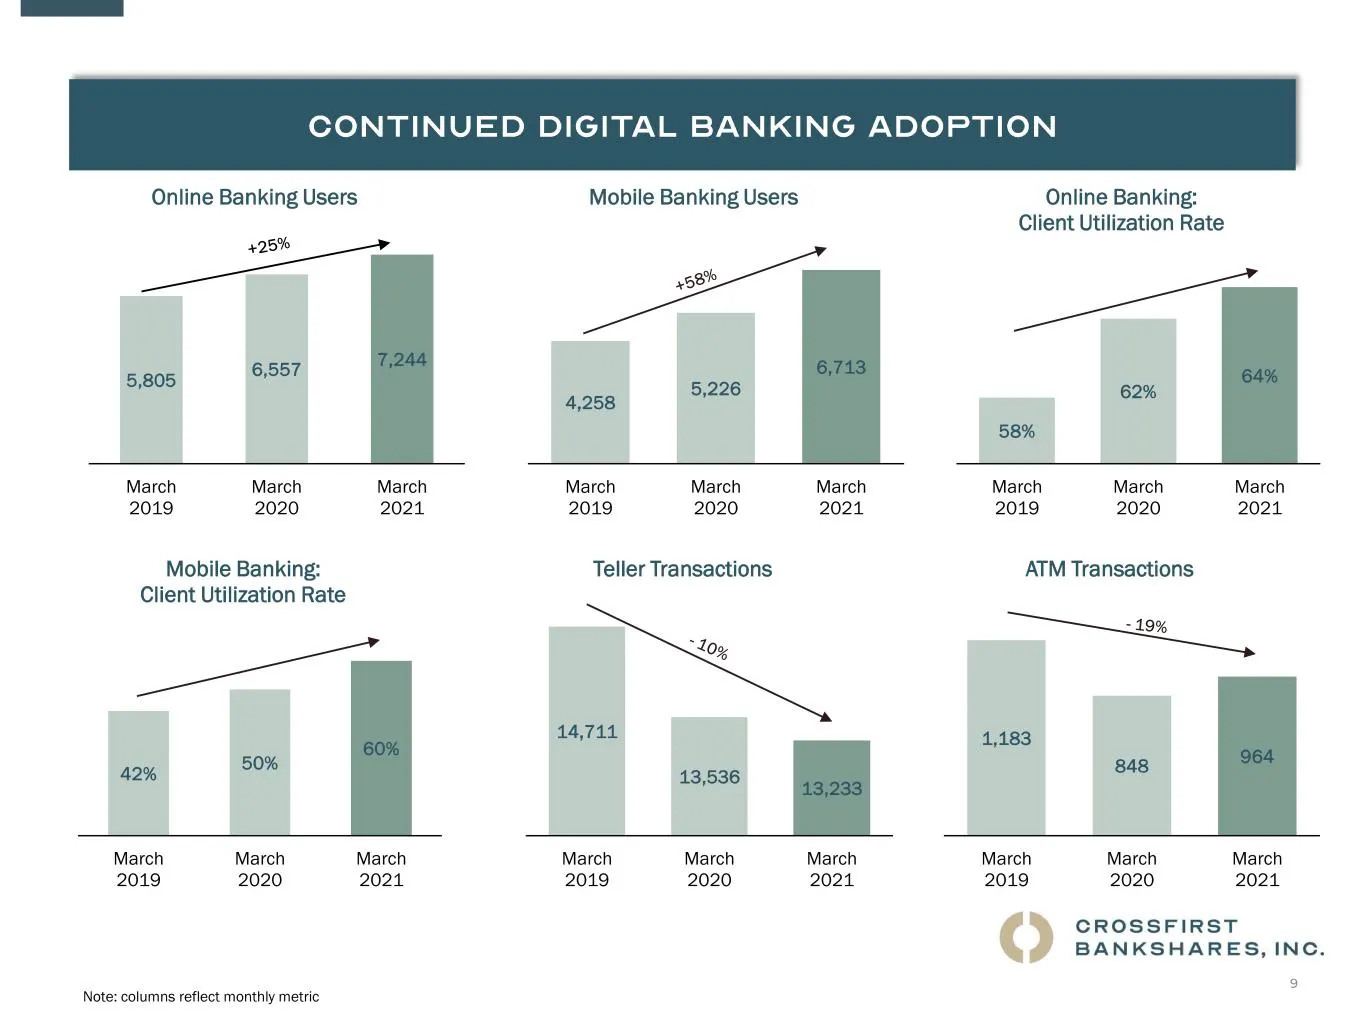
Slide 9: Digital Banking Usage Trends
9 9 5,805 6,557 7,244 0 1,000 2,000 3,000 4,000 5,000 6,000 7,000 8,000 March 2019 March 2020 March 2021 Online Banking Users 4,258 5,226 6,713 0 1,000 2,000 3,000 4,000 5,000 6,000 7,000 8,000 March 2019 March 2020 March 2021 Mobile Banking Users 58% 62% 64% 54% 56% 58% 60% 62% 64% 66% March 2019 M
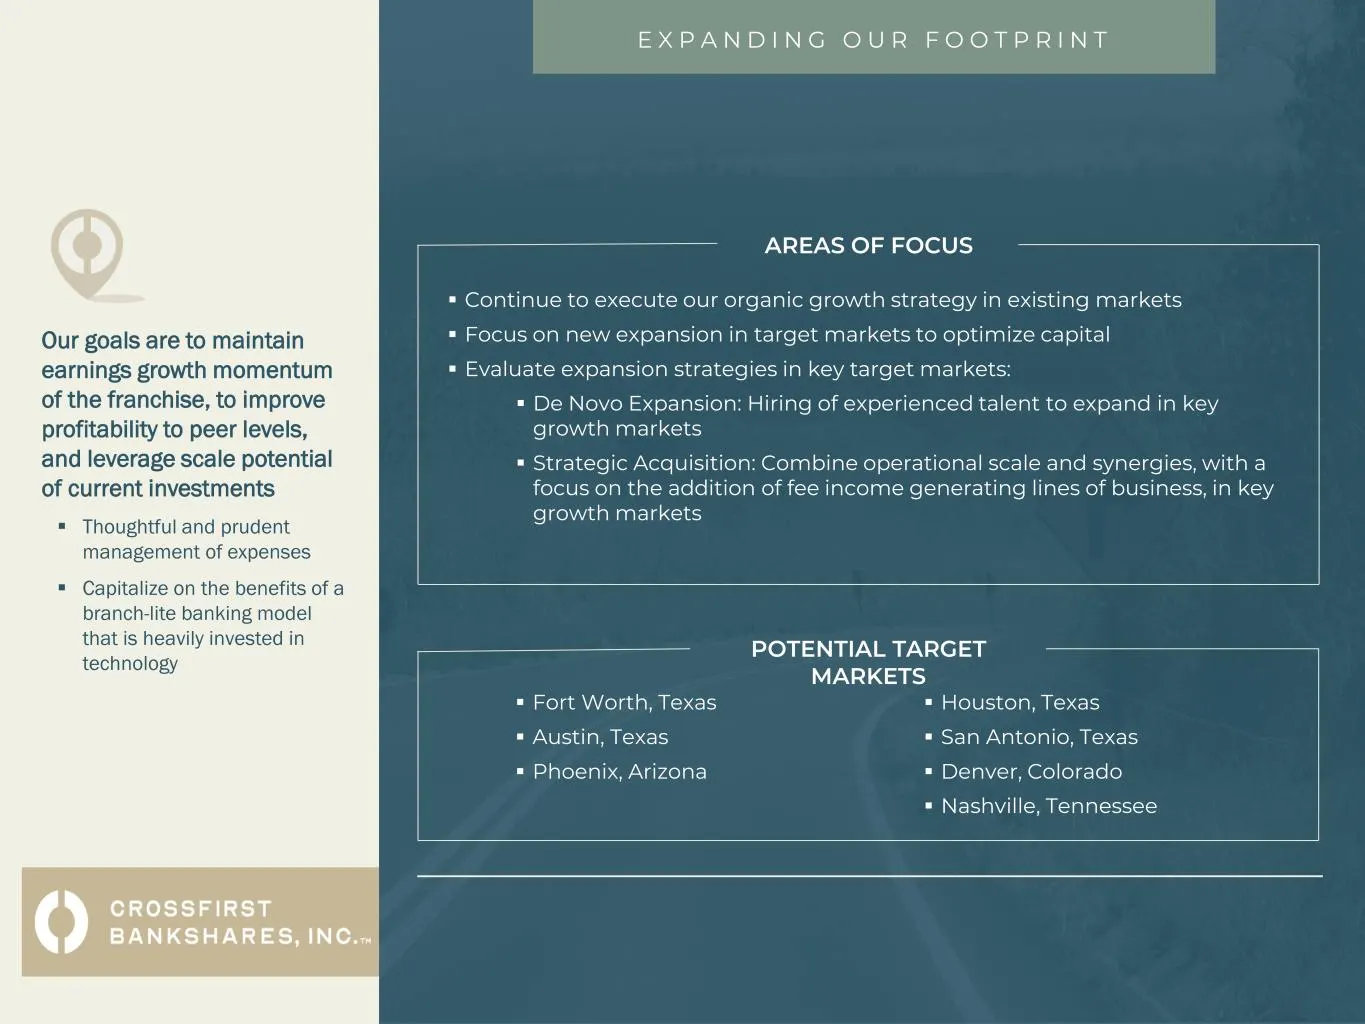
Slide 10: Growth Strategy and Target Markets
Our goals are to maintain earnings growth momentum of the franchise, to improve profitability to peer levels, and leverage scale potential of current investments ▪ Thoughtful and prudent management of expenses ▪ Capitalize on the benefits of a branch-lite banking model that is heavily invested in te
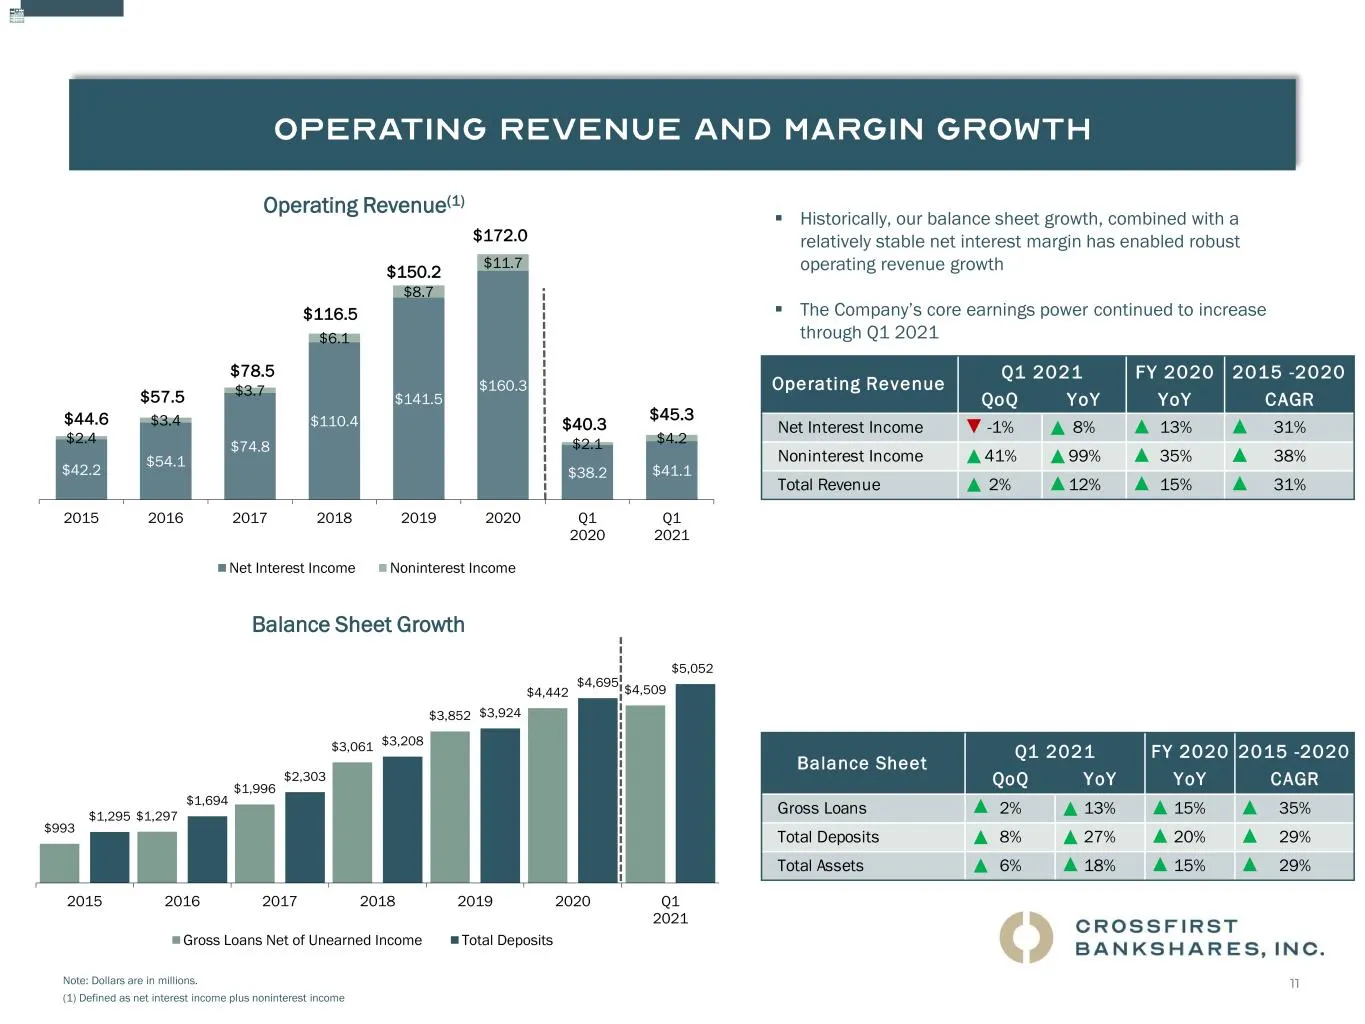
Slide 11: Operating Revenue and Balance Sheet Growth
11 11 Note: Dollars are in millions. (1) Defined as net interest income plus noninterest income ▪ Historically, our balance sheet growth, combined with a relatively stable net interest margin has enabled robust operating revenue growth ▪ The Company’s core earnings power continued to increase throug
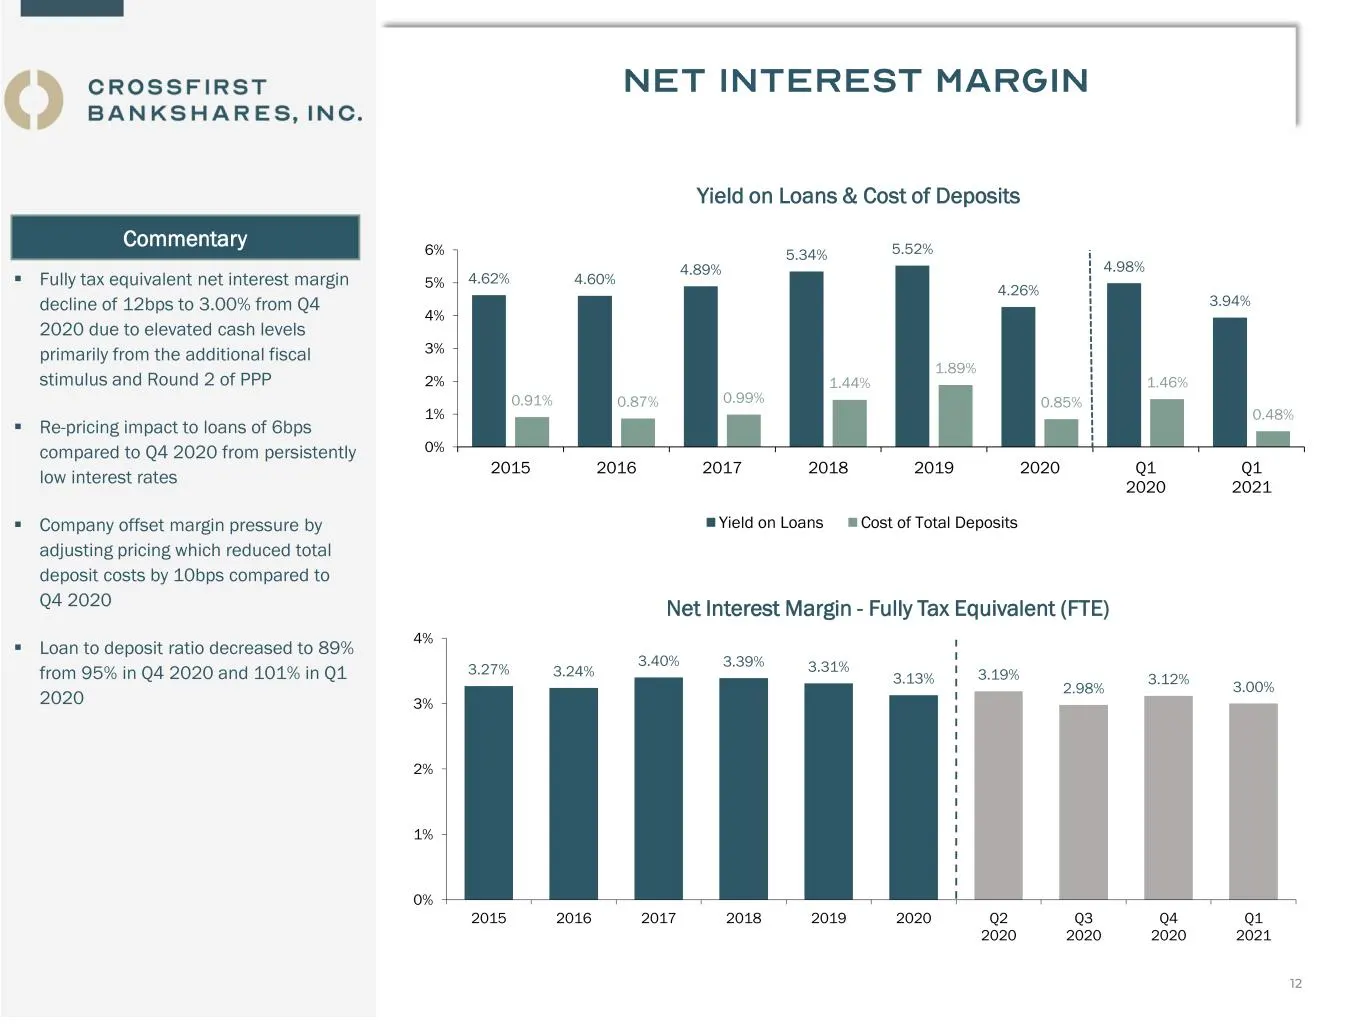
Slide 12: Net Interest Margin, Loan Yield and Deposit Cost
12 ▪ Fully tax equivalent net interest margin decline of 12bps to 3.00% from Q4 2020 due to elevated cash levels primarily from the additional fiscal stimulus and Round 2 of PPP ▪ Re-pricing impact to loans of 6bps compared to Q4 2020 from persistently low interest rates ▪ Company offset margin pres
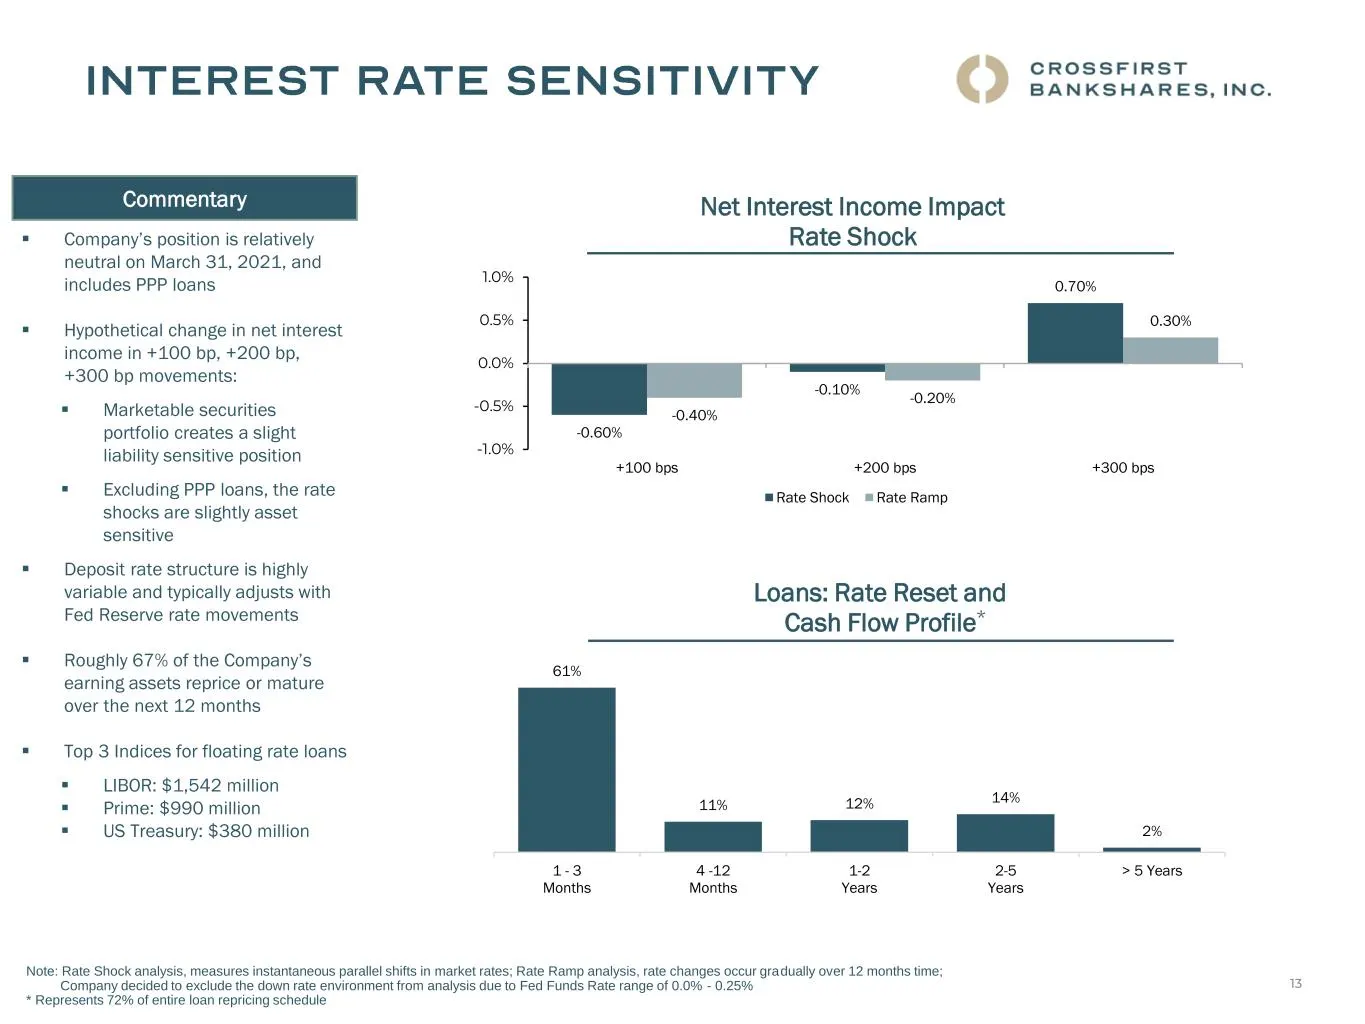
Slide 13: Interest Rate Sensitivity
1313 -0.60% -0.10% 0.70% -0.40% -0.20% 0.30% -1.0% -0.5% 0.0% 0.5% 1.0% +100 bps +200 bps +300 bps Net Interest Income Impact Rate Shock Rate Shock Rate Ramp ▪ Company’s position is relatively neutral on March 31, 2021, and includes PPP loans ▪ Hypothetical change in net interest income in +100 bp,
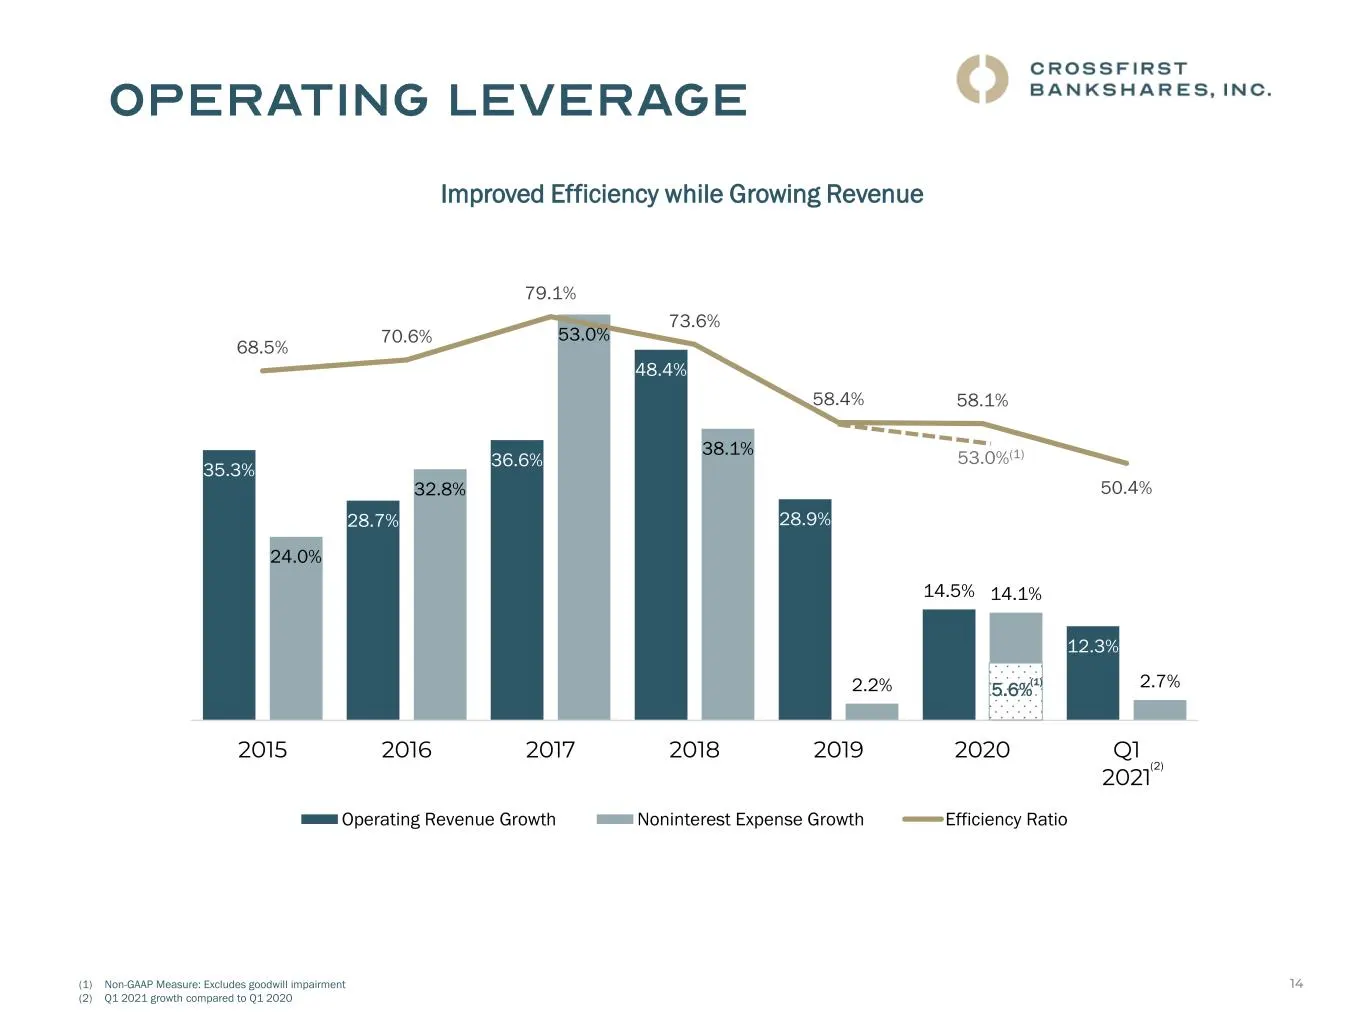
Slide 14: Improved Efficiency while Growing Revenue
1414 35.3% 28.7% 36.6% 48.4% 28.9% 14.5% 12.3% 24.0% 32.8% 53.0% 38.1% 2.2% 14.1% 2.7% 68.5% 70.6% 79.1% 73.6% 58.4% 58.1% 50.4% 0% 10% 20% 30% 40% 50% 60% 70% 80% 90% 0% 10% 20% 30% 40% 50% 60% 2015 2016 2017 2018 2019 2020 Q1 2021 E ffic ie n c y R a tio R e v e n u e a n d E x p e n s e G ro w th
Slide 15: Lowering Expenses
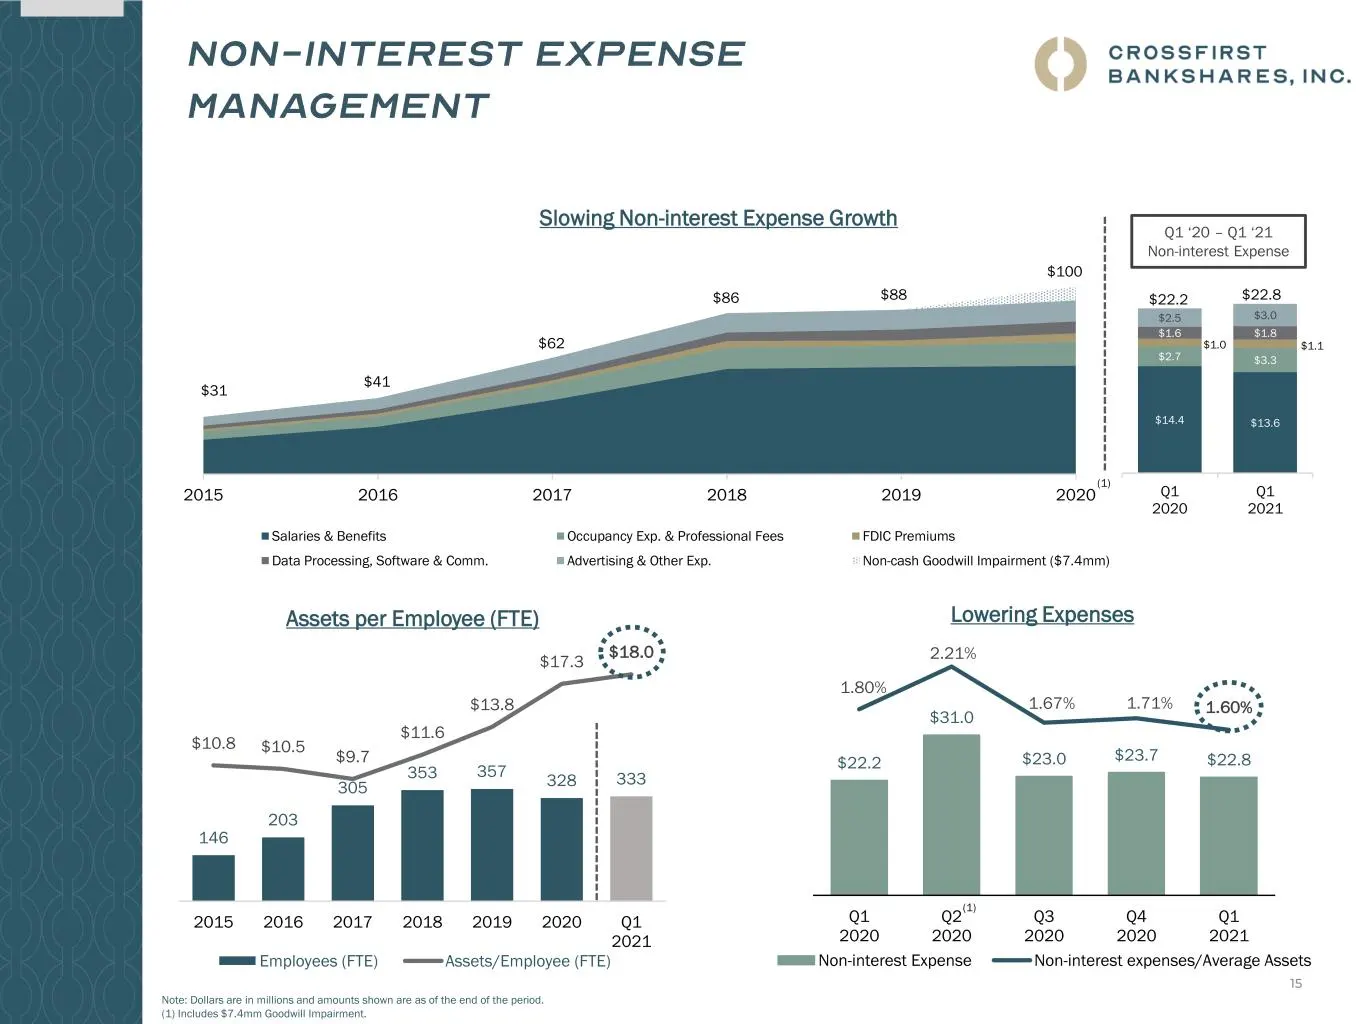
15 $- $20 $40 $60 $80 $100 $120 2015 2016 2017 2018 2019 2020 Salaries & Benefits Occupancy Exp. & Professional Fees FDIC Premiums Data Processing, Software & Comm. Advertising & Other Exp. Non-cash Goodwill Impairment ($7.4mm) $31 $13.6 $14.4 $3.3 $2.7 $1.1 $1.0 $1.8 $1.6 $3.0 $2.5 $- $5 $10 $15 $2
Slide 16: Investment Highlights
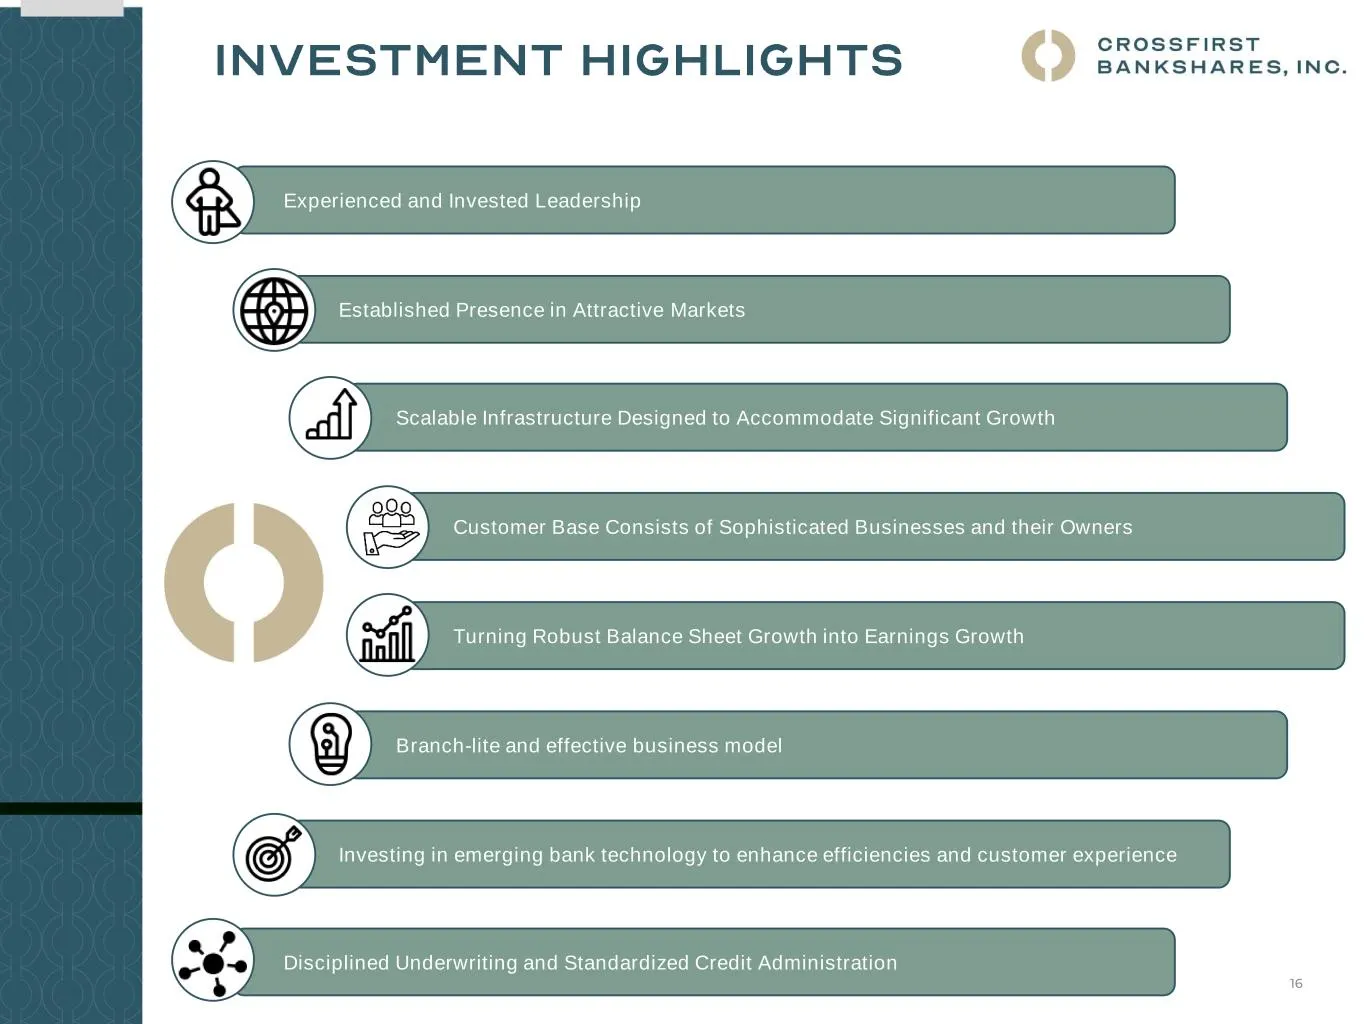
16 Disciplined Underwriting and Standardized Credit Administration Scalable Infrastructure Designed to Accommodate Significant Growth Established Presence in Attractive Markets Experienced and Invested Leadership Customer Base Consists of Sophisticated Businesses and their Owners Turning Robust Bala

Slide 17: Supplemental Information
CROSSFIRST BANKSHARES, INC. SUPPLEMENTAL INFORMATION
Slide 18: Loan Portfolio Breakdown
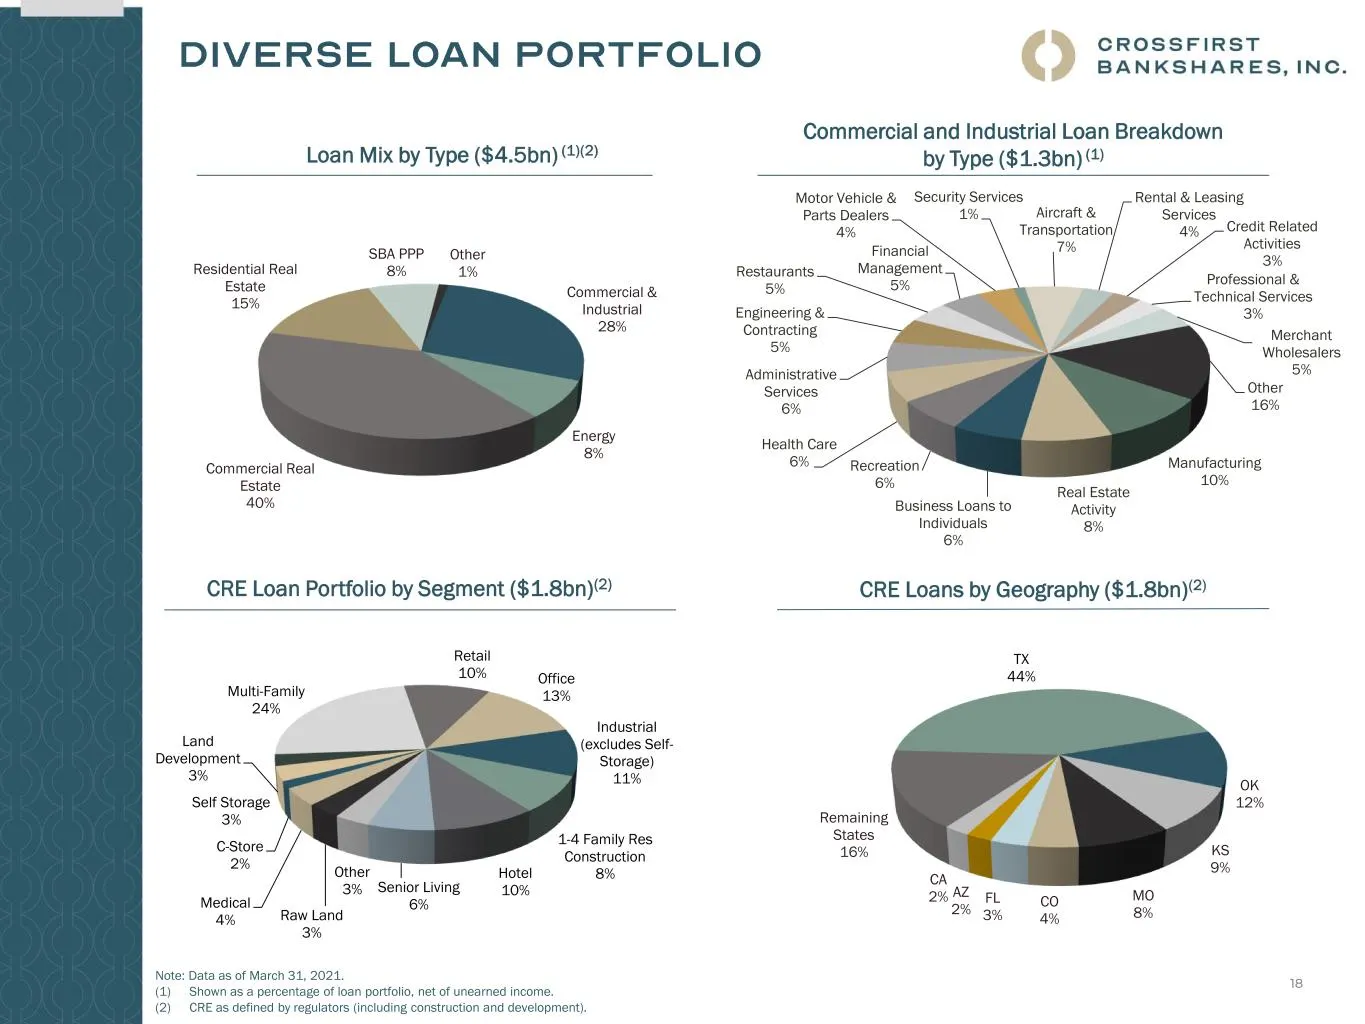
18 Other 16% Manufacturing 10% Real Estate Activity 8% Business Loans to Individuals 6% Recreation 6% Health Care 6% Administrative Services 6% Engineering & Contracting 5% Restaurants 5% Financial Management 5% Motor Vehicle & Parts Dealers 4% Security Services 1% Aircraft & Transportation 7% Renta
Slide 19: PPP Loans
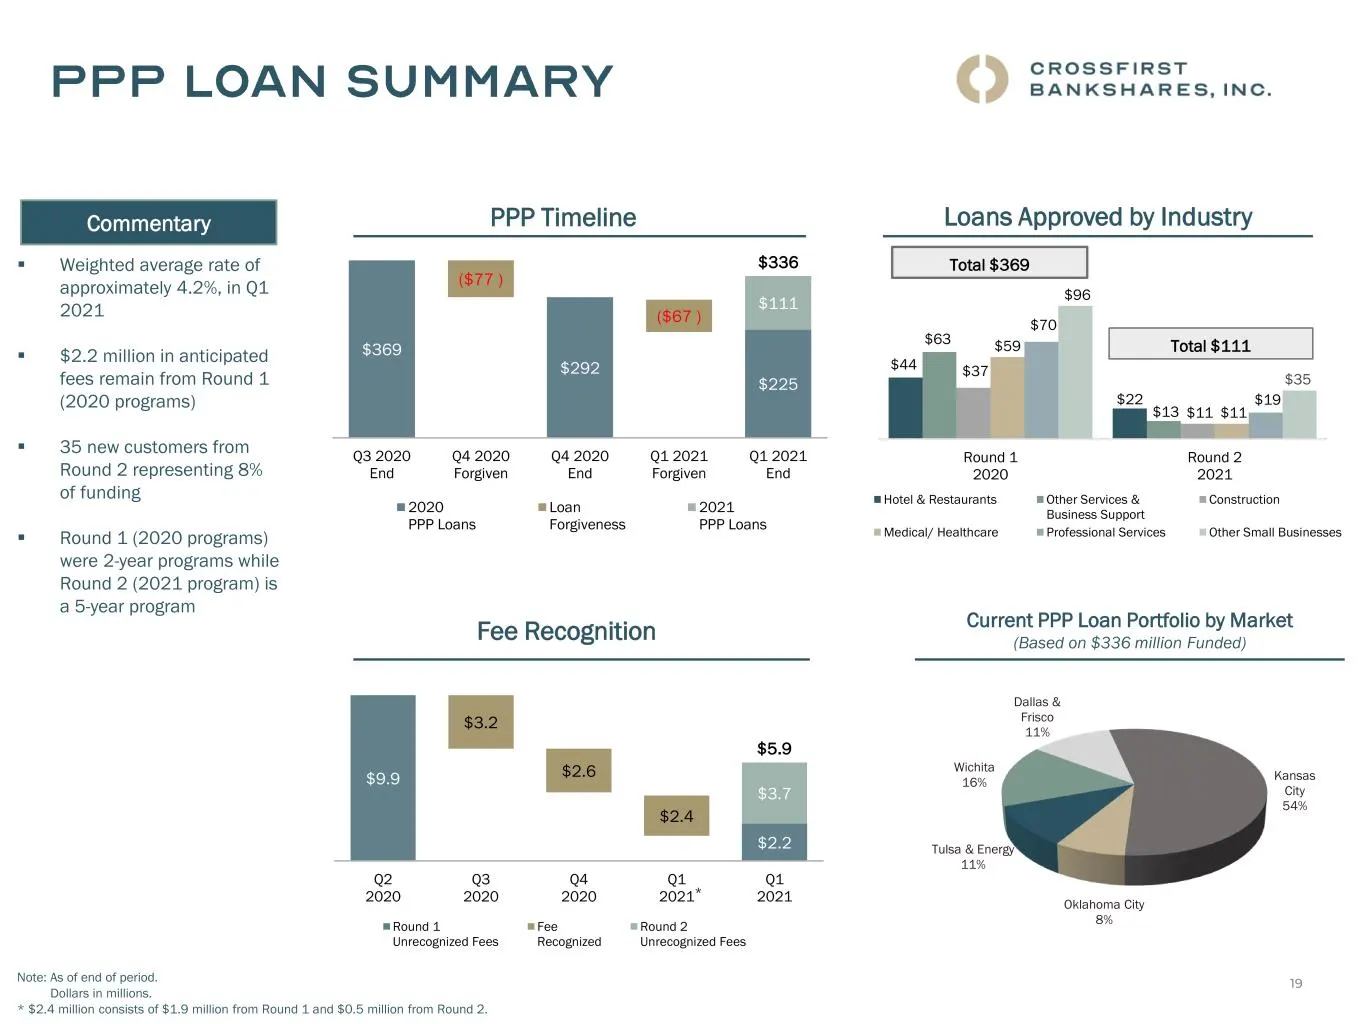
1919 $44 $22 $63 $13 $37 $11 $59 $11 $70 $19 $96 $35 $- $20 $40 $60 $80 $100 $120 Round 1 2020 Round 2 2021 Loans Approved by Industry Hotel & Restaurants Other Services & Business Support Construction Medical/ Healthcare Professional Services Other Small Businesses $369 $292 $225 ($77 ) ($67 ) $111
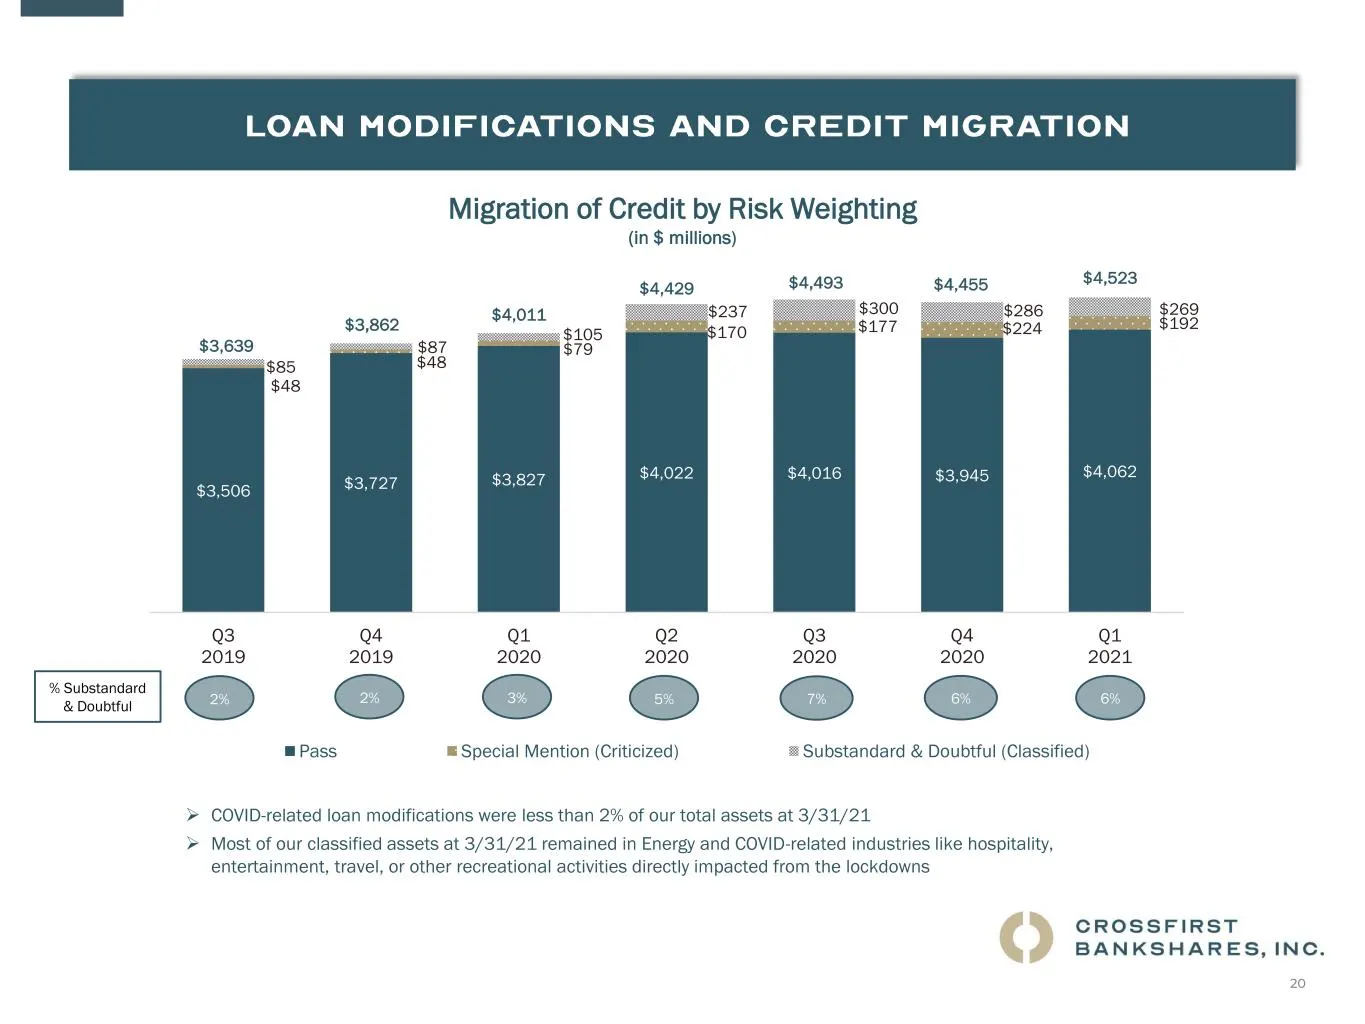
Slide 20: Migration of Credit by Risk Weighting
20 $3,506 $3,727 $3,827 $4,022 $4,016 $3,945 $4,062 $48 $48 $79 $170 $177 $224 $192 $85 $87 $105 $237 $300 $286 $269 $0 $500 $1,000 $1,500 $2,000 $2,500 $3,000 $3,500 $4,000 $4,500 $5,000 Q3 2019 Q4 2019 Q1 2020 Q2 2020 Q3 2020 Q4 2020 Q1 2021 Pass Special Mention (Criticized) Substandard & Doubtful
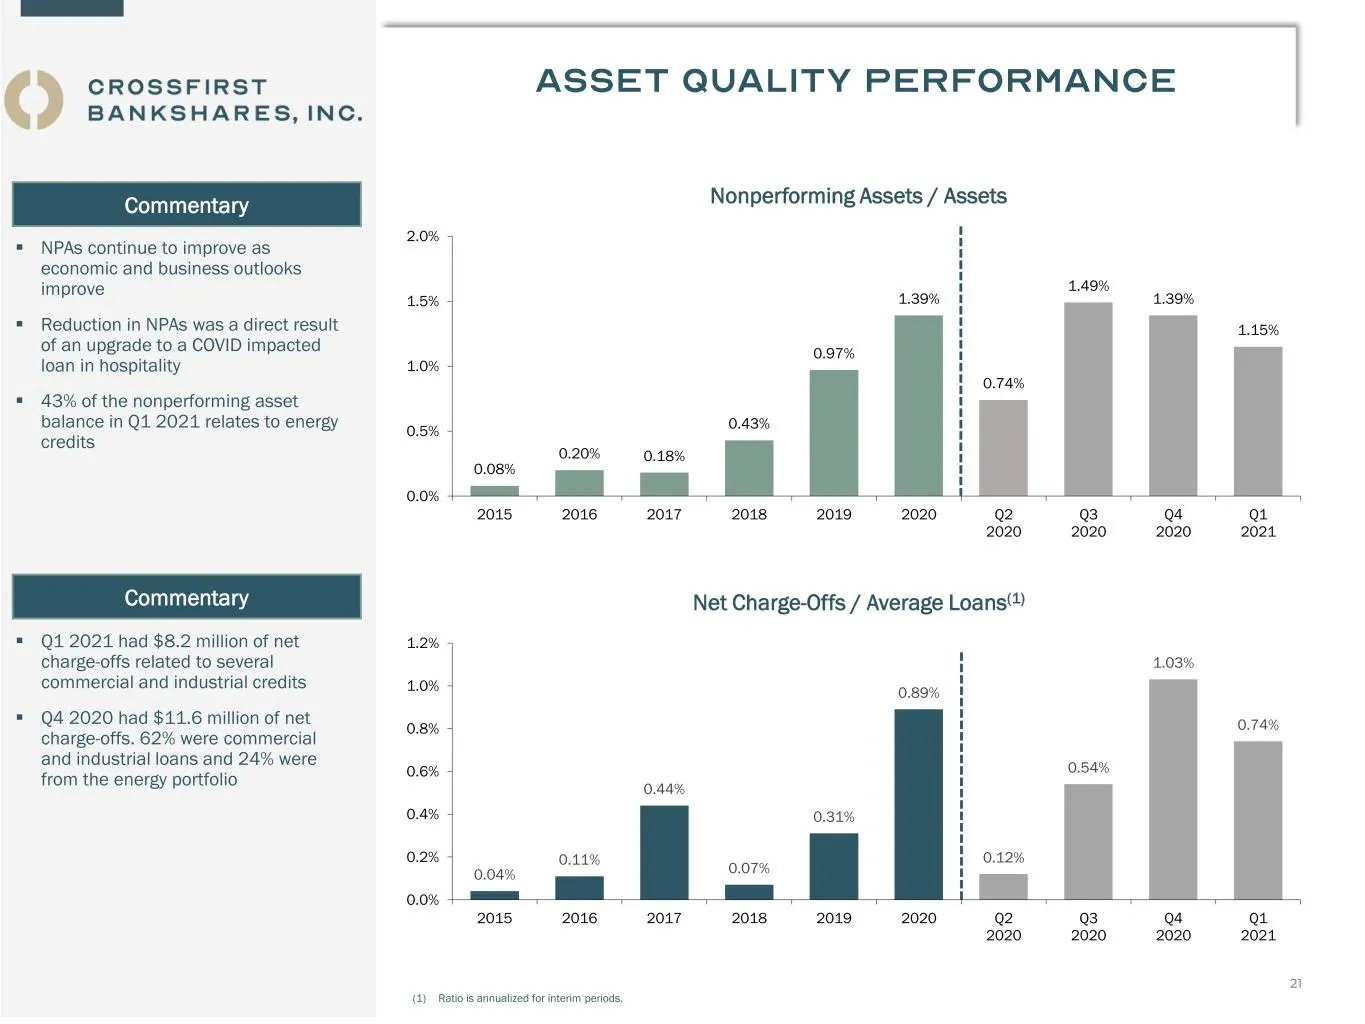
Slide 21: Net Charge-Offs and Nonperforming Assets
21 0.04% 0.11% 0.44% 0.07% 0.31% 0.89% 0.12% 0.54% 1.03% 0.74% 0.0% 0.2% 0.4% 0.6% 0.8% 1.0% 1.2% 2015 2016 2017 2018 2019 2020 Q2 2020 Q3 2020 Q4 2020 Q1 2021 Net Charge-Offs / Average Loans(1) 0.08% 0.20% 0.18% 0.43% 0.97% 1.39% 0.74% 1.49% 1.39% 1.15% 0.0% 0.5% 1.0% 1.5% 2.0% 2015 2016 2017 2018
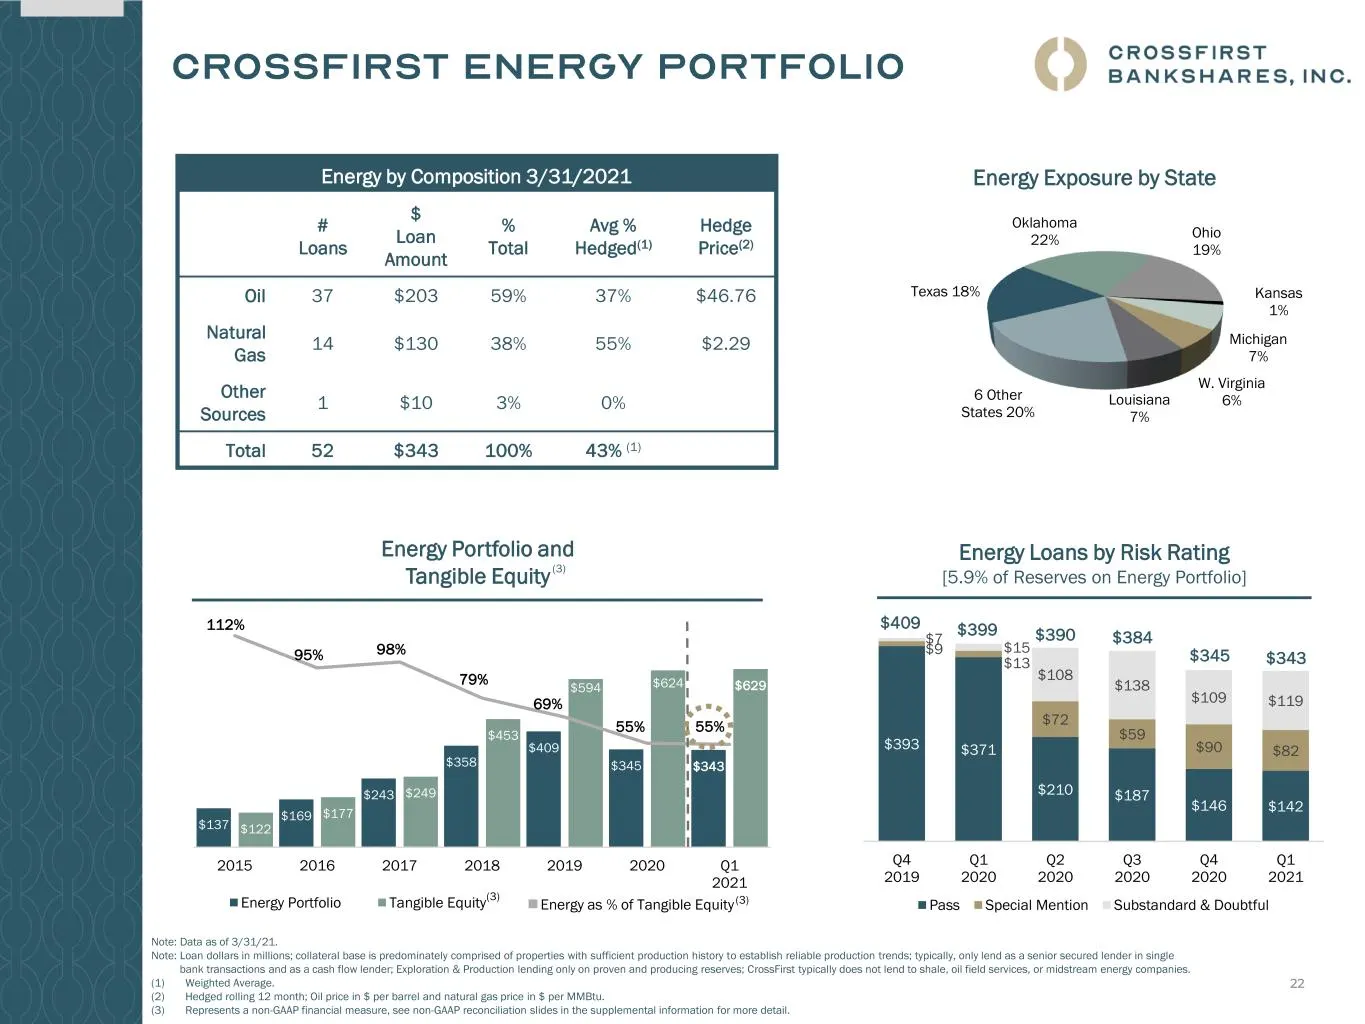
Slide 22: Energy Portfolio
22 Energy as % of Tangible Equity $393 $371 $210 $187 $146 $142 $9 $13 $72 $59 $90 $82 $7 $15 $108 $138 $109 $119 $0 $50 $100 $150 $200 $250 $300 $350 $400 $450 Q4 2019 Q1 2020 Q2 2020 Q3 2020 Q4 2020 Q1 2021 Pass Special Mention Substandard & Doubtful Energy Loans by Risk Rating [5.9% of Reserves o
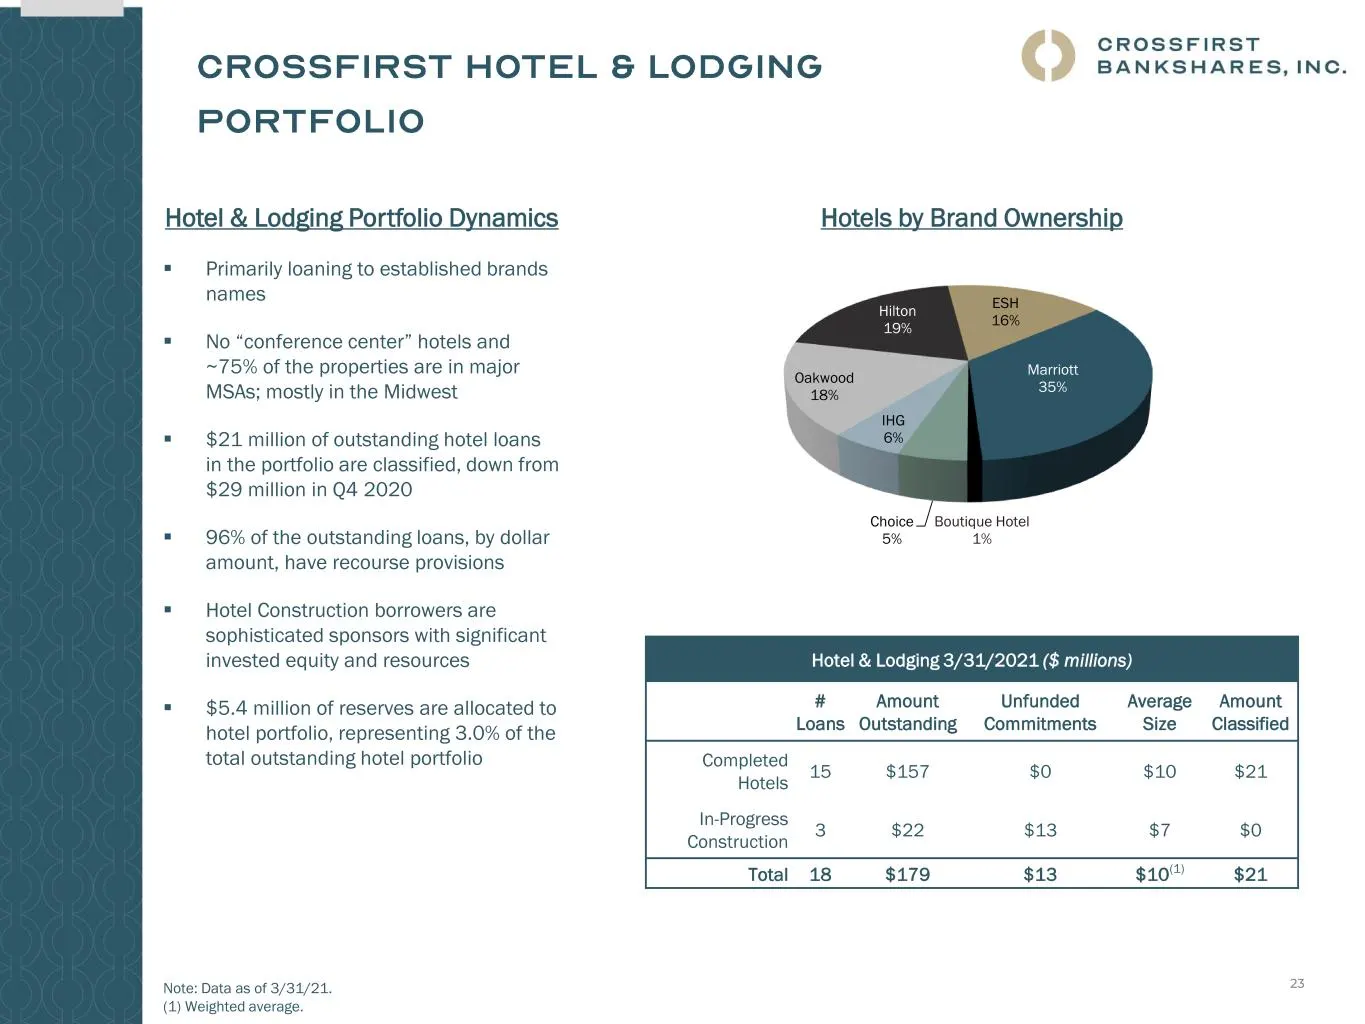
Slide 23: Hotel & Lodging Portfolio
23 Marriott 35% Boutique Hotel 1% Choice 5% IHG 6% Oakwood 18% Hilton 19% ESH 16% Hotel & Lodging Portfolio Dynamics ▪ Primarily loaning to established brands names ▪ No “conference center” hotels and ~75% of the properties are in major MSAs; mostly in the Midwest ▪ $21 million of outstanding hotel
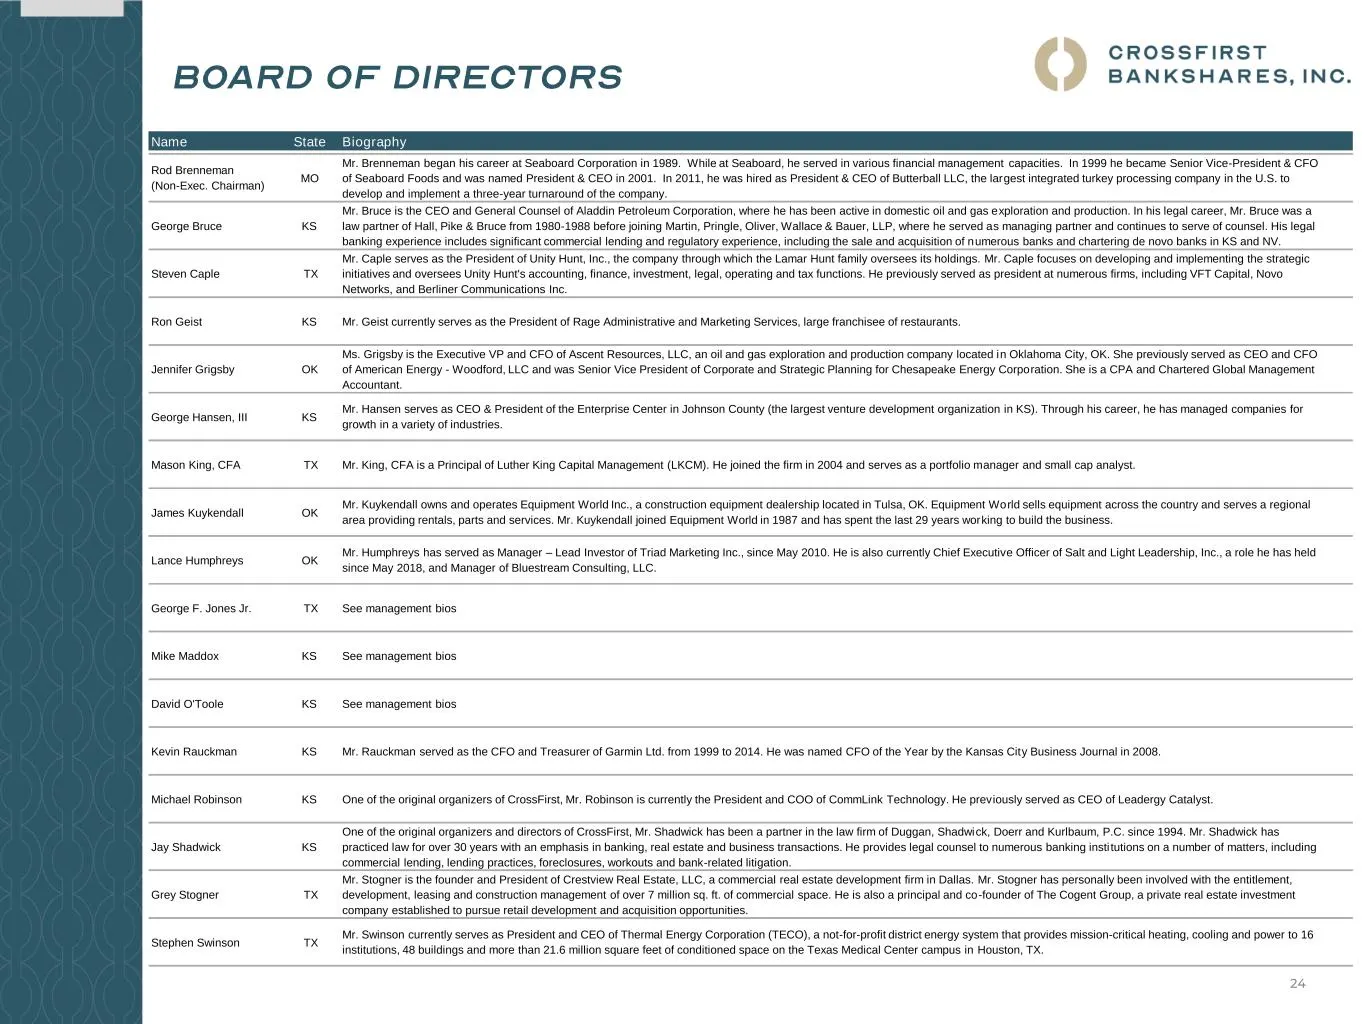
Slide 24: Board of Directors Biographies
24 Name State Biography Rod Brenneman (Non-Exec. Chairman) MO Mr. Brenneman began his career at Seaboard Corporation in 1989. While at Seaboard, he served in various financial management capacities. In 1999 he became Senior Vice-President & CFO of Seaboard Foods and was named President & CEO in 2001
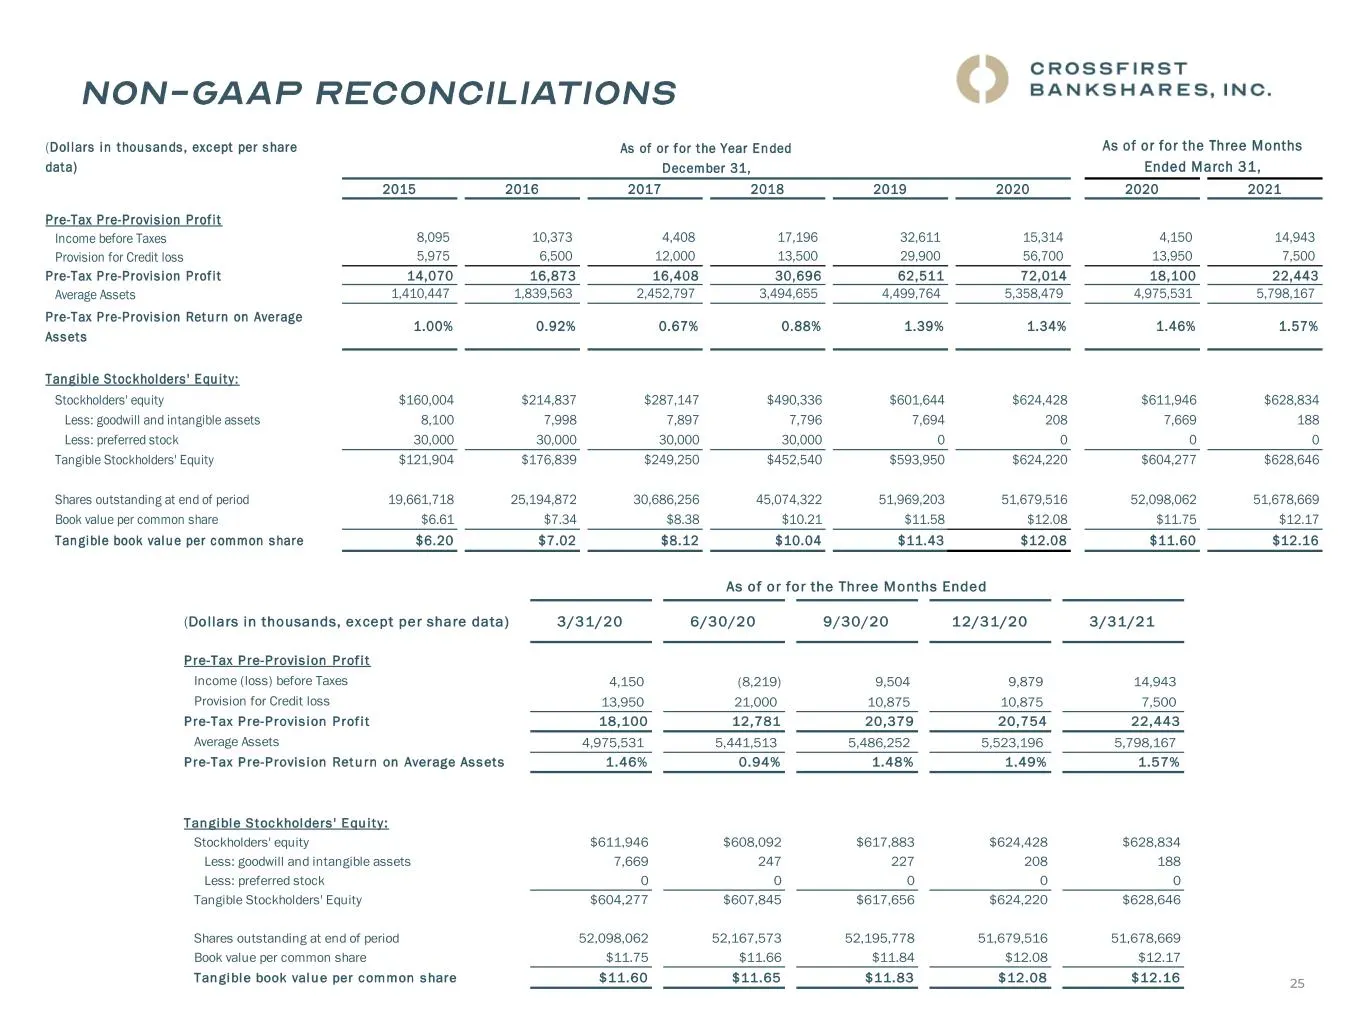
Slide 25: Non-GAAP Reconciliation
2525 (Dol lars in thousands , except per share data) As of or for the Three Months Ended March 31, 2015 2016 2017 2018 2019 2020 2020 2021 Pre-Tax Pre-Provis ion Prof i t Income before Taxes 8,095 10,373 4,408 17,196 32,611 15,314 4,150 14,943 Provision for Credit loss 5,975 6,500 12,000 13,500 29,9
Source: SEC EDGAR · 8-K filed May 18, 2021
More decks from CrossFirst Bankshares Inc
 Q3 2024 Earnings Presentation44 slides · Oct 22, 2024
 Merger or Acquisition (August 2024)27 slides · Aug 27, 2024
 Merger or Acquisition (August 2024)30 slides · Aug 27, 2024
 Merger or Acquisition (August 2024)31 slides · Aug 27, 2024
 Q2 2024 Earnings Presentation19 slides · Jul 15, 2024
 Q1 2024 Earnings Presentation19 slides · Apr 15, 2024