PSS World Medical — Investor Day (June 2006)
30 slides from PSS World Medical's investor day presentation, Jun 1, 2006

Slide 1: PSS World Medical Investor Day Conference
PSS World Medical Investor Day Conference June 1, 2006 Atlanta Georgia Exhibit 99.1

Slide 2: Robert Weiner, Vice President, Investor Relations
Robert Weiner Vice President, Investor Relations Investor Day Conference June 1, 2006 Atlanta Georgia * * * * * ******************************************************************************************* ***** ******************************************************************************************

Slide 3: David A. Smith, President and Chief Executive Officer
David A. Smith President and Chief Executive Officer Investor Day Conference June 1, 2006 Atlanta Georgia
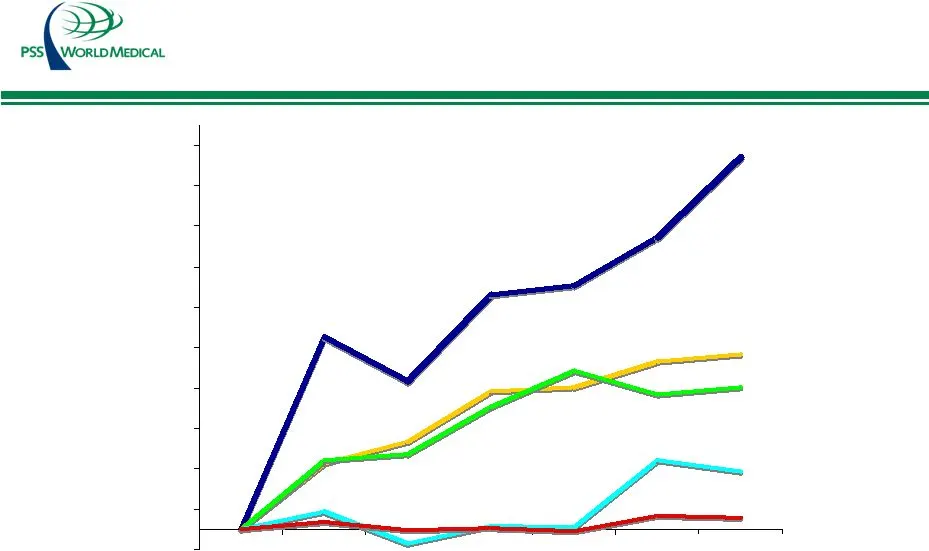
Slide 4: PSSI: Investors Benefit from our Strategies and Execution
PSSI: Investors Benefit from our Strategies and Execution -20 10/10/00 12/31/01 12/31/02 12/31/03 12/31/04 12/31/05 5/22/06 Prices as of May 22, 2006 PSSI HSIC PDCO MCK CAH

Slide 5: PSSI: We Are Unique
PSSI : We Are Unique • Performance-driven culture – Balance of customer satisfaction and profitability – Ethics – doing more than legal – doing what is right – Customer, vendor and employee surveys help to guide programs • Stick to the Strengths of Our Business Model – Unique and unparalleled custom
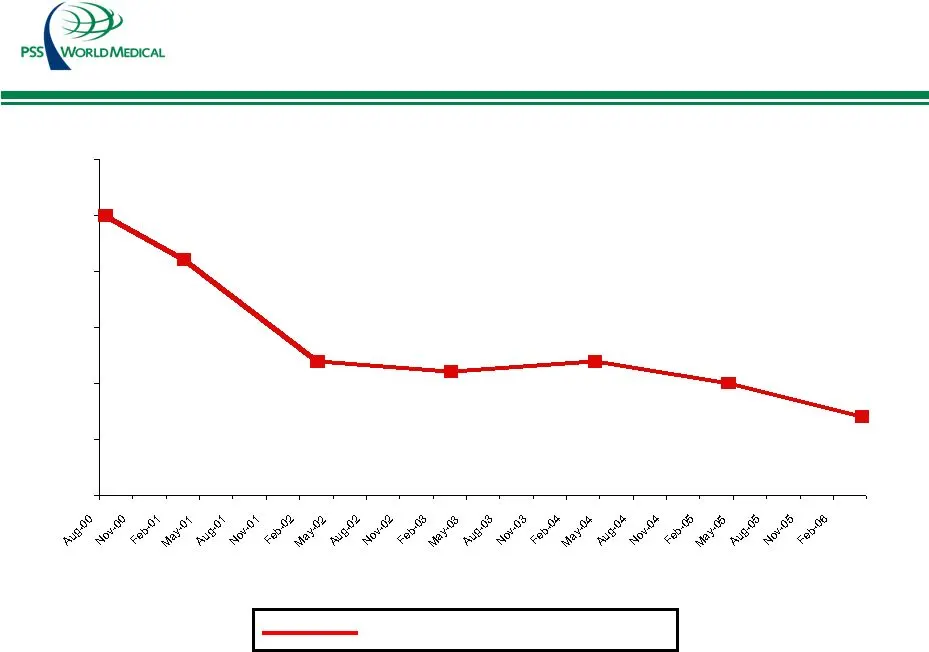
Slide 6: PSSI: Employer of Choice
PSSI: Employer of Choice 30% 26% 17% 16% 17% 15% 8/1/00 3/31/01 3/29/02 3/28/03 4/2/04 4/1/05 12% 4/1/06 % of Employee Turnover
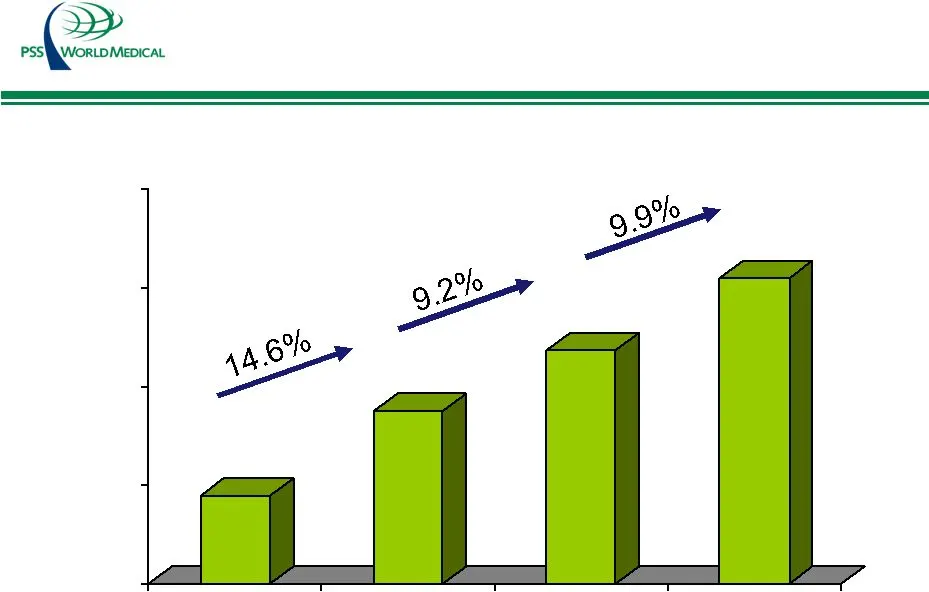
Slide 7: Focused on Leveraging the Strengths of Our Business Model
Focused on Leveraging the Strengths of Our Business Model 1000 1200 1400 1600 1800 FY 03 FY 04 FY 05 FY 06 $1,178 $1,350 $1,474 $1,619 ($ in millions)
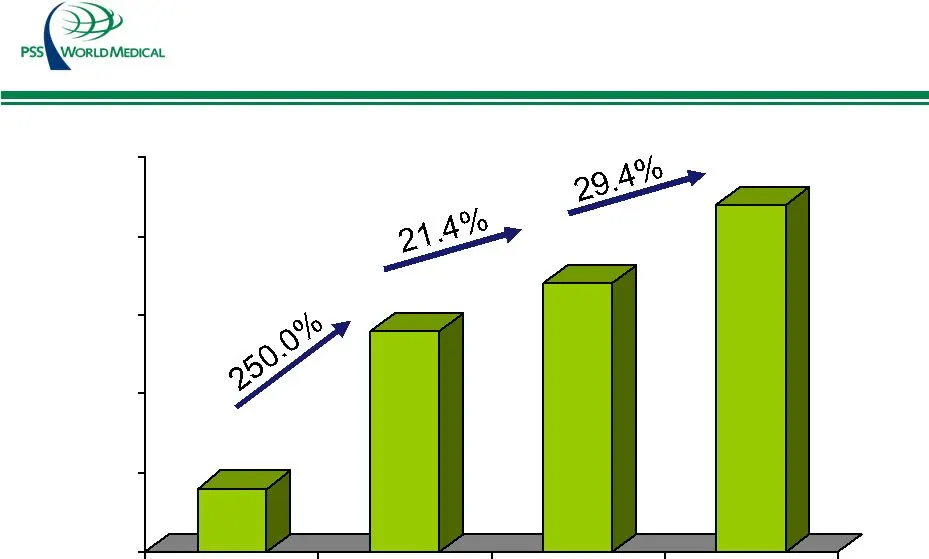
Slide 8: Focused on Execution of our Strategic Plan
Focused on Execution of our Strategic Plan 0.15 0.3 0.45 0.6 0.75 FY 03 FY 04 FY 05 FY 06 $0.12 $0.42 $0.51 $0.66 Earning Per Diluted Share from continued operations 1 Excludes non-recurring tax benefit of $5.6 million, or $0.09 per diluted share
Slide 9: US Healthcare Spending is Accelerating
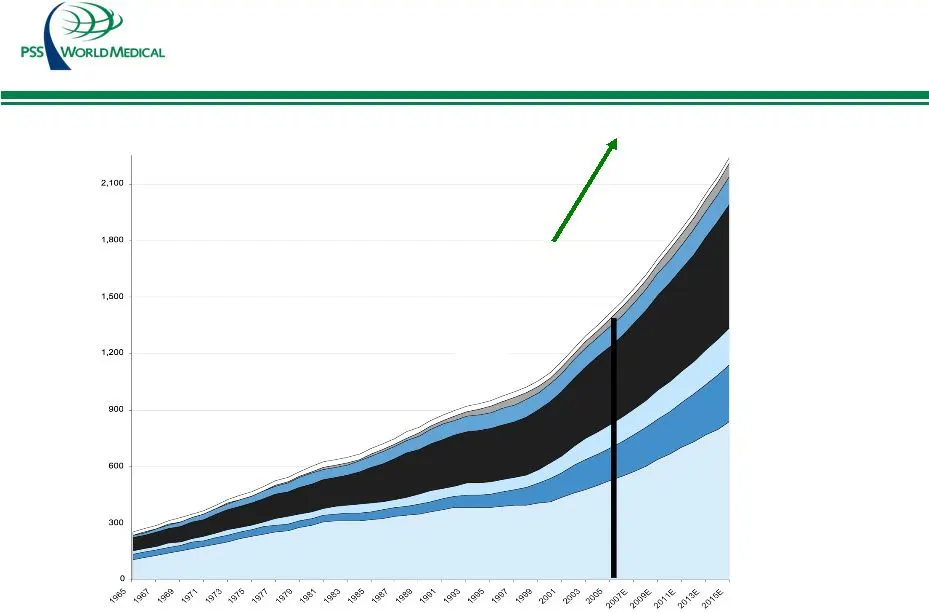
Non-durable Medical Product Home Health Care Nursing Home Care Physicians’ Care Admin. and Net Cost of Private Health Insurance Prescription Drugs Hospital Care Source: CMS 1975 Health Expenditures As % of GDP 13.8% 1995 Health Expenditures As % of GDP 14.4% 2005 Health Expenditures As % of GDP 15.5
Slide 10: Physician Market: New PSS Opportunity
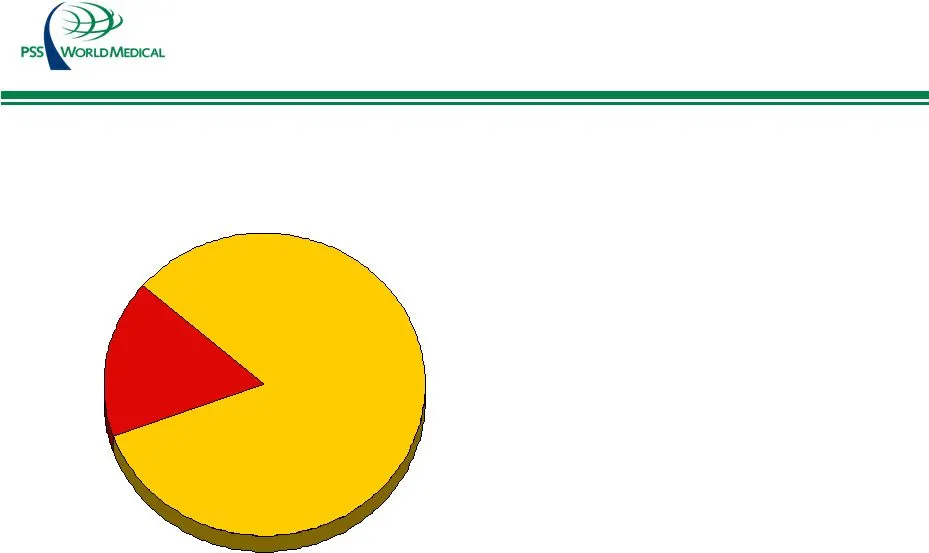
Non Physician 17% Where Are We Focused: FY 2007 - FY 2009 • We are targeting $3 Billion owned exclusively by practicing physicians – 1,470 Targeted ASC locations; 4,900 total market – 11,500,000 Cosmetic & Non-Surgical Procedures – Medicare payments to ASC’s up 19% in 2005 Physician 83% Physician Ma
Slide 11: What Are We Doing About It?
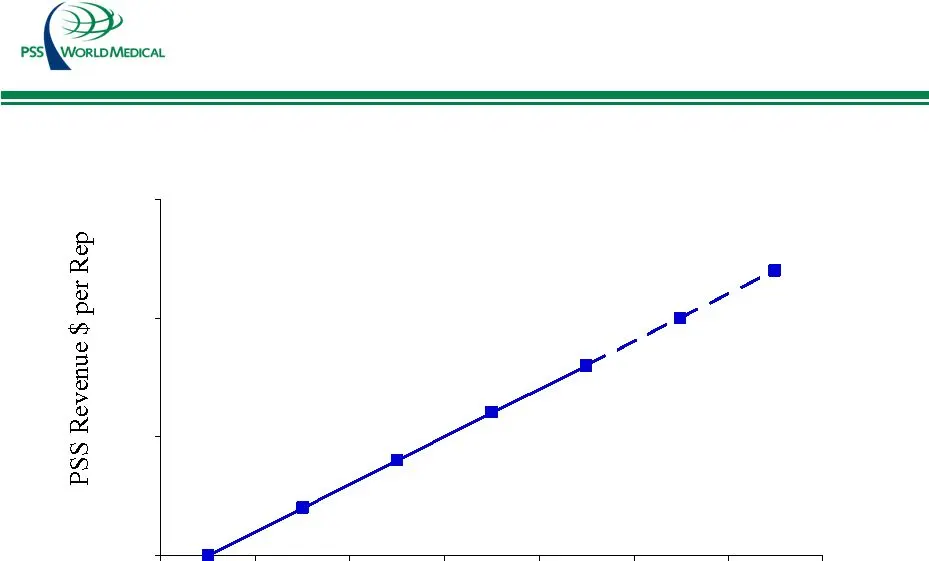
What Are We Doing About It? $1.0 $1.5 $2.0 $2.5 FY 02 FY 03 FY 04 FY 05 FY 06 FY 07 FY 08 ($ in Millions) •Sales Rep Productivity •Training & Development •Solution selling •Automation •New Sales representatives
Slide 12: Shared Services: Global Product Sourcing
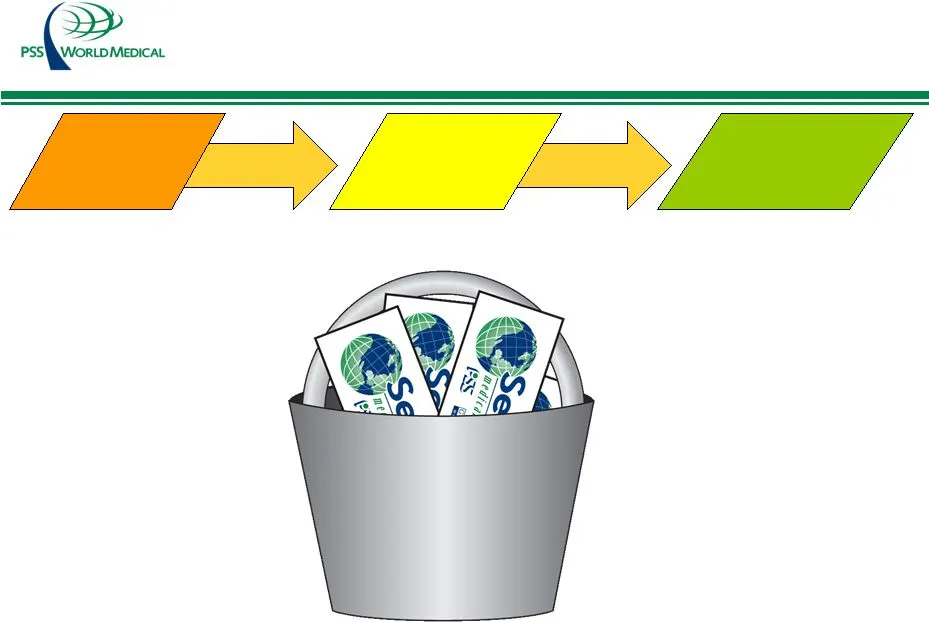
$340 Million $340 Million +15%* BRAND IMPORT DIRECT +30%* of purchases, based on today’s volume PSS World Medical opportunity *% of procurement savings Where We Are Focused: FY 2007-FY 2009 Shared Services: Global Product Sourcing
Slide 13: Where We Are Focused: FY 2007-FY 2009
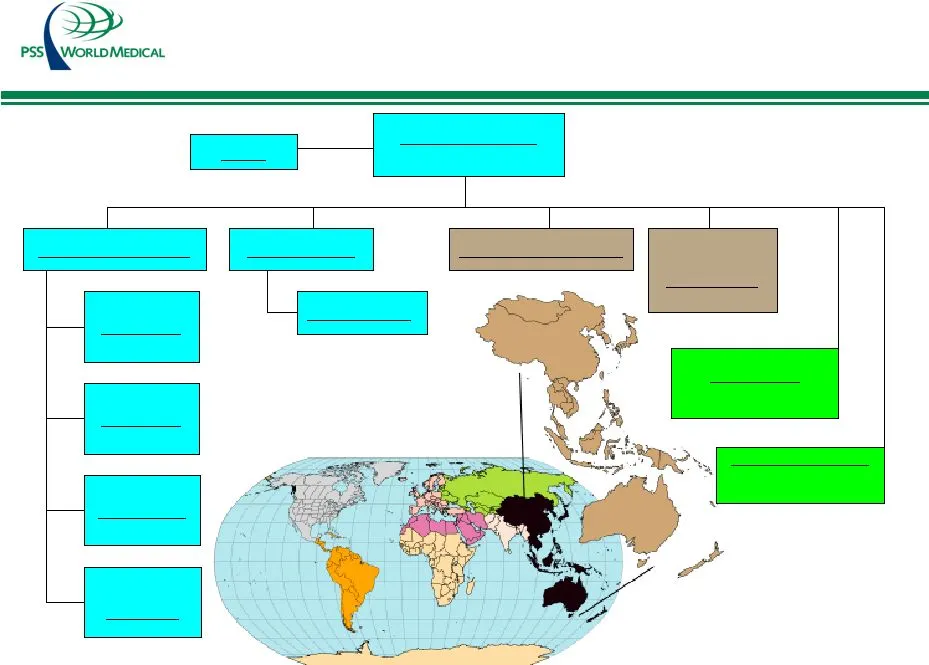
Where We Are Focused: FY 2007-FY 2009 Shared Services: Global Product Sourcing VP Global Sourcing Tomas D’Innocenzi Admin VP Sourcing Ops JAX Director QA/QC China Sourcing Mgrs: 2 Tiger Specialty Sourcing: 22 LOOP Solution Ltd. (Hong Kong) Quality Control Production Control QA/QC Analyst Sourcing: 3
Slide 14: Shared Services: Global Sourcing
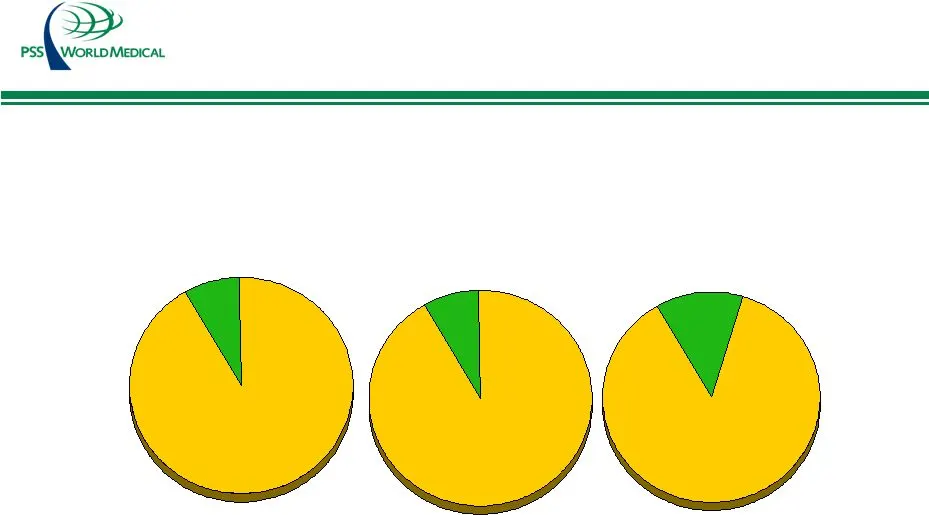
Where We Are Focused: FY 2006 - FY 2008 Shared Services: Global Sourcing 8% Branded 92% 12% Branded 88% Select Medical Product Mix FY 2006 $1.5 Million FY 2008 $10 - $11 Million Pre-Tax Savings: FY 2007 $3.5 – 4.0 Million 10% Branded 90%

Slide 15: Gary A. Corless, Chief Operating Officer
Gary A. Corless Chief Operating Officer Investor Day Conference June 1, 2006 Atlanta Georgia ******************************************************************************************* **** ****************************************************************************************** *****
Slide 16: The Physician Business: Market Drivers
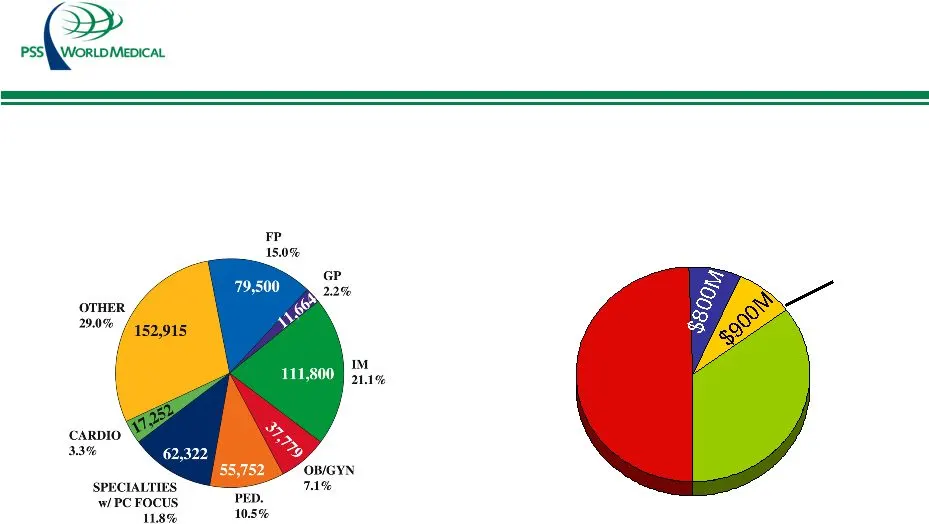
$5.1B $ 5.1B The Physician Business: Market Drivers • Office Based Physicians in PSS Market: 528,984 • Total Product Segmentation: $10.4 Billion $3.6B Medical & Surgical Pharmaceuticals Injectibles & Vaccines Diagnostic Equipment Non-diagnostic Equipment
Slide 17: The Physician Business: Competitive Landscape
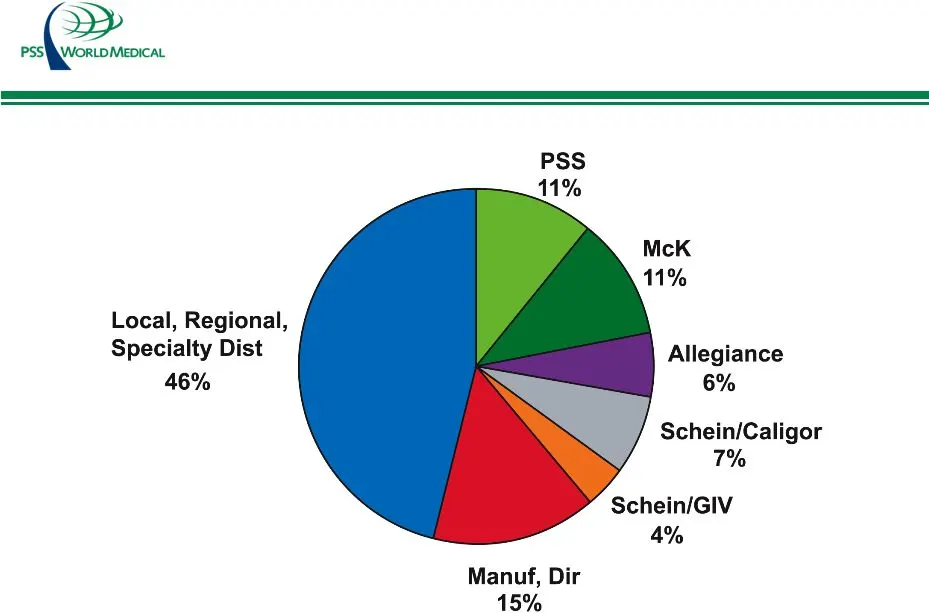
The Physician Business: Competitive Landscape
Slide 18: Smartscan: Progress Report
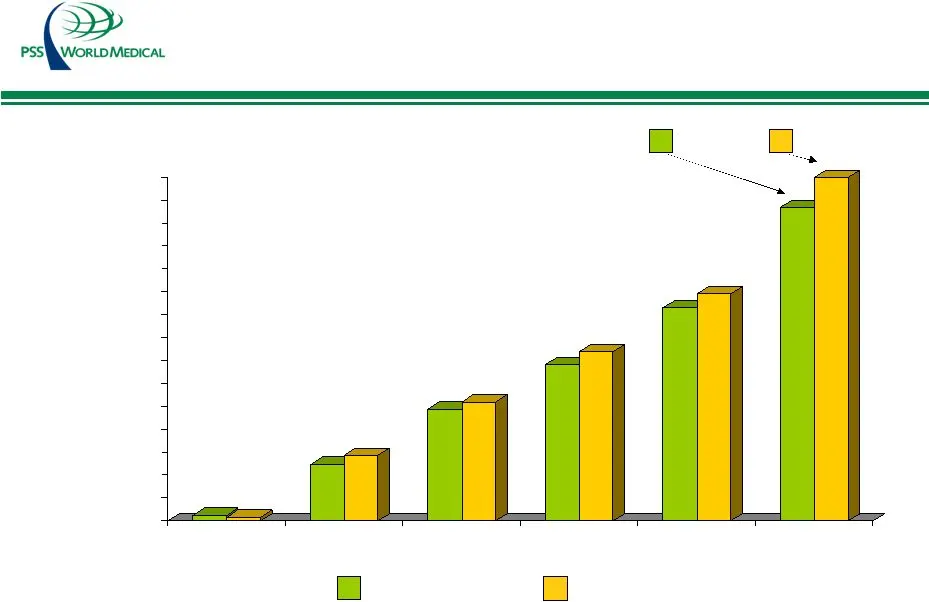
Smartscan: Progress Report 1000 1100 1200 1300 1400 1500 Oct-05 Nov-05 Dec-05 Jan-06 Feb-06 Mar-06 Net sales ($ In thousands) Number of orders $1,370 1,516
Slide 19: The Elder Care Business: Targeted Approach
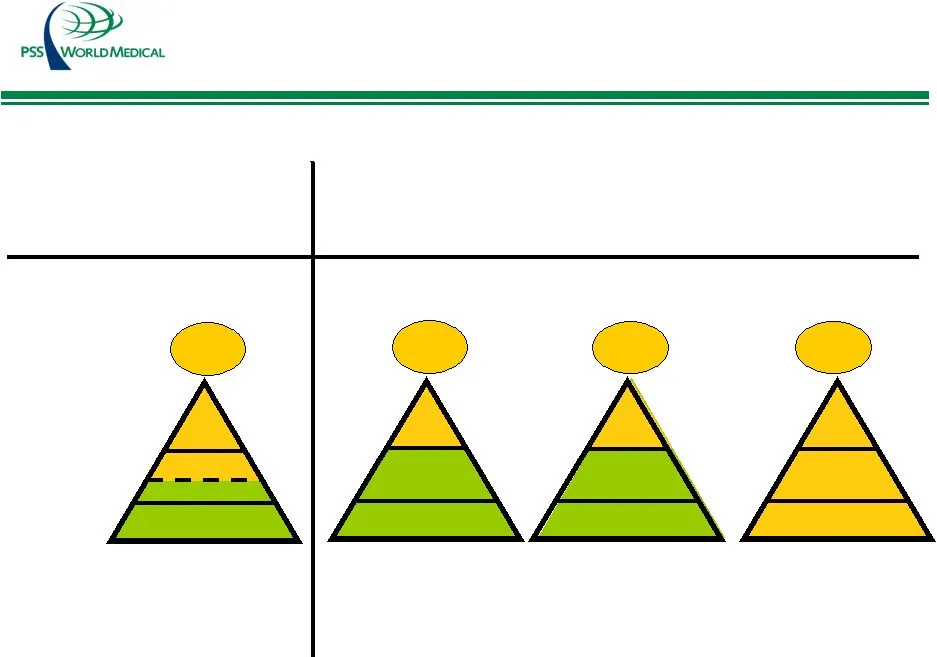
The Elder Care Business: Targeted Approach HME HSP HHA Skilled Nursing Home Care SNF 16,000 Customers 12,000 Customers 2,500 Customers 110,000 Customers Large Medium Small 15% 61% 17% 69% 79% 8% Target 76% or $3.0 Billion Target 86% or $6.9 Billion Target 87% or $1.1 Billion

Slide 20: David M. Bronson, Chief Financial Officer
David M. Bronson Executive Vice President and Chief Financial Officer Investor Day Conference June 1, 2006 Atlanta Georgia
Slide 21: Revenue Growth: FY 2004-2006
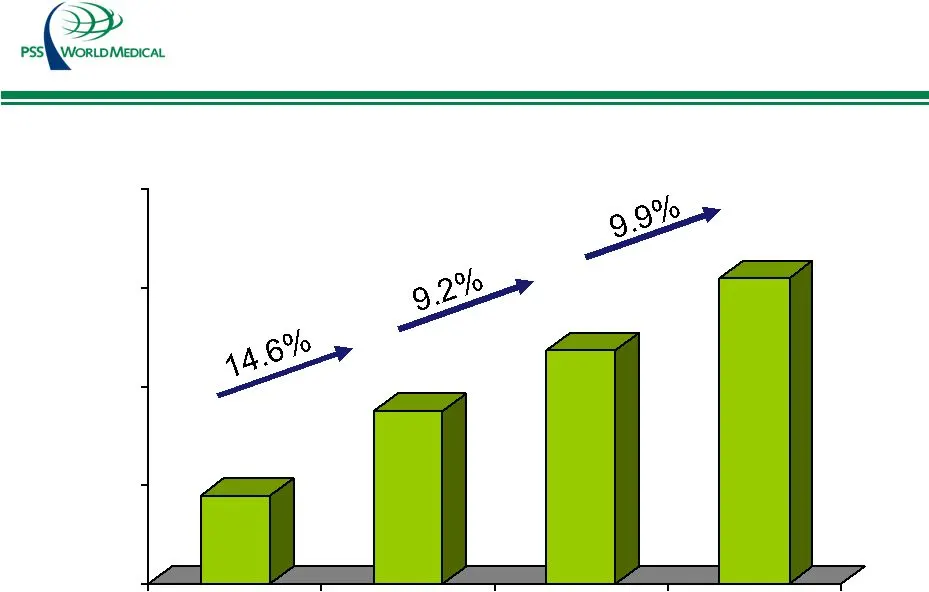
Revenue Growth: FY 2004 - 2006 1000 1200 1400 1600 1800 FY 03 FY 04 FY 05 FY 06 $1,178 $1,350 $1,474 $1,619 ($ in millions)
Slide 22: Operating Income Growth: FY 2004-2006
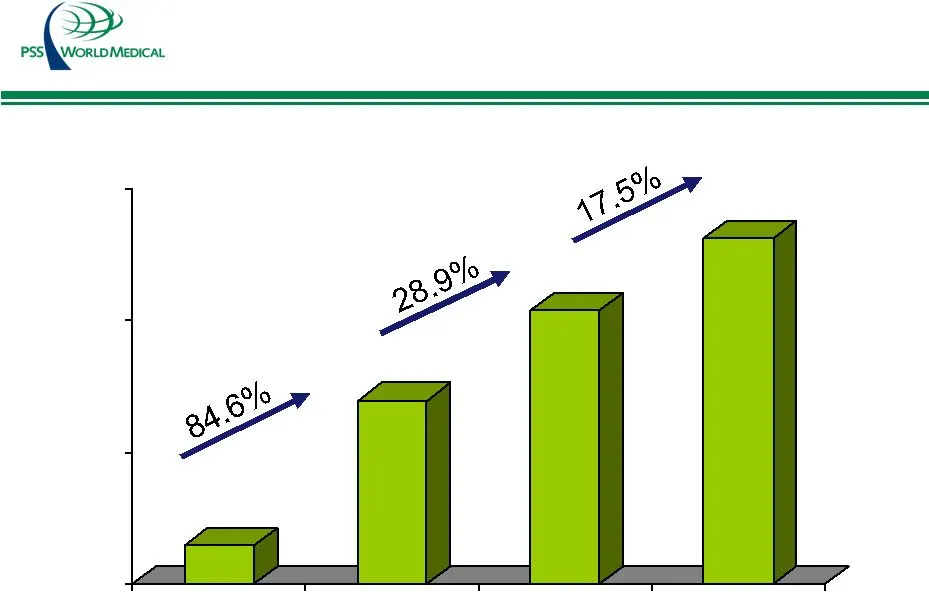
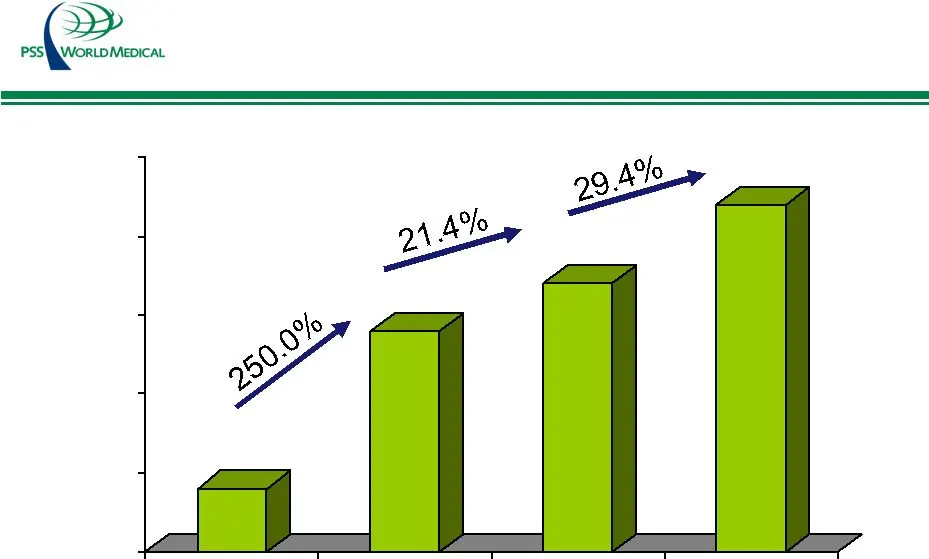
Operating Income Growth : FY 2004 - 2006 FY 03 FY 04 FY 05 FY 06 $25.9 $47.8 $61.6 $72.4 ($ in millions)
Slide 23: Operating Margin Growth: FY2004-2006
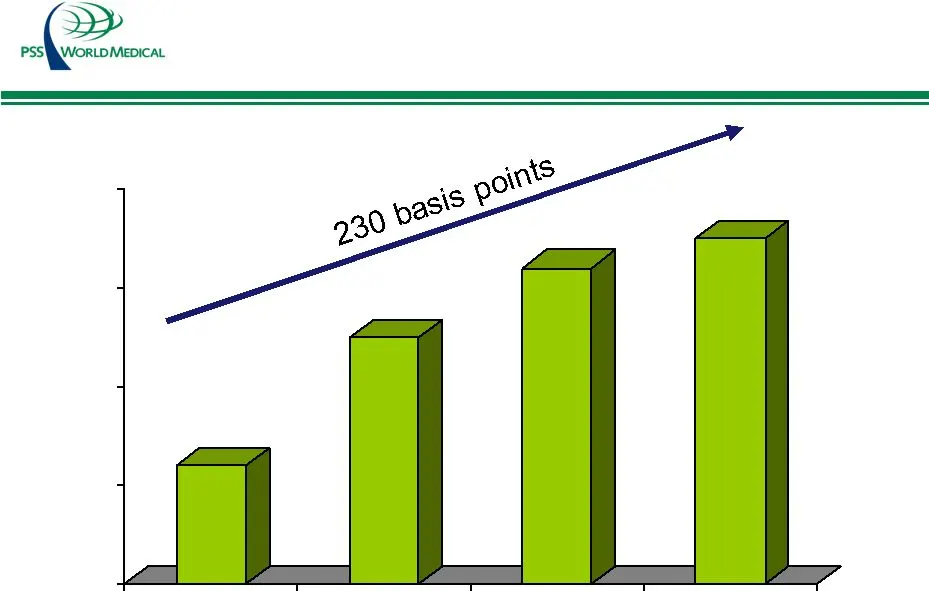
Operating Margin Growth: FY2004 - 2006 FY 03 FY 04 FY 05 FY 06 2.2% 3.5% 4.2% 4.5% (Scale in %)
Slide 24: Earnings Per Diluted Share Growth
Earnings Per Diluted Share Growth*: FY 2004 - 2006 0.15 0.3 0.45 0.6 0.75 FY 03 FY 04 FY 05 FY 06 $0.12 $0.42 $0.51 $0.66 *From continued operations 1 Excludes non-recurring tax benefit of $5.6 million, or $0.09 per diluted share
Slide 25: Operating Cash Flow Growth: FY 2004-FY2006
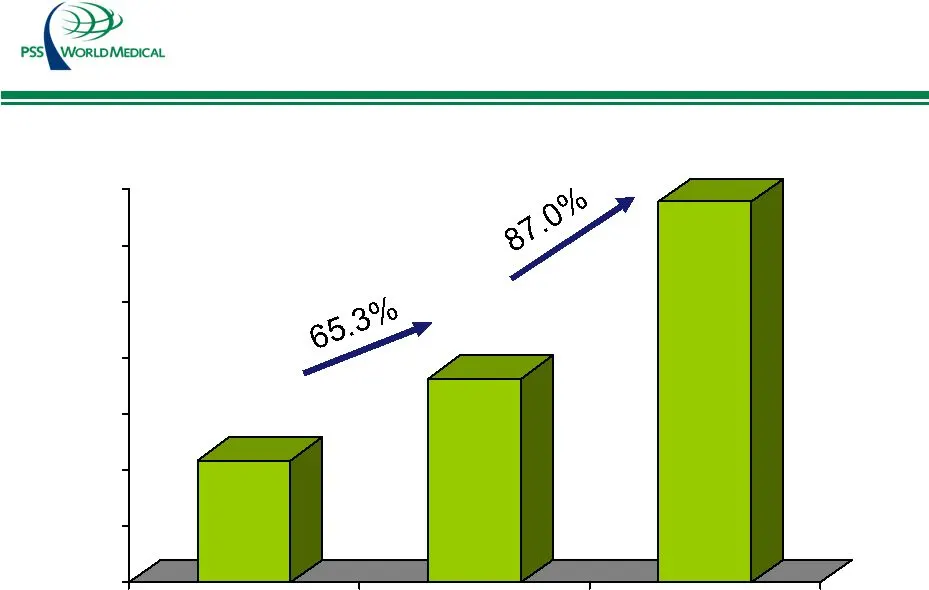
Operating Cash Flow Growth: FY 2004 – FY2006 $21.9 $36.3 $67.7 ($ in millions) FY 04 FY 05 FY 06
Slide 26: Fiscal Year 2006: Increased Shareholder Value
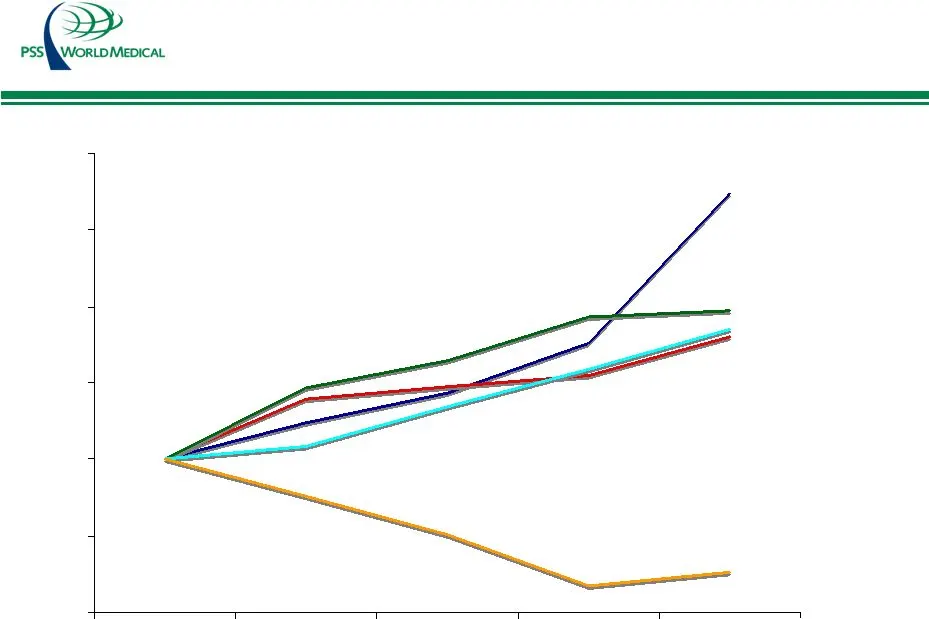
Fiscal Year 2006: Increased Shareholder Value -40 -20 PSSI - 69.7% MCK - 38.8% CAH - 34.1% HSIC - 33.5% PDCO - (29.5%) 3/31/05 3/31/06
Slide 27: EPS Growth Goals FY 2006-FY 2008
FY 2006 - FY 2008: EPS Growth Goals Earnings per diluted share from continuing operations FY 2007* $0.77 FY 2008* $0.94 FY 2006 $0.66 FY 2005 $0.51 Growth 29% Growth 17% Growth 22% FY2006 – FY2008: Average Annual Growth of 23% Excludes non-recurring tax benefit of $5.6 million or $0.09 per diluted s
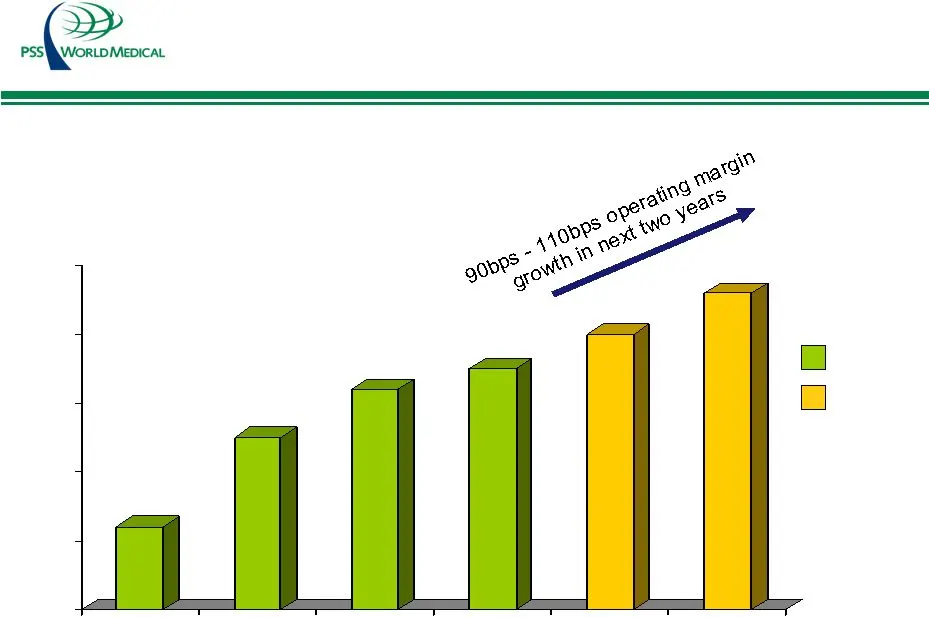
Slide 28: Operating Margin Growth: FY 2007-FY 2008
Operating Margin Growth: FY 2007 - FY 2008 FY 03 FY 04 FY 05 FY 06 FY 07 FY 08 2.2% 3.5% 4.2% 4.5% 4.8%-5.0% 5.4%-5.6% Actual Goal
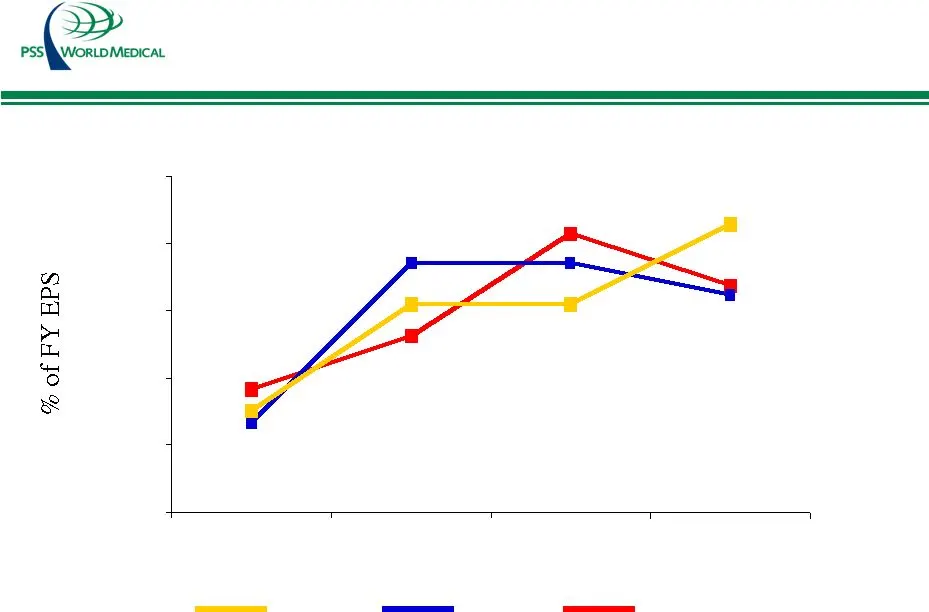
Slide 29: Historical Earnings Progression By Quarter FY 2003-2005
Fiscal Year 2003 - 2005: Historical Earnings Progression By Quarter 10% 15% 20% 25% 30% 35% 1st Qtr 2nd Qtr 3rd Qtr 4th Qtr FY 2005 FY 2004 FY 2003 FY 2003 - FY 2005 FY2005: excludes tax benefit of $5.6 million or $0.09 per diluted share
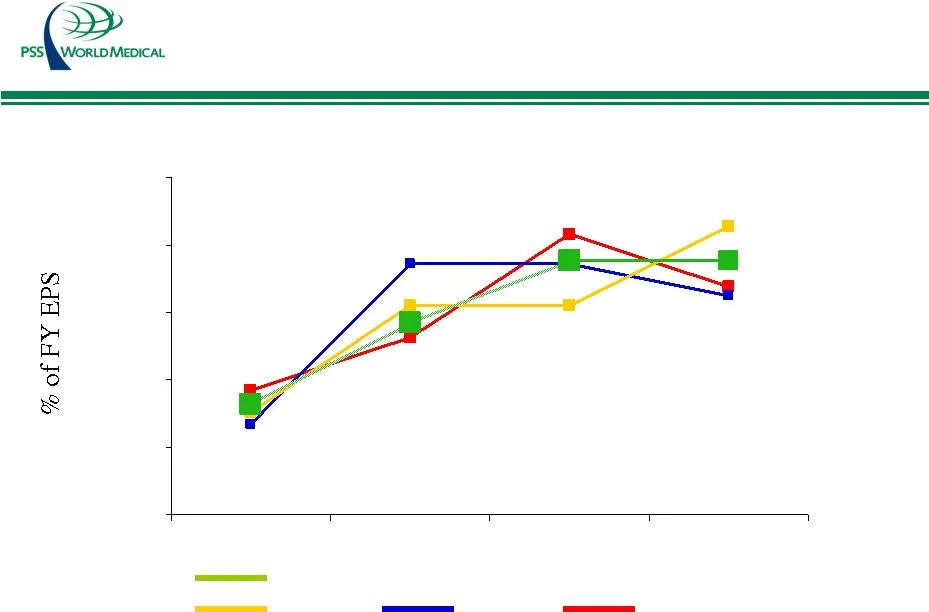
Slide 30: Historical Earnings Progression By Quarter FY 2003-2006
Fiscal Year 2003 - 2006: Historical Earnings Progression By Quarter 10% 15% 20% 25% 30% 35% 1st Qtr 2nd Qtr 3rd Qtr 4th Qtr FY 2005 FY 2004 FY 2003 FY 2003 - FY 2006 FY 2006 FY2005: excludes tax benefit of $5.6 million or $0.09 per diluted share
Source: SEC EDGAR · 8-K filed Jun 1, 2006