American Railcar Industries Inc
American Railcar Industries — Investor Presentation (November 2017)
24 slides from American Railcar Industries's investor presentation, Nov 3, 2017
Slide 1: American Railcar Industries, Inc. Investor Presentation November 2017
November 2017 Investor Contact: 636.940.6000 Website: americanrailcar.com American Railcar Industries, Inc.
Slide 2: Forward Looking Disclaimer Safe Harbor Statement
Forward Looking Disclaimer Safe Harbor Statement This presentation contains statements relating to our expected financial performance, objectives, long-term strategies and/or future business prospects, events and plans that are forward-looking statements. Forward-looking statements represent our est
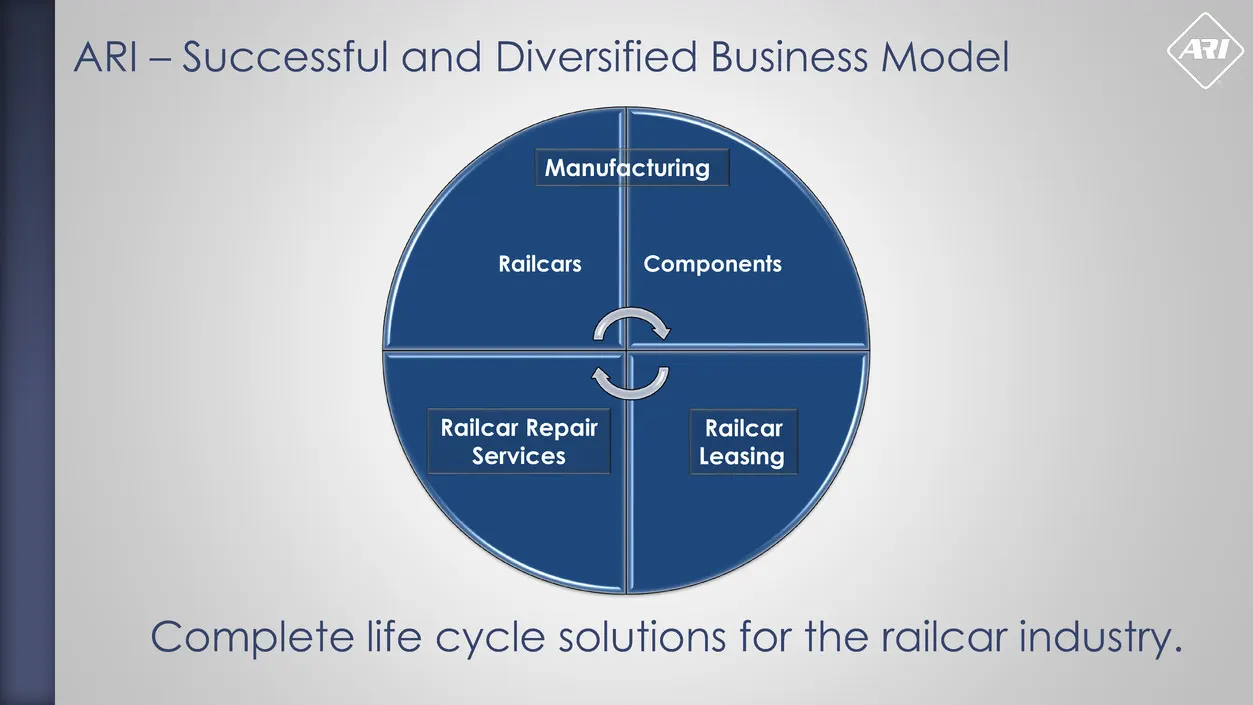
Slide 3: ARI – Successful and Diversified Business Model
ARI – Successful and Diversified Business Model Complete life cycle solutions for the railcar industry. Railcars Components Manufacturing Railcar Repair Services Railcar Leasing
Slide 4: Strategic Developments
Strategic Developments • Integration of strong sales force and fleet management group • Managing our lease fleet in-house gives us the opportunity to streamline processes and realize synergies and cost savings in integrating with the rest of our organization • Our sales and marketing strategy begins
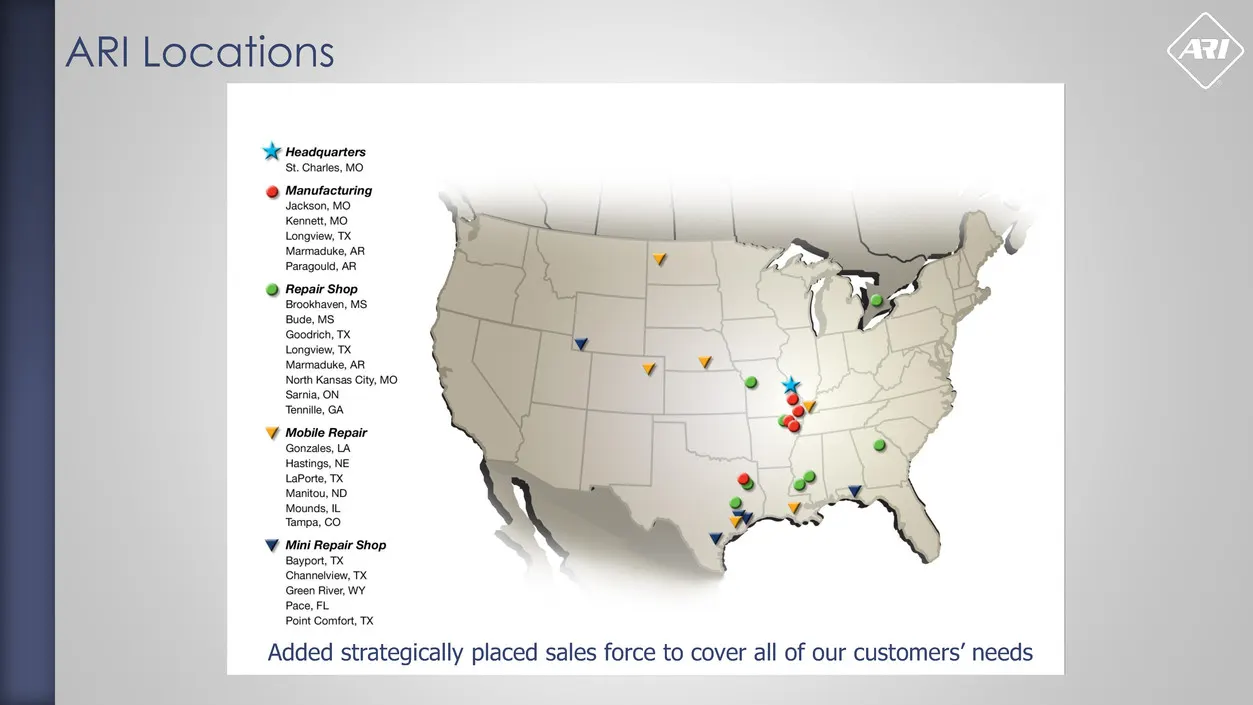
Slide 5: ARI Locations
ARI Locations Added strategically placed sales force to cover all of our customers’ needs
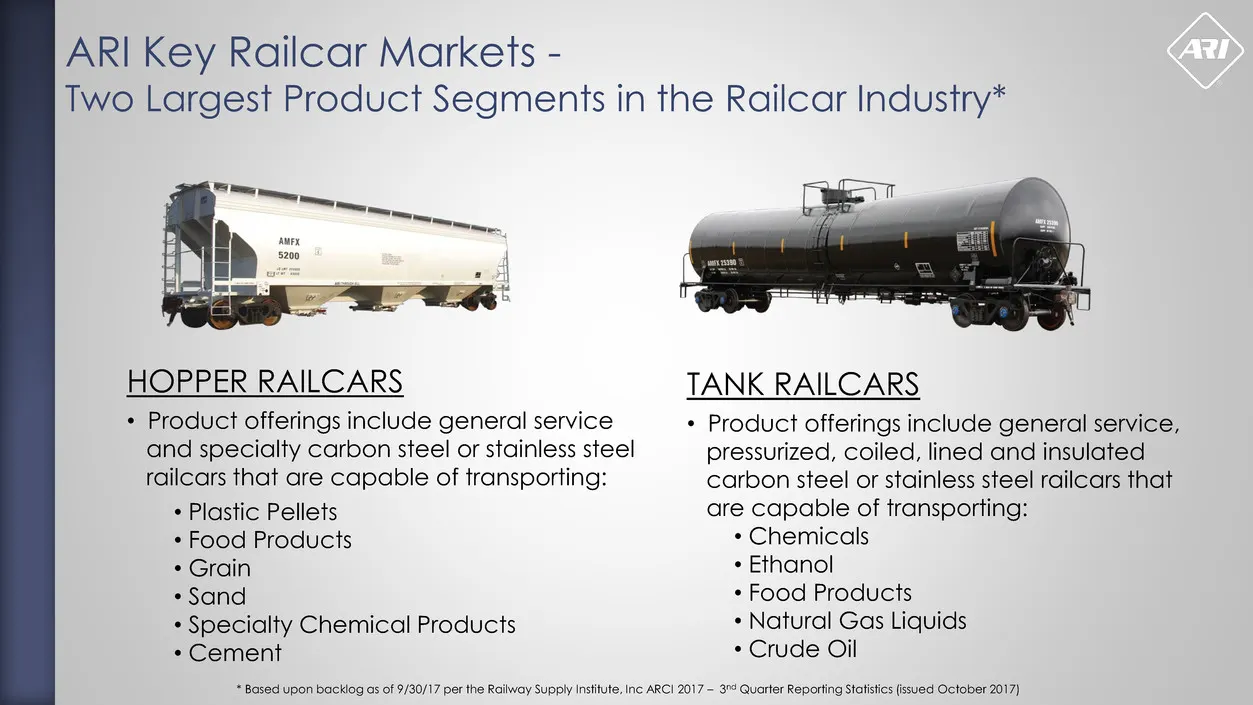
Slide 6: ARI Key Railcar Markets - Two Largest Product Segments
ARI Key Railcar Markets - Two Largest Product Segments in the Railcar Industry* TANK RAILCARS • Product offerings include general service, pressurized, coiled, lined and insulated carbon steel or stainless steel railcars that are capable of transporting: • Chemicals • Ethanol • Food Products • Natur
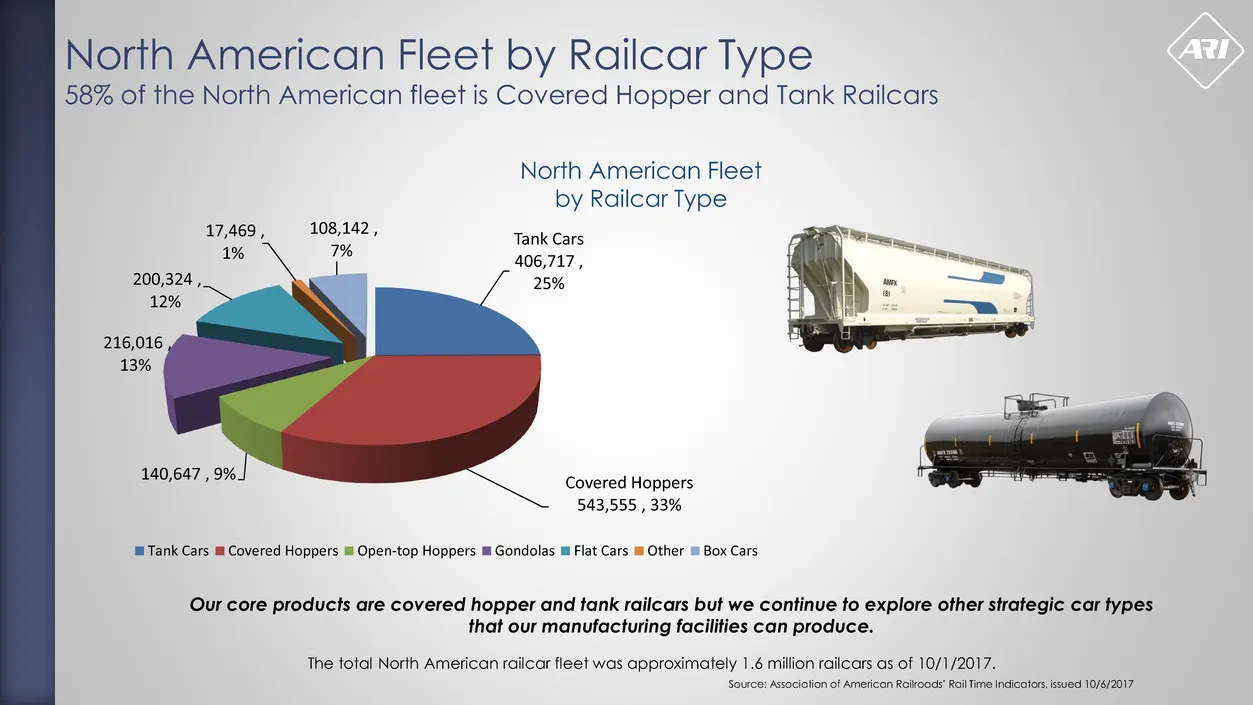
Slide 7: North American Fleet by Railcar Type
North American Fleet by Railcar Type 58% of the North American fleet is Covered Hopper and Tank Railcars The total North American railcar fleet was approximately 1.6 million railcars as of 10/1/2017. Tank Cars 406,717 , 25% Covered Hoppers 543,555 , 33% 140,647 , 9% 216,016 , 13% 200,324 , 12% 17,46
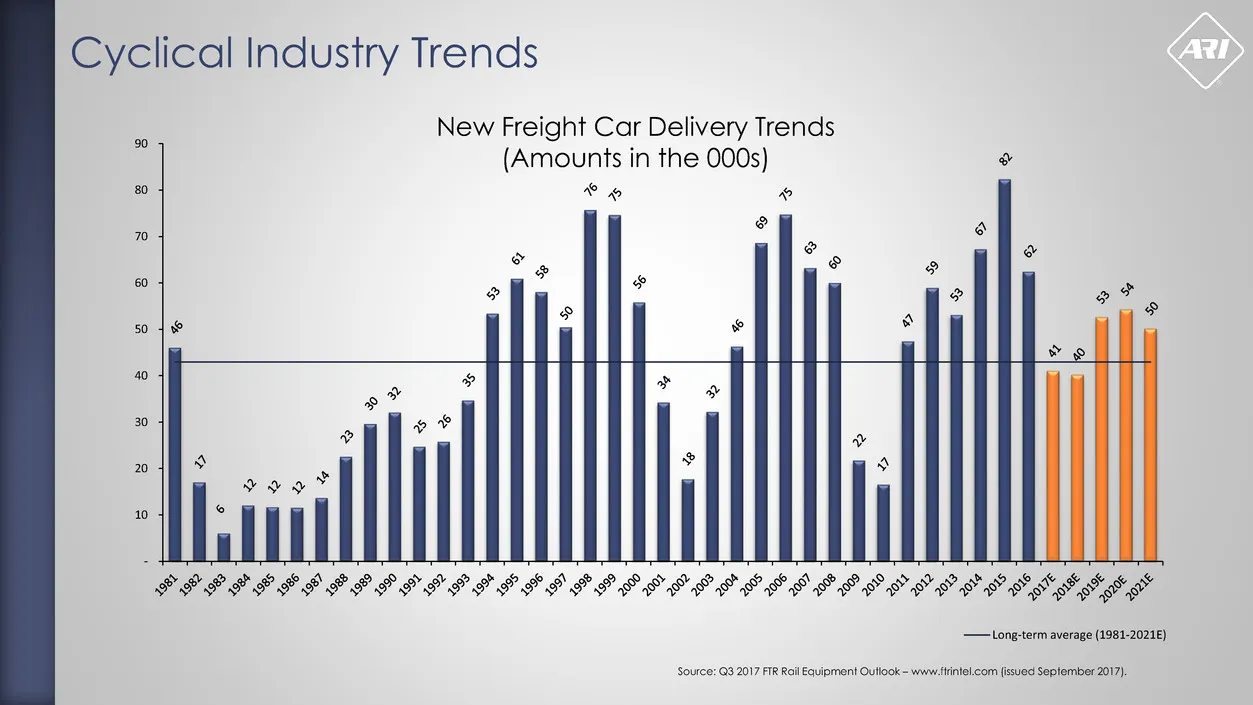
Slide 8: Cyclical Industry Trends - New Freight Car Delivery Trends
Cyclical Industry Trends - 10 20 30 40 50 60 70 80 90 Long-term average (1981-2021E) New Freight Car Delivery Trends (Amounts in the 000s) Source: Q3 2017 FTR Rail Equipment Outlook – www.ftrintel.com (issued September 2017).
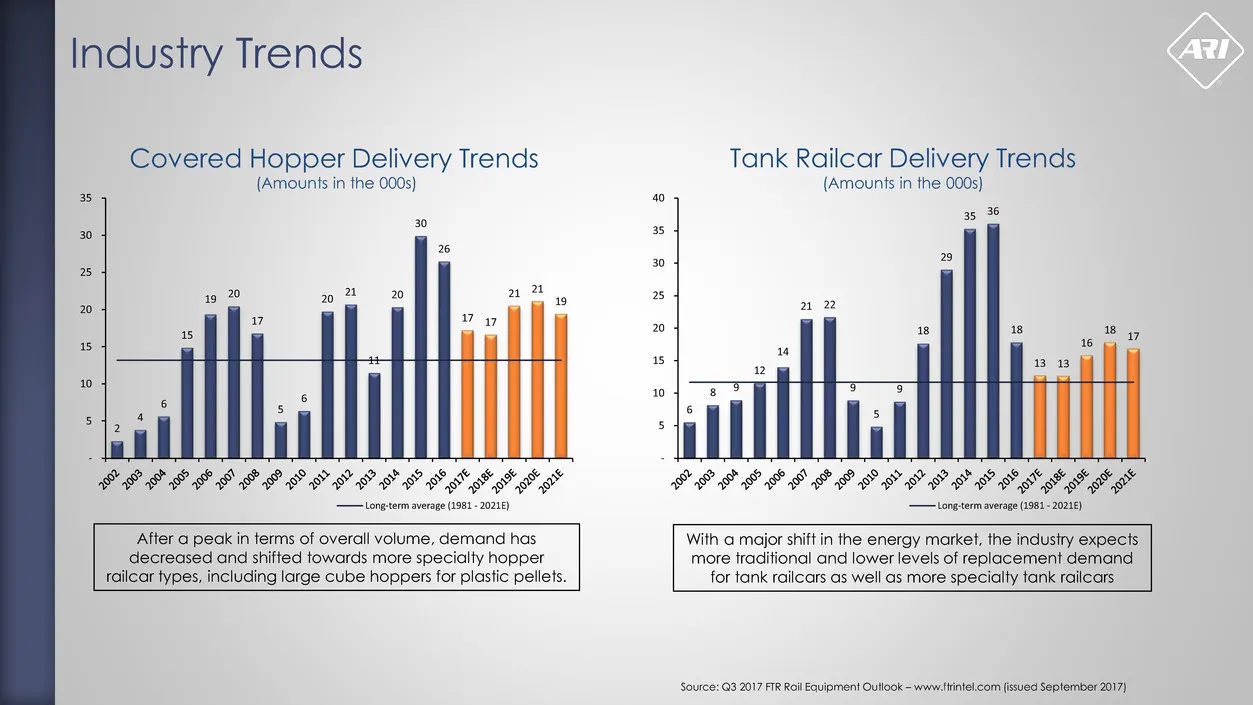
Slide 9: Industry Trends: Covered Hopper and Tank Railcar Deliveries
2 4 6 15 19 20 17 5 6 20 21 11 20 30 26 17 17 21 21 19 - 5 10 15 20 25 30 35 Long-term average (1981 - 2021E) Industry Trends Covered Hopper Delivery Trends (Amounts in the 000s) Tank Railcar Delivery Trends (Amounts in the 000s) After a peak in terms of overall volume, demand has decreased and shif
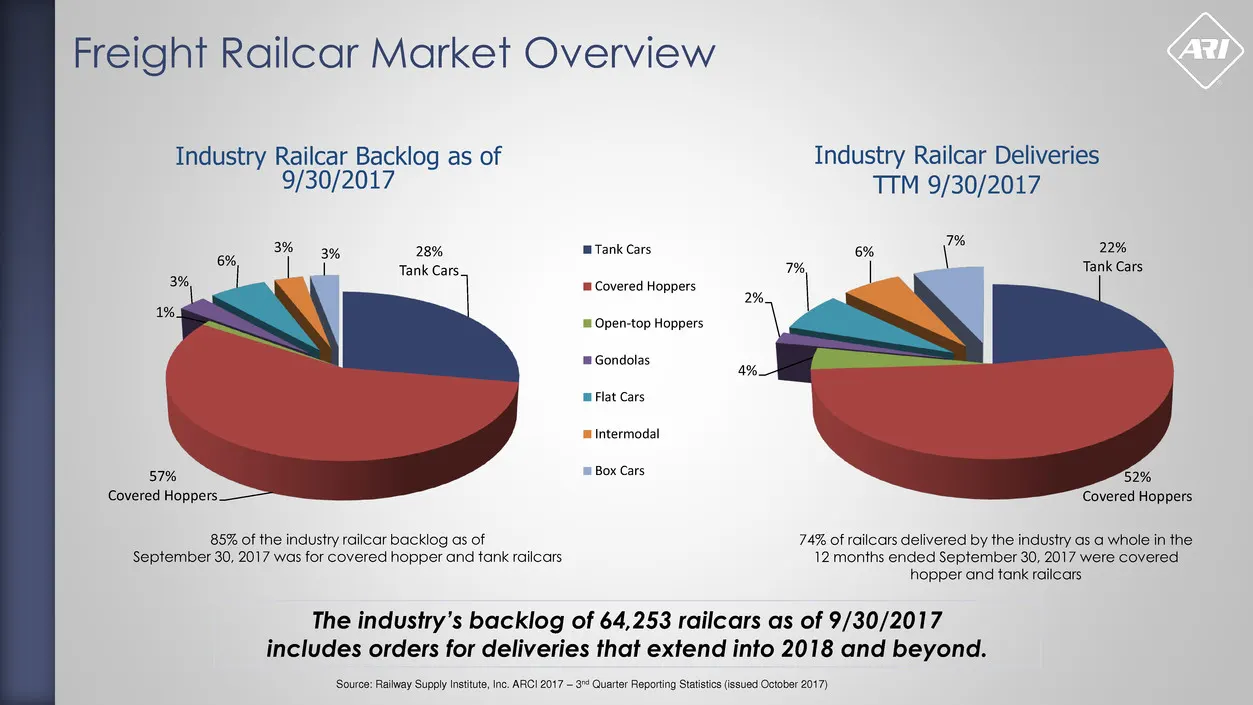
Slide 10: Freight Railcar Market Overview
22% Tank Cars 52% Covered Hoppers 4% 2% 7% 6% 7% 74% of railcars delivered by the industry as a whole in the 12 months ended September 30, 2017 were covered hopper and tank railcars Freight Railcar Market Overview Source: Railway Supply Institute, Inc. ARCI 2017 – 3nd Quarter Reporting Statistics (i
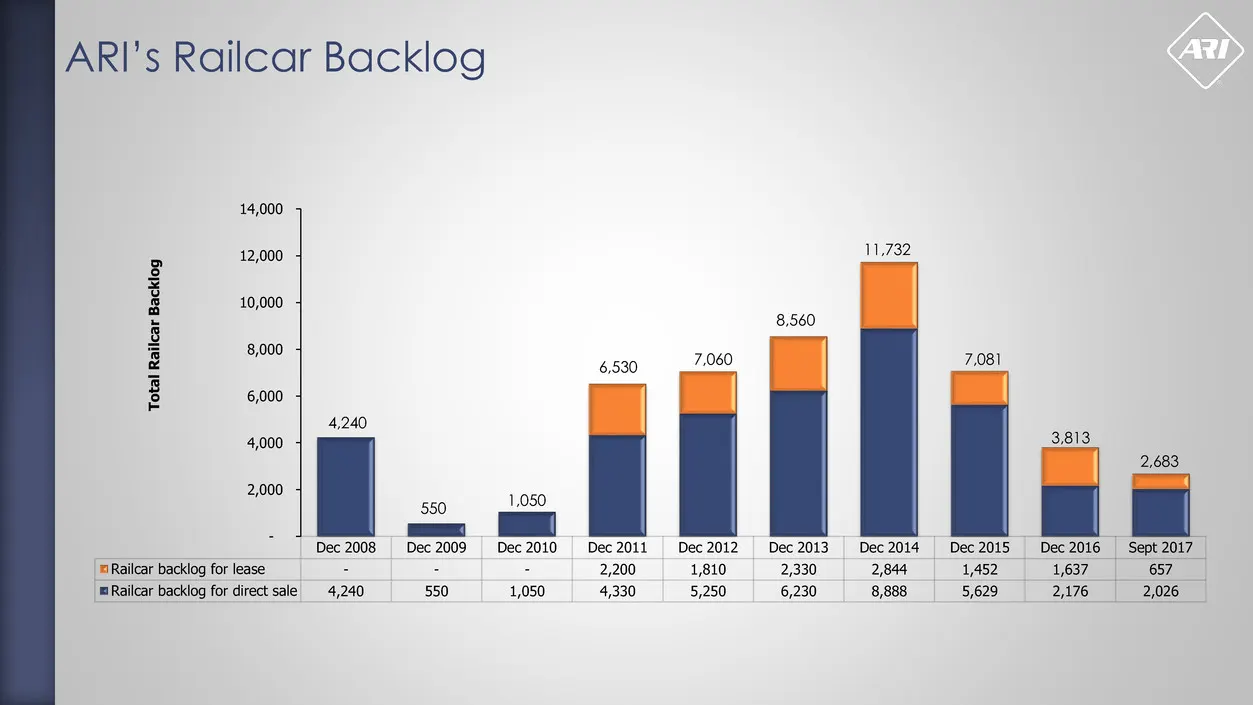
Slide 11: ARI's Railcar Backlog
ARI’s Railcar Backlog Dec 2008 Dec 2009 Dec 2010 Dec 2011 Dec 2012 Dec 2013 Dec 2014 Dec 2015 Dec 2016 Sept 2017 Railcar backlog for lease - - - 2,200 1,810 2,330 2,844 1,452 1,637 657 Railcar backlog for direct sale 4,240 550 1,050 4,330 5,250 6,230 8,888 5,629 2,176 2,026 - 2,000 4,000 6,000 8,000
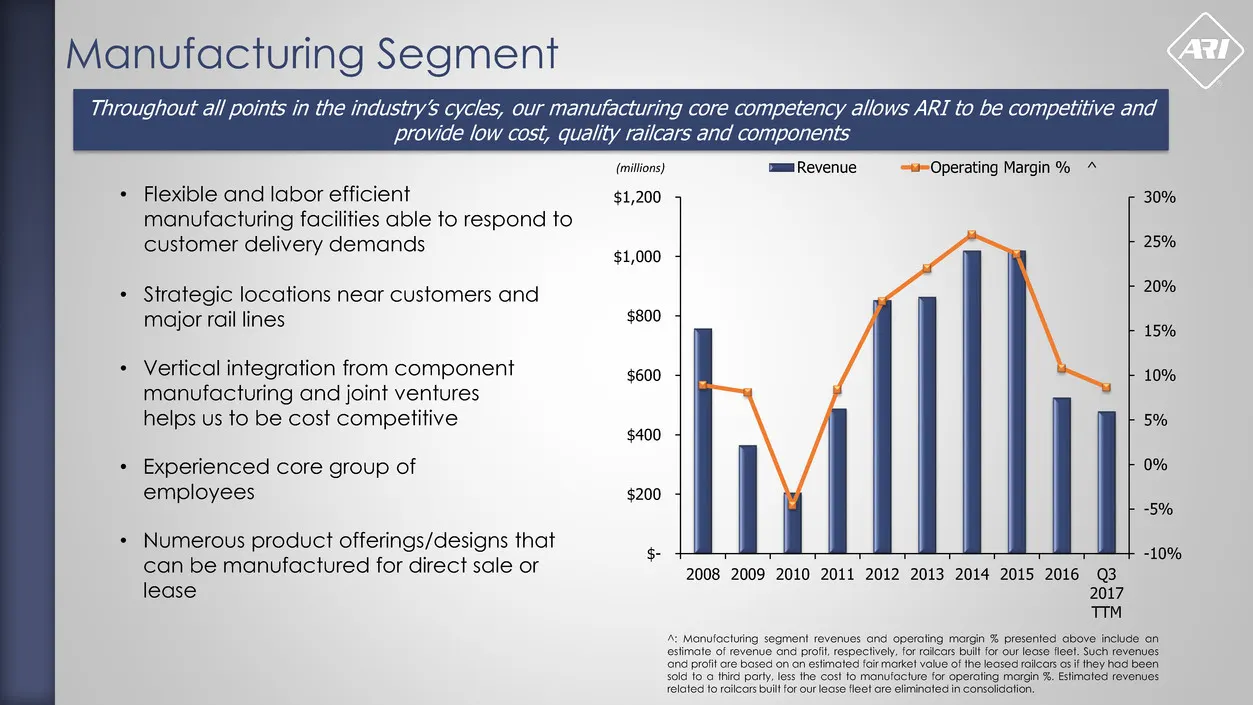
Slide 12: Manufacturing Segment
• Flexible and labor efficient manufacturing facilities able to respond to customer delivery demands • Strategic locations near customers and major rail lines • Vertical integration from component manufacturing and joint ventures helps us to be cost competitive • Experienced core group of employees
Slide 13: Railcar Leasing Segment
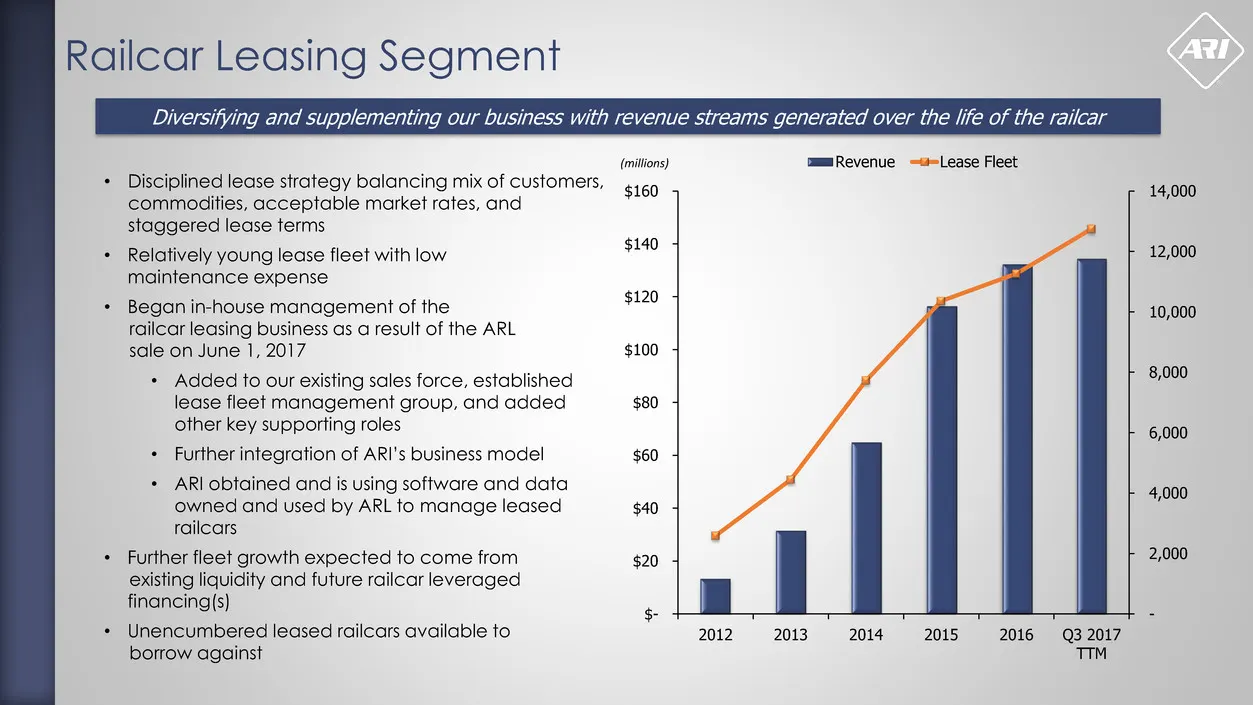
Railcar Leasing Segment Diversifying and supplementing our business with revenue streams generated over the life of the railcar - 2,000 4,000 6,000 8,000 10,000 12,000 14,000 $- $20 $40 $60 $80 $100 $120 $140 $160 2012 2013 2014 2015 2016 Q3 2017 TTM Revenue Lease Fleet(millions) • Disciplined lease
Slide 14: Railcar Services Segment
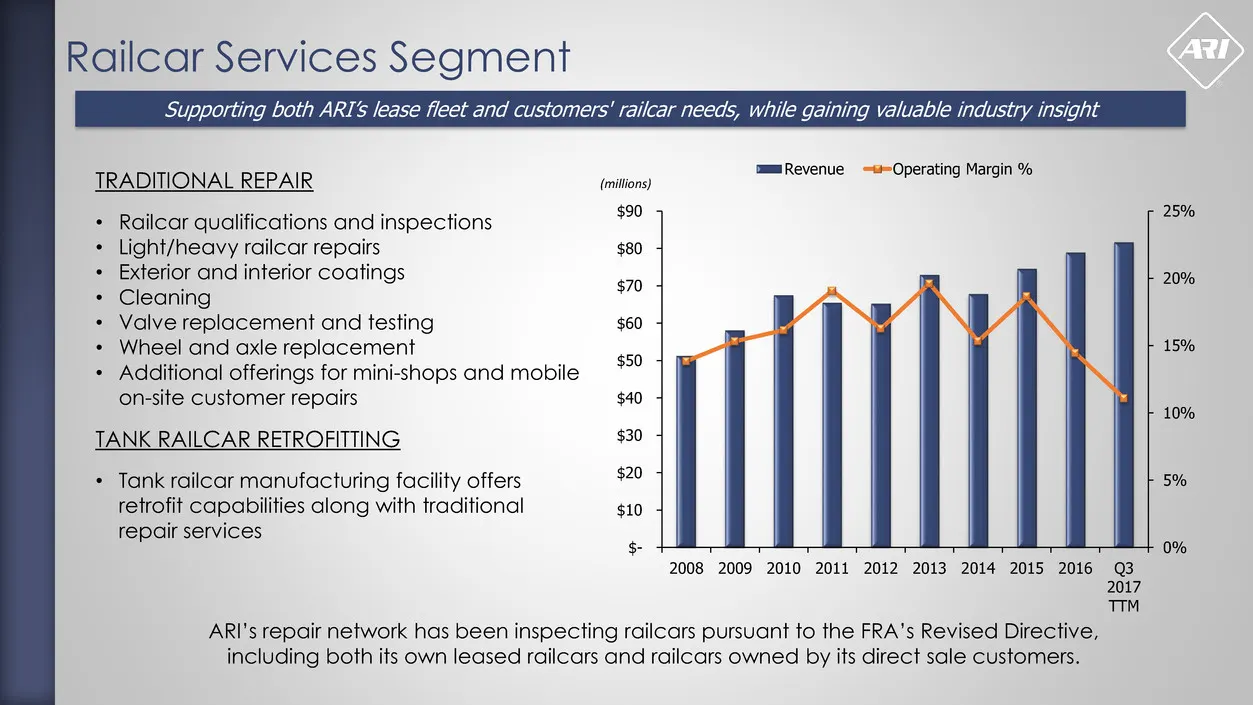
Railcar Services Segment Supporting both ARI’s lease fleet and customers' railcar needs, while gaining valuable industry insight TRADITIONAL REPAIR • Railcar qualifications and inspections • Light/heavy railcar repairs • Exterior and interior coatings • Cleaning • Valve replacement and testing • Whe
Slide 15: Strategic Progress Continues…
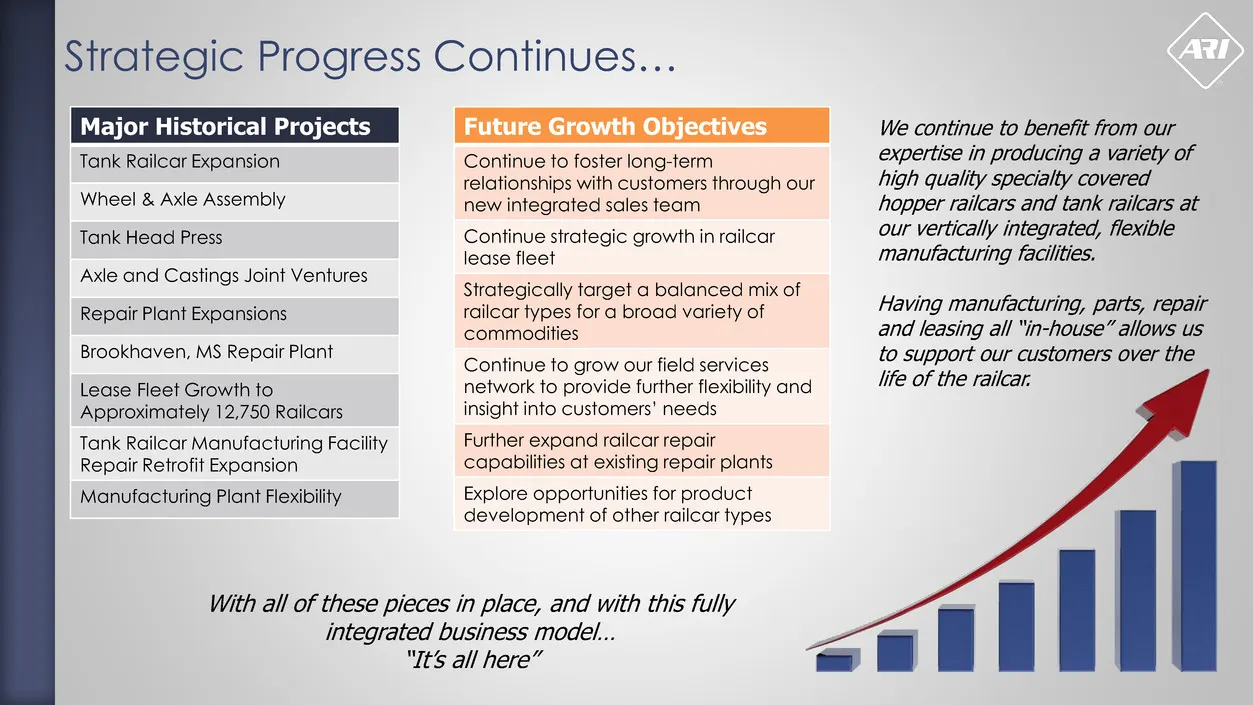
Strategic Progress Continues… Major Historical Projects Tank Railcar Expansion Wheel & Axle Assembly Tank Head Press Axle and Castings Joint Ventures Repair Plant Expansions Brookhaven, MS Repair Plant Lease Fleet Growth to Approximately 12,750 Railcars Tank Railcar Manufacturing Facility Repair Ret
Slide 16: Strong Financial Profile
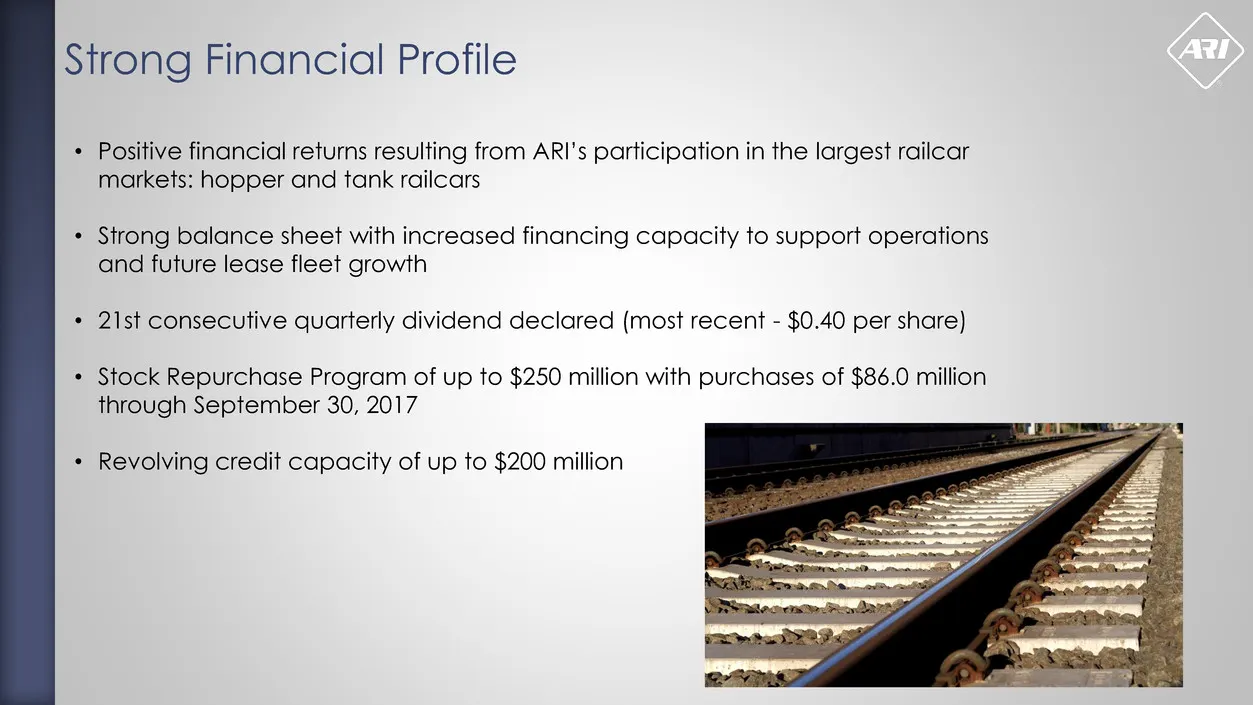
Strong Financial Profile • Positive financial returns resulting from ARI’s participation in the largest railcar markets: hopper and tank railcars • Strong balance sheet with increased financing capacity to support operations and future lease fleet growth • 21st consecutive quarterly dividend declare
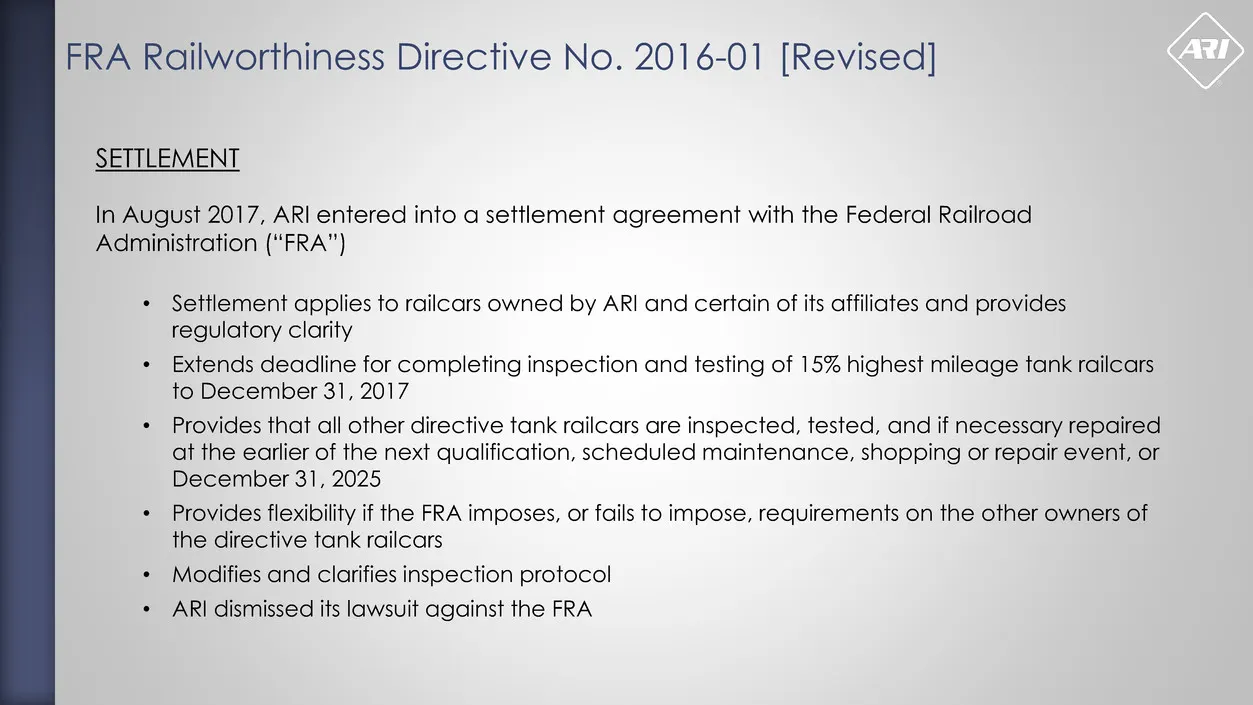
Slide 17: FRA Railworthiness Directive No. 2016-01 [Revised] Settlement
FRA Railworthiness Directive No. 2016-01 [Revised] SETTLEMENT In August 2017, ARI entered into a settlement agreement with the Federal Railroad Administration (“FRA”) • Settlement applies to railcars owned by ARI and certain of its affiliates and provides regulatory clarity • Extends deadline for co
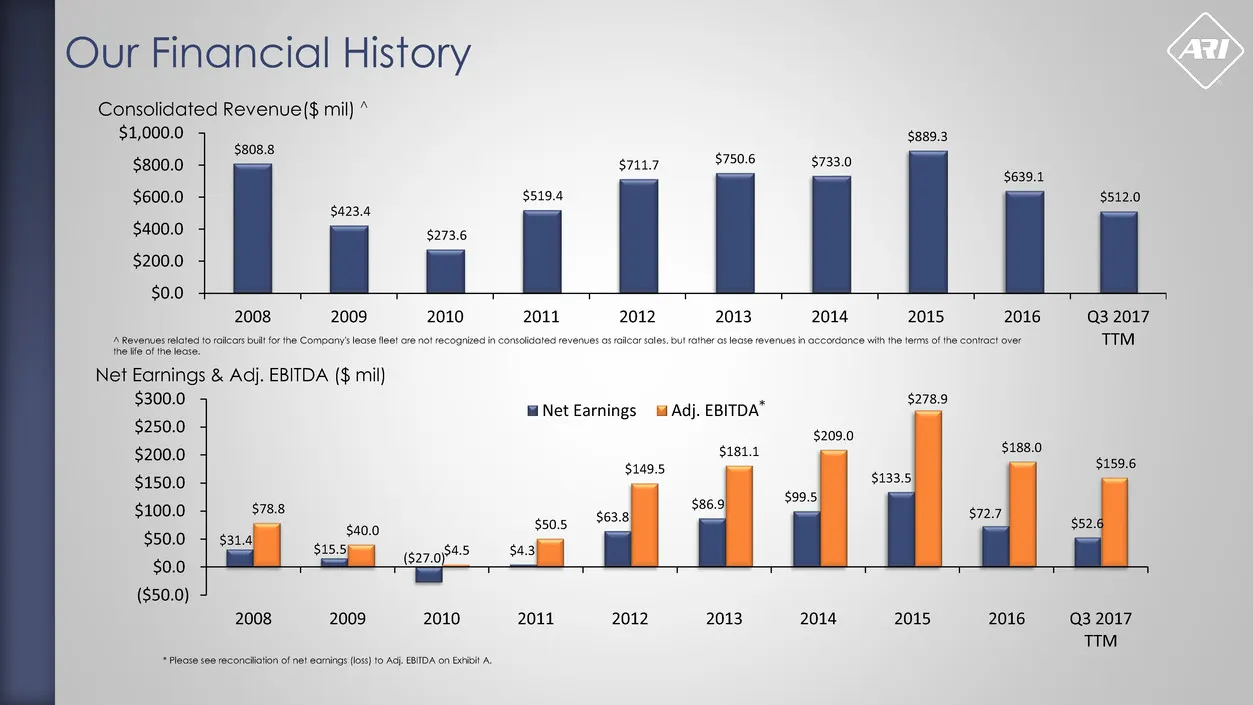
Slide 18: Our Financial History
Our Financial History $808.8 $423.4 $273.6 $519.4 $711.7 $750.6 $733.0 $889.3 $639.1 $512.0 $0.0 $200.0 $400.0 $600.0 $800.0 $1,000.0 2008 2009 2010 2011 2012 2013 2014 2015 2016 Q3 2017 TTM^ Revenues related to railcars built for the Company's lease fleet are not recognized in consolidated revenues
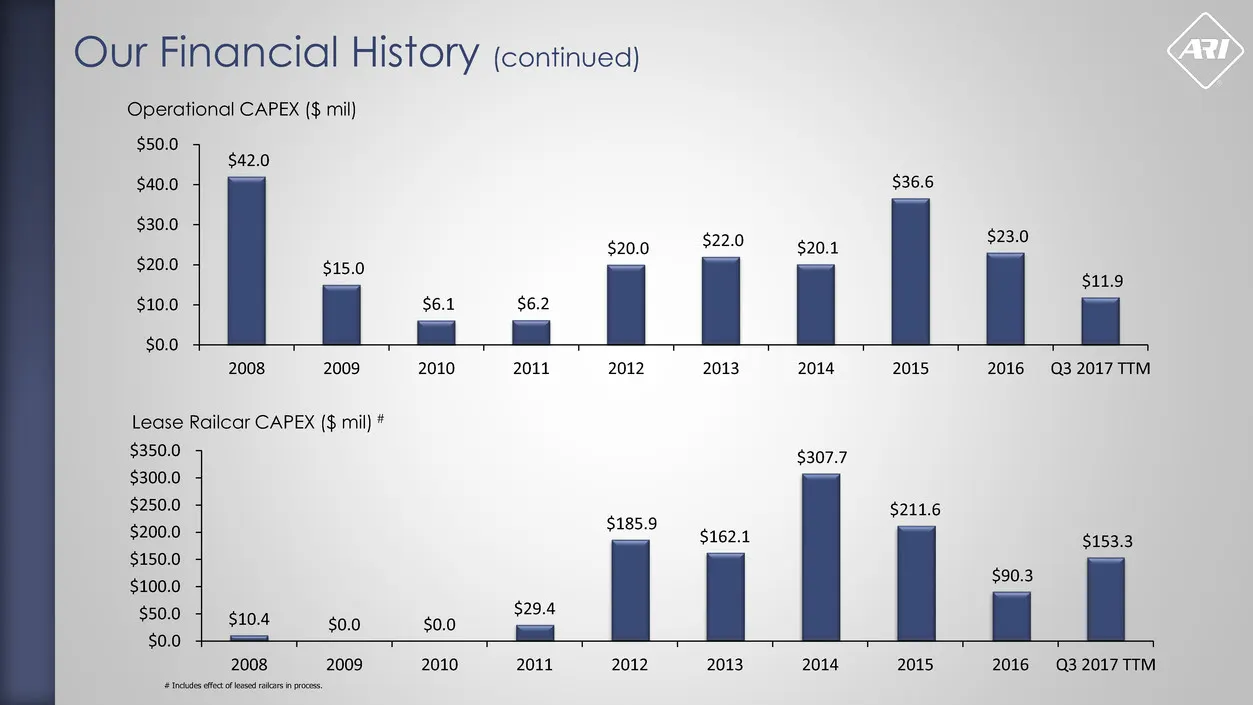
Slide 19: Our Financial History (continued)
Our Financial History (continued) $10.4 $0.0 $0.0 $29.4 $185.9 $162.1 $307.7 $211.6 $90.3 $153.3 $0.0 $50.0 $100.0 $150.0 $200.0 $250.0 $300.0 $350.0 2008 2009 2010 2011 2012 2013 2014 2015 2016 Q3 2017 TTM Lease Railcar CAPEX ($ mil) # Operational CAPEX ($ mil) $42.0 $15.0 $6.1 $6.2 $20.0 $22.0 $20
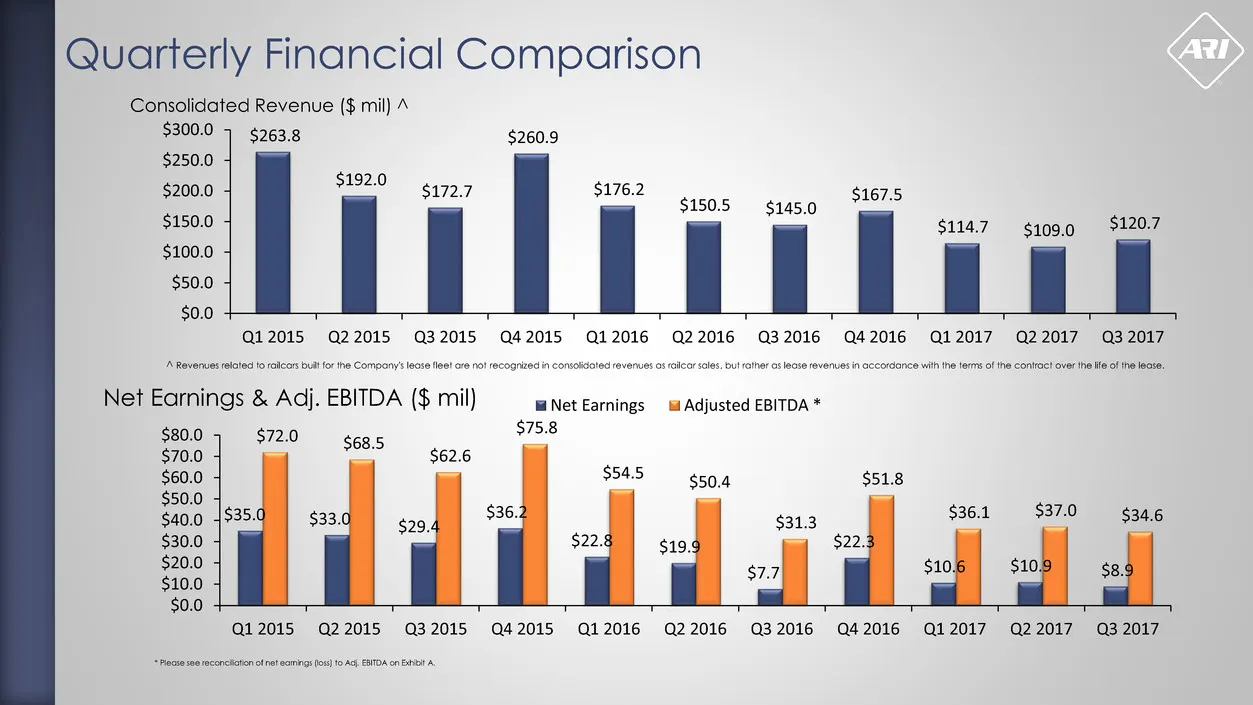
Slide 20: Quarterly Financial Comparison
Quarterly Financial Comparison $263.8 $192.0 $172.7 $260.9 $176.2 $150.5 $145.0 $167.5 $114.7 $109.0 $120.7 $0.0 $50.0 $100.0 $150.0 $200.0 $250.0 $300.0 Q1 2015 Q2 2015 Q3 2015 Q4 2015 Q1 2016 Q2 2016 Q3 2016 Q4 2016 Q1 2017 Q2 2017 Q3 2017 ^ Revenues related to railcars built for the Company's lea
Slide 21: Quarterly Financial Comparison (continued)
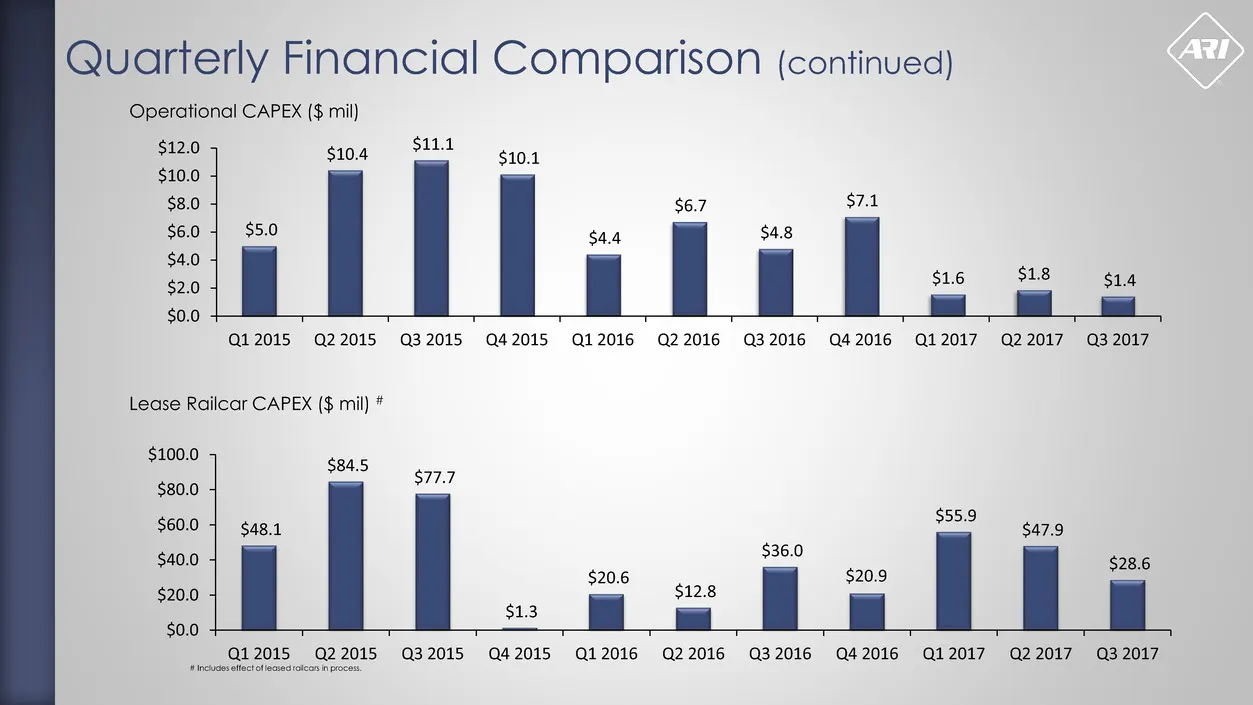
Quarterly Financial Comparison (continued) $5.0 $10.4 $11.1 $10.1 $4.4 $6.7 $4.8 $7.1 $1.6 $1.8 $1.4 $0.0 $2.0 $4.0 $6.0 $8.0 $10.0 $12.0 Q1 2015 Q2 2015 Q3 2015 Q4 2015 Q1 2016 Q2 2016 Q3 2016 Q4 2016 Q1 2017 Q2 2017 Q3 2017 $48.1 $84.5 $77.7 $1.3 $20.6 $12.8 $36.0 $20.9 $55.9 $47.9 $28.6 $0.0 $20.
Slide 22: Exhibit A – Adj. EBITDA Reconciliation
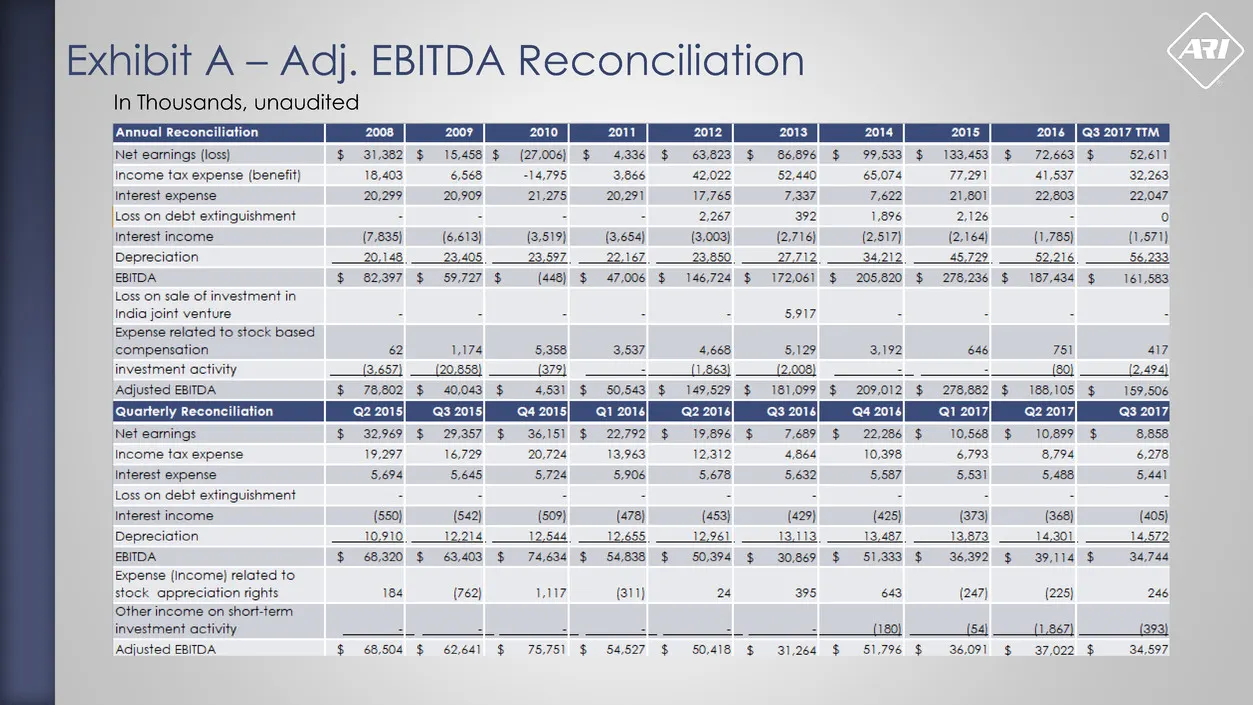
Exhibit A – Adj. EBITDA Reconciliation In Thousands, unaudited
Slide 23: Exhibit A – Adj. EBITDA Reconciliation
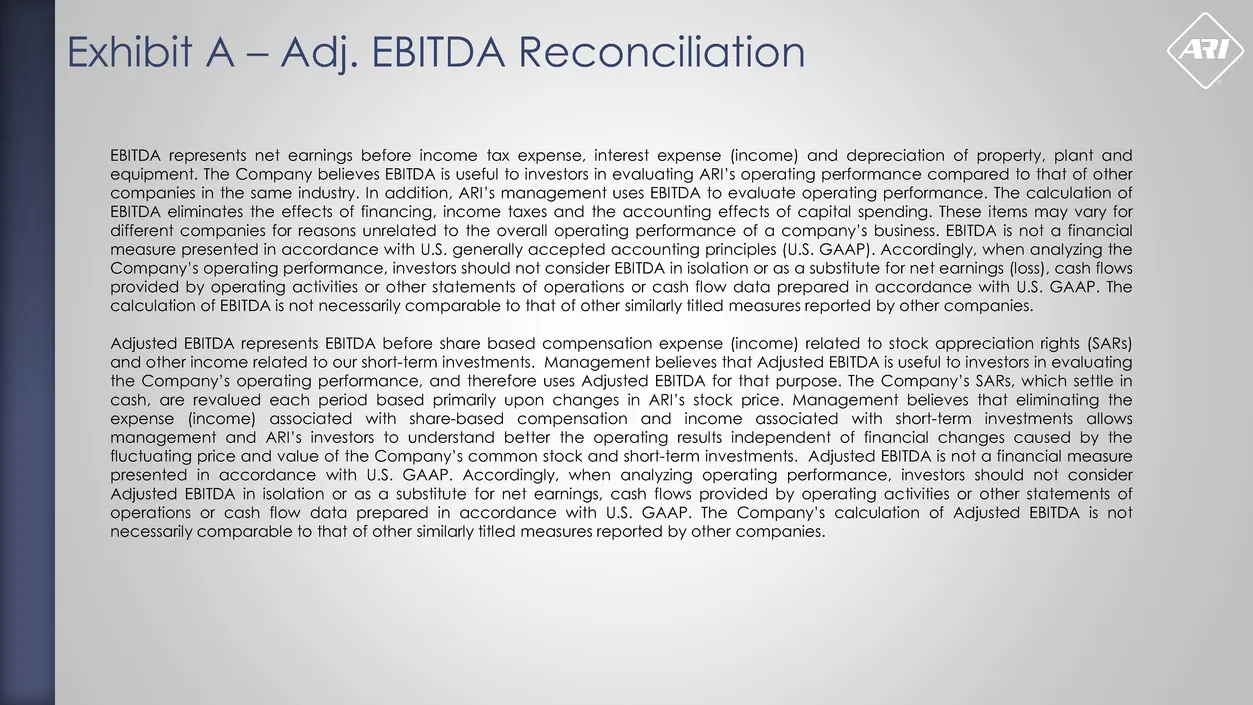
Exhibit A – Adj. EBITDA Reconciliation EBITDA represents net earnings before income tax expense, interest expense (income) and depreciation of property, plant and equipment. The Company believes EBITDA is useful to investors in evaluating ARI’s operating performance compared to that of other compani
Slide 24: A Tradition of Industry Leadership
A Tradition of Industry Leadership
Source: SEC EDGAR · 8-K filed Nov 3, 2017
More decks from American Railcar Industries Inc
 Q3 2018 Earnings Presentation19 slides · Oct 30, 2018
 Investor Presentation (August 2018)26 slides · Aug 24, 2018
 Q2 2018 Earnings Presentation19 slides · Aug 1, 2018
 Q1 2018 Earnings Presentation18 slides · May 1, 2018
 Q4 2017 Earnings Presentation19 slides · Feb 23, 2018
 Cowen conference 201824 slides · Feb 6, 2018