Innolux Corp. · TWSE:3481
Innolux — Chimei Innolux — Q3 2012 Earnings Presentation
10 slides from Innolux's earnings presentation, October 2012

Slide 1: 3Q 2012 Earning Results
3Q 2012 Earning Results October 2 0 1 2
Slide 2: Disclaimer
Disclaimer Chimei Innolux Corporation’s statements of its current expectations and estimates are forward-looking statements subject to significant known and unknown risks and uncertainties and actual results may differ materially from those contained or implied in the forward looking statements. The
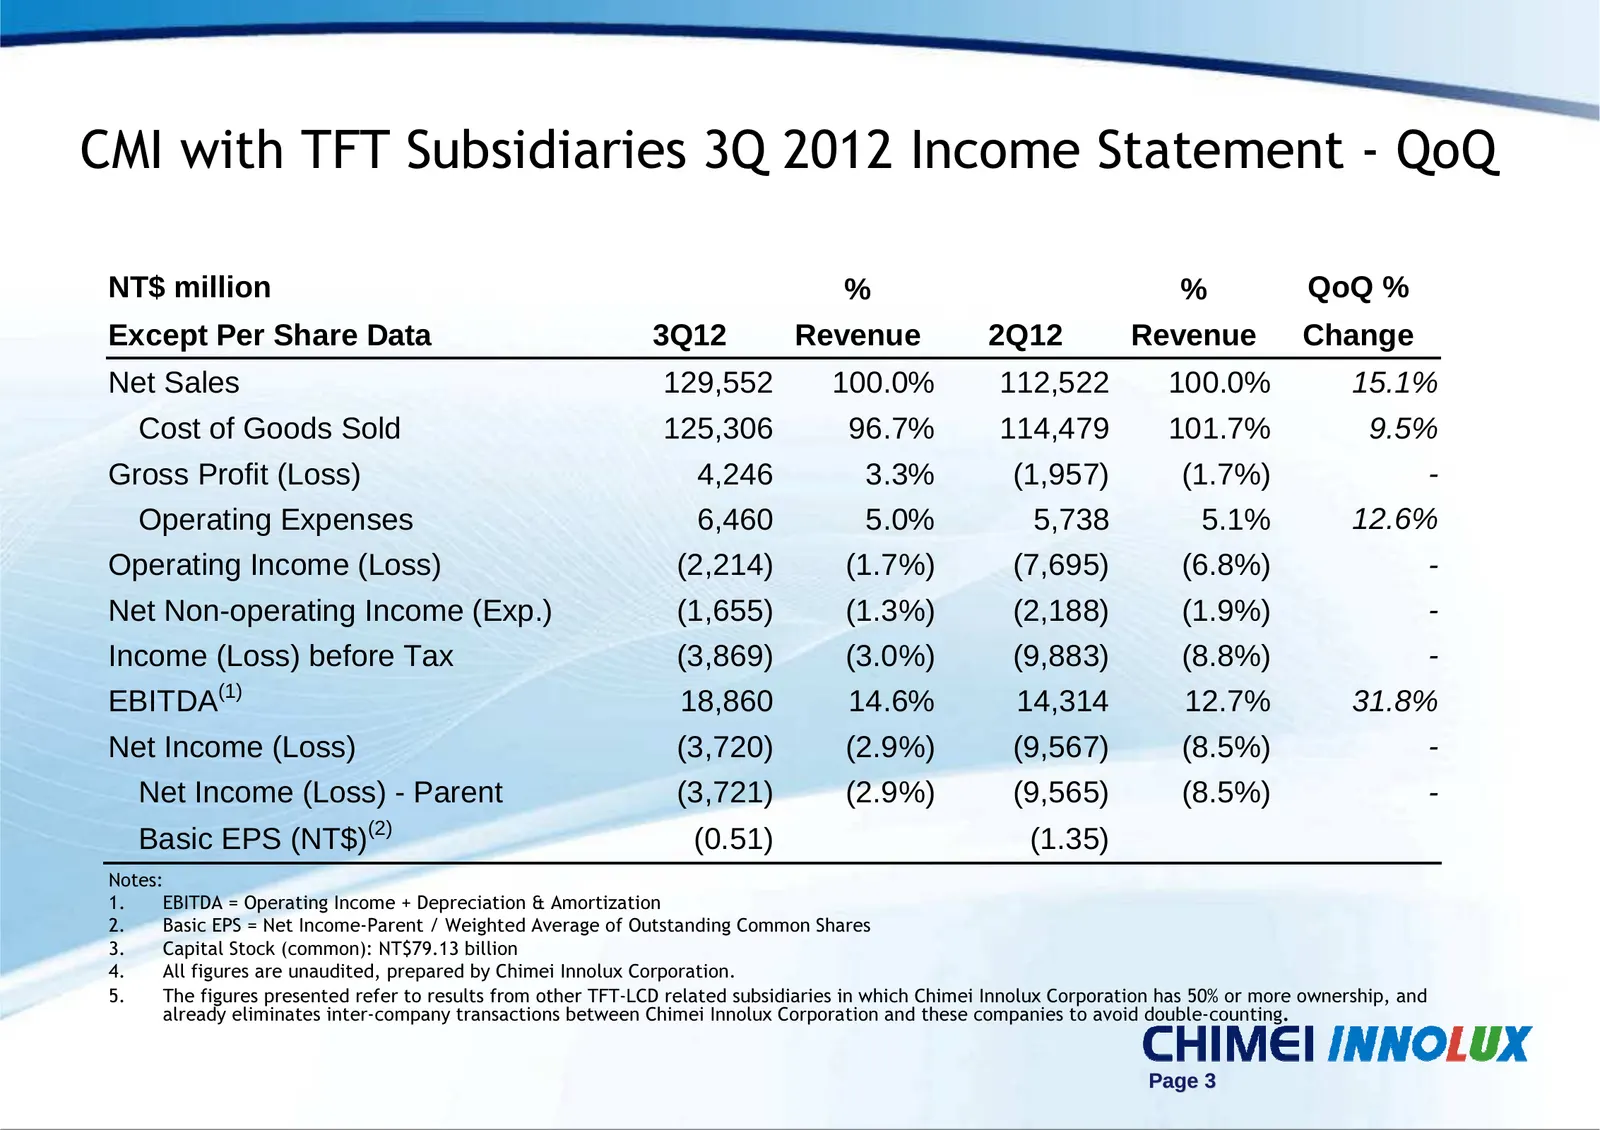
Slide 3: CMI with TFT Subsidiaries 3Q 2012 Income Statement - QoQ
CMI with TFT Subsidiaries 3Q 2012 Income Statement - QoQ NT$ million % % QoQ % Except Per Share Data 3Q12 Revenue 2Q12 Revenue Change Net Sales 129,552 100.0% 112,522 100.0% 15.1% Cost of Goods Sold 125,306 96.7% 114,479 101.7% 9.5% Gross Profit (Loss) 4,246 3.3% (1,957) (1.7%) - Operating Expenses
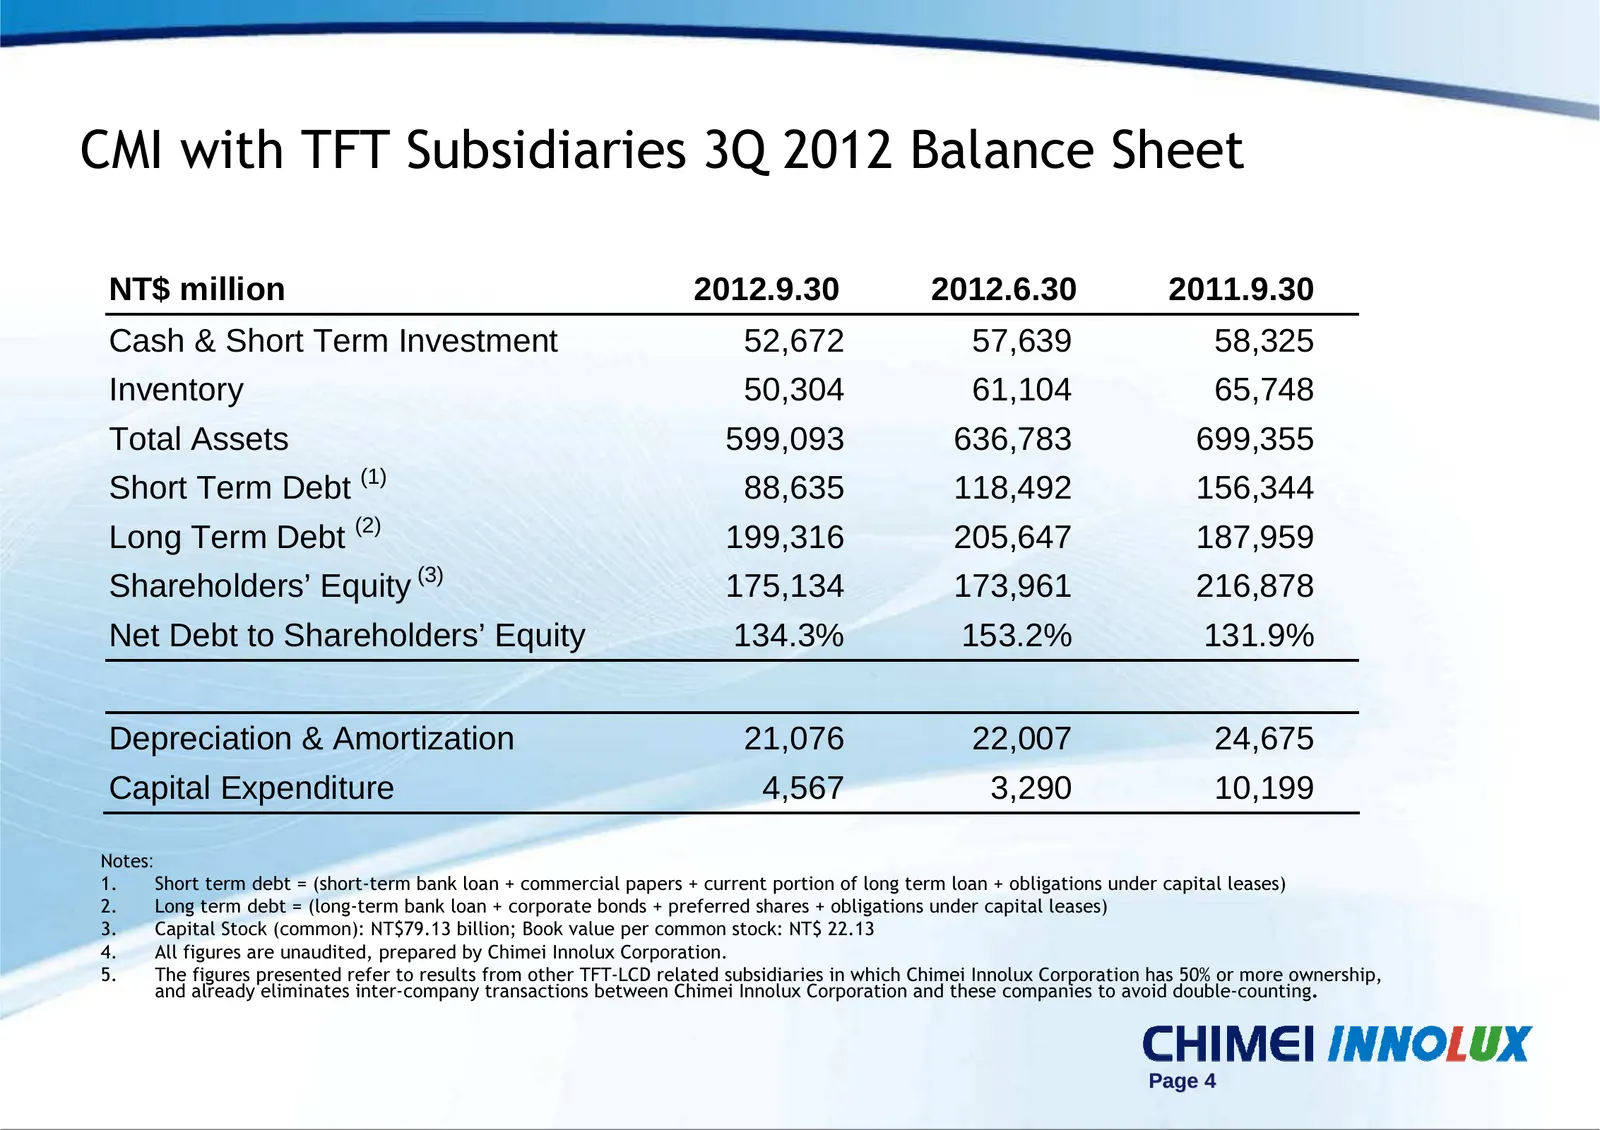
Slide 4: CMI with TFT Subsidiaries 3Q 2012 Balance Sheet
CMI with TFT Subsidiaries 3Q 2012 Balance Sheet NT$ million 2012.9.30 2012.6.30 2011.9.30 Cash & Short Term Investment 52,672 57,639 58,325 Inventory 50,304 61,104 65,748 Total Assets 599,093 636,783 699,355 Short Term Debt (1) 88,635 118,492 156,344 Long Term Debt (2) 199,316 205,647 187,959 Shareh
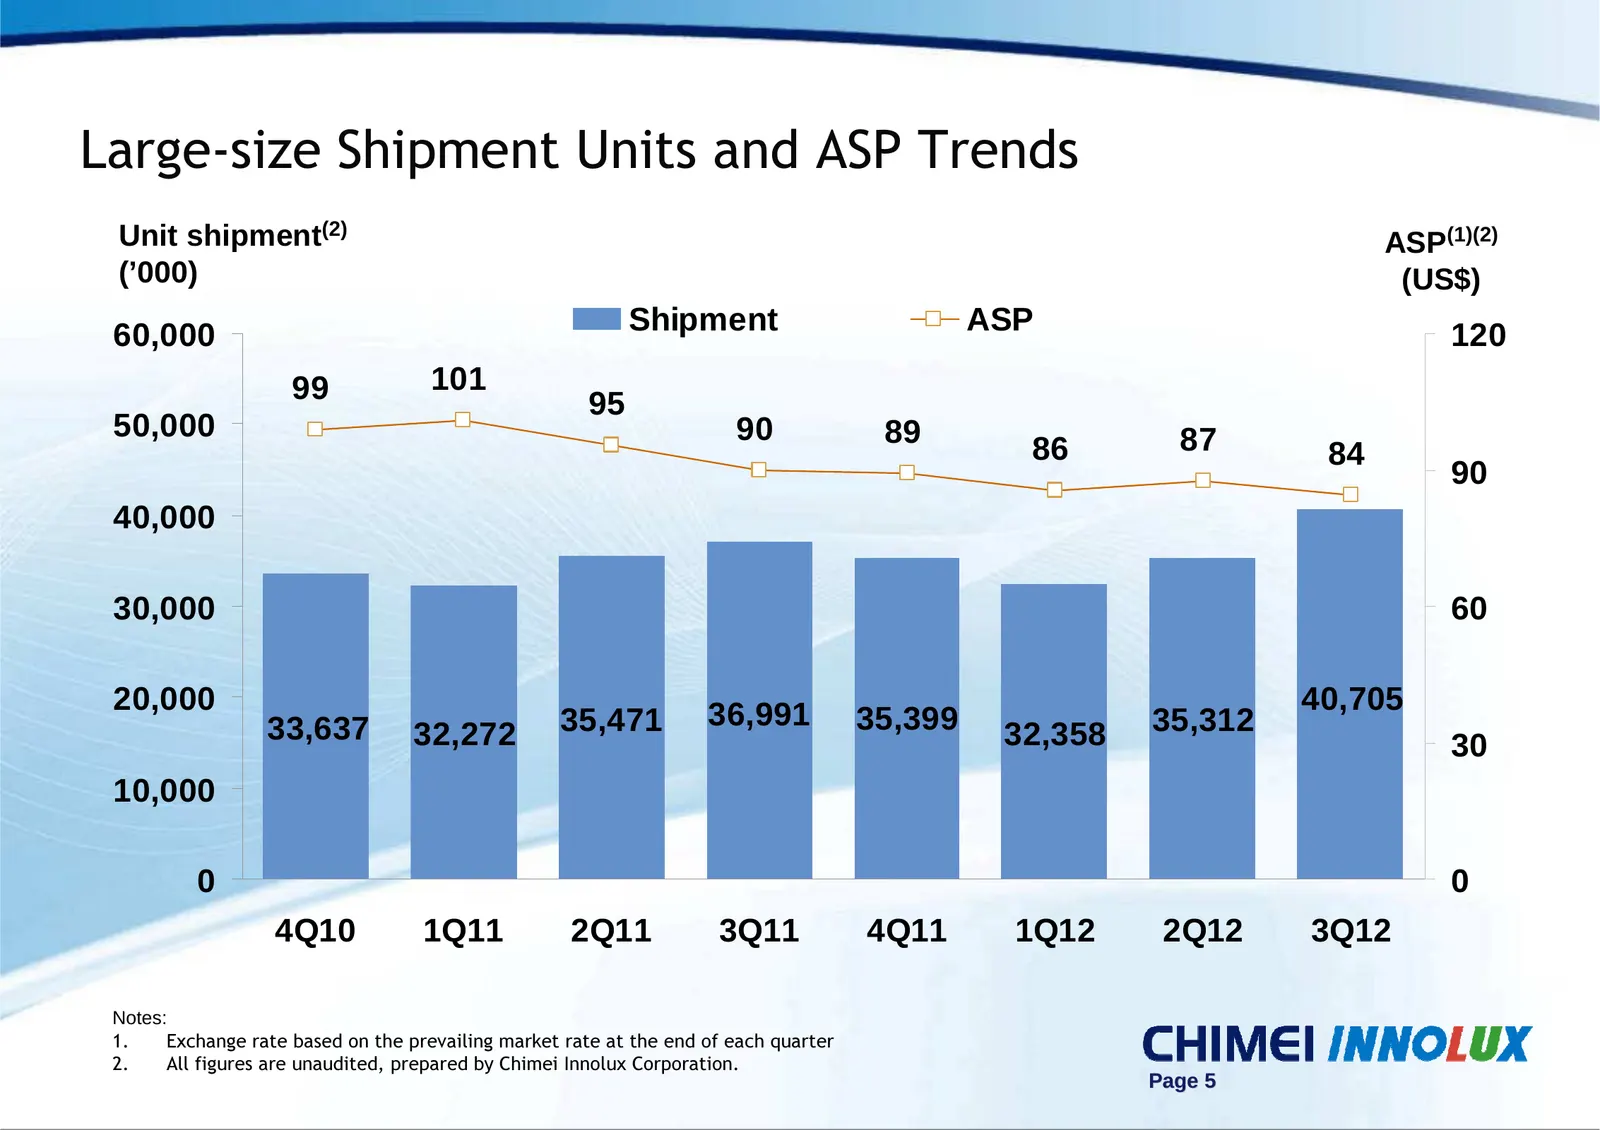
Slide 5: Large-size Shipment Units and ASP Trends
Large-size Shipment Units and ASP Trends Unit shipment(2) ASP(1)(2) (’000) (US$) 60,000 Shipment ASP 120 99 101 95 50,000 90 89 87 86 84 90 40,000 30,000 60 20,000 36,991 40,705 33,637 32,272 35,471 35,399 32,358 35,312 30 10,000 0 0 4Q10 1Q11 2Q11 3Q11 4Q11 1Q12 2Q12 3Q12 Notes: 1. Exchange rate ba
Slide 6: Small & Medium-Size Shipment and Sales Trends
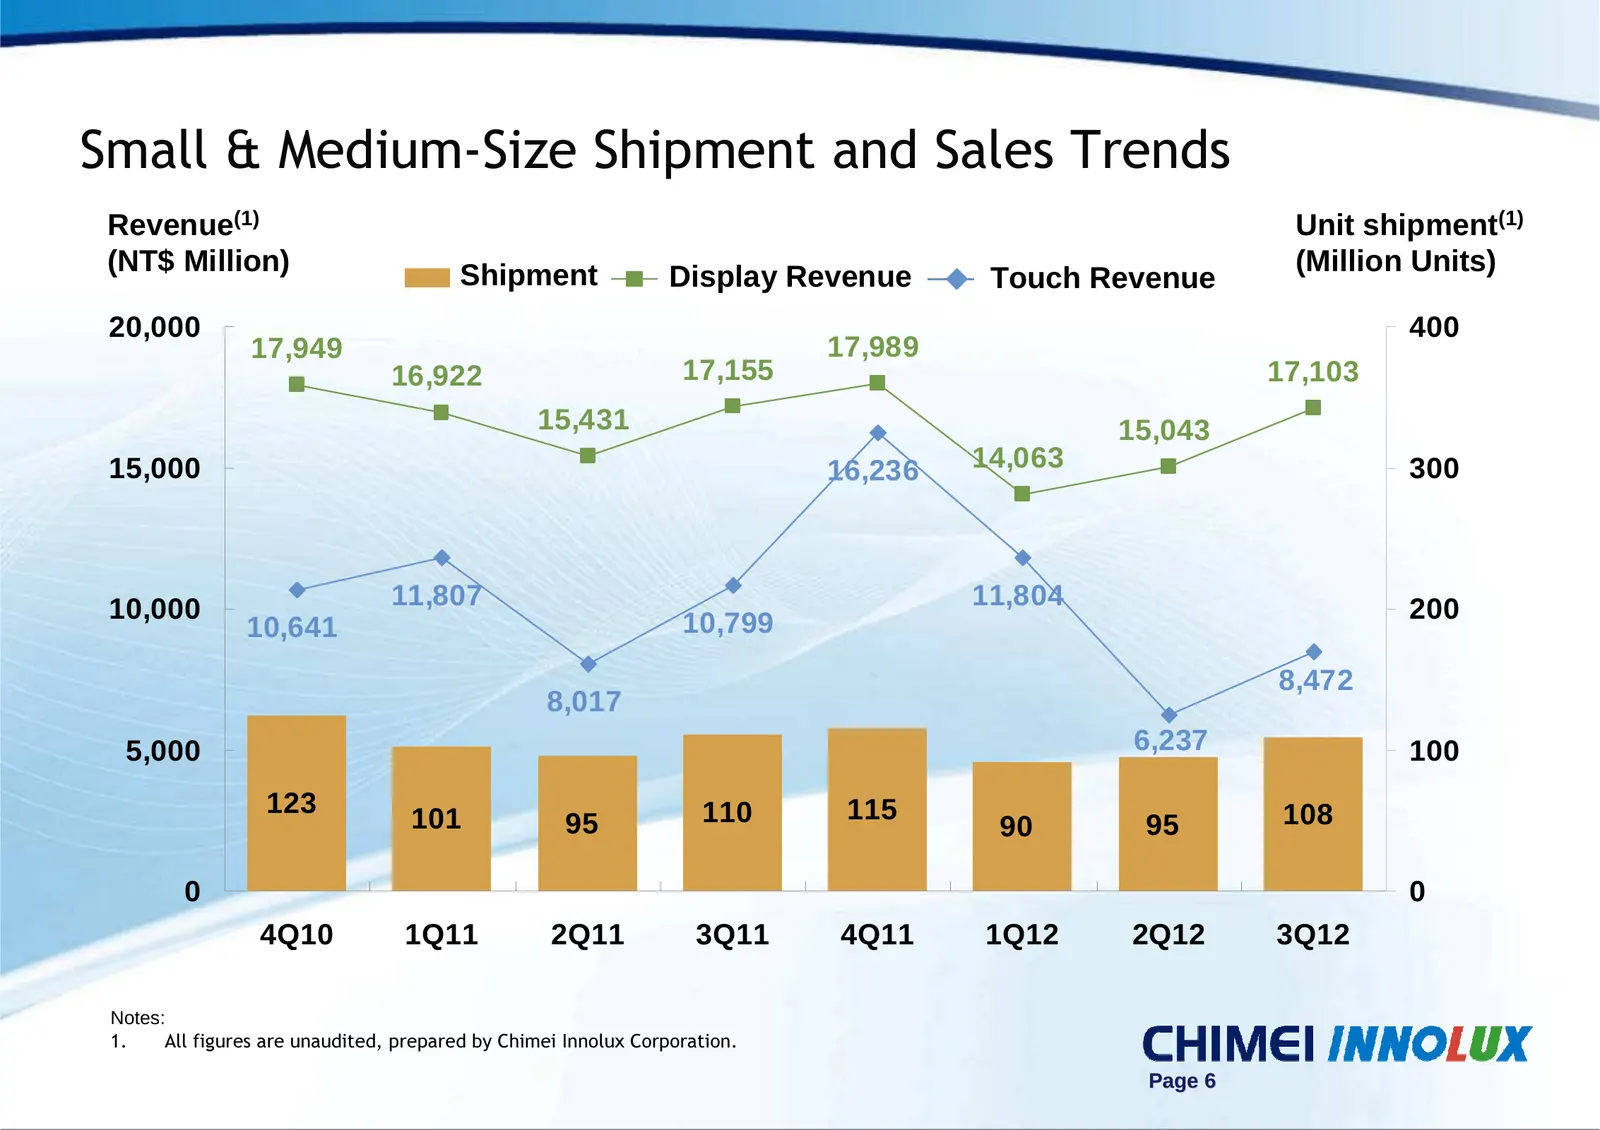
Small & Medium-Size Shipment and Sales Trends Revenue(1) Unit shipment(1) (NT$ Million) Shipment (Million Units) Display Revenue Touch Revenue 20,000 400 17,949 17,989 16,922 17,155 17,103 15,431 15,043 15,000 16,236 14,063 300 10,000 11,807 11,804 200 10,641 10,799 8,472 8,017 5,000 6,237 100 123 1
Slide 7: Revenue, Gross Margin, EBITDA Trends, and EPS Trends
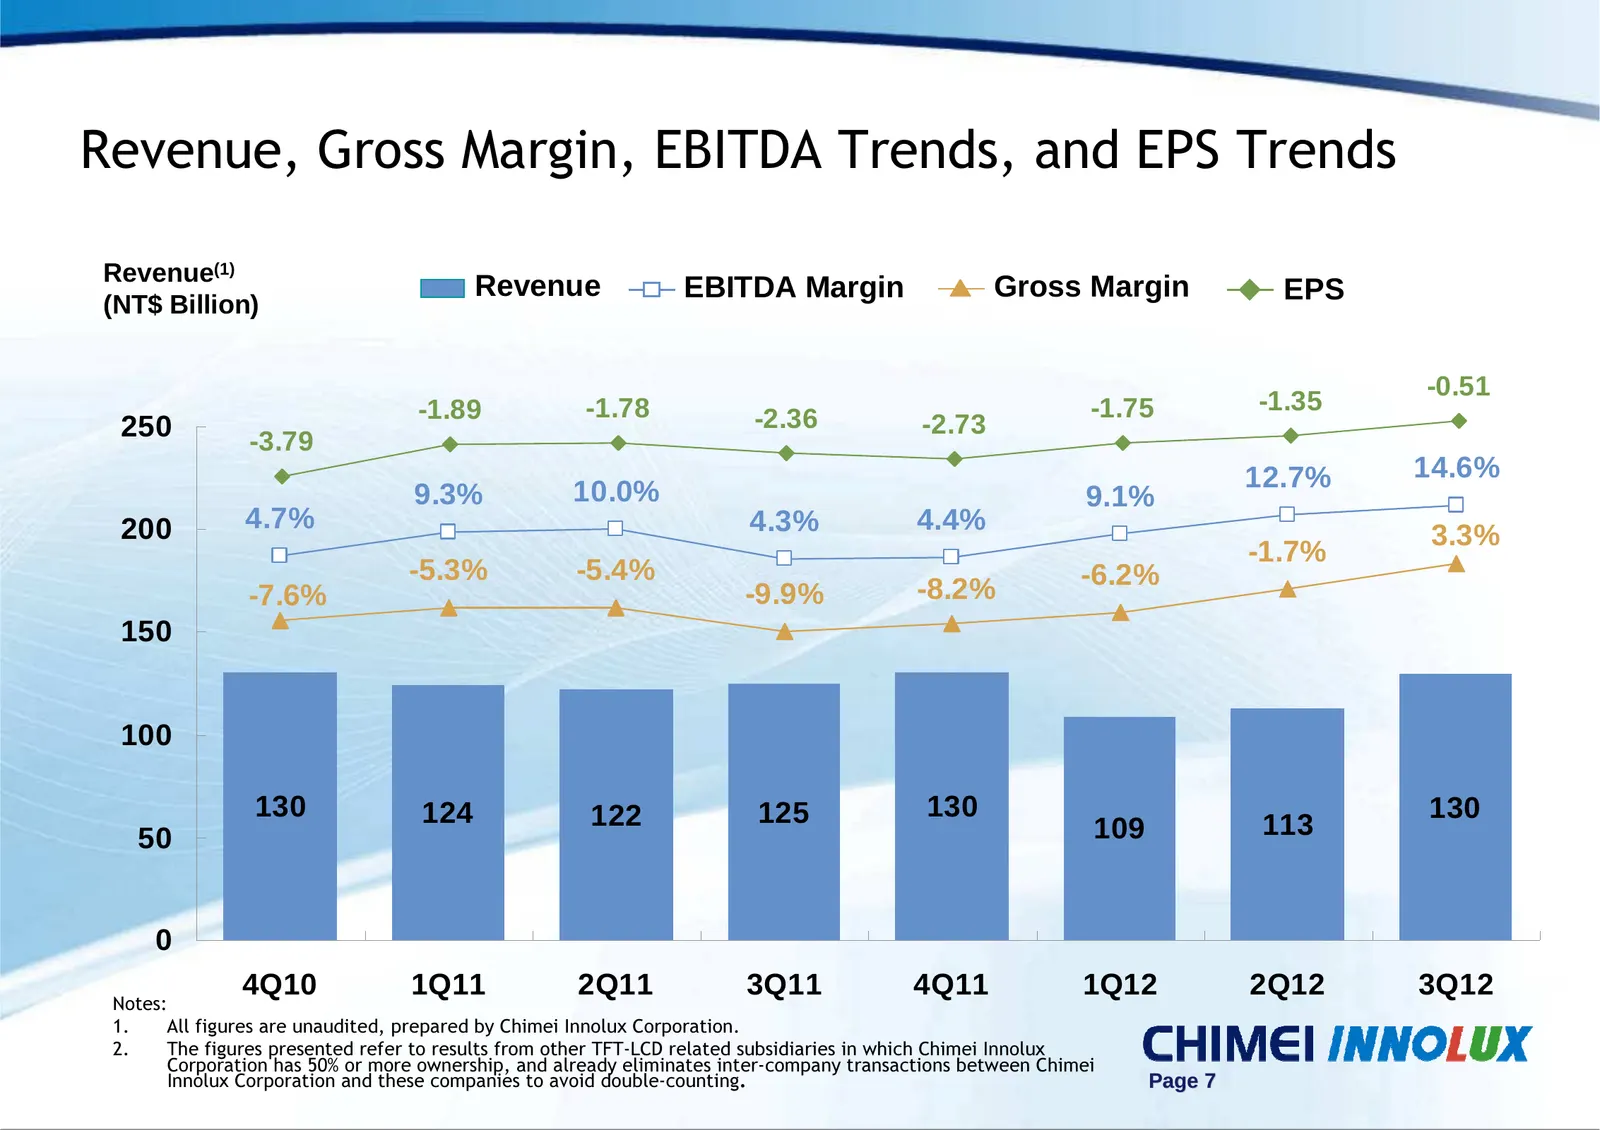
Revenue, Gross Margin, EBITDA Trends, and EPS Trends Revenue(1) Revenue EBITDA Margin Gross Margin EPS (NT$ Billion) -0.51 -1.89 -1.78 -1.75 -1.35 250 -2.36 -2.73 -3.79 12.7% 14.6% 9.3% 10.0% 9.1% 200 4.7% 4.3% 4.4% 3.3% -1.7% -5.3% -5.4% -6.2% -7.6% -9.9% -8.2% 150 100 130 124 122 125 130 130 50 10
Slide 8: Sales Breakdown by Application
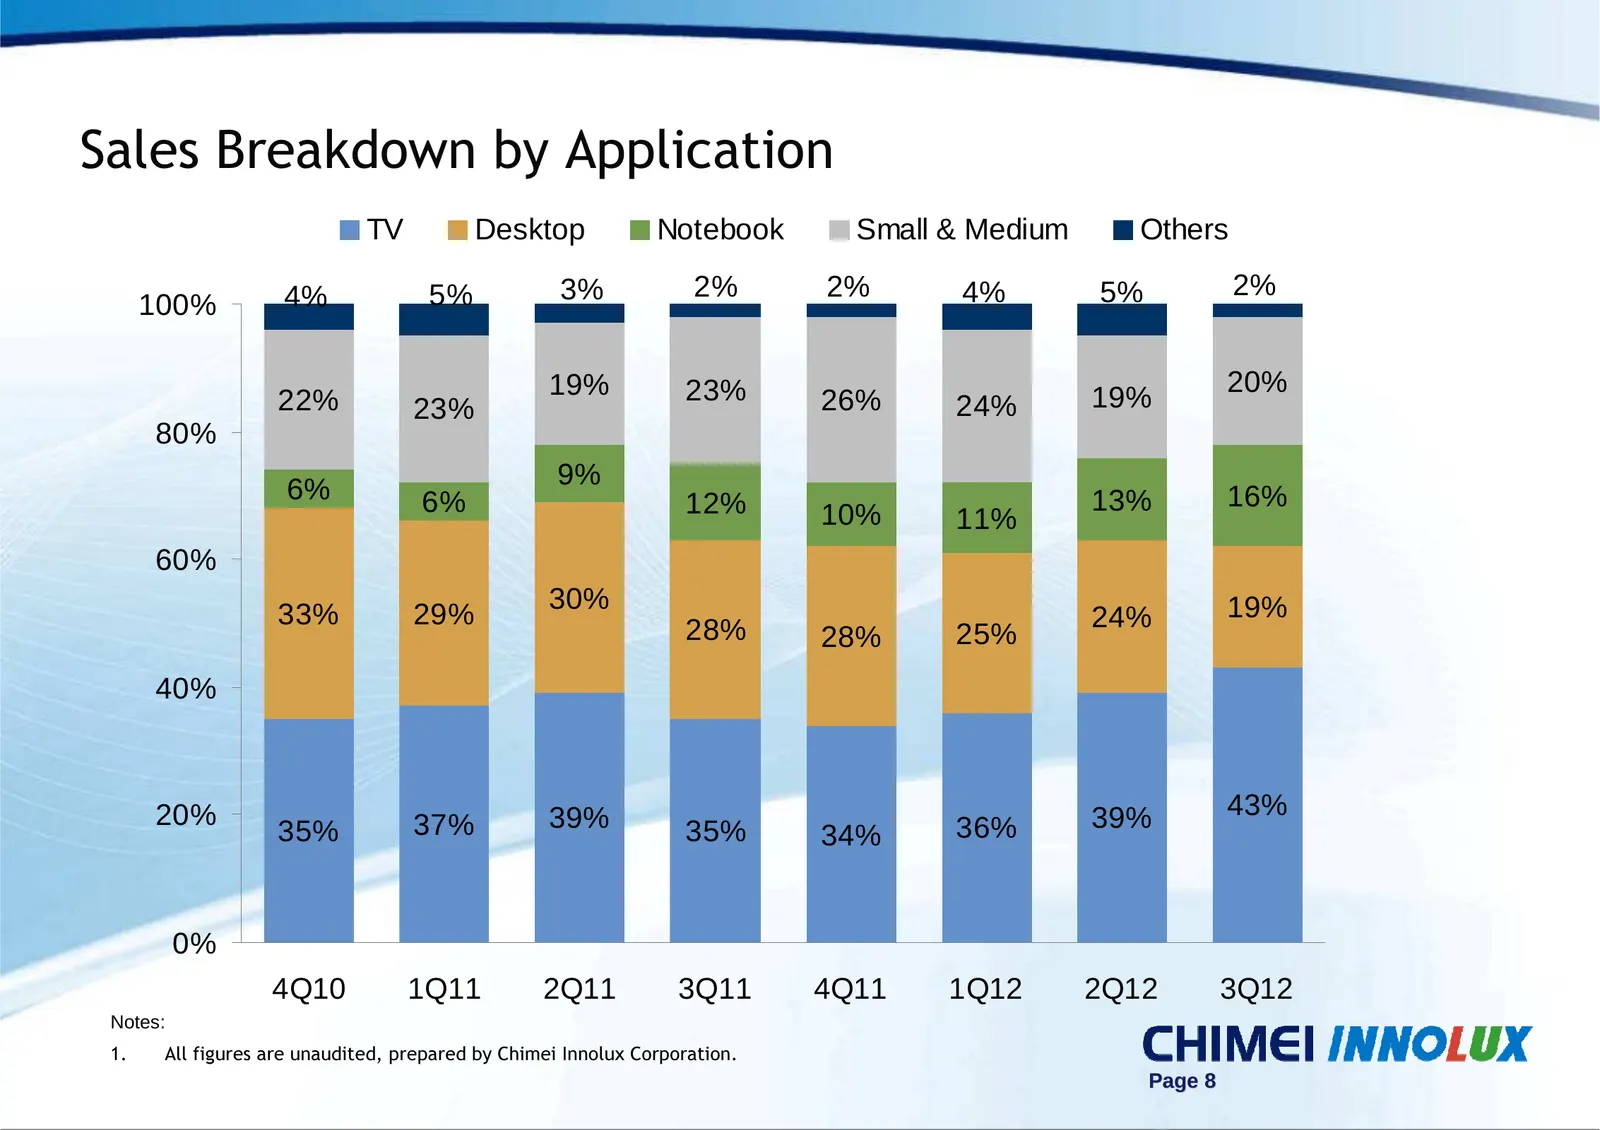
Sales Breakdown by Application TV Desktop Notebook Small & Medium Others 4% 5% 3% 2% 2% 4% 5% 2% 100% 19% 23% 20% 22% 23% 26% 24% 19% 80% 6% 9% 6% 12% 13% 16% 10% 11% 60% 30% 19% 33% 29% 24% 28% 28% 25% 40% 20% 39% 39% 43% 35% 37% 35% 34% 36% 0% 4Q10 1Q11 2Q11 3Q11 4Q11 1Q12 2Q12 3Q12 Notes: 1. All
Slide 9: Sales Breakdown by Size
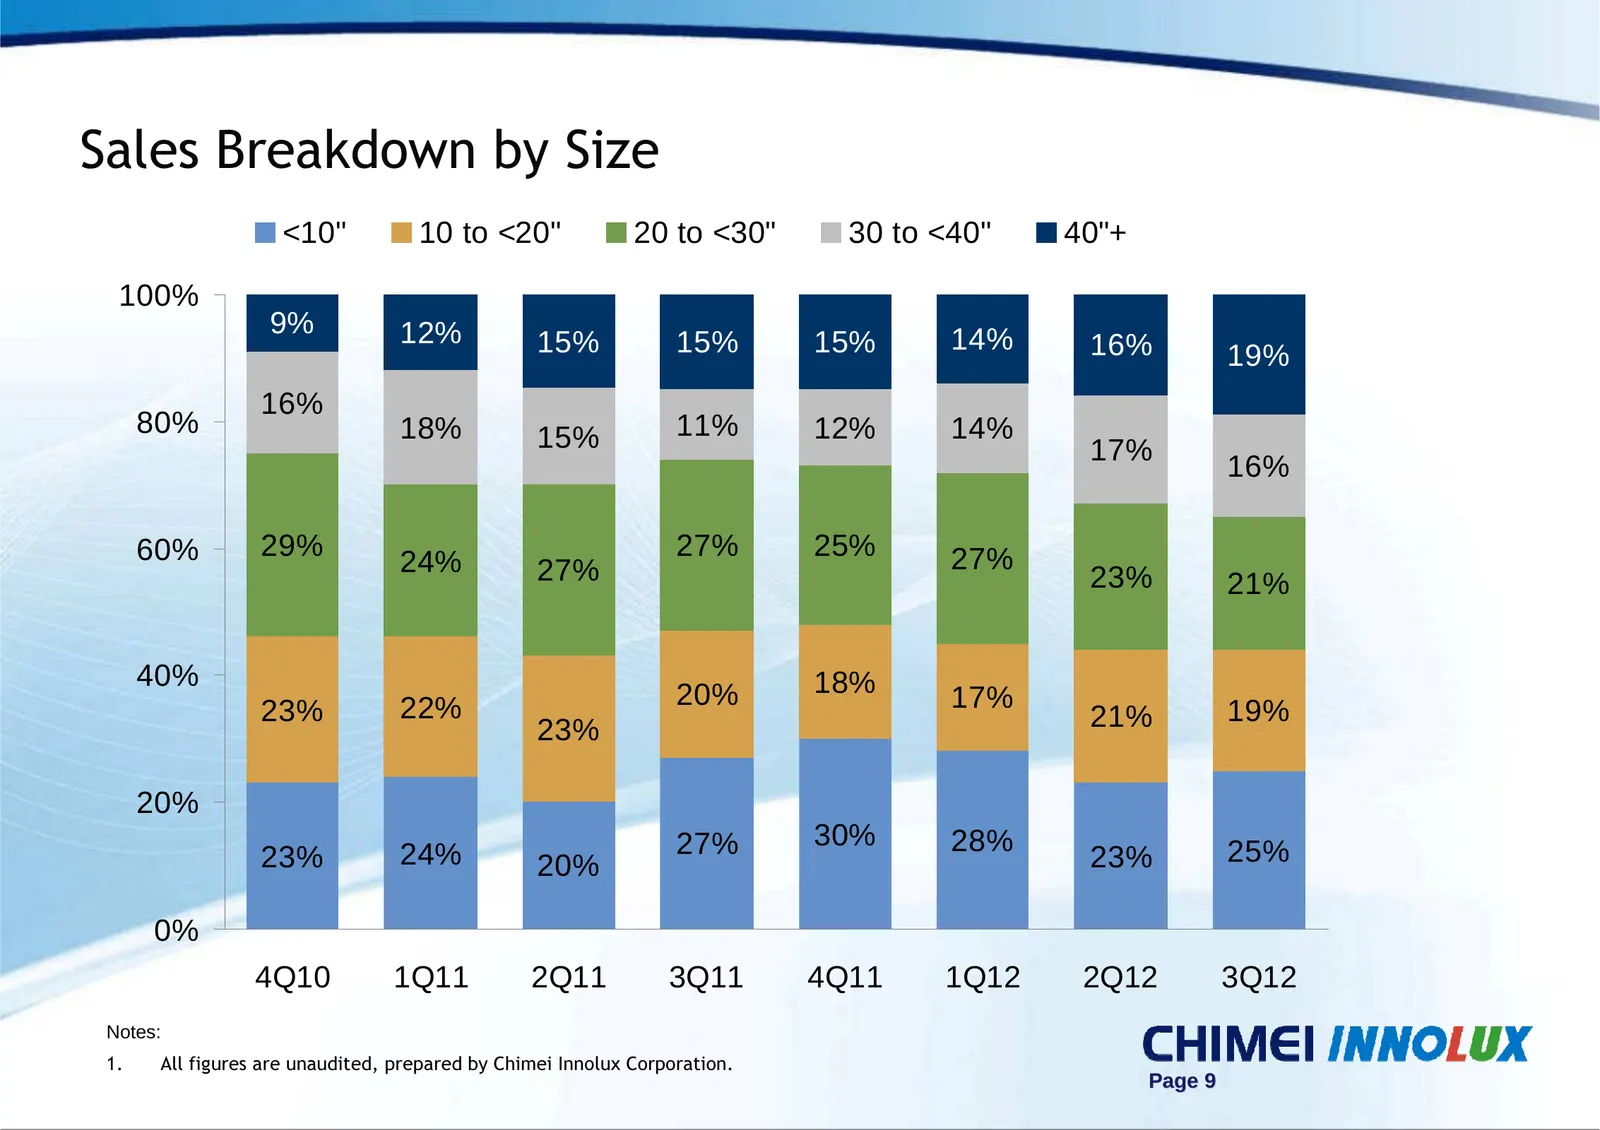
Sales Breakdown by Size <10" 10 to <20" 20 to <30" 30 to <40" 40"+ 100% 9% 12% 15% 15% 15% 14% 16% 19% 16% 80% 18% 15% 11% 12% 14% 17% 16% 60% 29% 27% 25% 27% 24% 27% 23% 21% 40% 18% 22% 20% 17% 23% 21% 19% 23% 20% 27% 30% 28% 23% 24% 20% 23% 25% 0% 4Q10 1Q11 2Q11 3Q11 4Q11 1Q12 2Q12 3Q12 Notes: 1.

Slide 10: For further information, please visit our website
For further information, please visit our website at: www.chimei-innolux.com Contact Investor Relations at: phone: +886 (0)6 505-3760 email:ir@chimei-innolux.com Page 10
Source: Internet Archive copy of innolux.com
More decks from Innolux Corp.
 Investor Presentation (August 2026)18 slides · Aug 18, 2026
 Q4 2024 Earnings Presentation26 slides · Mar 14, 2025
 Q2 2023 Earnings Presentation12 slides · Aug 2, 2023
 FY2021 Earnings Presentation9 slides · Mar 2, 2022
 H2 2021 Earnings Presentation9 slides · Aug 6, 2021
 Q2 2013 Earnings Presentation19 slides · August 2013