Fairmount Santrol Holdings Inc
Fairmount Santrol — Investor Presentation (September 2016)
19 slides from Fairmount Santrol's investor presentation, Sep 19, 2016
Slide 1: Investor Presentation September 2016
Investor Presentation September 2016 Exhibit 99.1
Slide 2: Forward-Looking Statements
Forward-Looking Statements This presentation contains forward-looking statements. These statements can be identified by the use of forward-looking terminology including “will,” “may,” “believe,” “expect,” “anticipate,” “estimate,” “continue,” or other similar words. These statements discuss future e
Slide 3: Two Complementary Business Segments
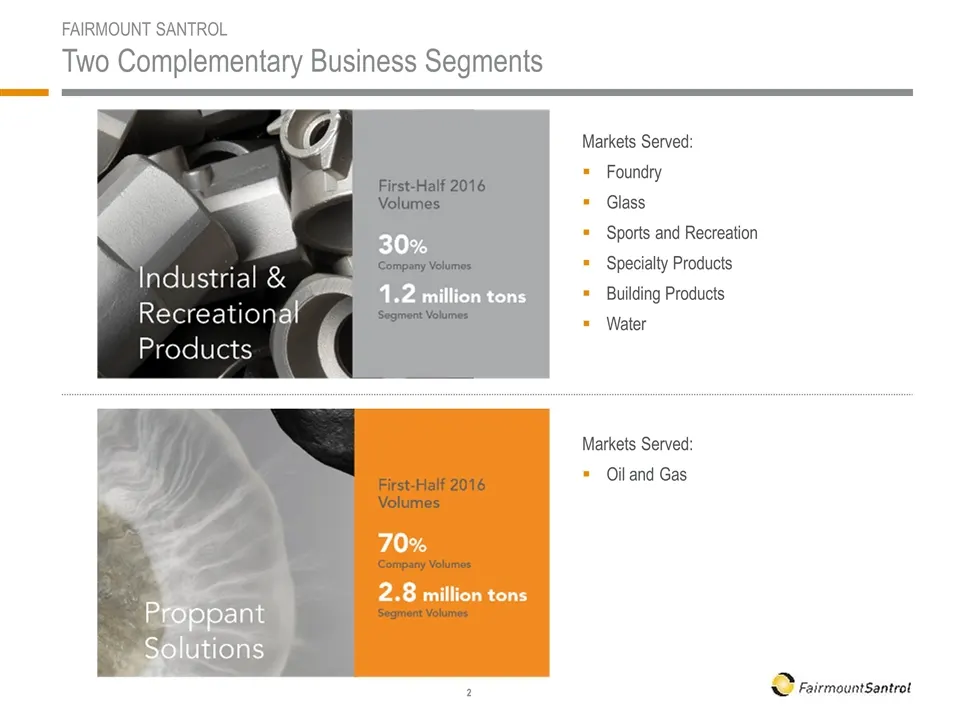
FAIRMOUNT SANTROL Two Complementary Business Segments Markets Served: Foundry Glass Sports and Recreation Specialty Products Building Products Water Markets Served: Oil and Gas
Slide 4: A Leading Solutions Provider Differentiated in Every Area of the Value Chain
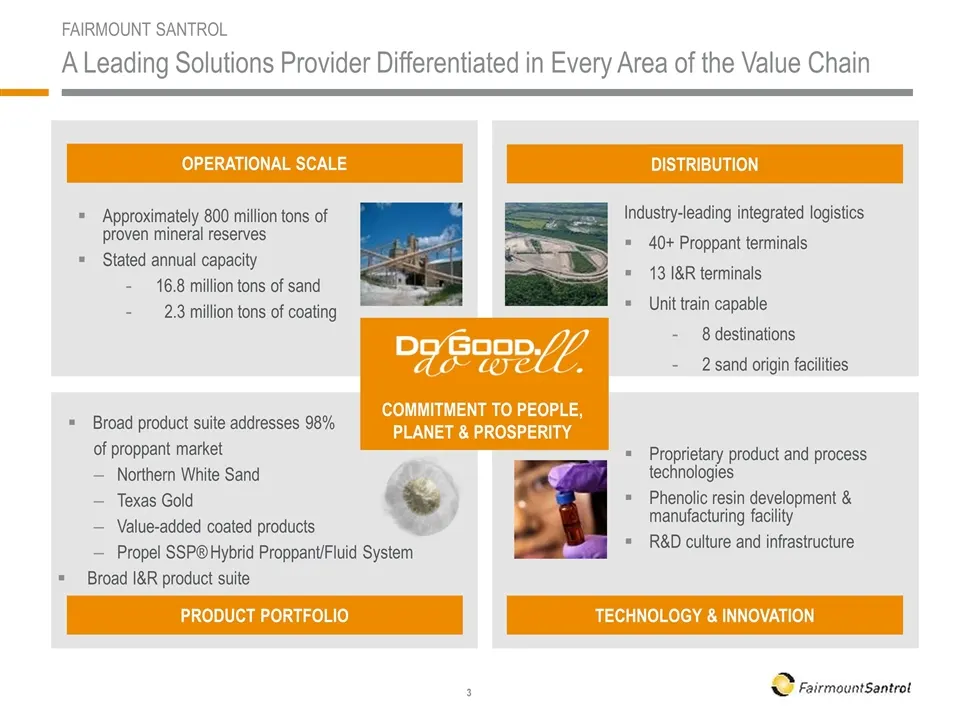
FAIRMOUNT SANTROL A Leading Solutions Provider Differentiated in Every Area of the Value Chain Operational Scale Approximately 800 million tons of proven mineral reserves Stated annual capacity 16.8 million tons of sand 2.3 million tons of coating Distribution Product Portfolio Technology & Innovati
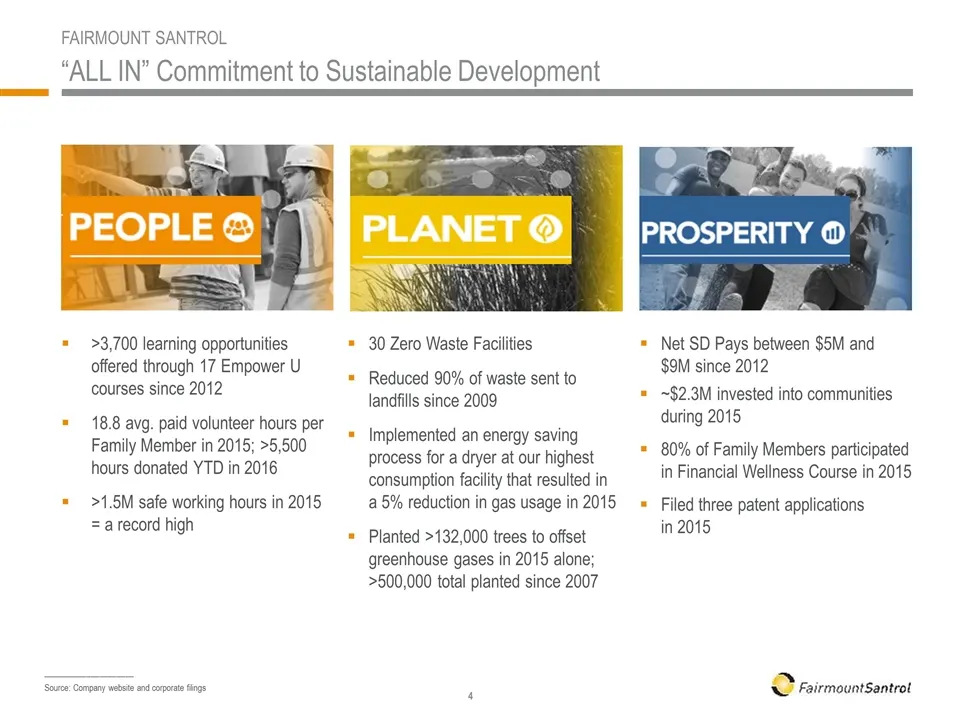
Slide 5: "All In" Commitment to Sustainable Development
“ FAIRMOUNT SANTROL “ALL IN” Commitment to Sustainable Development _____________________ Source: Company website and corporate filings >3,700 learning opportunities offered through 17 Empower U courses since 2012 18.8 avg. paid volunteer hours per Family Member in 2015; >5,500 hours donated YTD in 2
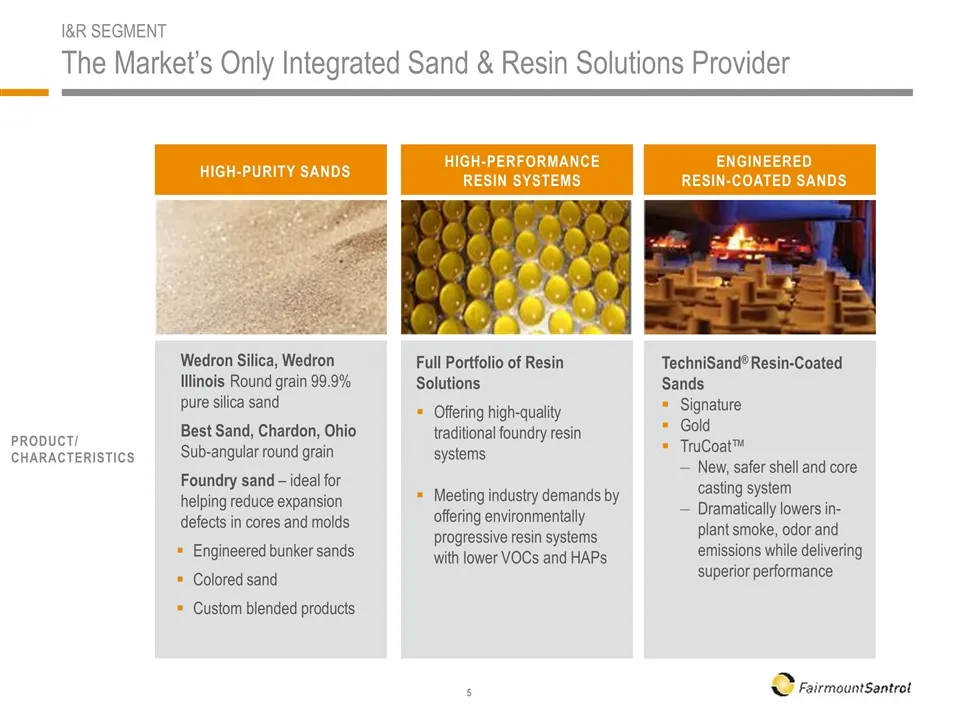
Slide 6: I&R Segment: High-Purity Sands and Engineered Resin-Coated Sands
HIGH-PURITY SANDS ENGINEERED RESIN-COATED SANDS TechniSand® Resin-Coated Sands Signature Gold TruCoat™ New, safer shell and core casting system Dramatically lowers in-plant smoke, odor and emissions while delivering superior performance HIGH-PERFORMANCE RESIN SYSTEMS Full Portfolio of Resin Solution
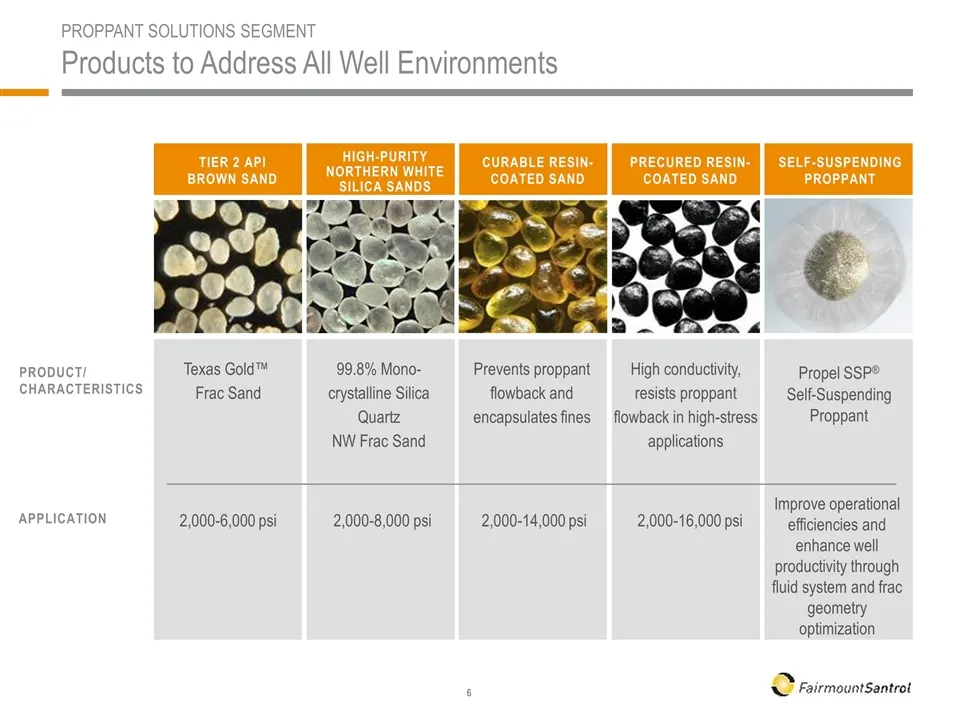
Slide 7: Proppant Solutions Segment: Products to Address All Well Environments
High-Purity Northern White Silica Sands Texas Gold™ Frac Sand Precured Resin-Coated Sand High conductivity, resists proppant flowback in high-stress applications Curable Resin-Coated Sand Prevents proppant flowback and encapsulates fines Self-Suspending Proppant Propel SSP® Self-Suspending Proppant
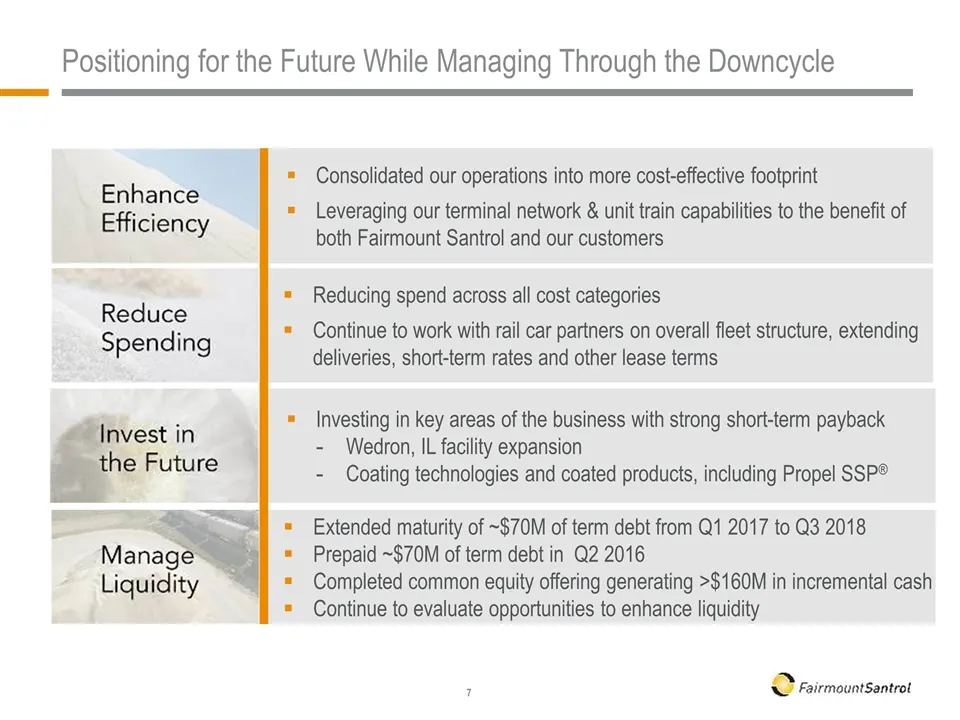
Slide 8: Positioning for the Future While Managing Through the Downcycle
Positioning for the Future While Managing Through the Downcycle Consolidated our operations into more cost-effective footprint Leveraging our terminal network & unit train capabilities to the benefit of both Fairmount Santrol and our customers Reducing spend across all cost categories Continue to wo
Slide 9: Enhance Efficiency: Consolidated Operations Into a More Cost-Effective Footprint
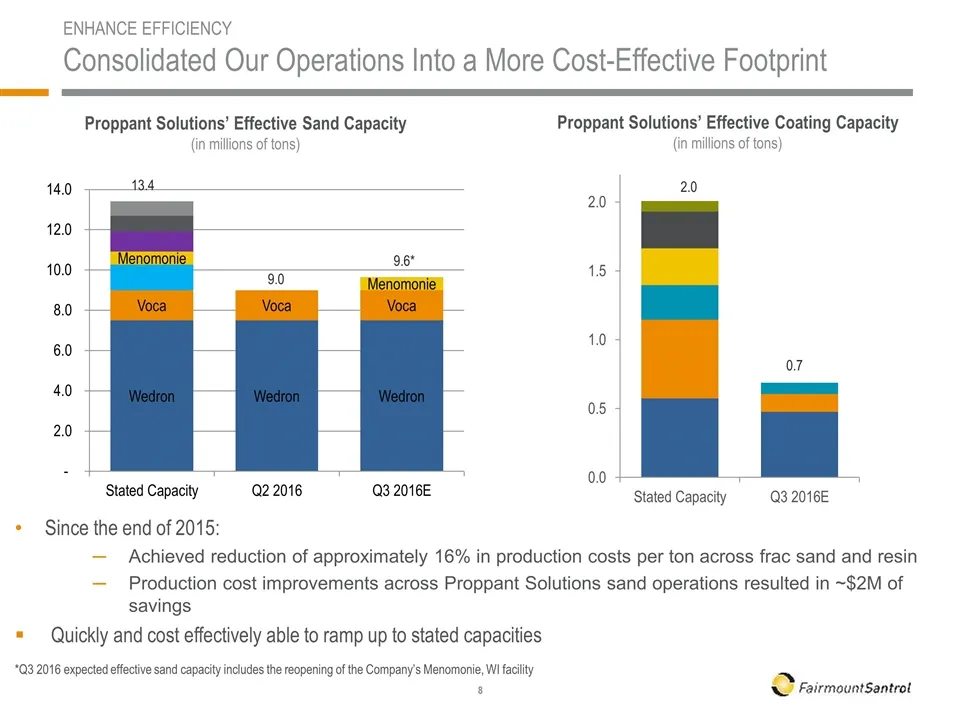
ENHANCE EFFICIENCY Consolidated Our Operations Into a More Cost-Effective Footprint Since the end of 2015: Achieved reduction of approximately 16% in production costs per ton across frac sand and resin Production cost improvements across Proppant Solutions sand operations resulted in ~$2M of savings
Slide 10: Leveraging Our Terminal Network & Unit Train Capabilities
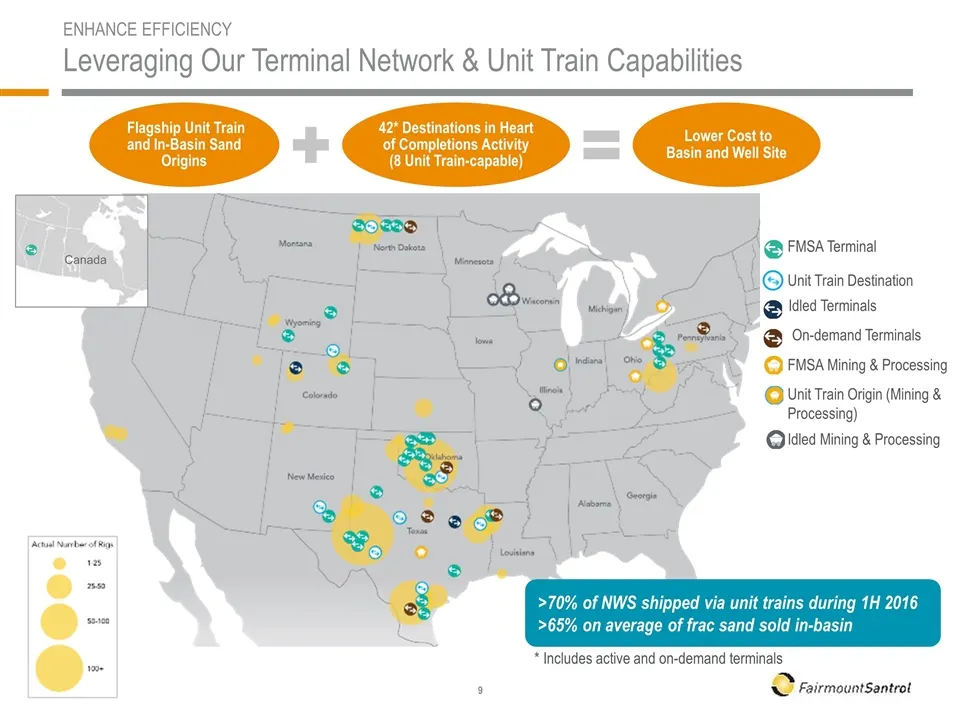
FMSA Terminal FMSA Mining & Processing Unit Train Destination Unit Train Origin (Mining & Processing) ENHANCE EFFICIENCY Leveraging Our Terminal Network & Unit Train Capabilities >70% of NWS shipped via unit trains during 1H 2016 >65% on average of frac sand sold in-basin Idled Terminals Idled Minin
Slide 11: Reduce Spending: Significant Reductions Across All Categories
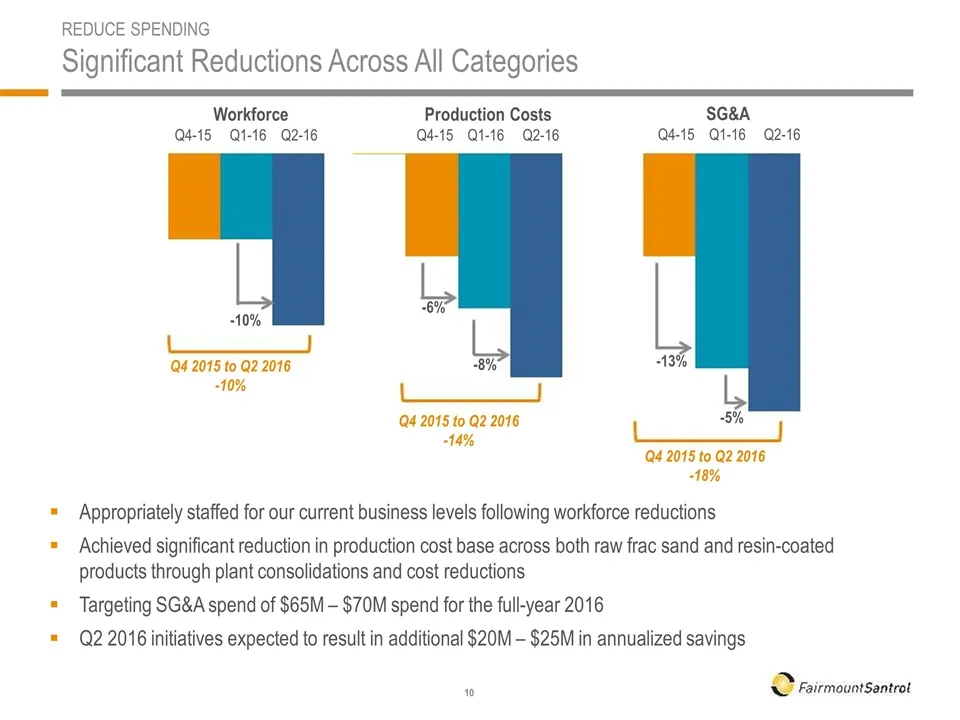
REDUCE SPENDING Significant Reductions Across All Categories Appropriately staffed for our current business levels following workforce reductions Achieved significant reduction in production cost base across both raw frac sand and resin-coated products through plant consolidations and cost reduction
Slide 12: Reduce Spending: Progress in Rail Car Fleet Overhang
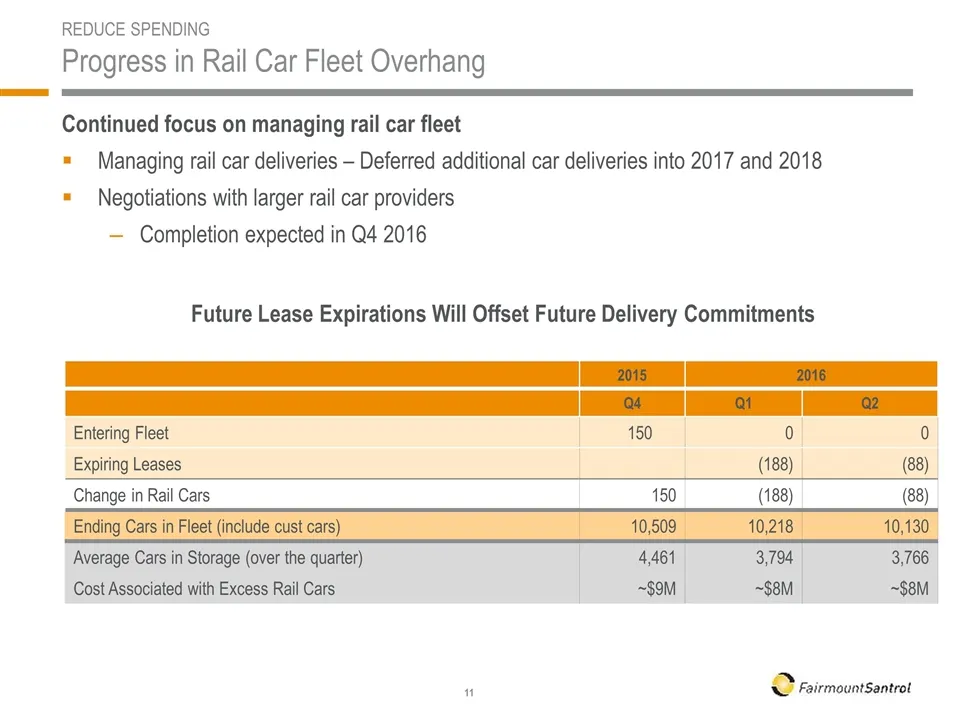
REDUCE SPENDING Progress in Rail Car Fleet Overhang Continued focus on managing rail car fleet Managing rail car deliveries – Deferred additional car deliveries into 2017 and 2018 Negotiations with larger rail car providers Completion expected in Q4 2016 Future Lease Expirations Will Offset Future D
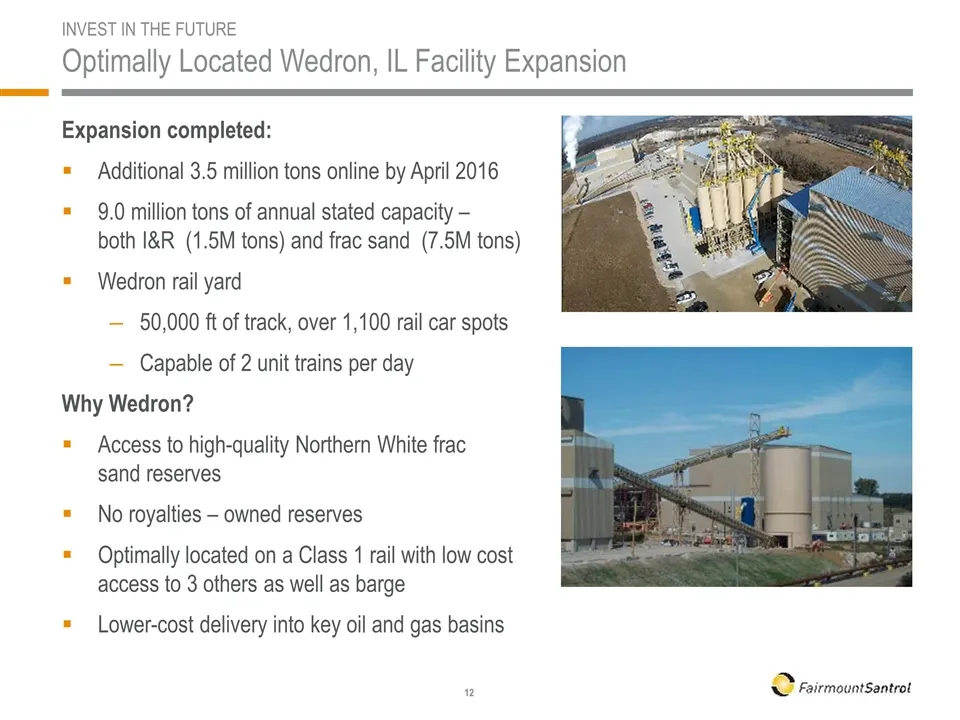
Slide 13: Optimally Located Wedron, IL Facility Expansion
INVEST IN THE FUTURE Optimally Located Wedron, IL Facility Expansion Expansion completed: Additional 3.5 million tons online by April 2016 9.0 million tons of annual stated capacity – both I&R (1.5M tons) and frac sand (7.5M tons) Wedron rail yard 50,000 ft of track, over 1,100 rail car spots Capabl
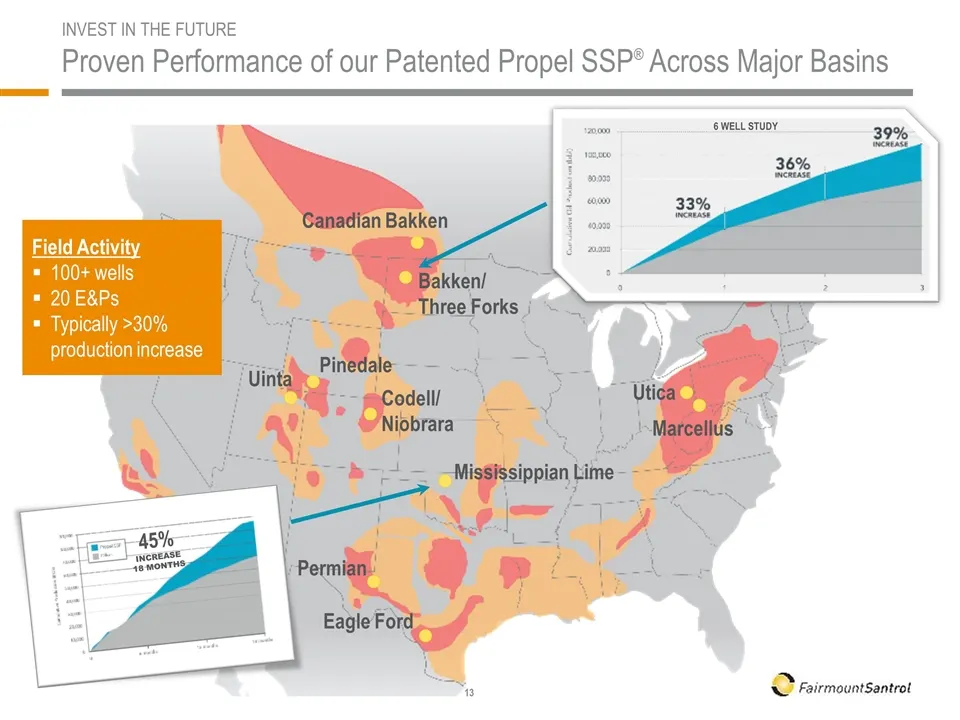
Slide 14: Proven Performance of Patented Propel SSP Across Major Basins
INVEST IN THE FUTURE Proven Performance of our Patented Propel SSP® Across Major Basins Bakken/ Three Forks Canadian Bakken Codell/ Niobrara Mississippian Lime Utica Marcellus Eagle Ford Uinta Permian 45% INCREASE 18 MONTHS 6 WELL STUDY Pinedale Field Activity 100+ wells 20 E&Ps Typically >30% produ
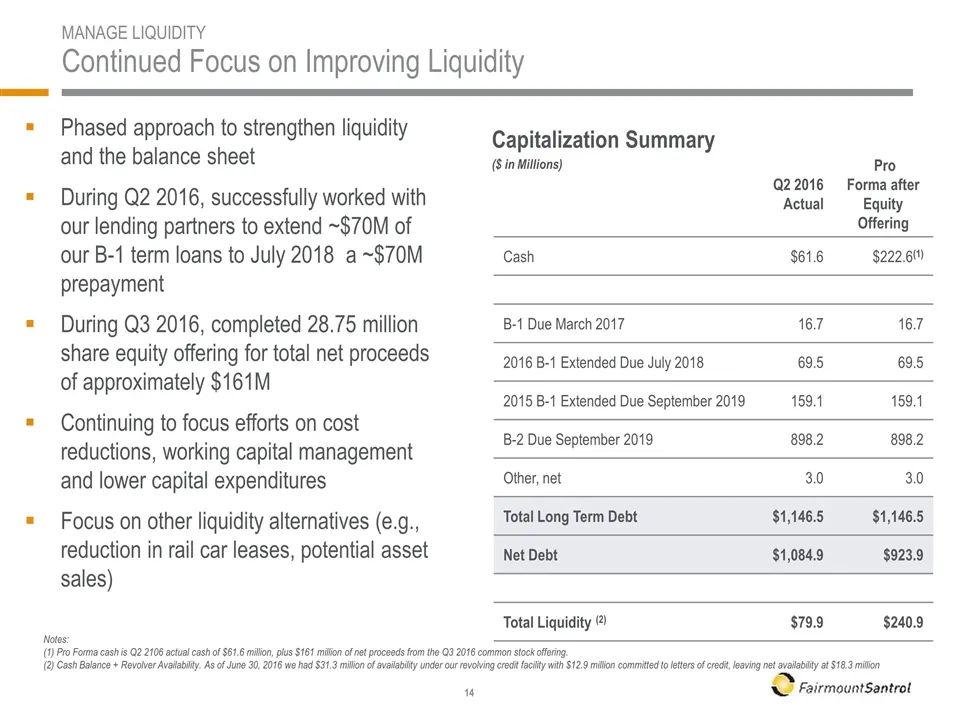
Slide 15: Continued Focus on Improving Liquidity
MANAGE LIQUIDITY Continued Focus on Improving Liquidity Q2 2016 Actual Pro Forma after Equity Offering Cash $61.6 $222.6(1) B-1 Due March 2017 16.7 16.7 2016 B-1 Extended Due July 2018 69.5 69.5 2015 B-1 Extended Due September 2019 159.1 159.1 B-2 Due September 2019 898.2 898.2 Other, net 3.0 3.0 To
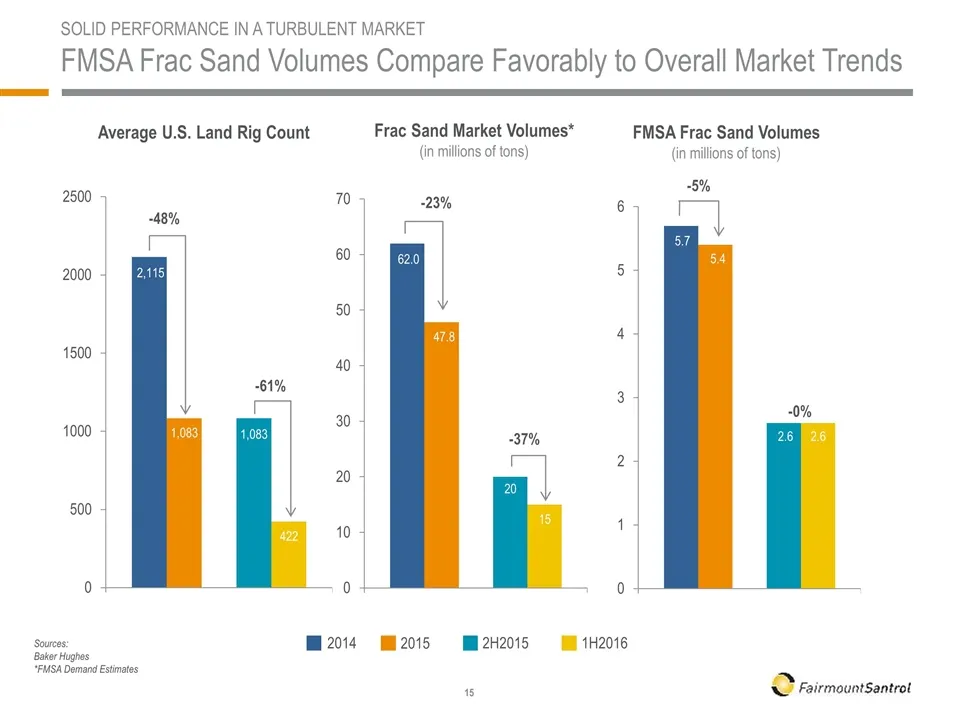
Slide 16: FMSA Frac Sand Volumes Compare Favorably to Overall Market Trends
SOLID PERFORMANCE IN A TURBULENT MARKET FMSA Frac Sand Volumes Compare Favorably to Overall Market Trends -48% Sources: Baker Hughes *FMSA Demand Estimates FMSA Frac Sand Volumes (in millions of tons) Average U.S. Land Rig Count Frac Sand Market Volumes* (in millions of tons) -23% -5% -61% -37% 1H20
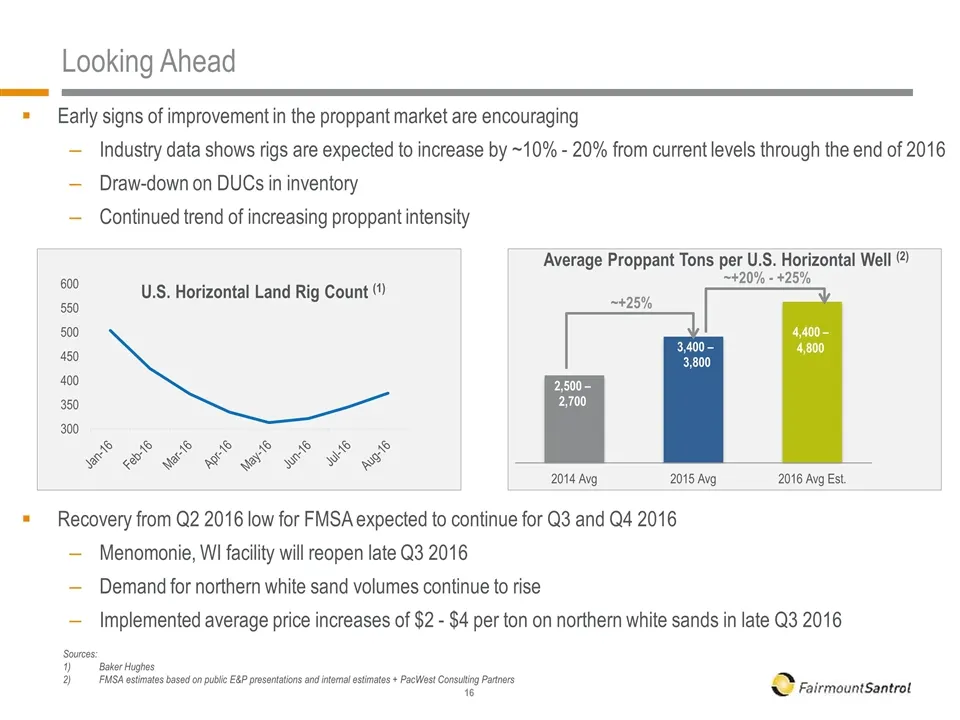
Slide 17: Early signs of improvement in the proppant market are encouraging
Early signs of improvement in the proppant market are encouraging Industry data shows rigs are expected to increase by ~10% - 20% from current levels through the end of 2016 Draw-down on DUCs in inventory Continued trend of increasing proppant intensity Recovery from Q2 2016 low for FMSA expected to
Slide 18: Why Invest in FMSA?
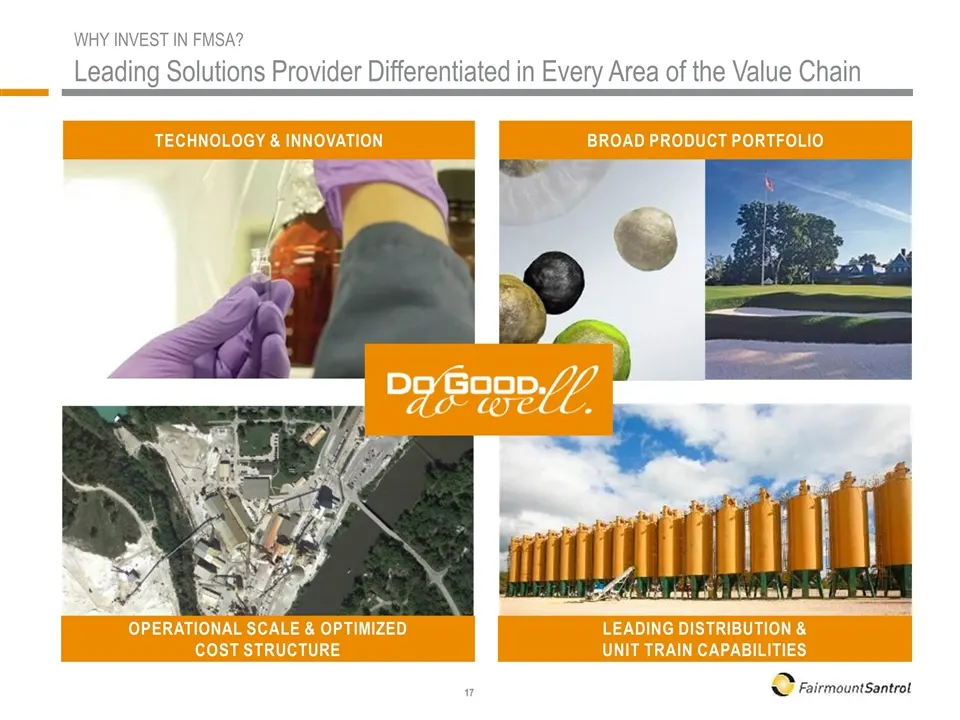
WHY INVEST IN FMSA? Leading Solutions Provider Differentiated in Every Area of the Value Chain Operational Scale & Optimized Cost Structure Leading Distribution & Unit Train Capabilities Broad Product Portfolio Technology & Innovation
Slide 19: Questions?
Questions? Dosa 8 FairmountSantrol
Source: SEC EDGAR · 8-K filed Sep 19, 2016
More decks from Fairmount Santrol Holdings Inc
 Merger or Acquisition (May 2018)44 slides · May 15, 2018
 Merger or Acquisition (May 2018)44 slides · May 9, 2018
 Debt Investor Presentation (May 2018)62 slides · May 8, 2018
 Merger or Acquisition (March 2018)31 slides · Mar 26, 2018
 Merger or Acquisition (January 2018)42 slides · Jan 3, 2018
 Merger or Acquisition (December 2017)26 slides · Dec 12, 2017