Transformers and Rectifiers (India) Limited · NSE:TARIL
Transformers and Rectifiers (India) — Q4 FY2009 Earnings Presentation
20 slides from Transformers and Rectifiers (India)'s earnings presentation, April 2009
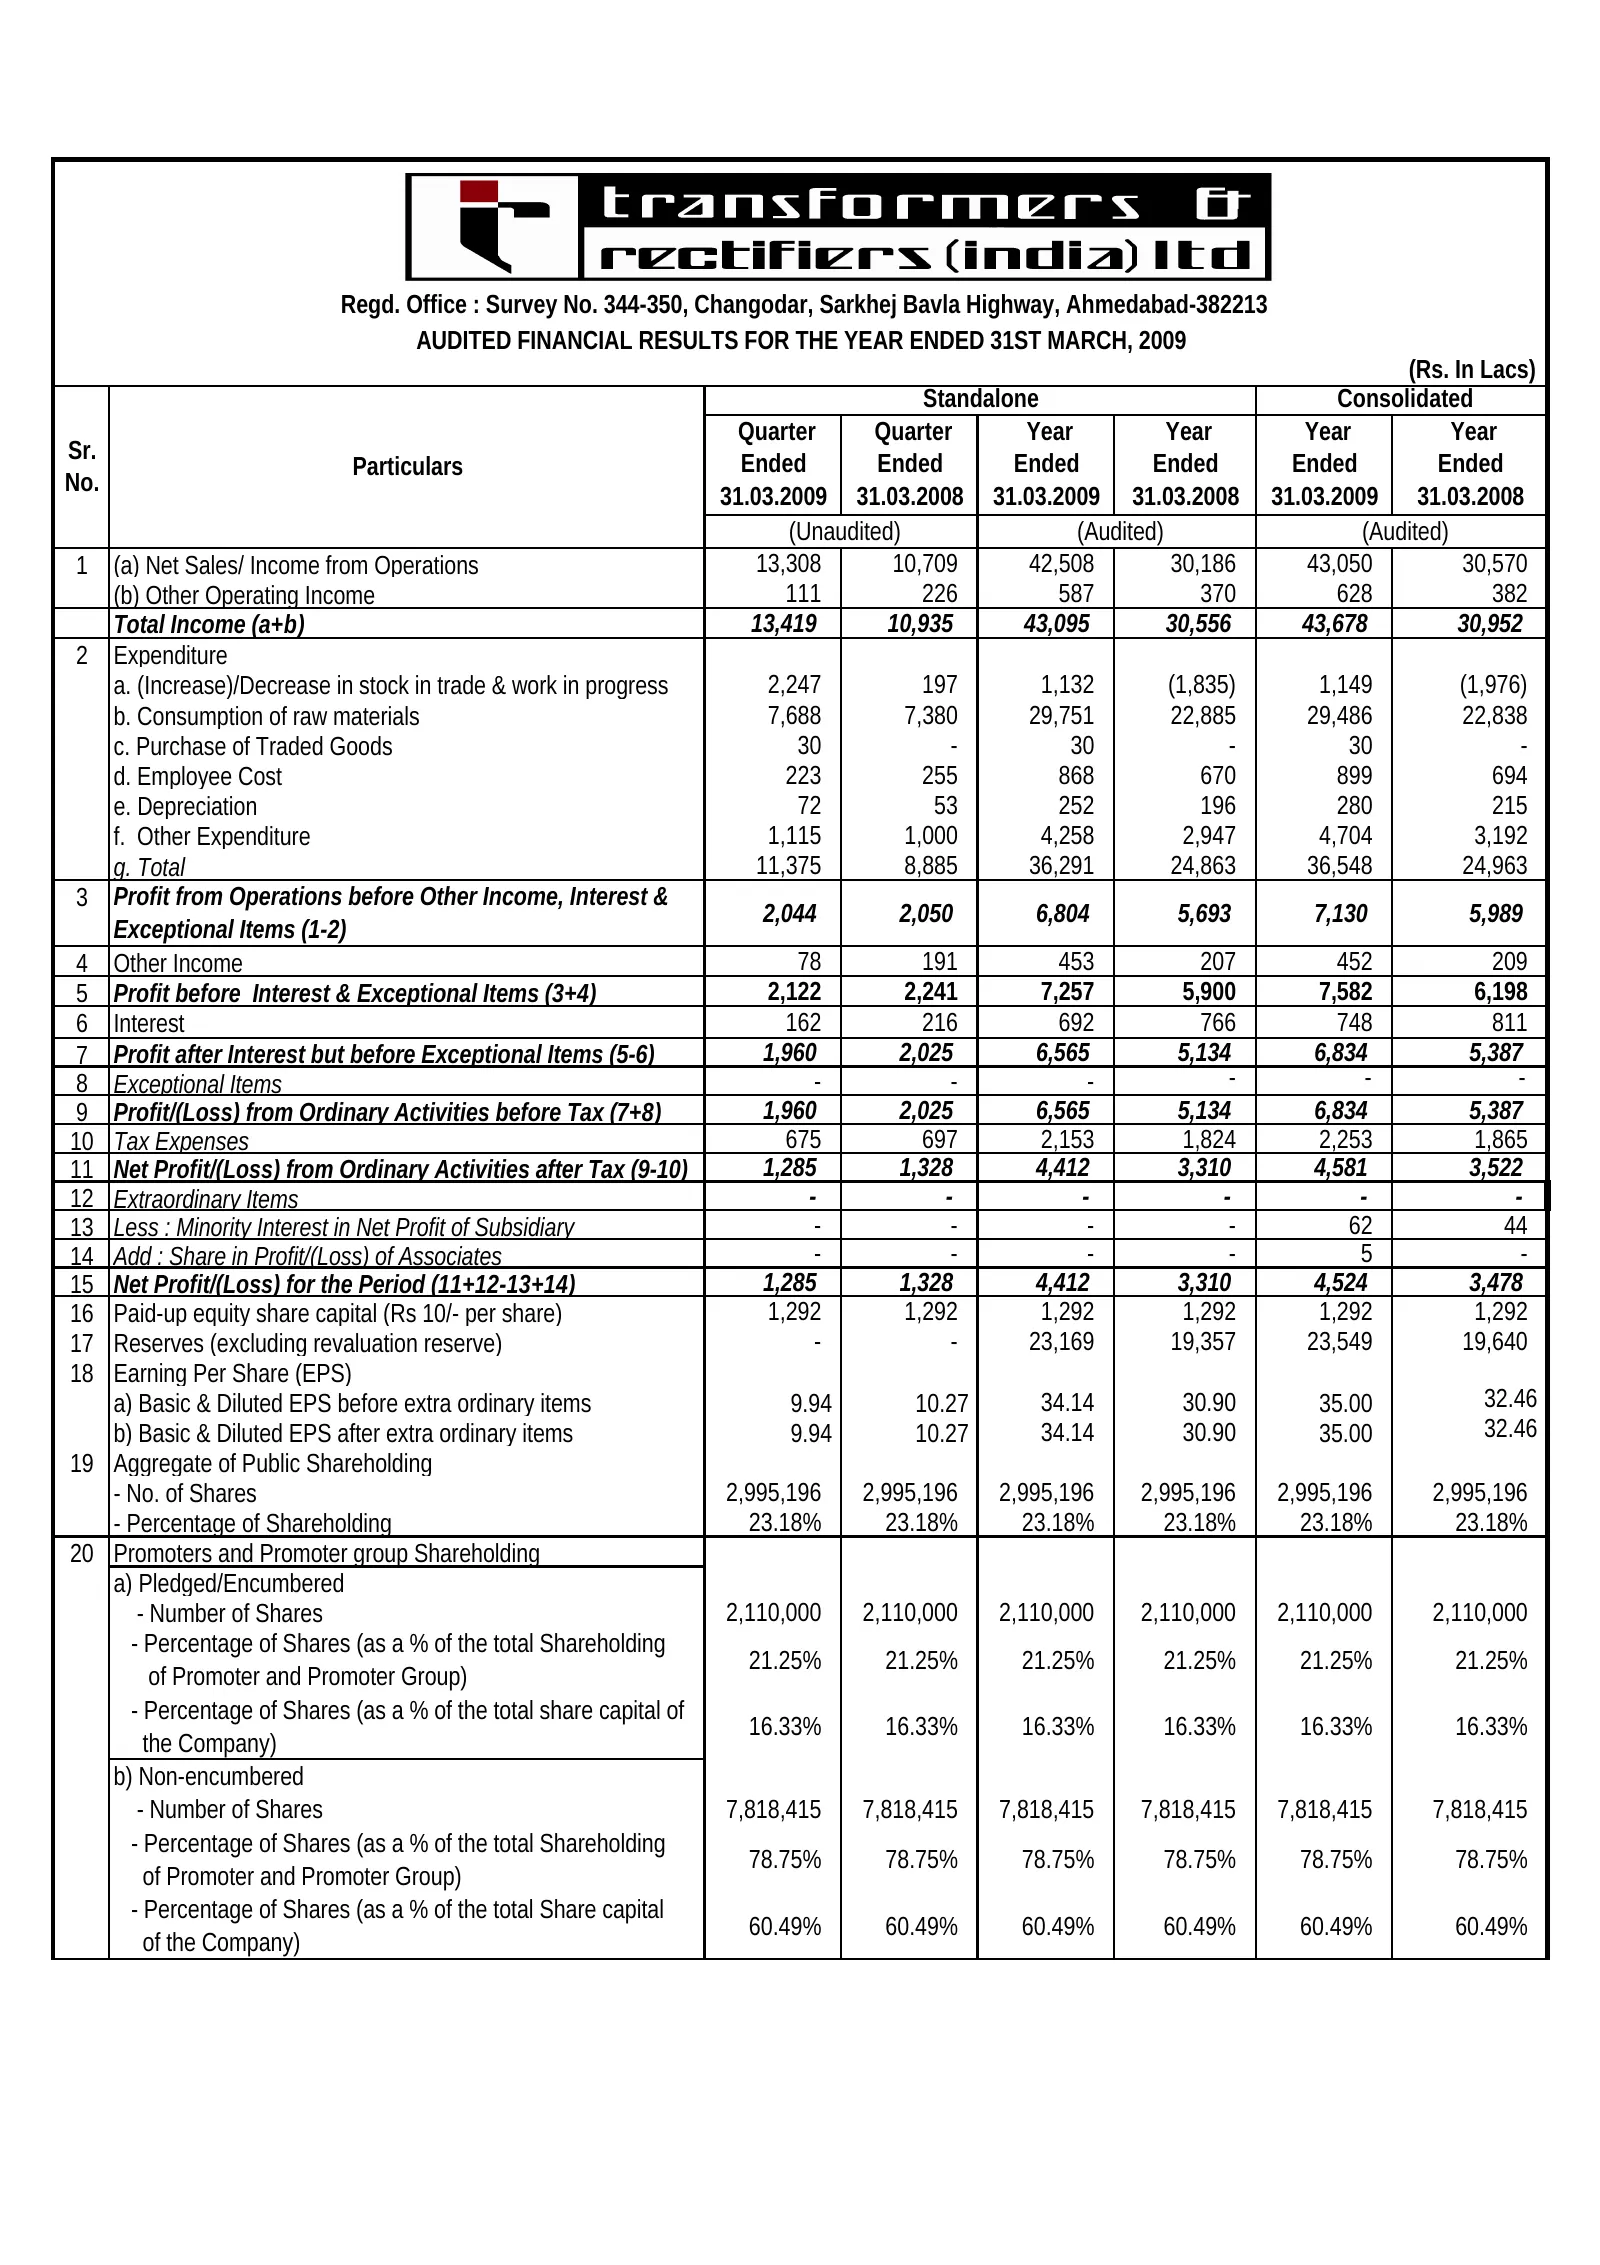
Slide 1: Audited Financial Results for the Year Ended 31st March 2009
Regd. Office : Survey No. 344-350, Changodar, Sarkhej Bavla Highway, Ahmedabad-382213 AUDITED FINANCIAL RESULTS FOR THE YEAR ENDED 31ST MARCH, 2009 (Rs. In Lacs) Standalone Consolidated Quarter Quarter Year Year Year Year Sr. Particulars Ended Ended Ended Ended Ended Ended No. 31.03.2009 31.03.2008
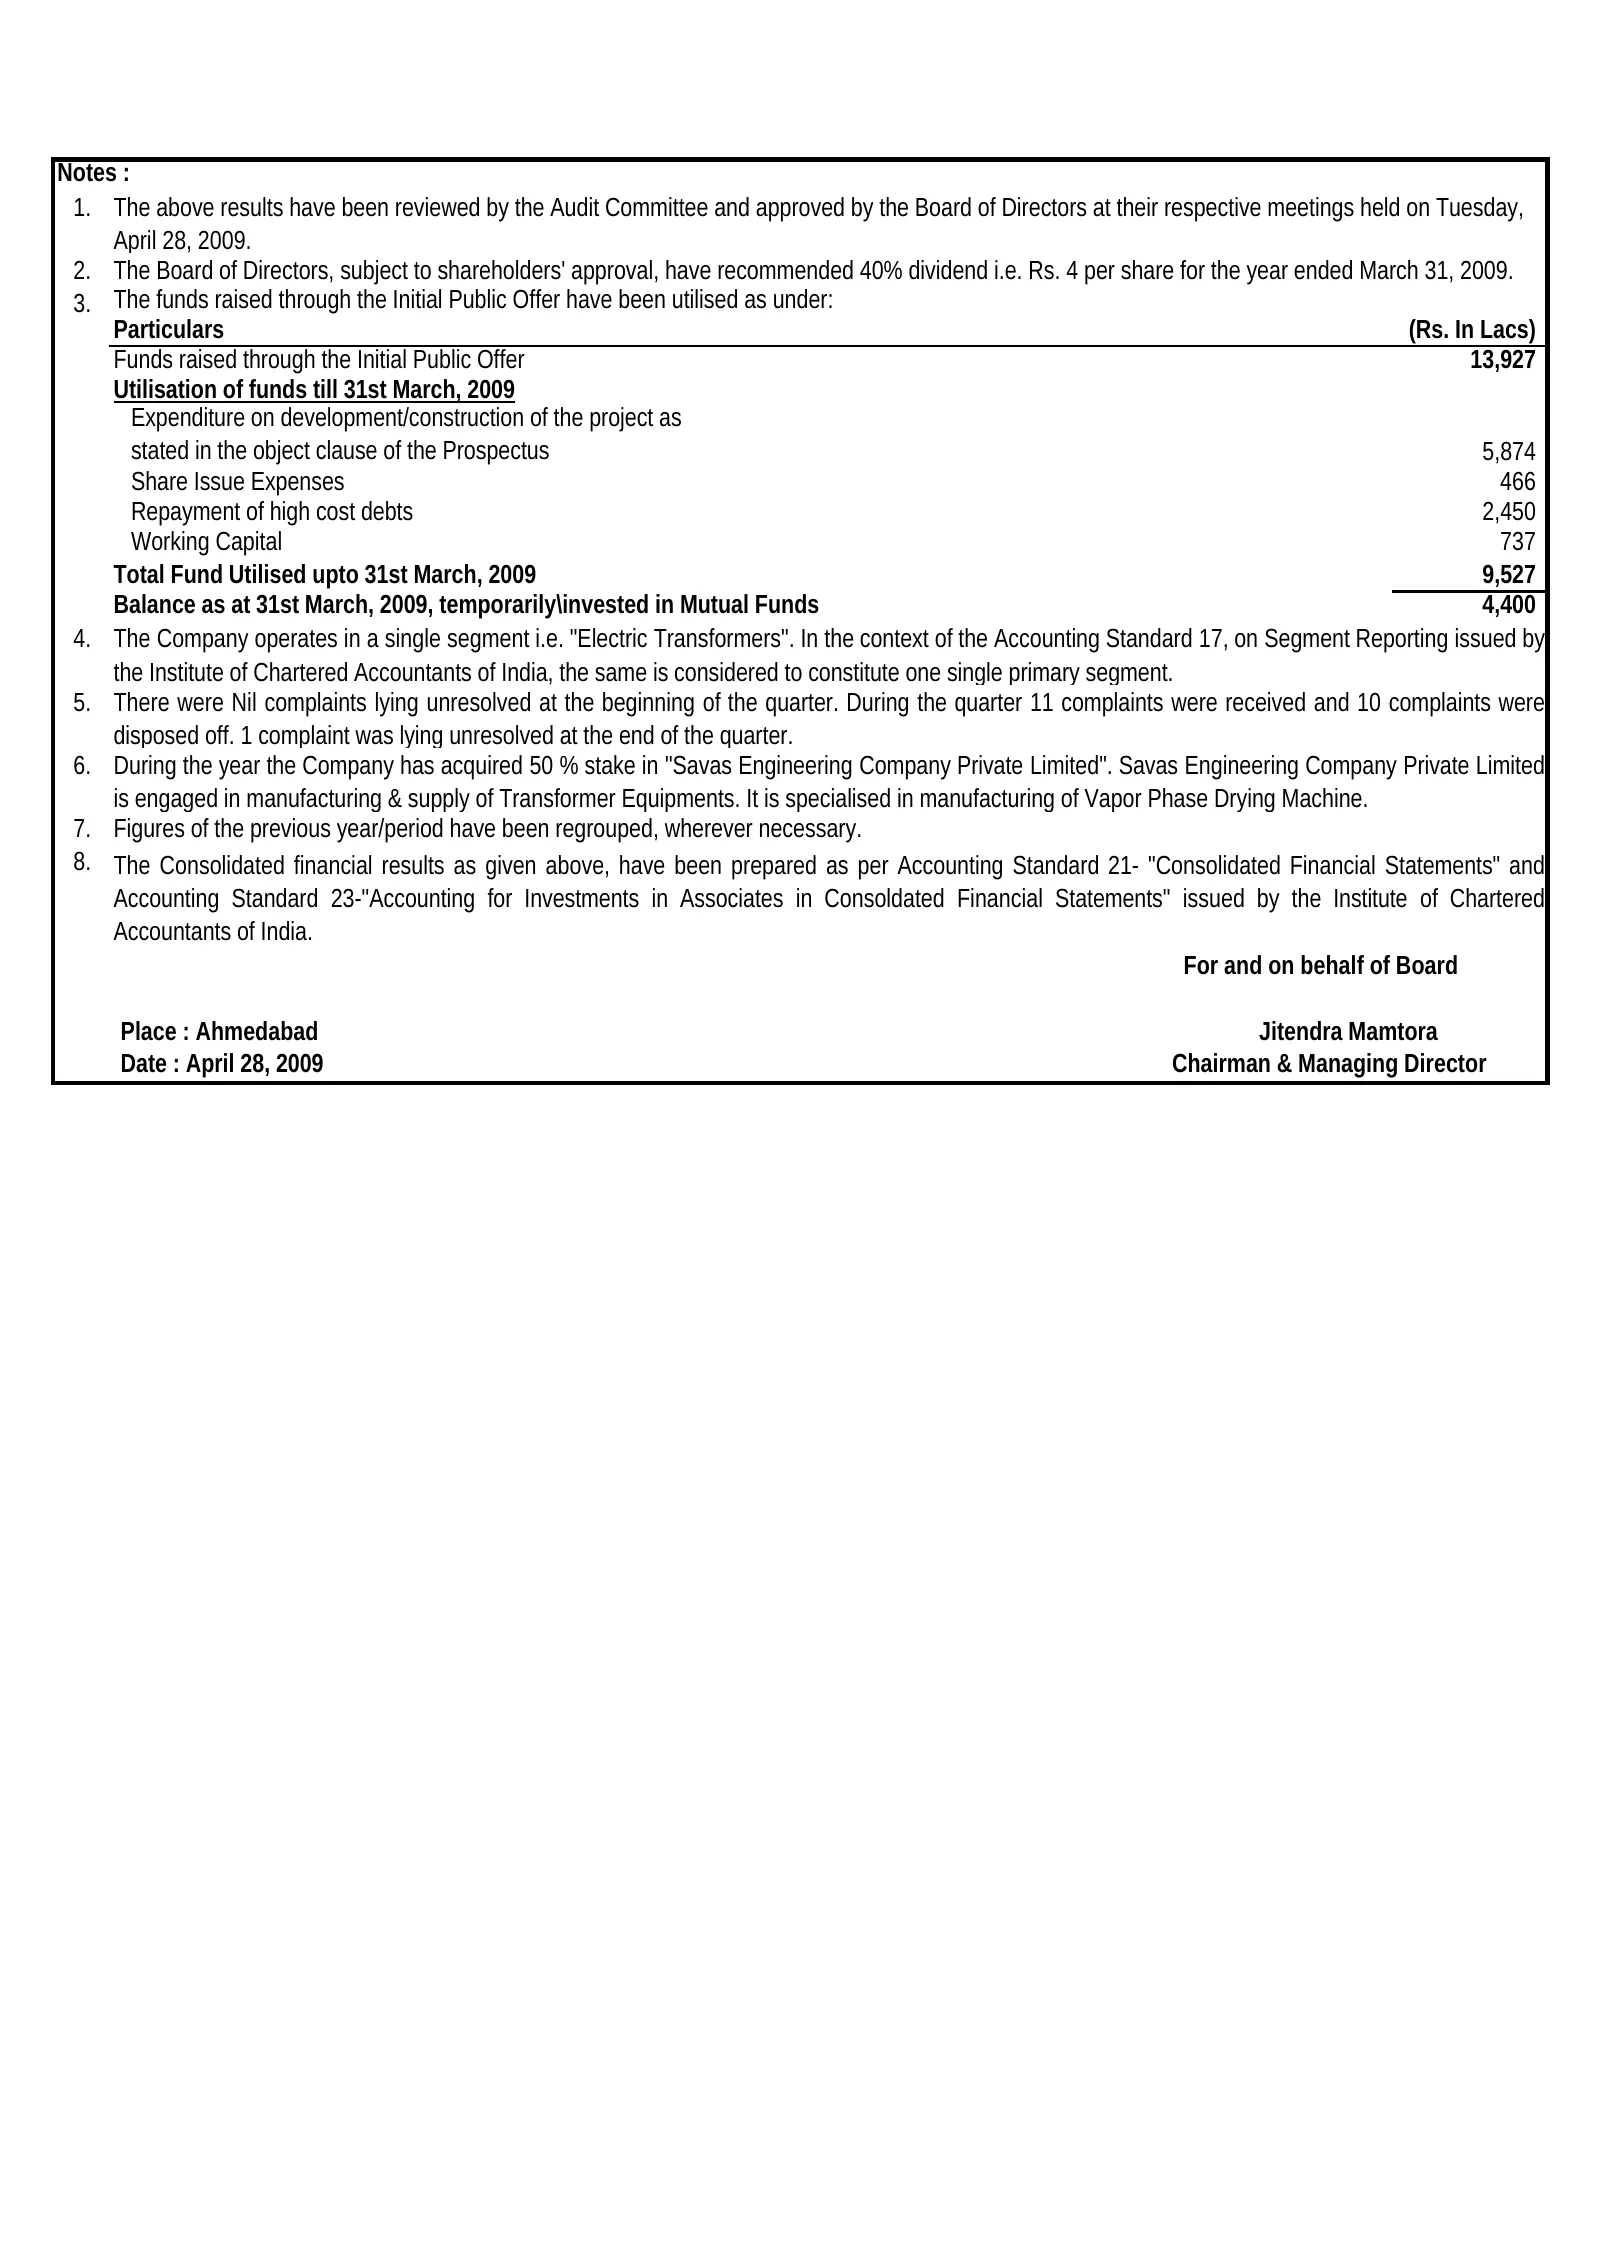
Slide 2: Notes to the results
Notes : 1. The above results have been reviewed by the Audit Committee and approved by the Board of Directors at their respective meetings held on Tuesday, April 28, 2009. 2. The Board of Directors, subject to shareholders' approval, have recommended 40% dividend i.e. Rs. 4 per share for the year en
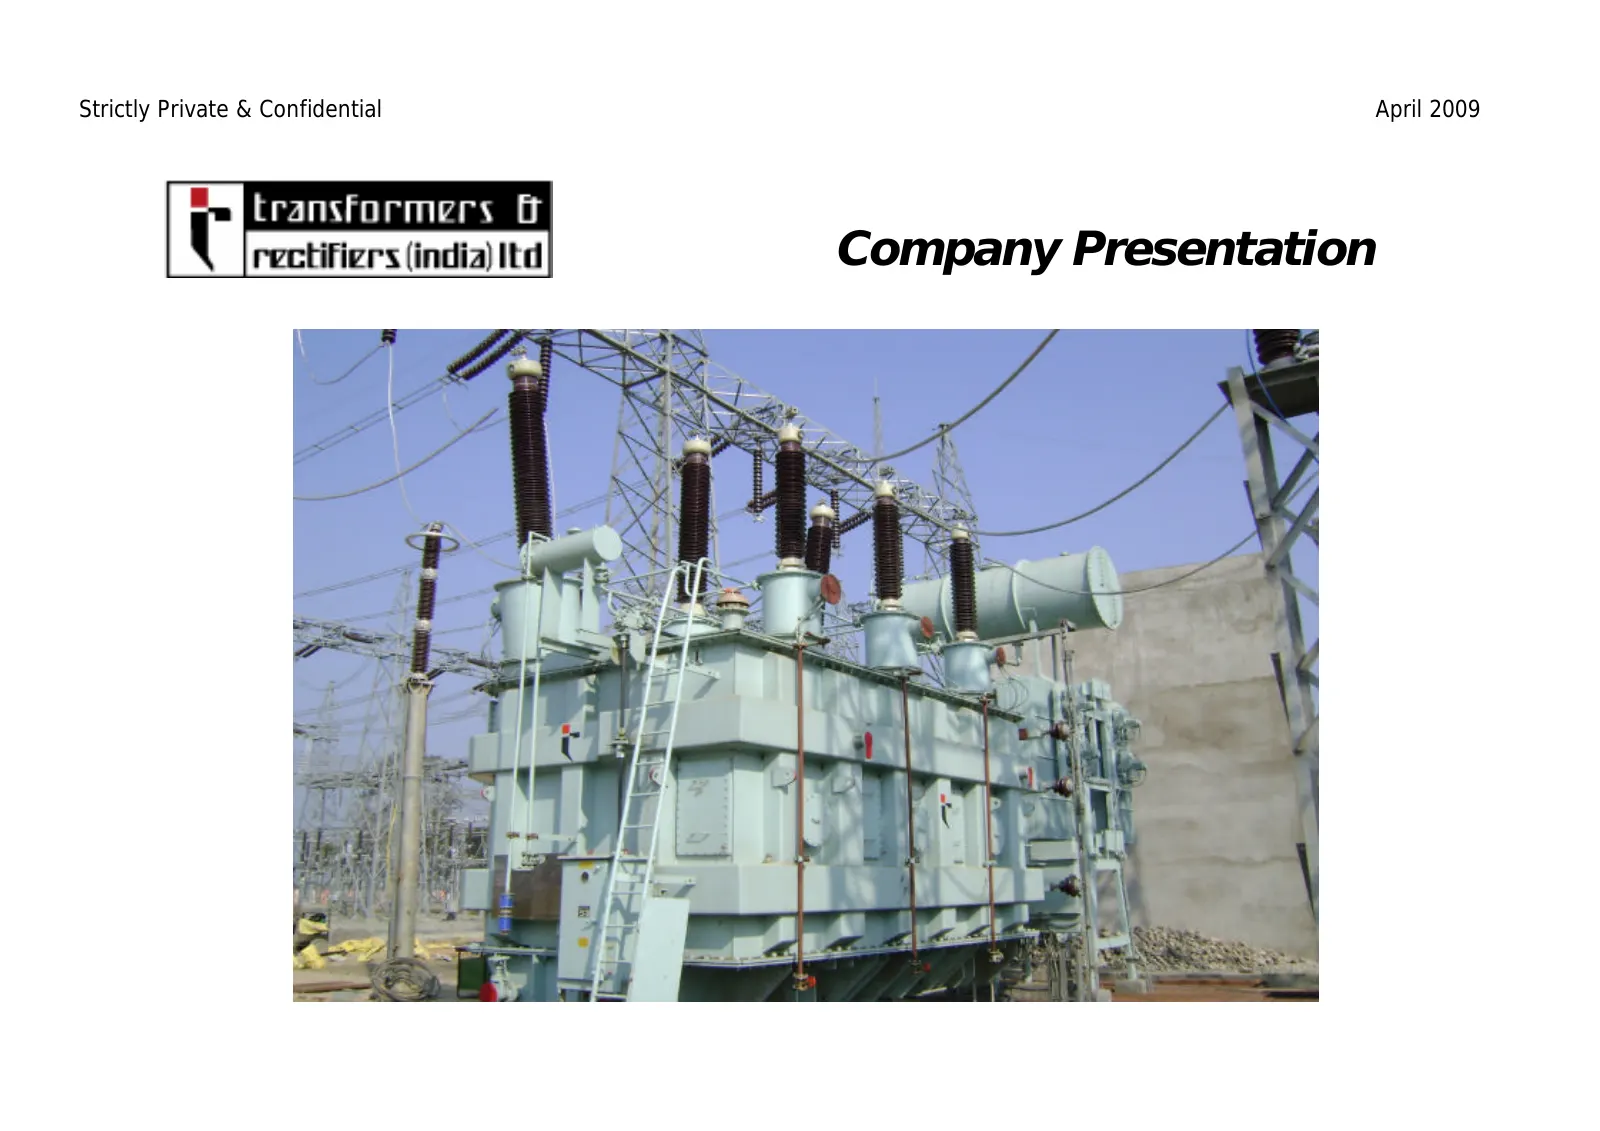
Slide 3: Company Presentation
Strictly Private & Confidential April 2009 Company Presentation
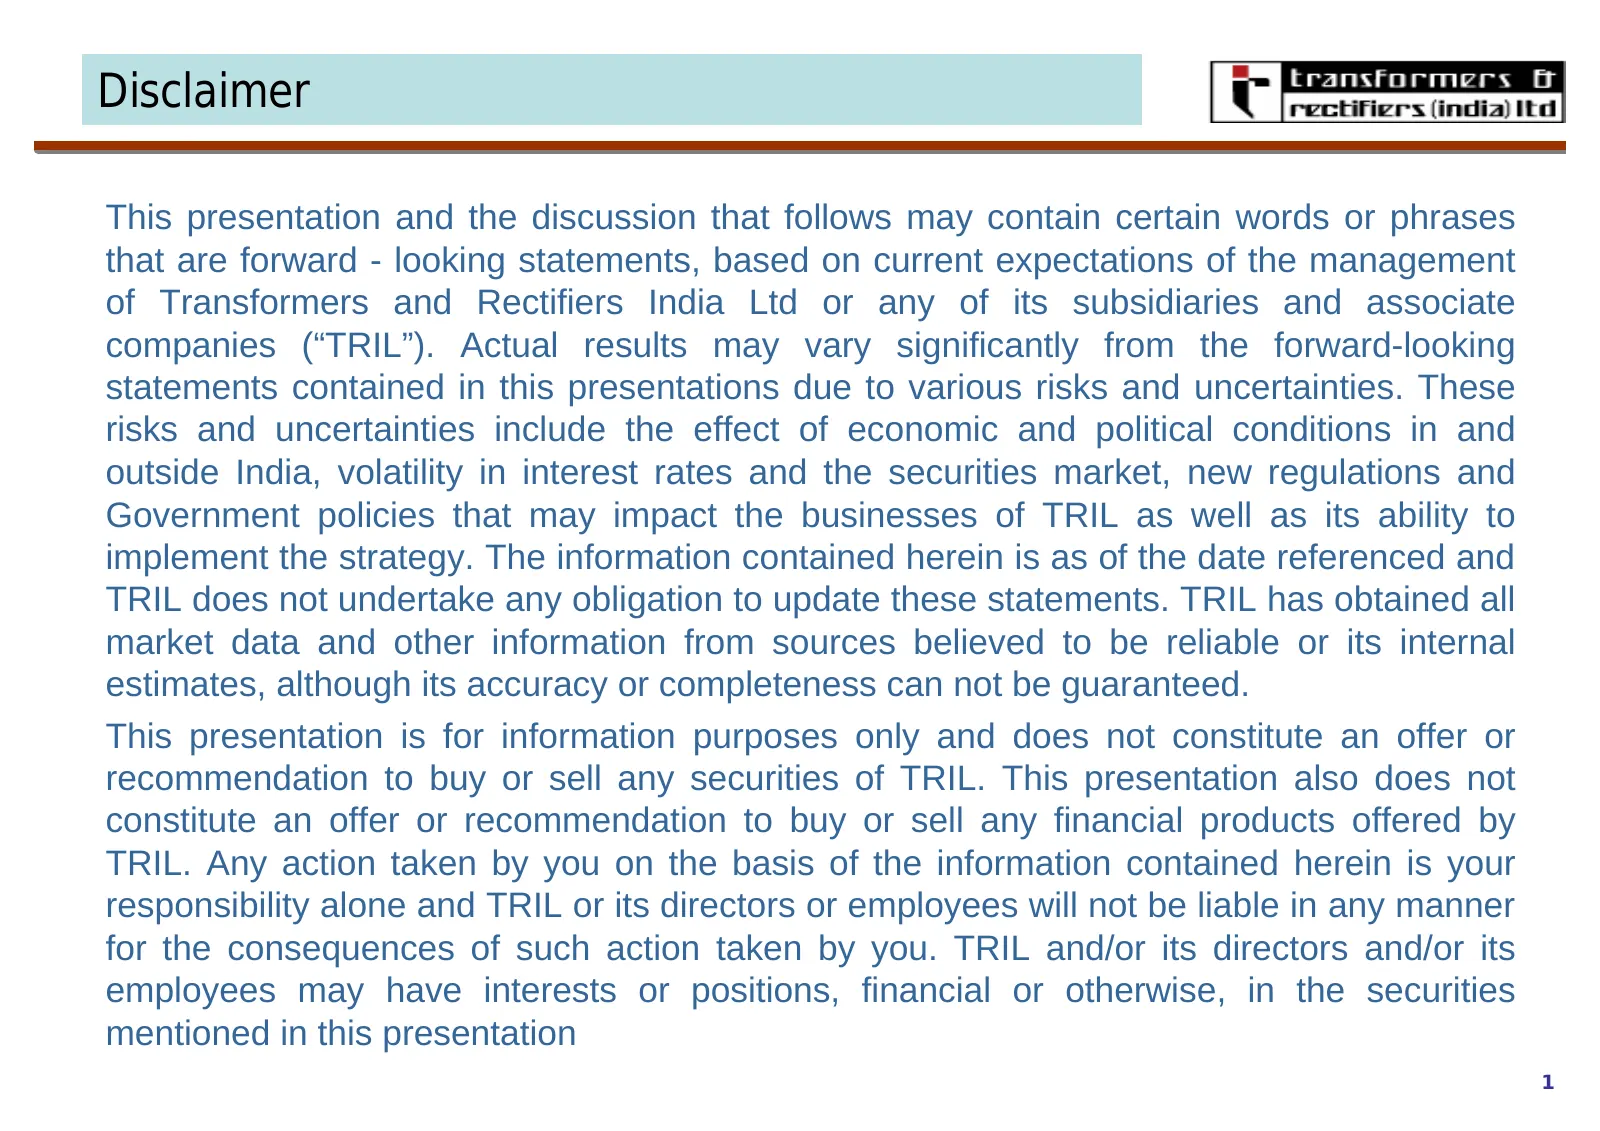
Slide 4: Disclaimer
Disclaimer This presentation and the discussion that follows may contain certain words or phrases that are forward - looking statements, based on current expectations of the management of Transformers and Rectifiers India Ltd or any of its subsidiaries and associate companies (“TRIL”). Actual result
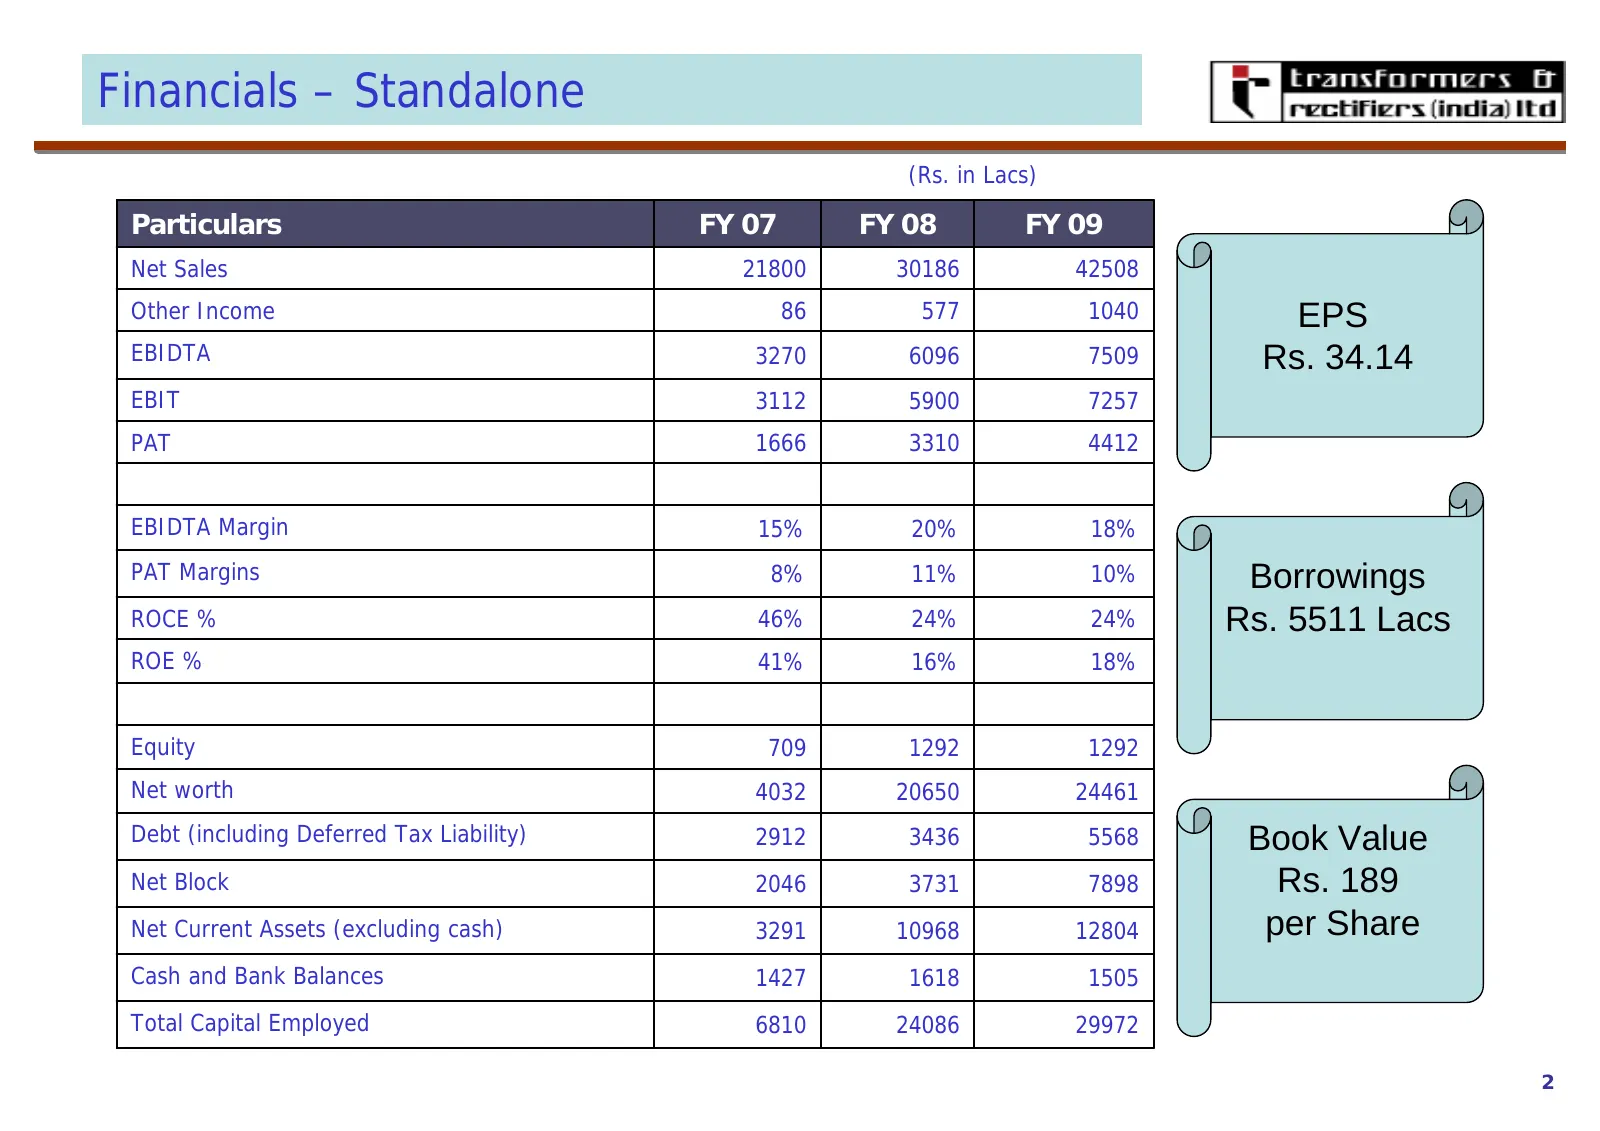
Slide 5: Financials – Standalone
Financials – Standalone (Rs. in Lacs) Particulars FY 07 FY 08 FY 09 Net Sales 21800 30186 42508 Other Income 86 577 1040 EPS EBIDTA 3270 6096 7509 Rs. 34.14 EBIT 3112 5900 7257 PAT 1666 3310 4412 EBIDTA Margin 15% 20% 18% PAT Margins 8% 11% 10% Borrowings ROCE % 46% 24% 24% Rs. 5511 Lacs ROE % 41% 1
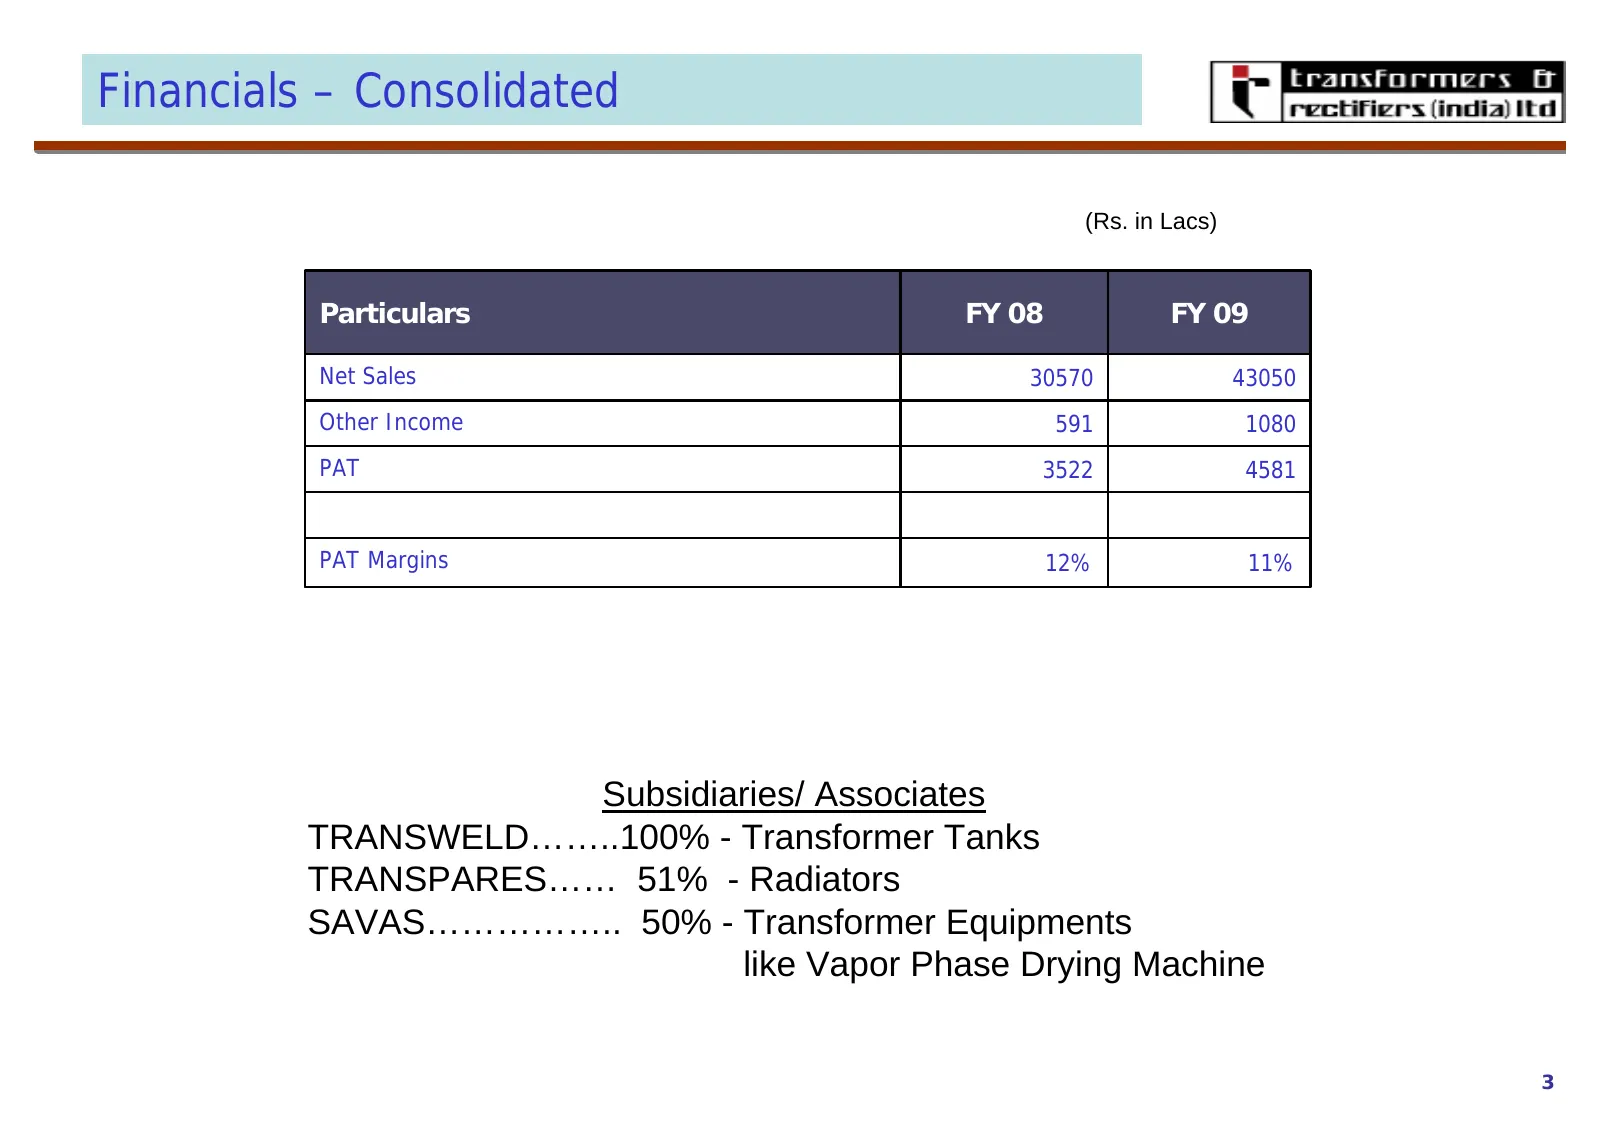
Slide 6: Financials – Consolidated
Financials – Consolidated (Rs. in Lacs) Particulars FY 08 FY 09 Net Sales 30570 43050 Other Income 591 1080 PAT 3522 4581 PAT Margins 12% 11% Subsidiaries/ Associates TRANSWELD……..100% - Transformer Tanks TRANSPARES…… 51% - Radiators SAVAS…………….. 50% - Transformer Equipments like Vapor Phase Drying
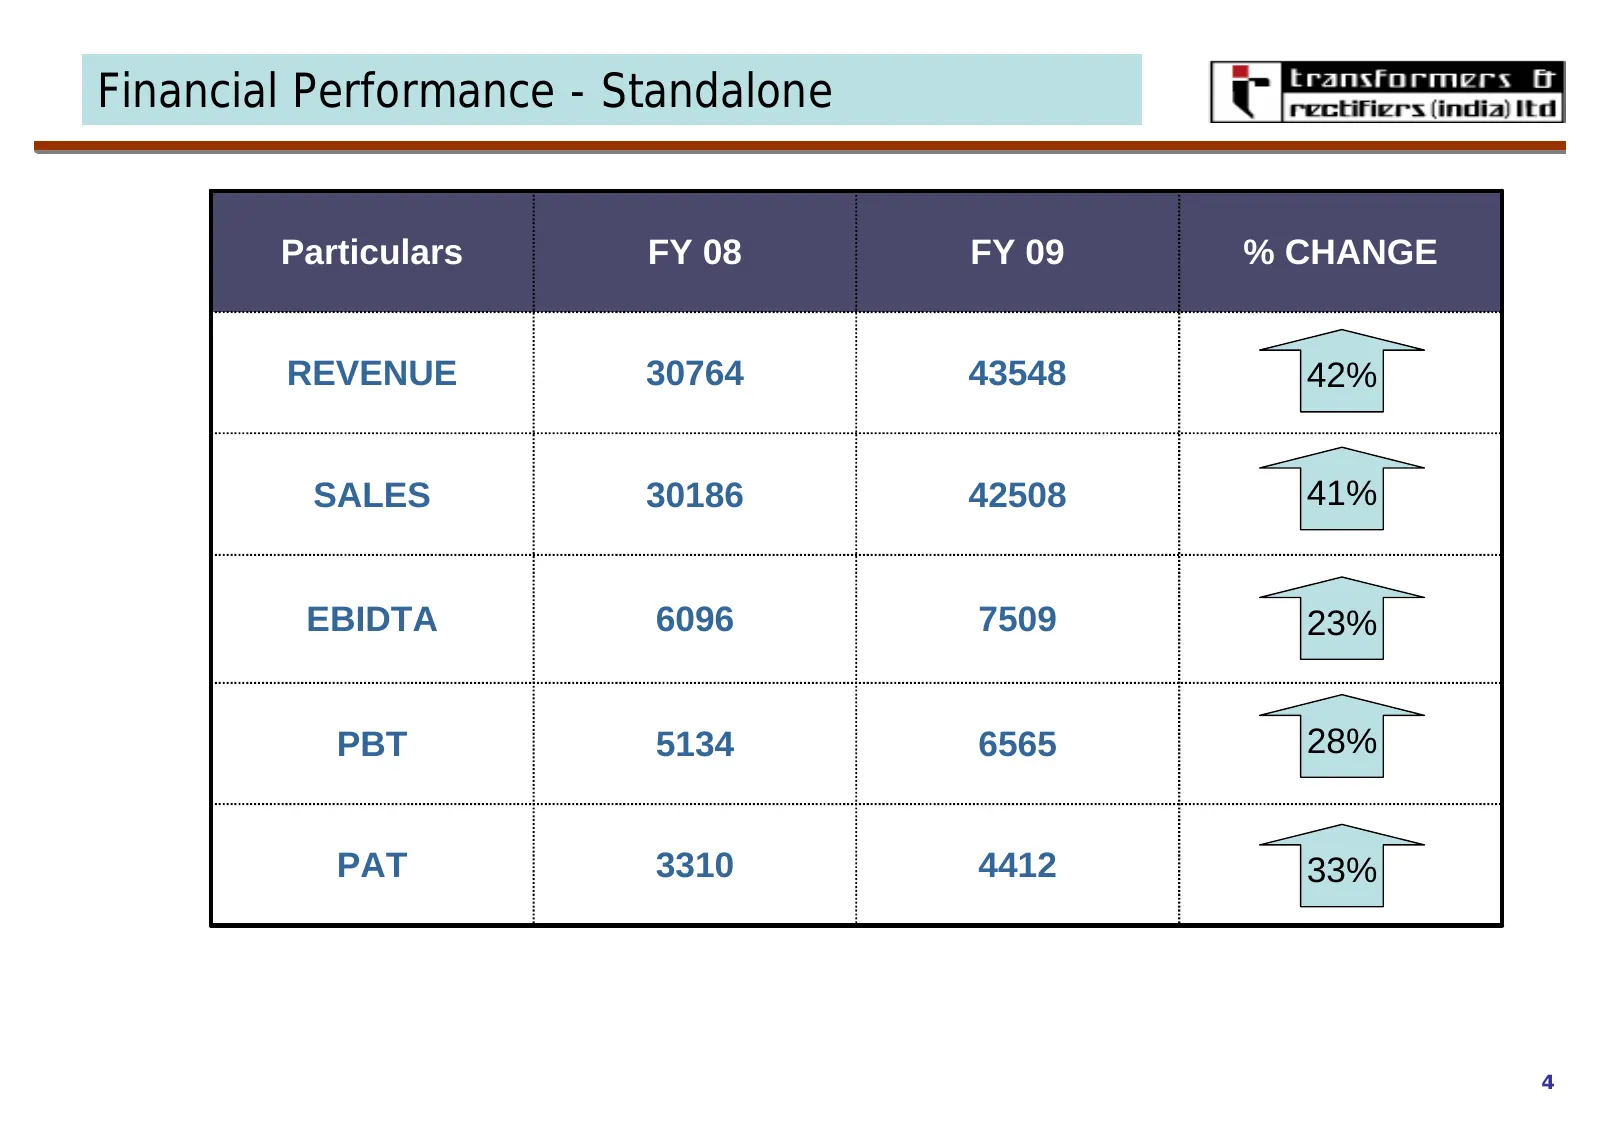
Slide 7: Financial Performance - Standalone
Financial Performance - Standalone Particulars FY 08 FY 09 % CHANGE REVENUE 30764 43548 42% SALES 30186 42508 41% EBIDTA 6096 7509 23% PBT 5134 6565 28% PAT 3310 4412 33% 4
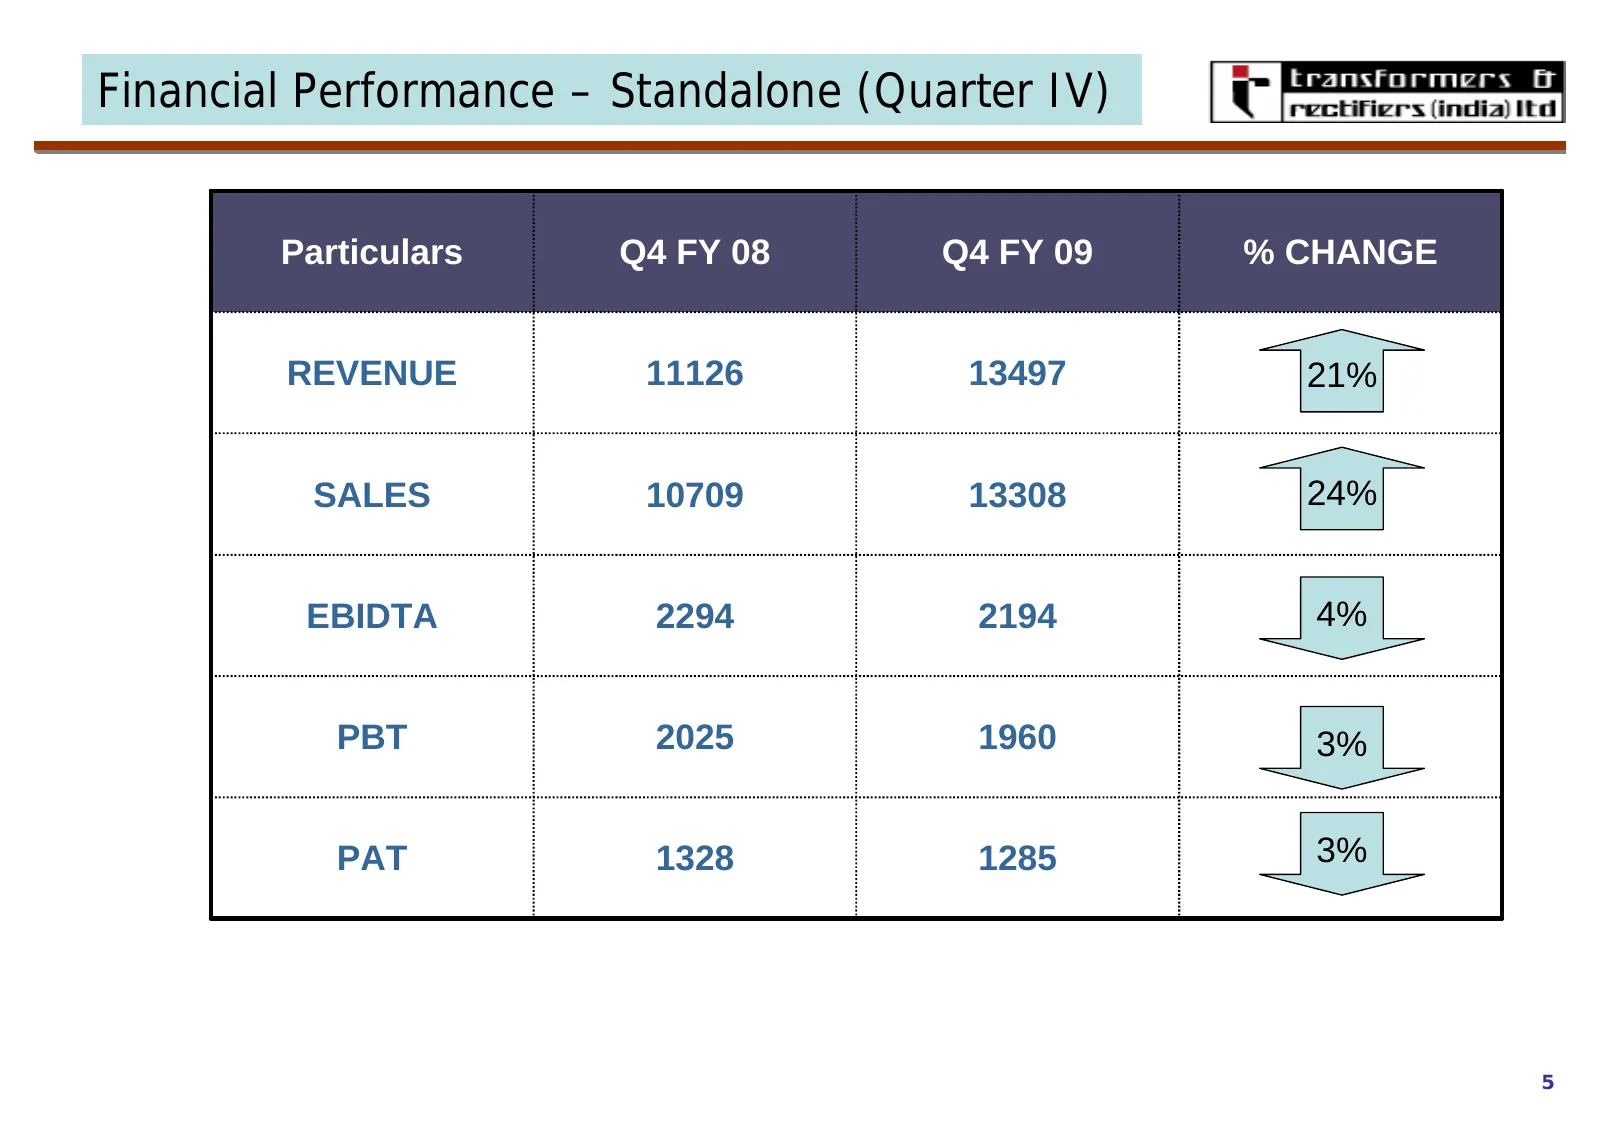
Slide 8: Financial Performance – Standalone (Quarter IV)
Financial Performance – Standalone (Quarter IV) Particulars Q4 FY 08 Q4 FY 09 % CHANGE REVENUE 11126 13497 21% SALES 10709 13308 24% EBIDTA 2294 2194 4% PBT 2025 1960 3% PAT 1328 1285 3% 5
Slide 9: Operational Performance
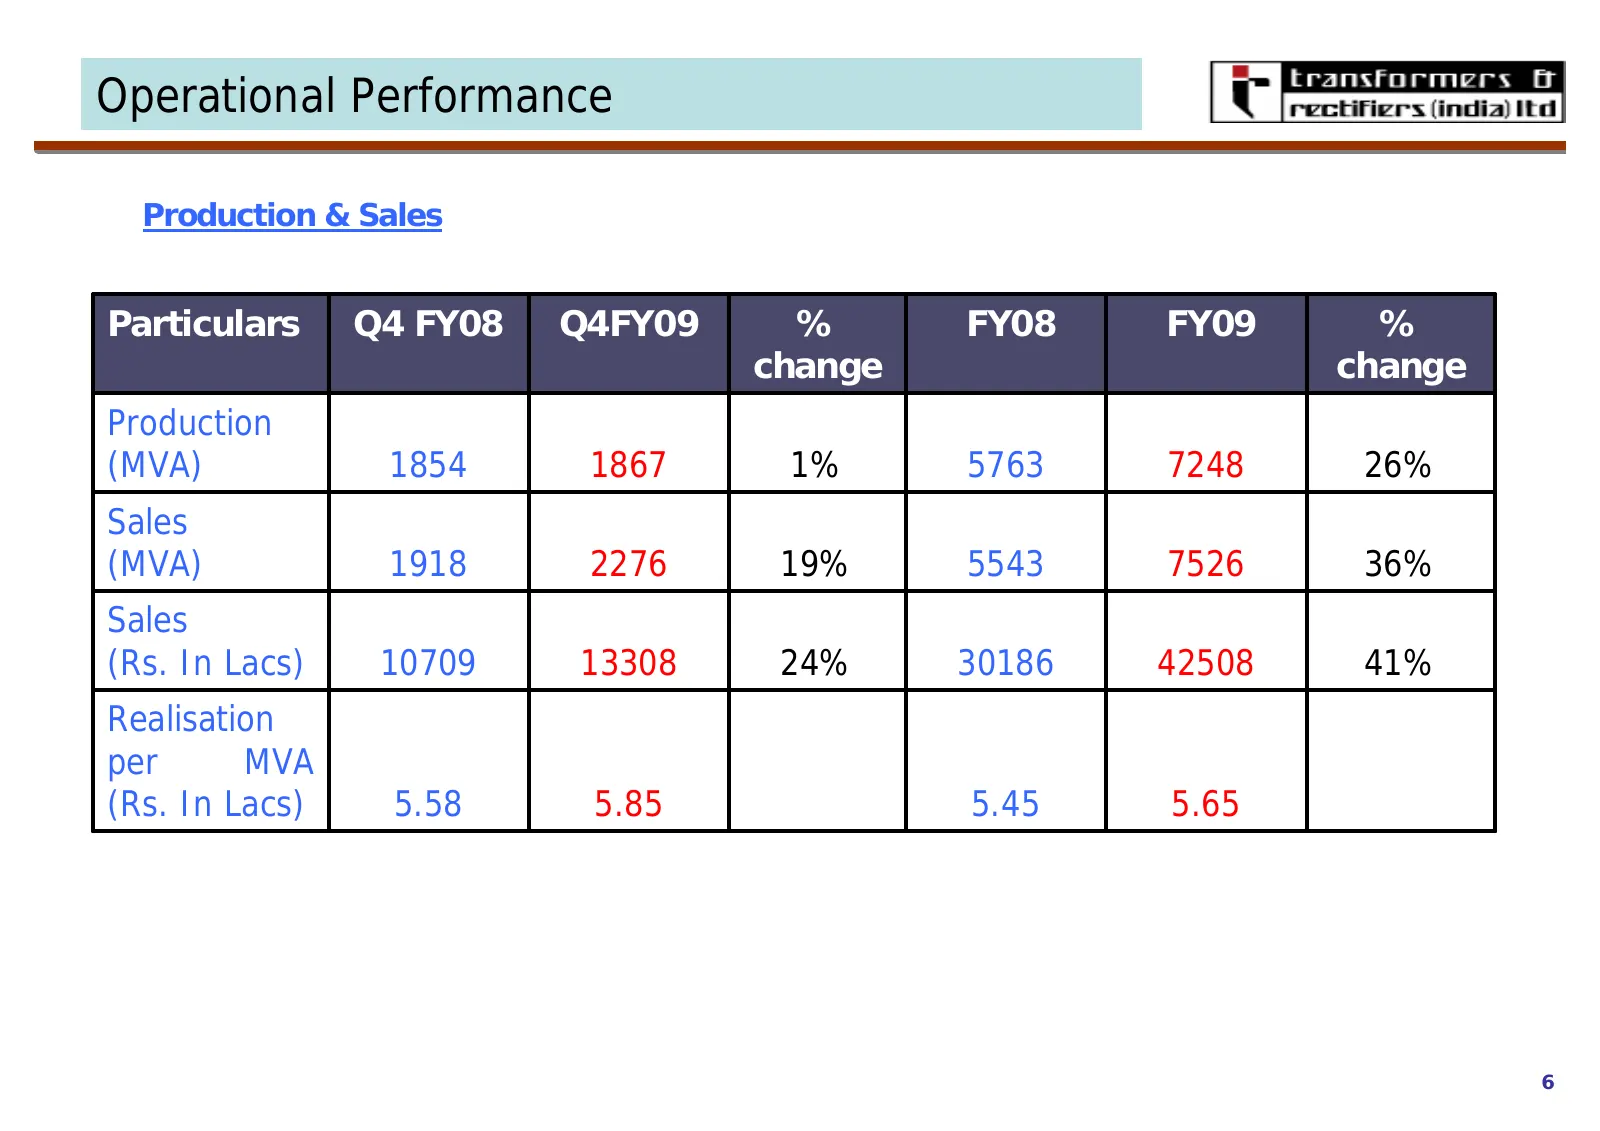
Operational Performance Production & Sales Particulars Q4 FY08 Q4FY09 % FY08 FY09 % change change Production (MVA) 1854 1867 1% 5763 7248 26% Sales (MVA) 1918 2276 19% 5543 7526 36% Sales (Rs. In Lacs) 10709 13308 24% 30186 42508 41% Realisation per MVA (Rs. In Lacs) 5.58 5.85 5.45 5.65 6
Slide 10: Operational Performance – Sales Break-up
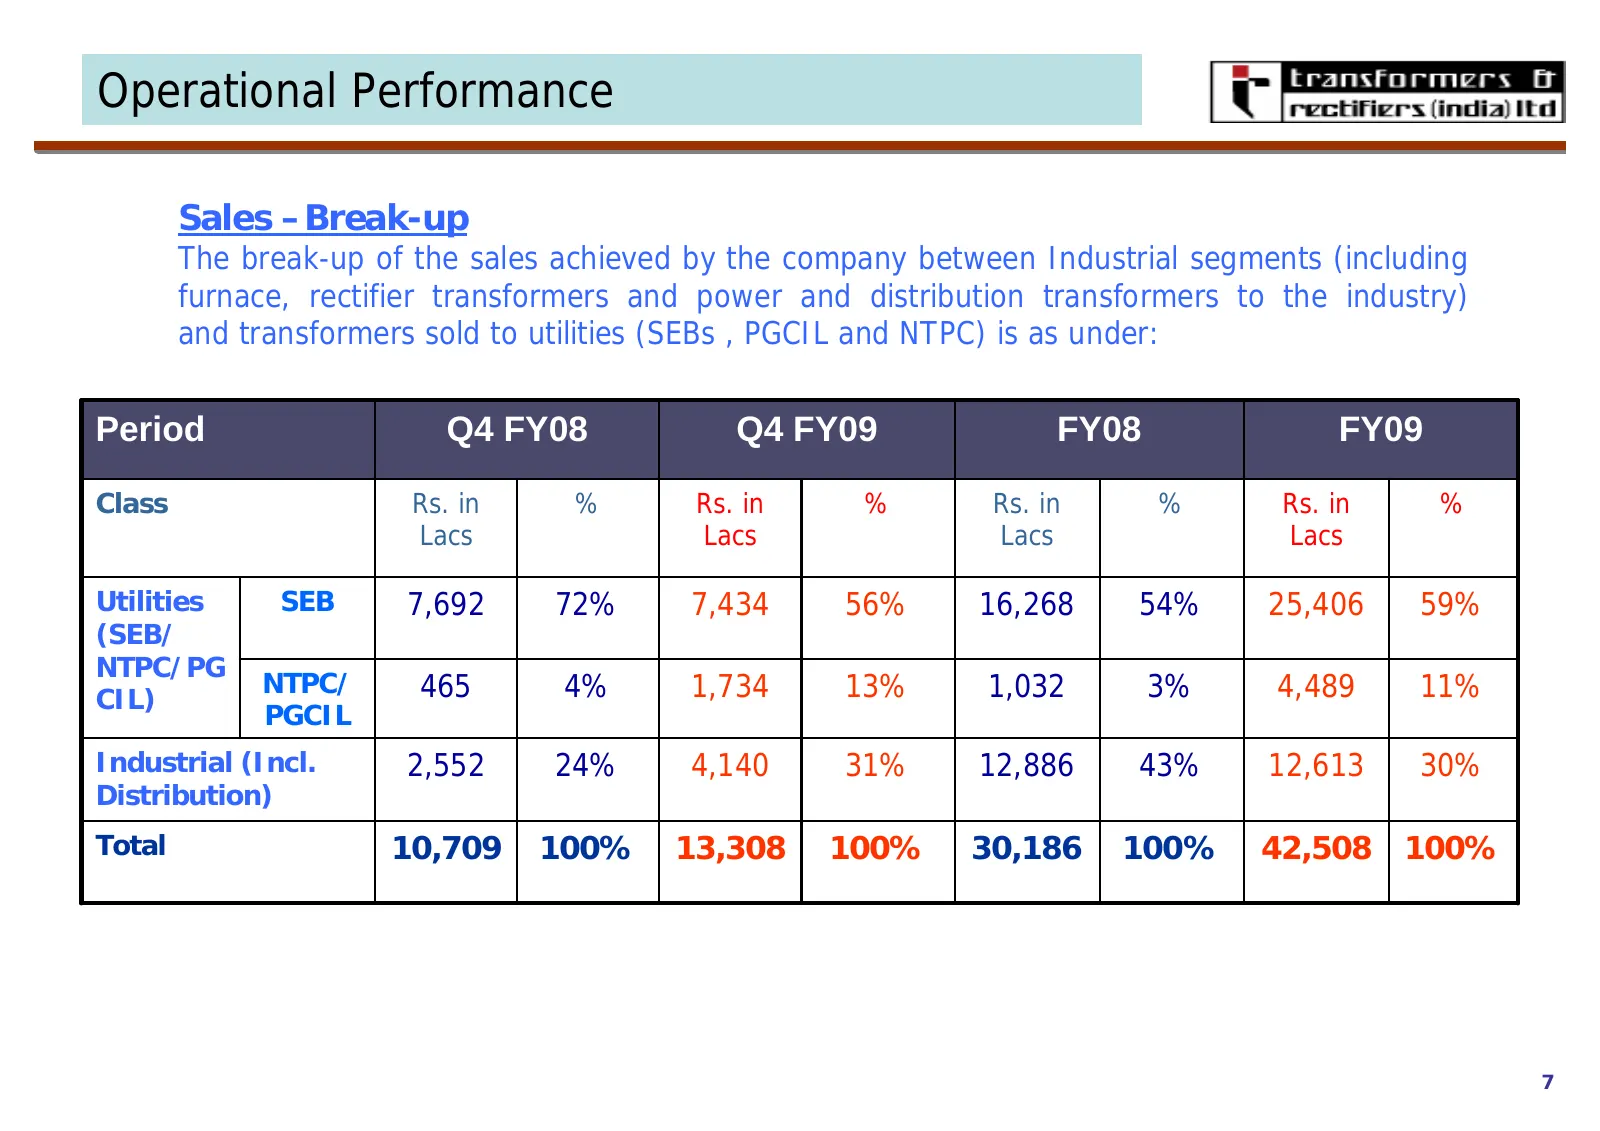
Operational Performance Sales –Break-up The break-up of the sales achieved by the company between Industrial segments (including furnace, rectifier transformers and power and distribution transformers to the industry) and transformers sold to utilities (SEBs , PGCIL and NTPC) is as under: Period Q4
Slide 11: Operational Performance – Sales Break-up
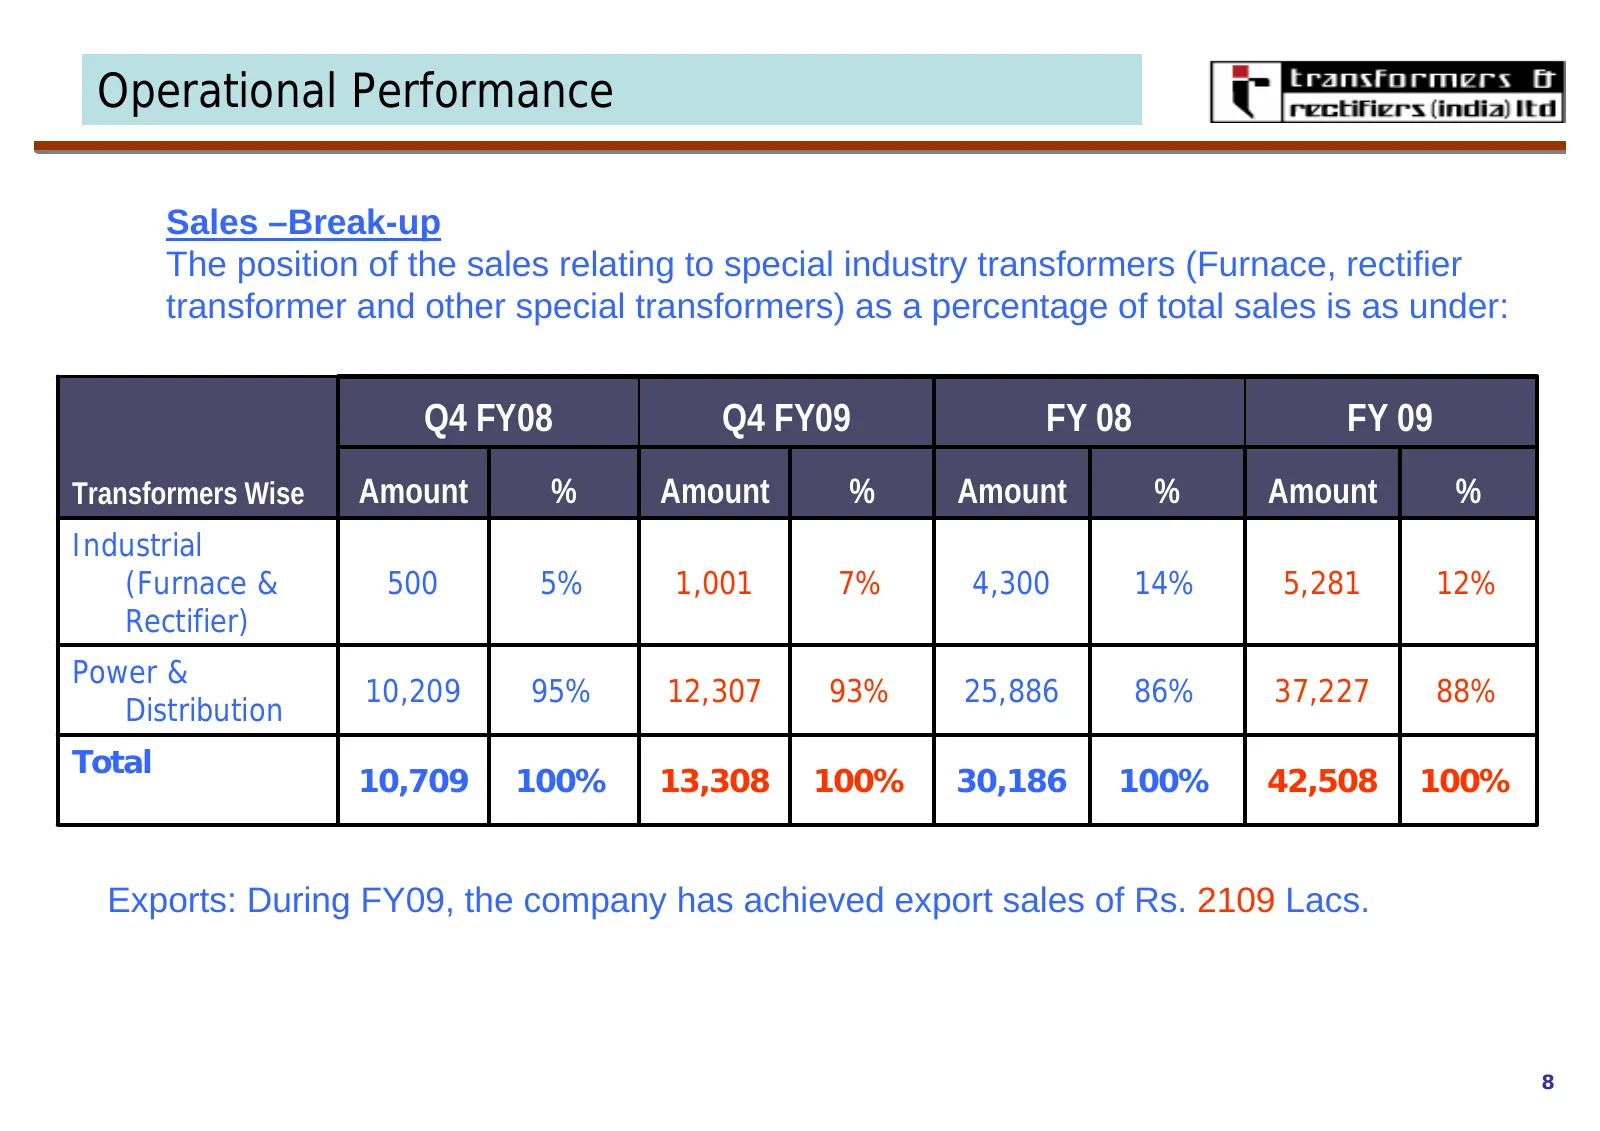
Operational Performance Sales –Break-up The position of the sales relating to special industry transformers (Furnace, rectifier transformer and other special transformers) as a percentage of total sales is as under: Q4 FY08 Q4 FY09 FY 08 FY 09 Transformers Wise Amount % Amount % Amount % Amount % In
Slide 12: Order Book
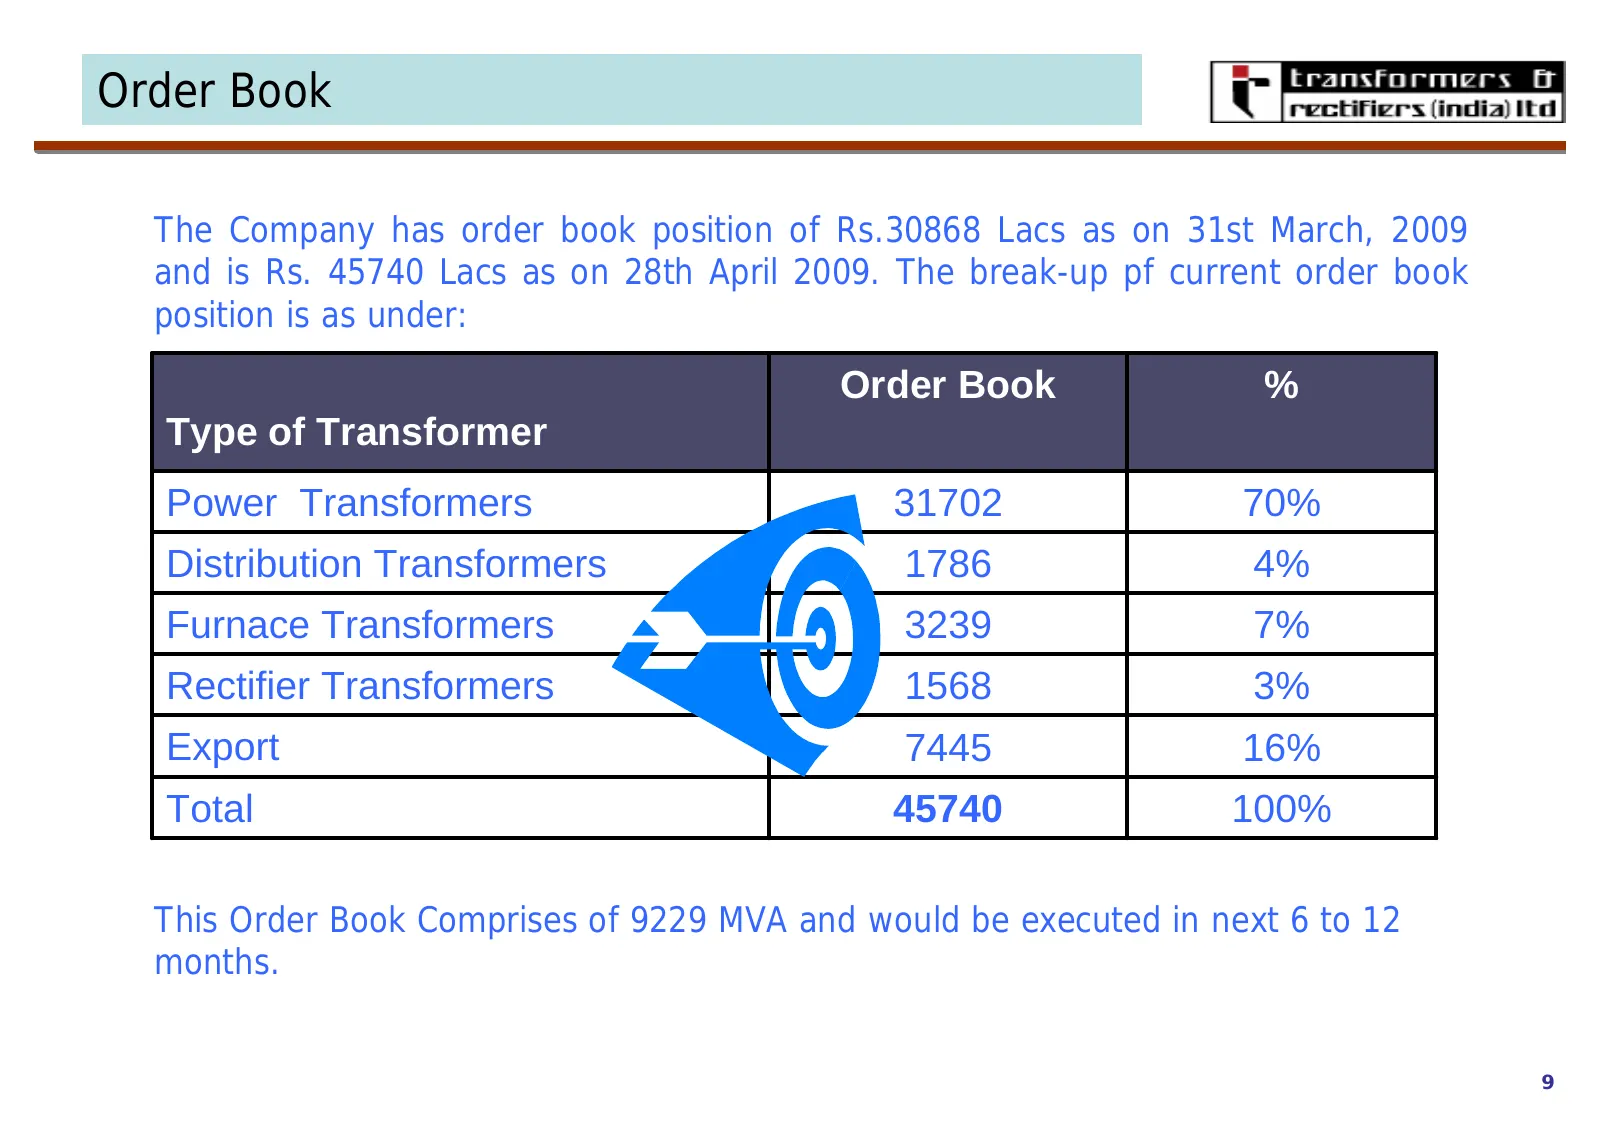
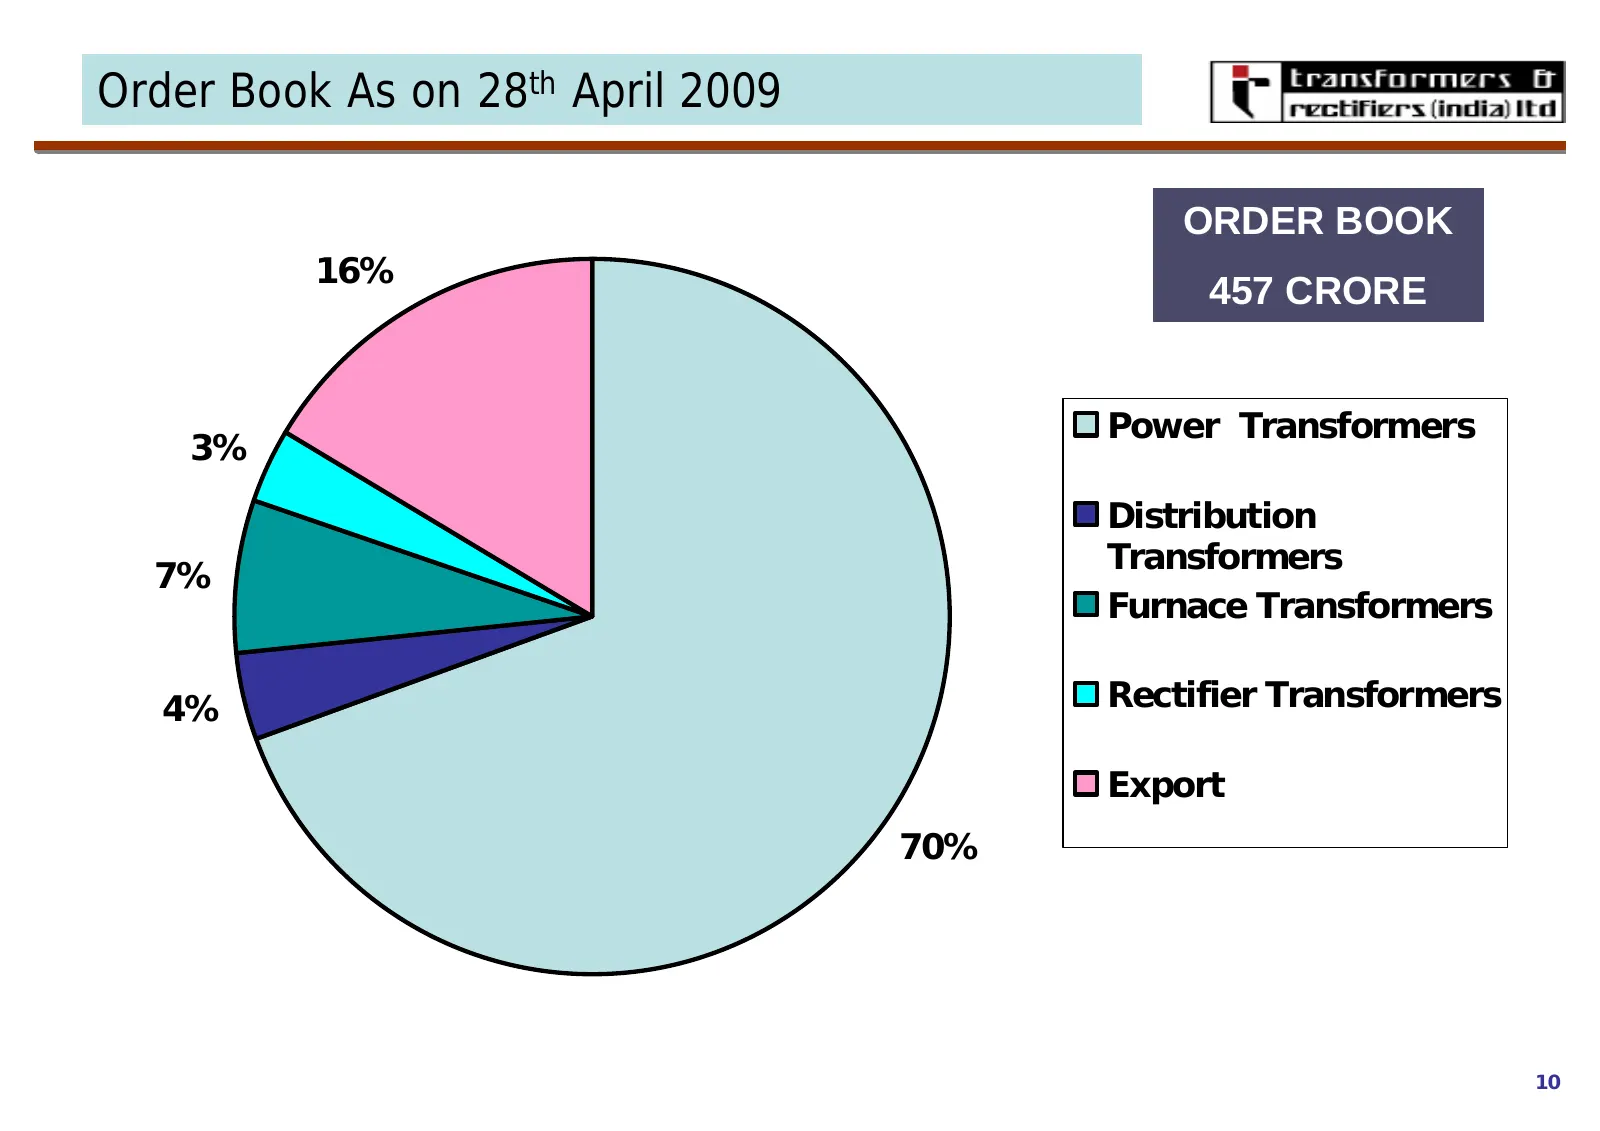
Order Book The Company has order book position of Rs.30868 Lacs as on 31st March, 2009 and is Rs. 45740 Lacs as on 28th April 2009. The break-up pf current order book position is as under: Order Book % Type of Transformer Power Transformers 31702 70% Distribution Transformers 1786 4% Furnace Transfo
Slide 13: Order Book As on 28th April 2009
Order Book As on 28th April 2009 ORDER BOOK 16% 457 CRORE Power Transformers 3% Distribution Transformers 7% Furnace Transformers 4% Rectifier Transformers Export 70% 10
Slide 14: Quarterly Revenue and PAT - Standalone
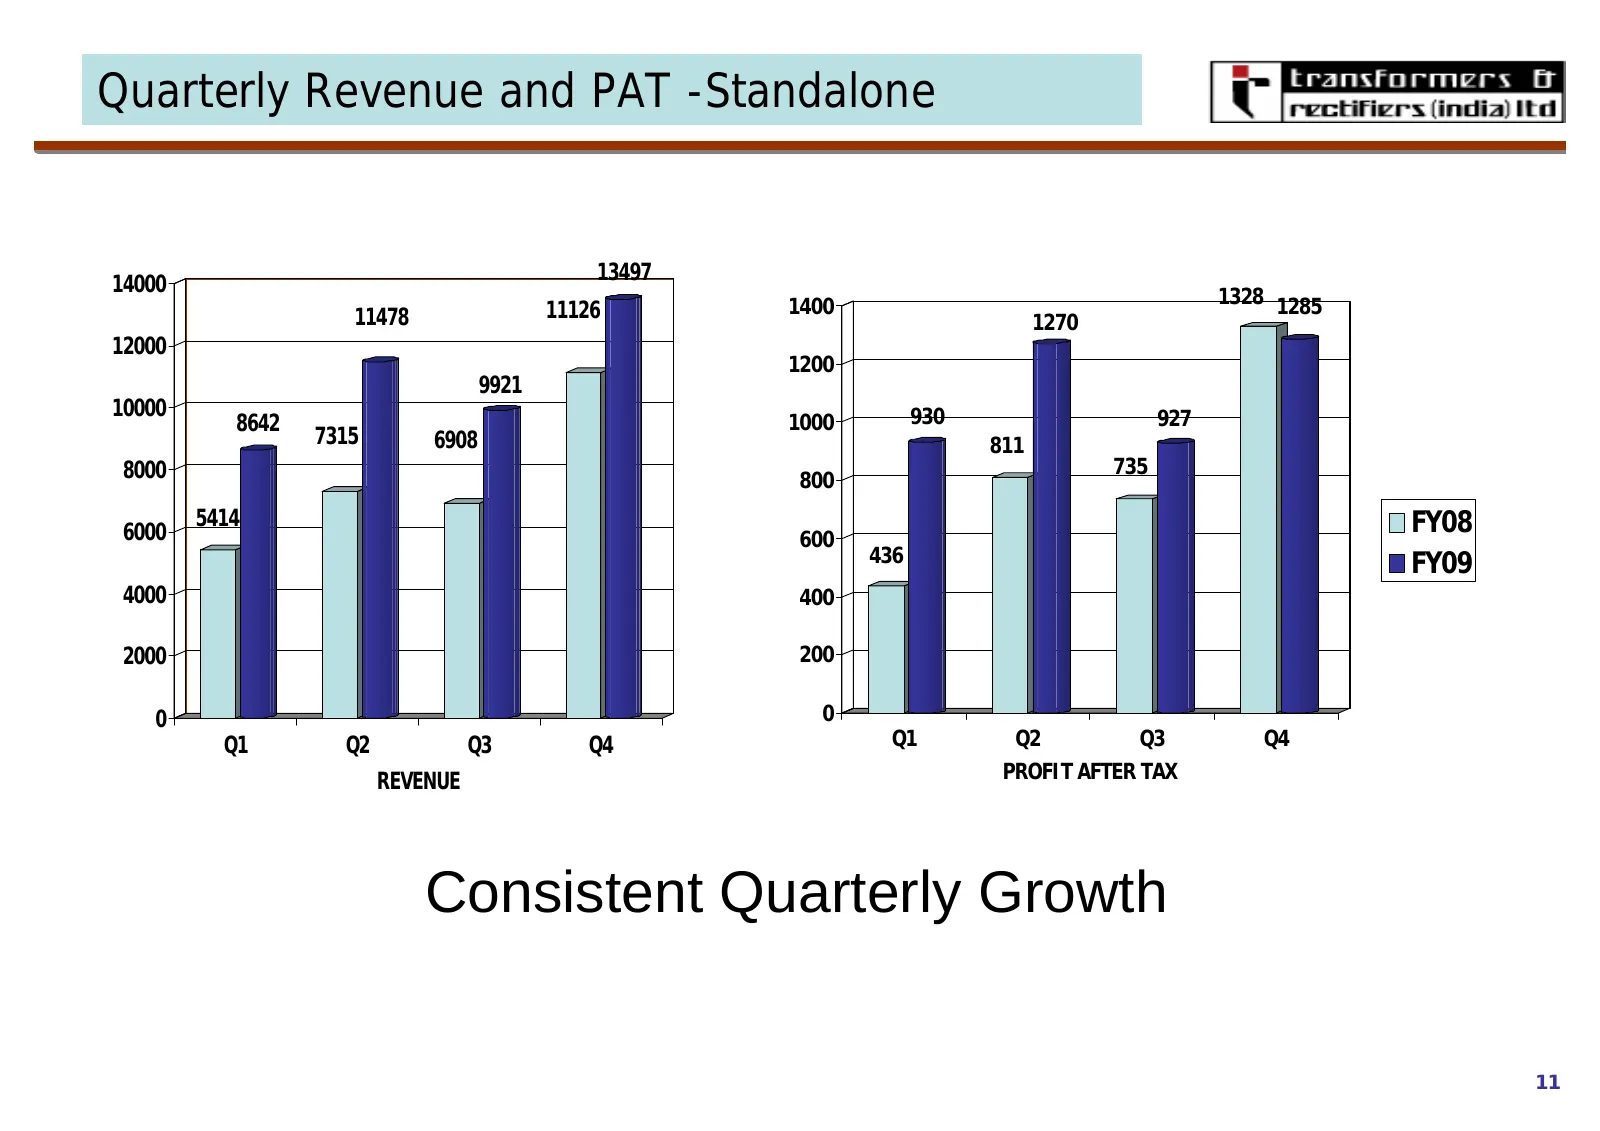
Quarterly Revenue and PAT -Standalone 13497 14000 1328 1285 11478 11126 1400 1270 12000 1200 9921 10000 930 927 8642 1000 7315 6908 811 8000 735 800 5414 FY08 6000 600 436 FY09 4000 400 2000 200 0 0 Q1 Q2 Q3 Q4 Q1 Q2 Q3 Q4 REVENUE PROFIT AFTER TAX Consistent Quarterly Growth 11
Slide 15: Breakup of Other Income - Standalone
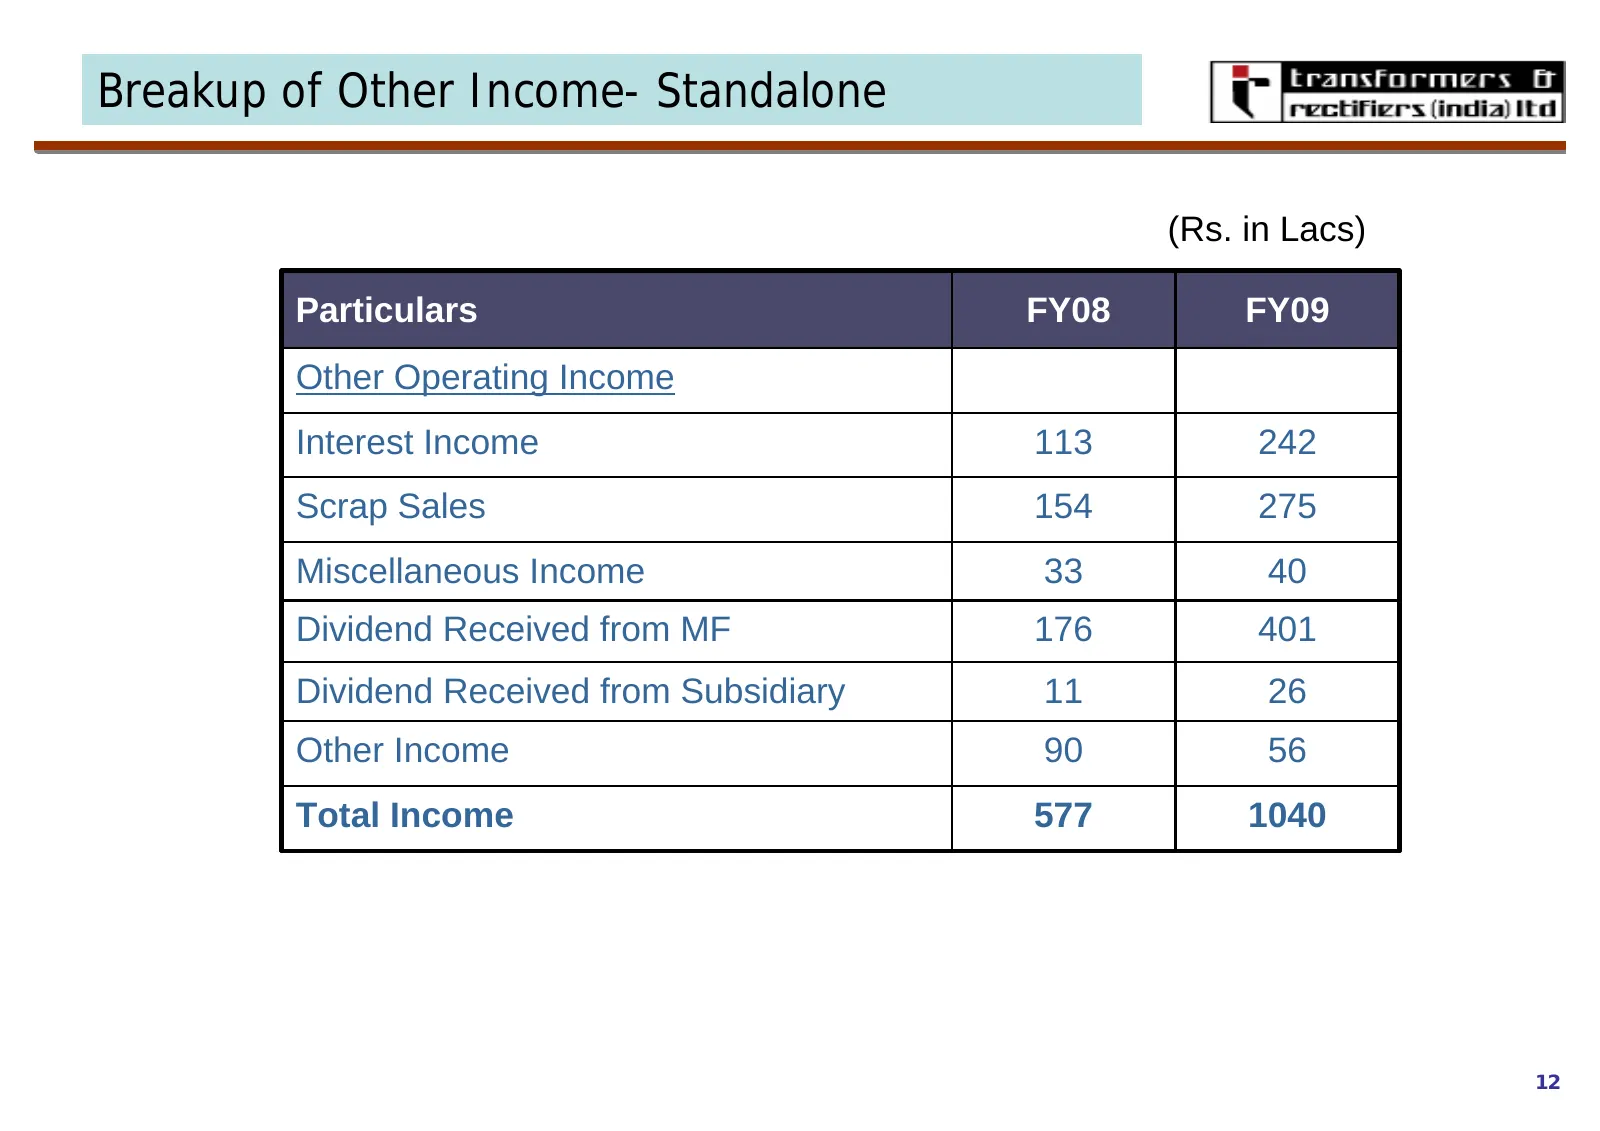
Breakup of Other Income- Standalone (Rs. in Lacs) Particulars FY08 FY09 Other Operating Income Interest Income 113 242 Scrap Sales 154 275 Miscellaneous Income 33 40 Dividend Received from MF 176 401 Dividend Received from Subsidiary 11 26 Other Income 90 56 Total Income 577 1040 12
Slide 16: Strong Financial Performance - Standalone
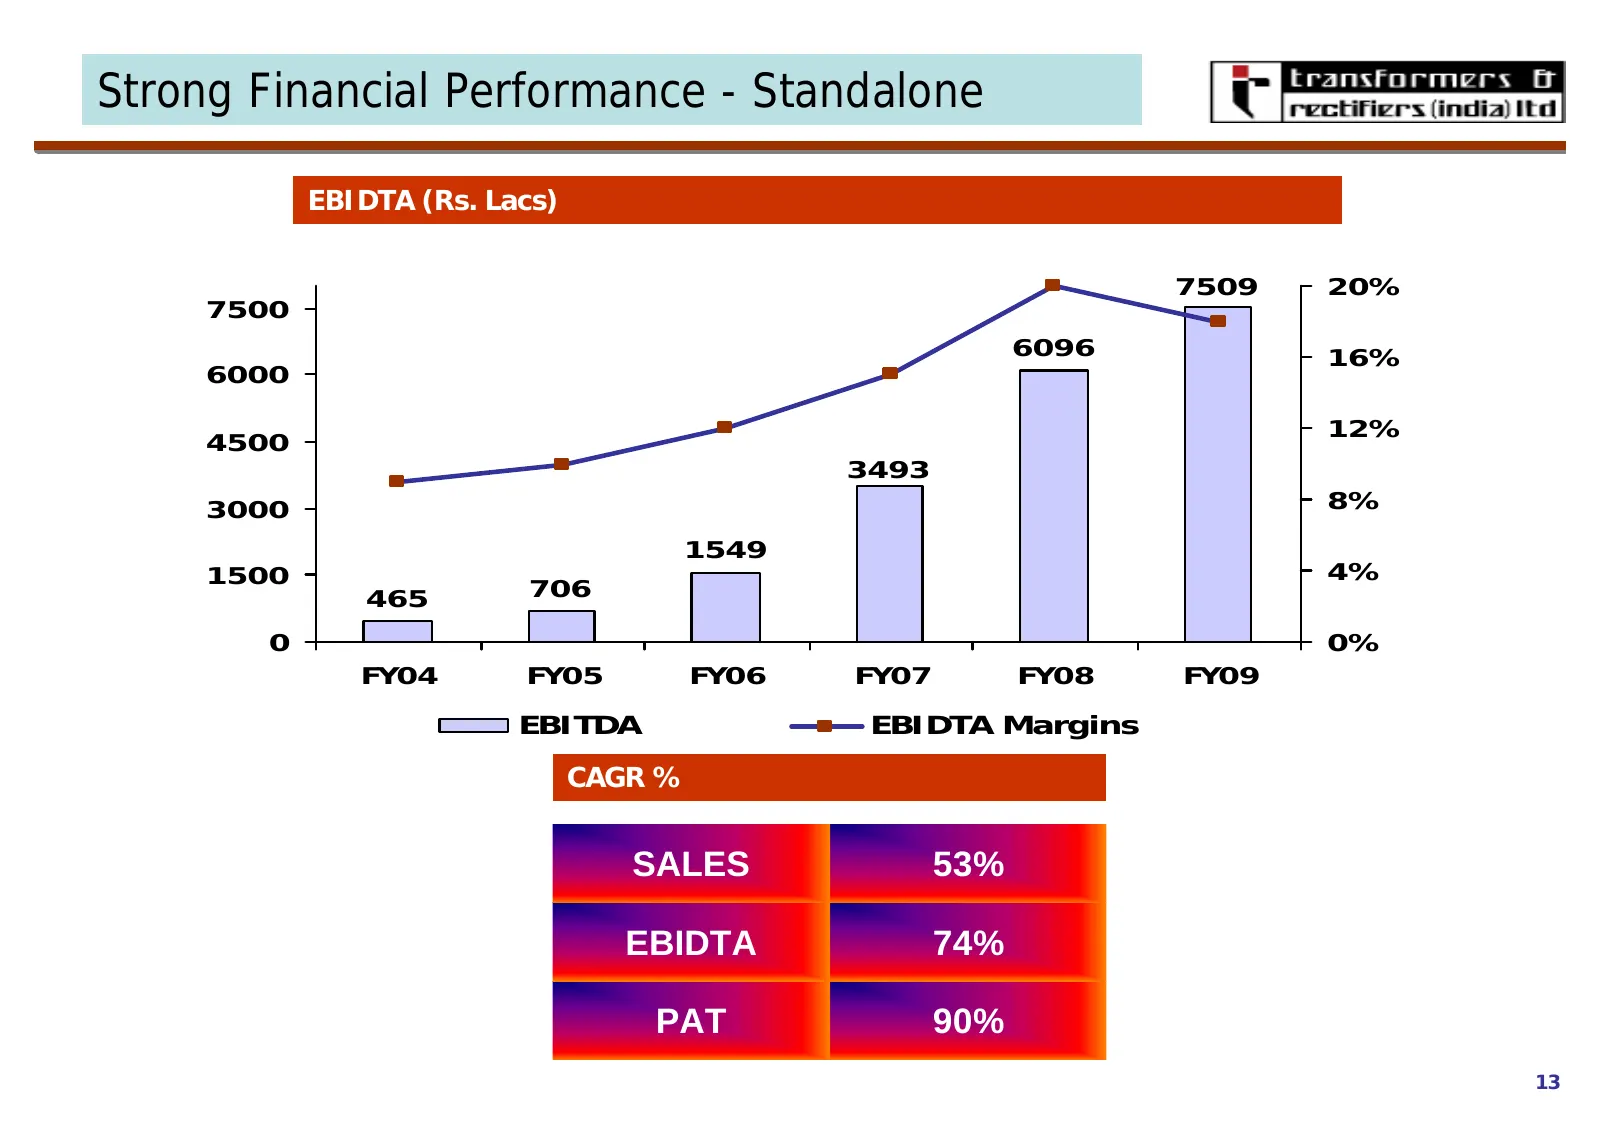
Strong Financial Performance - Standalone EBIDTA (Rs. Lacs) 7509 20% 7500 6096 16% 6000 12% 4500 3493 3000 8% 1549 1500 4% 465 706 0 0% FY04 FY05 FY06 FY07 FY08 FY09 EBITDA EBIDTA Margins CAGR % SALES 53% EBIDTA 74% PAT 90% 13
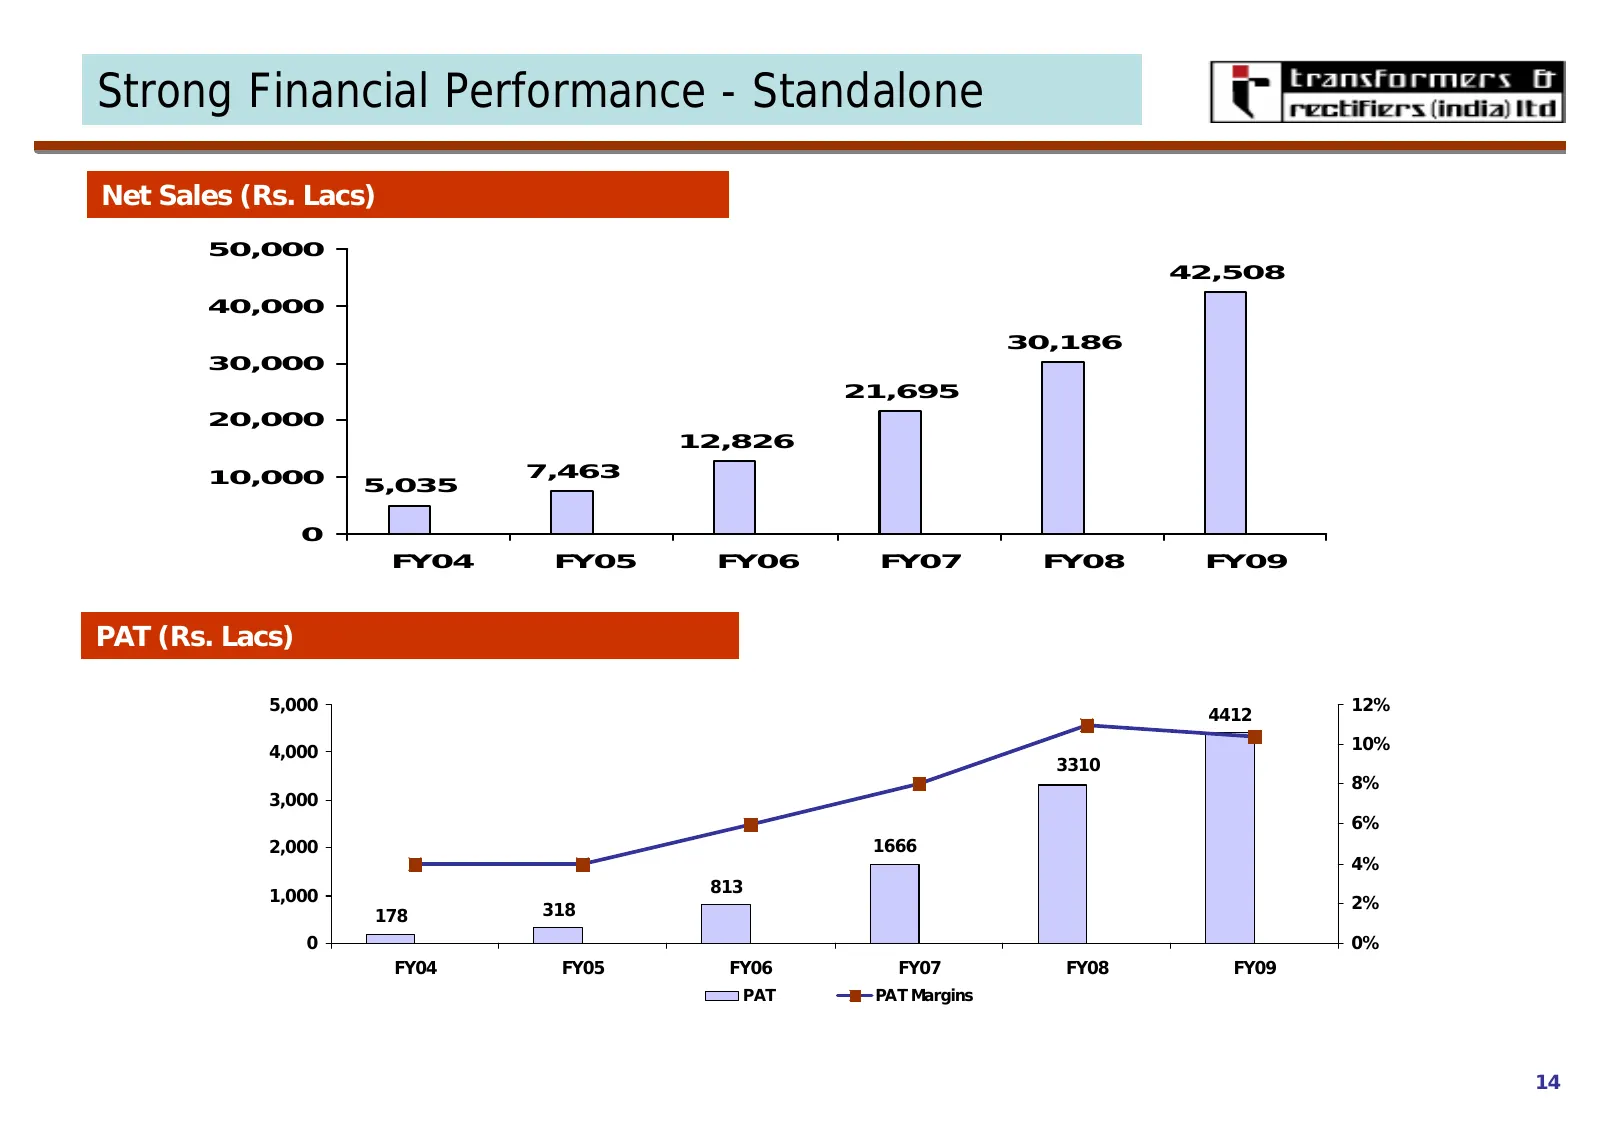
Slide 17: Strong Financial Performance - Standalone
Strong Financial Performance - Standalone Net Sales (Rs. Lacs) 50,000 42,508 40,000 30,186 30,000 21,695 20,000 12,826 10,000 7,463 5,035 0 FY04 FY05 FY06 FY07 FY08 FY09 PAT (Rs. Lacs) 5,000 12% 4412 4,000 10% 3310 8% 3,000 6% 2,000 1666 4% 813 1,000 2% 178 318 0 0% FY04 FY05 FY06 FY07 FY08 FY09 PAT
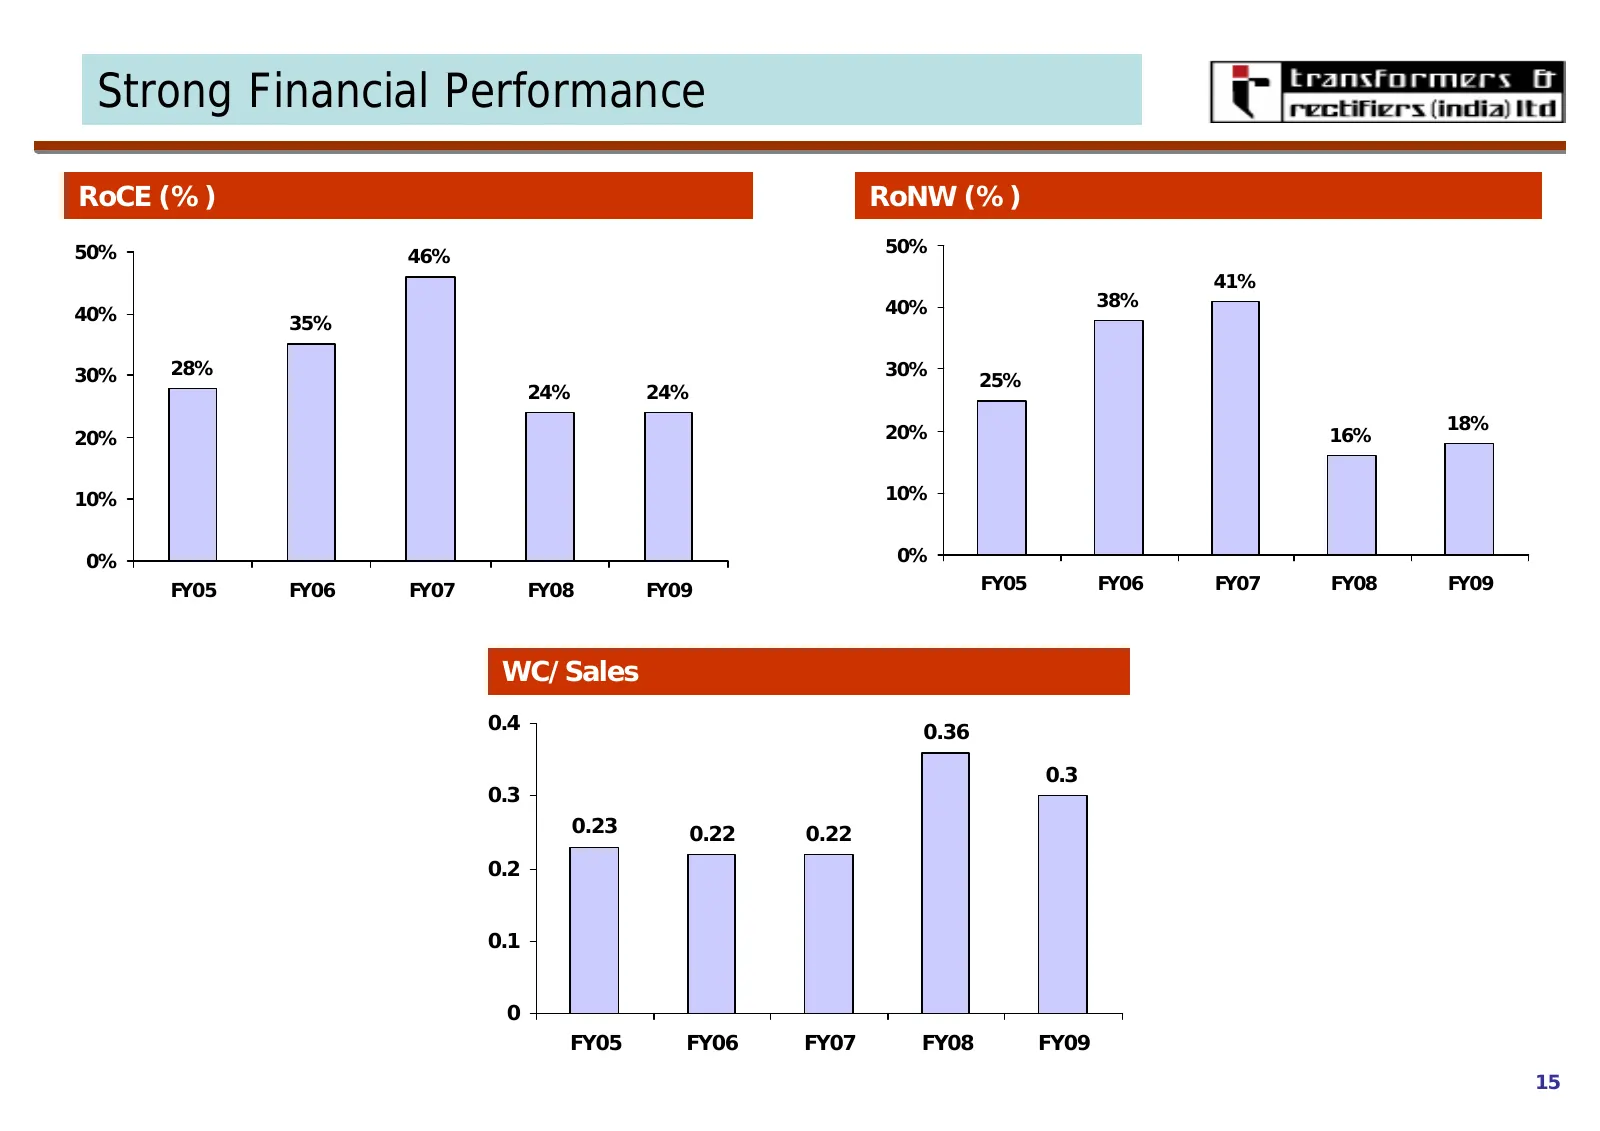
Slide 18: Strong Financial Performance
Strong Financial Performance RoCE (%) RoNW (%) 50% 50% 46% 41% 40% 38% 40% 35% 30% 28% 30% 25% 24% 24% 20% 18% 20% 16% 10% 10% 0% 0% FY05 FY06 FY07 FY08 FY09 FY05 FY06 FY07 FY08 FY09 WC/Sales 0.4 0.36 0.3 0.3 0.23 0.22 0.22 0.2 0.1 0 FY05 FY06 FY07 FY08 FY09 15
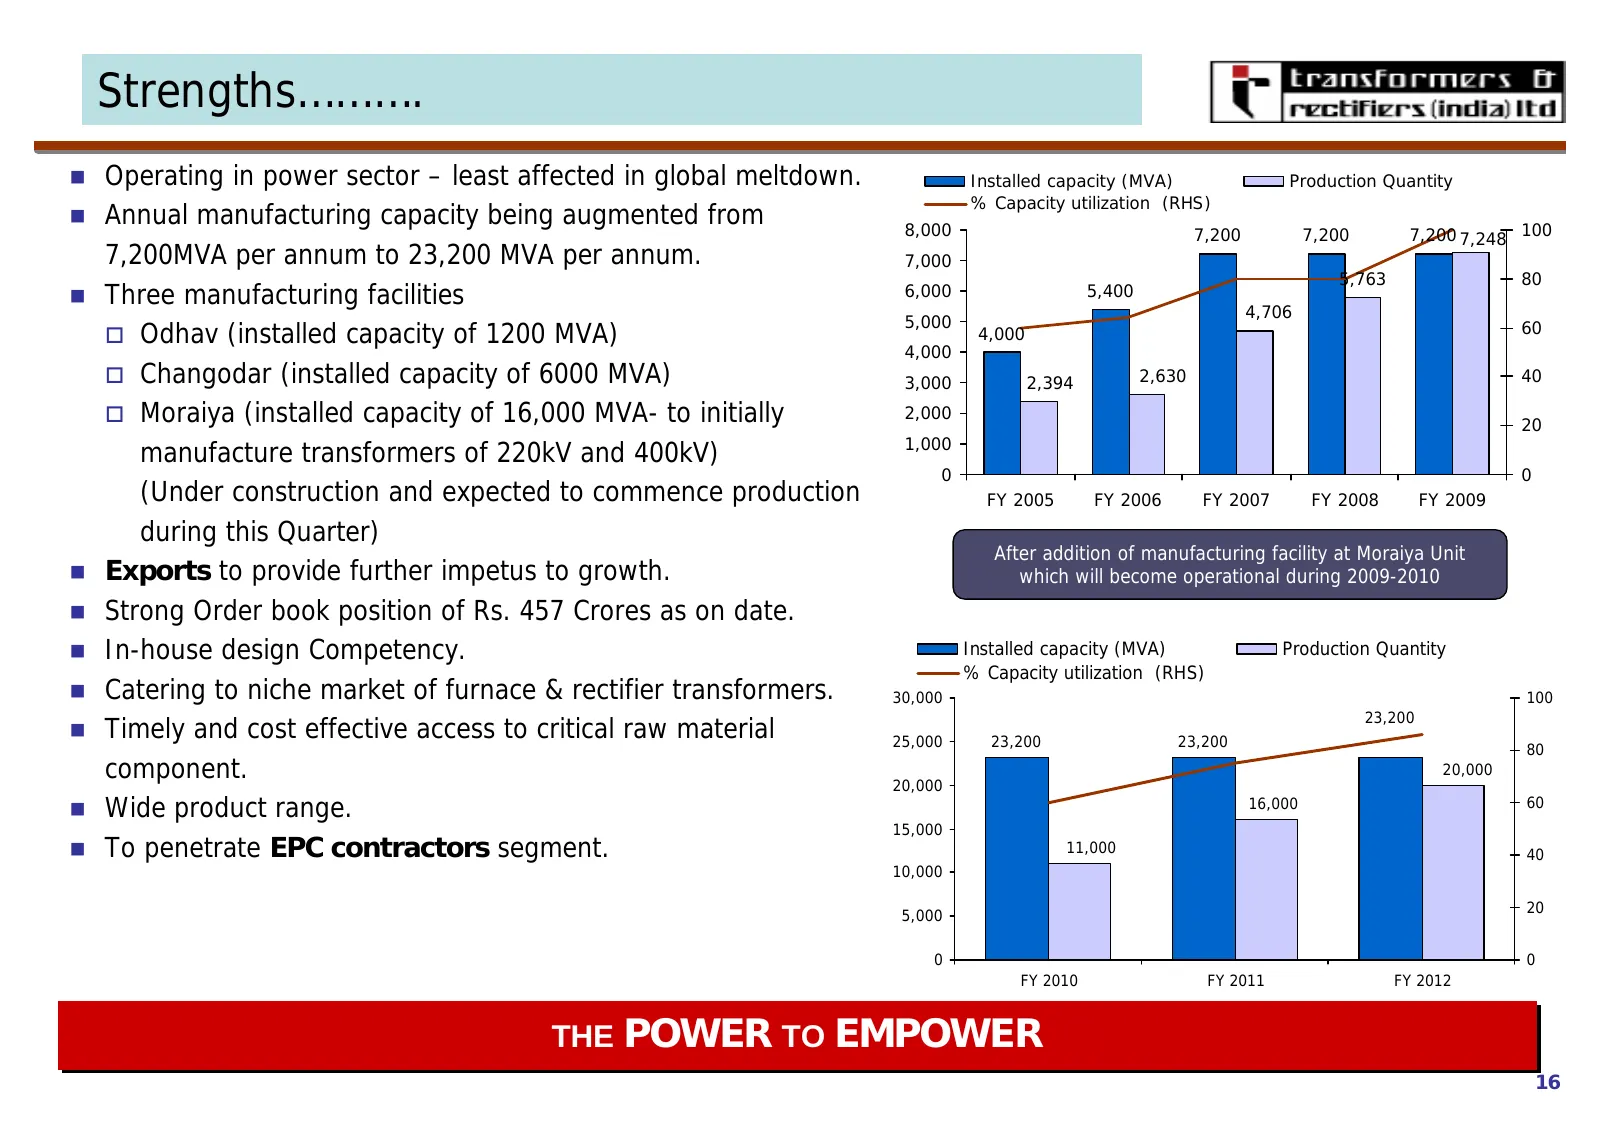
Slide 19: Strengths
Strengths………. n Operating in power sector – least affected in global meltdown. Installed capacity (MVA) Production Quantity % Capacity utilization (RHS) n Annual manufacturing capacity being augmented from 8,000 7,200 7,200 7,200 7,248 100 7,200MVA per annum to 23,200 MVA per annum. 7,000 5,763 80 n

Slide 20: Thank You
transformers & rectifiers (india) itd Thank You
Source: Internet Archive copy of transformerindia.com
More decks from Transformers and Rectifiers (India) Limited
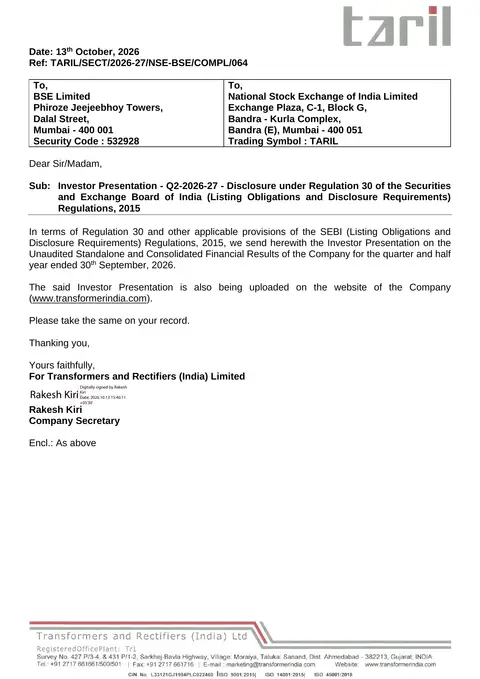 Q2 FY27 Earnings Presentation36 slides · Oct 13, 2026
 Q1 FY27 Earnings Presentation35 slides · Jul 20, 2026
 Q1 FY27 Earnings Presentation36 slides · Jul 20, 2026
 Q4 FY26 Earnings Presentation25 slides · Apr 21, 2026
 Q4 FY26 Earnings Presentation26 slides · Apr 21, 2026
 Q3 FY26 Earnings Presentation20 slides · Jan 8, 2026