AltaGas Ltd. · TSX:ALA
AltaGas — Investor Presentation (February 2024)
60 slides from AltaGas's investor presentation, February 2024
Slide 1: Fundamentally Focused – Monthly Investor Presentation
Fundamentally Focused Monthly Investor Presentation February 2024
Slide 2: Forward-Looking Information
Forward-Looking Information This presentation contains forward-looking information (forward-looking statements). Words such as "may", "can", "would", "could", "should", "likely", "will", "intend", "contemplate", "plan", "anticipate", "believe", "aim", "seek", "future", "commit", "propose", "contempl
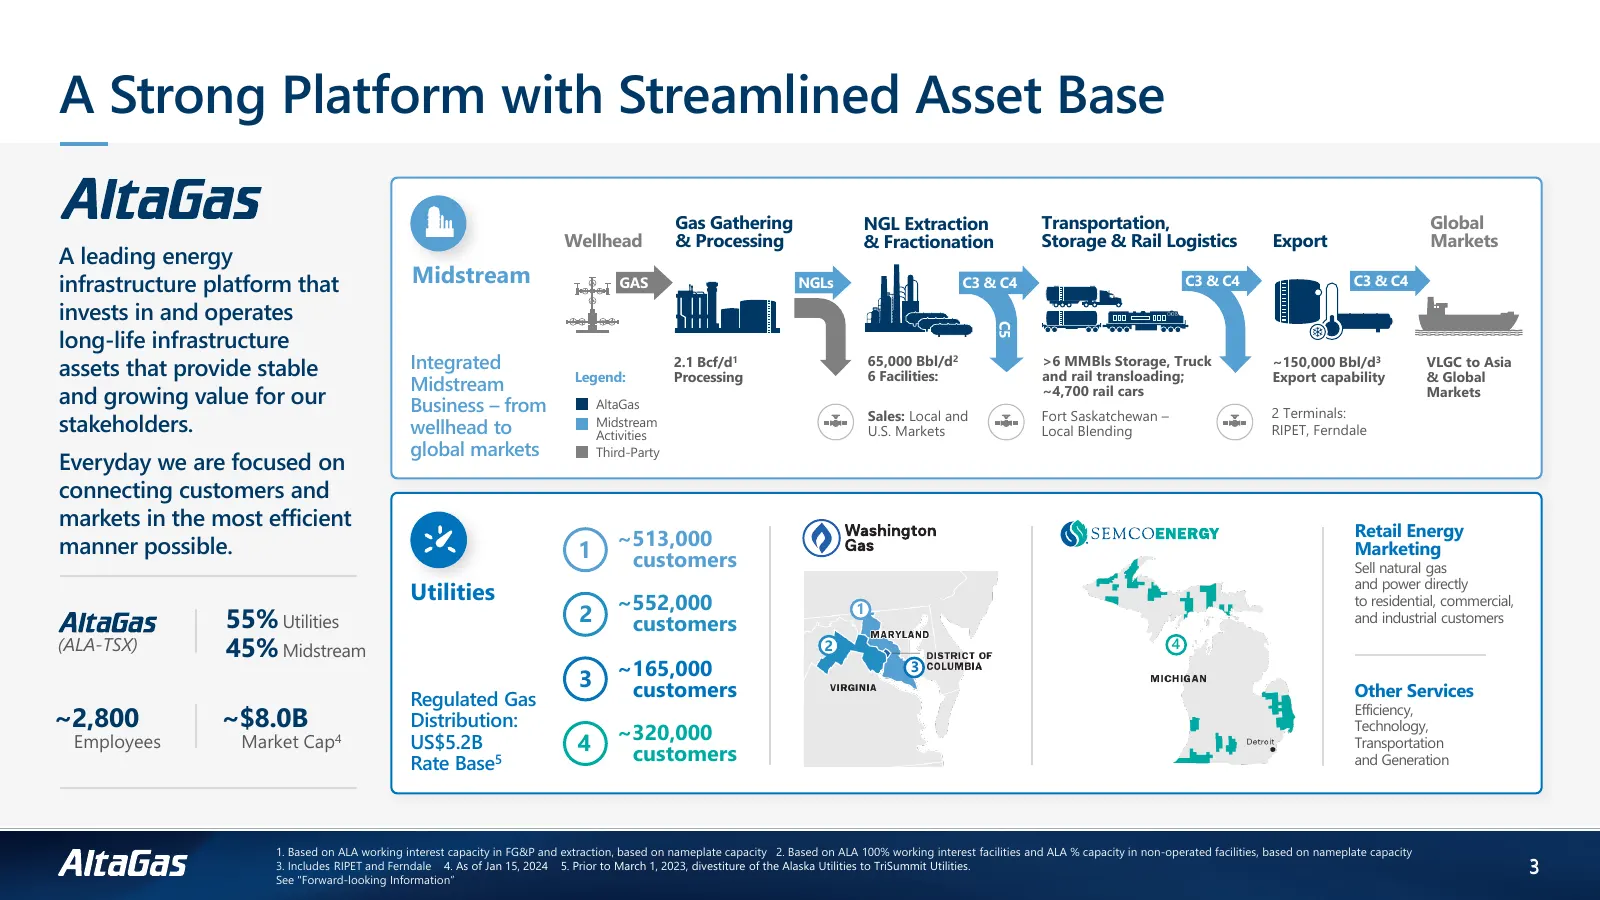
Slide 3: A Strong Platform with Streamlined Asset Base
A Strong Platform with Streamlined Asset Base Gas Gathering NGL Extraction Transportation, Global Wellhead & Processing & Fractionation Storage & Rail Logistics Export Markets A leading energy infrastructure platform that Midstream GAS NGLs C3 & C4 C3 & C4 C3 & C4 invests in and operates long-life i
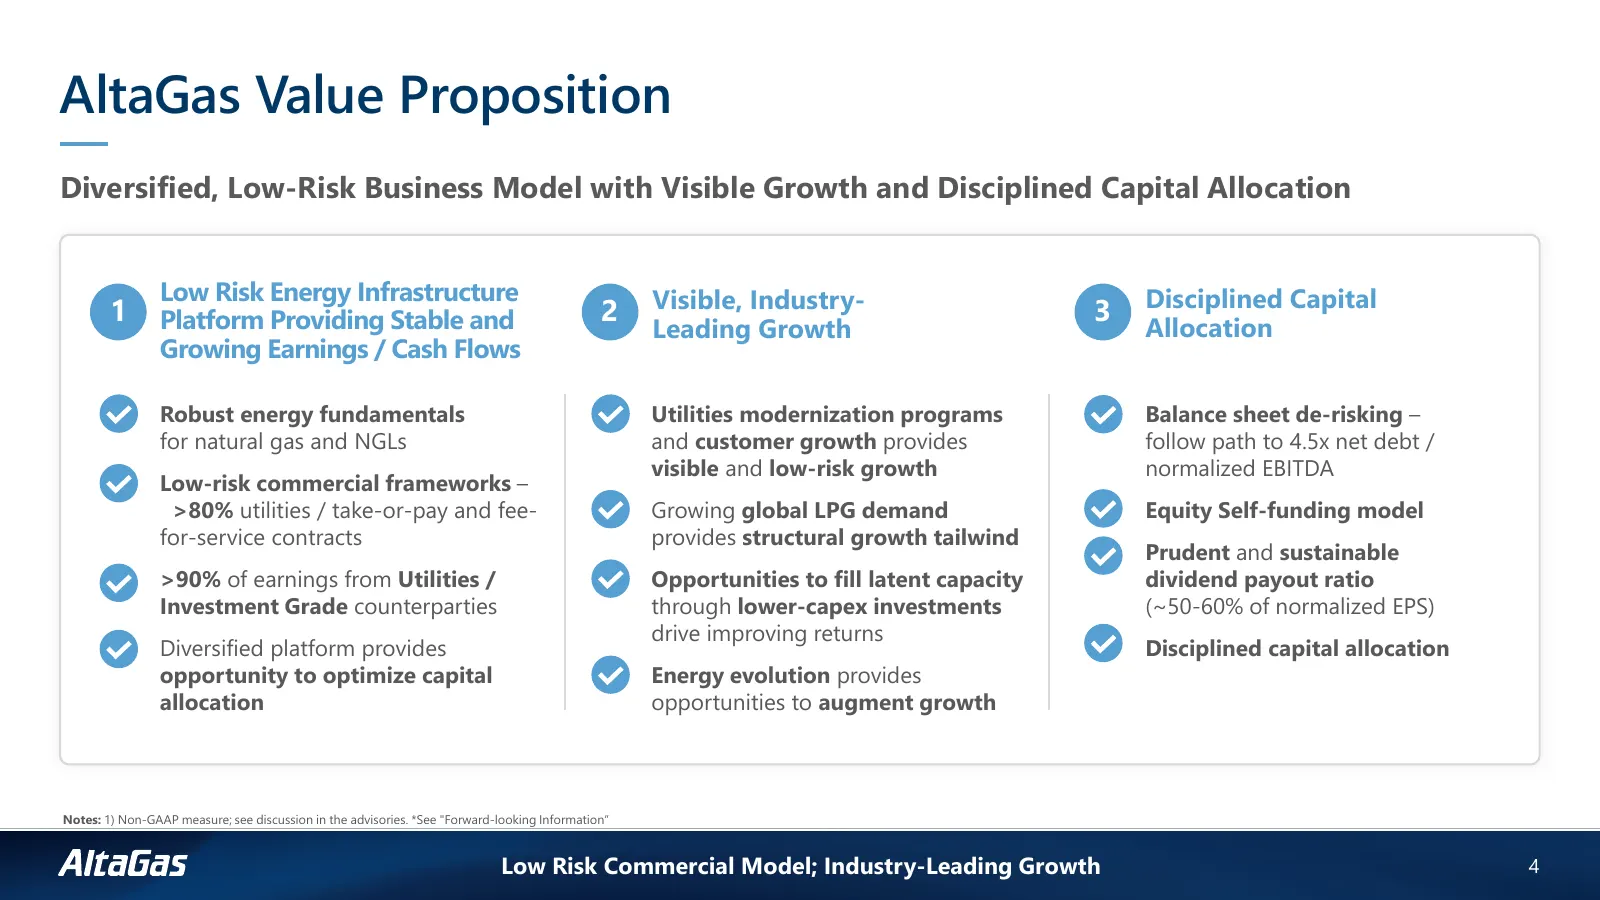
Slide 4: AltaGas Value Proposition
AltaGas Value Proposition Diversified, Low-Risk Business Model with Visible Growth and Disciplined Capital Allocation Low Risk Energy Infrastructure Visible, Industry- Disciplined Capital 1 Platform Providing Stable and 2 3 Leading Growth Allocation Growing Earnings / Cash Flows Robust energy fundam
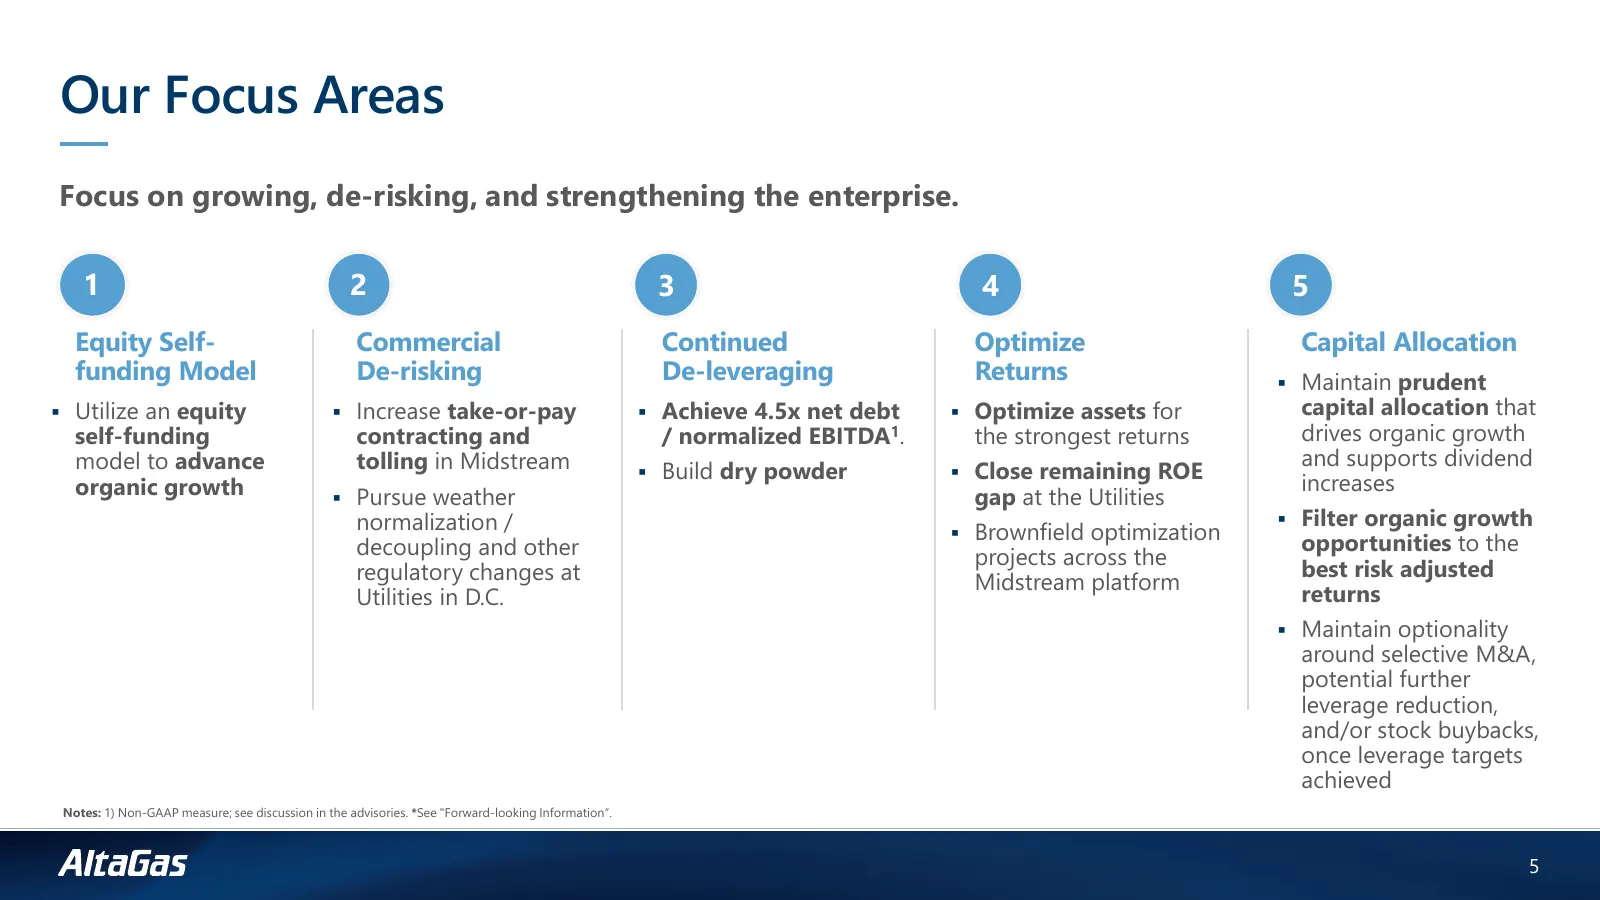
Slide 5: Our Focus Areas
Our Focus Areas Focus on growing, de-risking, and strengthening the enterprise. 1 2 3 4 5 Equity Self- Commercial Continued Optimize Capital Allocation funding Model De-risking De-leveraging Returns Maintain prudent Utilize an equity Increase take-or-pay Achieve 4.5x net debt Optimize asse
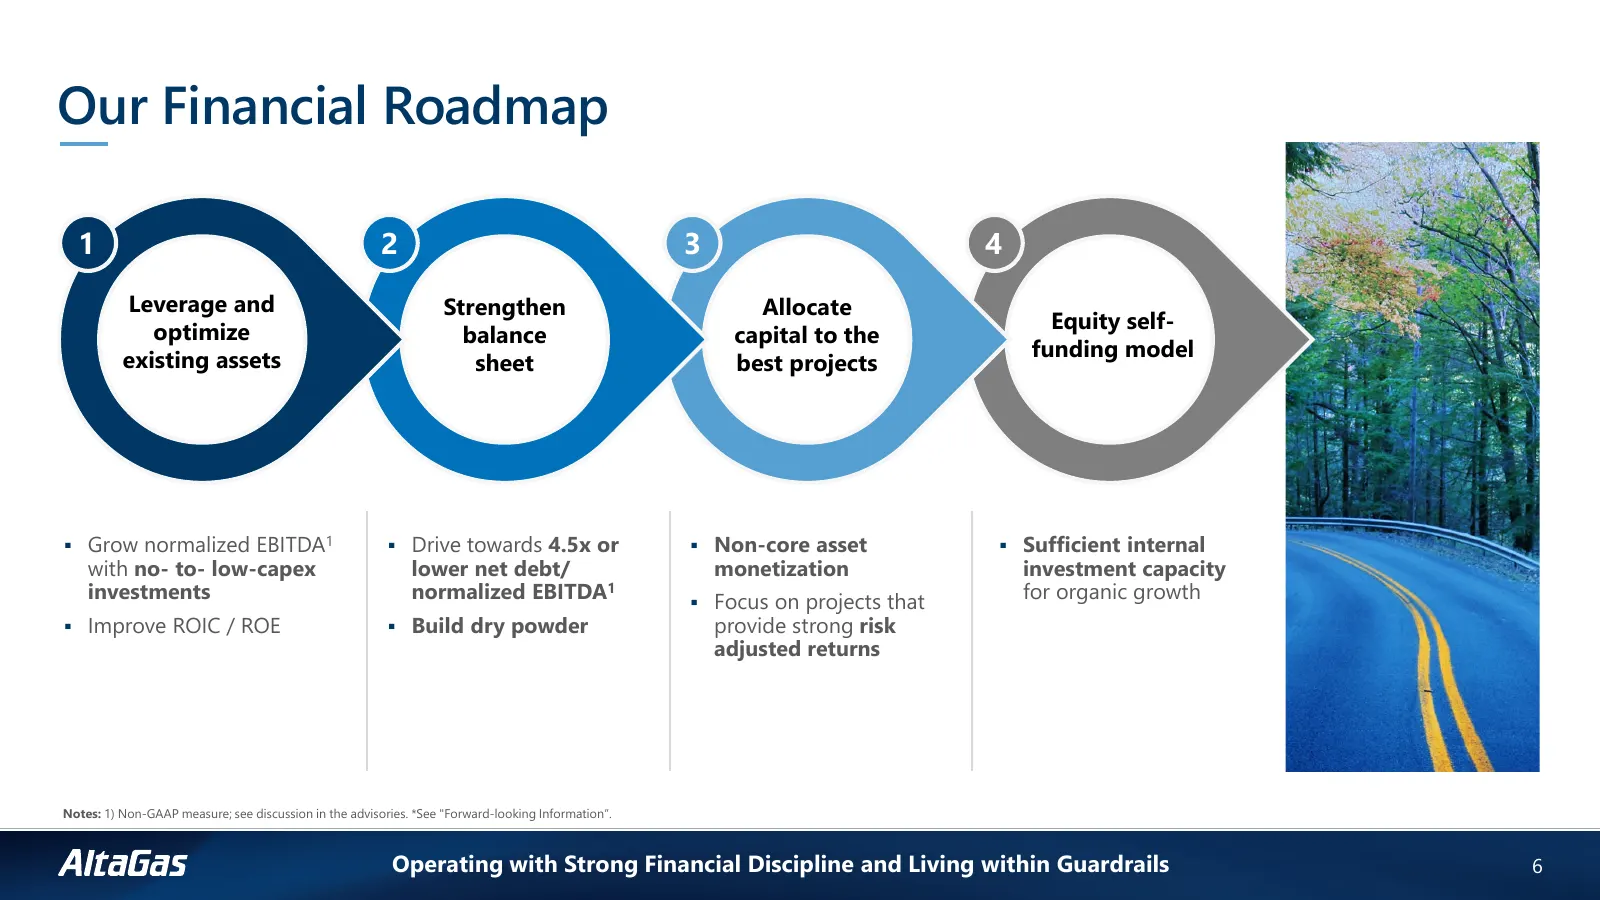
Slide 6: Our Financial Roadmap
Our Financial Roadmap 1 2 3 4 Leverage and Strengthen Allocate optimize Equity self- balance capital to the existing assets funding model sheet best projects Grow normalized EBITDA1 Drive towards 4.5x or Non-core asset Sufficient internal with no- to- low-capex lower net debt/ monetization i
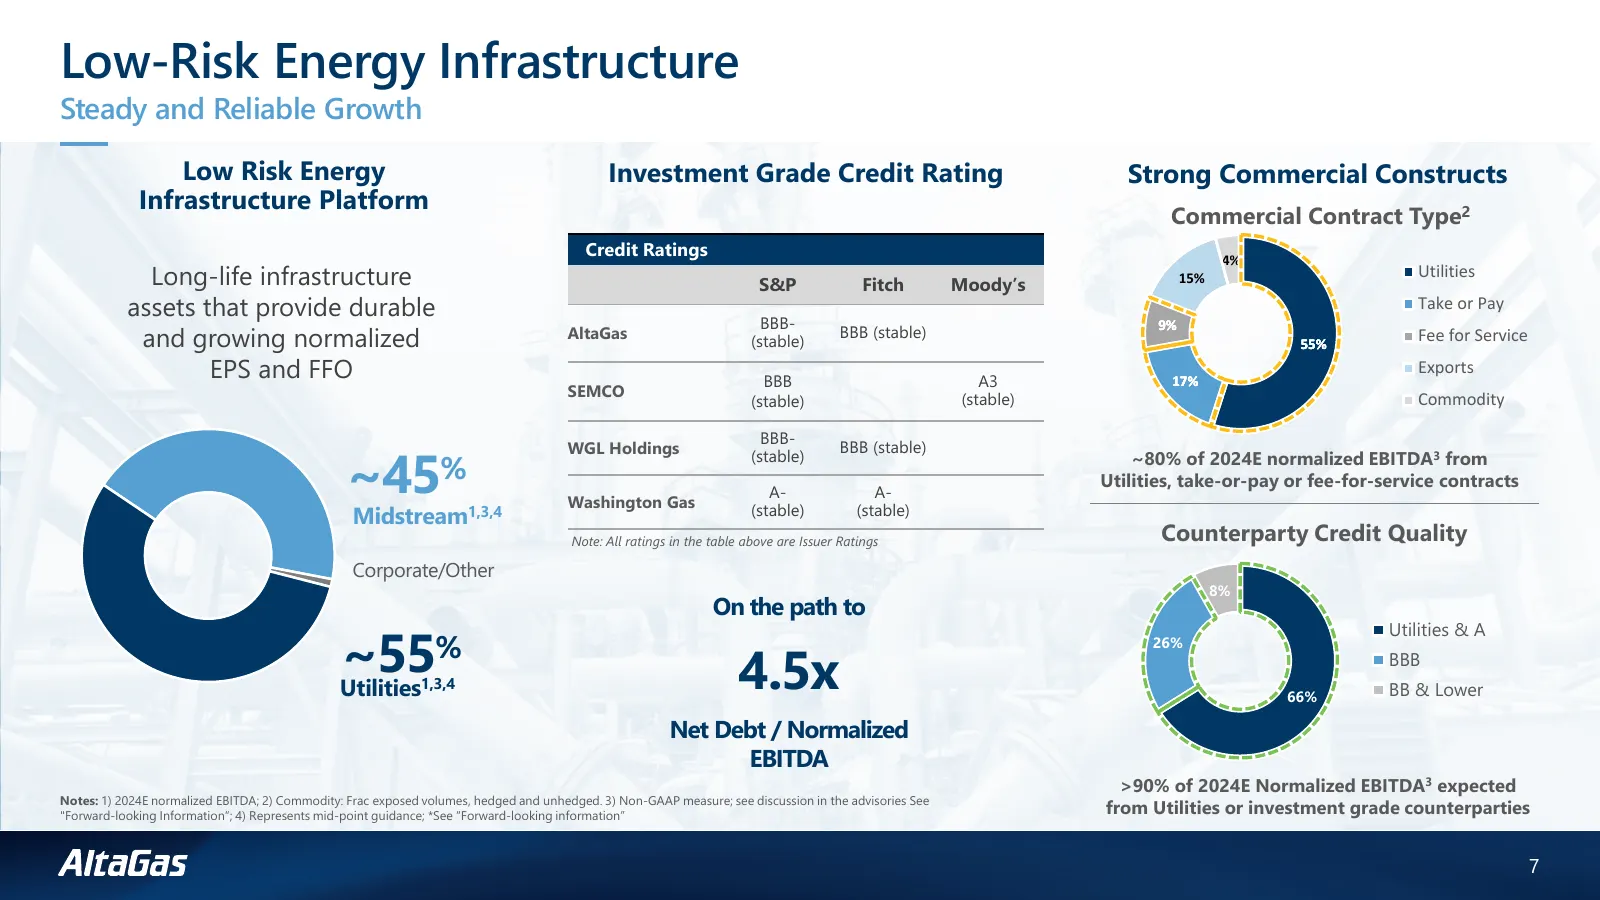
Slide 7: Low-Risk Energy Infrastructure
Low-Risk Energy Infrastructure Steady and Reliable Growth Low Risk Energy Investment Grade Credit Rating Strong Commercial Constructs Infrastructure Platform Commercial Contract Type2 Credit Ratings 4% Long-life infrastructure S&P Fitch Moody’s 15% Utilities assets that provide durable BBB- Take or
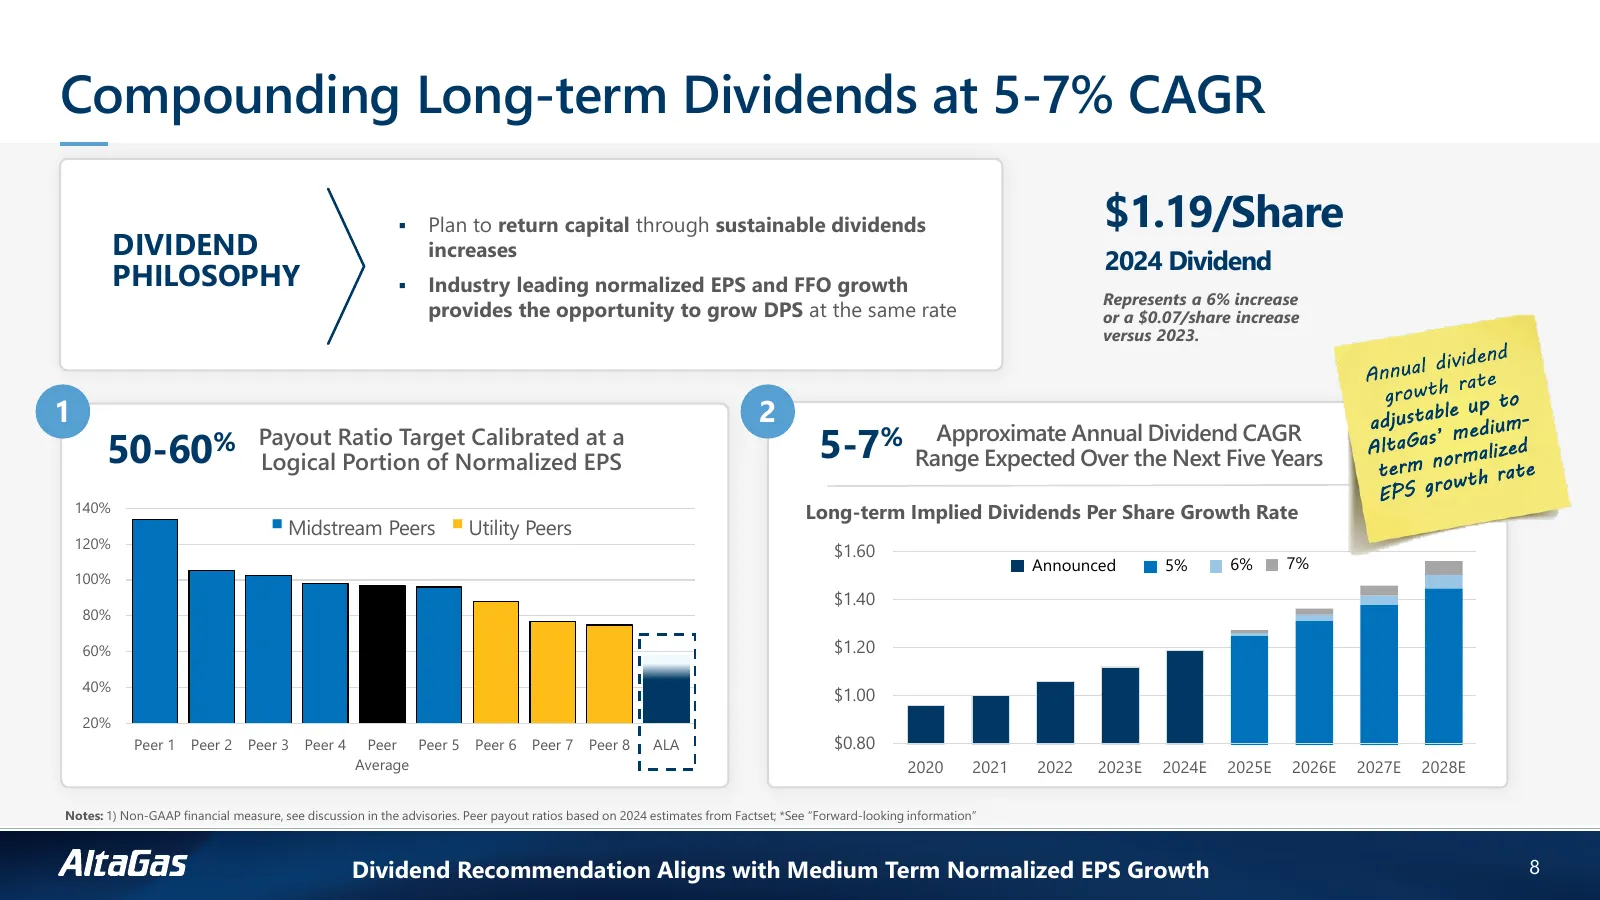
Slide 8: Compounding Long-term Dividends at 5-7% CAGR
Compounding Long-term Dividends at 5-7% CAGR Plan to return capital through sustainable dividends $1.19/Share DIVIDEND increases 2024 Dividend PHILOSOPHY Industry leading normalized EPS and FFO growth Represents a 6% increase provides the opportunity to grow DPS at the same rate or a $0.07/share
Slide 9: Strong Investment Capacity
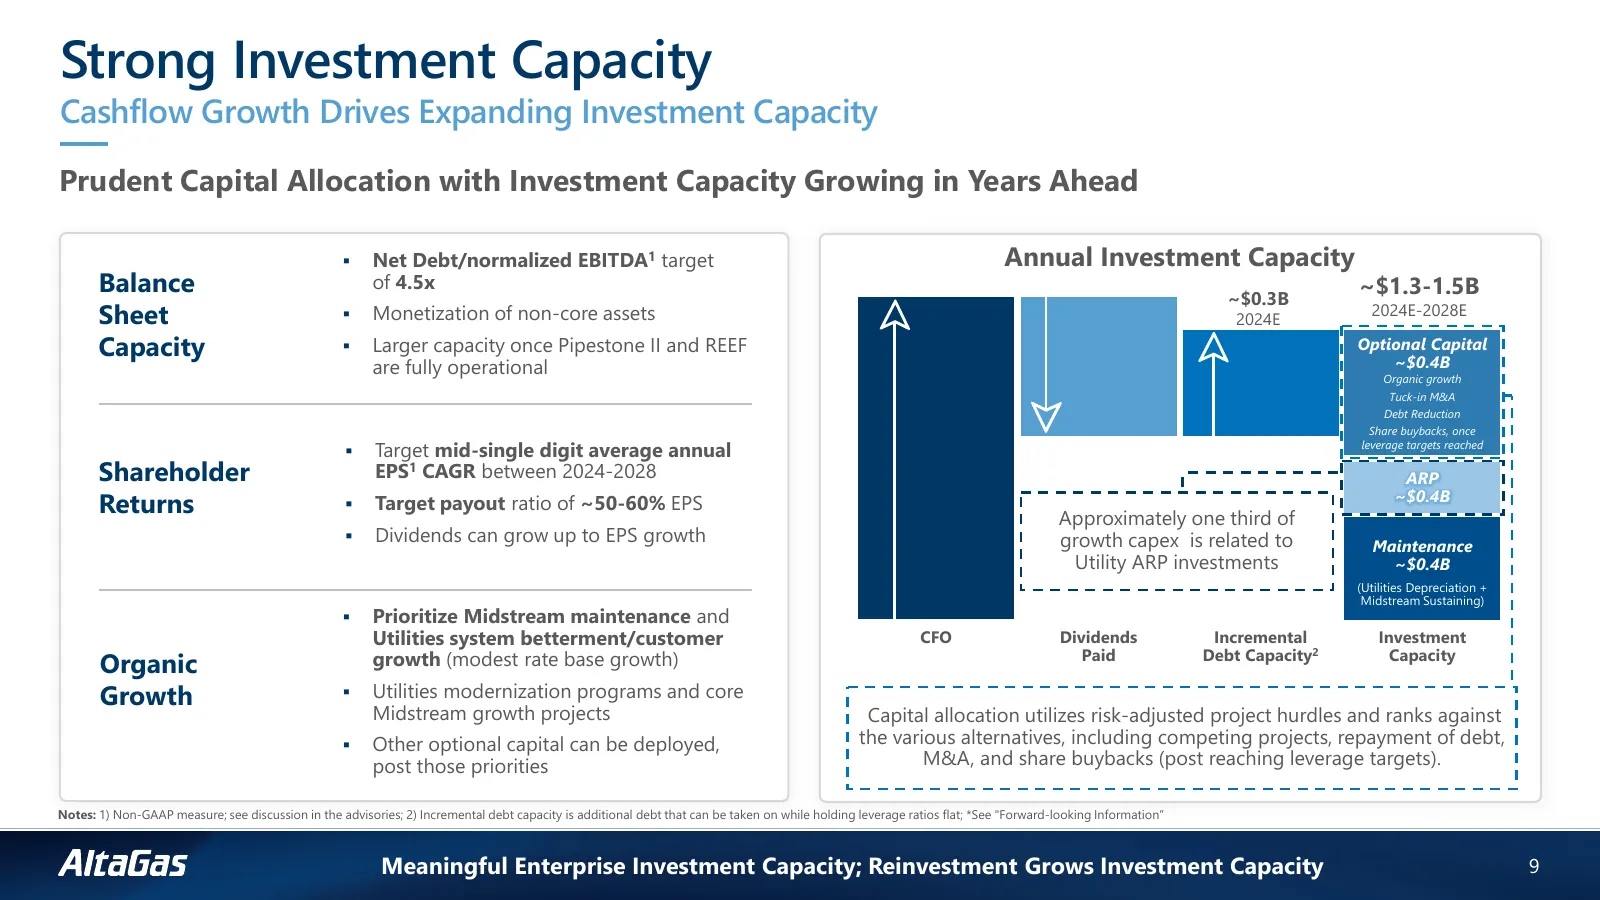
Strong Investment Capacity Cashflow Growth Drives Expanding Investment Capacity Prudent Capital Allocation with Investment Capacity Growing in Years Ahead Net Debt/normalized EBITDA1 target Annual Investment Capacity Balance of 4.5x ~$0.3B ~$1.3-1.5B Sheet Monetization of non-core assets 2024E 2
Slide 10: Capital Allocation Framework
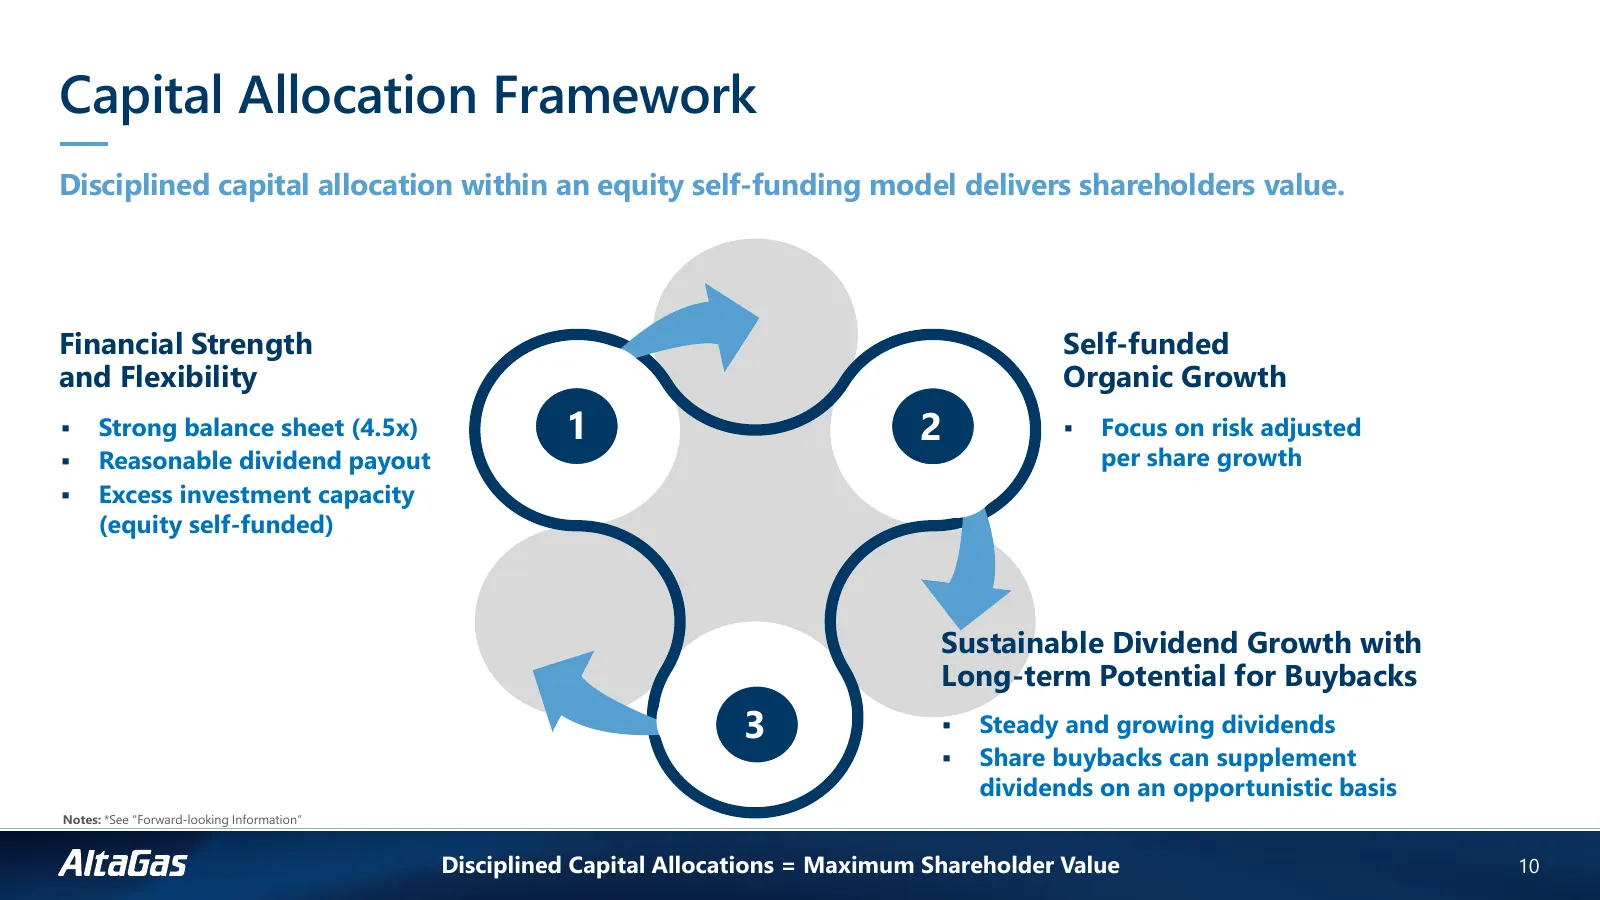
Capital Allocation Framework Disciplined capital allocation within an equity self-funding model delivers shareholders value. Financial Strength Self-funded and Flexibility Organic Growth Strong balance sheet (4.5x) 1 2 Focus on risk adjusted Reasonable dividend payout per share growth Excess
Slide 11: Balance Sheet is Structured to Weather the Current Environment
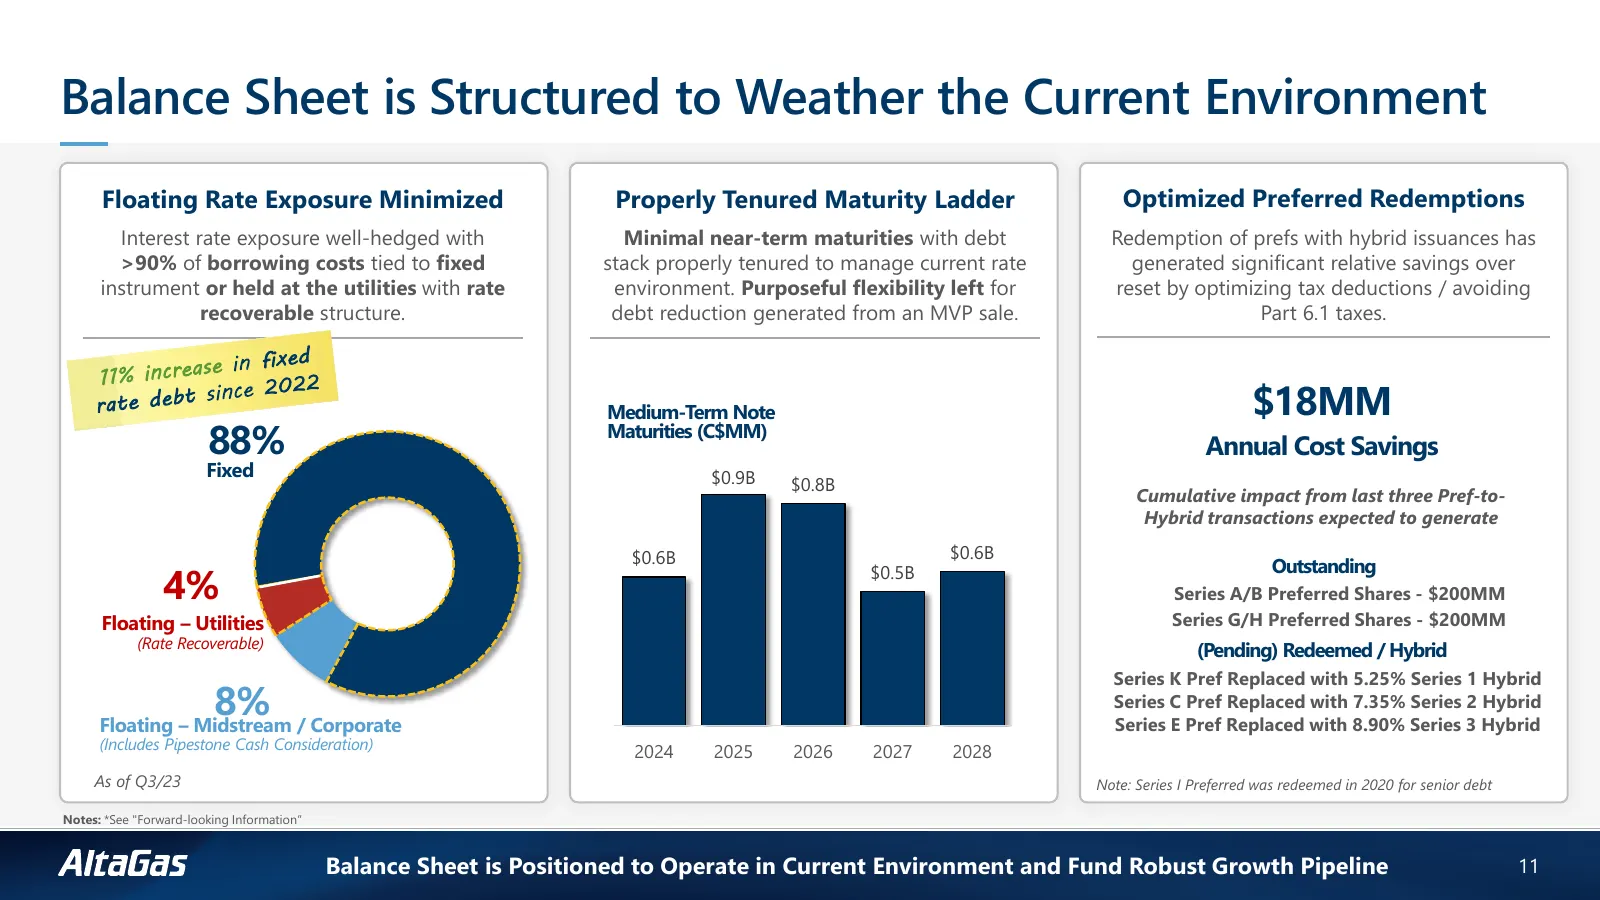
Balance Sheet is Structured to Weather the Current Environment Floating Rate Exposure Minimized Properly Tenured Maturity Ladder Optimized Preferred Redemptions Interest rate exposure well-hedged with Minimal near-term maturities with debt Redemption of prefs with hybrid issuances has >90% of borrow
Slide 12: Driving Towards Our Targeted Capital Structure
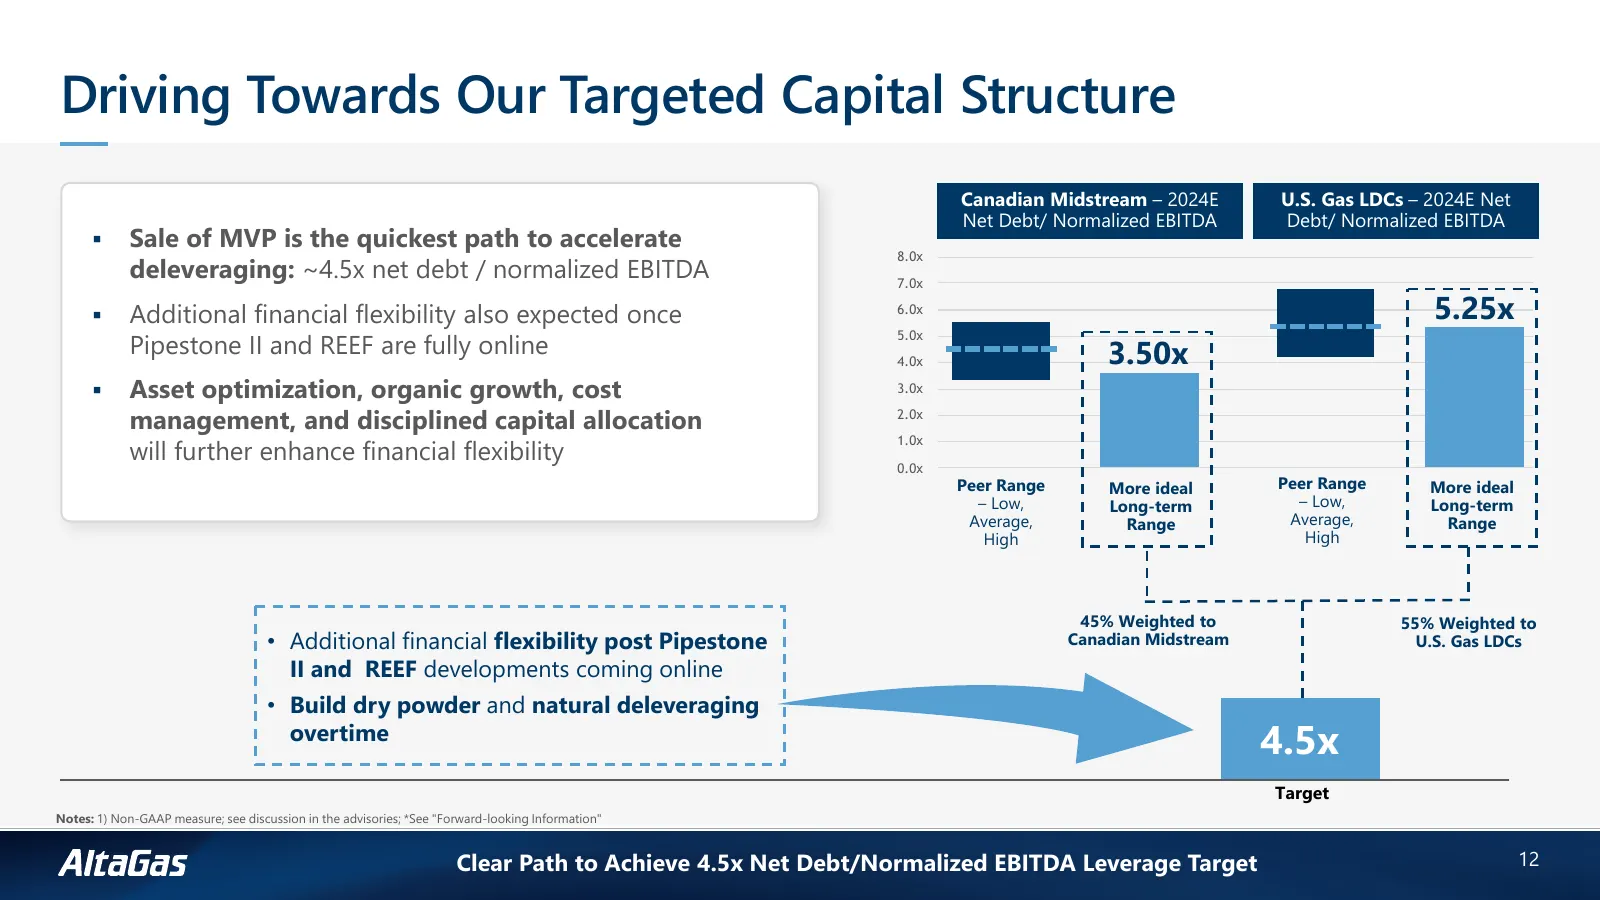
Driving Towards Our Targeted Capital Structure Canadian Midstream – 2024E U.S. Gas LDCs – 2024E Net Net Debt/ Normalized EBITDA Debt/ Normalized EBITDA Sale of MVP is the quickest path to accelerate deleveraging: ~4.5x net debt / normalized EBITDA 8.0x 7.0x Additional financial flexibility also
Slide 13: Commercial De-risking will Drive Long-term Value
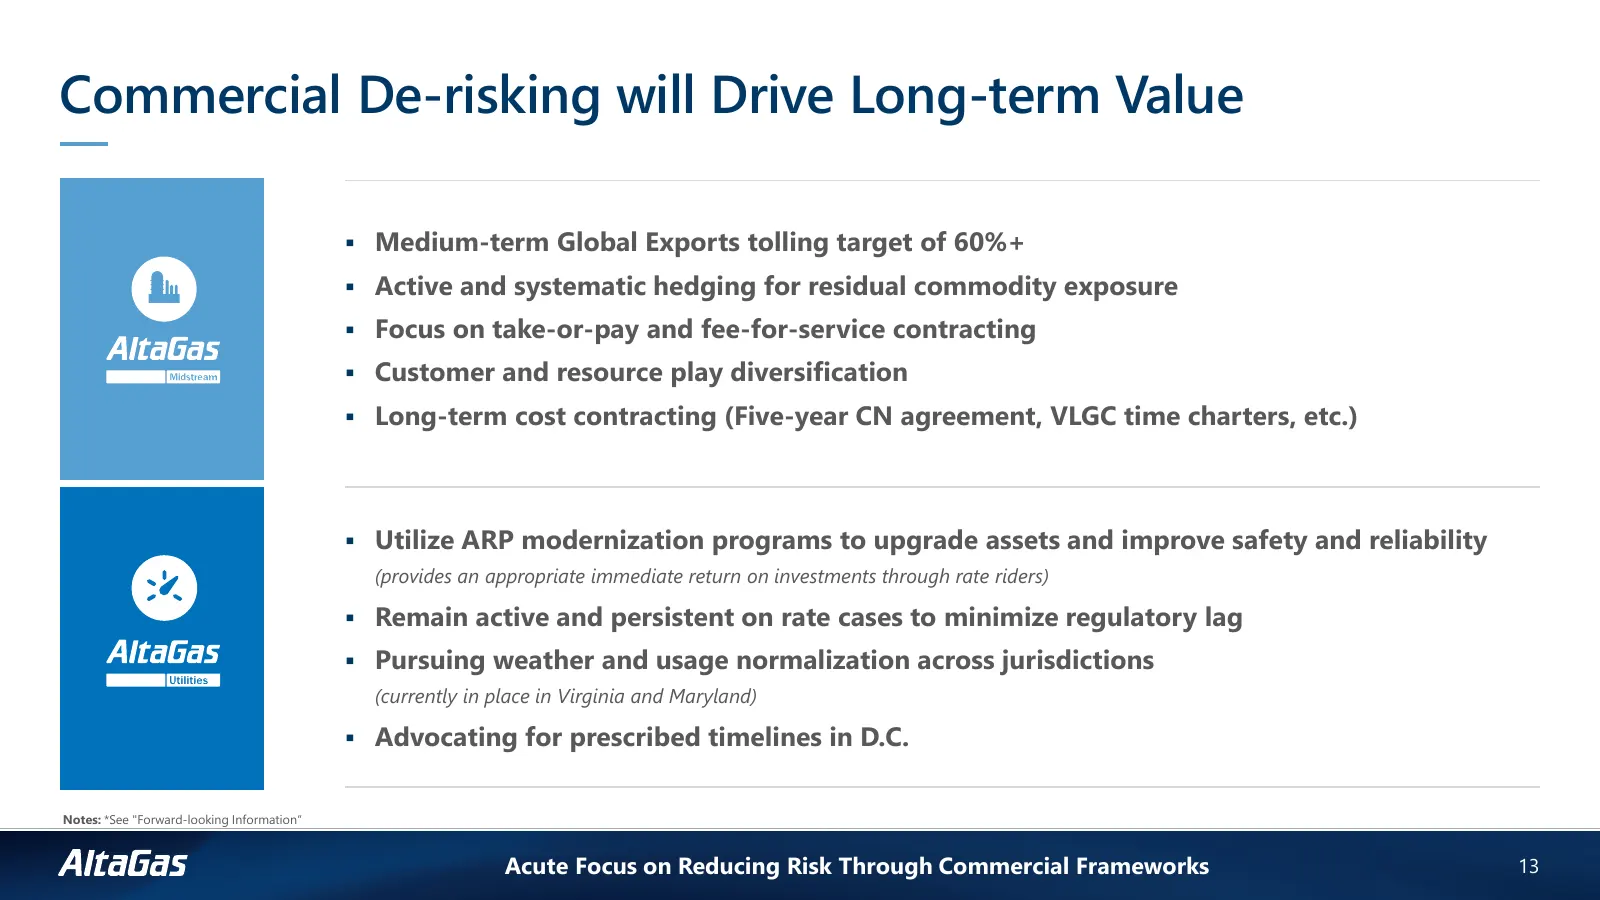
Commercial De-risking will Drive Long-term Value Medium-term Global Exports tolling target of 60%+ Active and systematic hedging for residual commodity exposure Focus on take-or-pay and fee-for-service contracting Customer and resource play diversification Long-term cost contracting (Five-
Slide 14: Delivering on Core Objectives
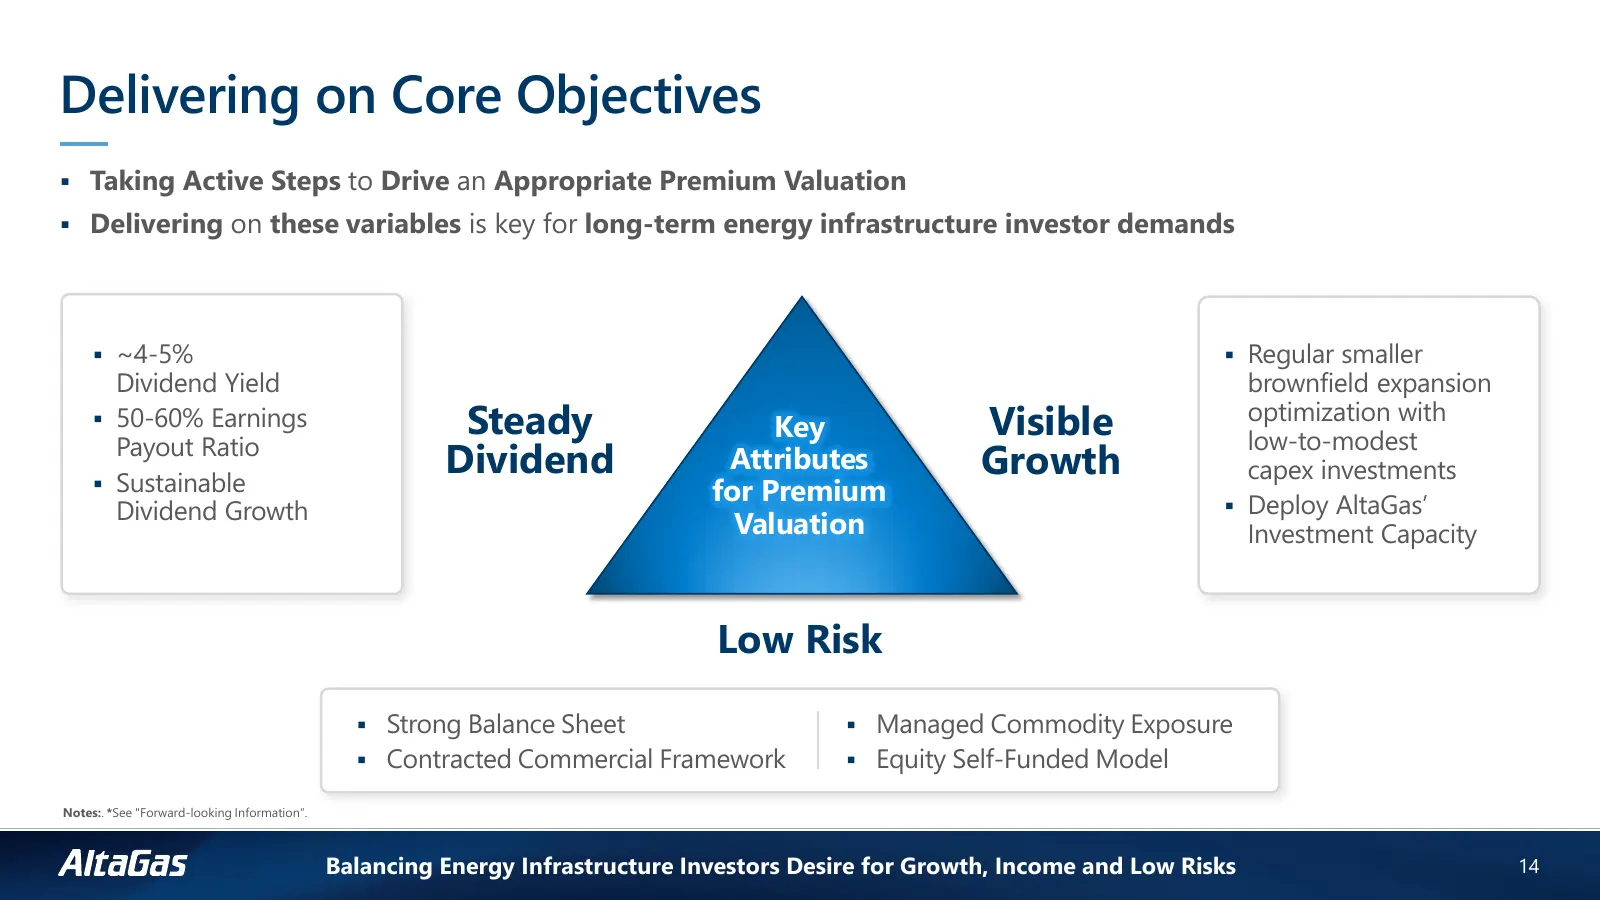
Delivering on Core Objectives Taking Active Steps to Drive an Appropriate Premium Valuation Delivering on these variables is key for long-term energy infrastructure investor demands ~4-5% Regular smaller Dividend Yield brownfield expansion 50-60% Earnings Steady Key Visible optimization wi
Slide 15: ESG Goals and Performance
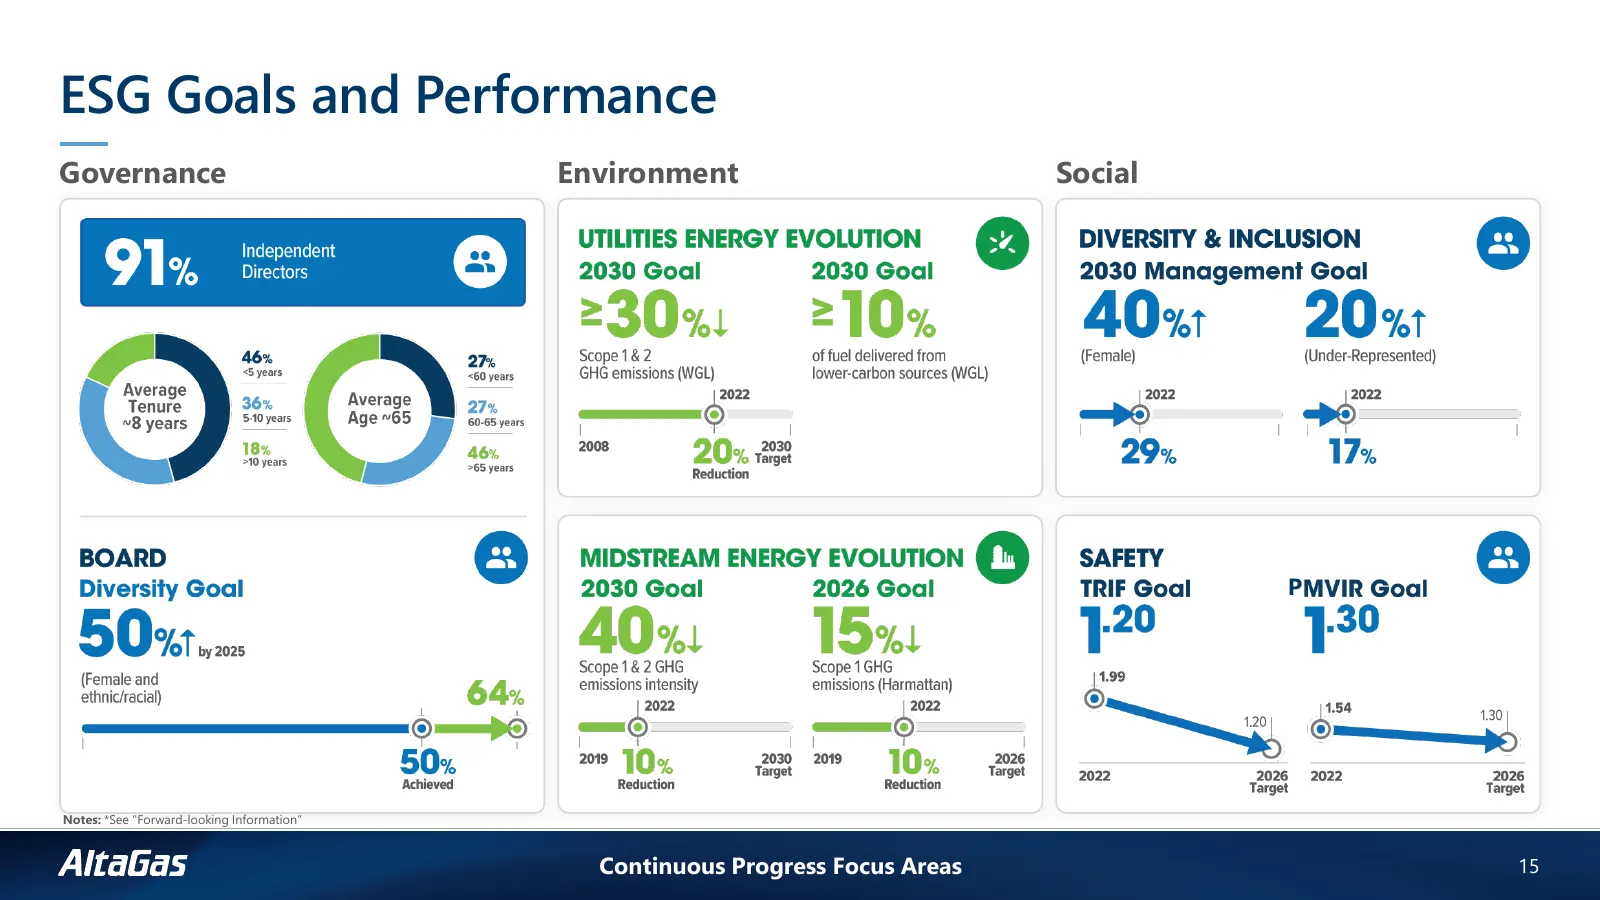
ESG Goals and Performance Governance Environment Social w P Notes: *See "Forward-looking Information“ Continuous Progress Focus Areas 15
Slide 16: Continuing the Longer-term Journey of Compounding
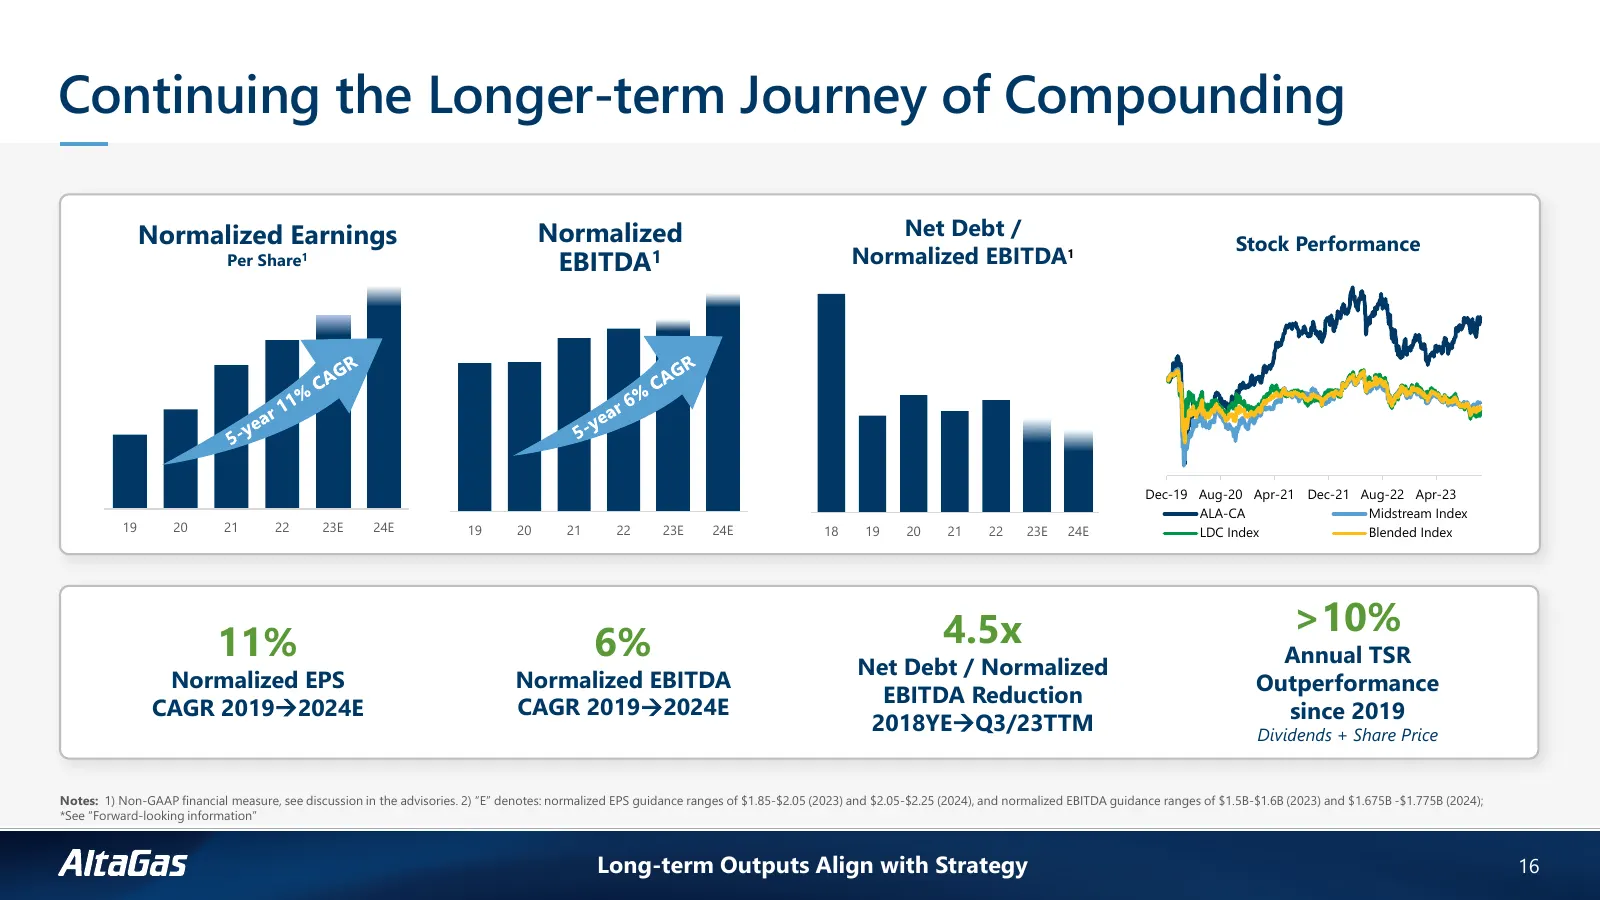
Continuing the Longer-term Journey of Compounding Normalized Earnings Normalized Net Debt / Stock Performance Per Share1 EBITDA1 Normalized EBITDA1 Dec-19 Aug-20 Apr-21 Dec-21 Aug-22 Apr-23 ALA-CA Midstream Index 19 20 21 22 23E 24E 19 20 21 22 23E 24E 18 19 20 21 22 23E 24E LDC Index Blended Index
Slide 17: Macro Set Up
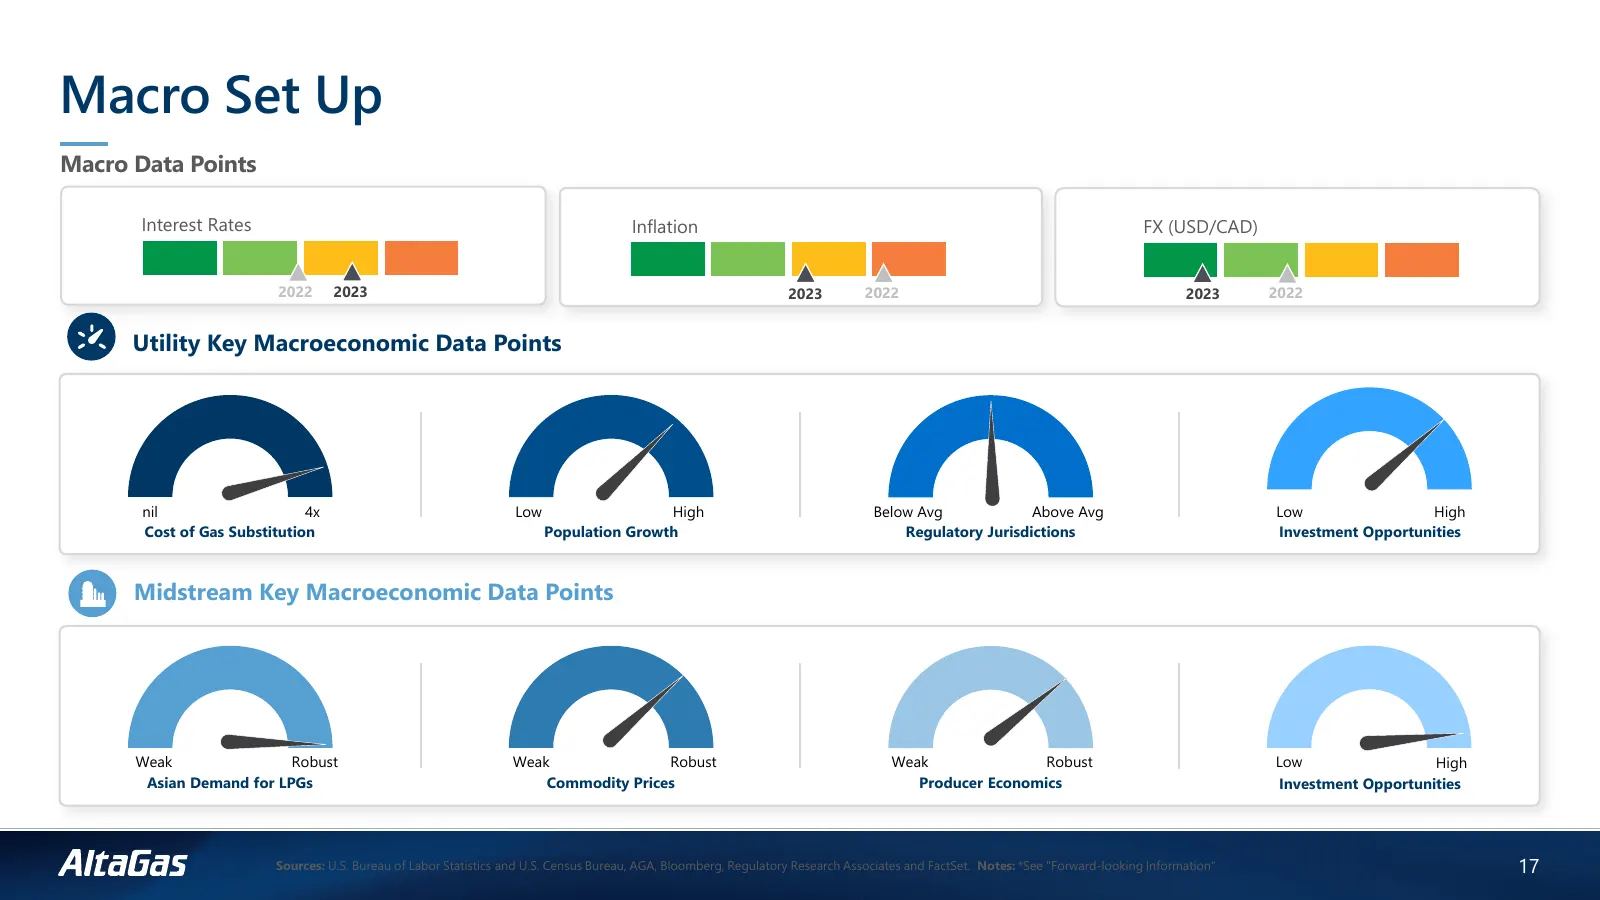
Macro Set Up Macro Data Points Interest Rates Inflation FX (USD/CAD) 2022 2023 2023 2022 2023 2022 Utility Key Macroeconomic Data Points nil 4x Low High Below Avg Above Avg Low High Cost of Gas Substitution Population Growth Regulatory Jurisdictions Investment Opportunities Midstream Key Macroeconom
Slide 18: Global Energy Demand Continues to Compound
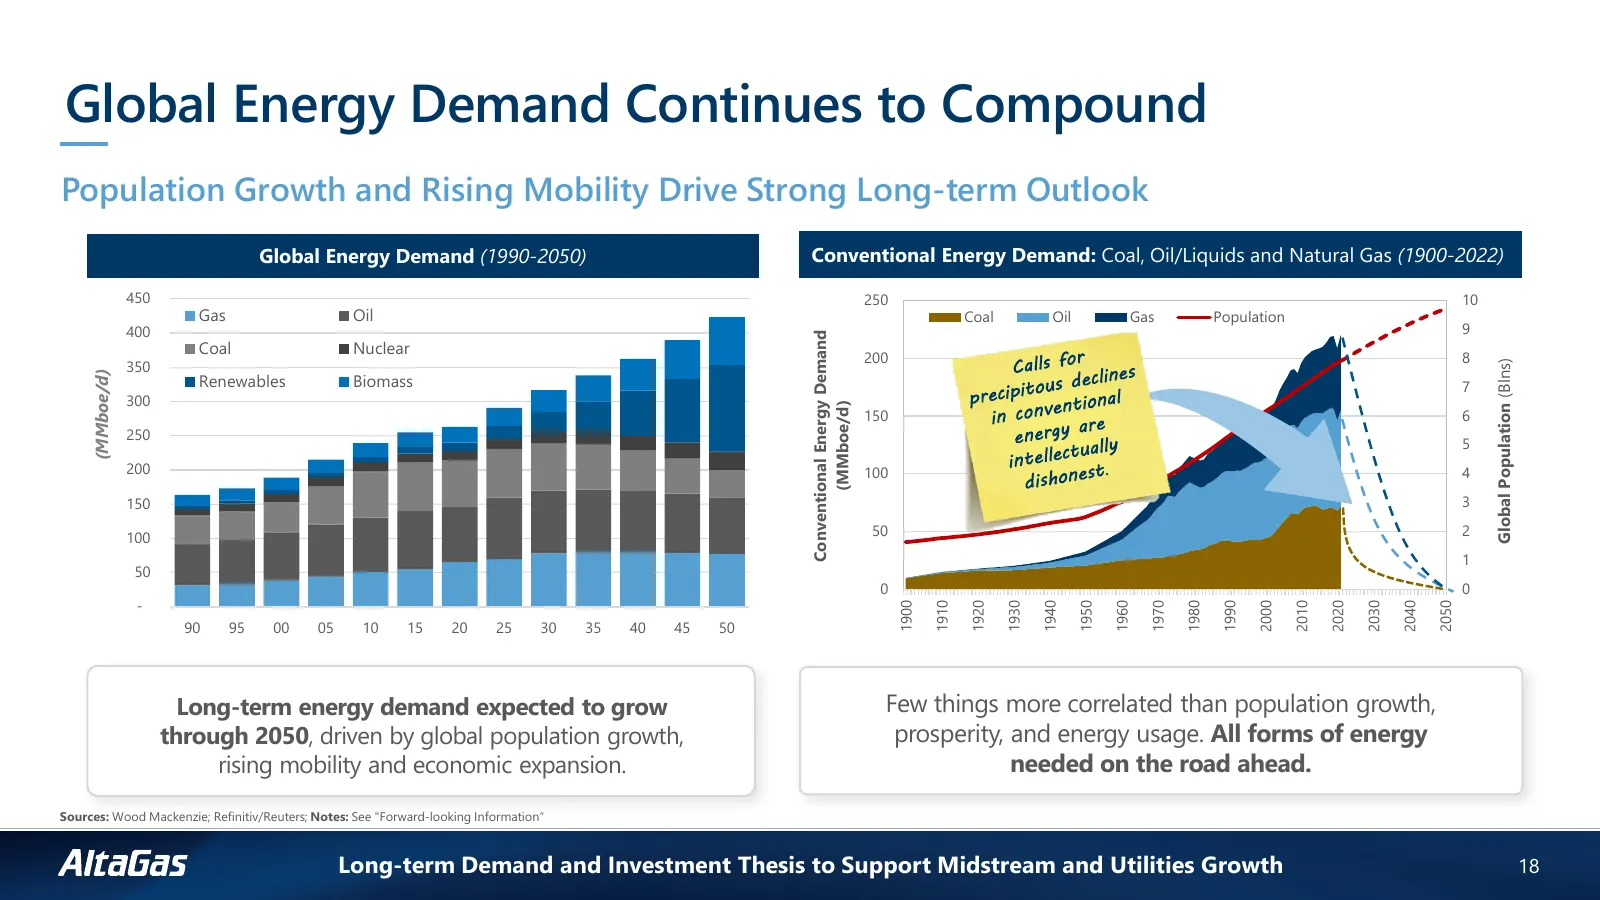
Global Energy Demand Continues to Compound Population Growth and Rising Mobility Drive Strong Long-term Outlook Global Energy Demand (1990-2050) Conventional Energy Demand: Coal, Oil/Liquids and Natural Gas (1900-2022) 450 250 10 Gas Oil Coal Oil Gas Population 400 9 Conventional Energy Demand Coal
Slide 19: Fundamentals for Natural Gas and NGLs are Robust
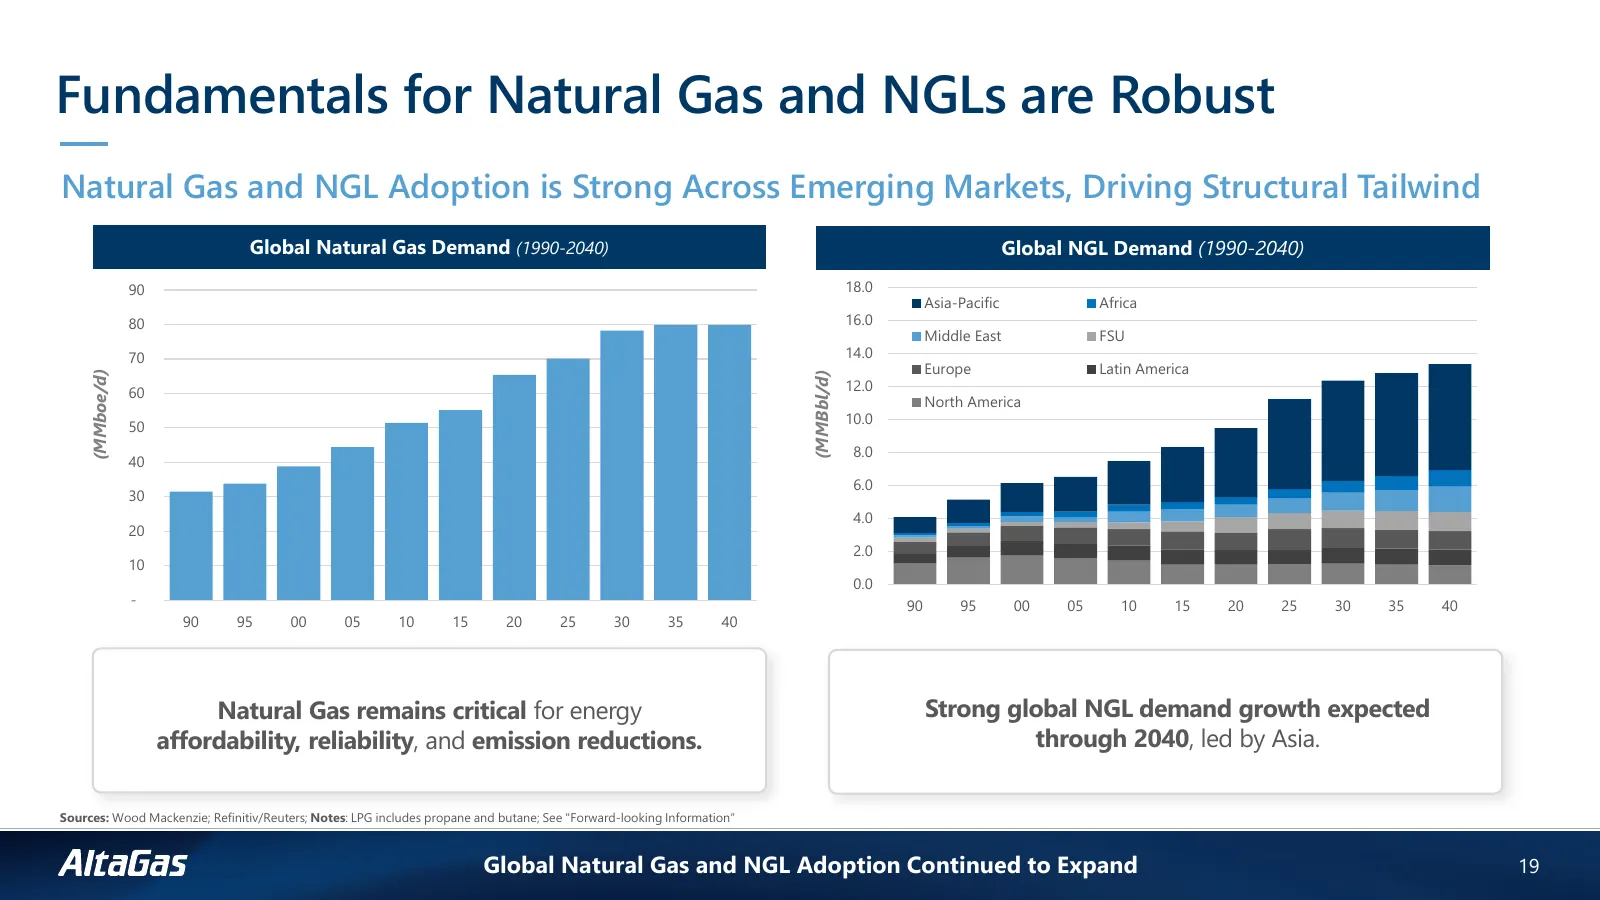
Fundamentals for Natural Gas and NGLs are Robust Natural Gas and NGL Adoption is Strong Across Emerging Markets, Driving Structural Tailwind Global Natural Gas Demand (1990-2040) Global NGL Demand (1990-2040) 90 18.0 Asia-Pacific Africa 80 16.0 Middle East FSU 70 14.0 Europe Latin America (MMboe/d)
Slide 20: Gas Utilities Critical for Long-term Energy Delivery
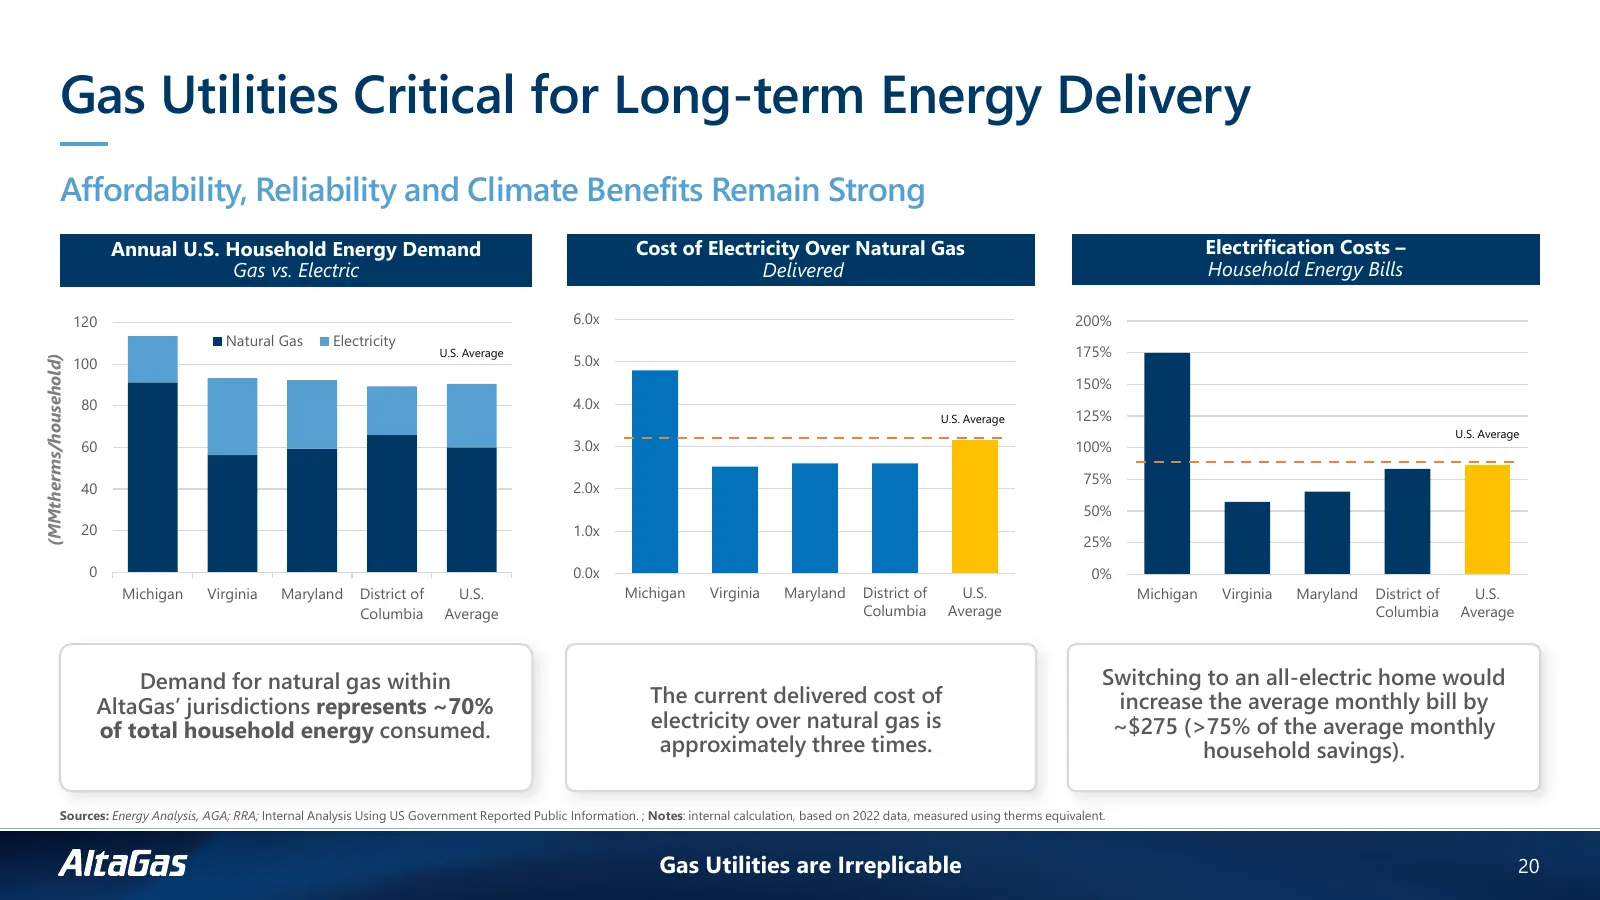
Gas Utilities Critical for Long-term Energy Delivery Affordability, Reliability and Climate Benefits Remain Strong Annual U.S. Household Energy Demand Cost of Electricity Over Natural Gas Electrification Costs – Gas vs. Electric Delivered Household Energy Bills 120 6.0x 200% Natural Gas Electricity
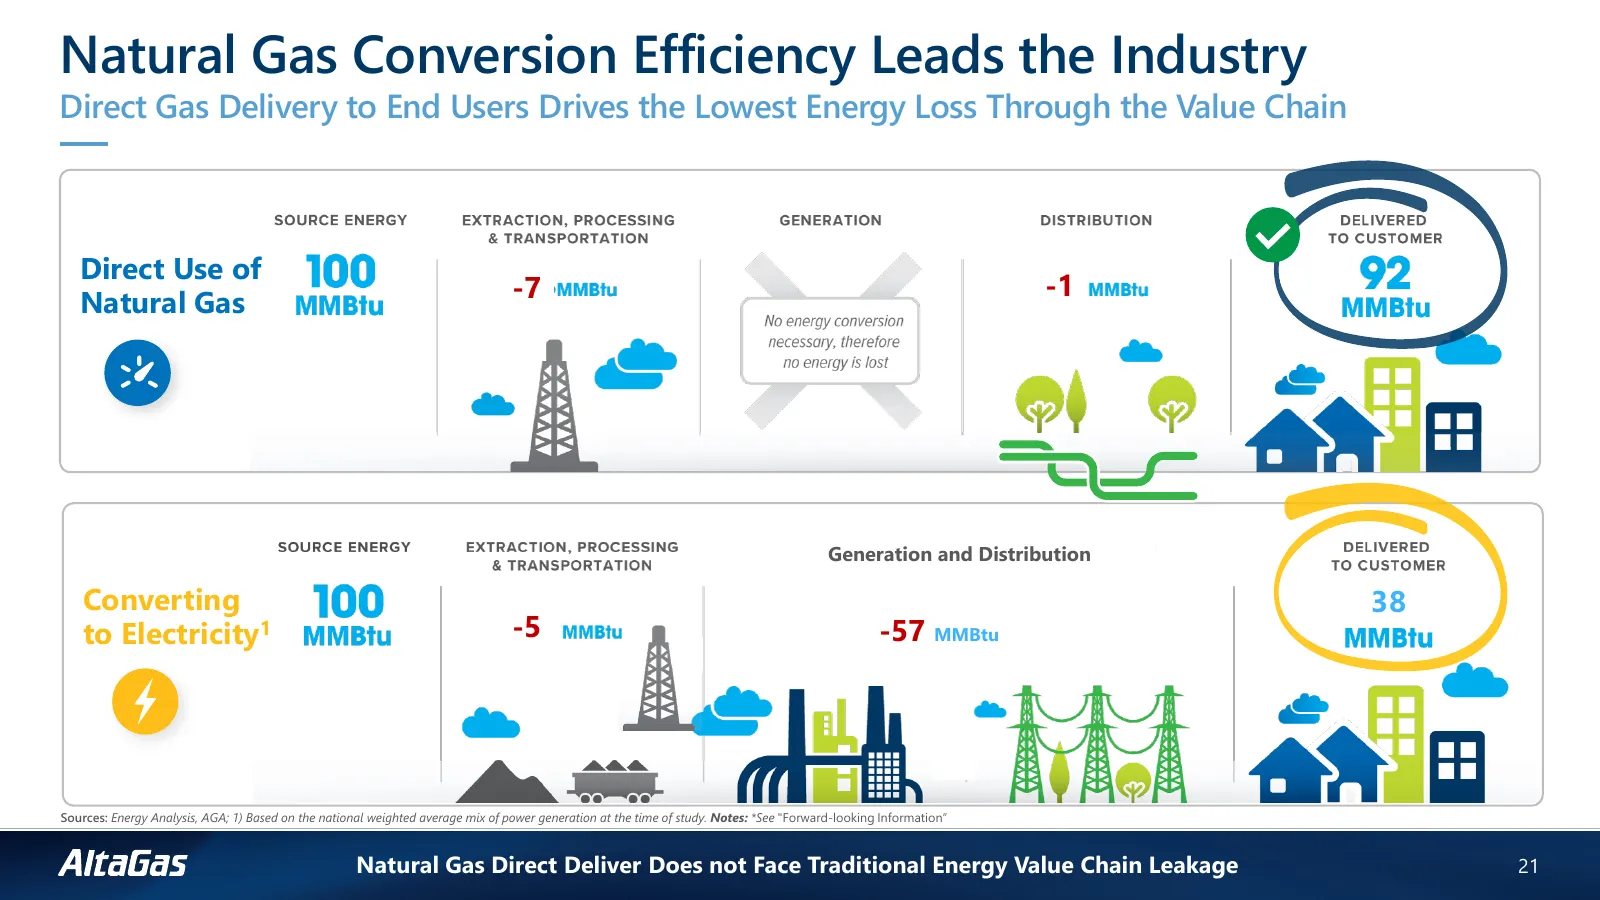
Slide 21: Natural Gas Conversion Efficiency Leads the Industry
Natural Gas Conversion Efficiency Leads the Industry Direct Gas Delivery to End Users Drives the Lowest Energy Loss Through the Value Chain Direct Use of -7 -1 Natural Gas Generation and Distribution Converting 38 to Electricity1 -5 -57 MMBtu Sources: Energy Analysis, AGA; 1) Based on the national w
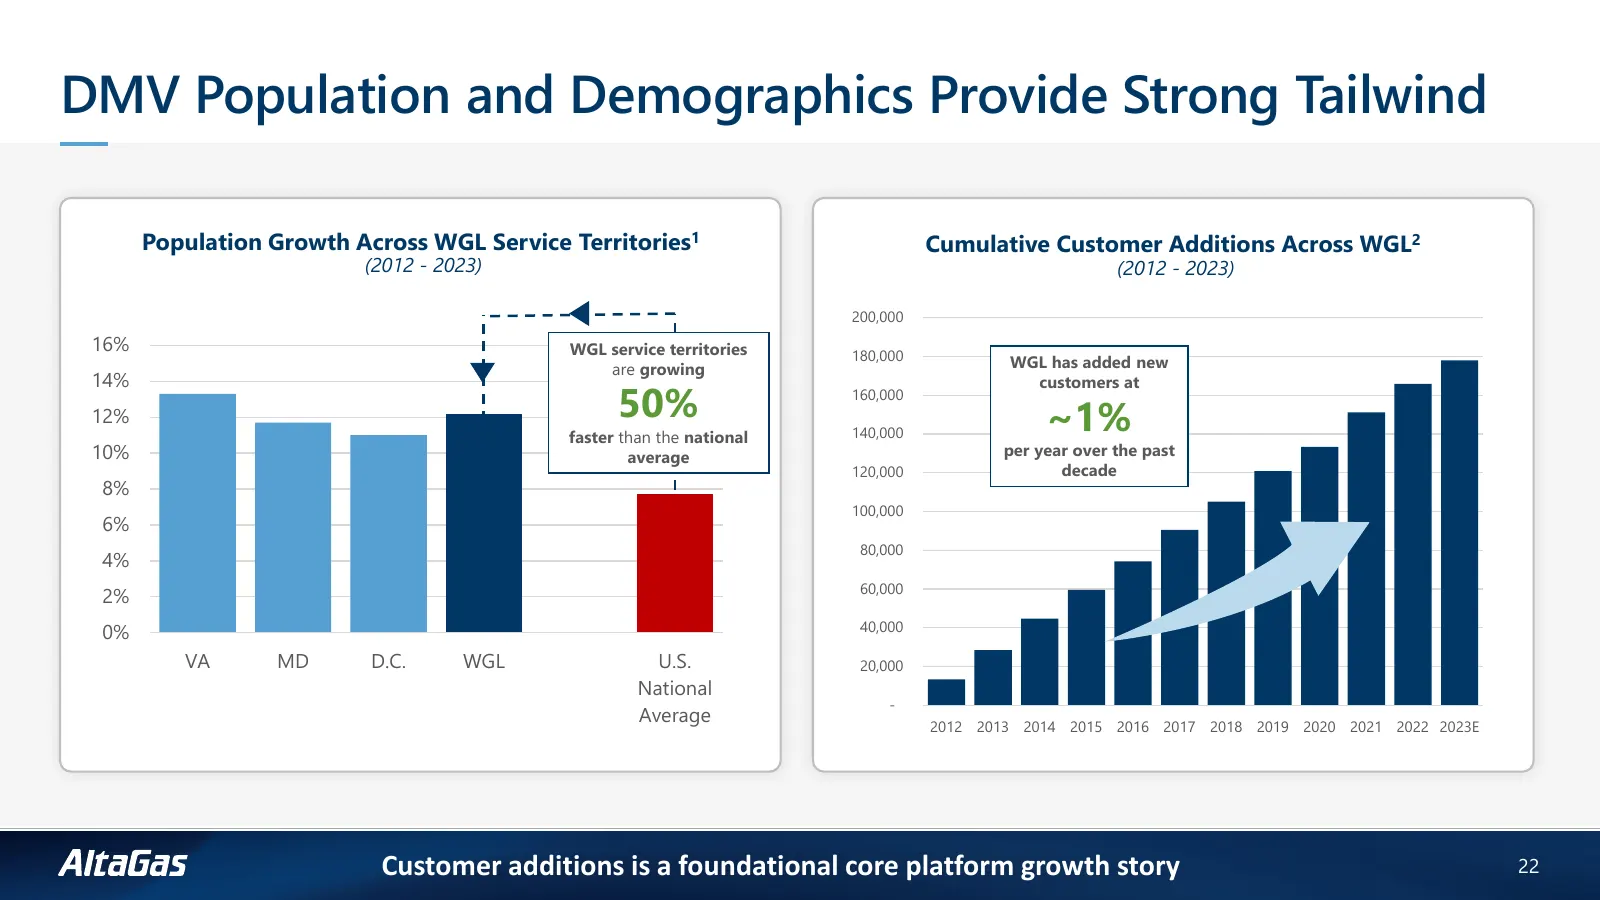
Slide 22: DMV Population and Demographics Provide Strong Tailwind
DMV Population and Demographics Provide Strong Tailwind Population Growth Across WGL Service Territories1 Cumulative Customer Additions Across WGL2 (2012 - 2023) (2012 - 2023) 200,000 16% WGL service territories 180,000 are growing WGL has added new 14% 50% customers at ~1% 160,000 12% faster than t
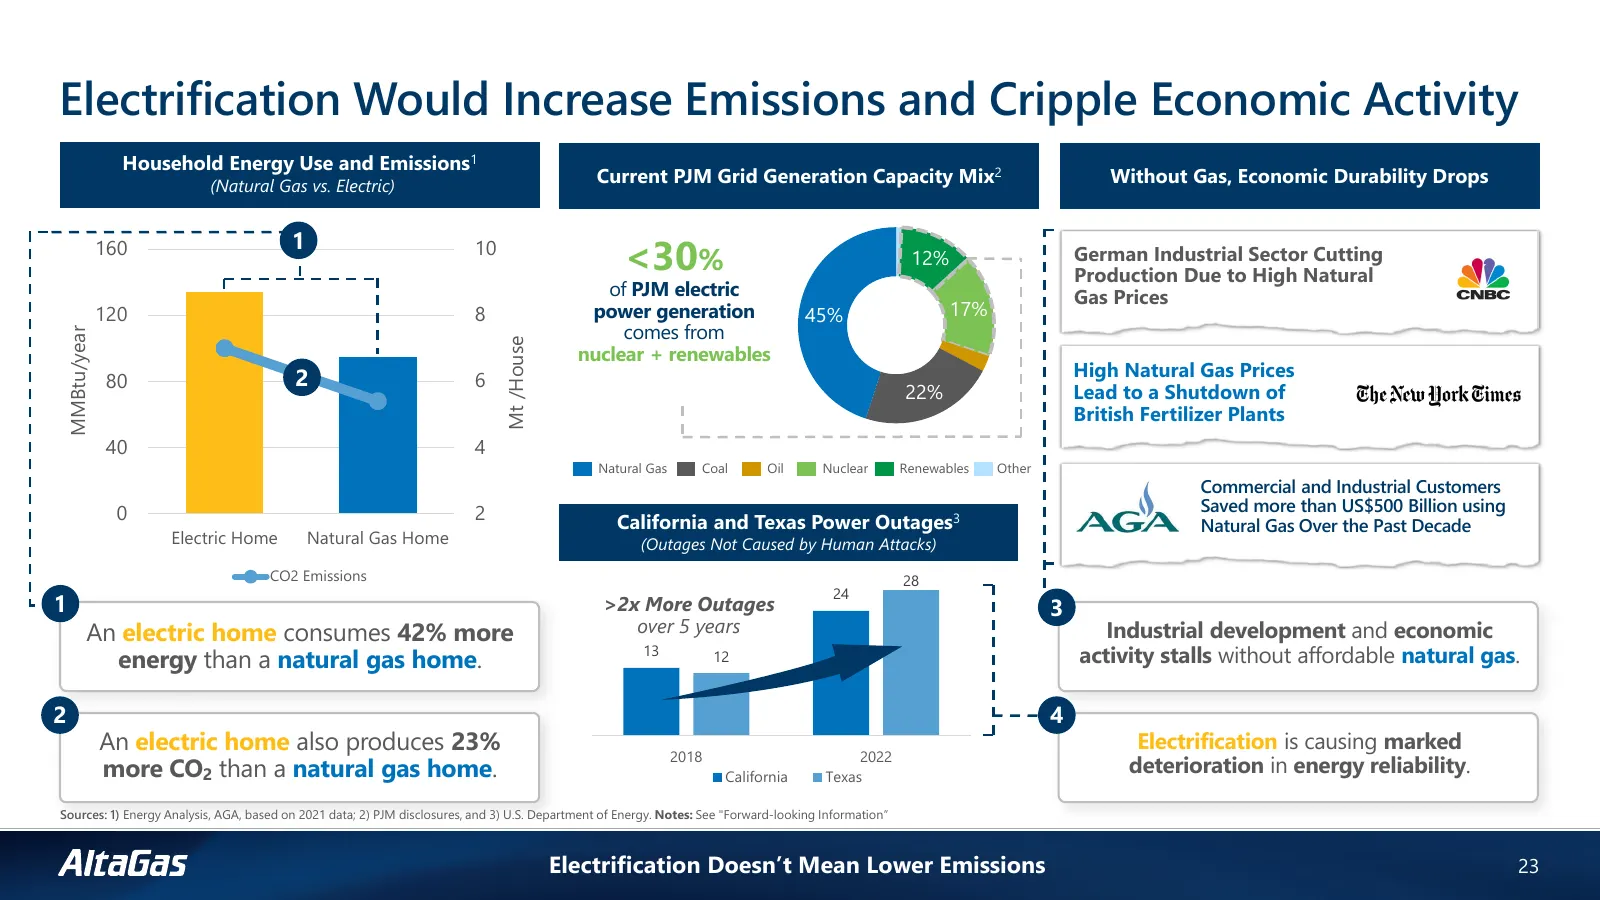
Slide 23: Electrification Would Increase Emissions and Cripple Economic Activity
Electrification Would Increase Emissions and Cripple Economic Activity Household Energy Use and Emissions1 (Natural Gas vs. Electric) Current PJM Grid Generation Capacity Mix2 Without Gas, Economic Durability Drops <30% 160 1 10 12% German Industrial Sector Cutting Production Due to High Natural of
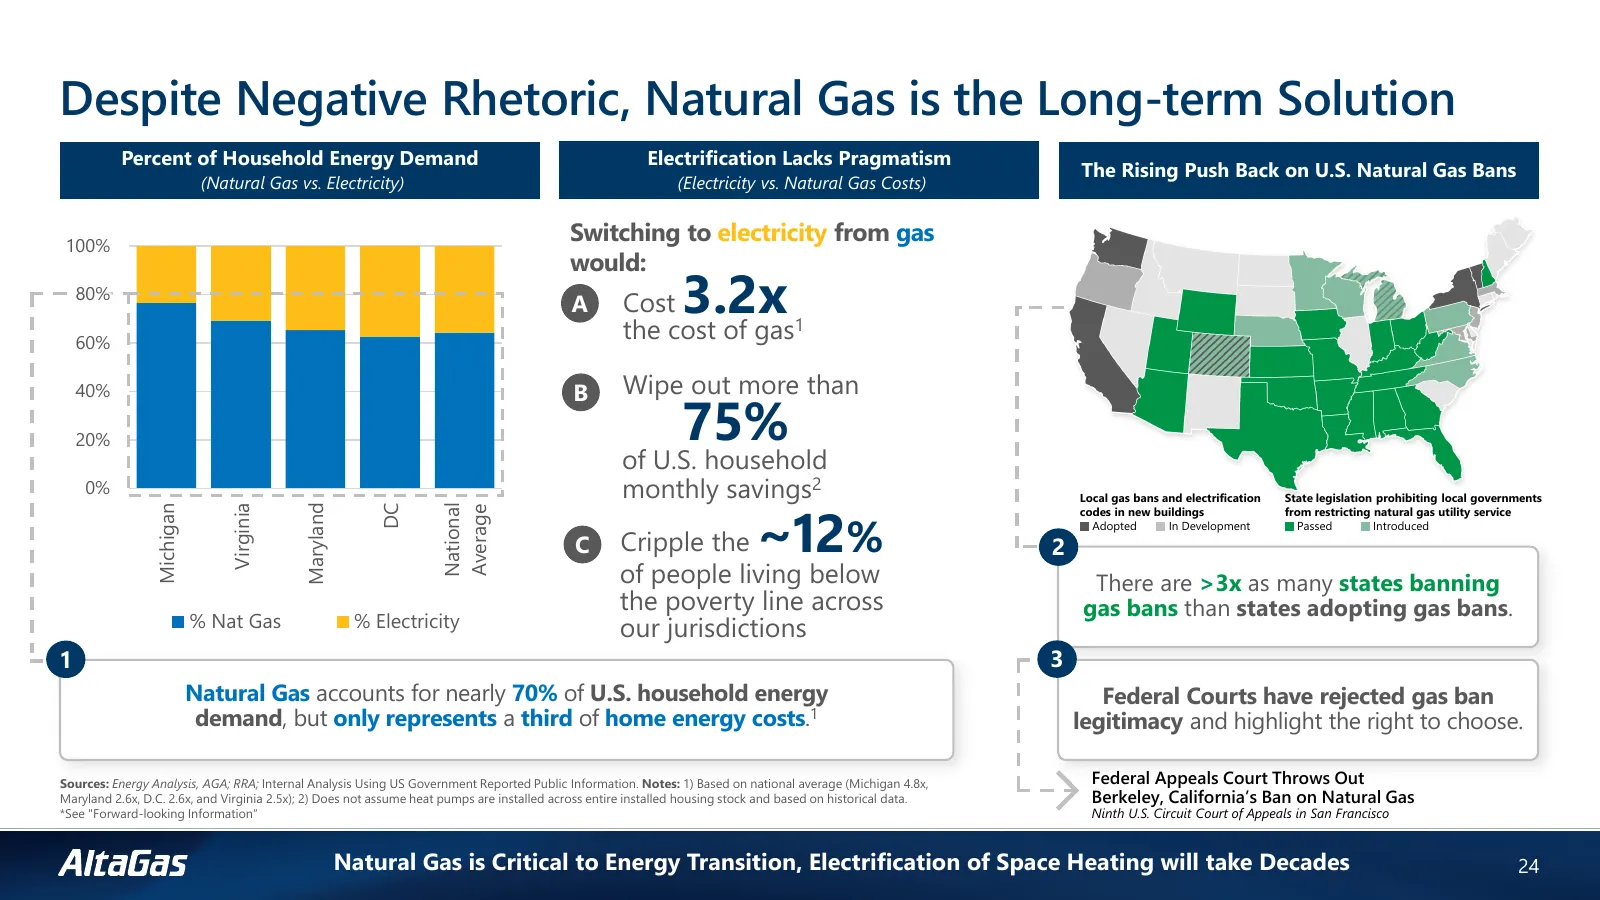
Slide 24: Despite Negative Rhetoric, Natural Gas is the Long-term Solution
Despite Negative Rhetoric, Natural Gas is the Long-term Solution Percent of Household Energy Demand Electrification Lacks Pragmatism The Rising Push Back on U.S. Natural Gas Bans (Natural Gas vs. Electricity) (Electricity vs. Natural Gas Costs) 100% Switching to electricity from gas would: 80% A Cos
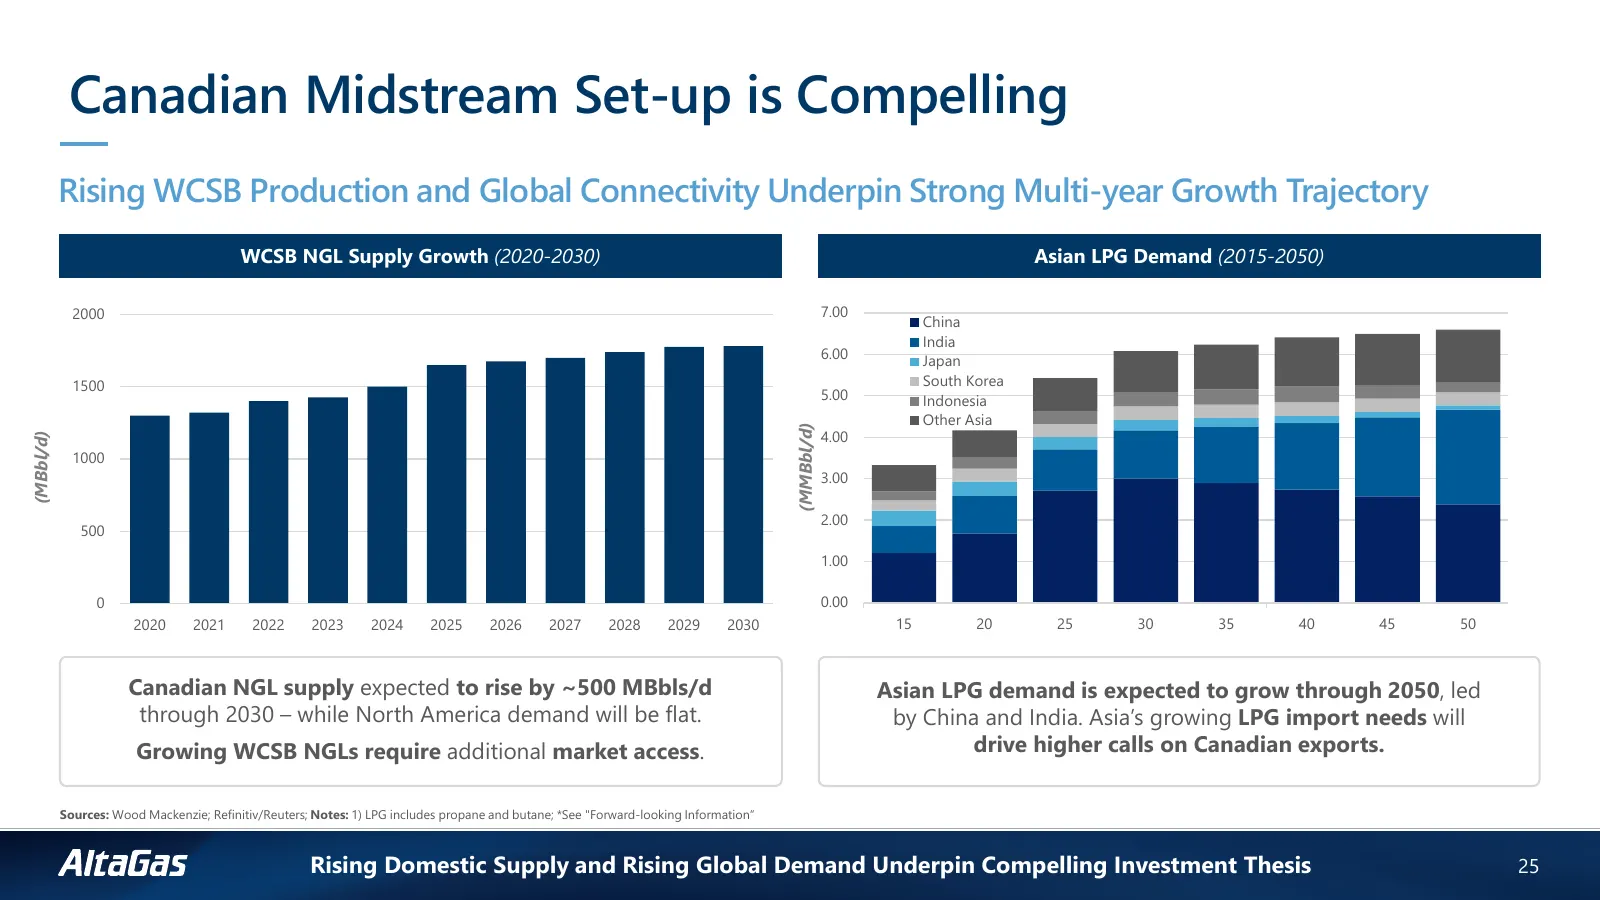
Slide 25: Canadian Midstream Set-up is Compelling
Canadian Midstream Set-up is Compelling Rising WCSB Production and Global Connectivity Underpin Strong Multi-year Growth Trajectory WCSB NGL Supply Growth (2020-2030) Asian LPG Demand (2015-2050) 2000 7.00 China India 6.00 Japan 1500 South Korea 5.00 Indonesia Other Asia 4.00 (MMBbl/d) (MBbl/d) 1000
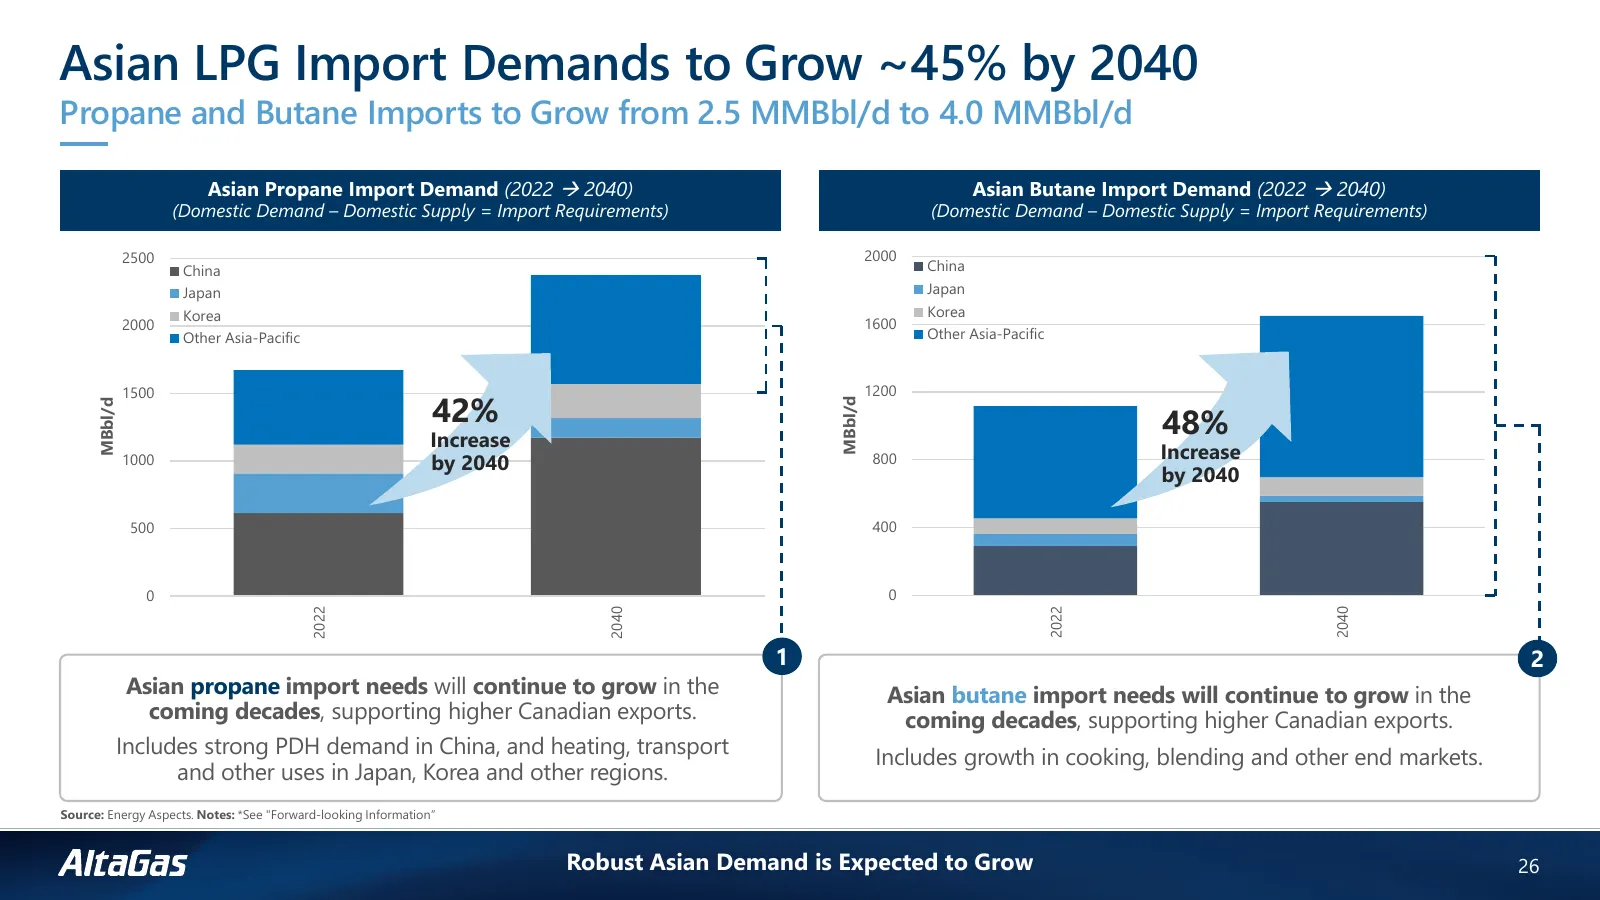
Slide 26: Asian LPG Import Demands to Grow ~45% by 2040
Asian LPG Import Demands to Grow ~45% by 2040 Propane and Butane Imports to Grow from 2.5 MMBbl/d to 4.0 MMBbl/d Asian Propane Import Demand (2022 2040) Asian Butane Import Demand (2022 2040) (Domestic Demand – Domestic Supply = Import Requirements) (Domestic Demand – Domestic Supply = Import Re
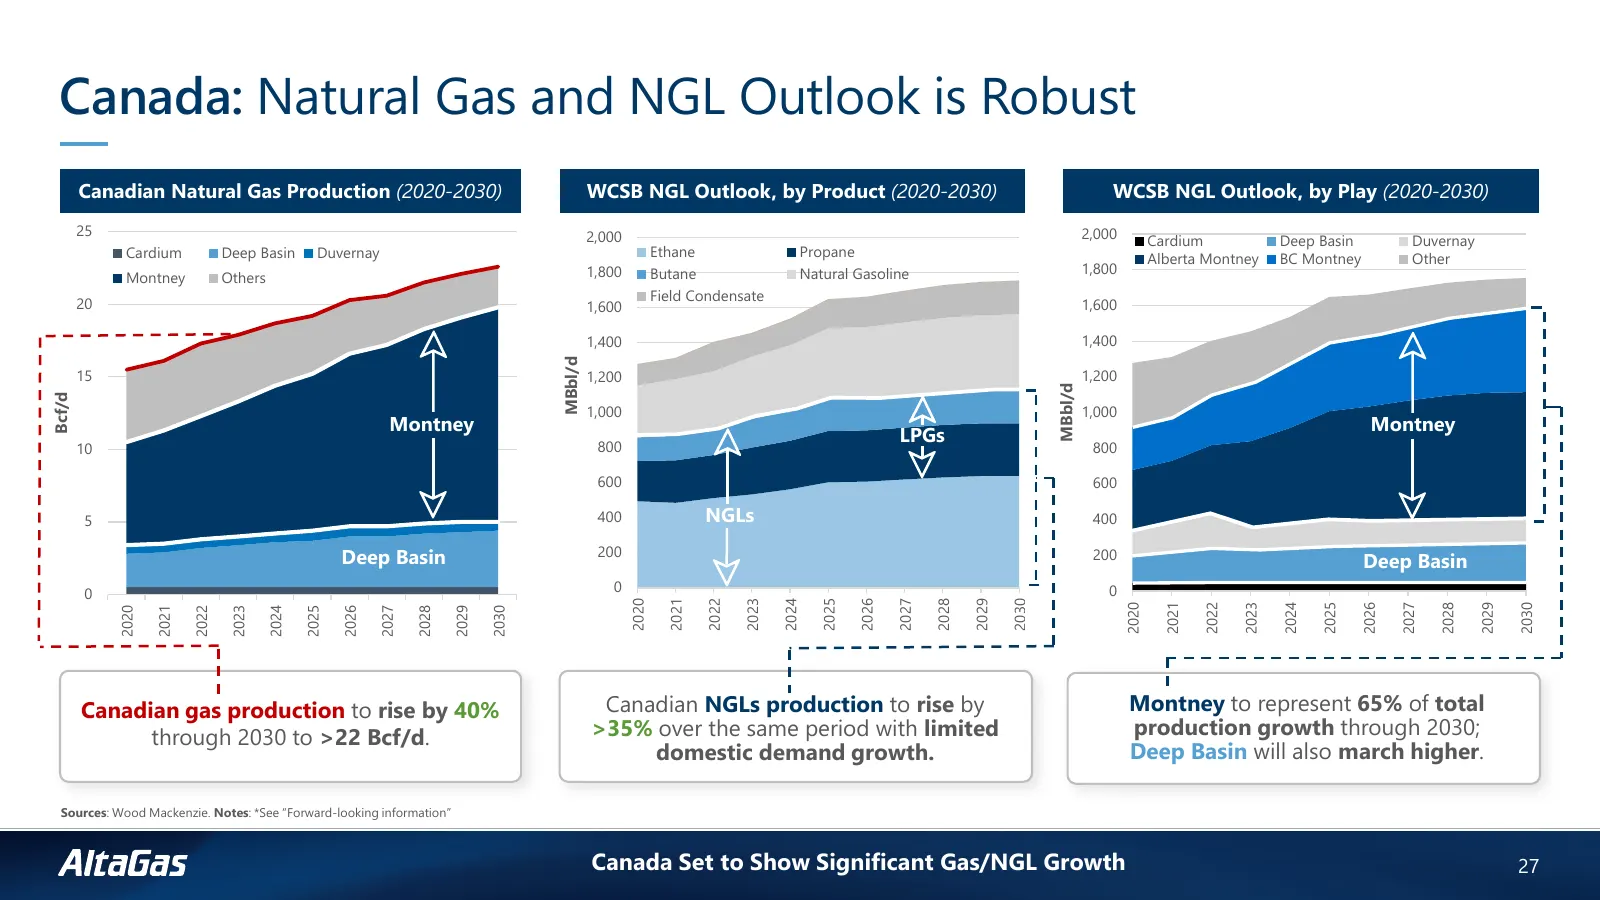
Slide 27: Canada: Natural Gas and NGL Outlook is Robust
Canada: Natural Gas and NGL Outlook is Robust Canadian Natural Gas Production (2020-2030) WCSB NGL Outlook, by Product (2020-2030) WCSB NGL Outlook, by Play (2020-2030) 25 2,000 2,000 Cardium Deep Basin Duvernay Cardium Deep Basin Duvernay Ethane Propane Alberta Montney BC Montney Other 1,800 Butane
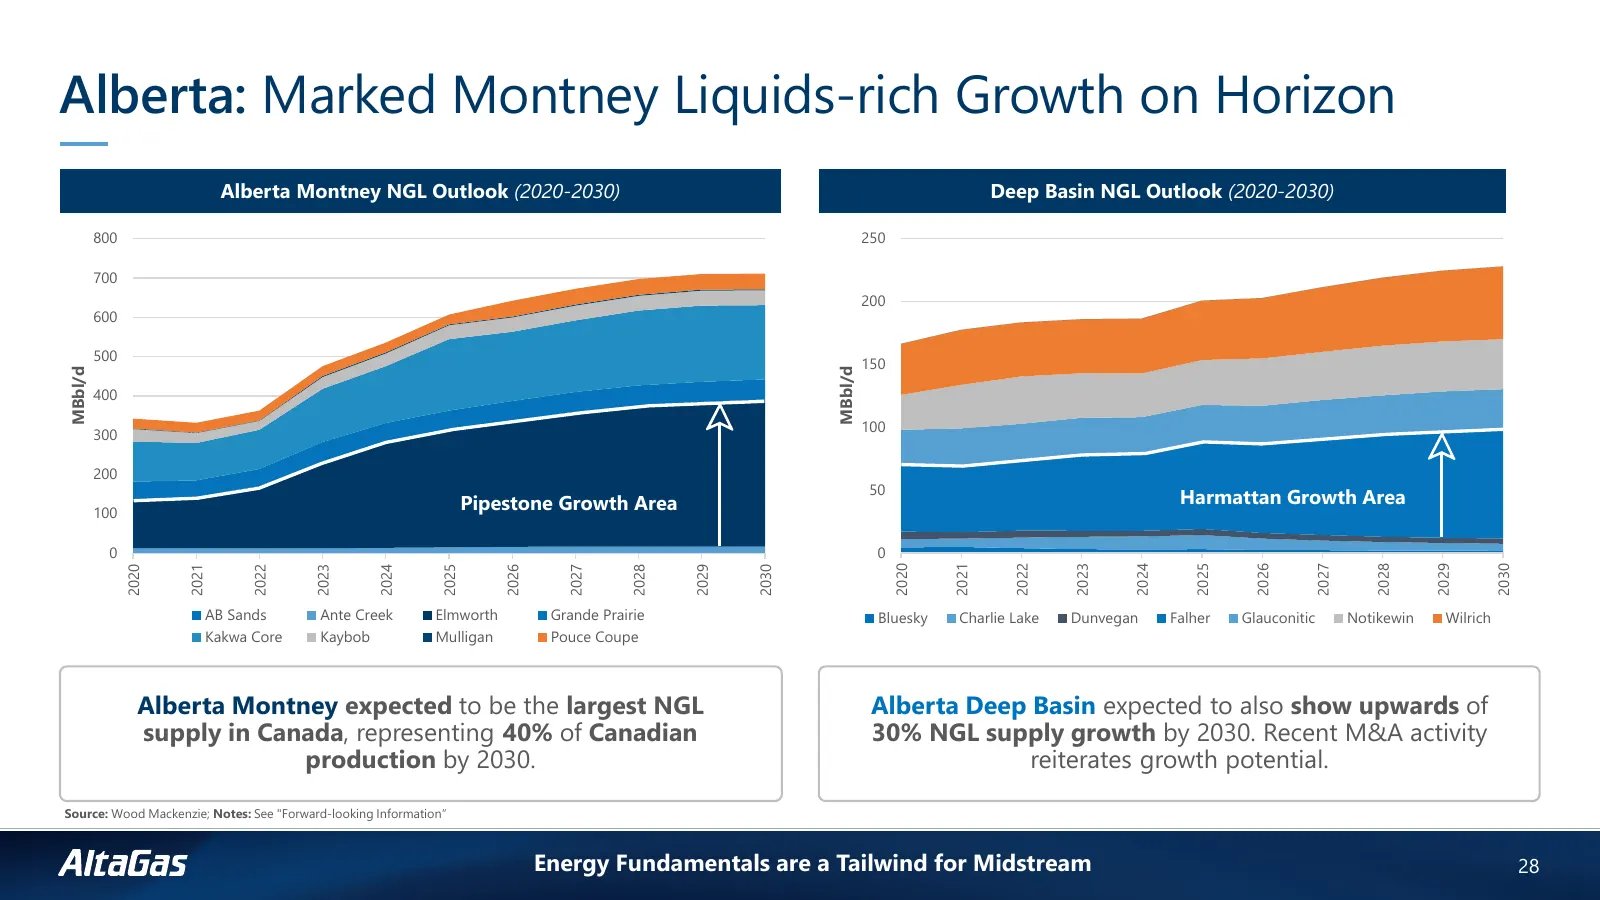
Slide 28: Alberta: Marked Montney Liquids-rich Growth on Horizon
Alberta: Marked Montney Liquids-rich Growth on Horizon Alberta Montney NGL Outlook (2020-2030) Deep Basin NGL Outlook (2020-2030) 800 250 700 200 600 500 150 MBbl/d MBbl/d 400 100 300 200 50 Pipestone Growth Area Harmattan Growth Area 100 0 0 2020 2021 2022 2023 2024 2025 2026 2027 2028 2029 2030 20
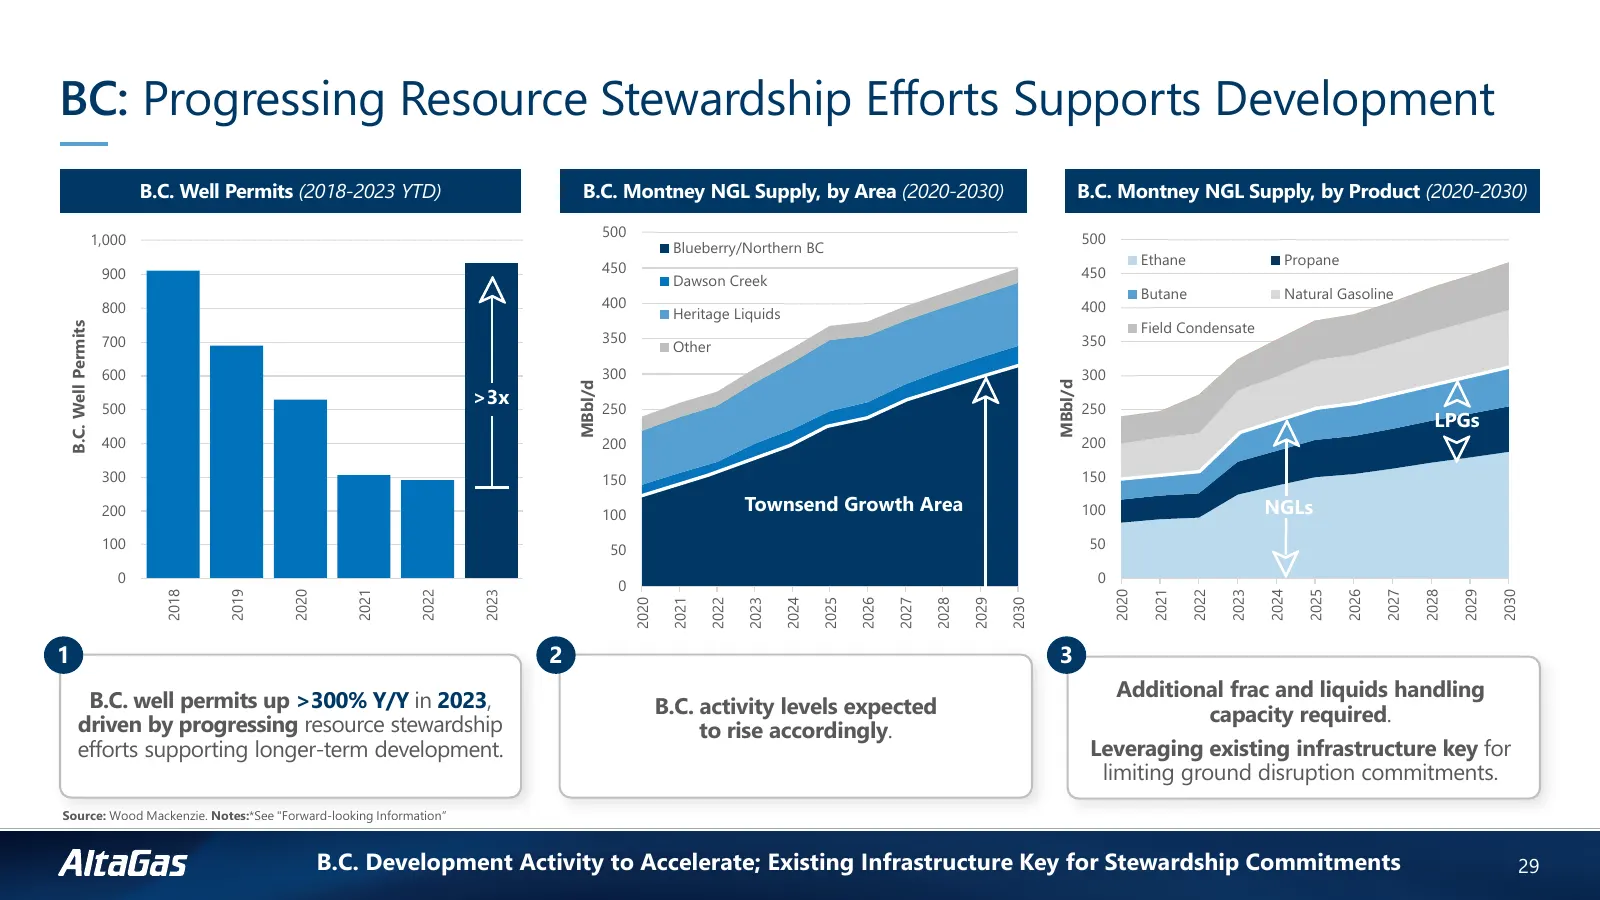
Slide 29: BC: Progressing Resource Stewardship Efforts Supports Development
BC: Progressing Resource Stewardship Efforts Supports Development B.C. Well Permits (2018-2023 YTD) B.C. Montney NGL Supply, by Area (2020-2030) B.C. Montney NGL Supply, by Product (2020-2030) 500 500 1,000 Blueberry/Northern BC 450 Ethane Propane 900 450 Dawson Creek Butane Natural Gasoline 800 400
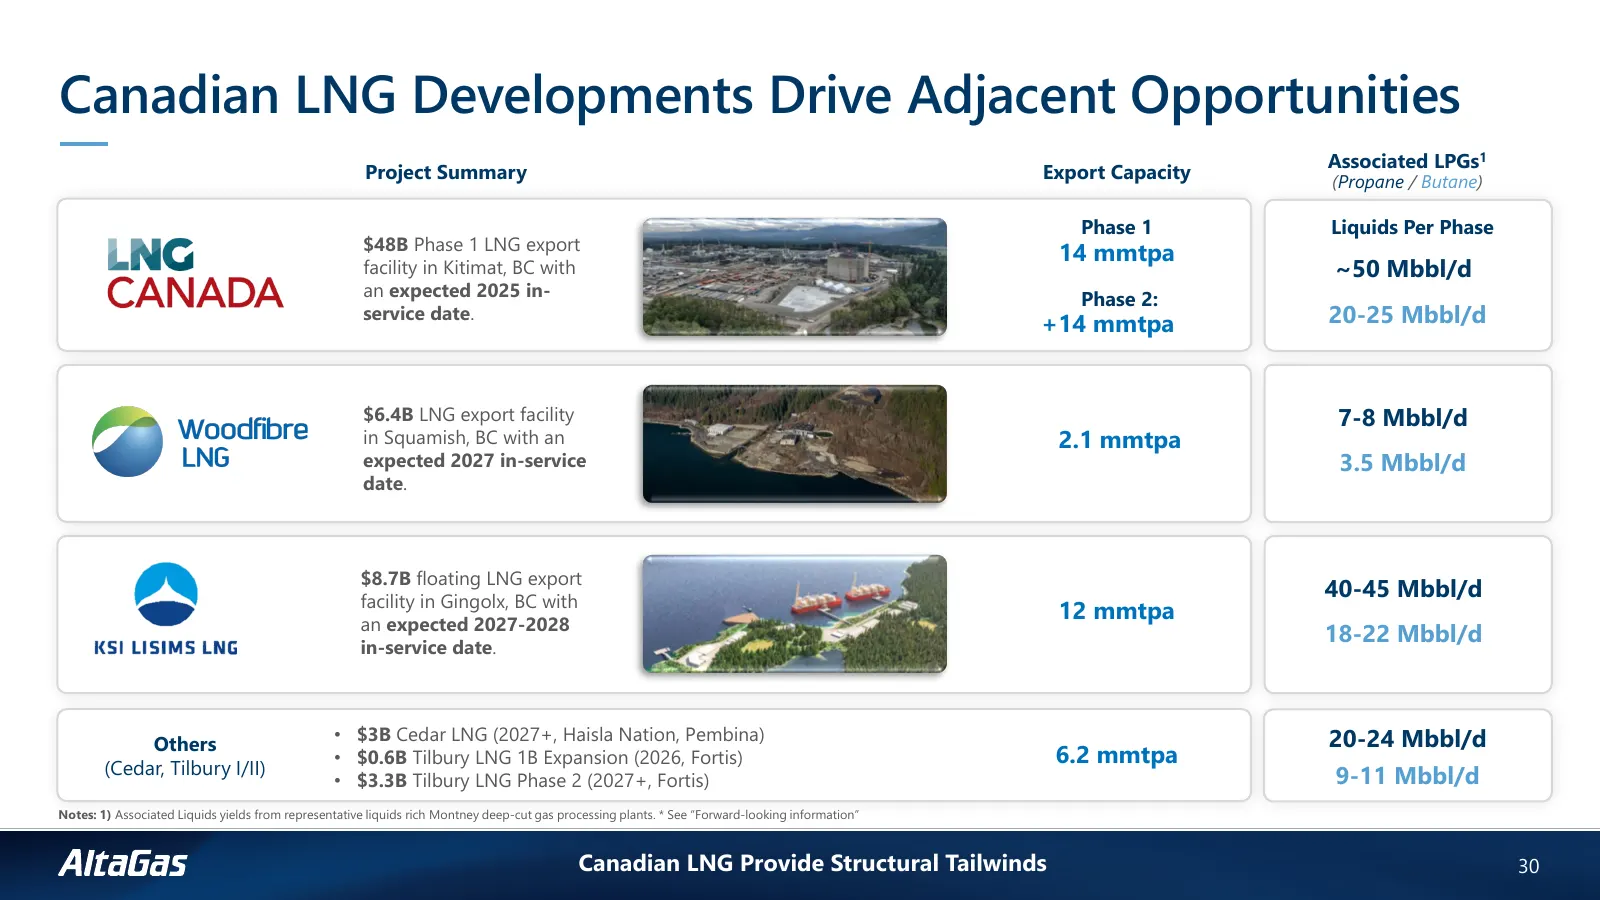
Slide 30: Canadian LNG Developments Drive Adjacent Opportunities
Canadian LNG Developments Drive Adjacent Opportunities Associated LPGs1 Project Summary Export Capacity (Propane / Butane) Phase 1 Liquids Per Phase $48B Phase 1 LNG export 14 mmtpa facility in Kitimat, BC with ~50 Mbbl/d an expected 2025 in- Phase 2: service date. +14 mmtpa 20-25 Mbbl/d $6.4B LNG e
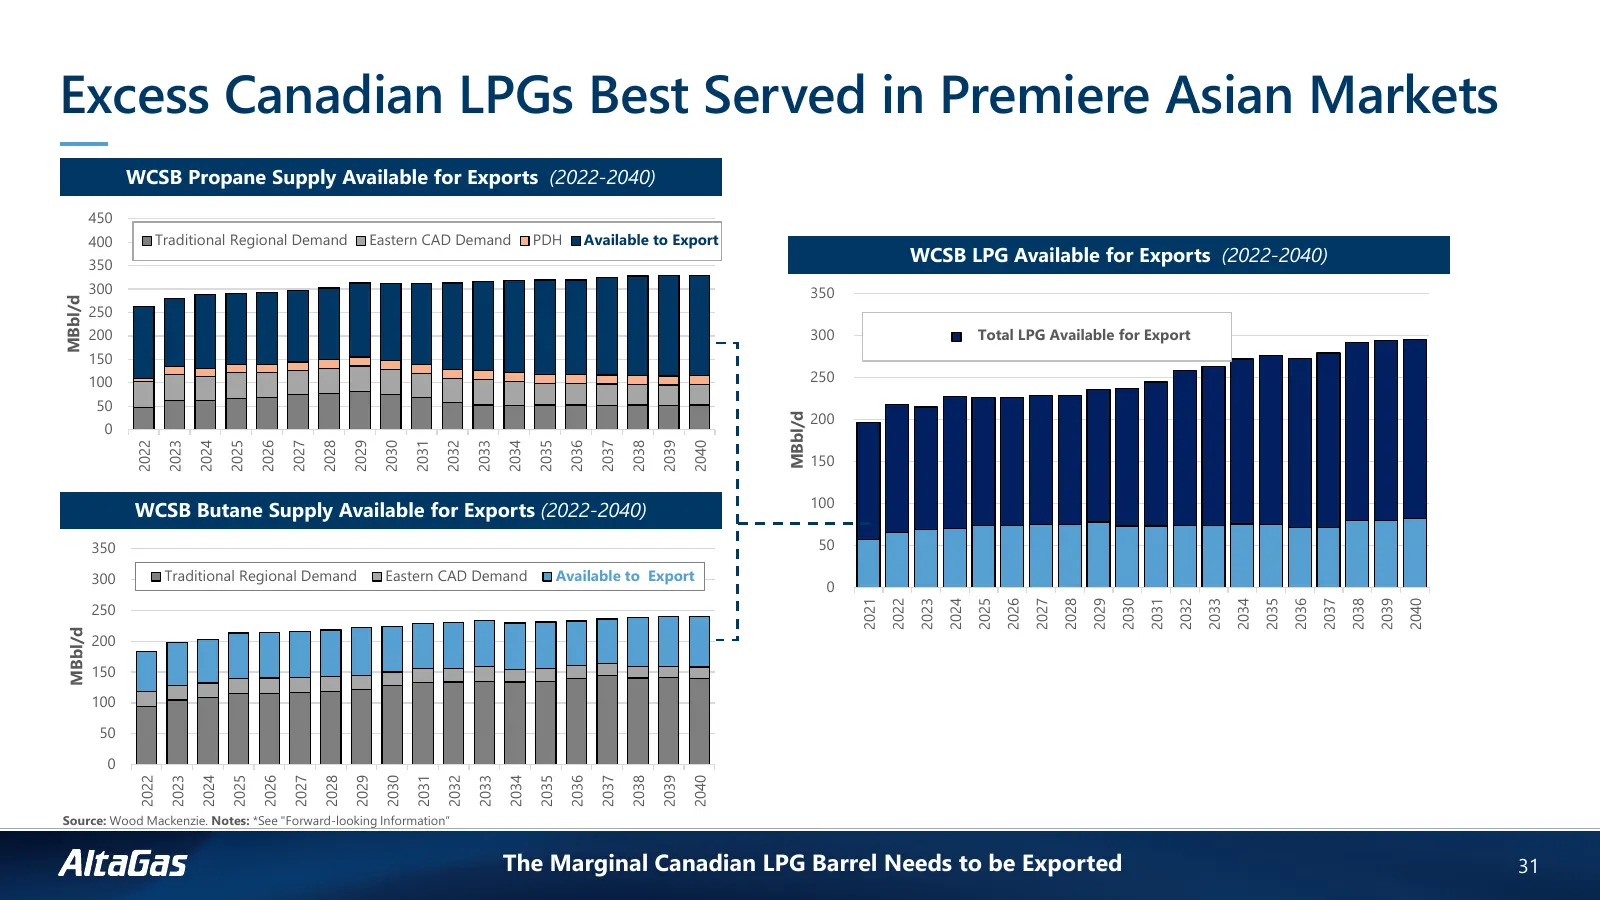
Slide 31: Excess Canadian LPGs Best Served in Premiere Asian Markets
Excess Canadian LPGs Best Served in Premiere Asian Markets WCSB Propane Supply Available for Exports (2022-2040) 450 400 Traditional Regional Demand Eastern CAD Demand PDH Available to Export 350 WCSB LPG Available for Exports (2022-2040) 300 350 MBbl/d 250 200 300 Total LPG Propane Available Availa
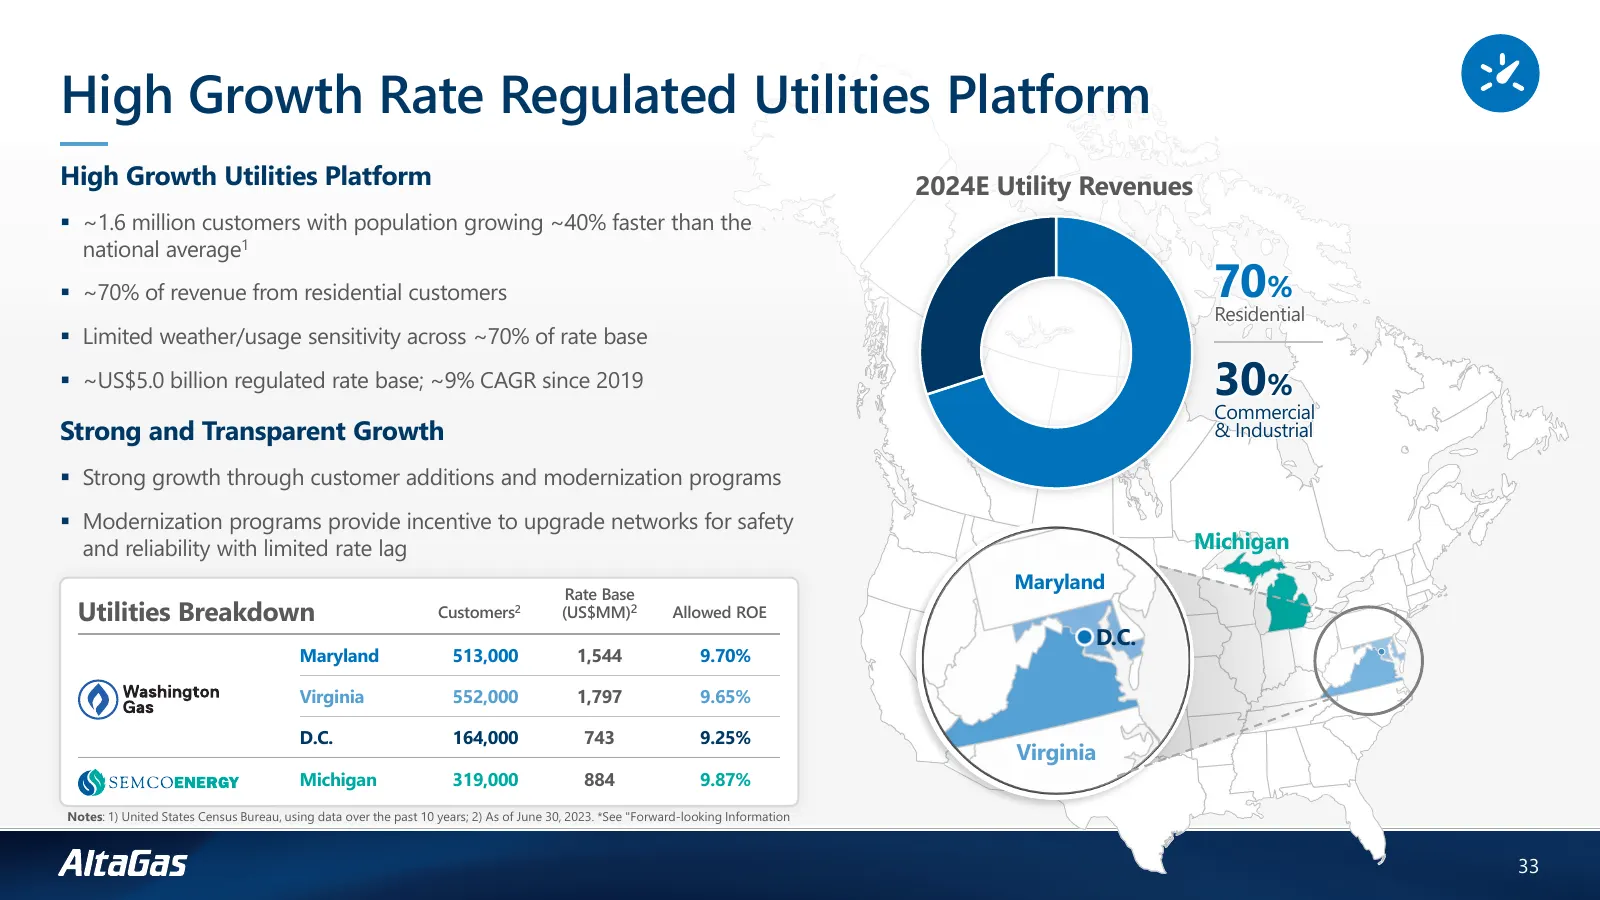
Slide 32: High Growth Rate Regulated Utilities Platform
High Growth Rate Regulated Utilities Platform High Growth Utilities Platform 2024E Utility Revenues ~1.6 million customers with population growing ~40% faster than the national average1 ~70% of revenue from residential customers 70% Residential Limited weather/usage sensitivity across ~70% of
Slide 33: Utilities Strategic Focus
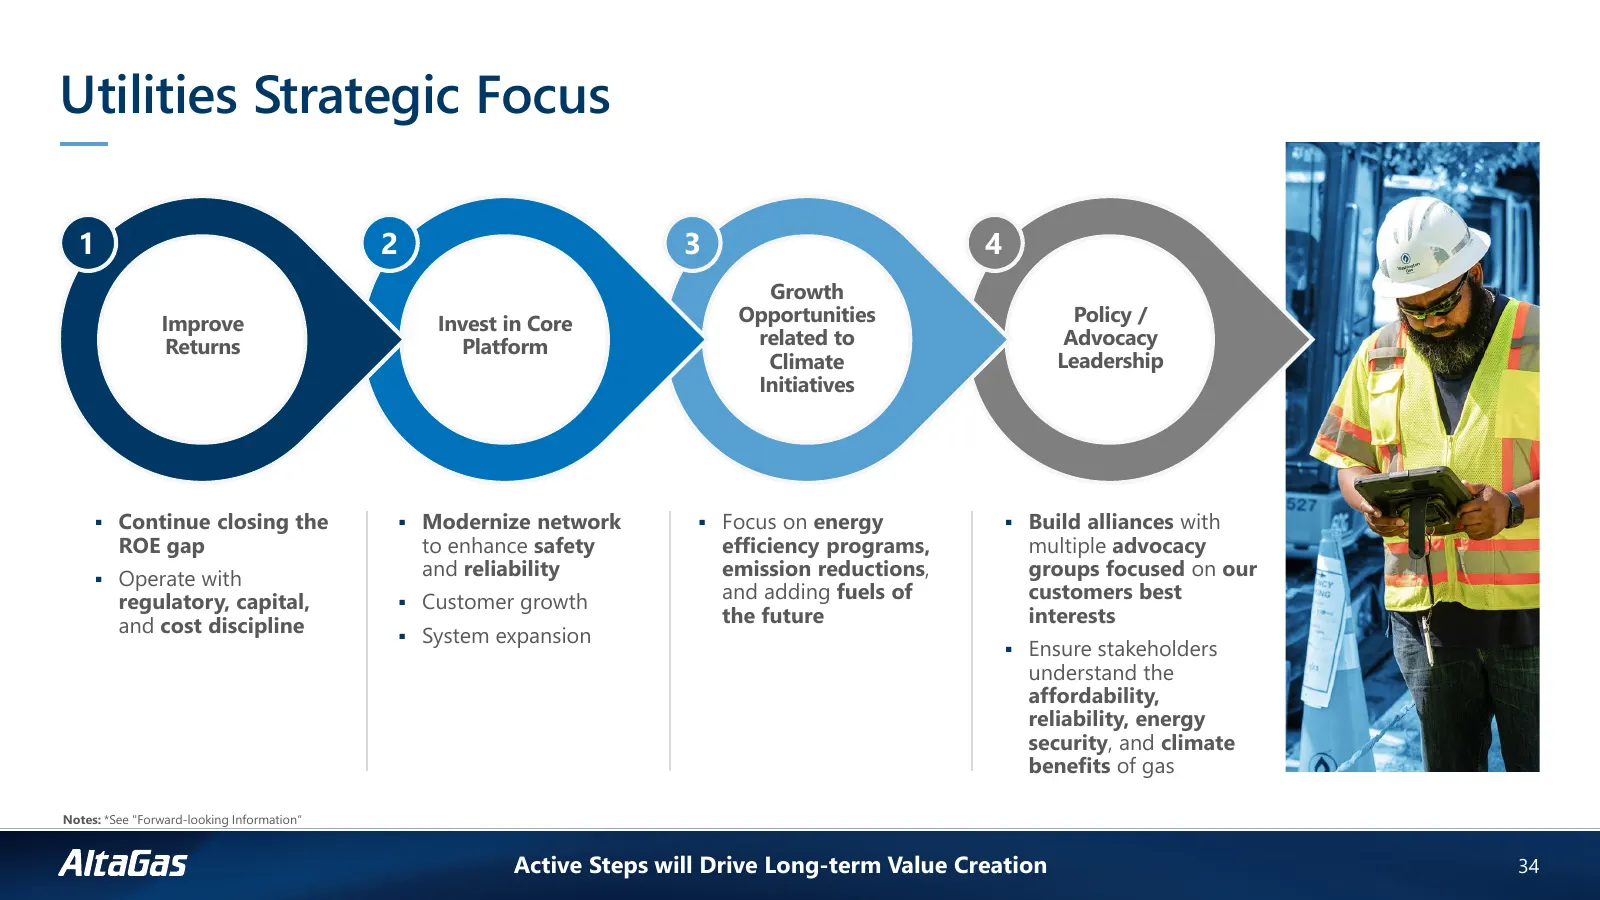
Utilities Strategic Focus 1 2 3 4 Growth Improve Invest in Core Opportunities Policy / Returns Platform related to Advocacy Climate Leadership Initiatives Continue closing the Modernize network Focus on energy Build alliances with ROE gap to enhance safety efficiency programs, multiple advoc
Slide 34: Improve Returns at WGL
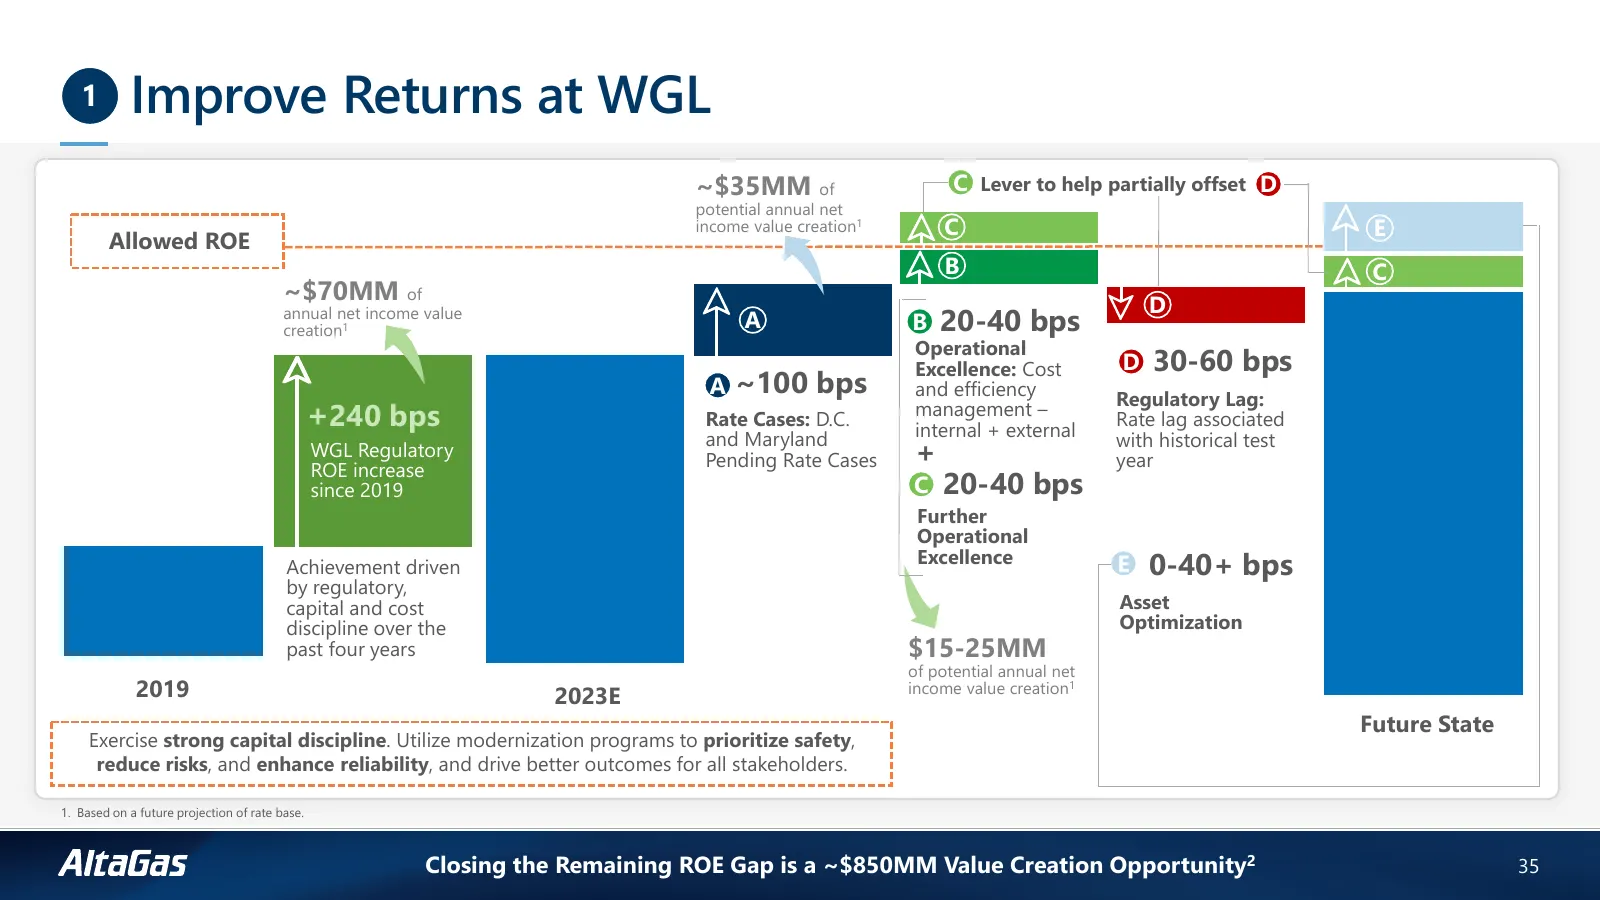
1 Improve Returns at WGL ~$35MM of C Lever to help partially offset D potential annual net income value creation1 C E Allowed ROE B C ~$70MM of D annual net income value creation1 A B 20-40 bps Operational Excellence: Cost D 30-60 bps A ~100 bps and efficiency Regulatory Lag: +240 bps Rate Cases: D.
Slide 35: Address Aging Infrastructure
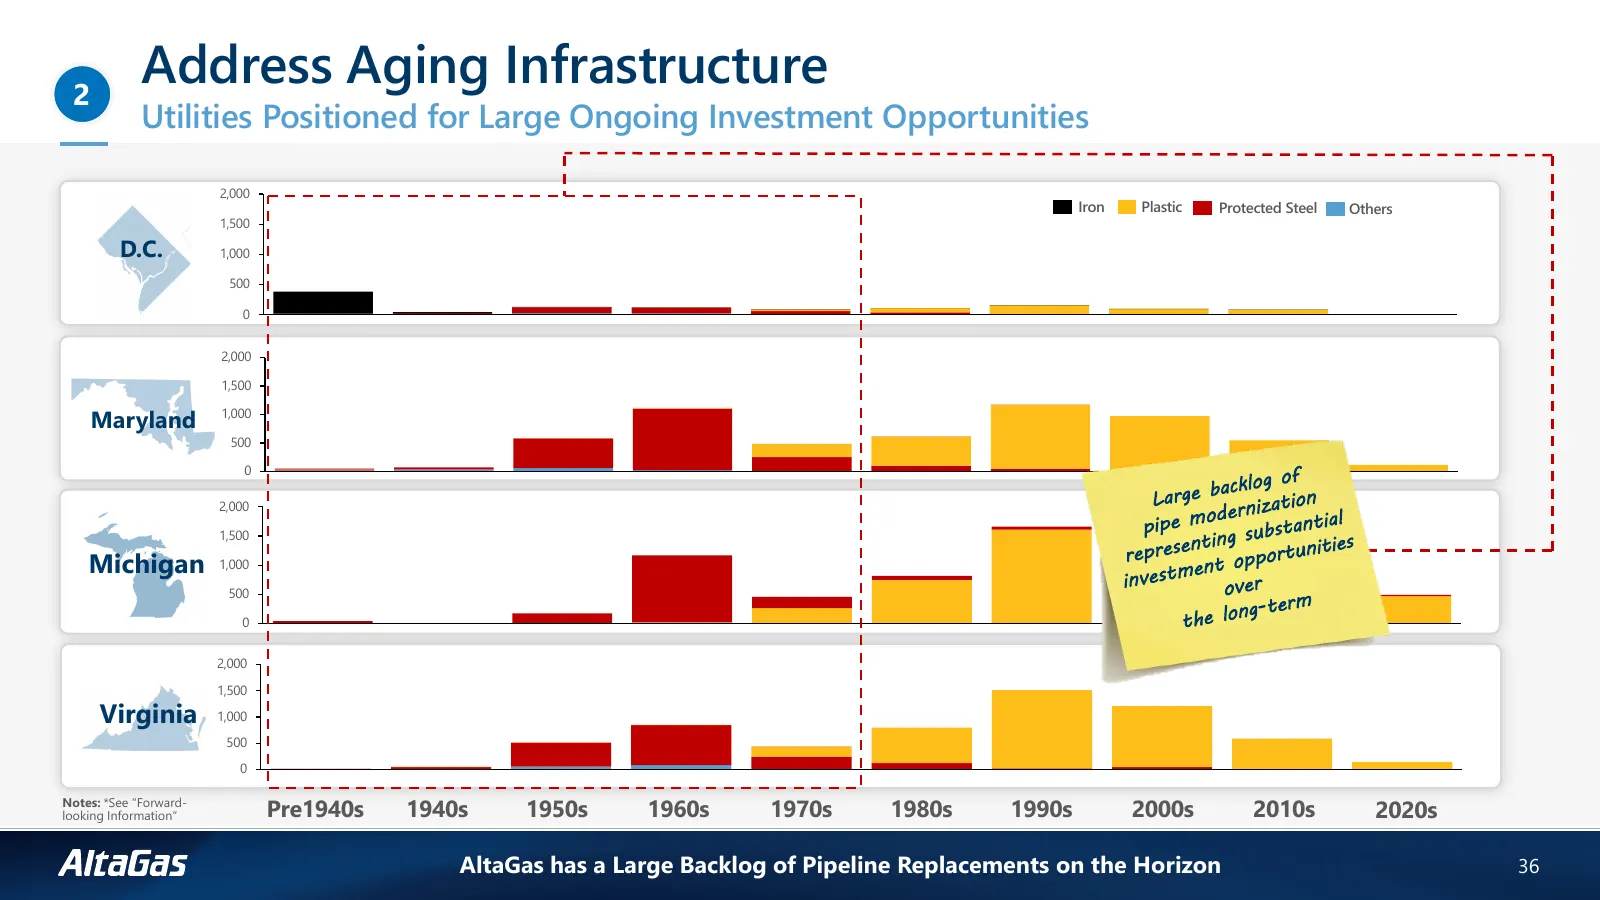
2 Address Aging Infrastructure Utilities Positioned for Large Ongoing Investment Opportunities 2,000 Iron Plastic Protected Steel Others 1,500 D.C. 1,000 500 0 2,000 1,500 Maryland 1,000 500 0 2,000 1,500 Michigan 1,000 500 0 2,000 1,500 Virginia 1,000 500 0 Notes: *See "Forward- looking Information
Slide 36: Accelerated Replacement Programs
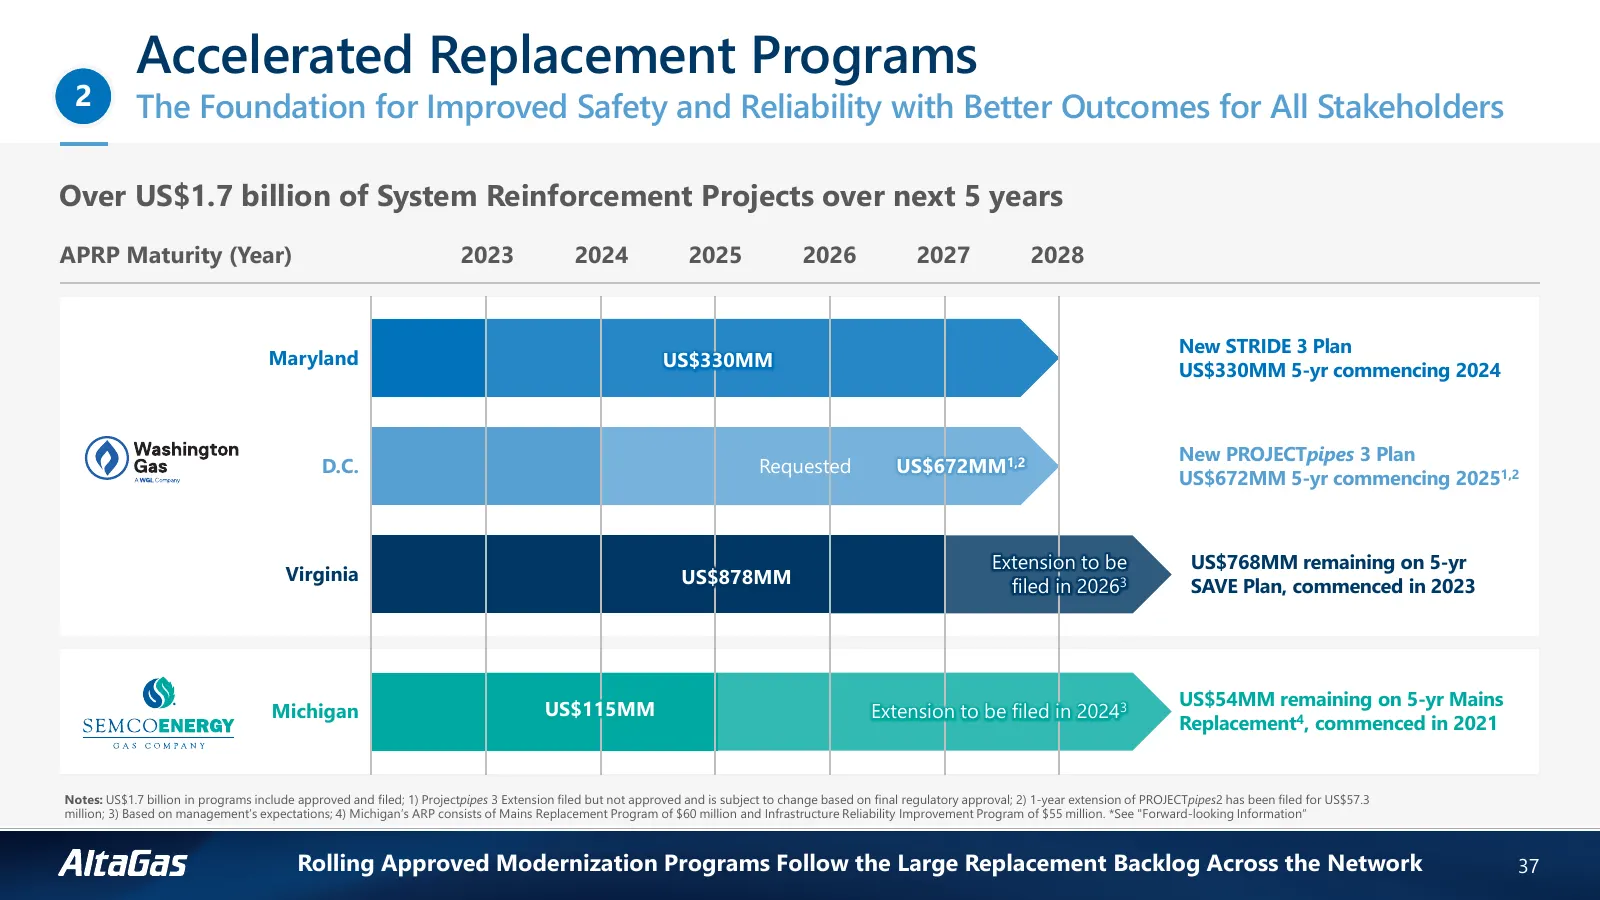
Accelerated Replacement Programs 2 The Foundation for Improved Safety and Reliability with Better Outcomes for All Stakeholders Over US$1.7 billion of System Reinforcement Projects over next 5 years APRP Maturity (Year) 2023 2024 2025 2026 2027 2028 New STRIDE 3 Plan Maryland US$330MM US$330MM 5-yr
Slide 37: Invest in Core Platform
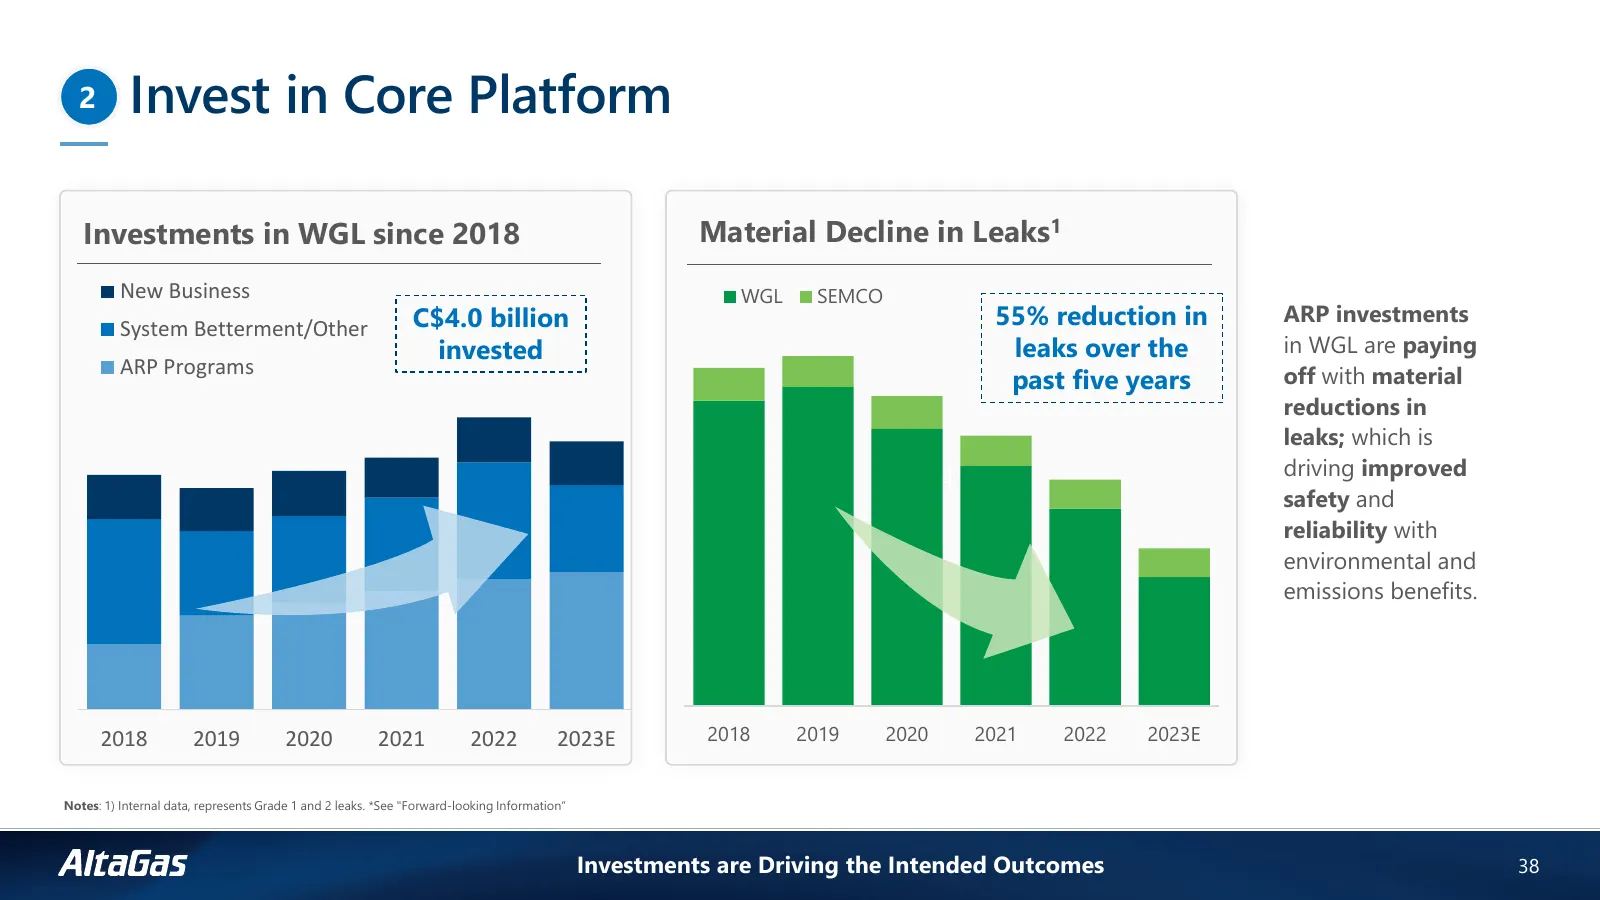
2 Invest in Core Platform Investments in WGL since 2018 Material Decline in Leaks1 New Business WGL SEMCO System Betterment/Other C$4.0 billion 55% reduction in ARP investments invested leaks over the in WGL are paying ARP Programs off with material past five years reductions in leaks; which is driv
Slide 38: Advance System Expansion and Reliability Projects
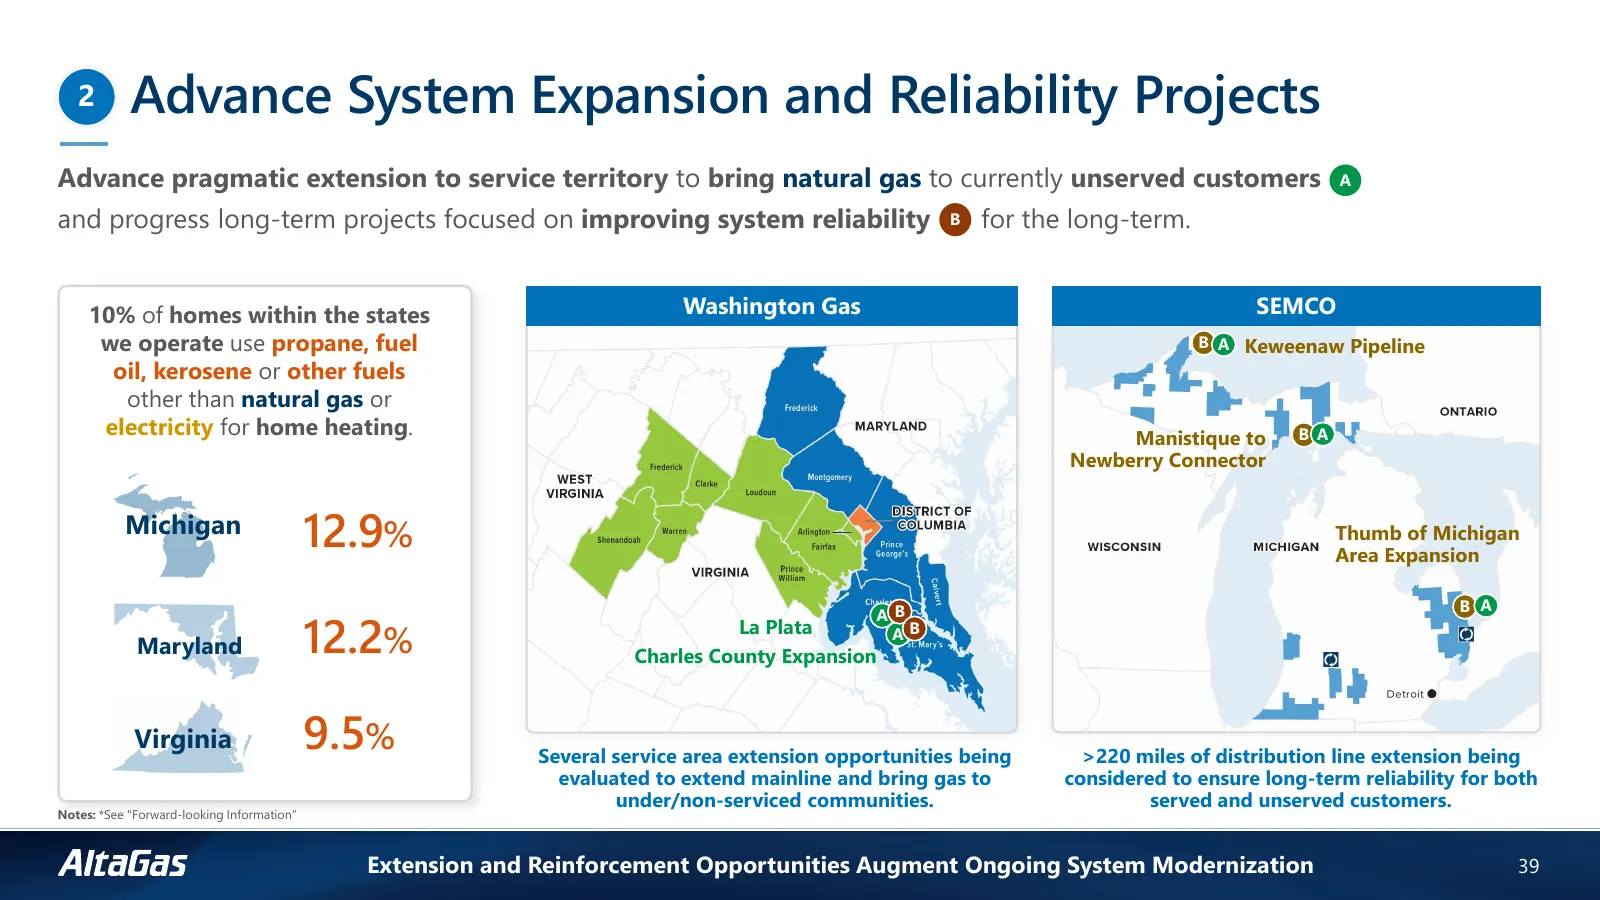
2 Advance System Expansion and Reliability Projects Advance pragmatic extension to service territory to bring natural gas to currently unserved customers A and progress long-term projects focused on improving system reliability B for the long-term. 10% of homes within the states Washington Gas SEMCO
Slide 39: Climate Initiatives Provide Incremental Investment Opportunities
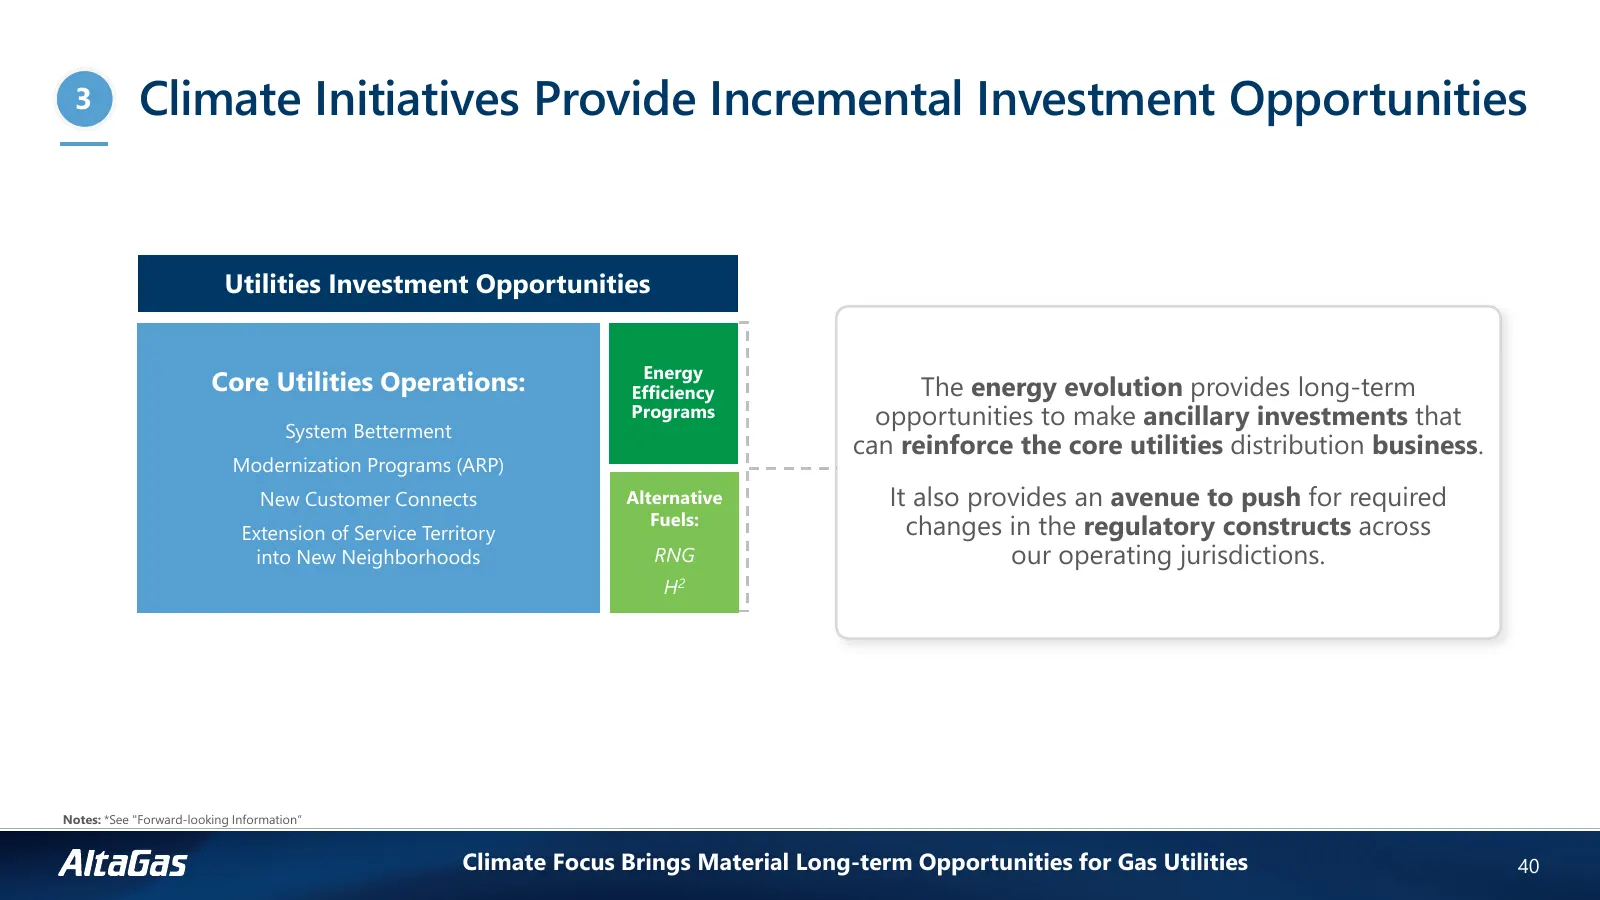
3 Climate Initiatives Provide Incremental Investment Opportunities Utilities Investment Opportunities Energy Core Utilities Operations: Efficiency The energy evolution provides long-term System Betterment Programs opportunities to make ancillary investments that can reinforce the core utilities dist
Slide 40: Other RNG Advancements
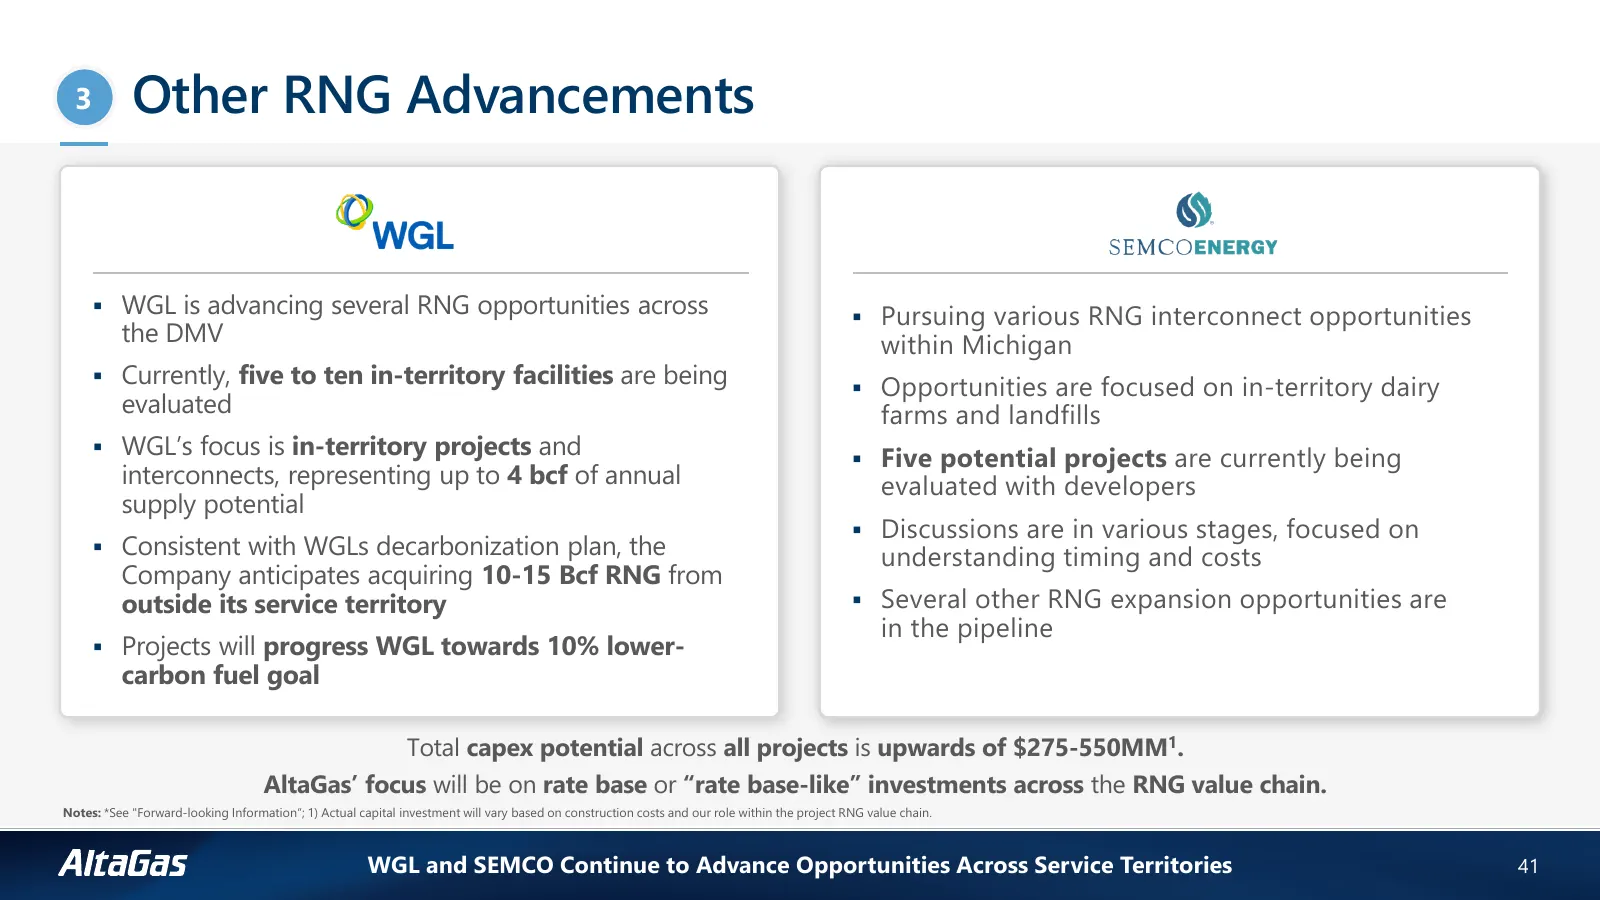
33 Other RNG Advancements WGL is advancing several RNG opportunities across Pursuing various RNG interconnect opportunities the DMV within Michigan Currently, five to ten in-territory facilities are being Opportunities are focused on in-territory dairy evaluated farms and landfills WGL’s f
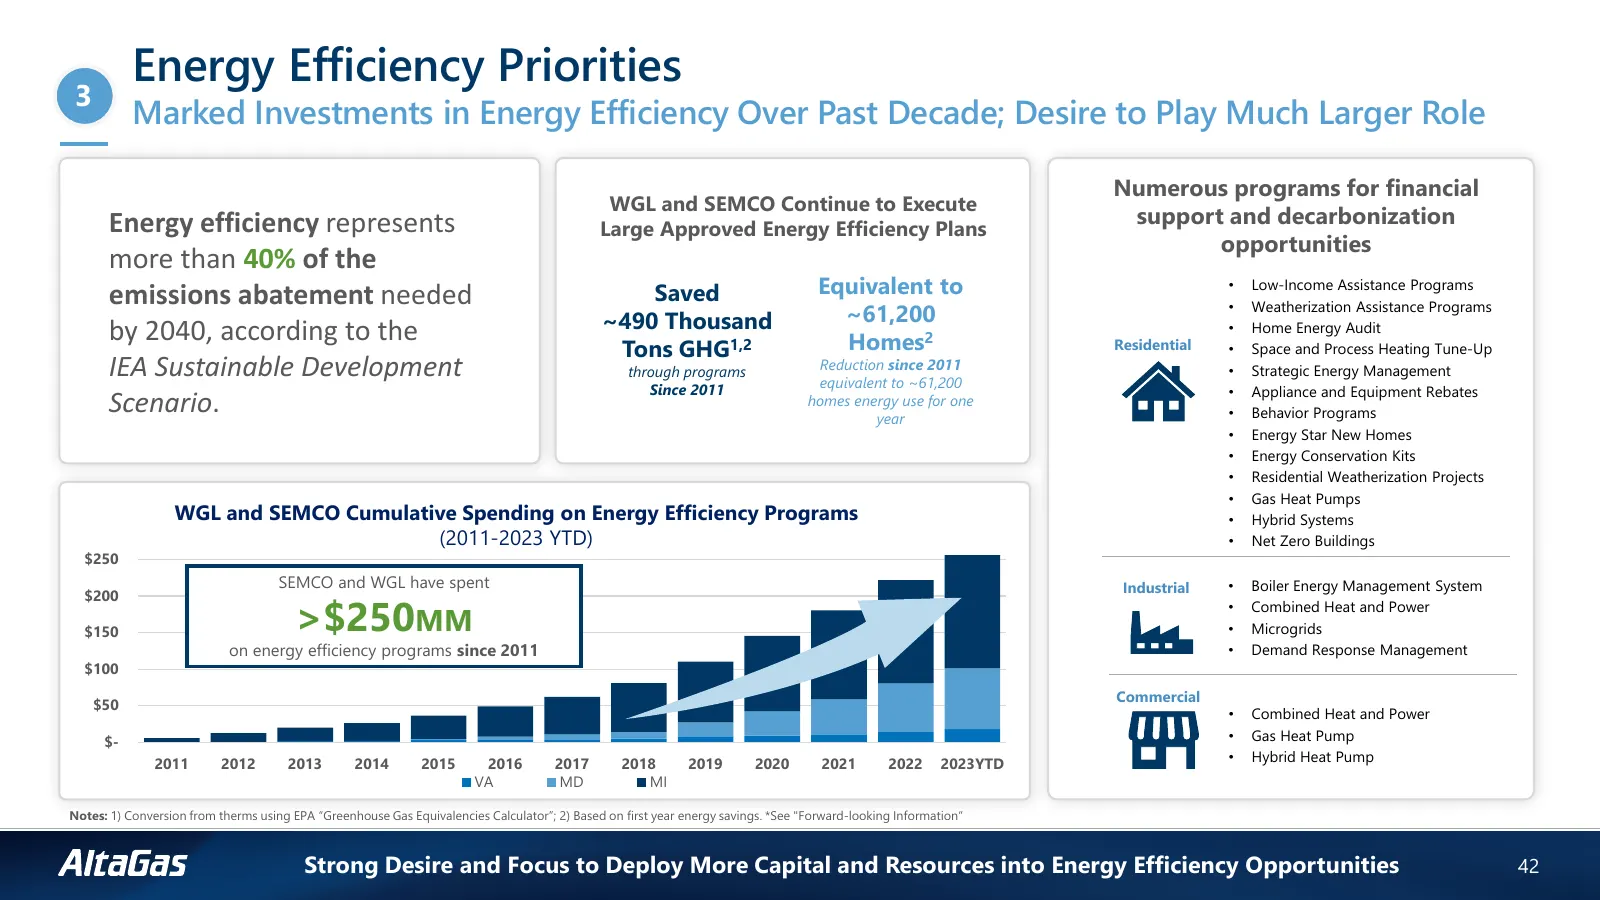
Slide 41: Energy Efficiency Priorities
Energy Efficiency Priorities 3 Marked Investments in Energy Efficiency Over Past Decade; Desire to Play Much Larger Role Numerous programs for financial WGL and SEMCO Continue to Execute Energy efficiency represents Large Approved Energy Efficiency Plans support and decarbonization opportunities mor
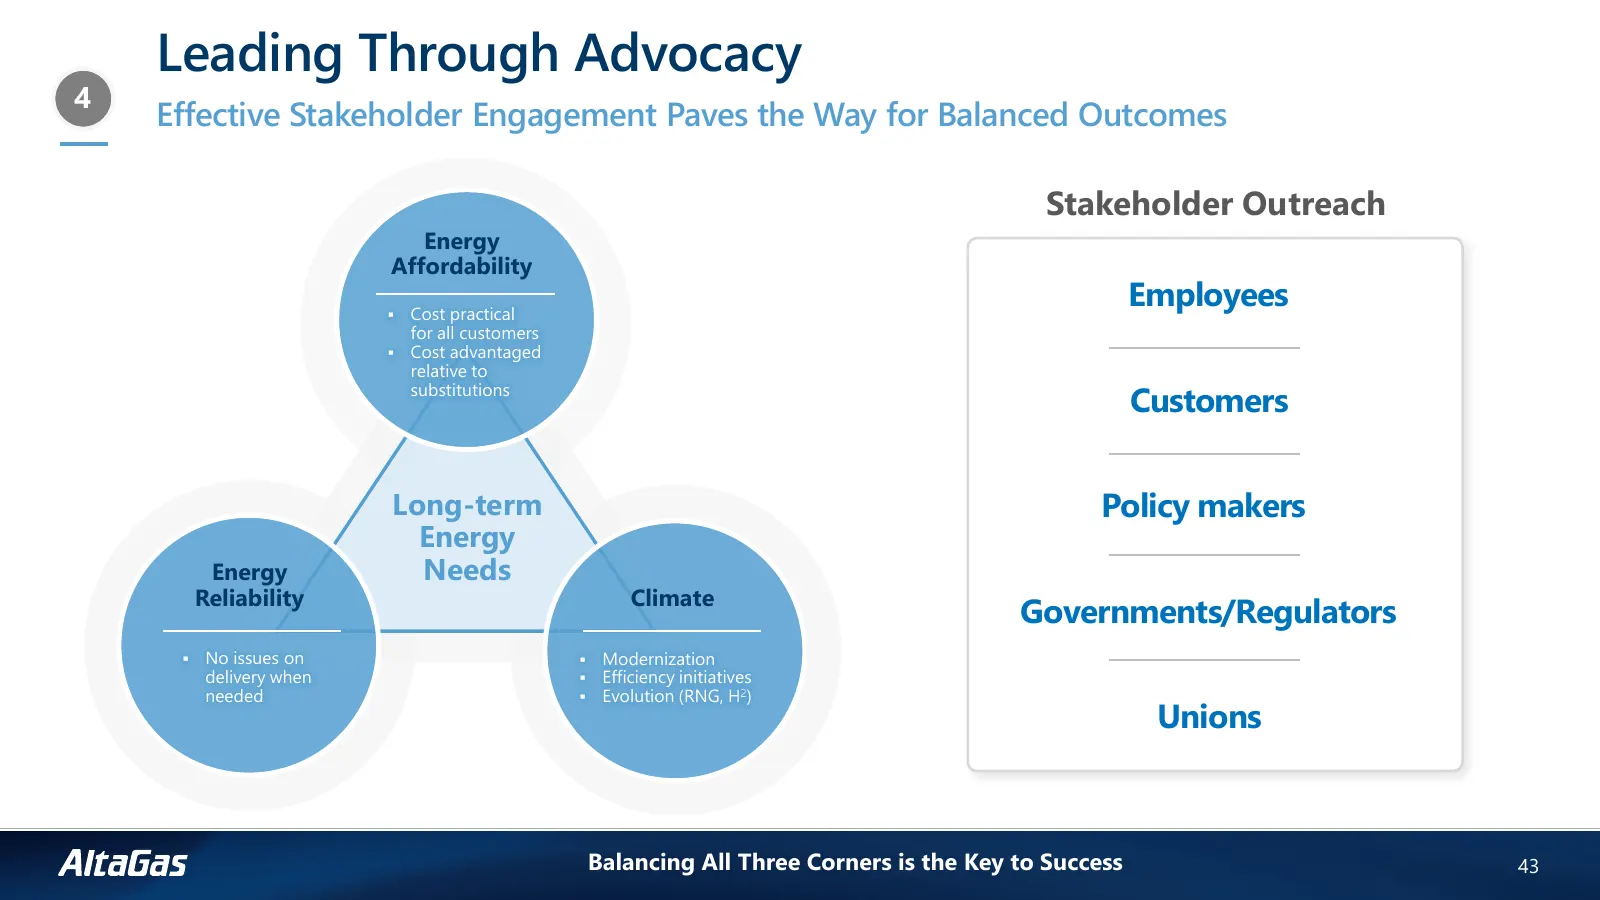
Slide 42: Leading Through Advocacy
Leading Through Advocacy 4 Effective Stakeholder Engagement Paves the Way for Balanced Outcomes Stakeholder Outreach Energy Affordability Cost practical Employees for all customers Cost advantaged relative to substitutions Customers Long-term Policy makers Energy Energy Needs Reliability Climate
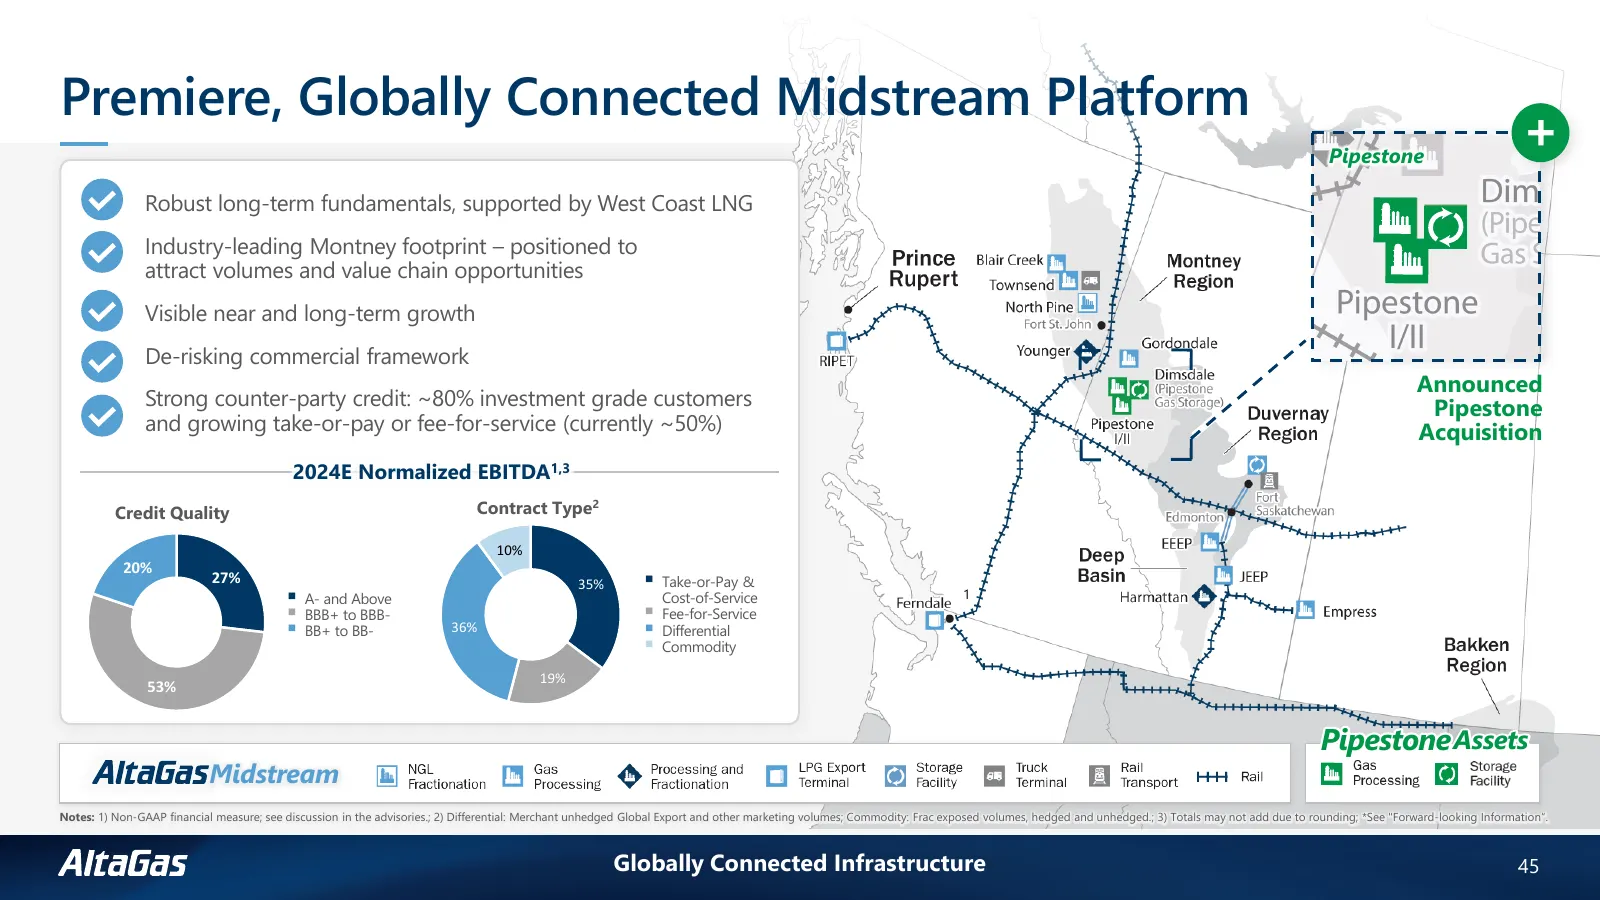
Slide 43: Premiere, Globally Connected Midstream Platform
Premiere, Globally Connected Midstream Platform Pipestone + Robust long-term fundamentals, supported by West Coast LNG Industry-leading Montney footprint – positioned to attract volumes and value chain opportunities Visible near and long-term growth De-risking commercial framework Announced Strong c
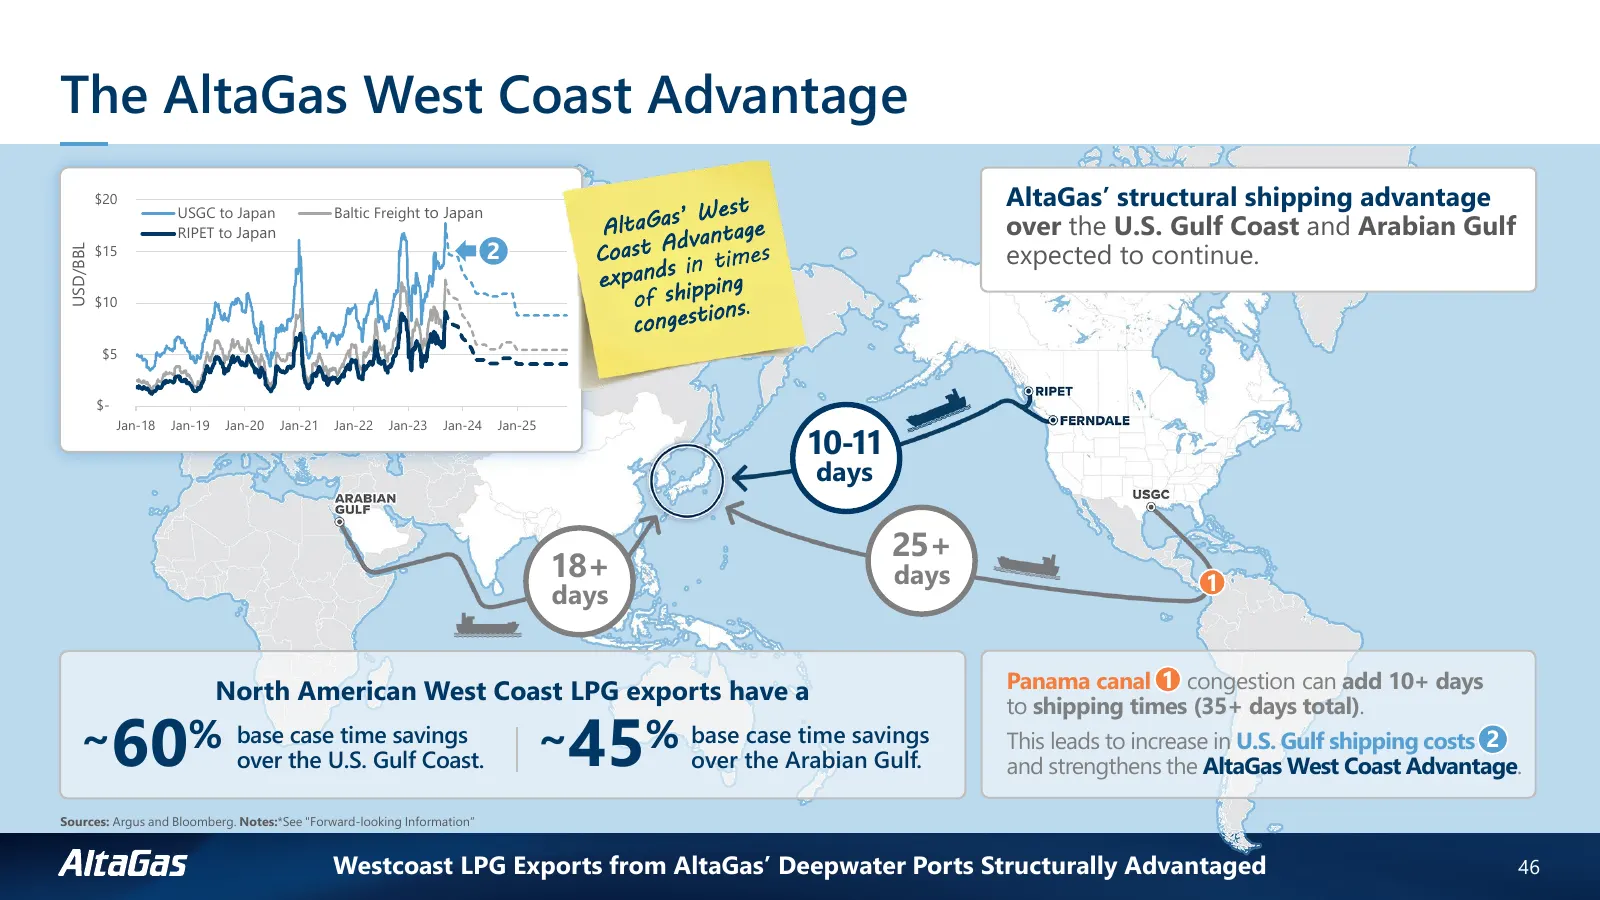
Slide 44: The AltaGas West Coast Advantage
The AltaGas West Coast Advantage $20 USGC to Japan Baltic Freight to Japan AltaGas’ structural shipping advantage RIPET to Japan Chiba over the U.S. Gulf Coast and Arabian Gulf $15 2 expected to continue. USD/BBL $10 $5 $- 10-11 Jan-18 Jan-19 Jan-20 Jan-21 Jan-22 Jan-23 Jan-24 Jan-25 days 25+ 18+ da
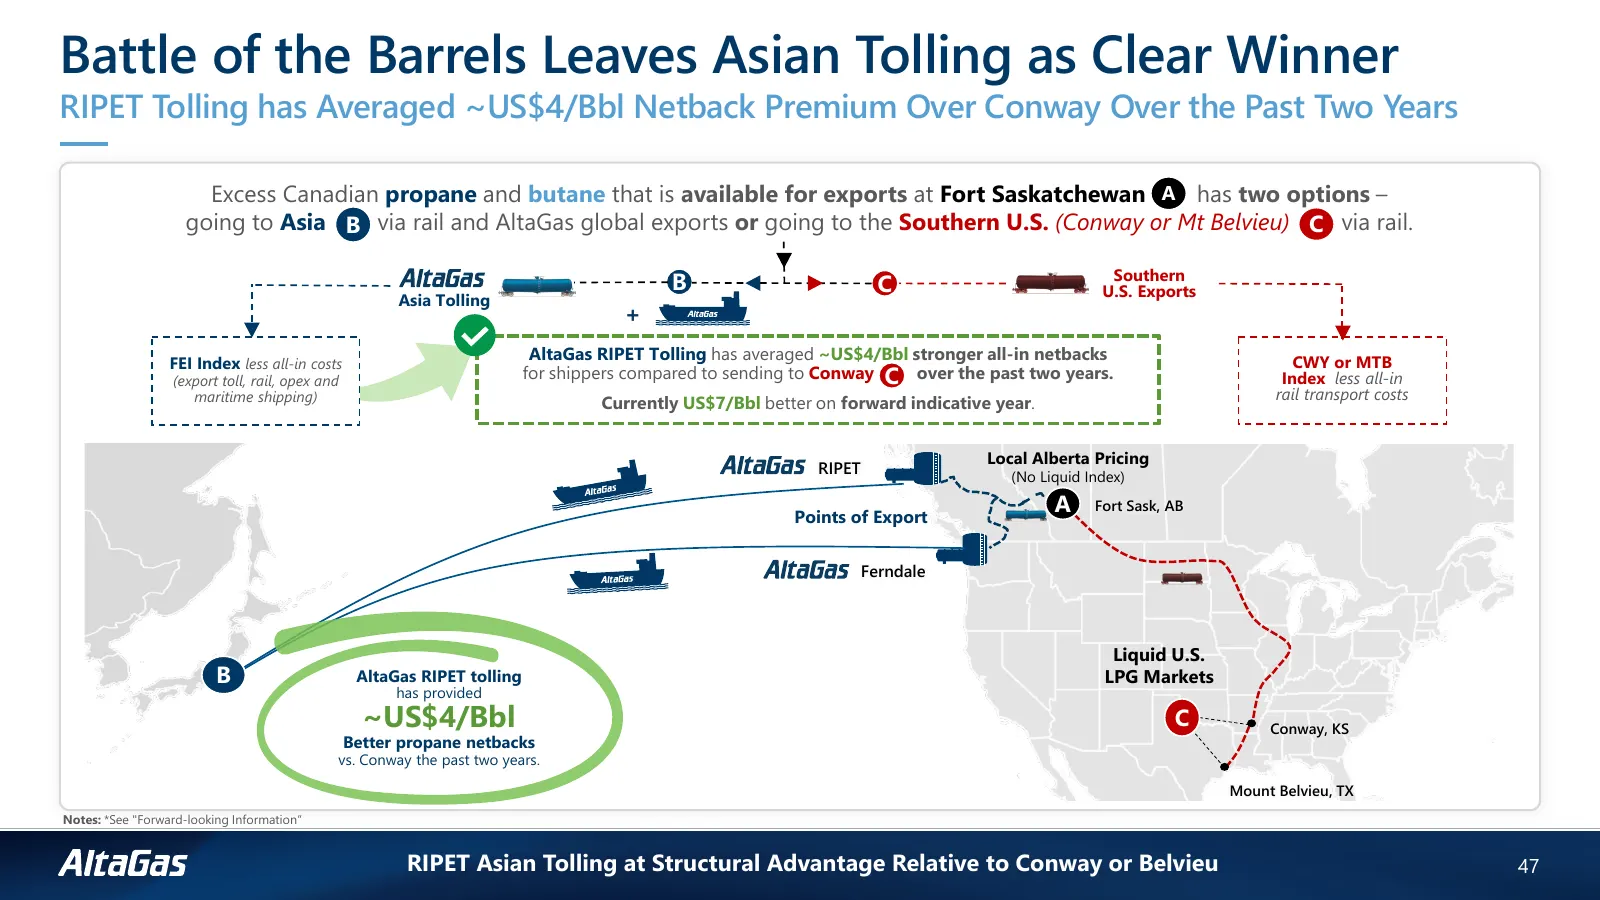
Slide 45: Battle of the Barrels Leaves Asian Tolling as Clear Winner
Battle of the Barrels Leaves Asian Tolling as Clear Winner RIPET Tolling has Averaged ~US$4/Bbl Netback Premium Over Conway Over the Past Two Years Excess Canadian propane and butane that is available for exports at Fort Saskatchewan A has two options – going to Asia B via rail and AltaGas global ex
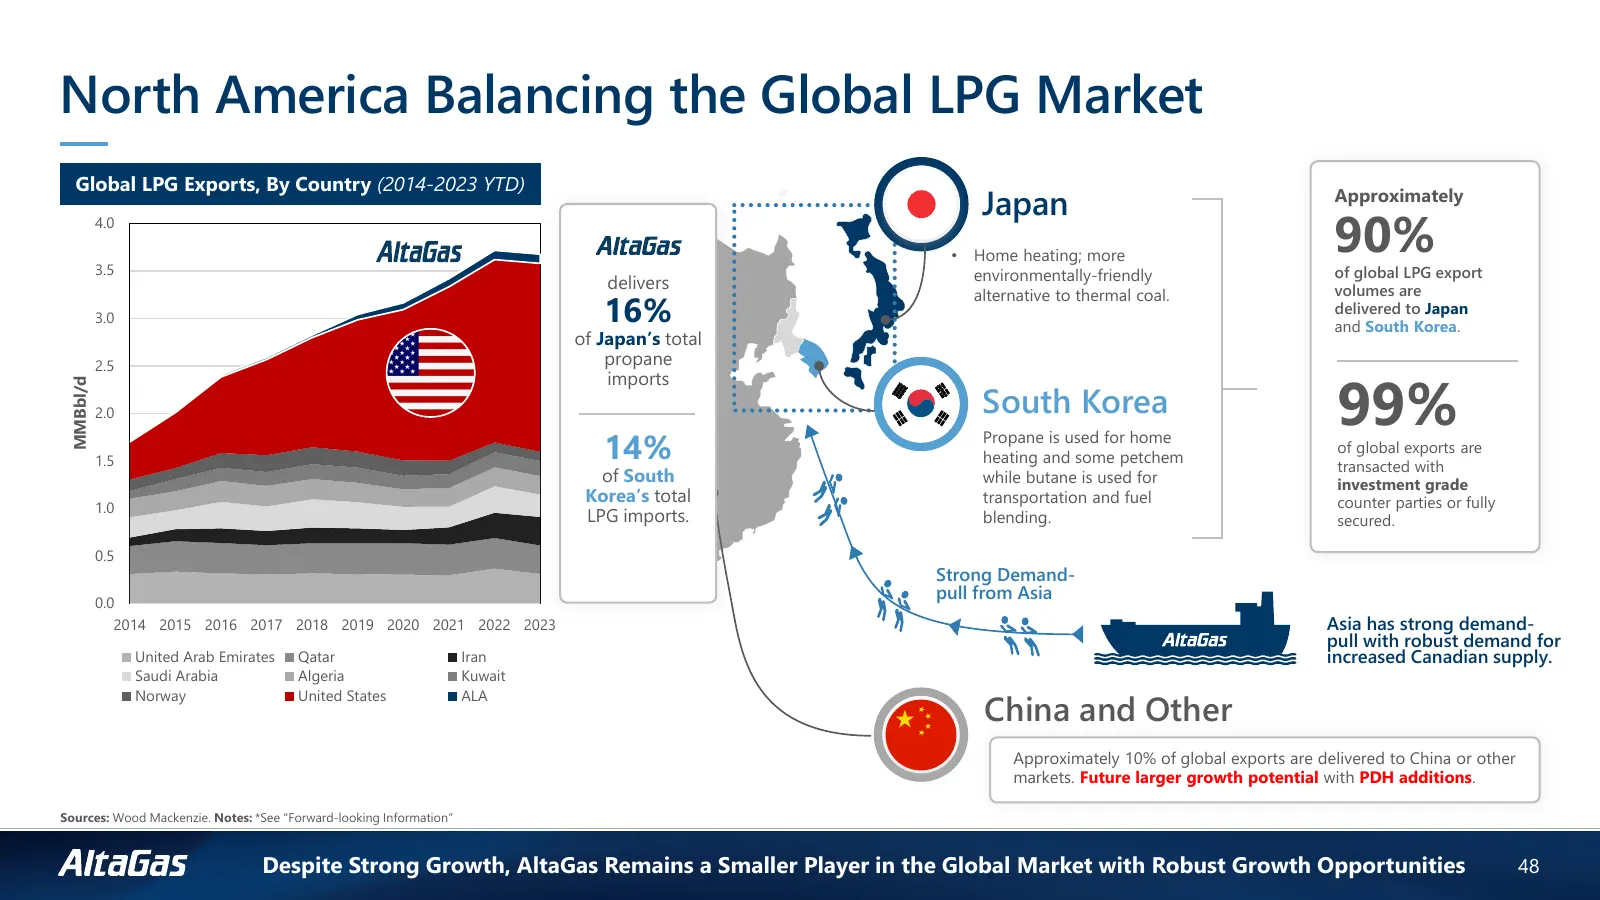
Slide 46: North America Balancing the Global LPG Market
North America Balancing the Global LPG Market Global LPG Exports, By Country (2014-2023 YTD) Japan Approximately 4.0 3.5 • Home heating; more 90% environmentally-friendly of global LPG export delivers volumes are 16% alternative to thermal coal. delivered to Japan 3.0 and South Korea. of Japan’s tot
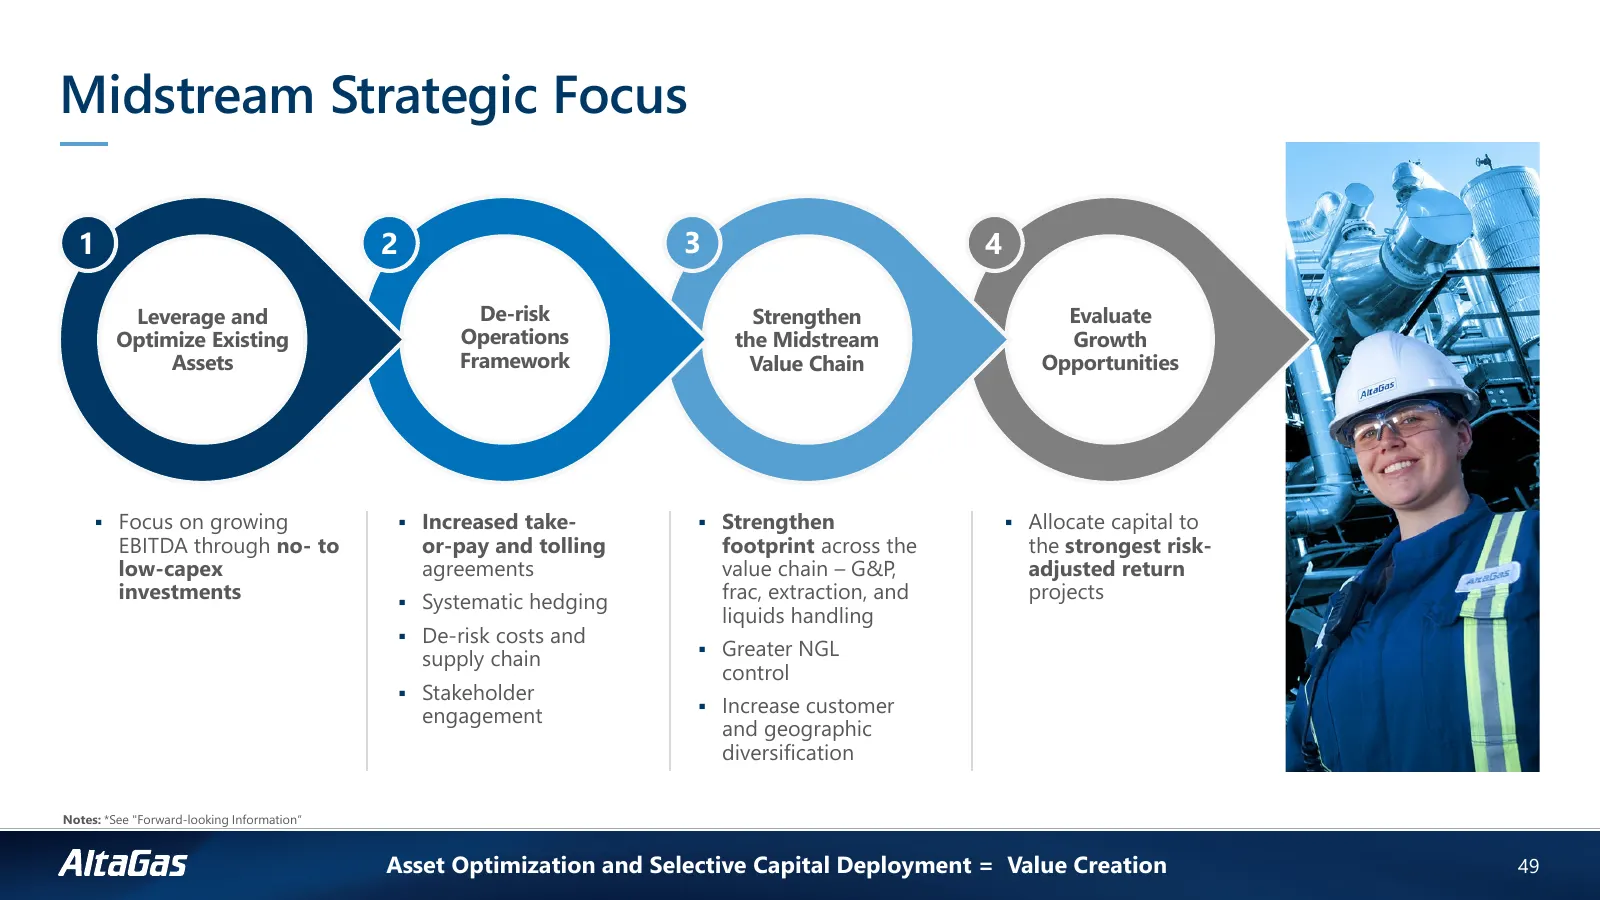
Slide 47: Midstream Strategic Focus
Midstream Strategic Focus 1 2 3 4 Leverage and De-risk Strengthen Evaluate Optimize Existing Operations the Midstream Growth Assets Framework Value Chain Opportunities Focus on growing Increased take- Strengthen Allocate capital to EBITDA through no- to or-pay and tolling footprint across th
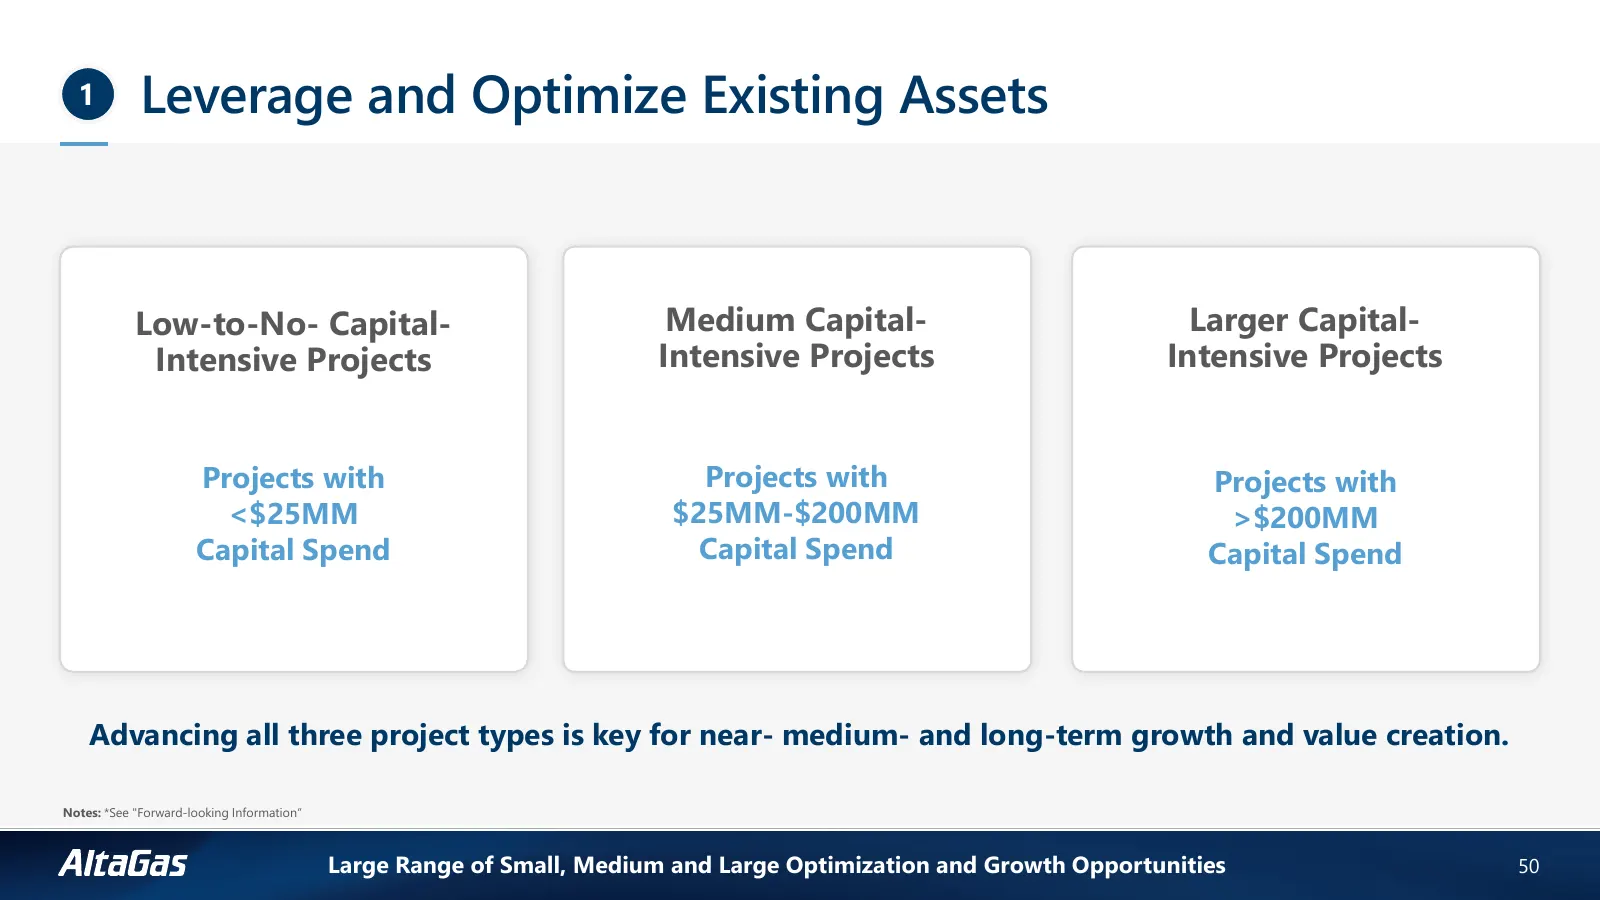
Slide 48: Leverage and Optimize Existing Assets
1 Leverage and Optimize Existing Assets Low-to-No- Capital- Medium Capital- Larger Capital- Intensive Projects Intensive Projects Intensive Projects Projects with Projects with Projects with <$25MM $25MM-$200MM >$200MM Capital Spend Capital Spend Capital Spend Advancing all three project types is ke
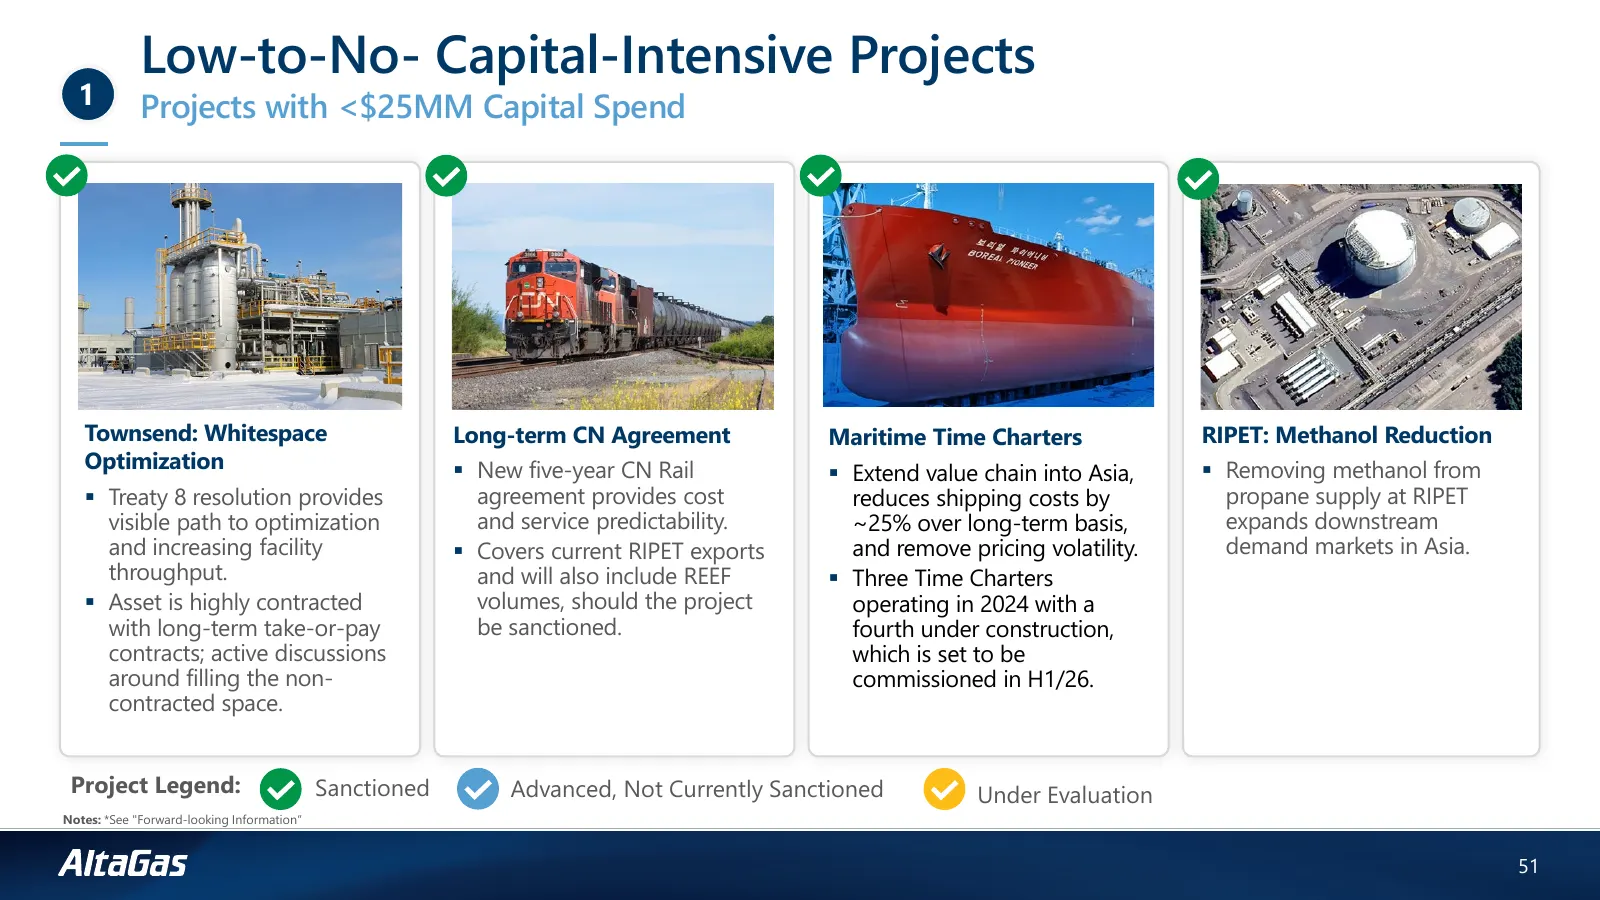
Slide 49: Low-to-No-Capital-Intensive Projects
Low-to-No- Capital-Intensive Projects 1 Projects with <$25MM Capital Spend Townsend: Whitespace Long-term CN Agreement Maritime Time Charters RIPET: Methanol Reduction Optimization New five-year CN Rail Extend value chain into Asia, Removing methanol from Treaty 8 resolution provides agreeme
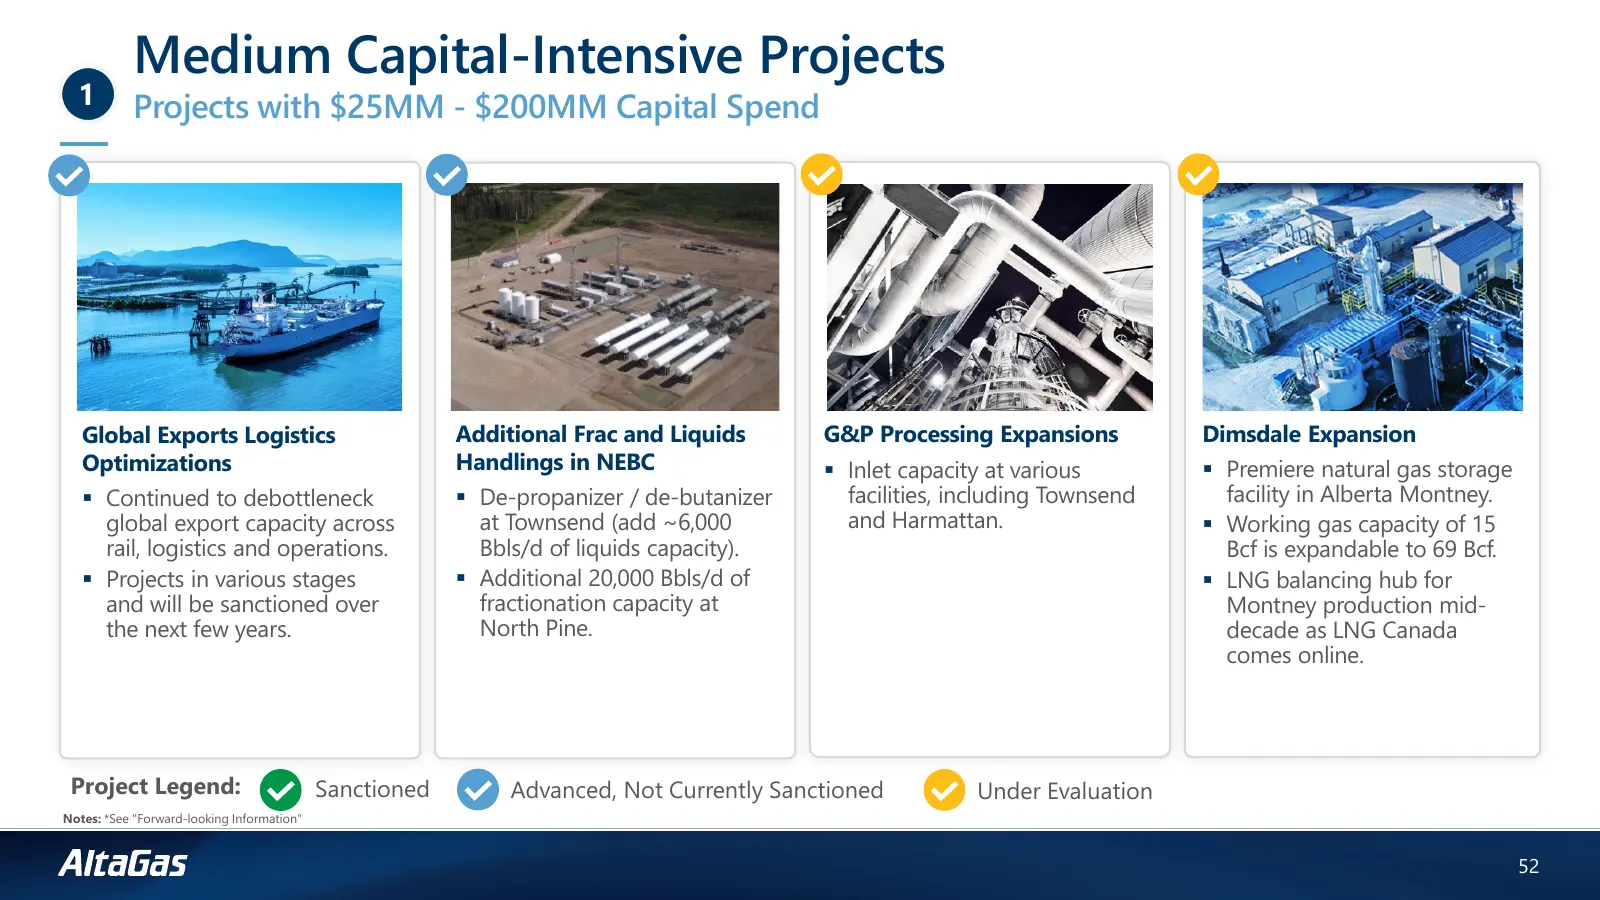
Slide 50: Medium Capital-Intensive Projects
Medium Capital-Intensive Projects 1 Projects with $25MM - $200MM Capital Spend Global Exports Logistics Additional Frac and Liquids G&P Processing Expansions Dimsdale Expansion Optimizations Handlings in NEBC Inlet capacity at various Premiere natural gas storage Continued to debottleneck De
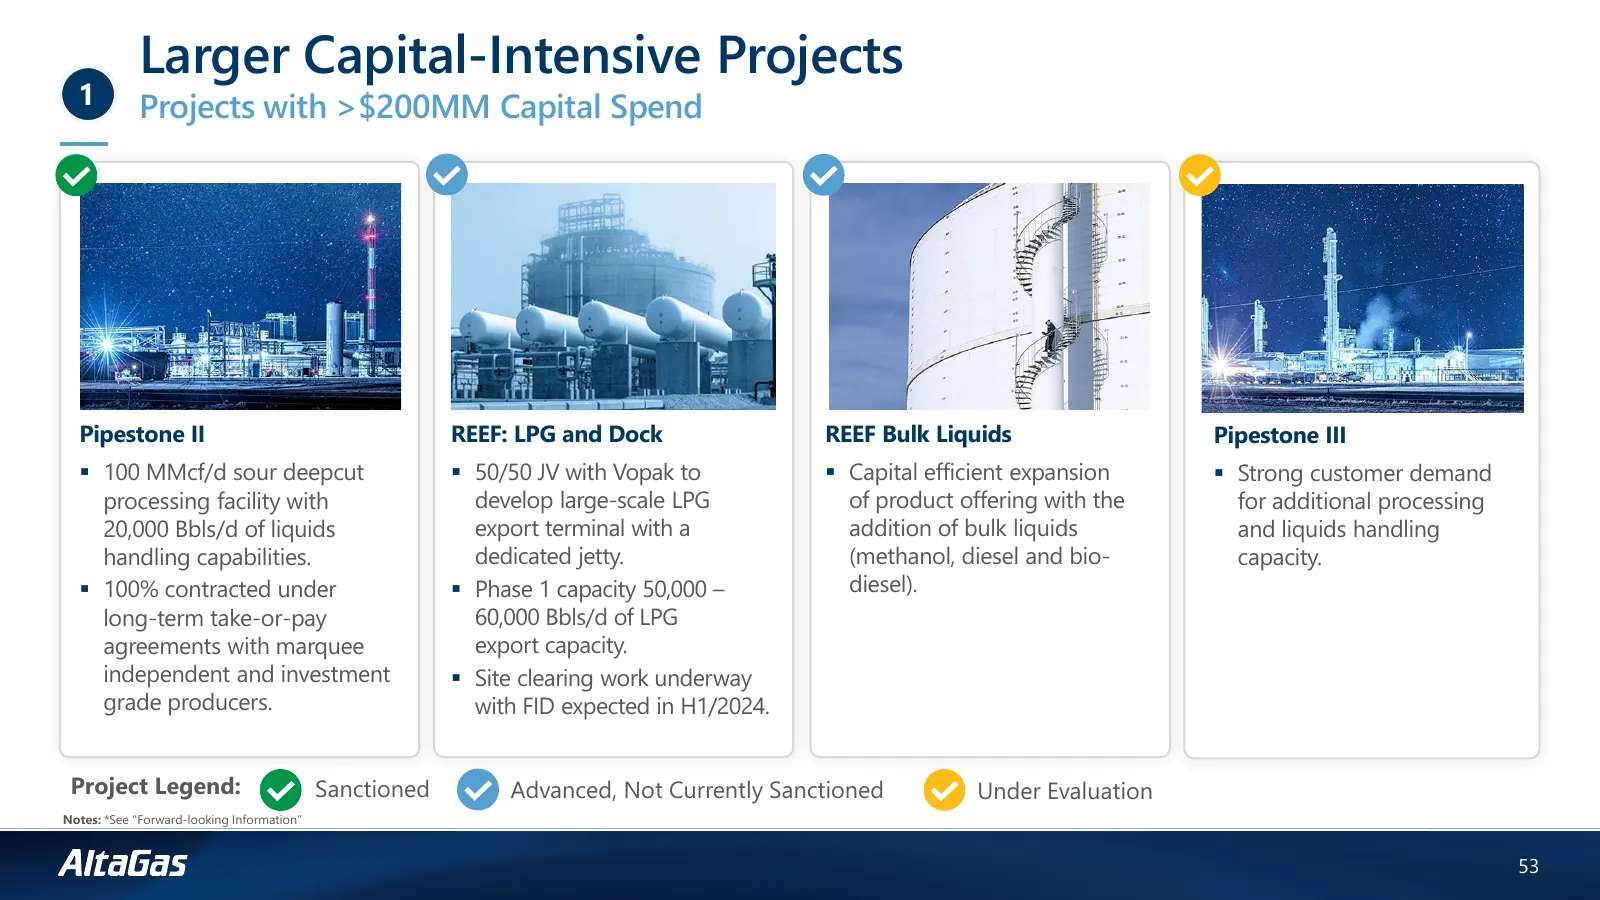
Slide 51: Larger Capital-Intensive Projects
Larger Capital-Intensive Projects 1 Projects with >$200MM Capital Spend Pipestone II REEF: LPG and Dock REEF Bulk Liquids Pipestone III 100 MMcf/d sour deepcut 50/50 JV with Vopak to Capital efficient expansion Strong customer demand processing facility with develop large-scale LPG of produc
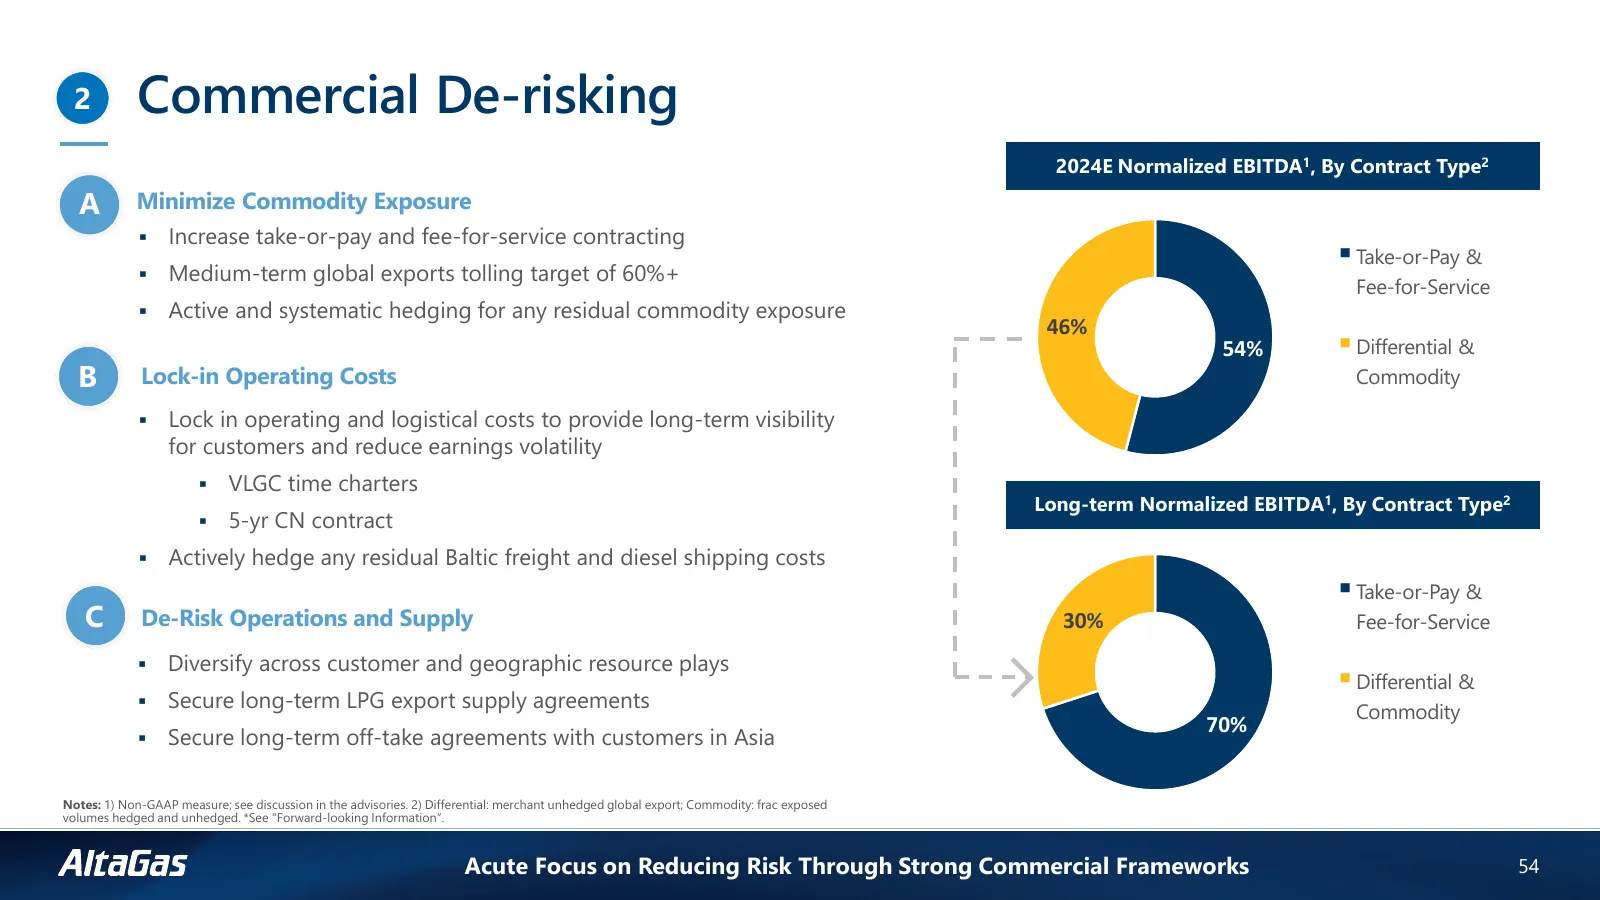
Slide 52: Commercial De-risking
2 Commercial De-risking 2024E Normalized EBITDA1, By Contract Type2 A Minimize Commodity Exposure Increase take-or-pay and fee-for-service contracting Take-or-Pay & Medium-term global exports tolling target of 60%+ Fee-for-Service Active and systematic hedging for any residual commodity expo
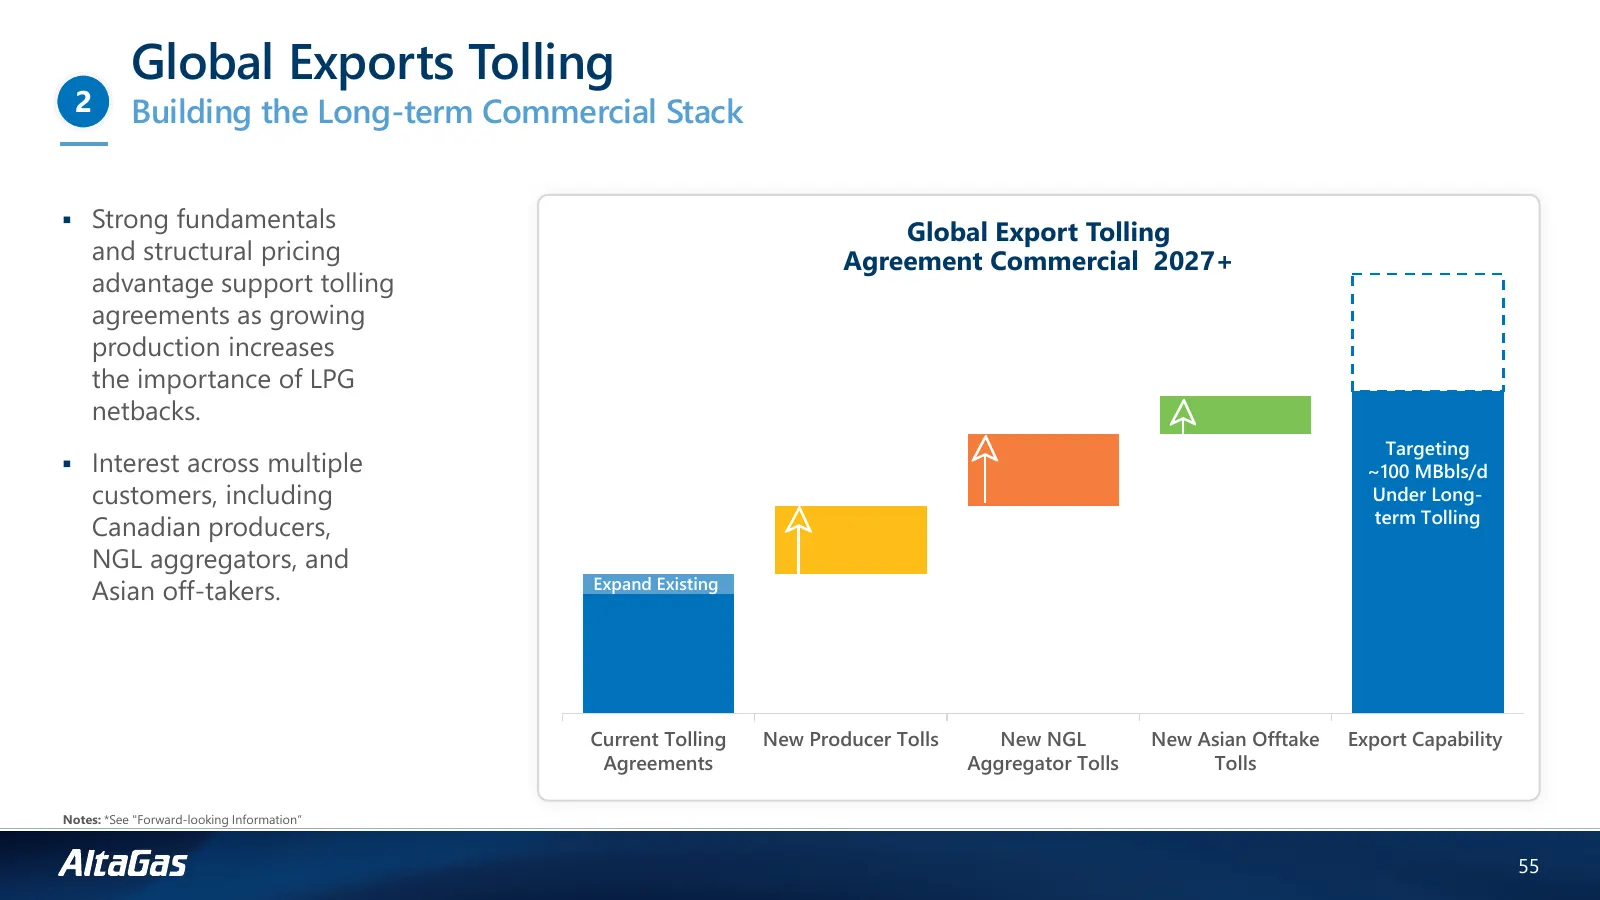
Slide 53: Global Exports Tolling
Global Exports Tolling 2 Building the Long-term Commercial Stack Strong fundamentals Global Export Tolling and structural pricing Agreement Commercial 2027+ advantage support tolling agreements as growing production increases the importance of LPG netbacks. Targeting Interest across multiple ~10
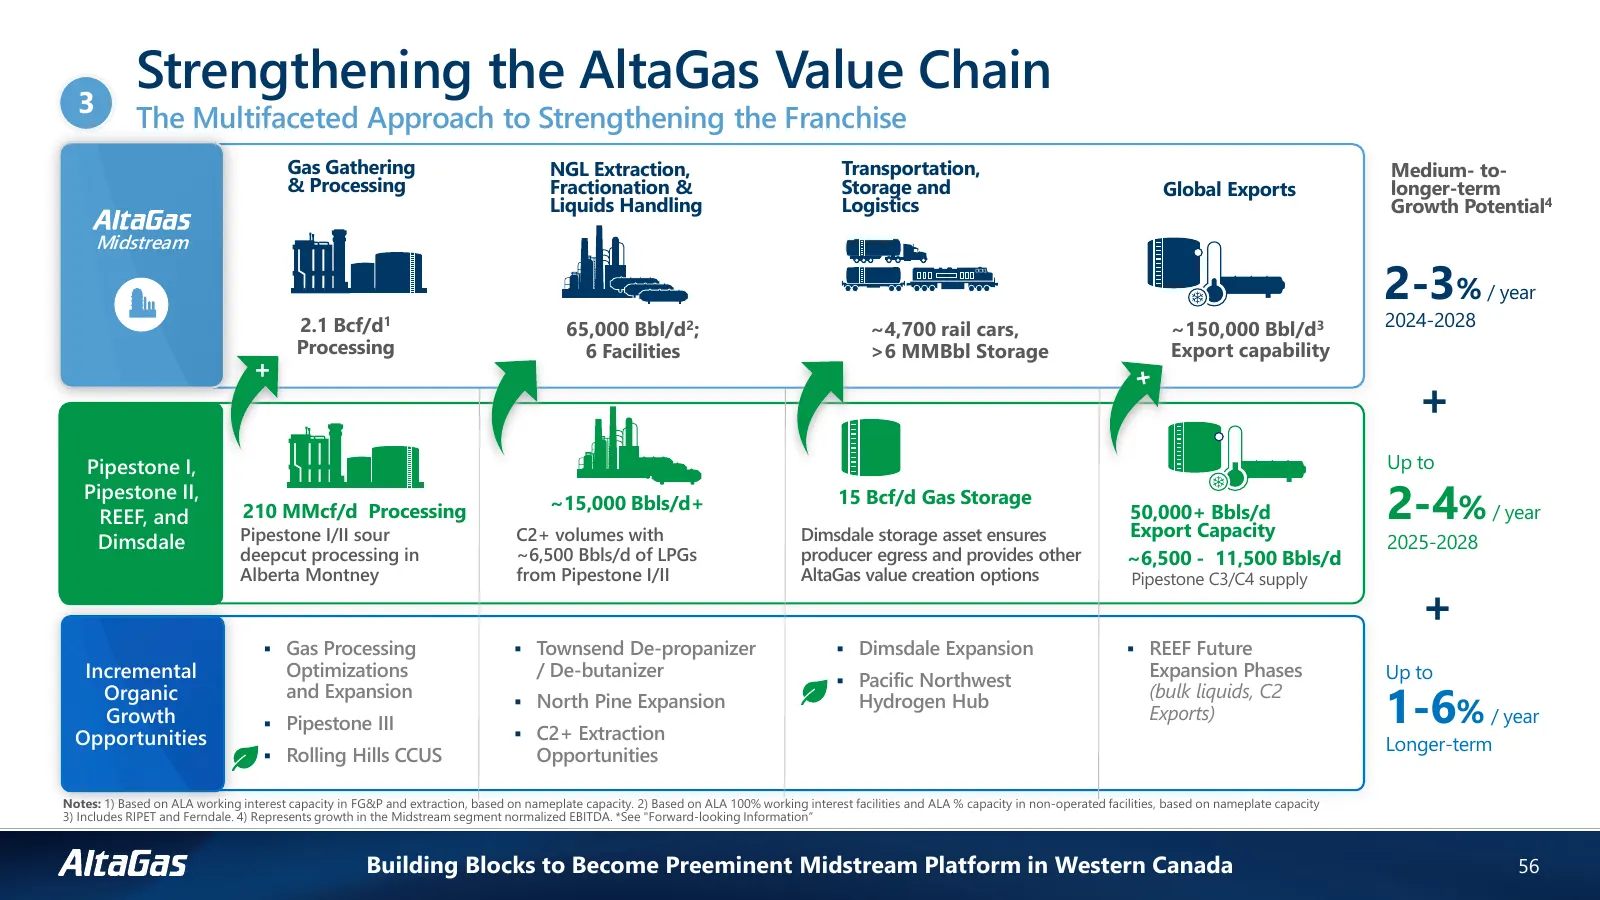
Slide 54: Strengthening the AltaGas Value Chain
3 Strengthening the AltaGas Value Chain The Multifaceted Approach to Strengthening the Franchise Gas Gathering NGL Extraction, Transportation, Medium- to- & Processing Fractionation & Storage and Global Exports longer-term Liquids Handling Logistics Growth Potential4 Midstream 2-3% / year 2.1 Bcf/d1
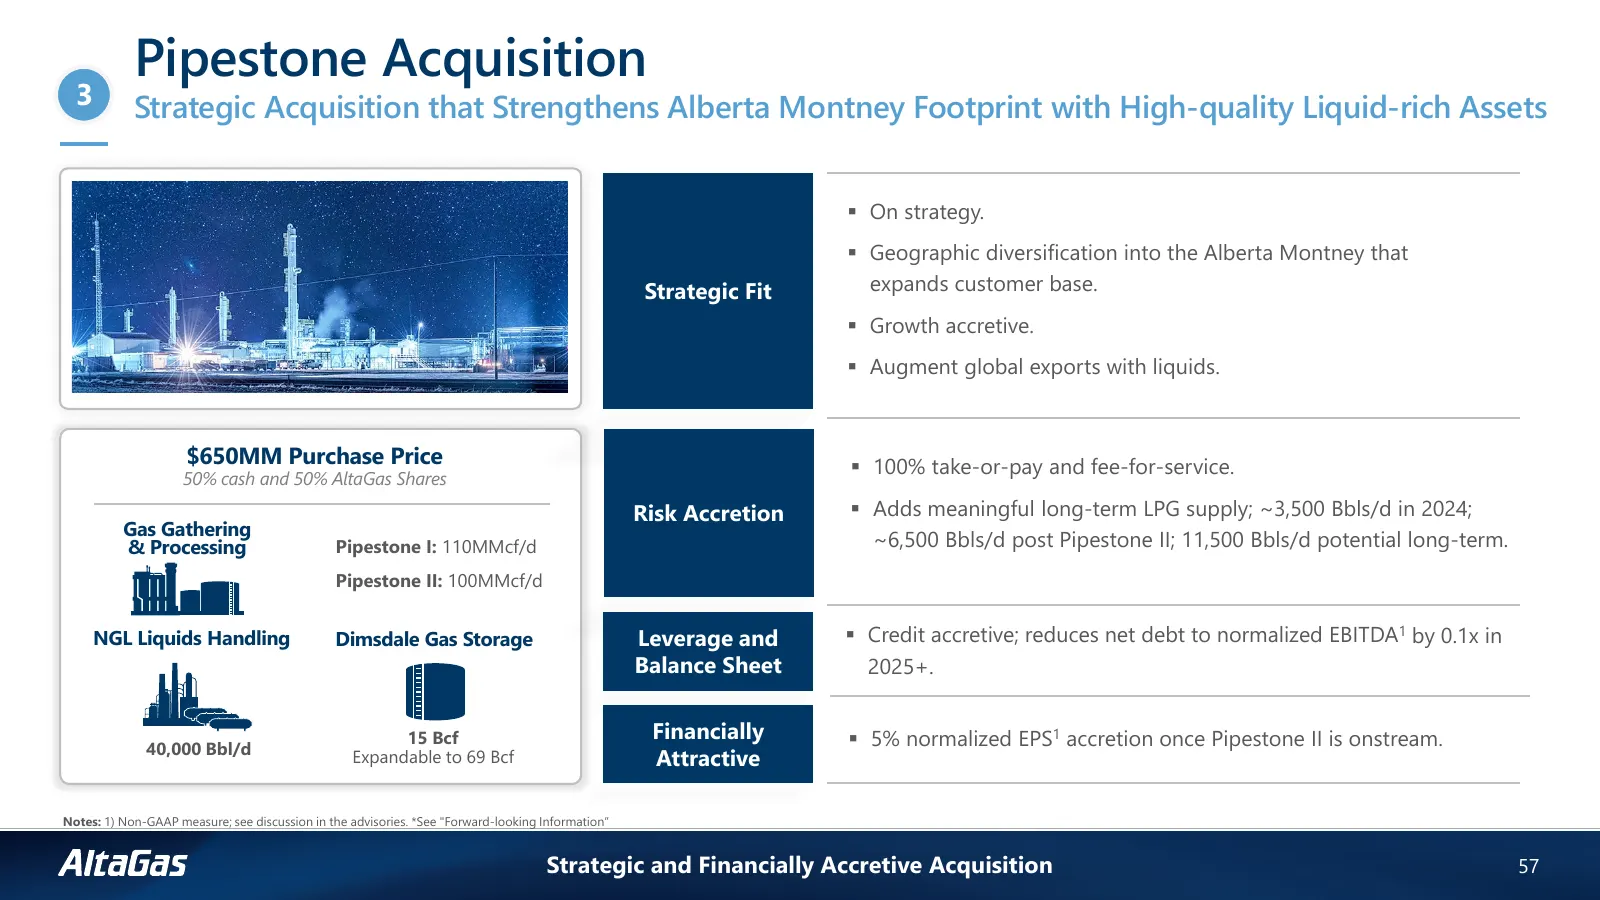
Slide 55: Pipestone Acquisition
Pipestone Acquisition 3 Strategic Acquisition that Strengthens Alberta Montney Footprint with High-quality Liquid-rich Assets On strategy. Geographic diversification into the Alberta Montney that Strategic Fit expands customer base. Growth accretive. Augment global exports with liquids. $650
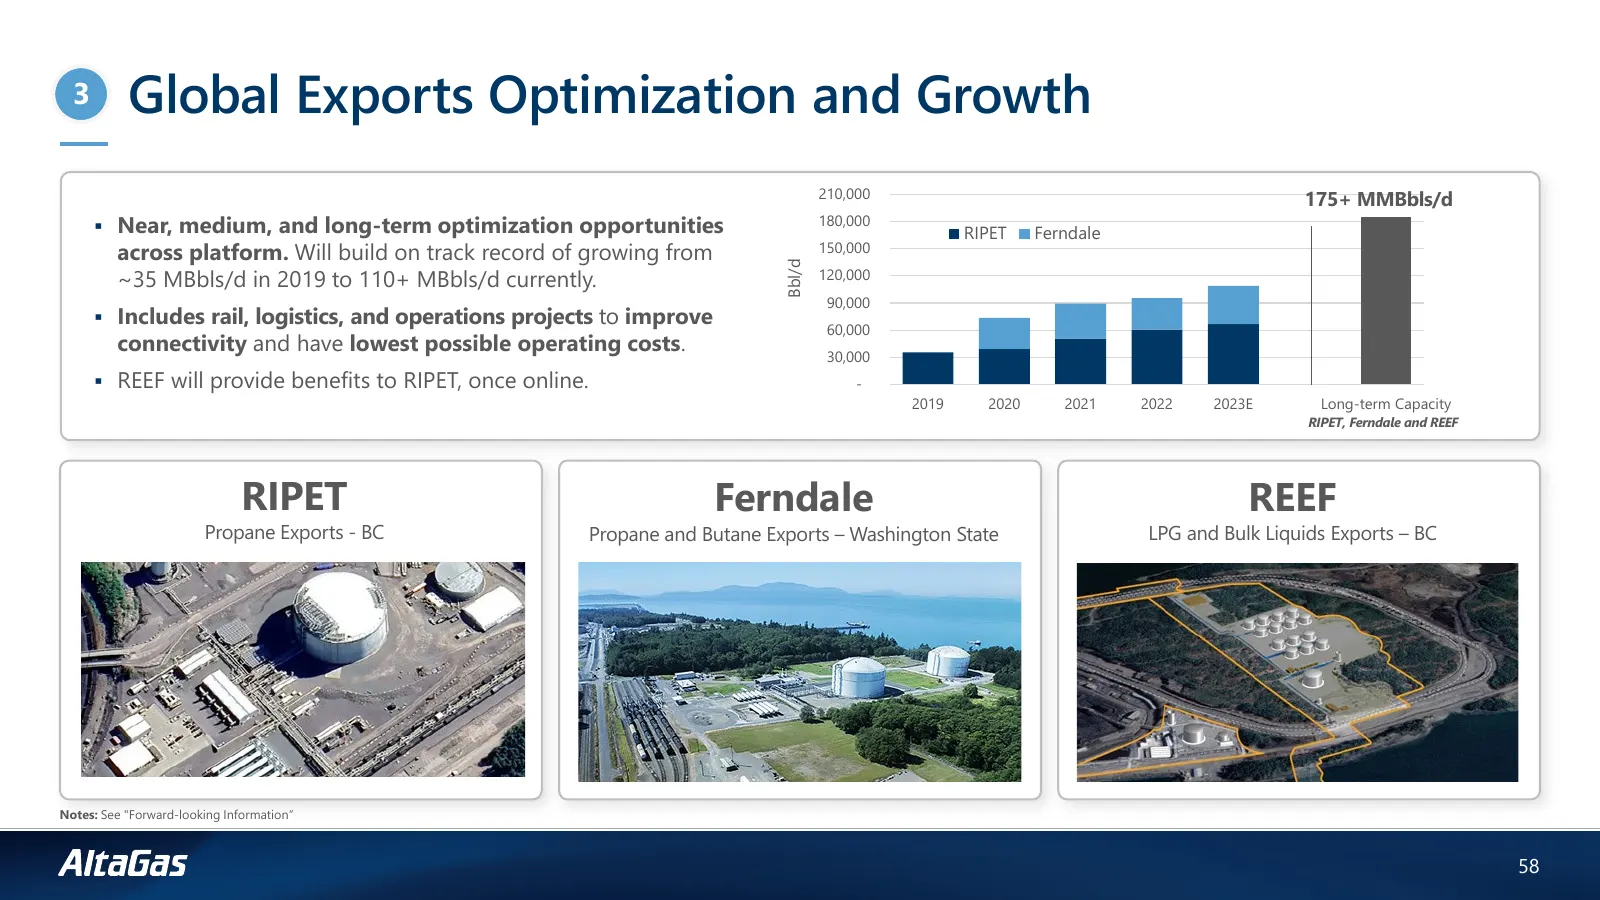
Slide 56: Global Exports Optimization and Growth
3 Global Exports Optimization and Growth 210,000 175+ MMBbls/d Near, medium, and long-term optimization opportunities 180,000 RIPET Ferndale across platform. Will build on track record of growing from 150,000 ~35 MBbls/d in 2019 to 110+ MBbls/d currently. Bbl/d 120,000 90,000 Includes rail, logi
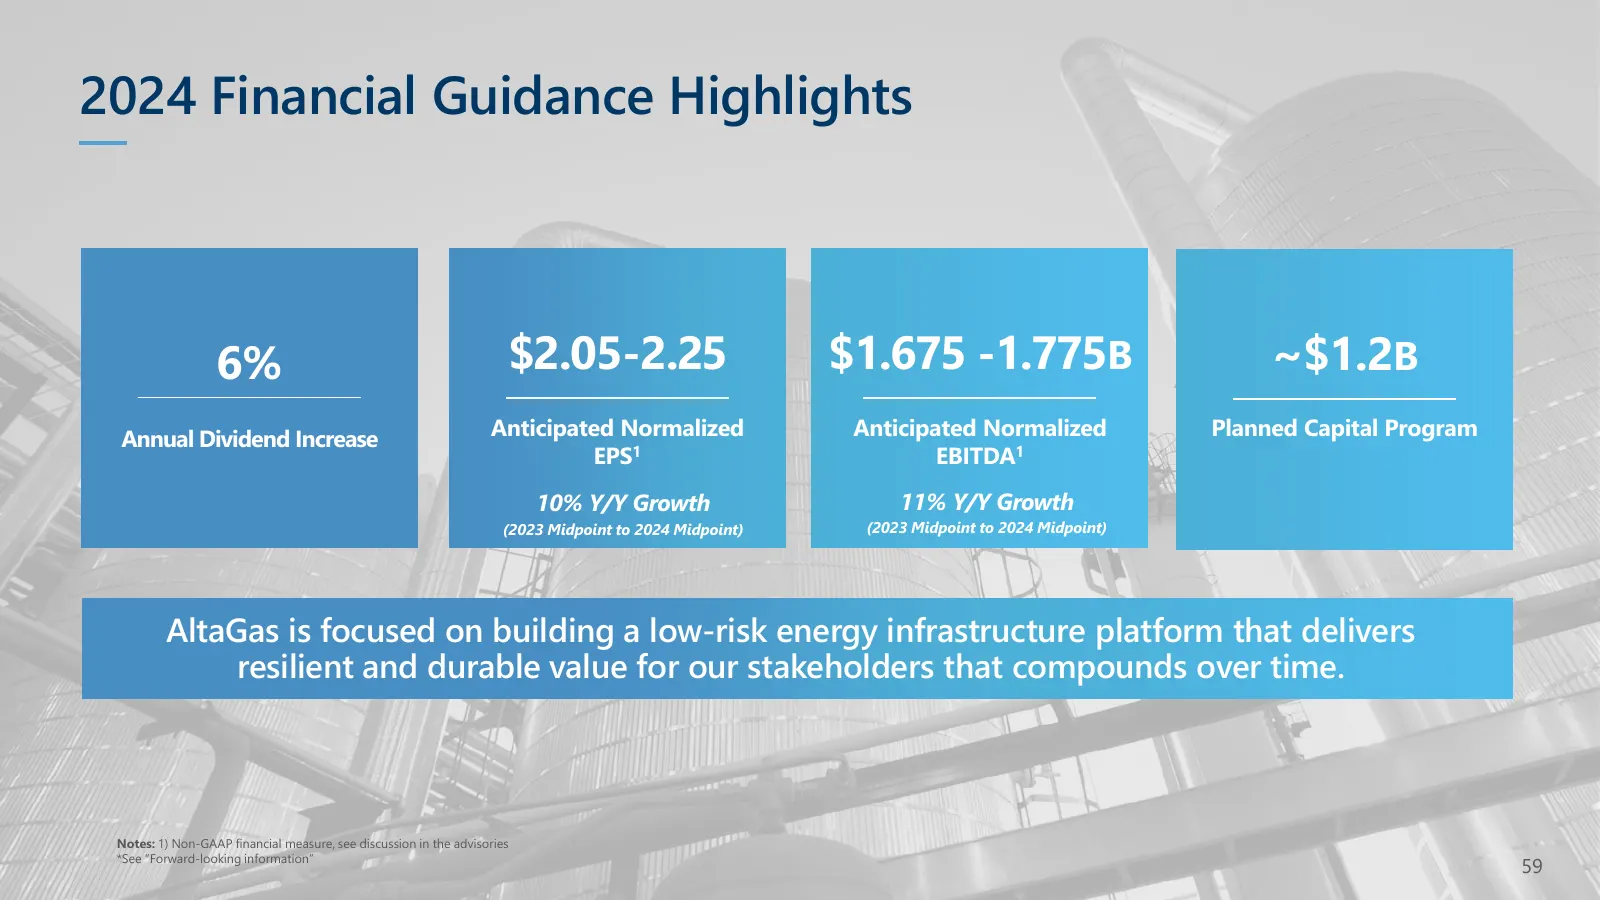
Slide 57: 2024 Financial Guidance Highlights
2024 Financial Guidance Highlights 6% $2.05-2.25 $1.675 -1.775B ~$1.2B Annual Dividend Increase Anticipated Normalized Anticipated Normalized Planned Capital Program EPS1 EBITDA1 10% Y/Y Growth 11% Y/Y Growth (2023 Midpoint to 2024 Midpoint) (2023 Midpoint to 2024 Midpoint) AltaGas is focused on bui
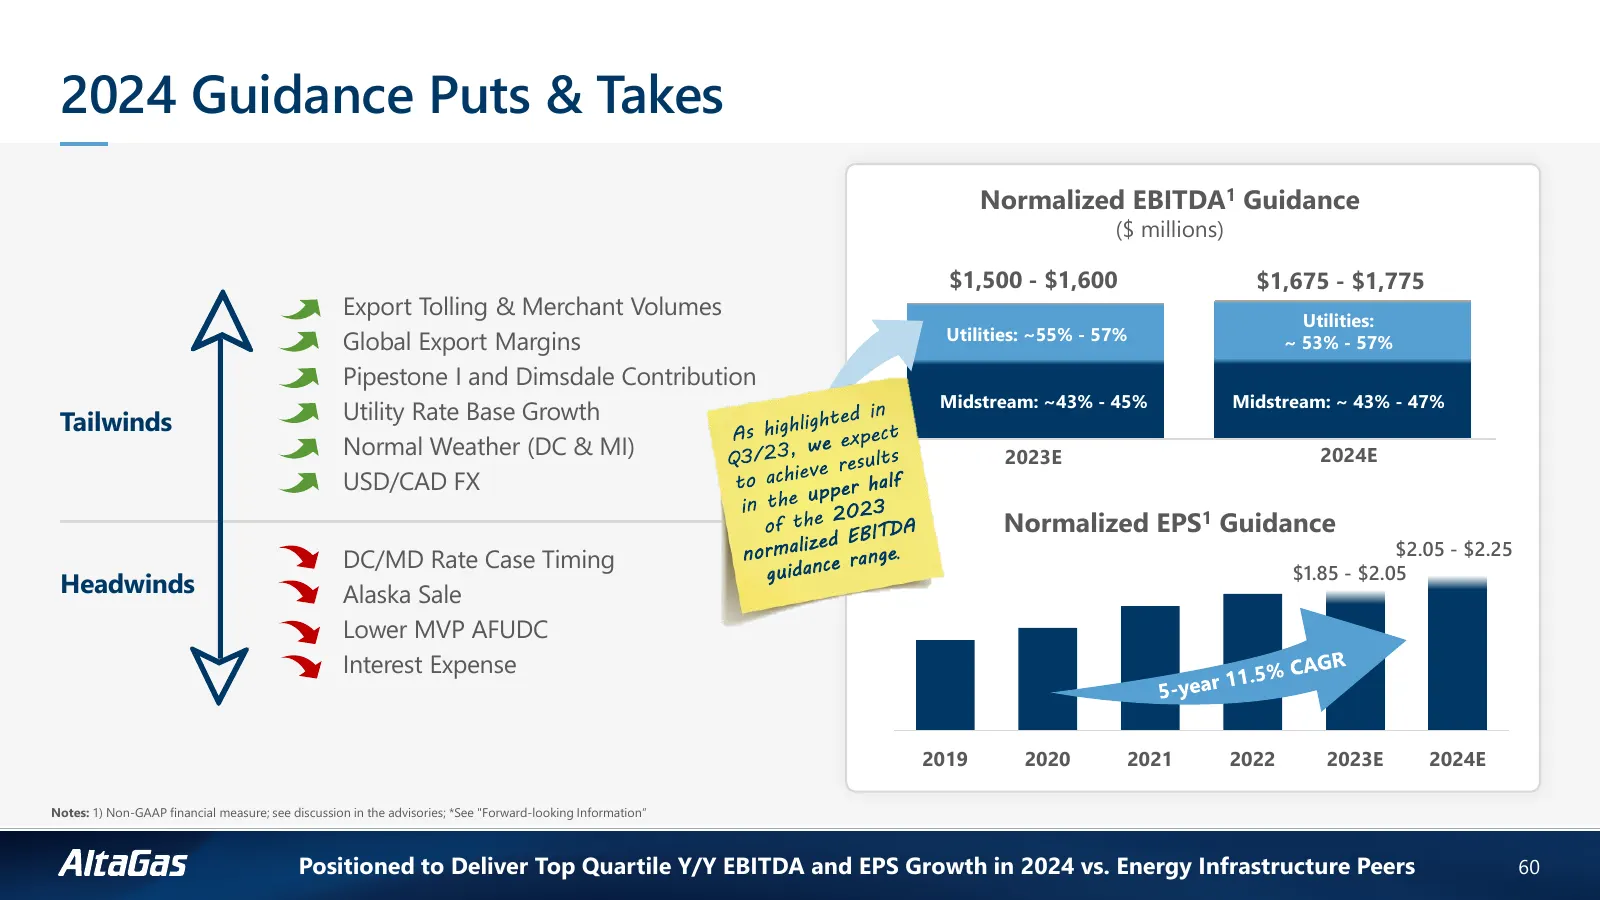
Slide 58: 2024 Guidance Puts & Takes
2024 Guidance Puts & Takes Normalized EBITDA1 Guidance ($ millions) $1,500 - $1,600 $1,675 - $1,775 Export Tolling & Merchant Volumes Utilities: Utilities: ~55% - 57% Global Export Margins ~ 53% - 57% Pipestone I and Dimsdale Contribution Midstream: ~43% - 45% Midstream: ~ 43% - 47% Tailwinds Utilit
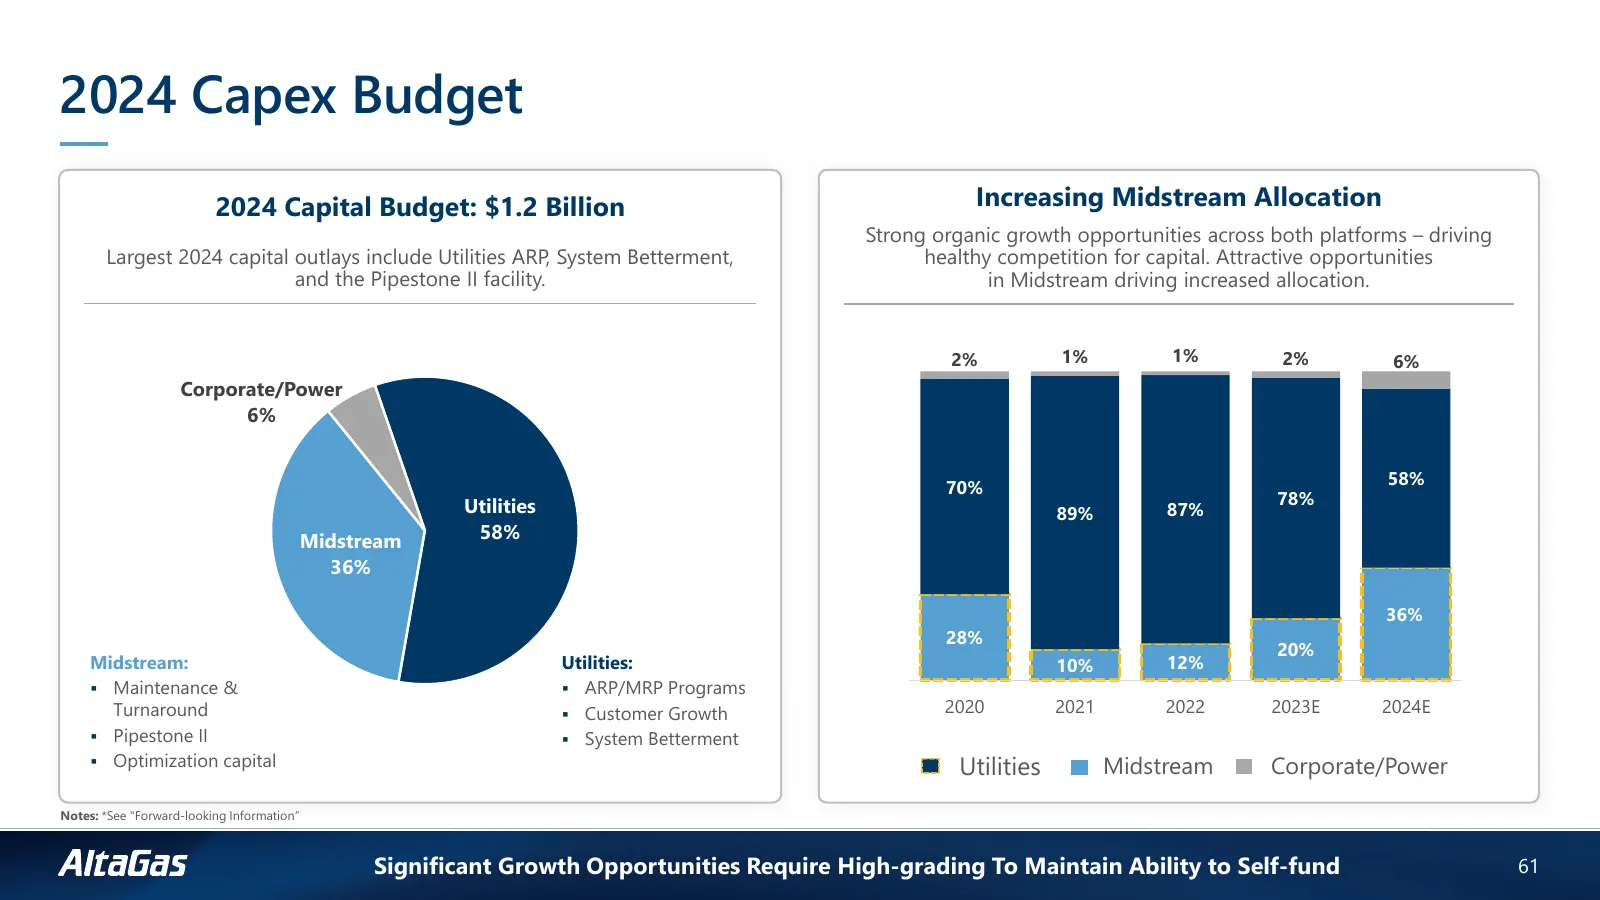
Slide 59: 2024 Capex Budget
2024 Capex Budget 2024 Capital Budget: $1.2 Billion Increasing Midstream Allocation Strong organic growth opportunities across both platforms – driving Largest 2024 capital outlays include Utilities ARP, System Betterment, healthy competition for capital. Attractive opportunities and the Pipestone I
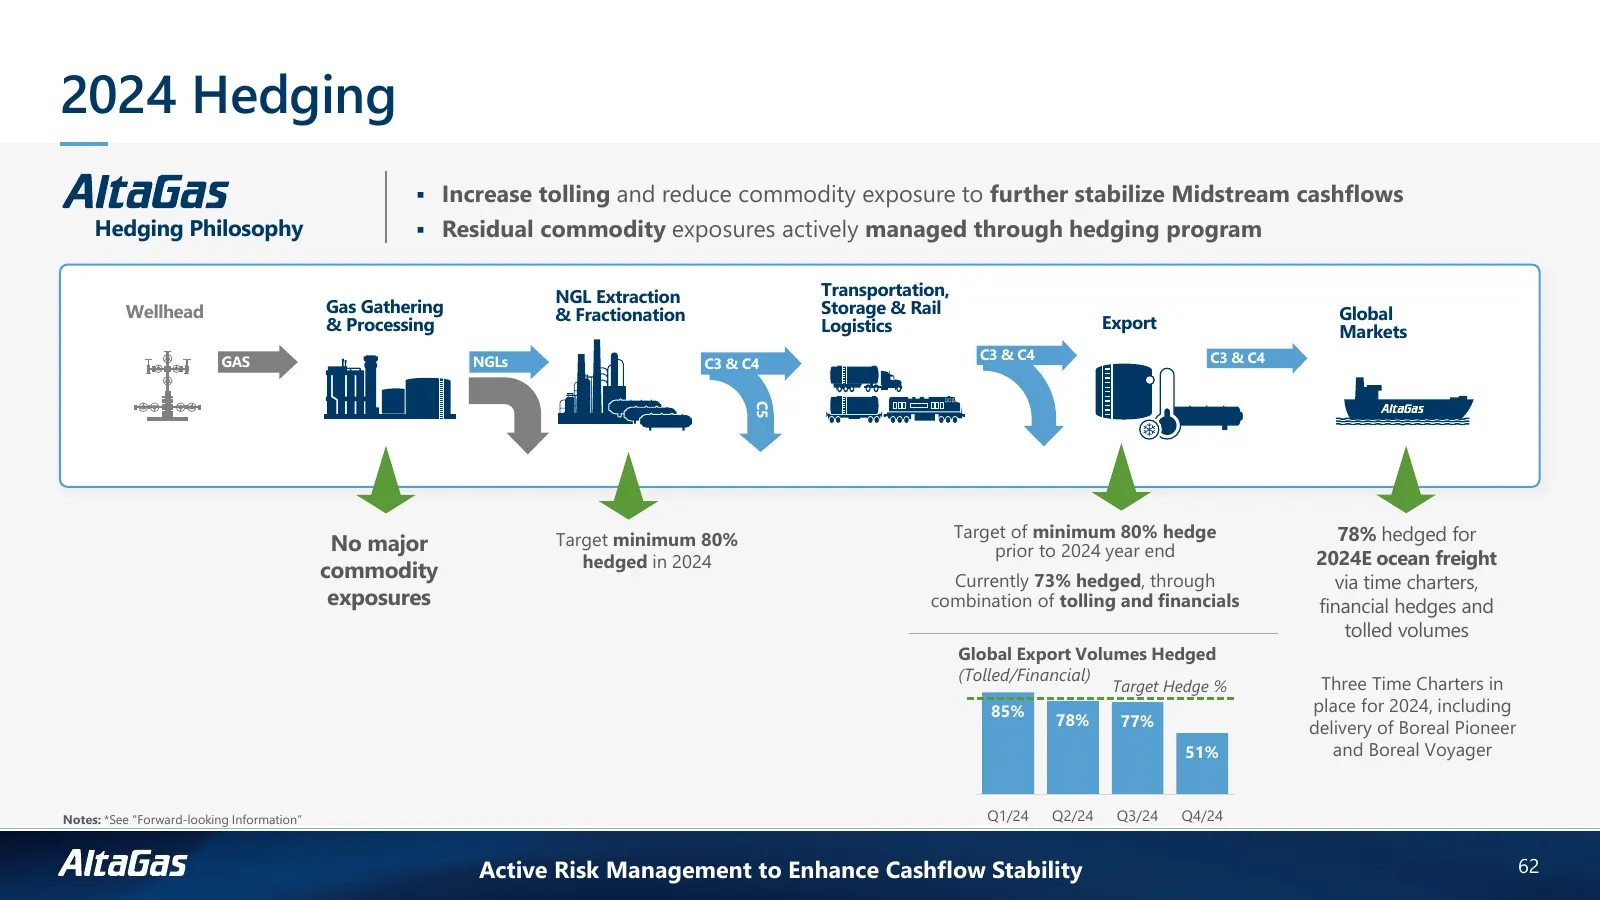
Slide 60: 2024 Hedging
2024 Hedging Increase tolling and reduce commodity exposure to further stabilize Midstream cashflows Hedging Philosophy Residual commodity exposures actively managed through hedging program NGL Extraction Transportation, Wellhead Gas Gathering & Fractionation Storage & Rail Global & Processing L
Source: Internet Archive copy of altagas.ca
More decks from AltaGas Ltd.
 Q3 2026 Earnings Presentation23 slides · Oct 29, 2026
 Q2 2026 Earnings Presentation24 slides · Jul 30, 2026
 Investor Presentation (June 2026)58 slides · June 2026
 Investor Presentation (May 2026)61 slides · May 2026
 Q1 2026 Earnings Presentation24 slides · Apr 30, 2026
 Q4 2025 Earnings Presentation30 slides · Mar 6, 2026