Hill-Rom — Hillenbrand Industries — Investor Presentation (March 2008)
40 slides from Hill-Rom's investor presentation, Mar 13, 2008
Slide 1: Investor Presentation
Investor Presentation Peter H. Soderberg Gregory N. Miller Blair A. Rieth, Jr. President & CEO SVP & CFO VP IR, Comm., & Brand
Slide 2: Forward Looking Statements
Forward Looking Statements Certain statements in this presentation contain forward-looking statements, within the meaning of the Private Securities Litigation Reform Act of 1995, regarding the Company's future plans, objectives, beliefs, expectations, representations and projections. The Company has
Slide 3: Building a Great Business for nearly 80 years
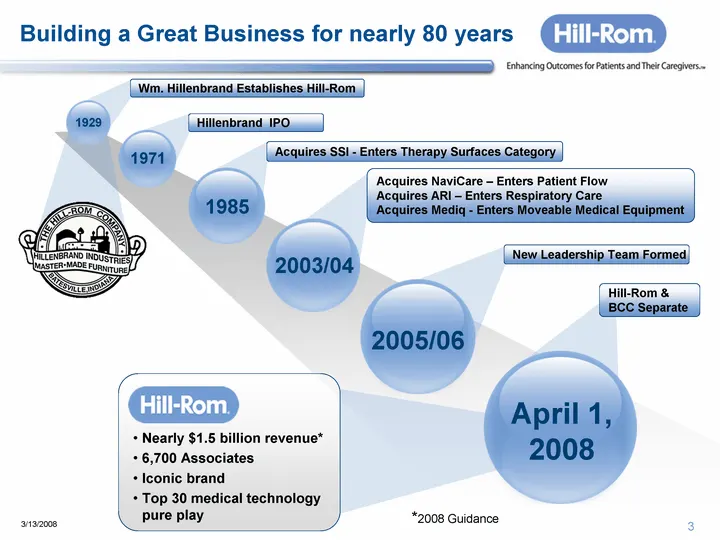
Building a Great Business for nearly 80 years Wm. Hillenbrand Establishes Hill-Rom Hillenbrand IPO 1971 1985 Acquires SSI - Enters Therapy Surfaces Category 2005/06 New Leadership Team Formed Hill-Rom & BCC Separate Acquires NaviCare - Enters Patient Flow Acquires ARI - Enters Respiratory Care Acqui
Slide 4: Today we have a balanced business
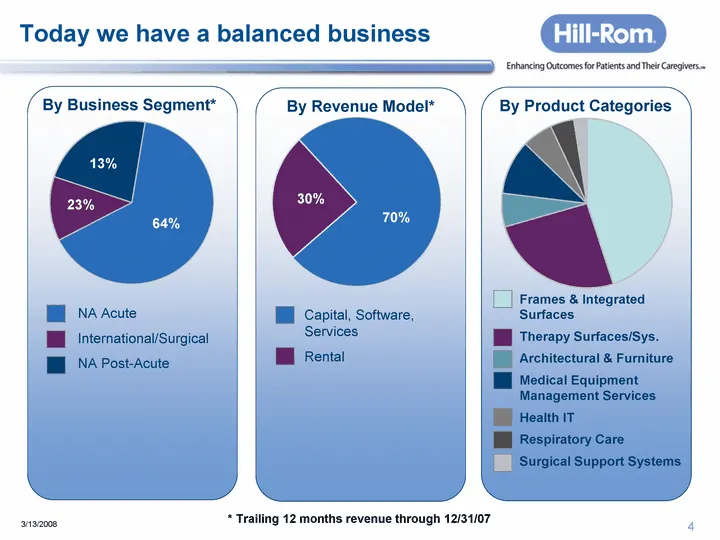
Today we have a balanced business By Business Segment* NA Acute International/Surgical NA Post-Acute By Product Categories Frames & Integrated Surfaces Therapy Surfaces/Sys. Architectural & Furniture Medical Equipment Management Services Health IT Respiratory Care Surgical Support Systems 64% 23% 13
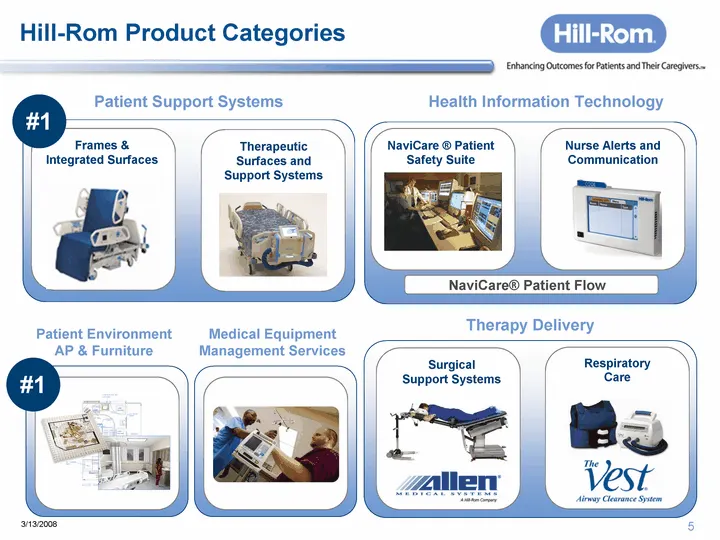
Slide 5: Hill-Rom Product Categories
Frames & Integrated Surfaces Therapeutic Surfaces and Support Systems Patient Support Systems Hill-Rom Product Categories NaviCare (r) Patient Safety Suite Health Information Technology Nurse Alerts and Communication NaviCare(r) Patient Flow Respiratory Care Surgical Support Systems Therapy Delivery
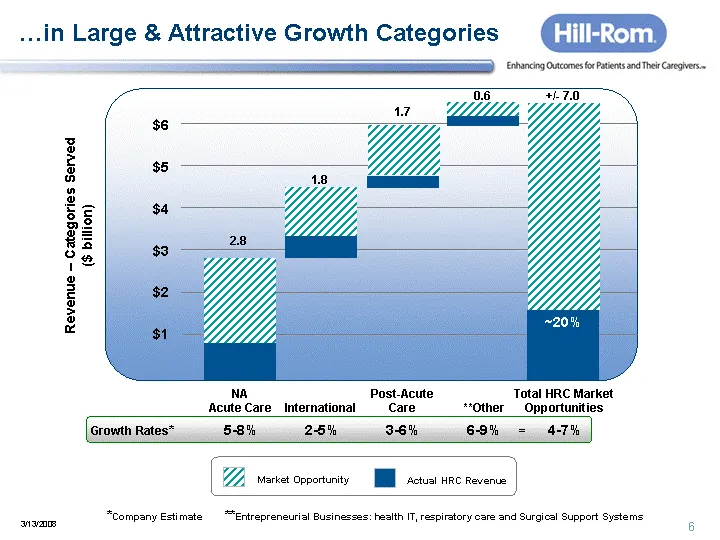
Slide 6: In Large & Attractive Growth Categories
....in Large & Attractive Growth Categories $6 $5 $4 $3 $2 $1 Revenue - Categories Served ($ billion) ~20% Market Opportunity 2.8 1.8 1.7 0.6 +/- 7.0 NA Post-Acute Total HRC Market Acute Care International Care **Other Opportunities Growth Rates* 5-8% 2-5% 3-6% 6-9% 4-7% *Company Estimate **Entrepre
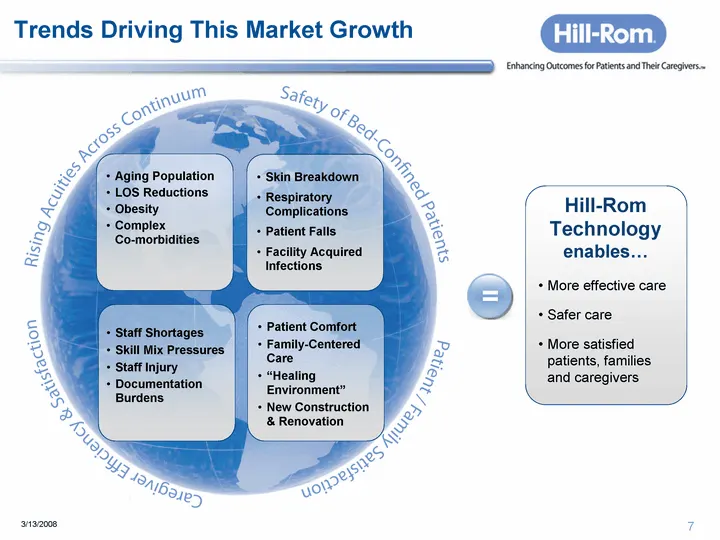
Slide 7: Trends Driving This Market Growth
Trends Driving This Market Growth = Hill-Rom Technology enables... More effective care Safer care More satisfied patients, families and caregivers Skin Breakdown Respiratory Complications Patient Falls Facility Acquired Infections Aging Population LOS Reductions Obesity Complex Co-morbidities Staff
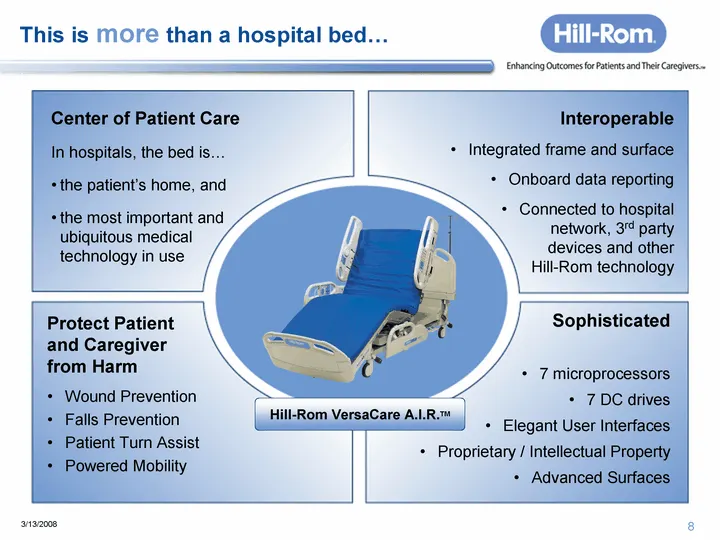
Slide 8: This is more than a hospital bed
This is more than a hospital bed... Center of Patient Care In hospitals, the bed is... the patient's home, and the most important and ubiquitous medical technology in use Protect Patient and Caregiver from Harm Wound Prevention Falls Prevention Patient Turn Assist Powered Mobility Interoperable Inte
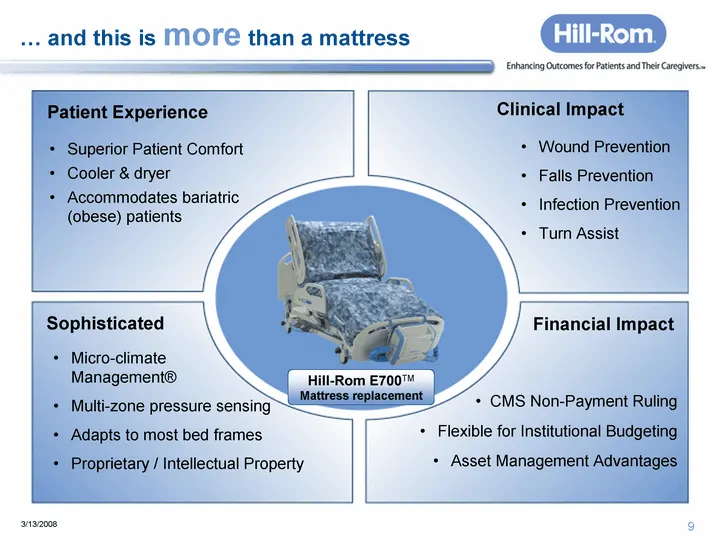
Slide 9: And this is more than a mattress
.... and this is more than a mattress Clinical Impact Superior Patient Comfort Cooler & dryer Accommodates bariatric (obese) patients Financial Impact Micro-climate Management(r) Multi-zone pressure sensing Adapts to most bed frames Proprietary / Intellectual Property Wound Prevention Falls Preventi
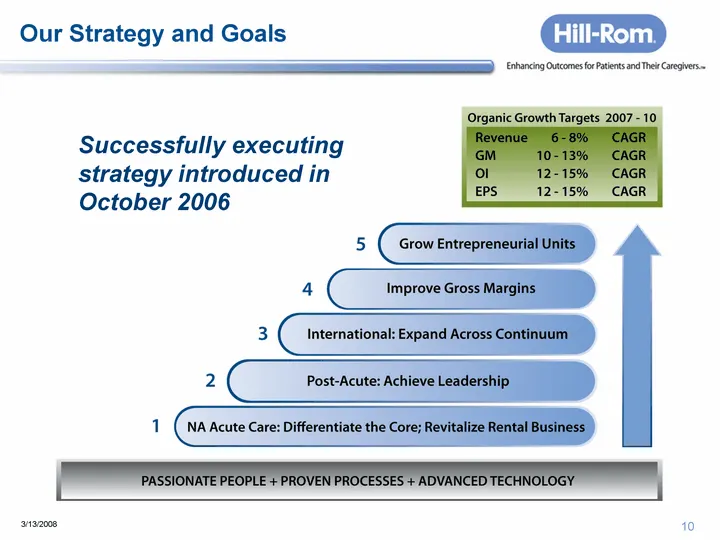
Slide 10: Our Strategy and Goals
Our Strategy and Goals Successfully executing strategy introduced in October 2006
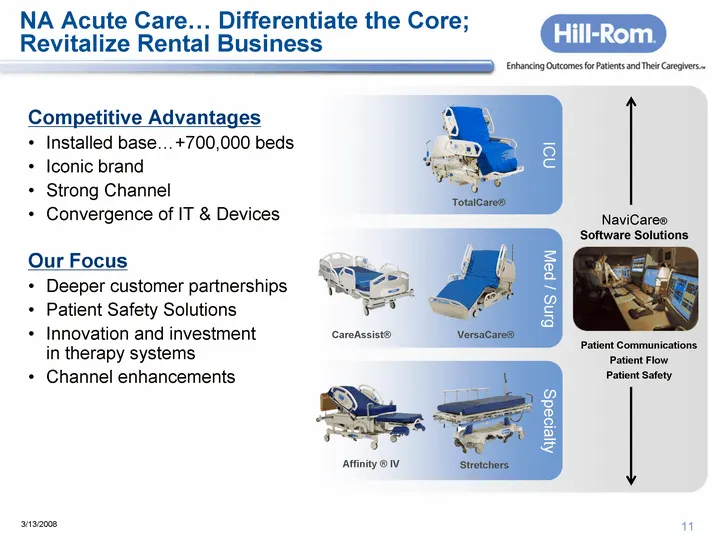
Slide 11: NA Acute Care: Differentiate the Core; Revitalize Rental Business
Med / Surg ICU NA Acute Care... Differentiate the Core; Revitalize Rental Business Competitive Advantages Installed base...+700,000 beds Iconic brand Strong Channel Convergence of IT & Devices Our Focus Deeper customer partnerships Patient Safety Solutions Innovation and investment in therapy system
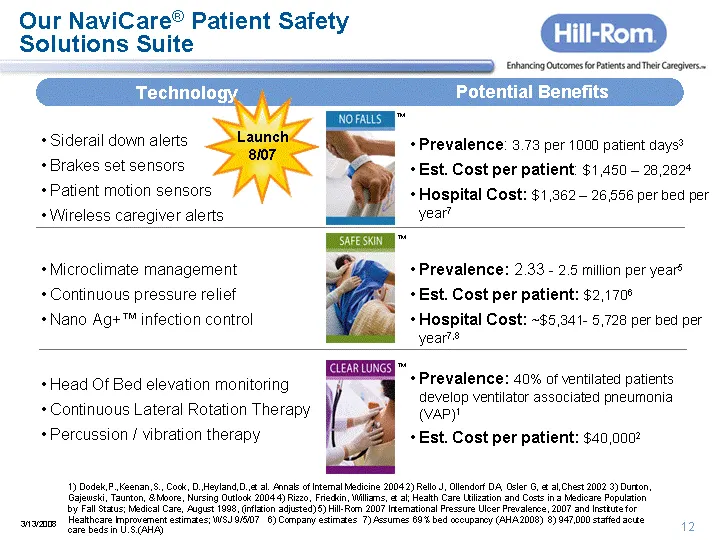
Slide 12: Our NaviCare Patient Safety Solutions Suite
Our NaviCare(r) Patient Safety Solutions Suite Potential Benefits Technology Siderail down alerts Brakes set sensor Patient pressure sensor Prevalence: 3.73 per 1000 patient days3 Cost per patient: $26,2354 Hospital Cost: ~$30,360 per bed per year7 Head Of Bed elevation monitoring Continuous Lateral
Slide 13: We have made targeted investments
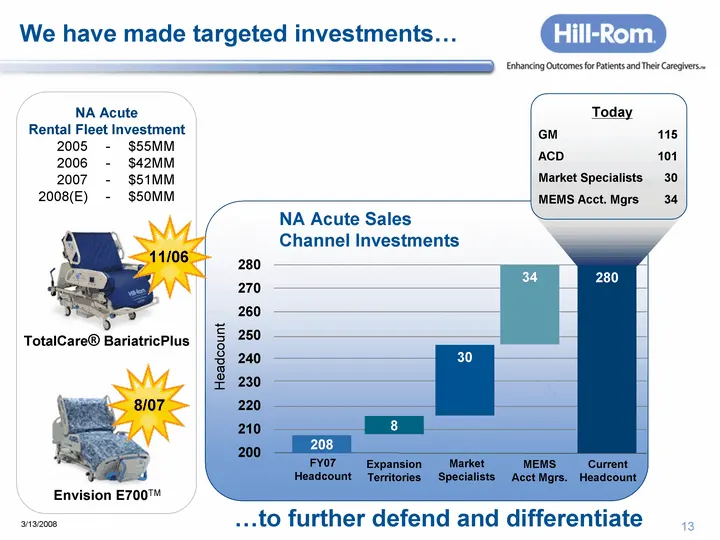
We have made targeted investments... NA Acute Rental Fleet Investment 2005 - $55MM 2006 - $42MM 2007 - $51MM 2008(E) - $50MM NA Acute Sales Channel Investments FY07 Headcount Expansion Territories Market Specialists MEMS Acct Mgrs. Current Headcount 280 270 260 250 240 230 220 210 200 30 280 208 8 3
Slide 14: Achieve a Leadership Position in NA Post-Acute Care
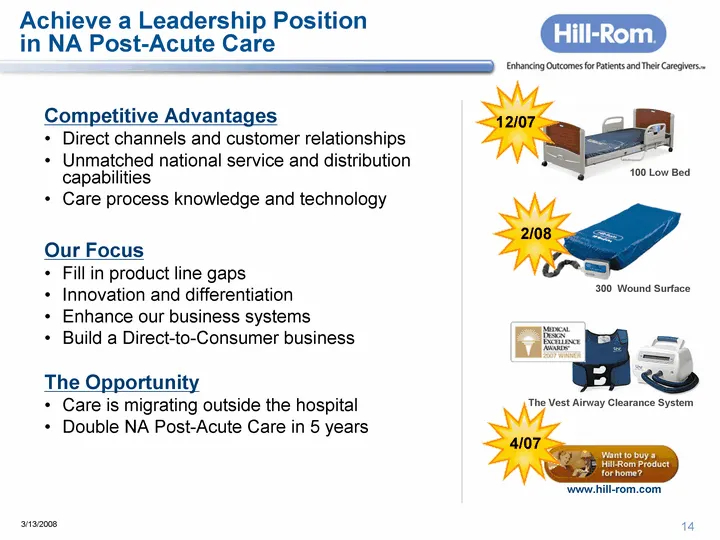
Achieve a Leadership Position in NA Post-Acute Care Competitive Advantages Direct channels and customer relationships Unmatched national service and distribution capabilities Care process knowledge and technology Our Focus Fill in product line gaps Innovation and differentiation Enhance our business
Slide 15: Rapidly Grow International
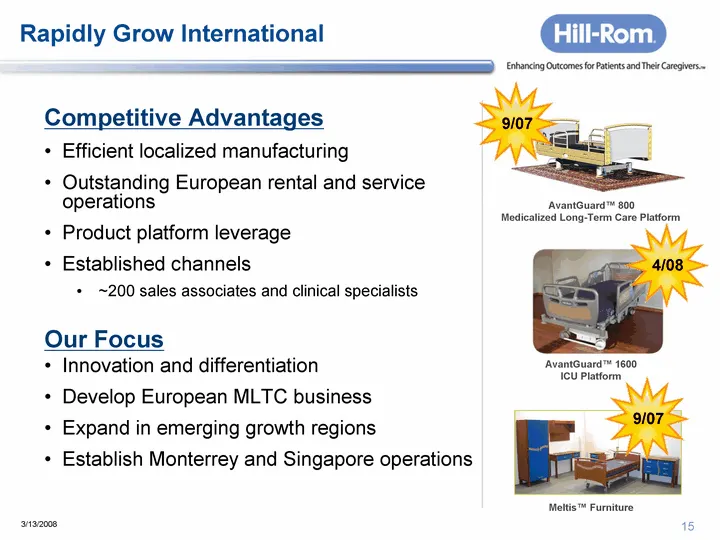
Rapidly Grow International Competitive Advantages Efficient localized manufacturing Outstanding European rental and service operations Product platform leverage Established channels ~200 sales associates and clinical specialists Our Focus Innovation and differentiation Develop European MLTC business
Slide 16: We are Taking Share Internationally
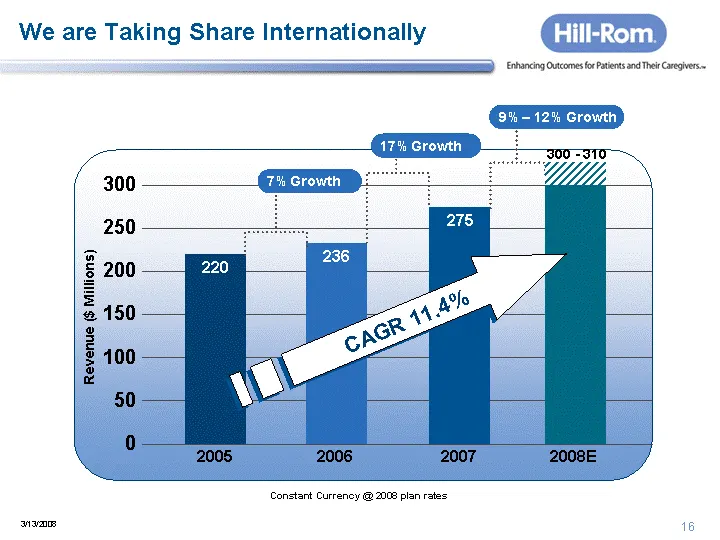
We are Taking Share Internationally 236 275 220 300 250 200 150 100 50 0 7% Growth 2005 2006 2007 2008E 17% Growth 9% - 12% Growth CAGR 11.4% Constant Currency @ 2008 plan rates 300 - 310 Revenue ($ Millions)
Slide 17: We Seek Improved Gross Margins
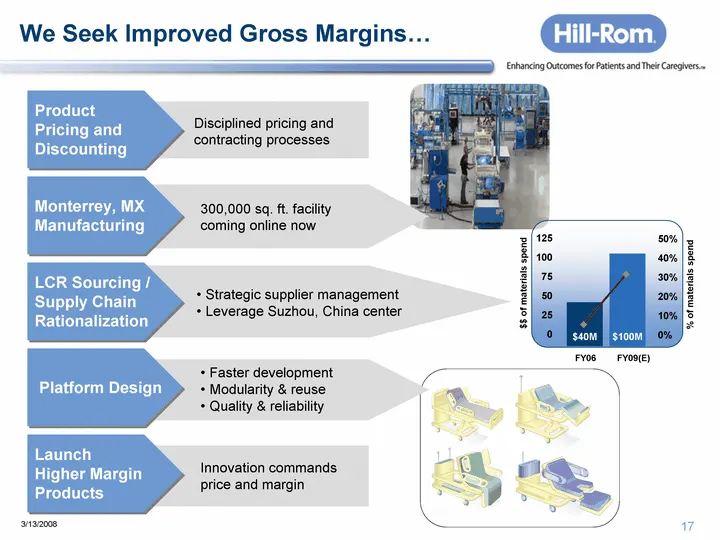
Product Pricing and Discounting Disciplined pricing and contracting processes LCR Sourcing / Supply Chain Rationalization We Seek Improved Gross Margins... Monterrey, MX Manufacturing 300,000 sq. ft. facility coming online now Platform Design Faster development Modularity & reuse Quality & reliabili
Slide 18: Especially by accelerating innovation
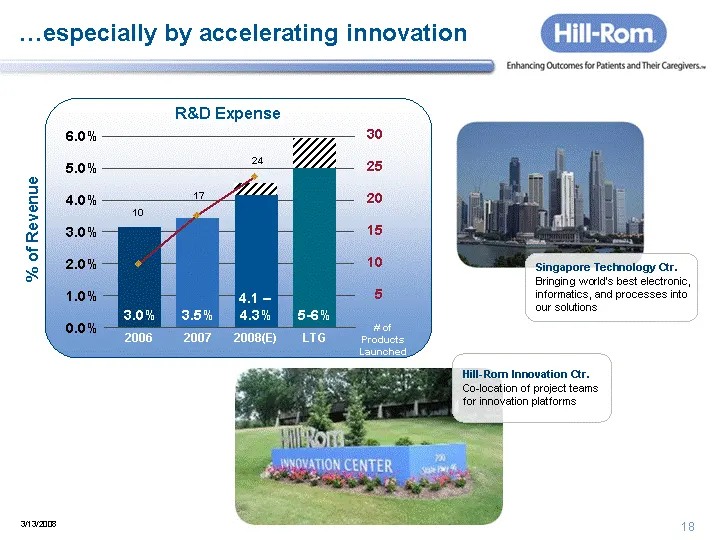
....especially by accelerating innovation 6.0% 5.0% 4.0% 3.0% 2.0% 1.0% 0.0% R&D Expense 2006 2007 2008(E) LTG 3.5% 4.1 - 4.3% 3.0% 5-6% Singapore Technology Ctr. Bringing world's best electronic, informatics, and processes into our solutions 10 17 24 30 25 20 15 10 5 # of Products Launched % of Rev
Slide 19: We are looking outward for opportunities to add value
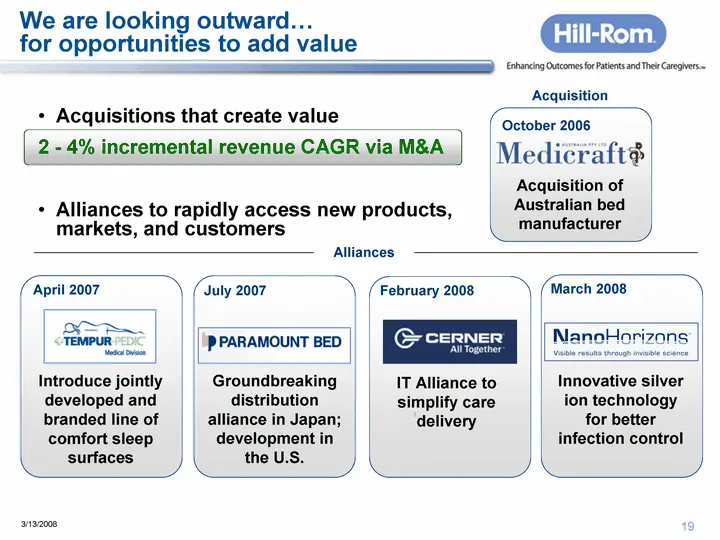
March 2008 Innovative silver ion technology for better infection control We are looking outward... for opportunities to add value Acquisitions that create value 2 - 4% incremental revenue CAGR via M&A Alliances to rapidly access new products, markets, and customers April 2007 July 2007 February 2008
Slide 20: We expect our separation will...
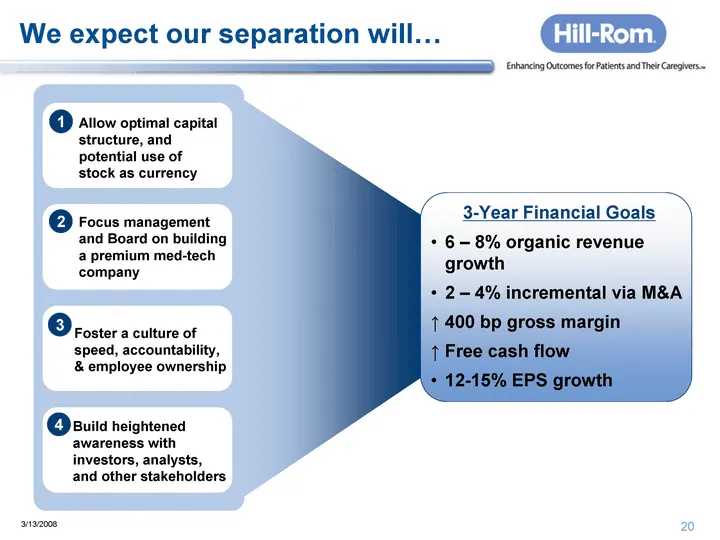
We expect our separation will... 3-Year Financial Goals 6 - 8% organic revenue growth 2 - 4% incremental via M&A 400 bp gross margin Free cash flow 12-15% EPS growth 1 3 2 4 Focus management and Board on building a premium med-tech company Foster a culture of speed, accountability, & employee owners

Slide 21: Financial Perspective
Enhancing Outcomes for Patients and Their Caregivers. Financial Perspective er =~ ‘avazooe (©2008 Rem Sense, ALL RIGHTS RESERVED. 24
Slide 22: Revenue Growth is Accelerating
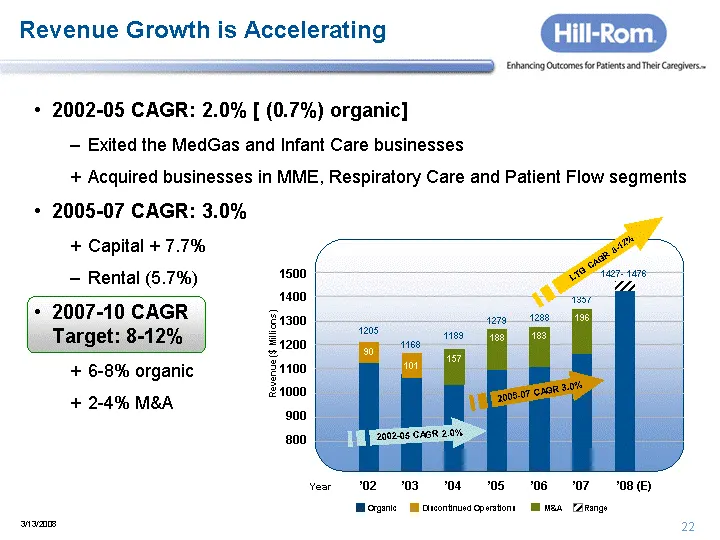
2002-05 CAGR: 2.0% [ (0.7%) organic] Exited the MedGas and Infant Care businesses Acquired businesses in MME, Respiratory Care and Patient Flow segments 2005-07 CAGR: 3.0% Capital + 7.7% Rental (5.7%) 2007-10 CAGR Target: 8-12% 6-8% organic 2-4% M&A Revenue Growth is Accelerating Year 1500 1400 1300
Slide 23: Recent Quarterly Performance is Encouraging
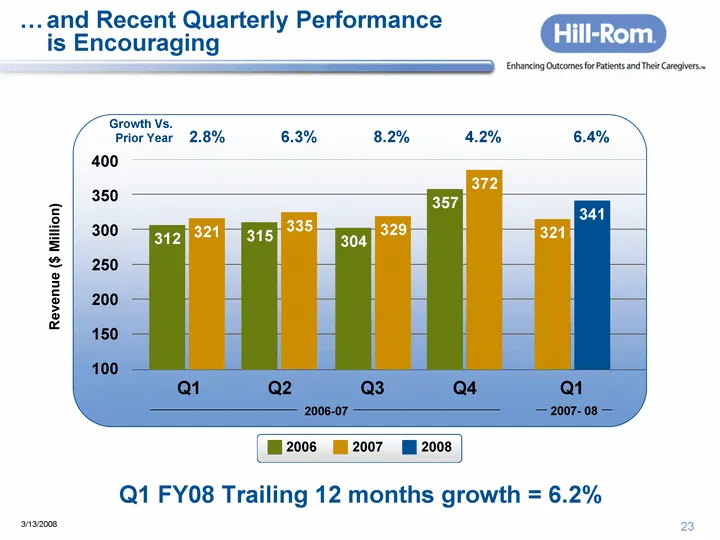
.... and Recent Quarterly Performance is Encouraging 400 350 300 250 200 150 100 321 312 2.8% Q1 335 315 6.3% Q2 329 304 8.2% Q3 372 357 4.2% Q4 341 2006 2007 2008 6.4% 321 Q1 2006-07 2007- 08 Revenue ($ Million) Growth Vs. Prior Year Q1 FY08 Trailing 12 months growth = 6.2%
Slide 24: Gross Margins begin to improve
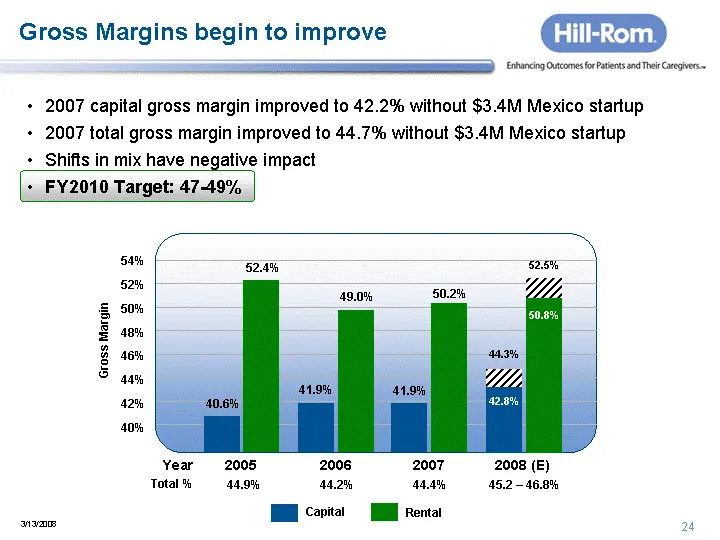
Gross Margins begin to improve 2007 capital gross margin improved to 42.2% without $3.4M Mexico startup 2007 total gross margin improved to 44.7% without $3.4M Mexico startup Shifts in mix have negative impact FY2010 Target: 47-49% Capital Rental 54% 52% 50% 48% 46% 44% 42% 40% 2005 40.6% Year Total
Slide 25: Operating Expenses Reflect Investments
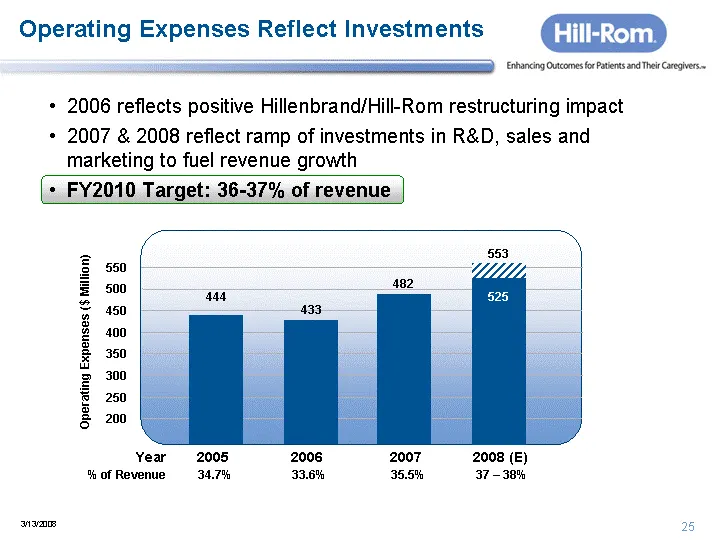
Operating Expenses Reflect Investments 2006 reflects positive Hillenbrand/Hill-Rom restructuring impact 2007 & 2008 reflect ramp of investments in R&D, sales and marketing to fuel revenue growth FY2010 Target: 36-37% of revenue 05 550 500 450 400 350 300 250 200 2005 444 Year % of Revenue 2006 2007
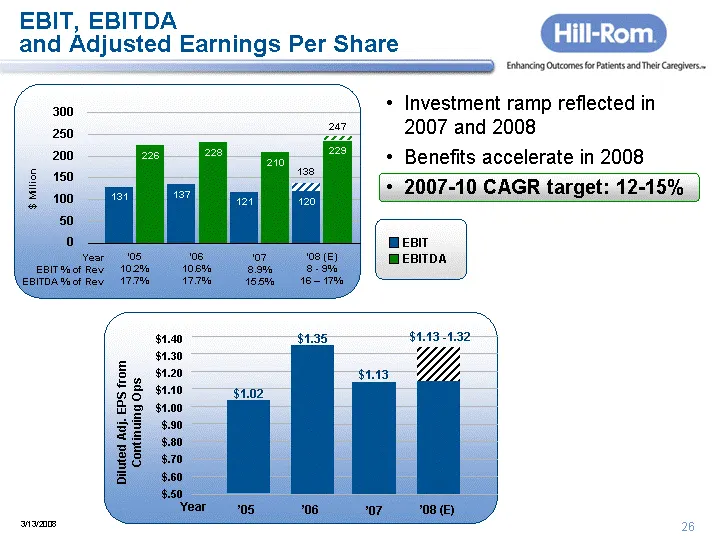
Slide 26: EBIT, EBITDA and Adjusted Earnings Per Share
EBIT, EBITDA and Adjusted Earnings Per Share Investment ramp reflected in 2007 and 2008 Benefits accelerate in 2008 2007-10 CAGR target: 12-15% 131 121 120 137 300 250 200 150 100 50 0 247 '05 10.2% 17.7% '06 10.6% 17.7% '07 8.9% 15.5% '08 (E) 8 - 9% 16 - 17% $ Million 226 210 229 228 138 EBIT EBITD
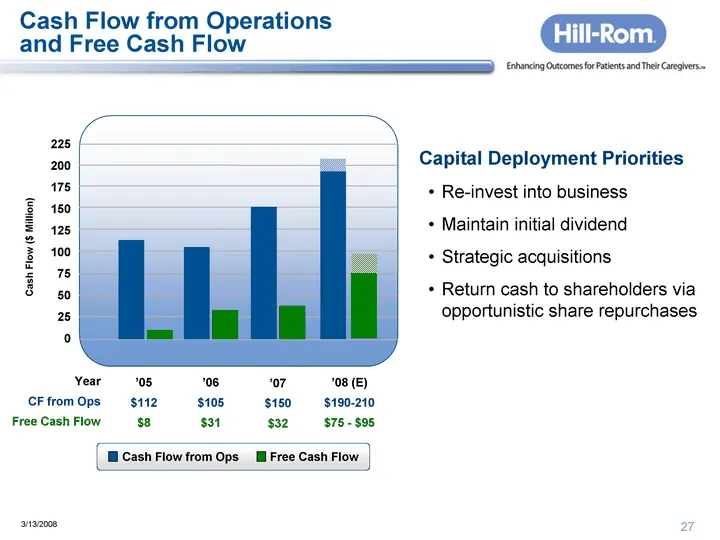
Slide 27: Cash Flow from Operations and Free Cash Flow
Cash Flow from Operations and Free Cash Flow Capital Deployment Priorities Re-invest into business Maintain initial dividend Strategic acquisitions Return cash to shareholders via opportunistic share repurchases 225 200 175 150 125 100 75 50 25 0 '05 $112 $8 '06 $80 $6 '07 $150 $32 '08 (E) $190-210
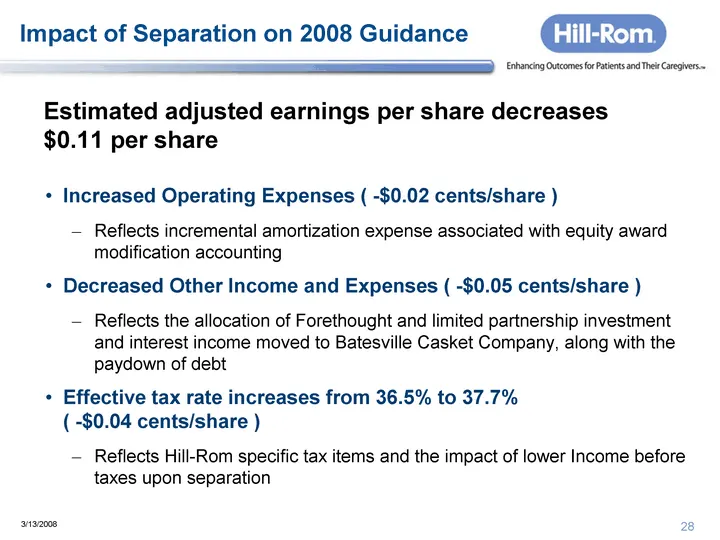
Slide 28: Impact of Separation on 2008 Guidance
Impact of Separation on 2008 Guidance Increased Operating Expenses ( -$0.02 cents/share ) Reflects incremental amortization expense associated with equity award modification accounting Decreased Other Income and Expenses ( -$0.05 cents/share ) Reflects the allocation of Forethought and limited partn
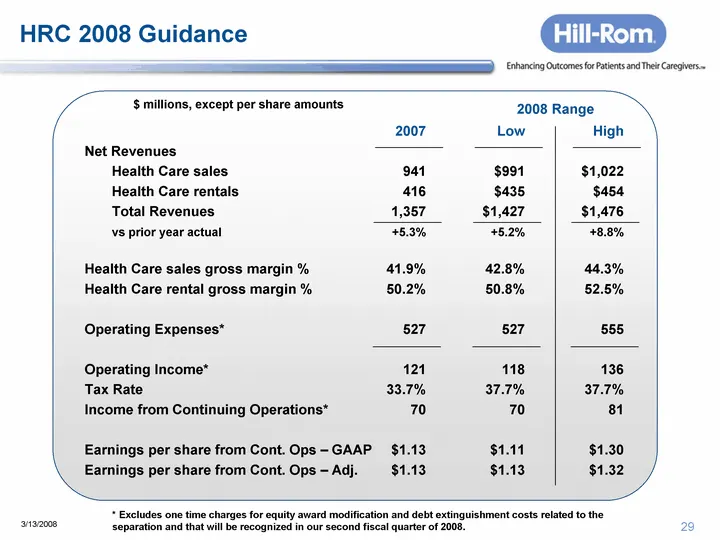
Slide 29: HRC 2008 Guidance
HRC 2008 Guidance 2007 Low High Net Revenues Health Care sales 941 $991 $1,022 Health Care rentals 416 $435 $454 Total Revenues 1,357 $1,427 $1,476 vs prior year actual +5.3% +5.2% +8.8% Health Care sales gross margin % 41.9% 42.8% 44.3% Health Care rental gross margin % 50.2% 50.8% 52.5% Operating
Slide 30: Why Hill-Rom? Why Now?
Why Hill-Rom? Why Now? New leadership team keeping its promises...investments bearing fruit Iconic brand and large install base Business model and portfolio diversity...Much more than a bed company Growth is clearly accelerating Leverage is building...across the care continuum... around the world Se
Slide 31: Appendix
Enhancing Outcomes for Patients and Their Caregivers.» APPENDIX ‘anazooe (©2008 item See, ALL RIGHTS RESERVED. 34
Slide 32: Spin-off mechanics: Distribution time table
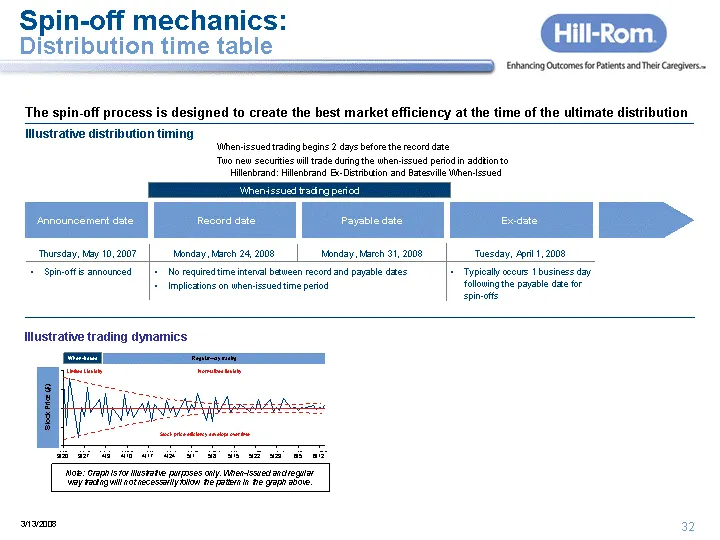
Spin-off mechanics: Distribution time table The spin-off process is designed to create the best market efficiency at the time of the ultimate distribution Illustrative distribution timing Announcement date Record date Payable date Ex-date Thursday, May 10, 2007 Monday, March 24, 2008 Monday, March 3
Slide 33: Spin-off mechanics: Trading vehicles during when-issued
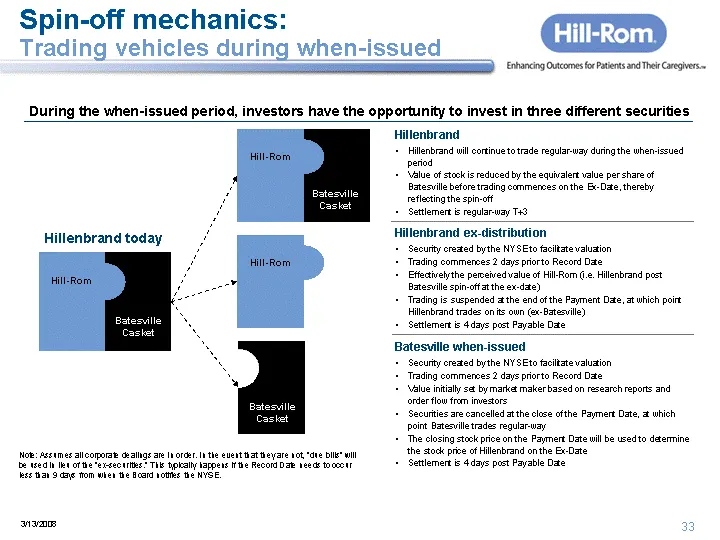
Spin-off mechanics: Trading vehicles during when-issued During the when-issued period, investors have the opportunity to invest in three different securities Hillenbrand today Batesville Casket Hill-Rom Batesville Casket Hill-Rom Batesville Casket Hillenbrand Hillenbrand will continue to trade regul
Slide 34: Reconciliation: International Revenue
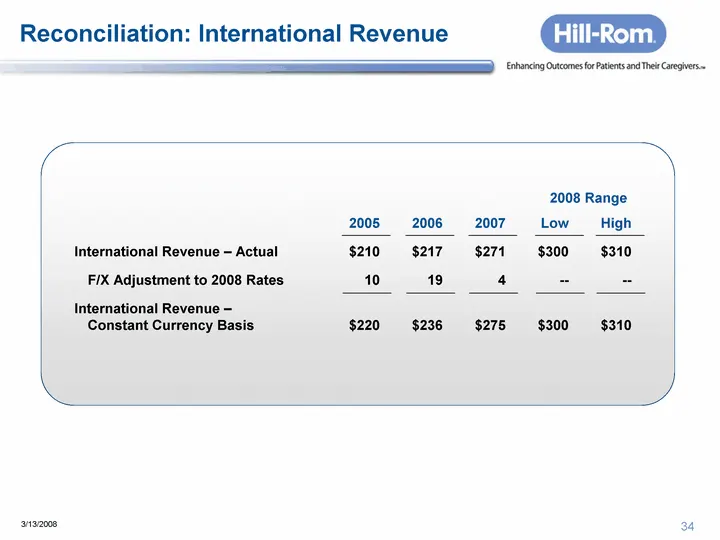
Reconciliation: International Revenue 2005 2006 2007 Low High International Revenue - Actual $210 $217 $271 $300 $310 F/X Adjustment to 2008 Rates 10 19 4 -- -- International Revenue - Constant Currency Basis $220 $236 $275 $300 $310 2008 Range
Slide 35: Reconciliation: Operating Expenses
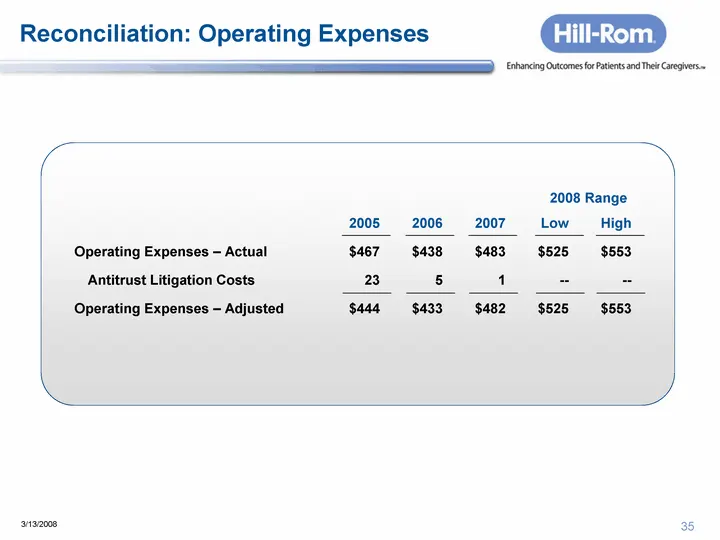
Reconciliation: Operating Expenses 2005 2006 2007 Low High Operating Expenses - Actual $467 $438 $483 $525 $553 Antitrust Litigation Costs 23 5 1 -- -- Operating Expenses - Adjusted $444 $433 $482 $525 $553 2008 Range
Slide 36: Reconciliation: EBIT and EBITDA
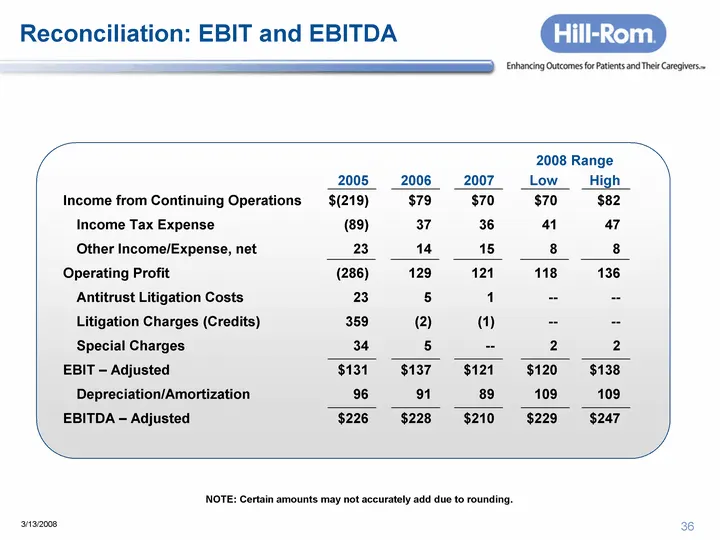
Reconciliation: EBIT and EBITDA 2005 2006 2007 Low High Income from Continuing Operations $(219) $79 $70 $70 $82 Income Tax Expense (89) 37 36 41 47 Other Income/Expense, net 23 14 15 8 8 Operating Profit (286) 129 121 118 136 Antitrust Litigation Costs 23 5 1 -- -- Litigation Charges (Credits) 359
Slide 37: Reconciliation: EPS
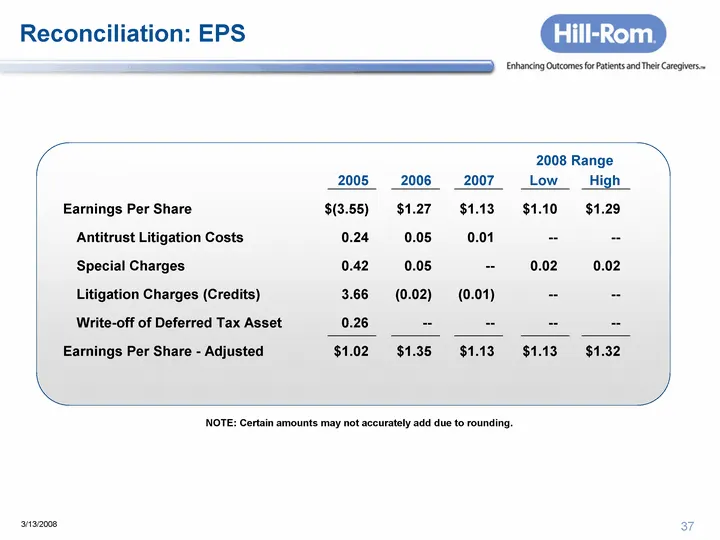
Reconciliation: EPS 2005 2006 2007 Low High Earnings Per Share $(3.55) $1.27 $1.13 $1.10 $1.29 Antitrust Litigation Costs 0.24 0.05 0.01 -- -- Special Charges 0.42 0.05 -- 0.02 0.02 Litigation Charges (Credits) 3.66 (0.02) (0.01) -- -- Write-off of Deferred Tax Asset 0.26 -- -- -- -- Earnings Per Sh
Slide 38: Reconciliation: Cash Flow
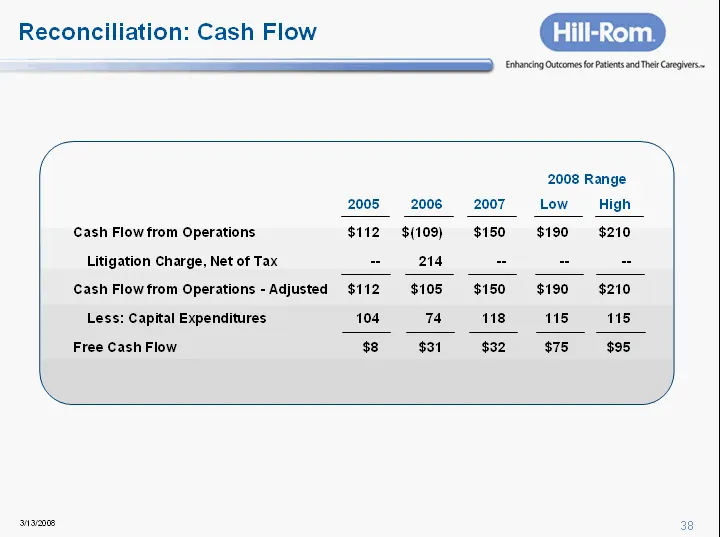
Reconciliation: Cash Flow 2005 2006 2007 Low High Cash Flow from Operations $112 $(109) $150 $190 $210 Litigation Charge, Net of Tax -- 189 -- -- -- Cash Flow from Operations - Adjusted $112 $80 $150 $190 $210 Less: Capital Expenditures 104 74 118 115 115 Free Cash Flow $8 $6 $32 $75 $95 2008 Range
Slide 39: Anti-Trust Litigation Update
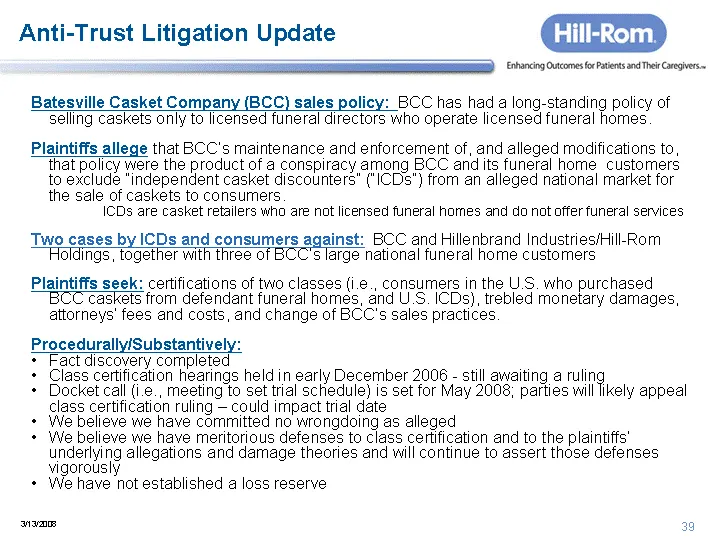
Anti-Trust Litigation Update Batesville Casket Company (BCC) sales policy: BCC has had a long-standing policy of selling caskets only to licensed funeral directors who operate licensed funeral homes. Plaintiffs allege that BCC's maintenance and enforcement of, and alleged modifications to, that poli
Slide 40: Judgment Sharing Agreement (JSA)
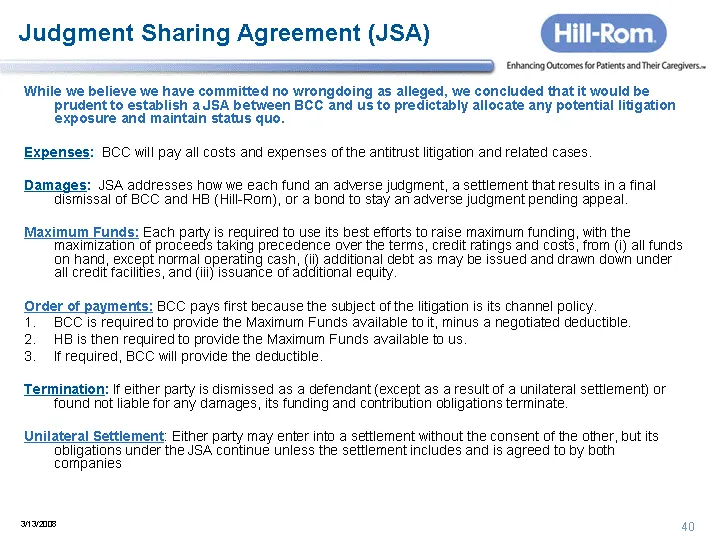
Judgment Sharing Agreement (JSA) While we believe we have committed no wrongdoing as alleged , we concluded that it would be prudent to establish a JSA between BCC and us to predictably allocate any potential litigation exposure and maintain status quo. Expenses: BCC will pay all costs and expenses
Source: SEC EDGAR · 8-K filed Mar 13, 2008
More decks from Hill-Rom Holdings Inc
 Merger or Acquisition (September 2021)5 slides · Sep 2, 2021
 Merger or Acquisition (September 2021)10 slides · Sep 2, 2021
 Merger or Acquisition (September 2021)26 slides · Sep 2, 2021
 Merger or Acquisition (January 2017)14 slides · Jan 10, 2017
 Merger or Acquisition (June 2015)14 slides · Jun 17, 2015
 Hillenbrand Industries — Investor Presentation (March 2008)37 slides · Mar 13, 2008