Dynegy — Lehman Brothers 2005 Energy/Power Conference
46 slides from Dynegy's conference presentation, Sep 7, 2005
Slide 1: Lehman Brothers 2005 Energy/Power Conference
Exhibit 99.1 Investor Peter (713) LehmanJ. 507-6466 Wilt, Brothers Relations: Vice ir@dynegy.com 2005 President CEOHillarie Energy/Power C. Bloxom, Conference Senior Analyst September 7, 2005 New York City
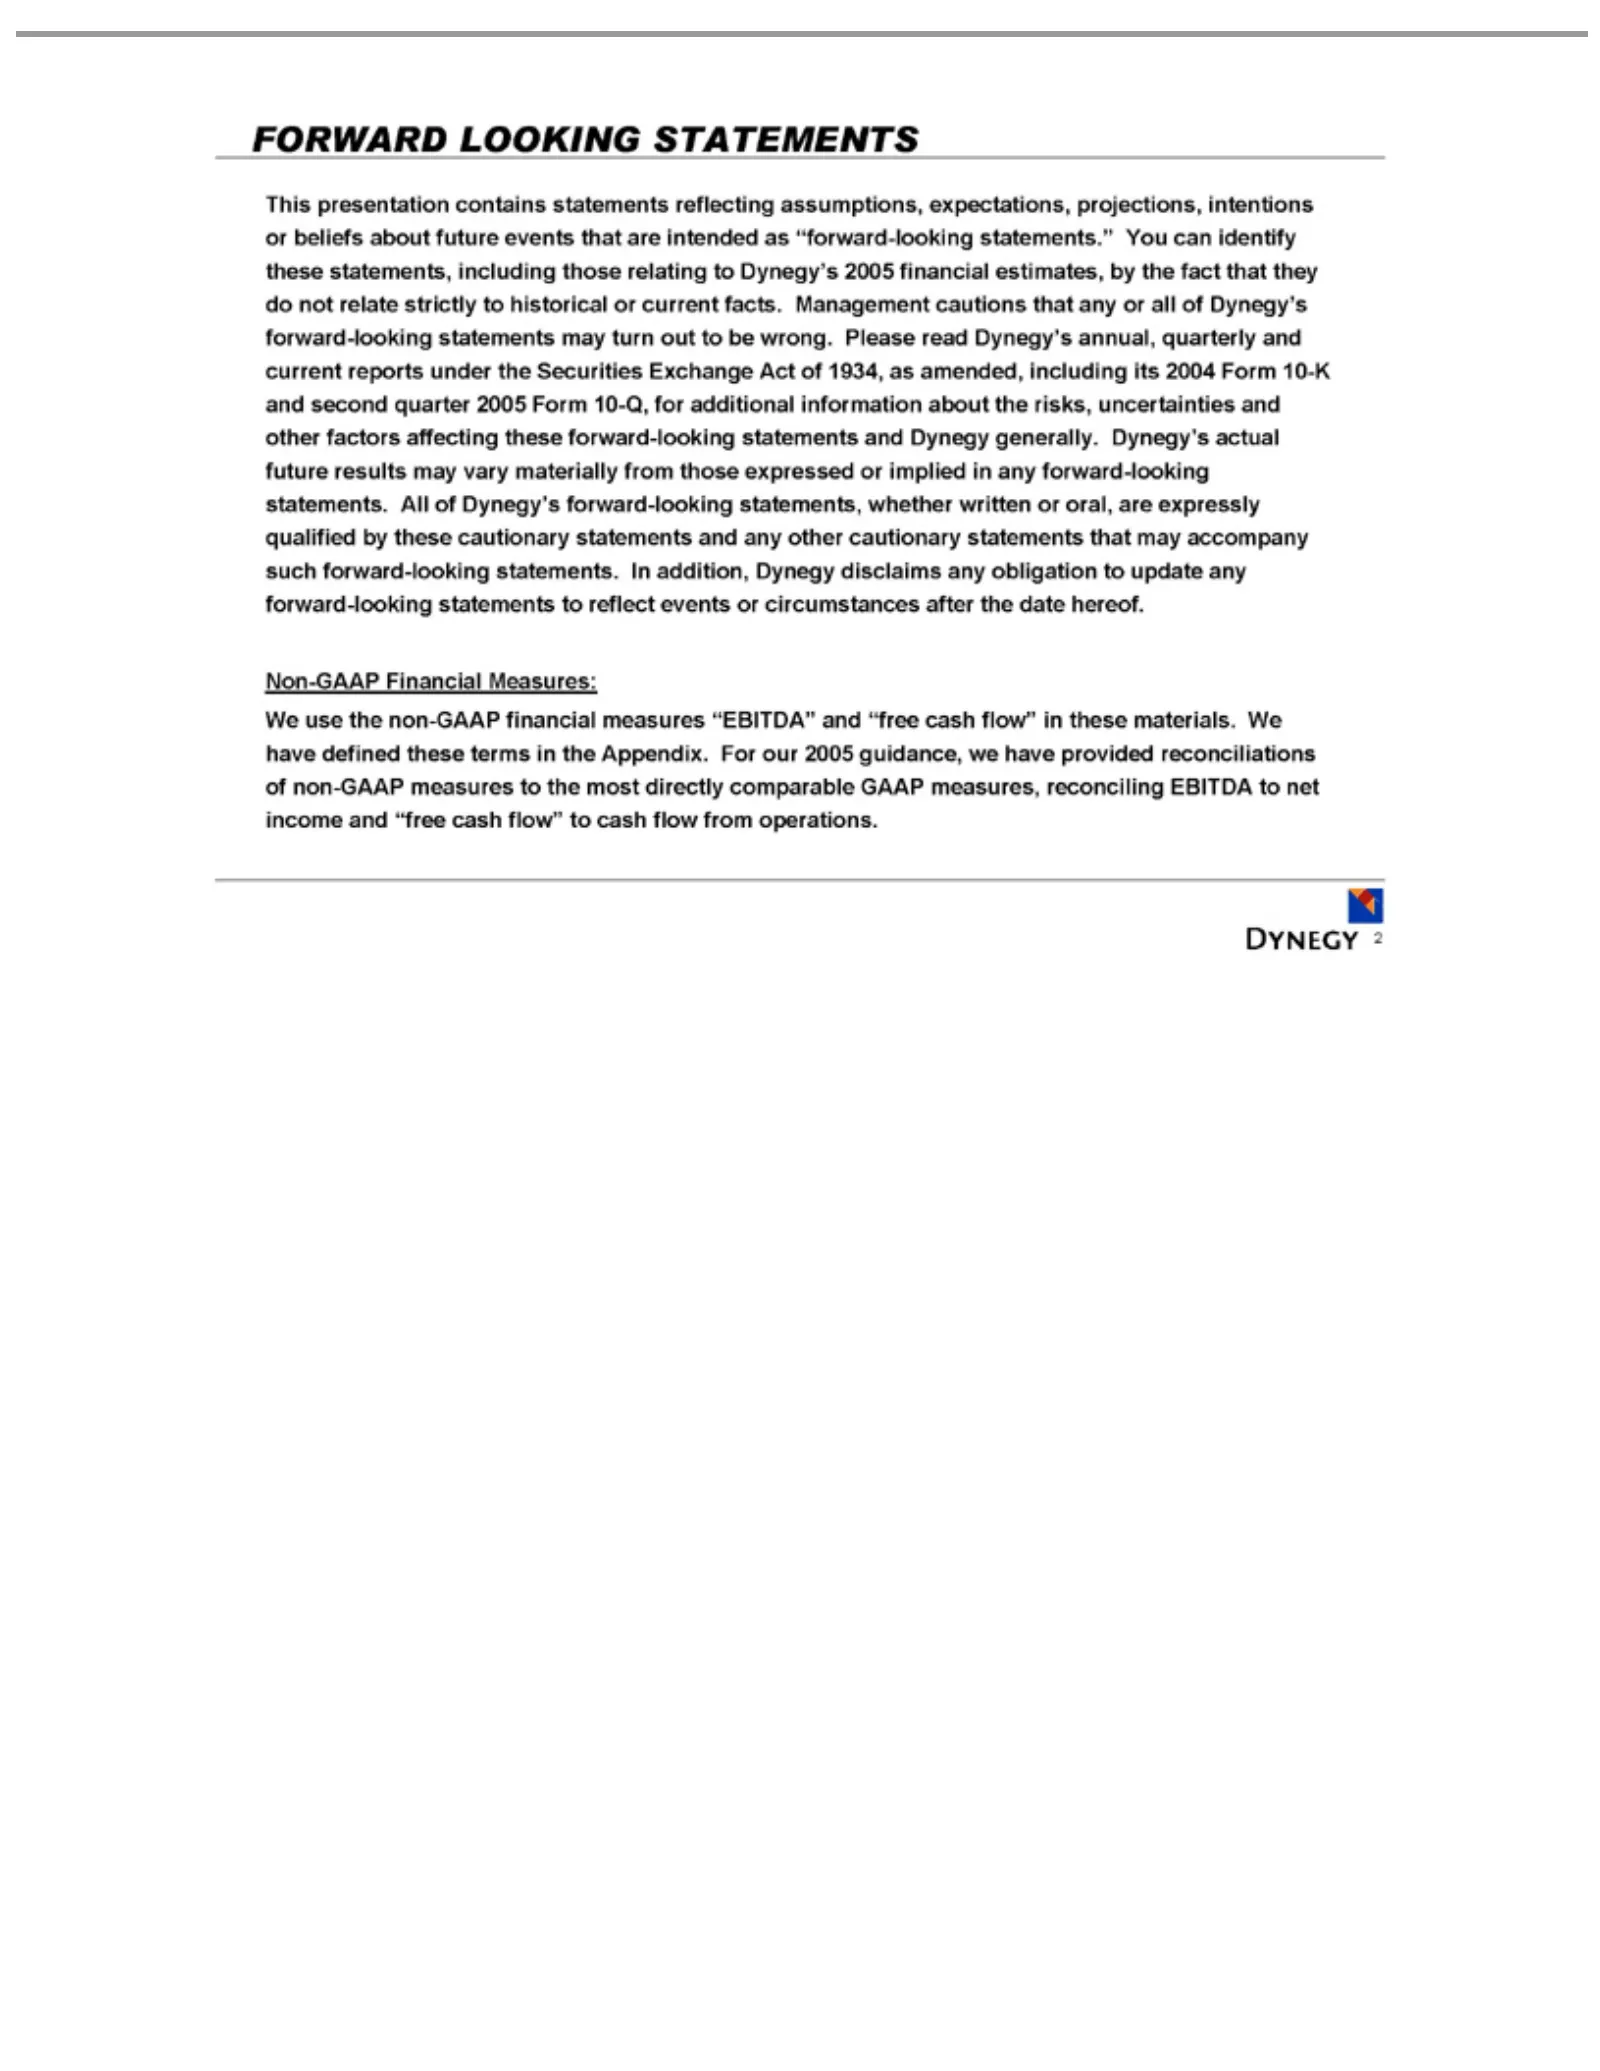
Slide 2: Forward Looking Statements
FORWARD This forward-looking K future these statements Non-GAAP We of 2 and non-GAAP use presentation statements, cautionary results second the to non-GAAP Financial LOOKING may reflect quarter measures statements including contains vary events 2005 Measures: financial materially to STATEMENTS state
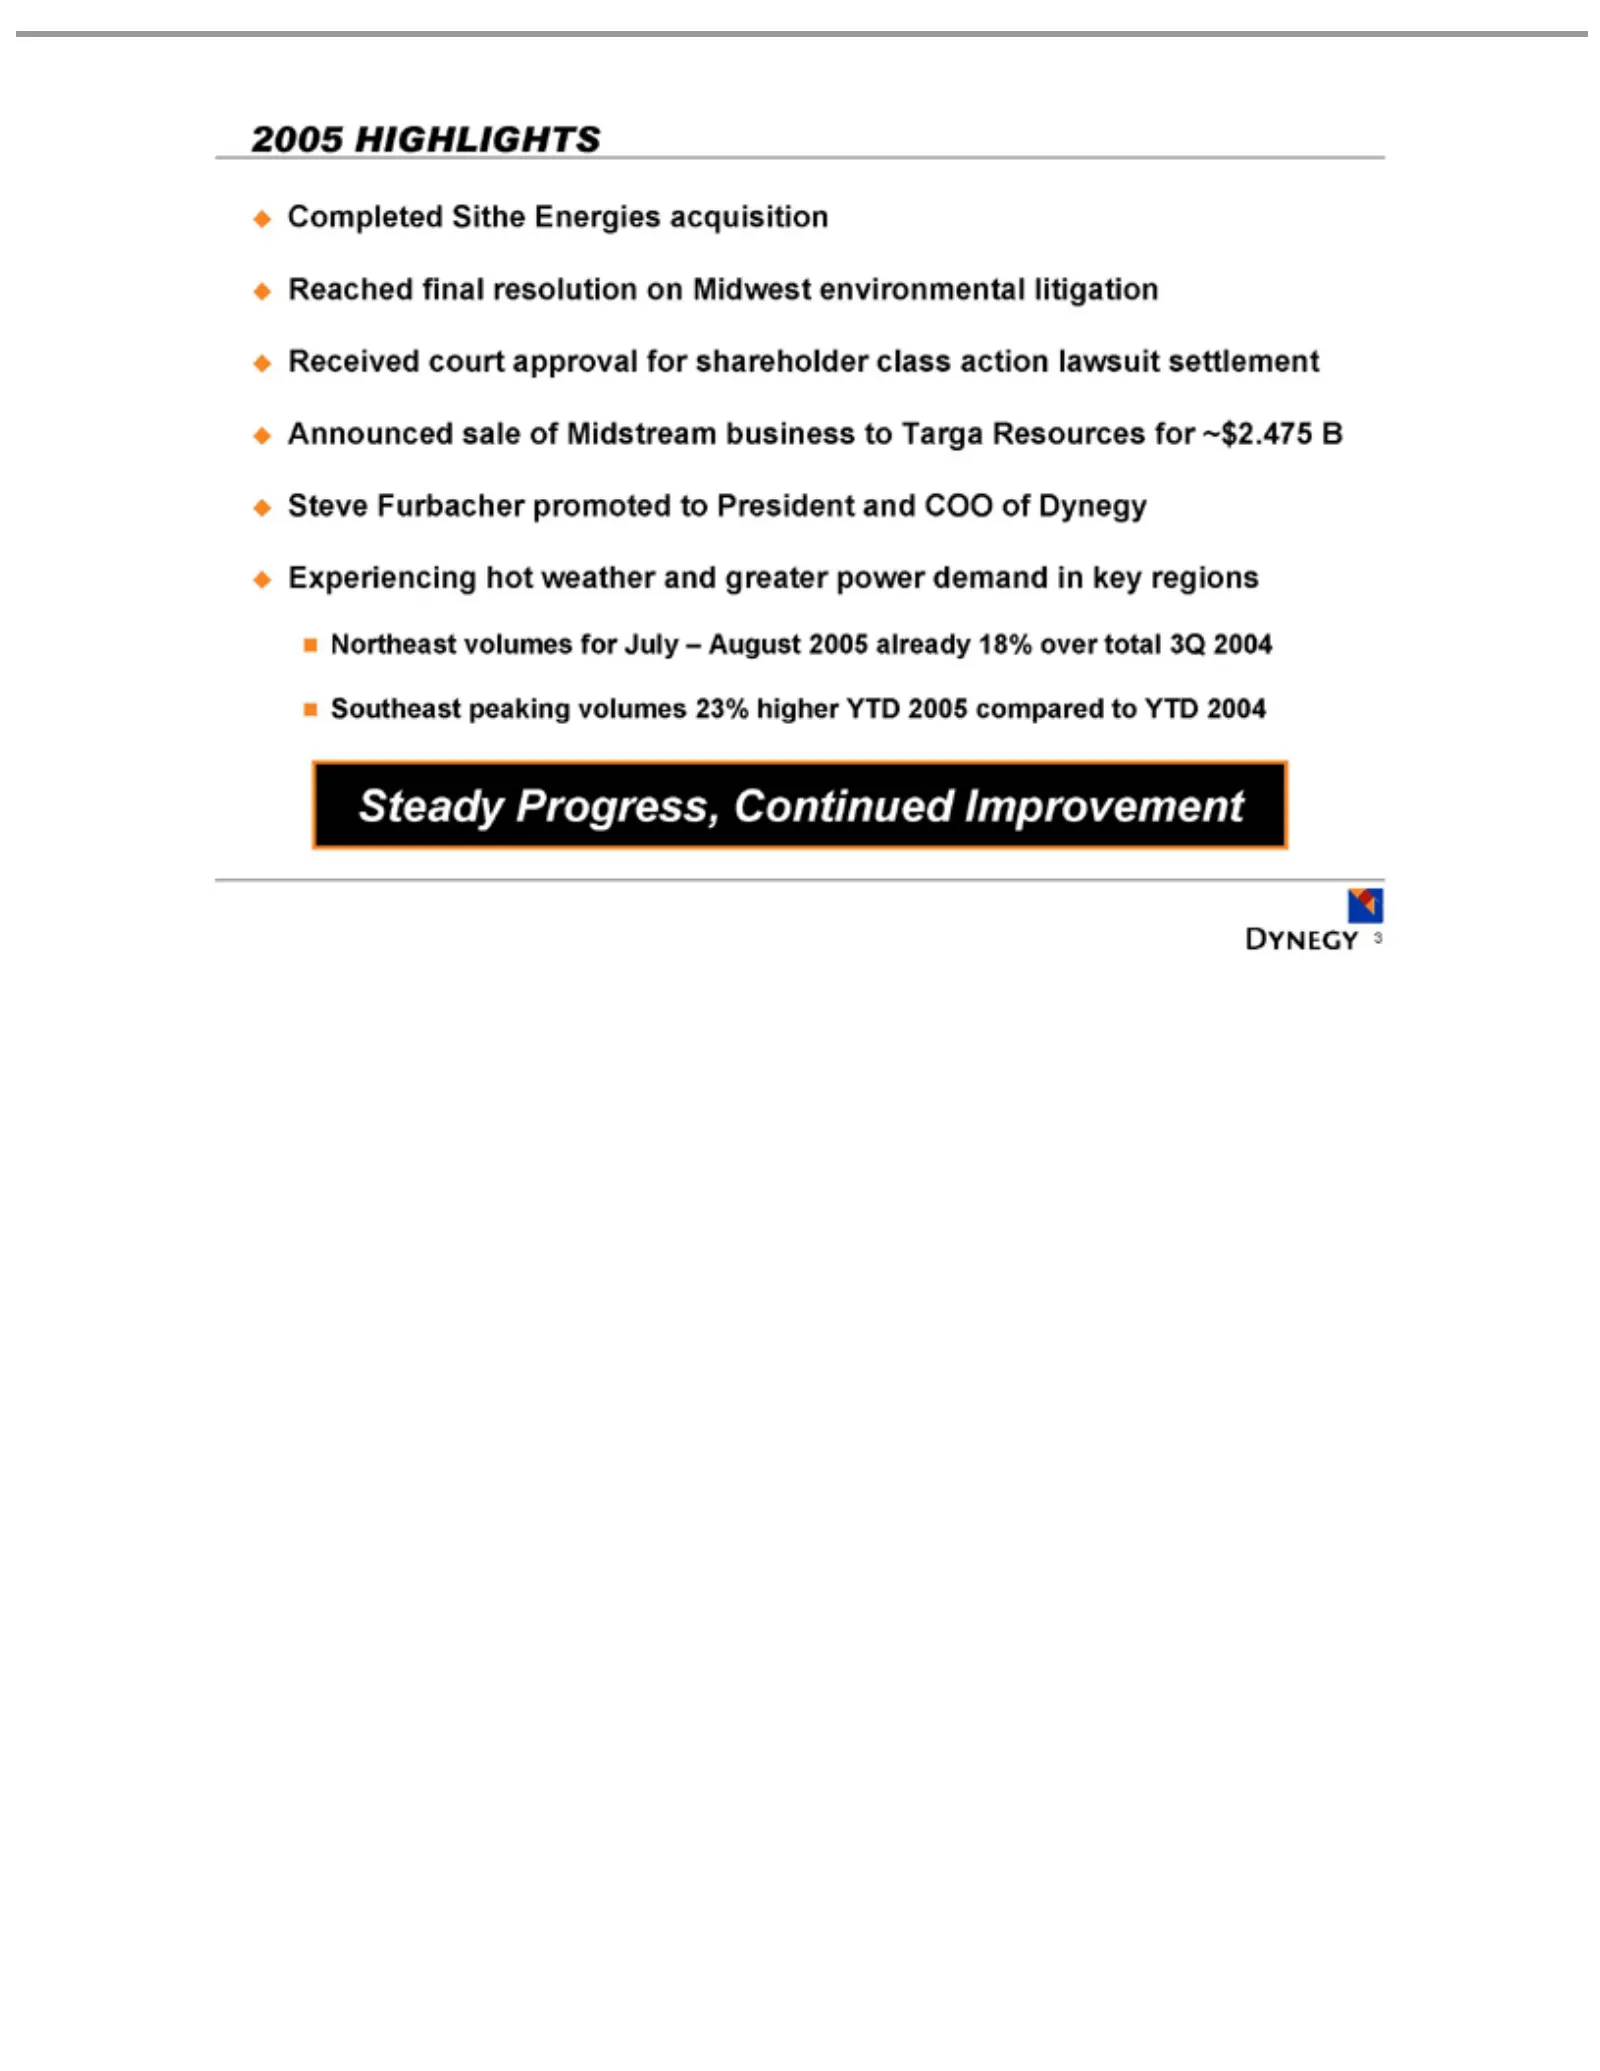
Slide 3: 2005 Highlights
2005 HIGHLIGHTS Completed Reached Received Dynegy Northeast Southeast Steady 3 Progress, Experiencing final court volumes peaking Sithe resolution approval Continued Energies volumes for hot July for onweather acquisition –23% Midwest Improvement shareholder August higher and2005 environmental great
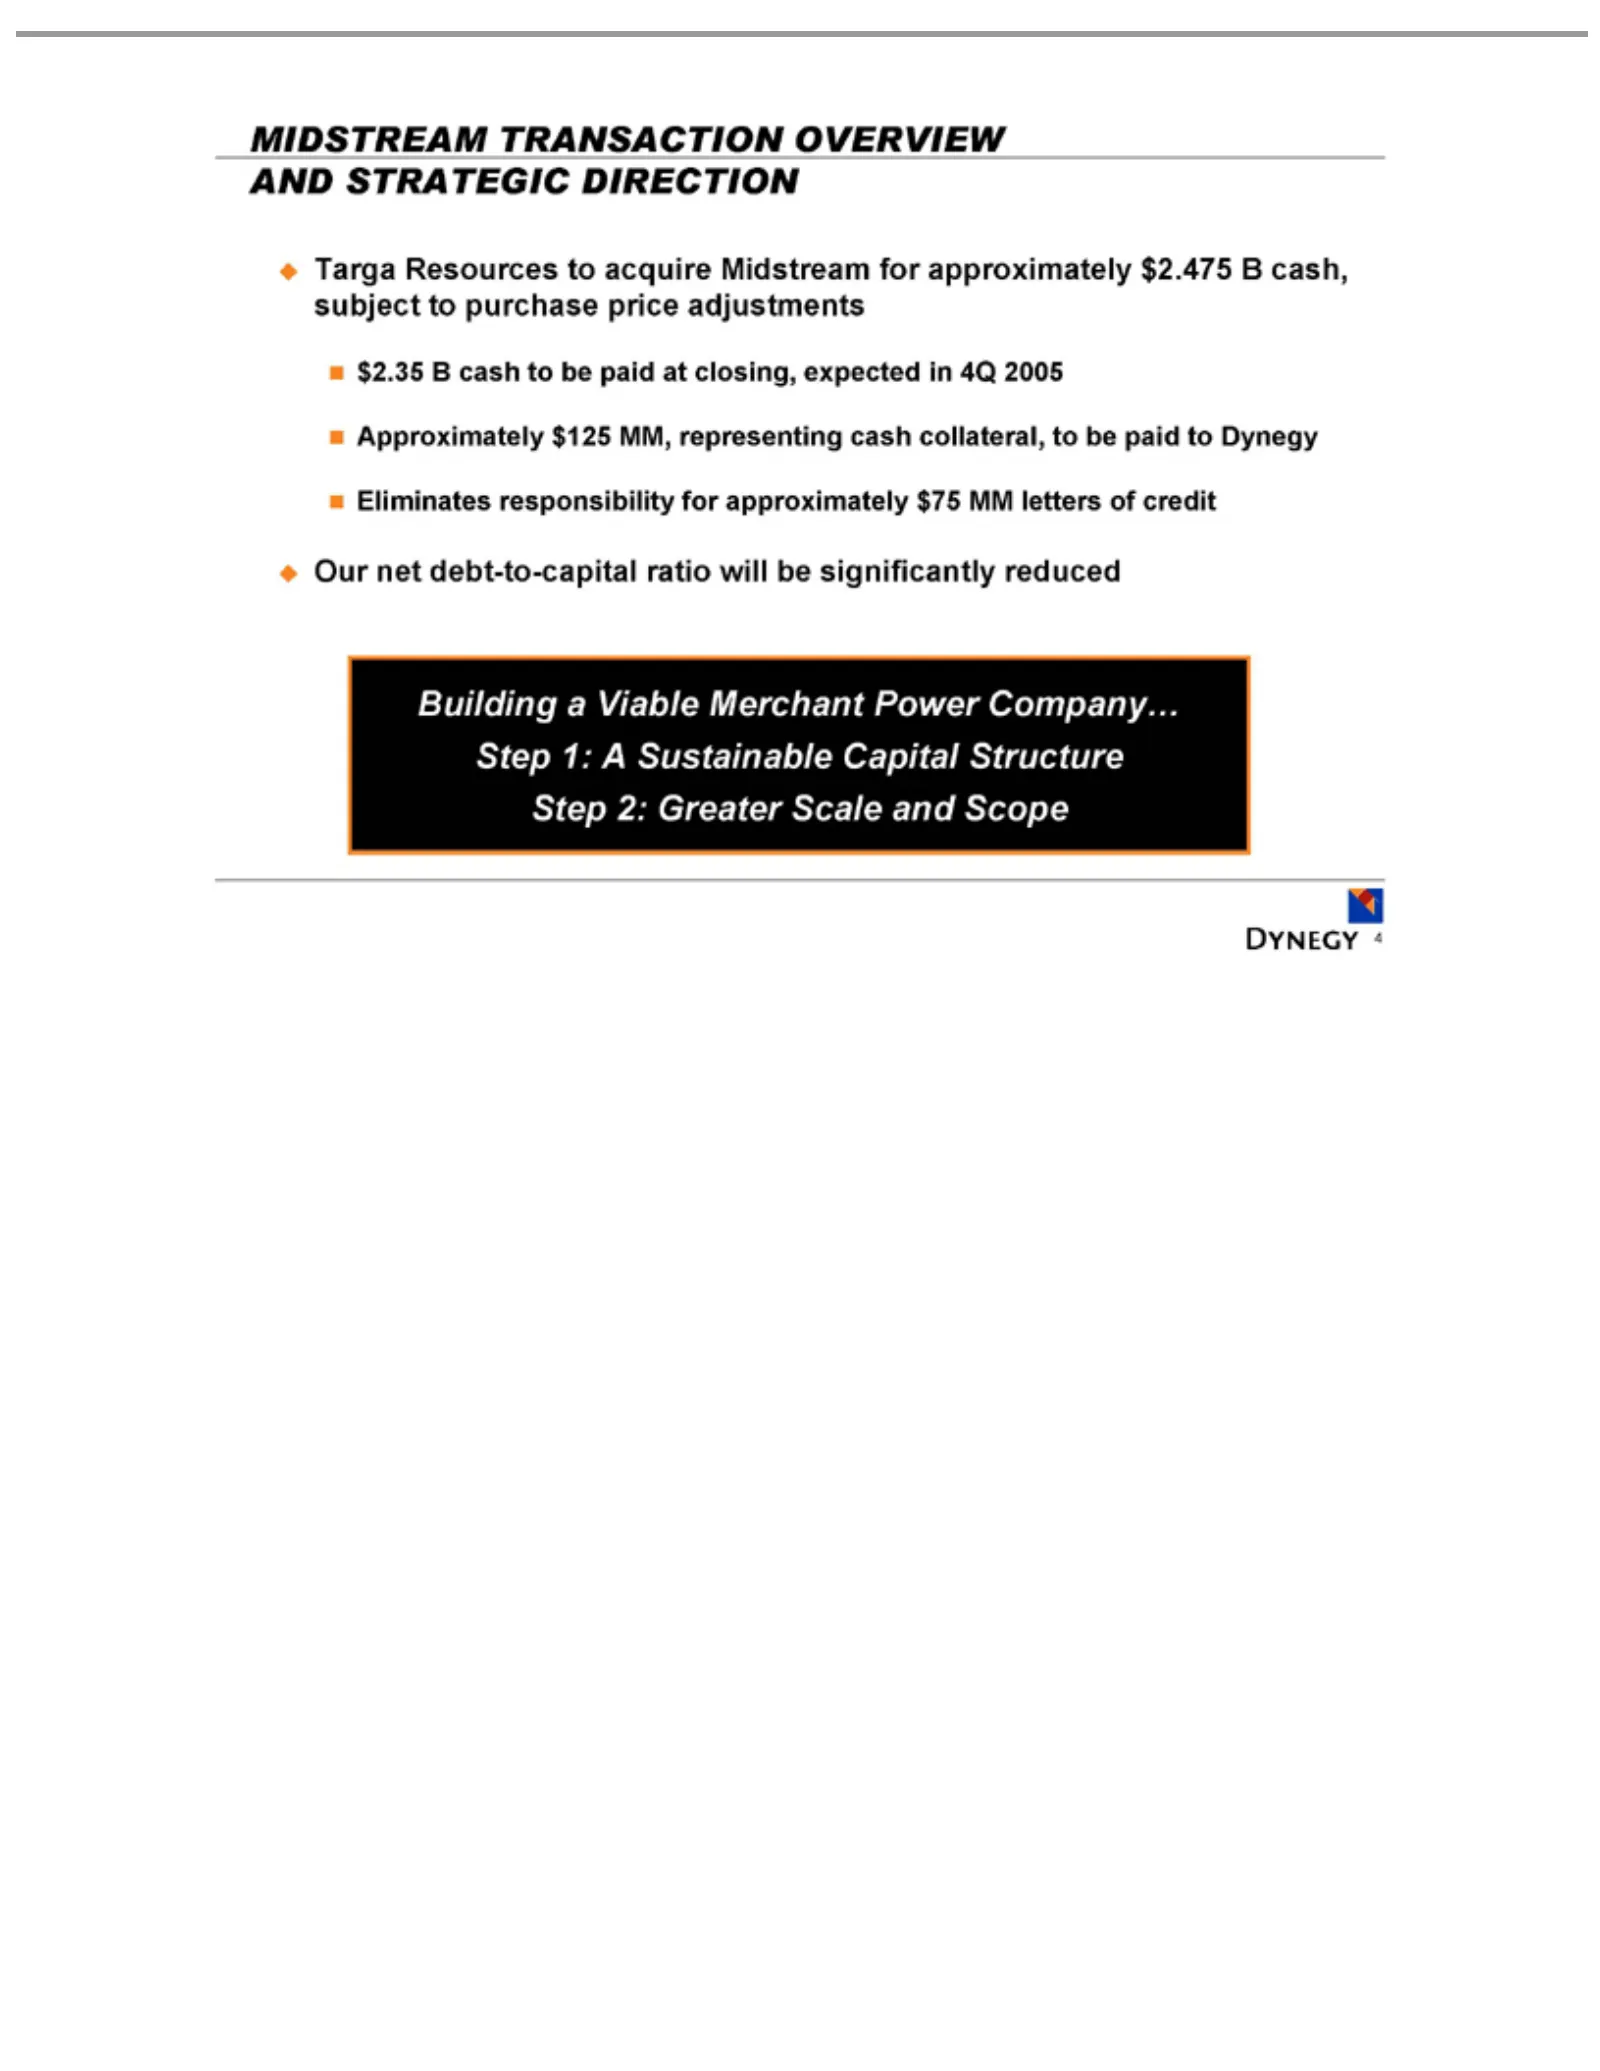
Slide 4: Midstream Transaction Overview and Strategic Direction
MIDSTREAM Targa Approximately Eliminates Our Building 4 net Resources debt-to-capital a Viable responsibility TRANSACTION $125 toMerchant acquire MM, ratio for representing Midstream Power will approximately be OVERVIEW Company… significantly for cash approximately $75 collateral, AND Step MM reduce
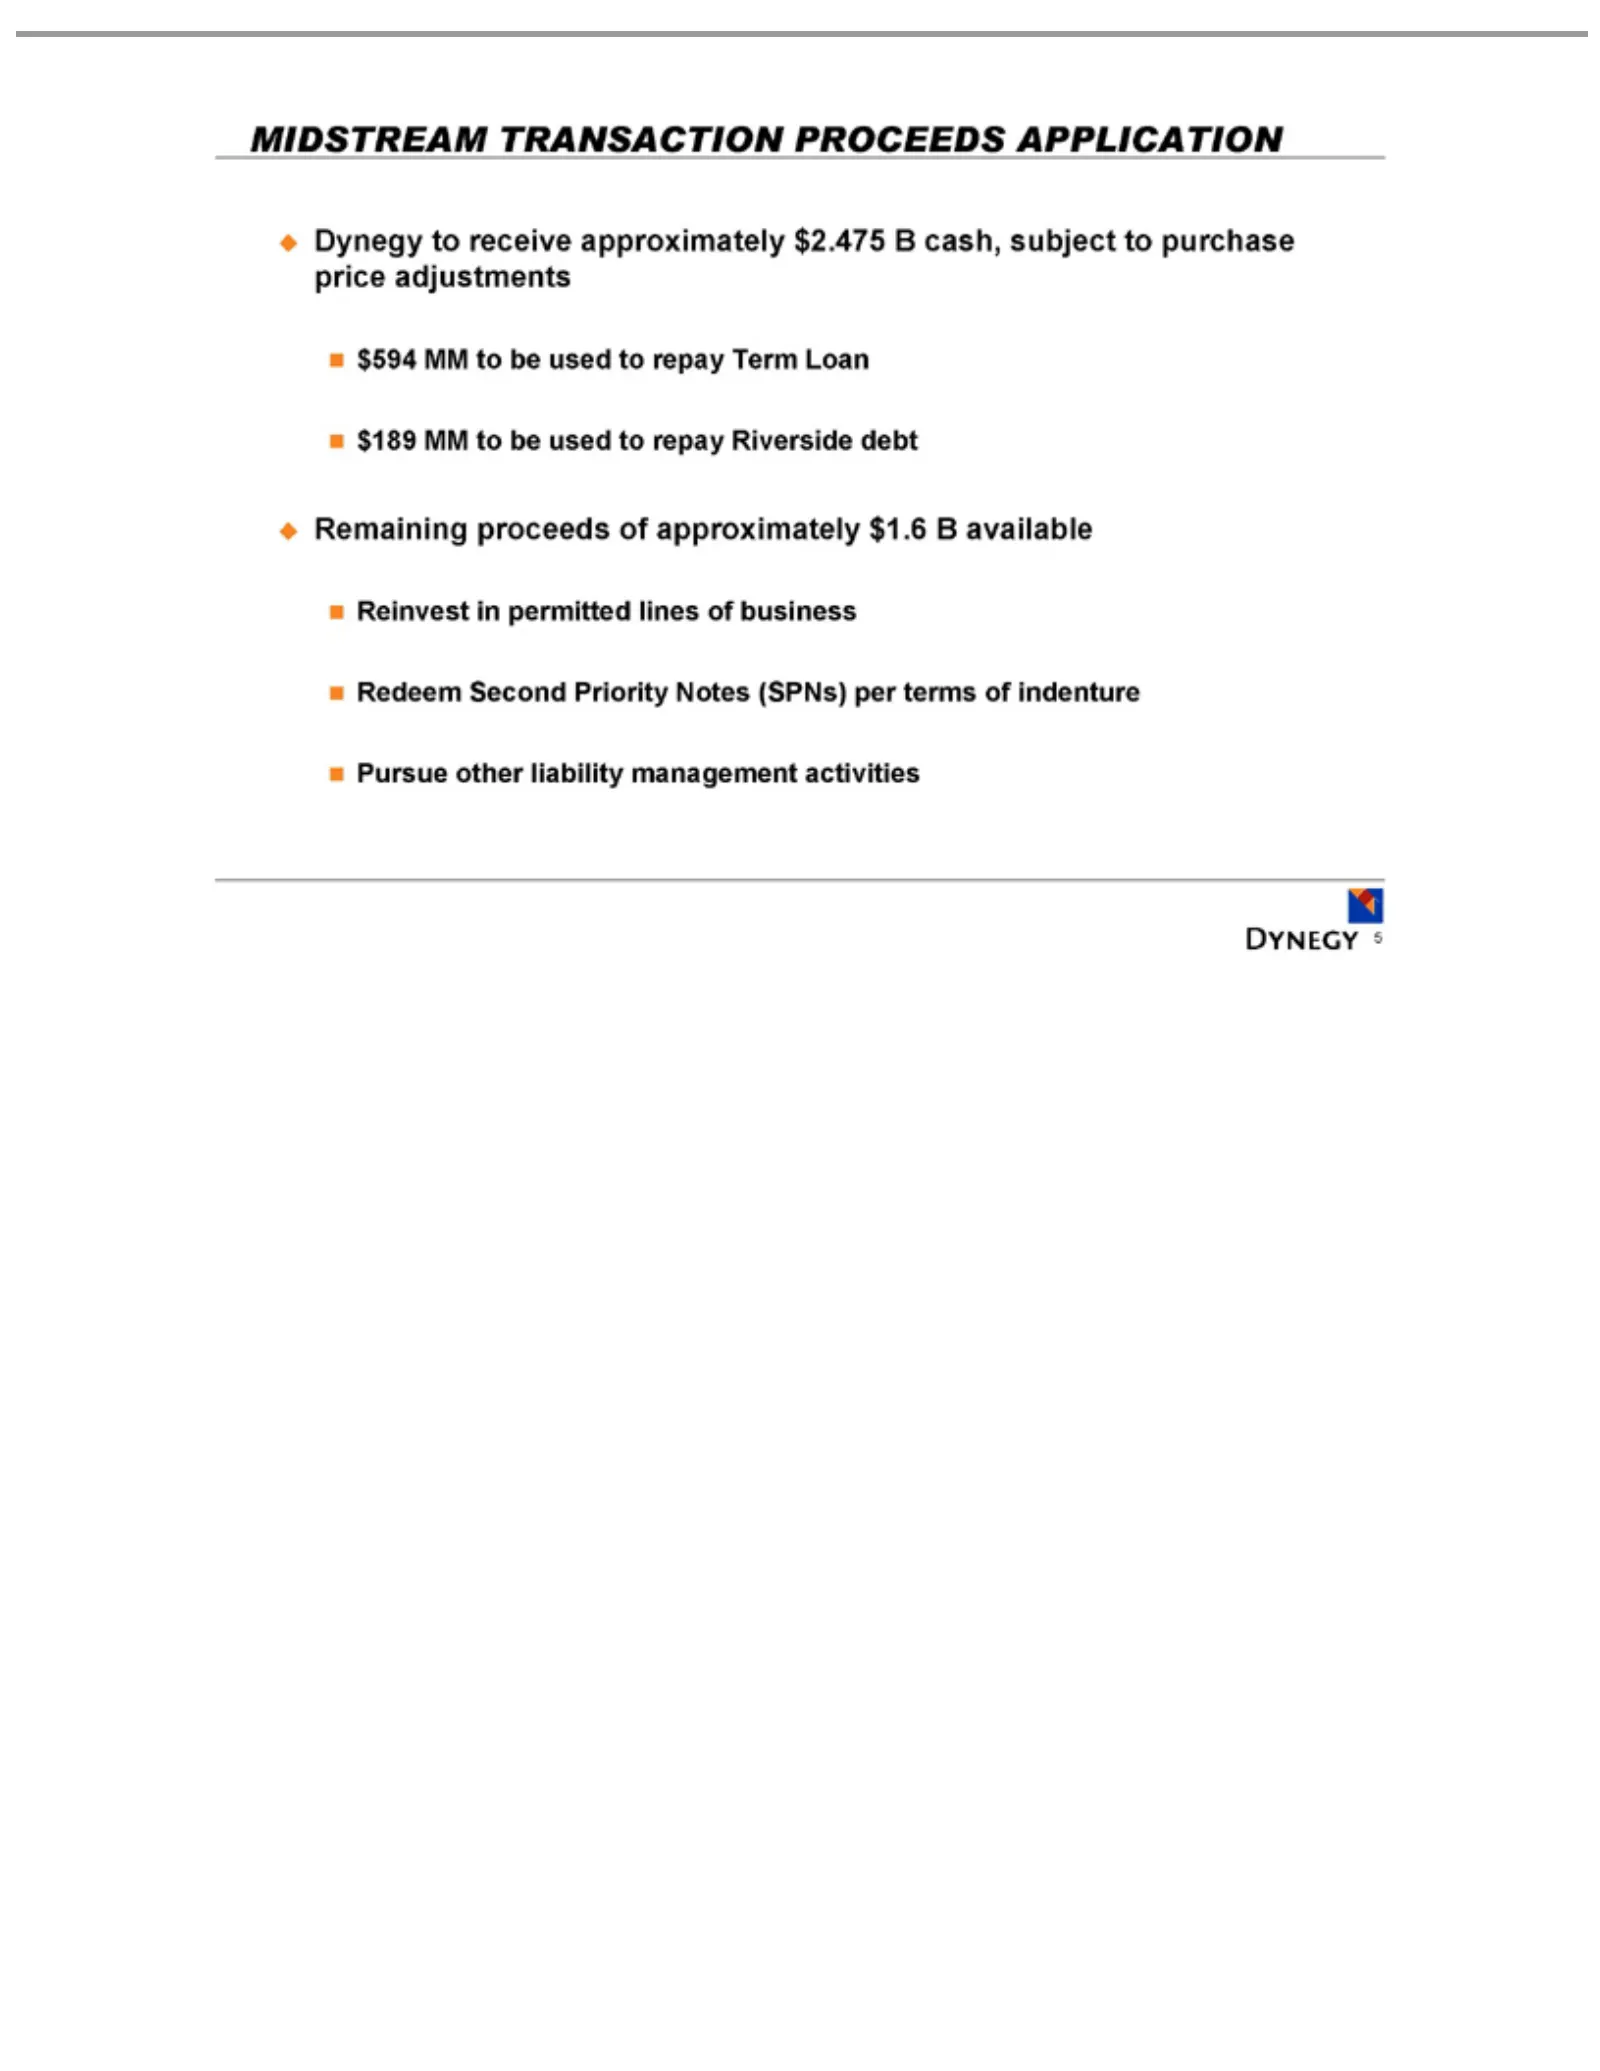
Slide 5: Midstream Proceeds Application
MIDSTREAM Dynegy $189 Remaining Reinvest Redeem Pursue 5 MMother to Second into receive proceeds permitted liability beTRANSACTION used Priority approximately of to management lines approximately repay Notes of business Riverside (SPNs) PROCEEDS $2.475 activities $1.6 per debt Bterms cash, B availab
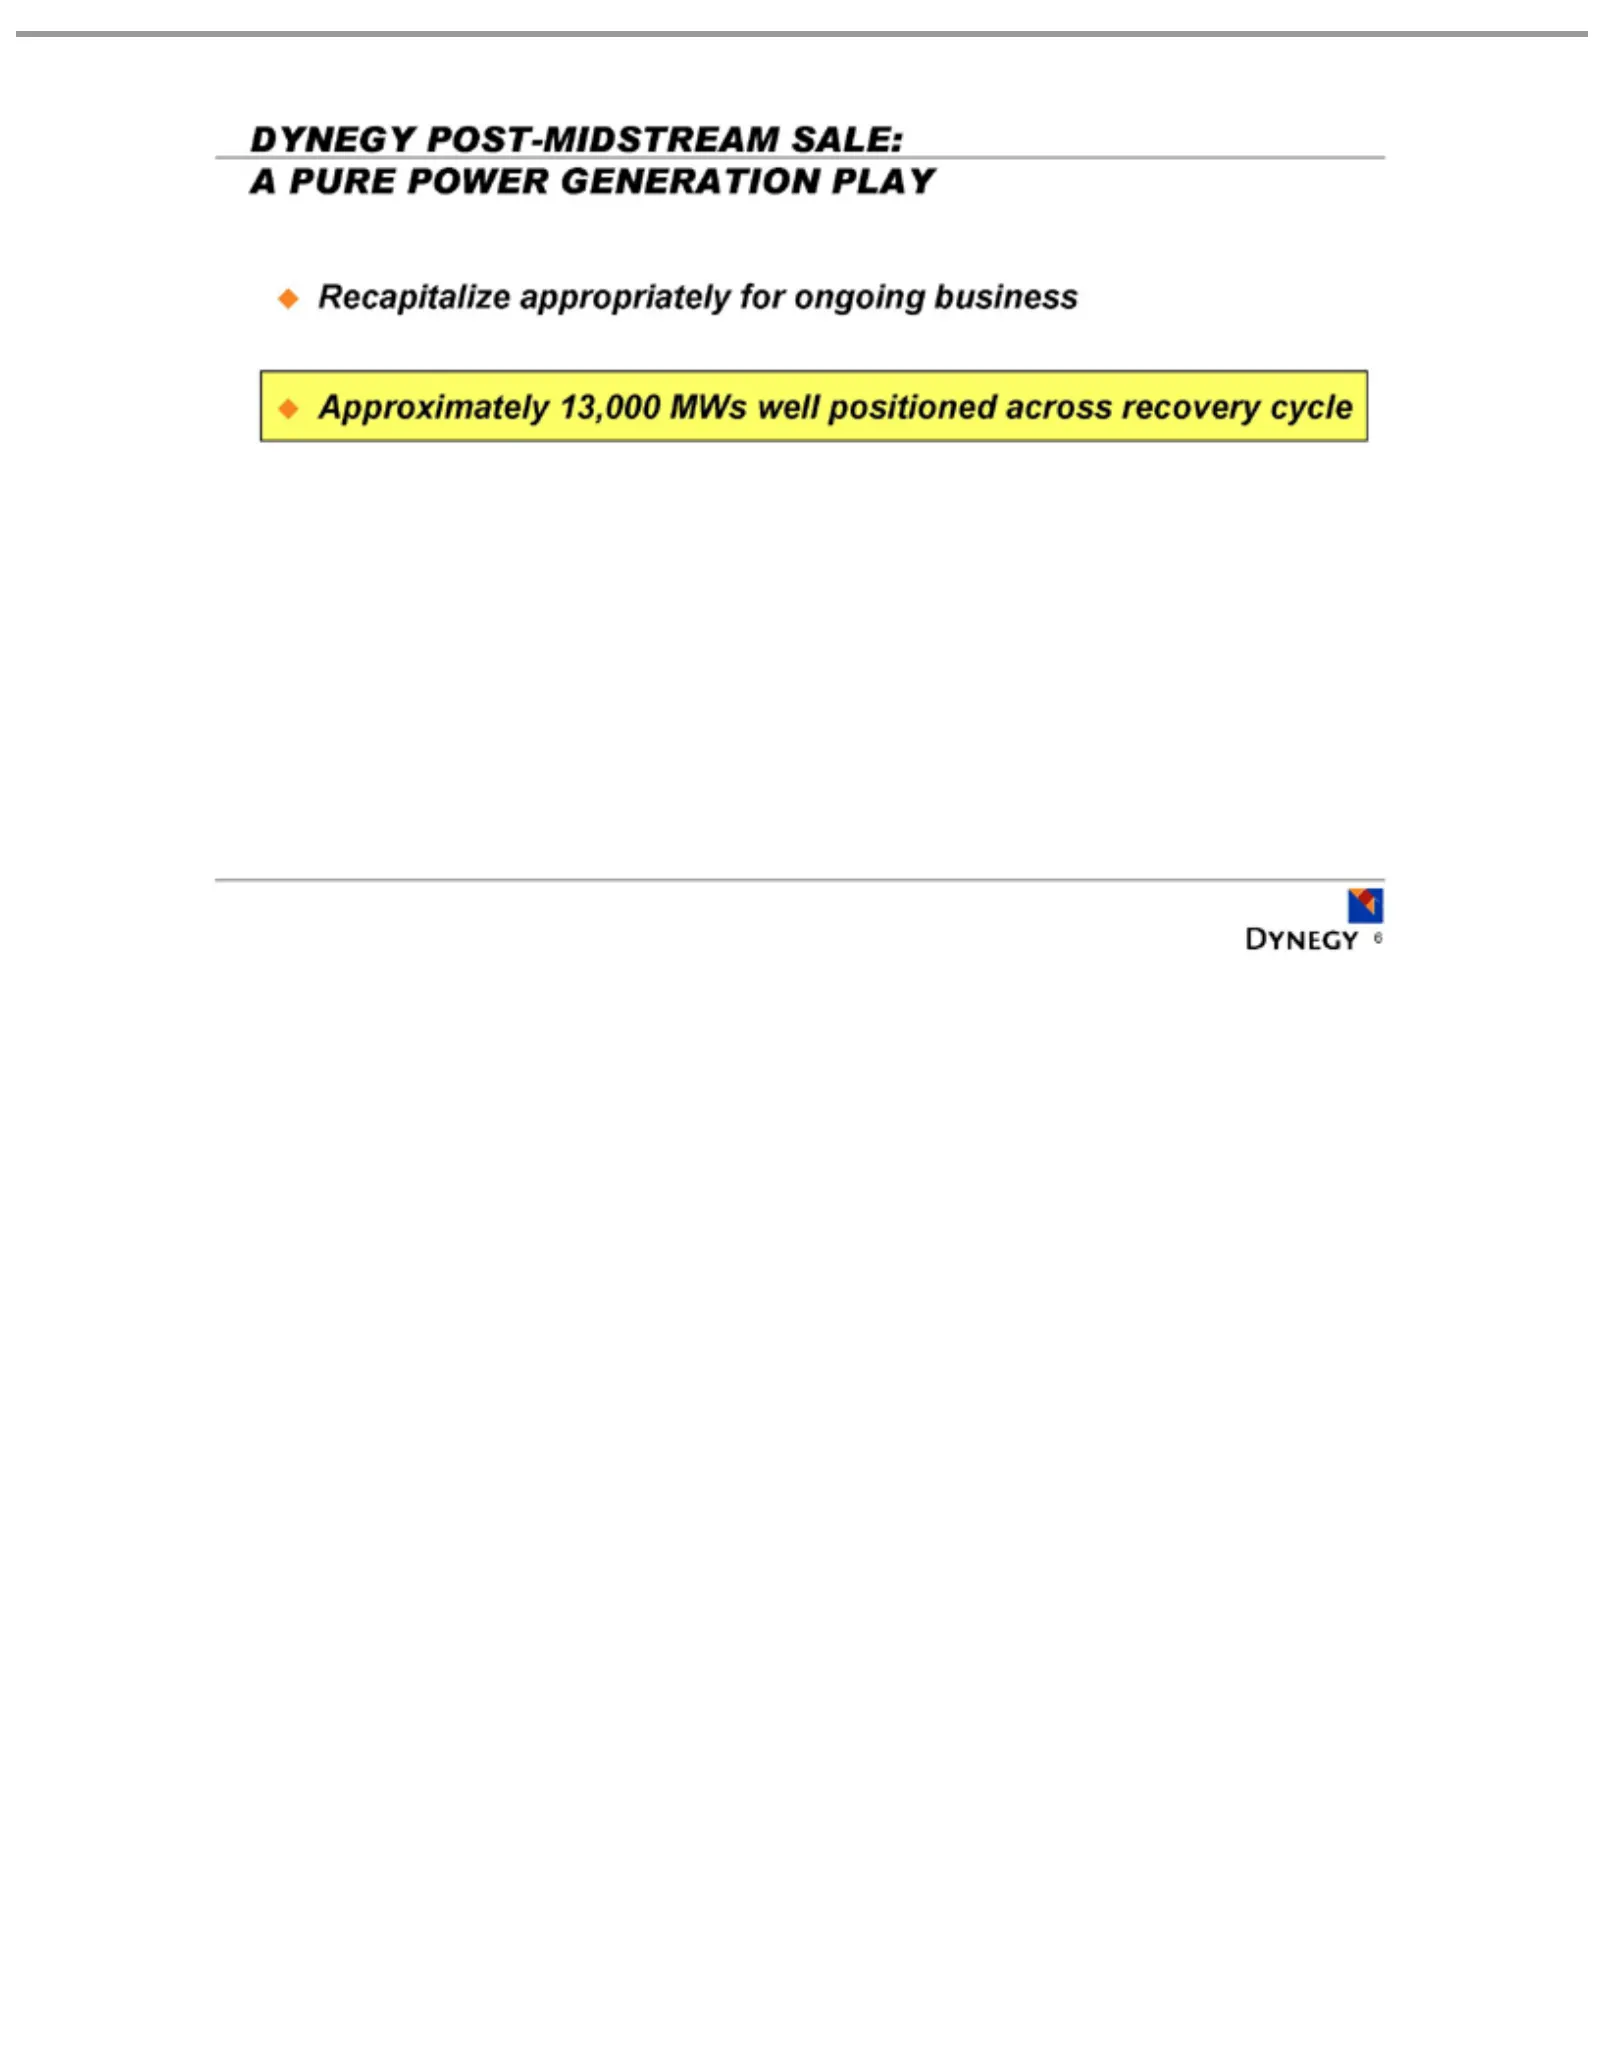
Slide 6: Dynegy Post-Midstream Sale: A Pure Power Generation Play
DYNEGY POST-MIDSTREAM Recapitalize Approximately 6 appropriately 13,000 MWs forwell ongoing SALE: positioned business A PURE across POWER recovery GENERATION cycle PLAY
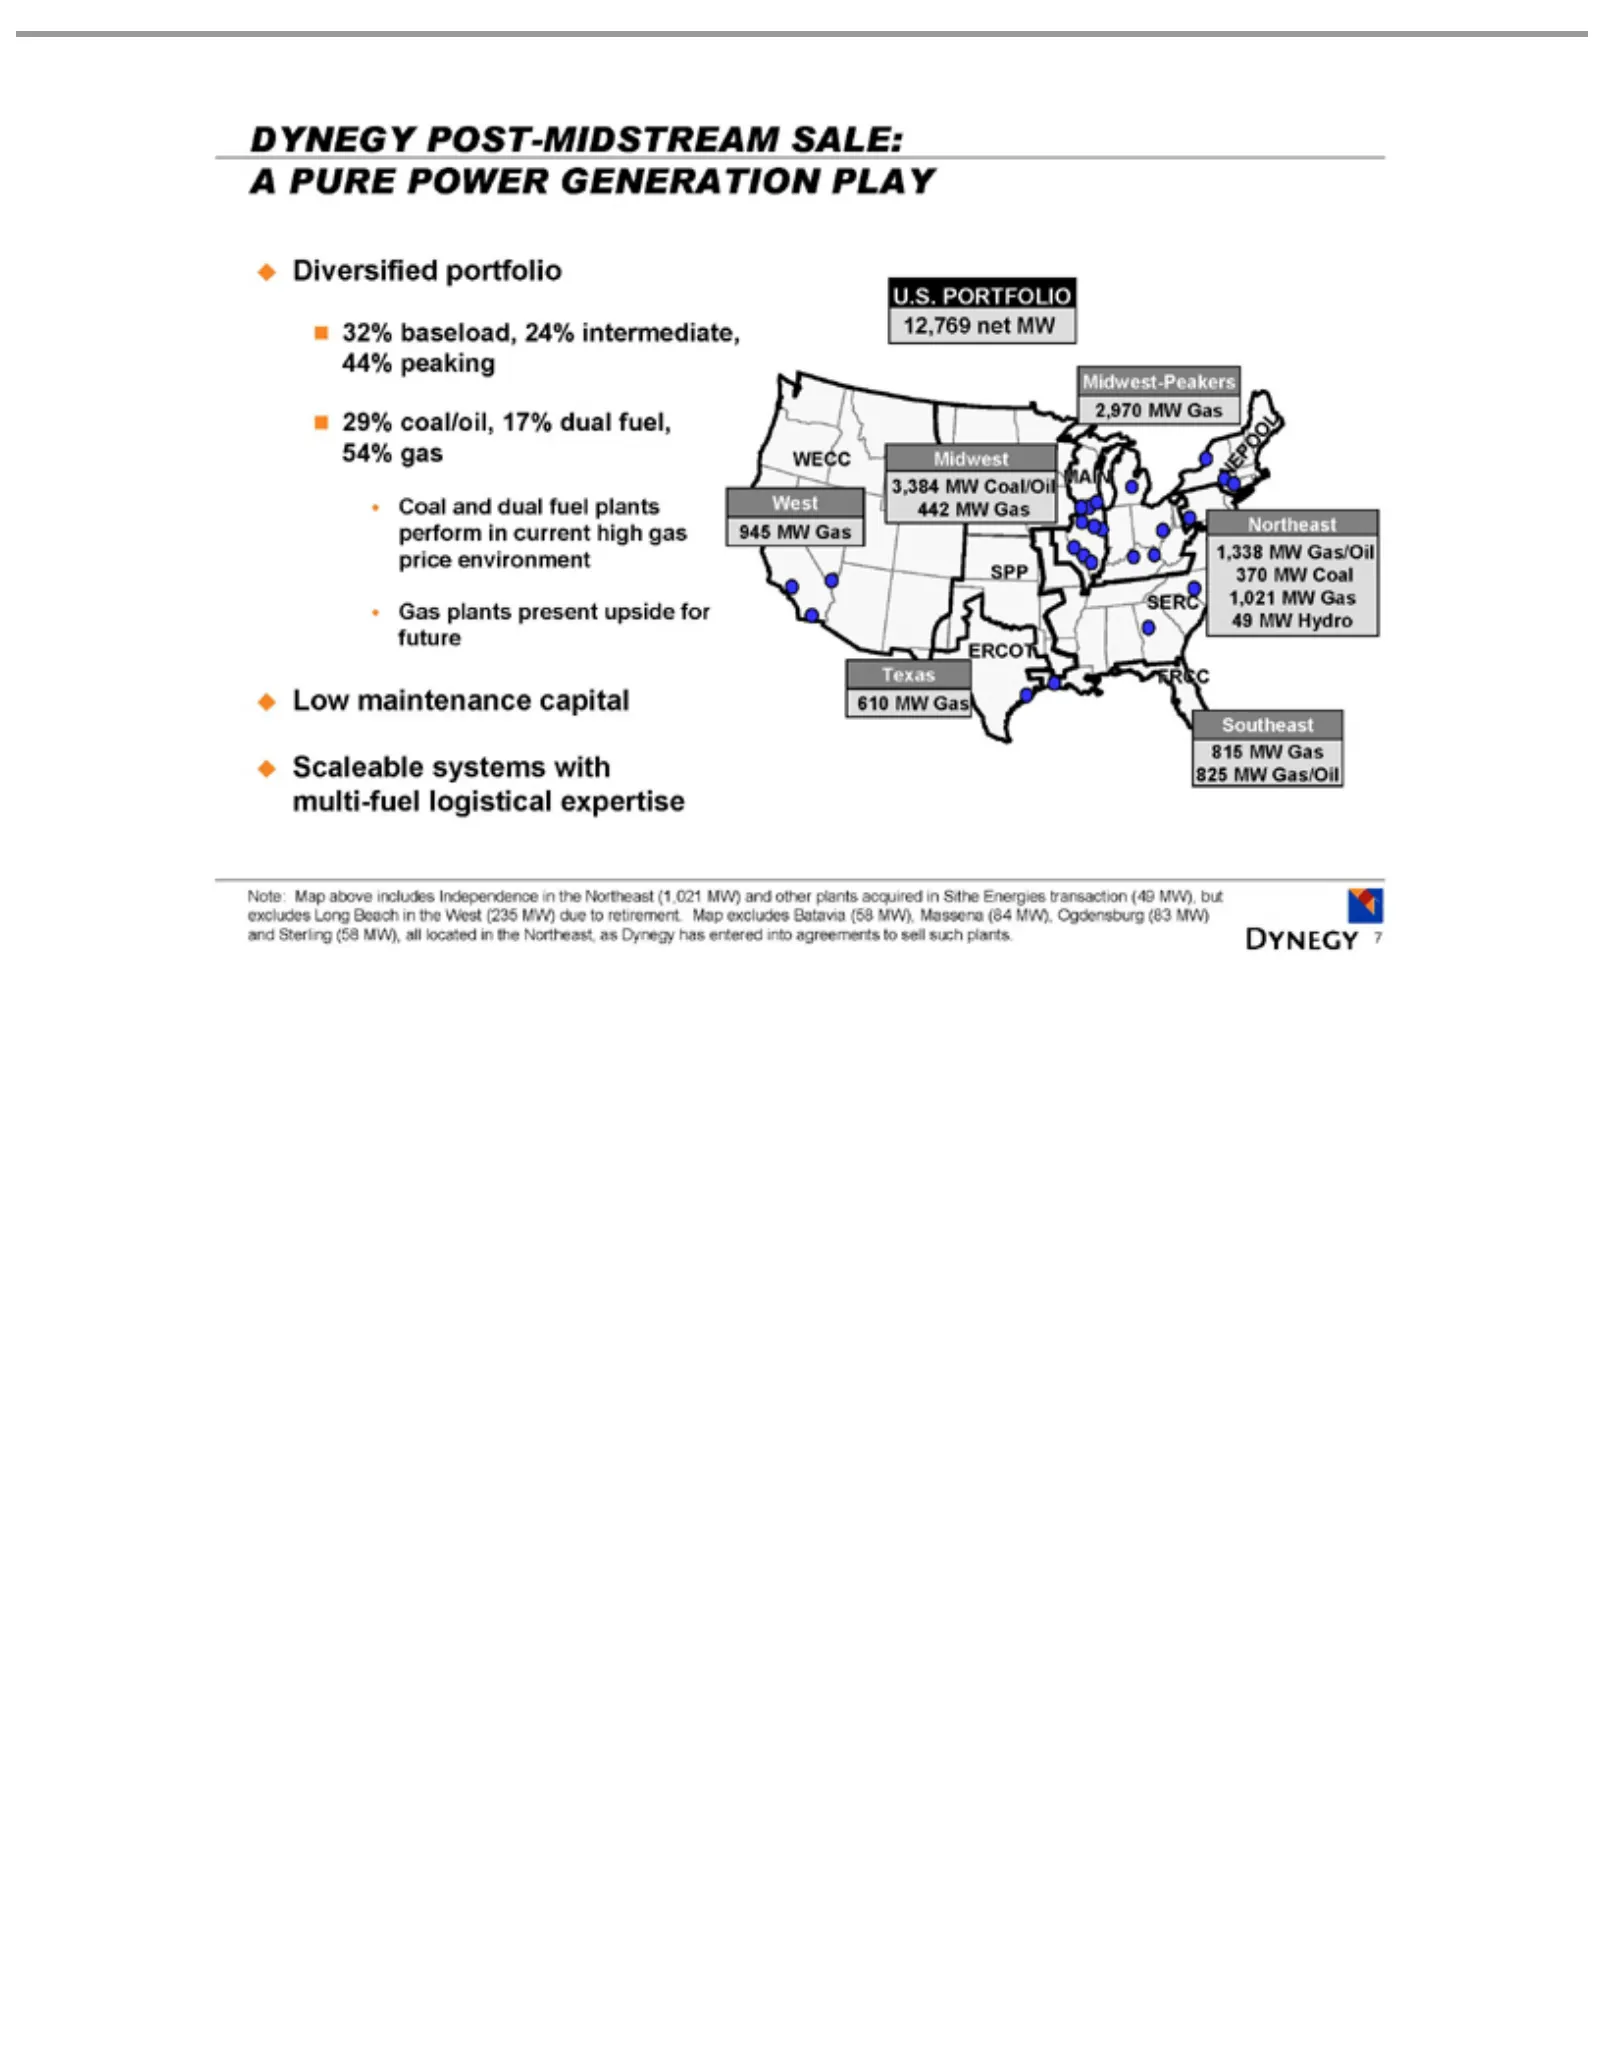
Slide 7: Diversified Portfolio Post-Midstream Sale
DYNEGY Diversified 32% 29% Coal Gas Low Scaleable Note: retirement. U.S. Midwest-Peakers West WECC Midwest Texas ERCOT SPP MAIN Southeast FRCC Northeast 7 NEPOOL SERC plants PORTFOLIO maintenance baseload, coal/oil, and 945 Map 6103,384 dual MW systems 1,338 815 MW POST-MIDSTREAM present above Map p
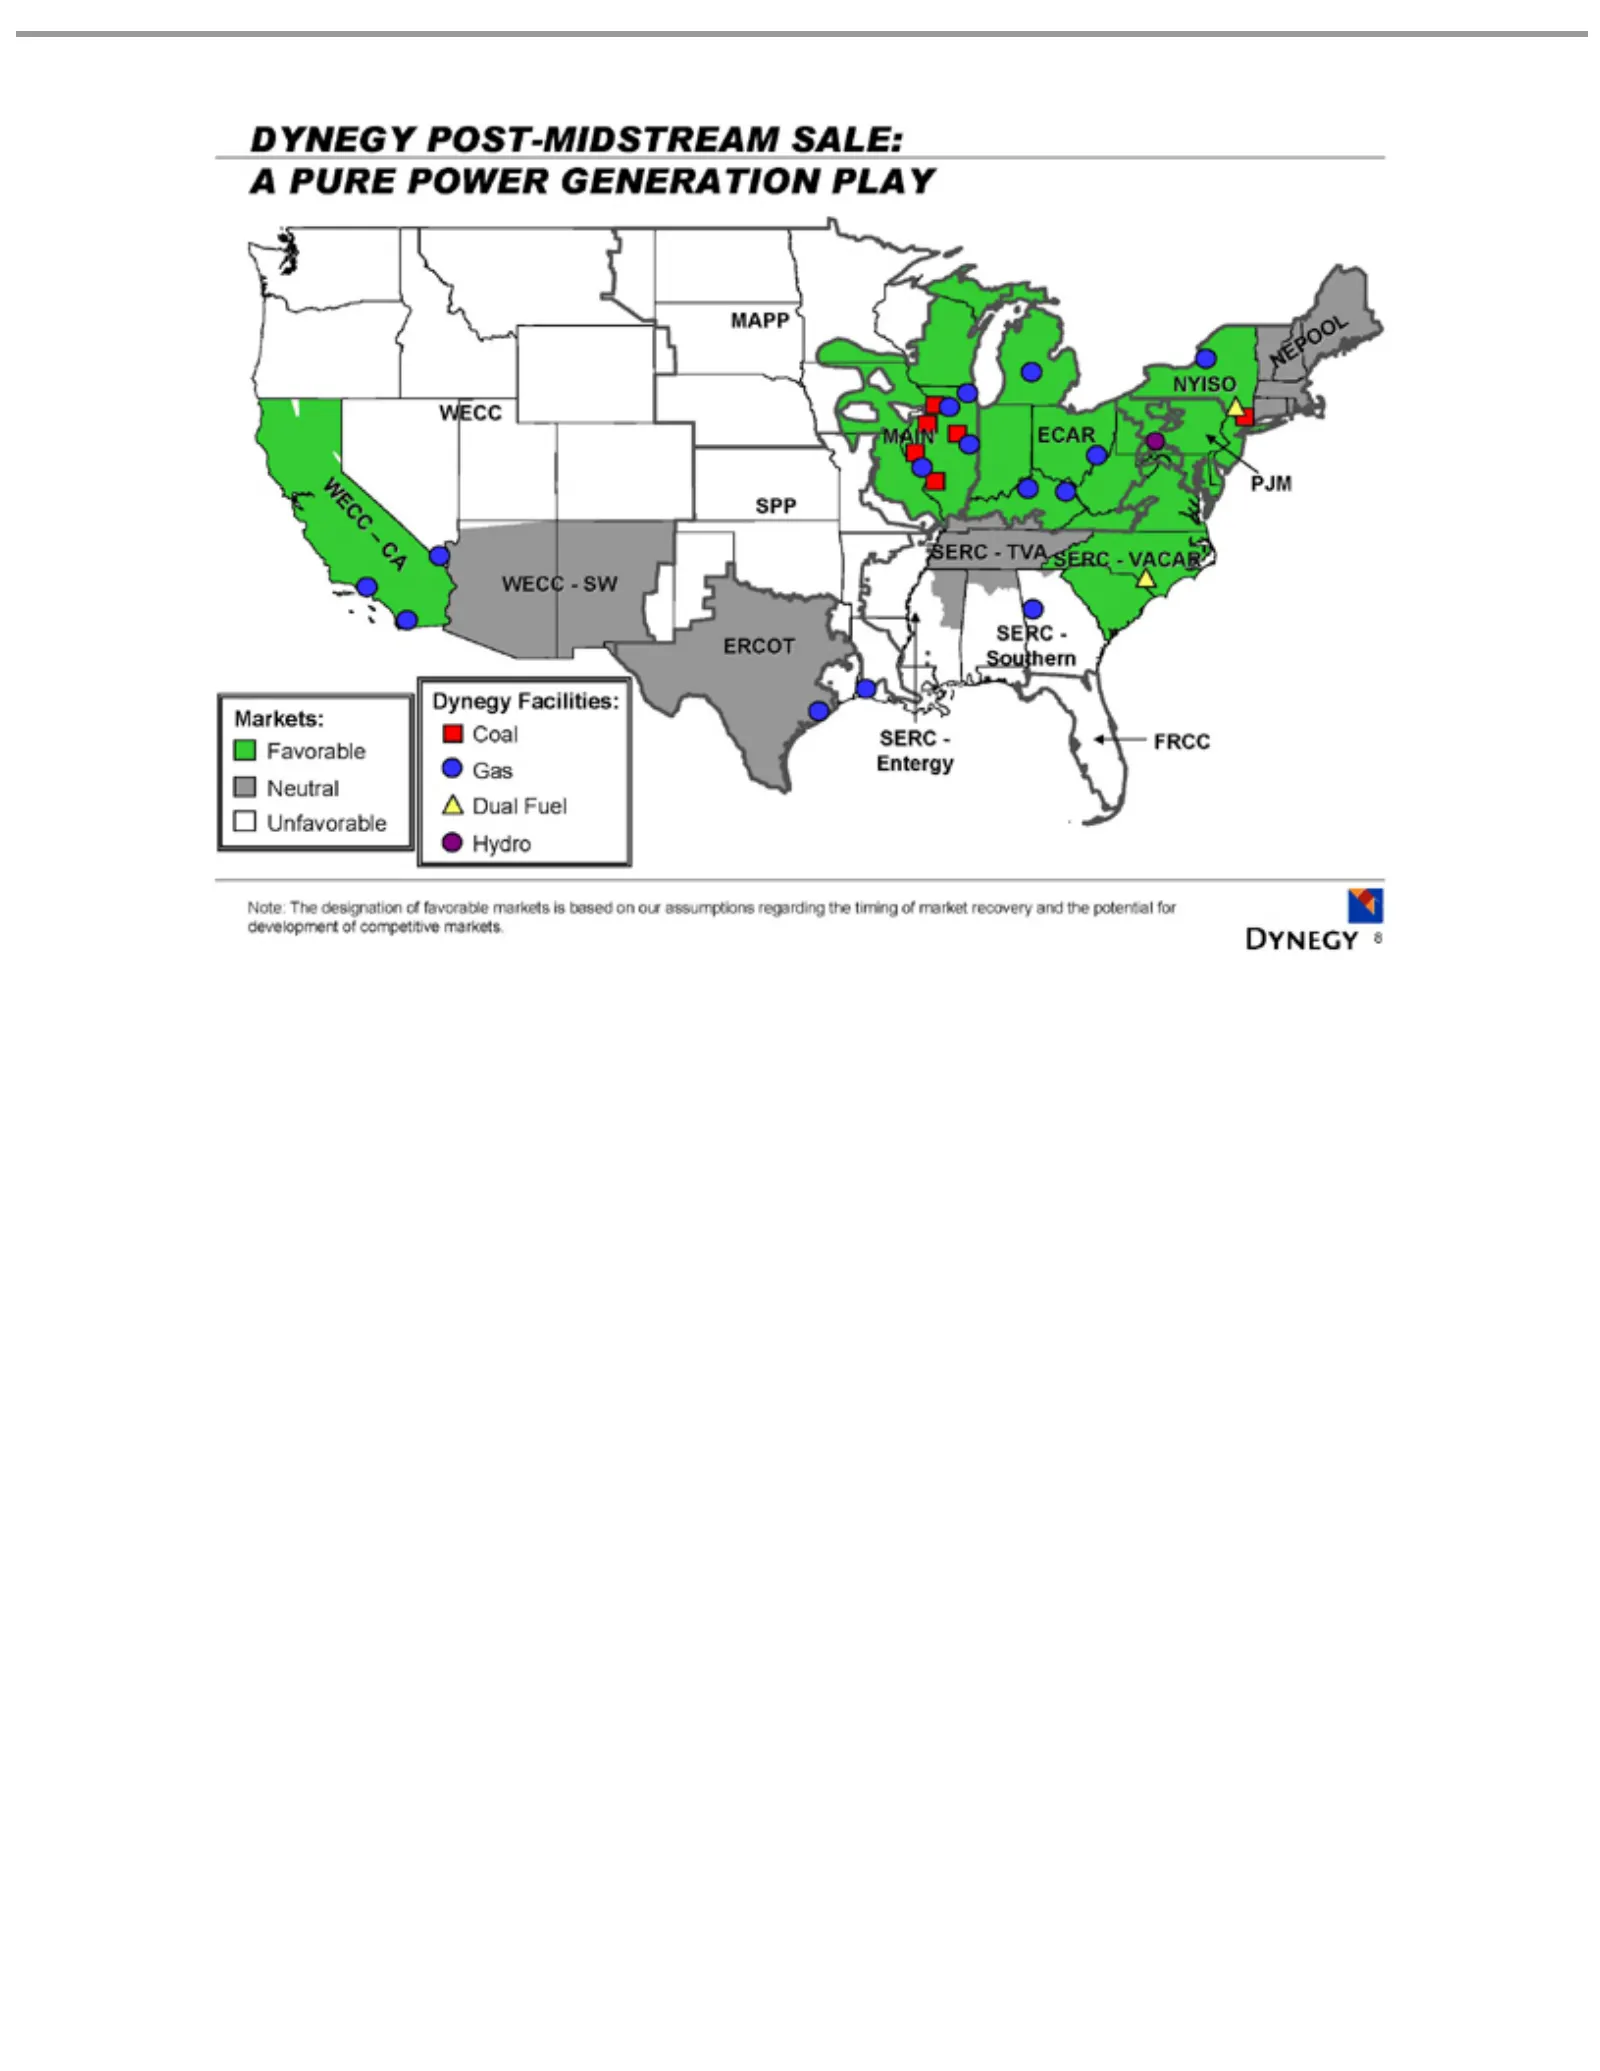
Slide 8: Dynegy Markets and Facilities Map
DYNEGY WECC SERC—VACAR SERC—TVA PJM NEPOOL NYISO ECAR MAIN ERCOT SPP MAPP WECC—SW SERC Dynegy Unfavorable Neutral Favorable Markets: FRCC Dual Gas Coal Note: Hydro 8 Fuel The - –Entergy Southern Facilities: CA designation POST-MIDSTREAM of favorable SALE: markets A PURE is based POWER on our GENERAT
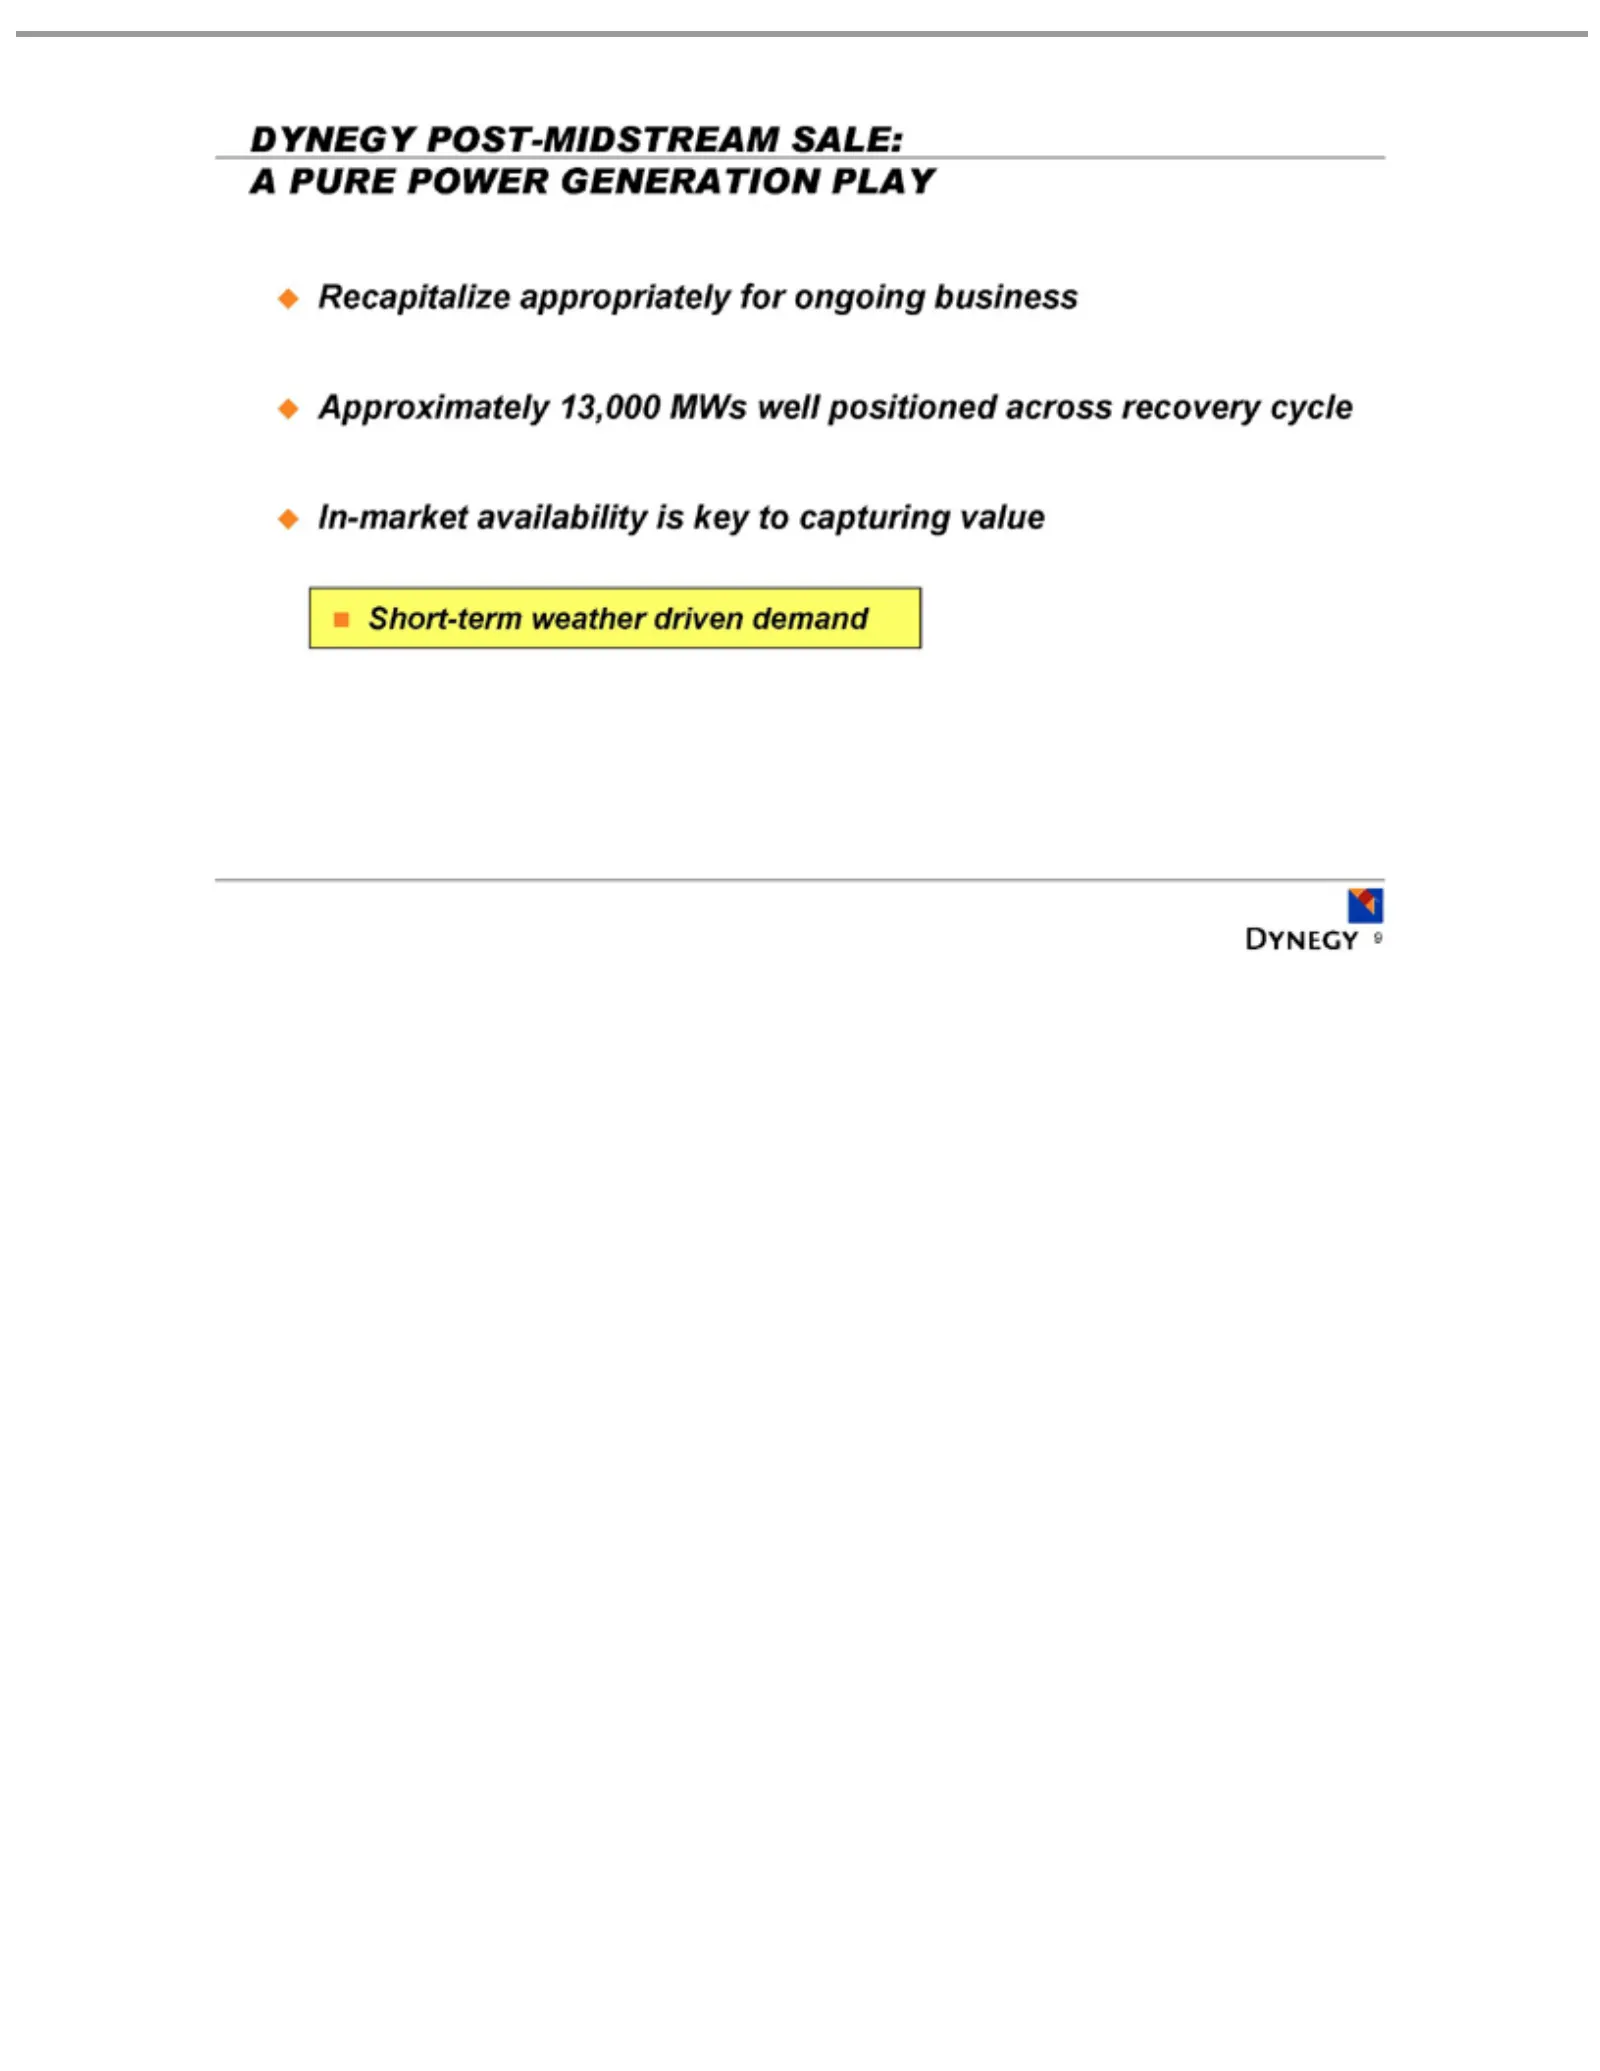
Slide 9: In-Market Availability Key to Capturing Value
DYNEGYavailability Recapitalize Approximately In-market Short-term 9 POST-MIDSTREAM weather appropriately 13,000 driven isMWs key for demand to well ongoing capturing SALE: positioned business Avalue PURE across POWER recovery GENERATION cycle PLAY
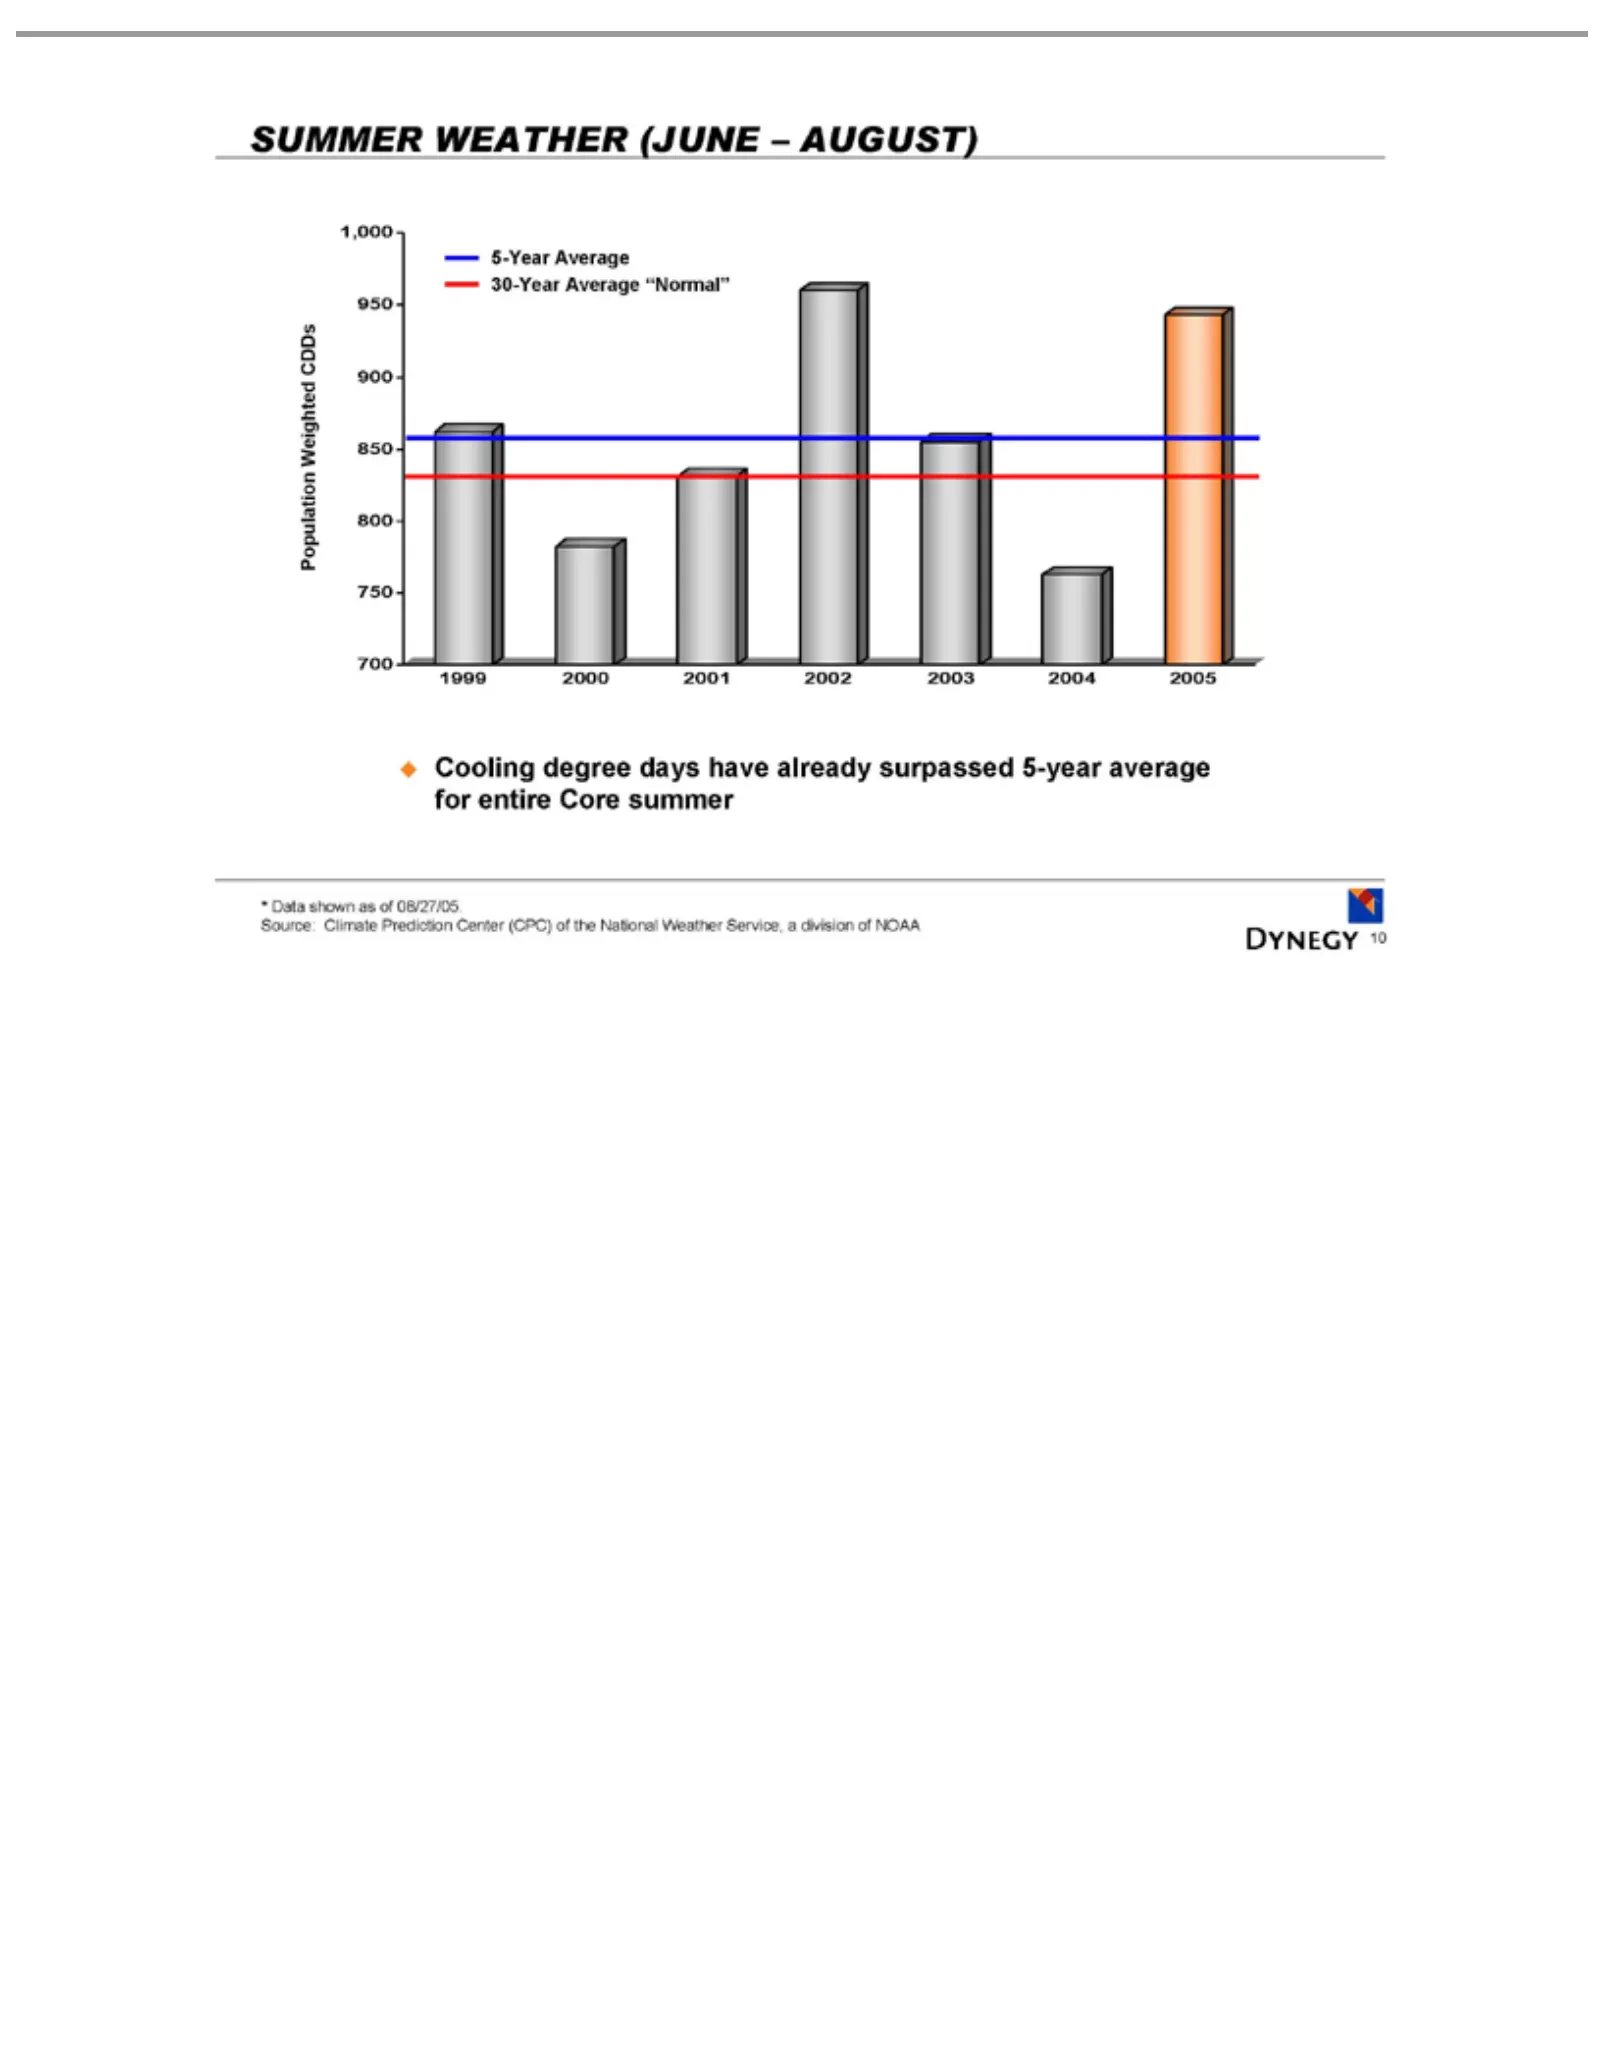
Slide 10: Summer Weather
SUMMER 5-Year 30-Year Population 1,000 1999 Cooling * Source: 10Data2000 950 Average shown Climate Average degree 900 2001 Weighted WEATHER as 850 days Prediction 2002 of “Normal” 800 08/27/05. have CDDs 2003 750 (JUNE already Center 700– AUGUST) 2004 2005 surpassed (CPC) of the 5-year National aver
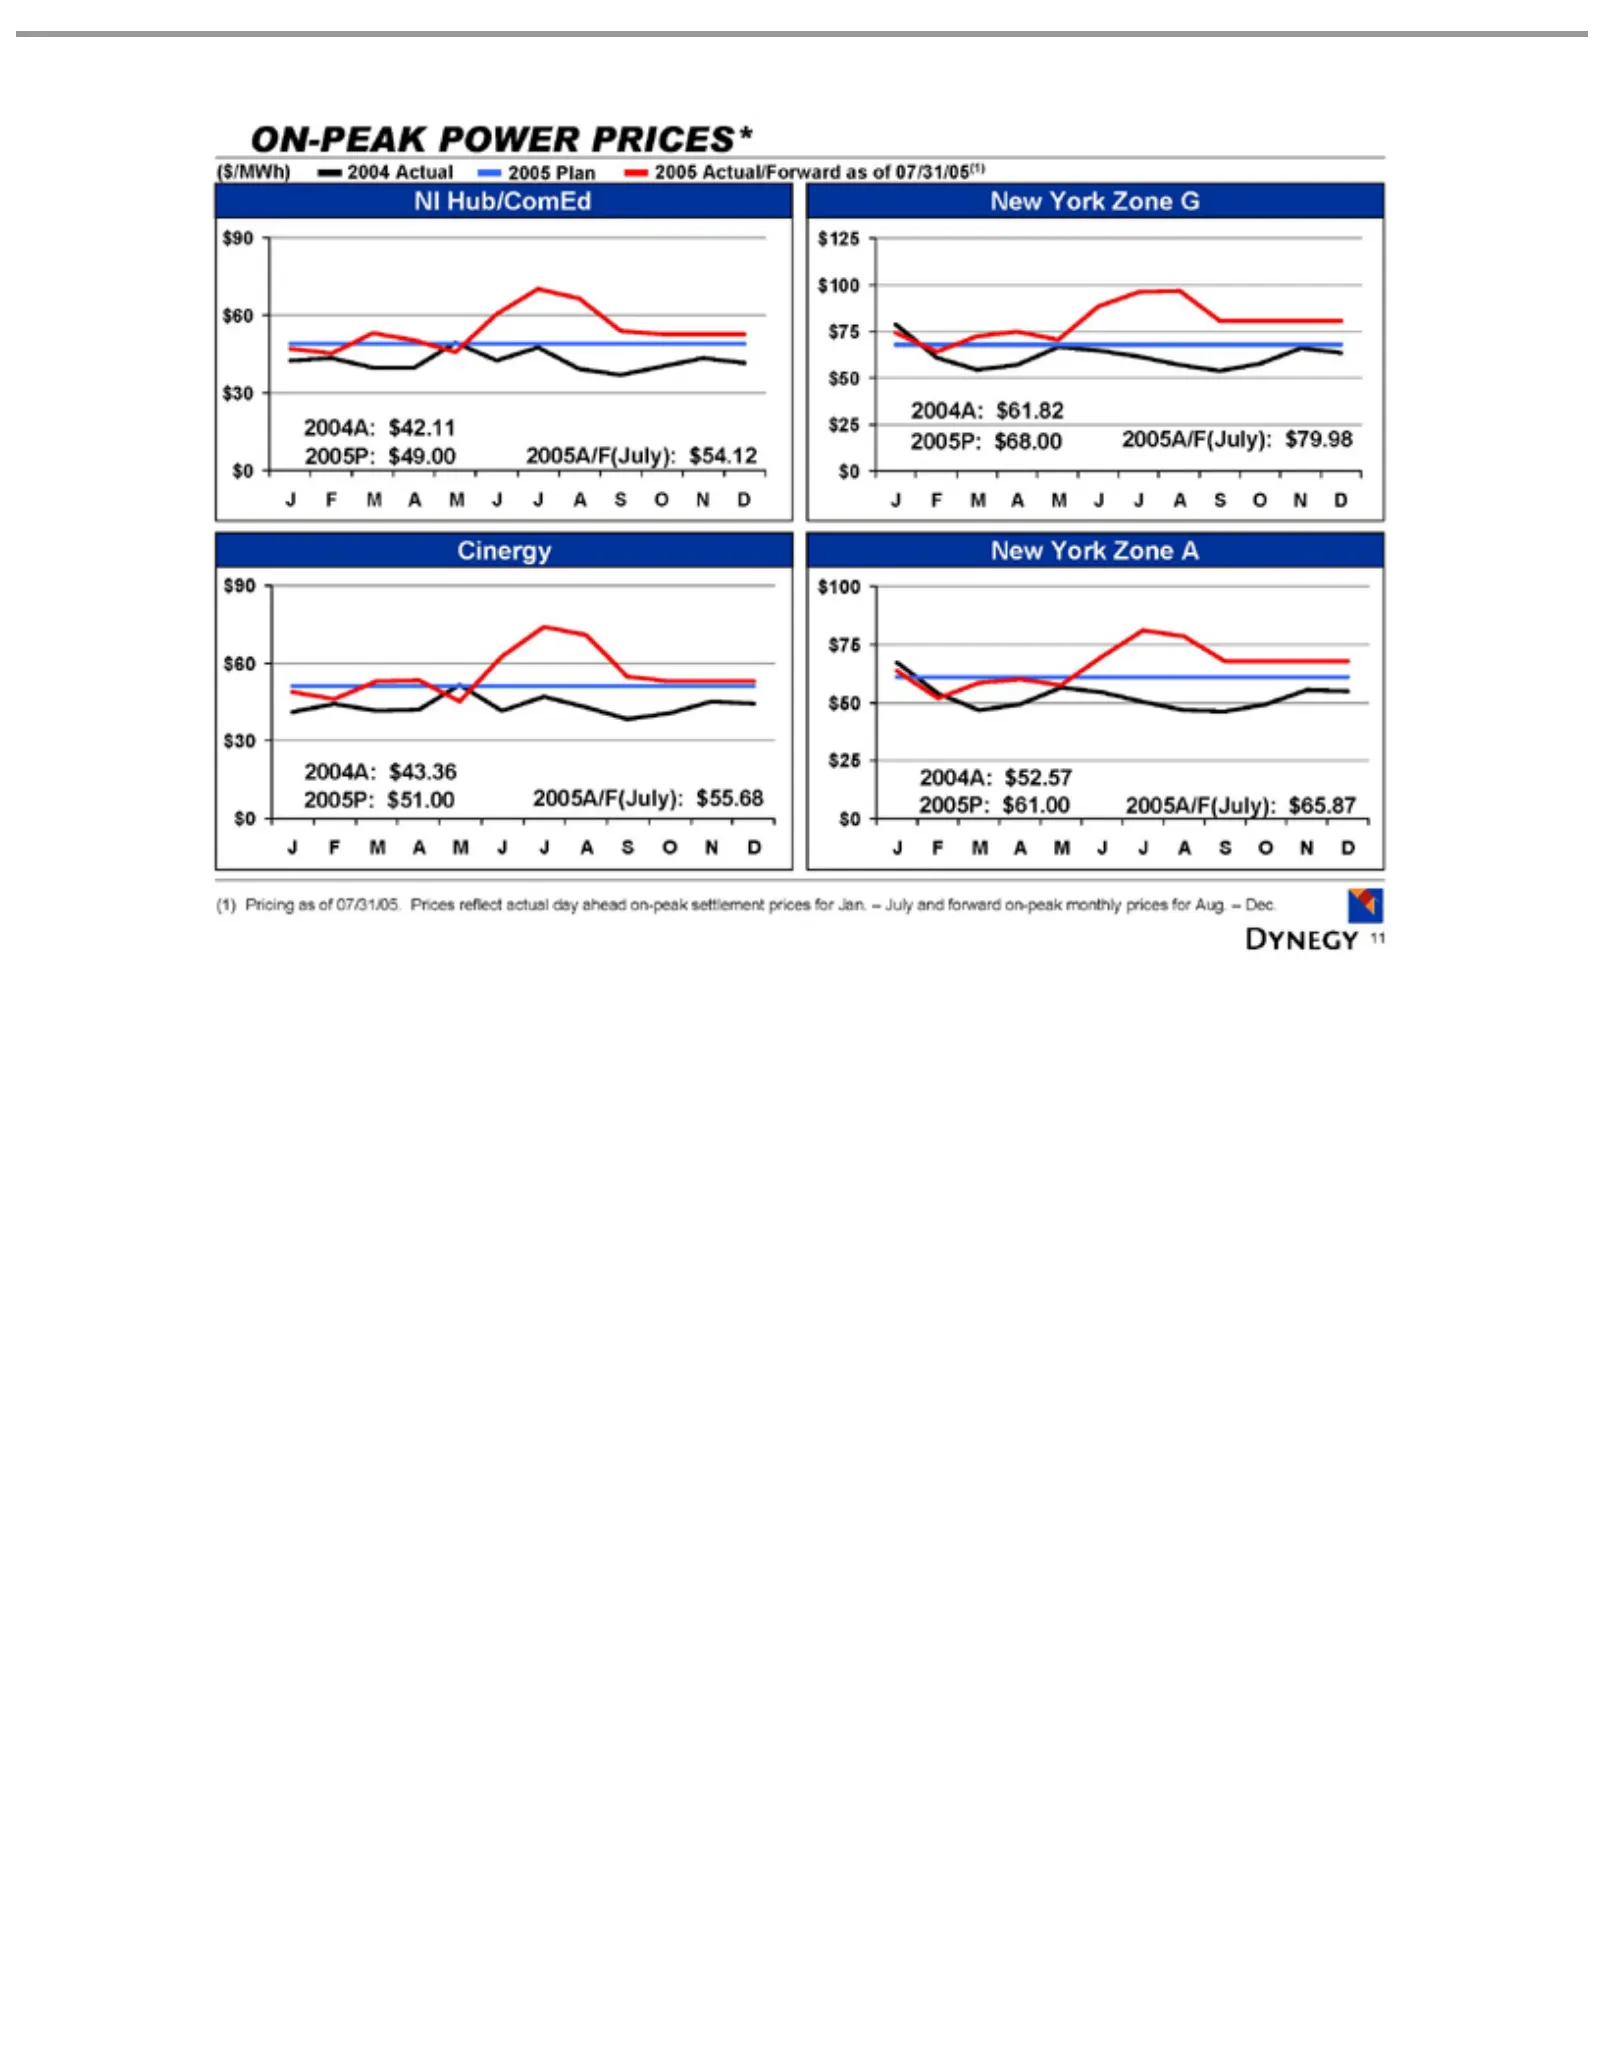
Slide 11: On-Peak Power Prices
ON-PEAK 2004 ($/MWh) 2005 NI $125 Cinergy $0 $30 $60 New J$100 2004A: 2005A/F(July): (1) 11F Hub/ComEd Pricing MYork Actual Actual/Forward Plan $100 $75 A$52.57 $42.11 $61.82 $43.36 M $90 $50 Zone $75 as JPOWER Jof $25 A2005P: $50 $54.12 $79.98 $55.68 $65.87 A G $90 07/31/05. S $0 O$25 $60 PRICES* N
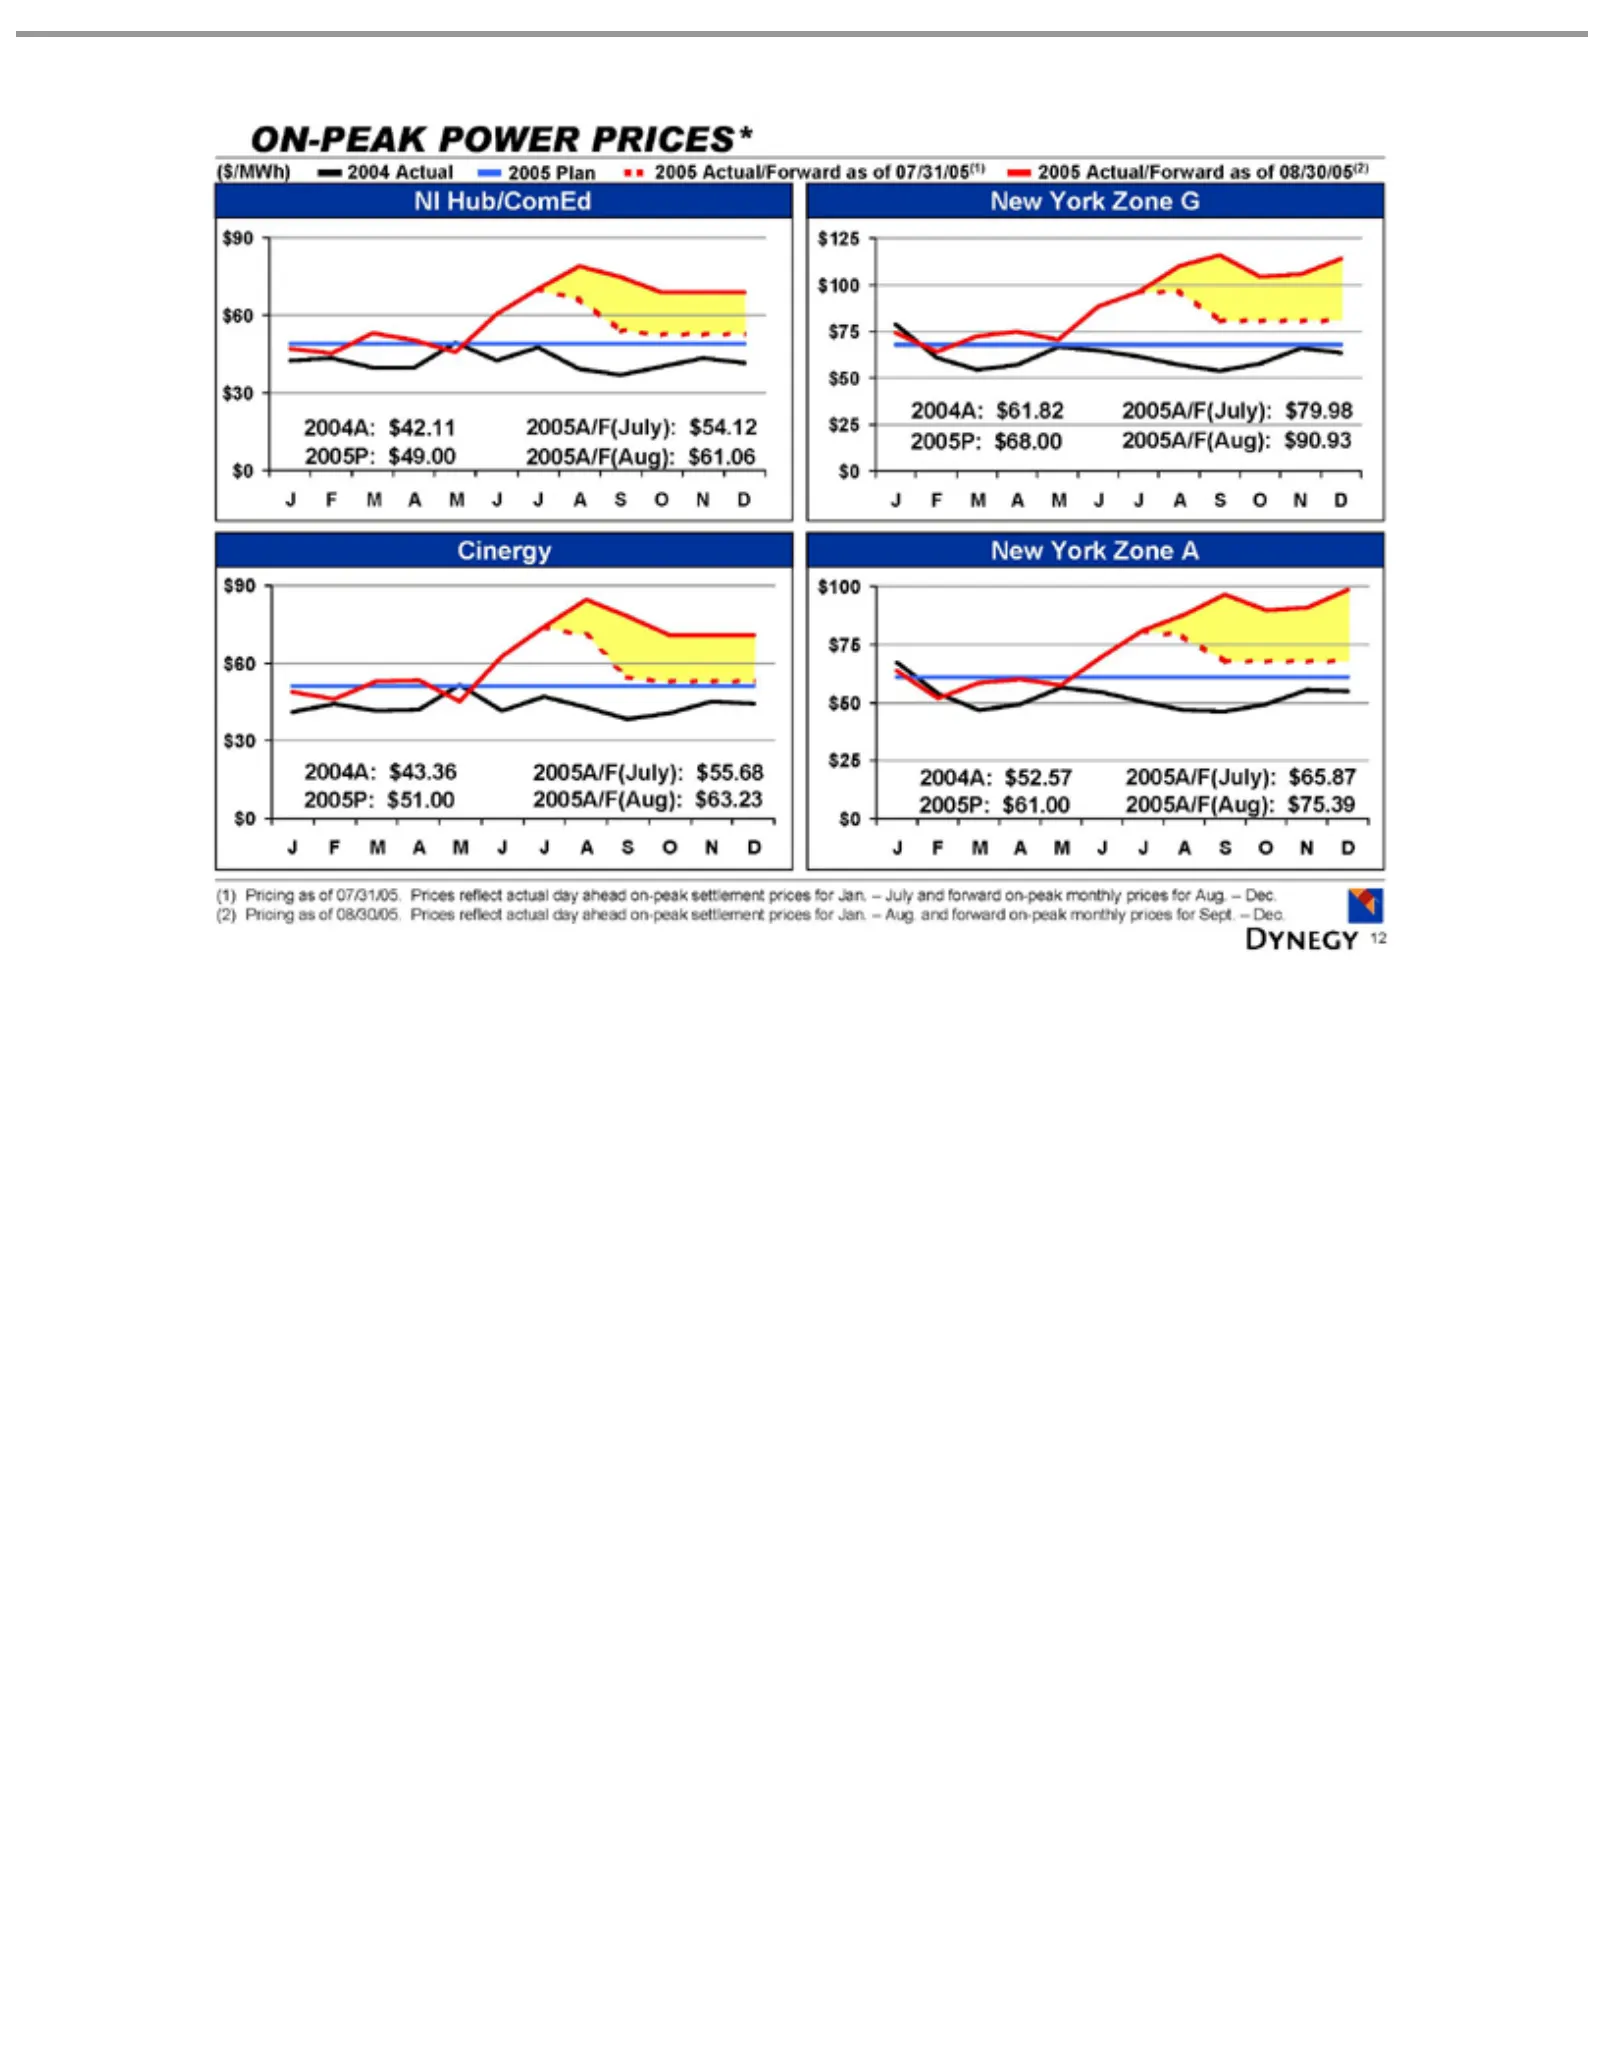
Slide 12: On-Peak Power Prices (Updated)
ON-PEAK 2004 ($/MWh) 2005 NI $125 Cinergy $0 $30 $60 New J$100 2004A: 2005A/F(July): (1) day 12F Hub/ComEd Pricing Mahead York Actual Actual/Forward Plan $100 $75 A$52.57 $42.11 $61.82 $43.36 M $90 $50 on-peak Zone $75 as JPOWER Jof $25 A2005P: $50 $54.12 $79.98 $55.68 $65.87 A G $90 07/31/05. S $0
Slide 13: Longer-Term Power Market Recovery
DYNEGYavailability Recapitalize Approximately In-market Short-term Longer-term 13 POST-MIDSTREAM weather appropriately power 13,000 driven market isMWs key for demand recovery to well ongoing capturing SALE: positioned business Avalue PURE across POWER recovery GENERATION cycle PLAY
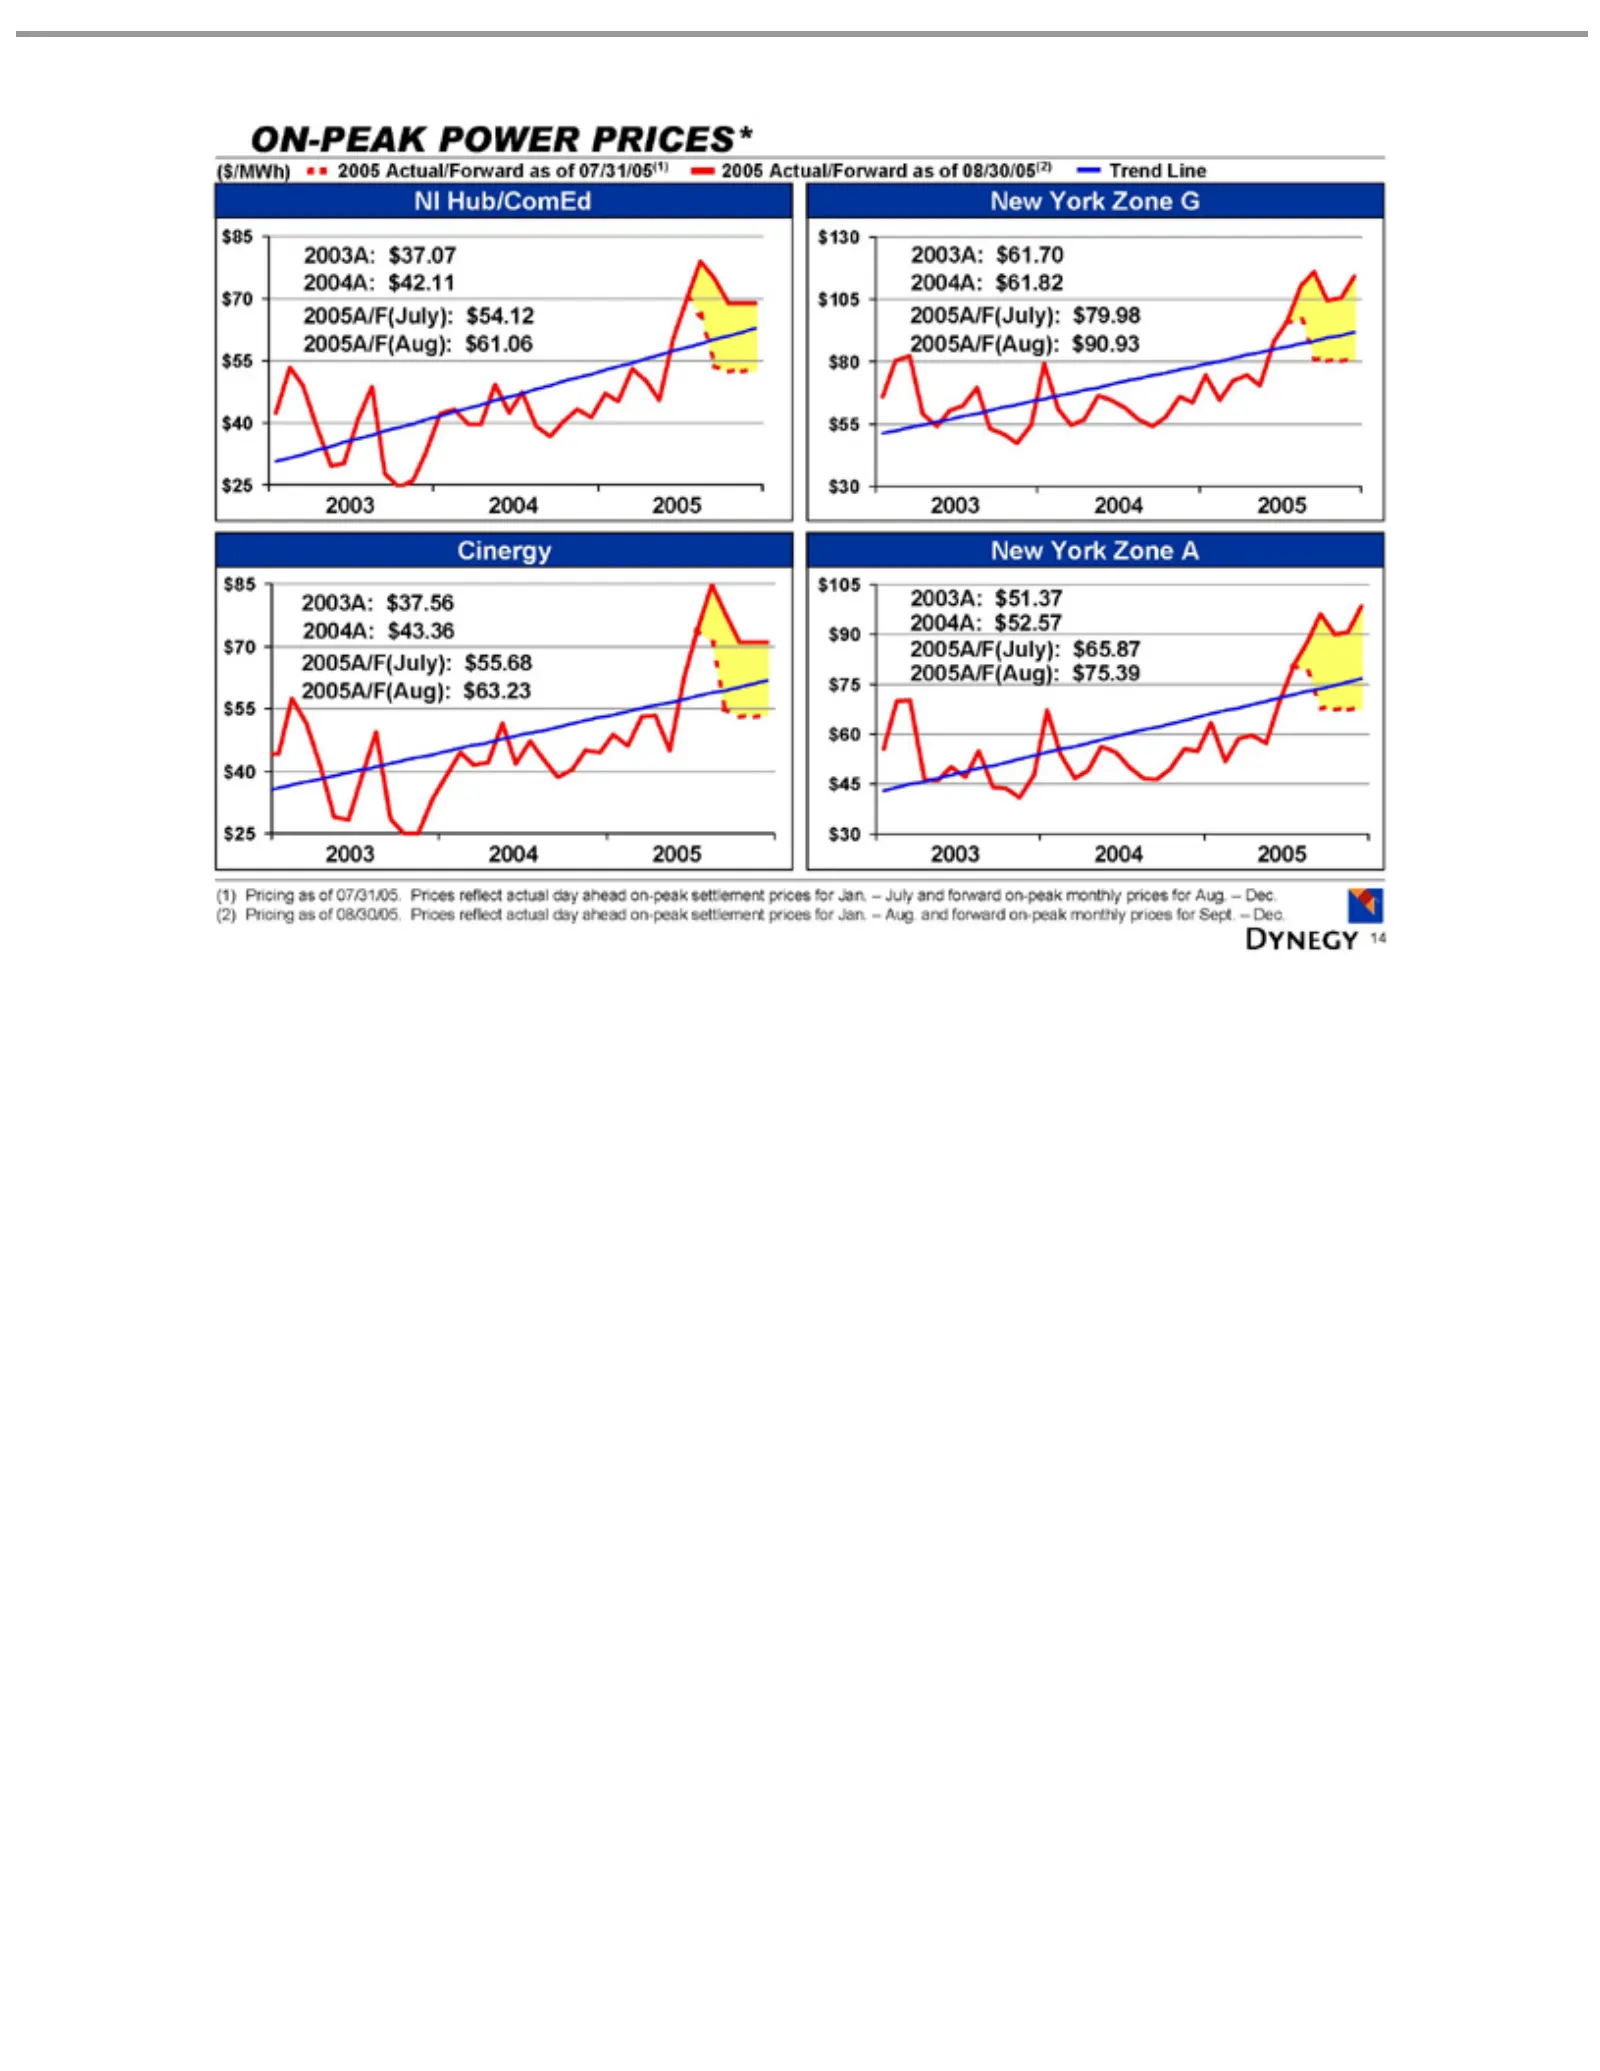
Slide 14: On-Peak Power Prices Trend
ON-PEAK ($/MWh) 2005 Trend NI $130 Cinergy New $105 2003A: 2003 (1) day 14 Hub/ComEd Pricing ahead York Actual/Forward $105 $90 2004 Line $37.07 $61.70 $37.56 $51.37 $85 $75 on-peak Zone $80 2005 as POWER $70 of $60 $55 2004A: A G $85 07/31/05. $55 $45 settlement $30 $70 PRICES* $40 as$30 $42.11 $61
Slide 15: Reduce Hedging to Maximize Cyclical Upside
DYNEGY Recapitalize Approximately In-market Short-term Longer-term Reduce 15 hedging availability POST-MIDSTREAM weather appropriately power 13,000 to maximize driven market isMWs key for demand recovery to well commodity ongoing capturing SALE: positioned business Avalue cyclical PURE across POWER
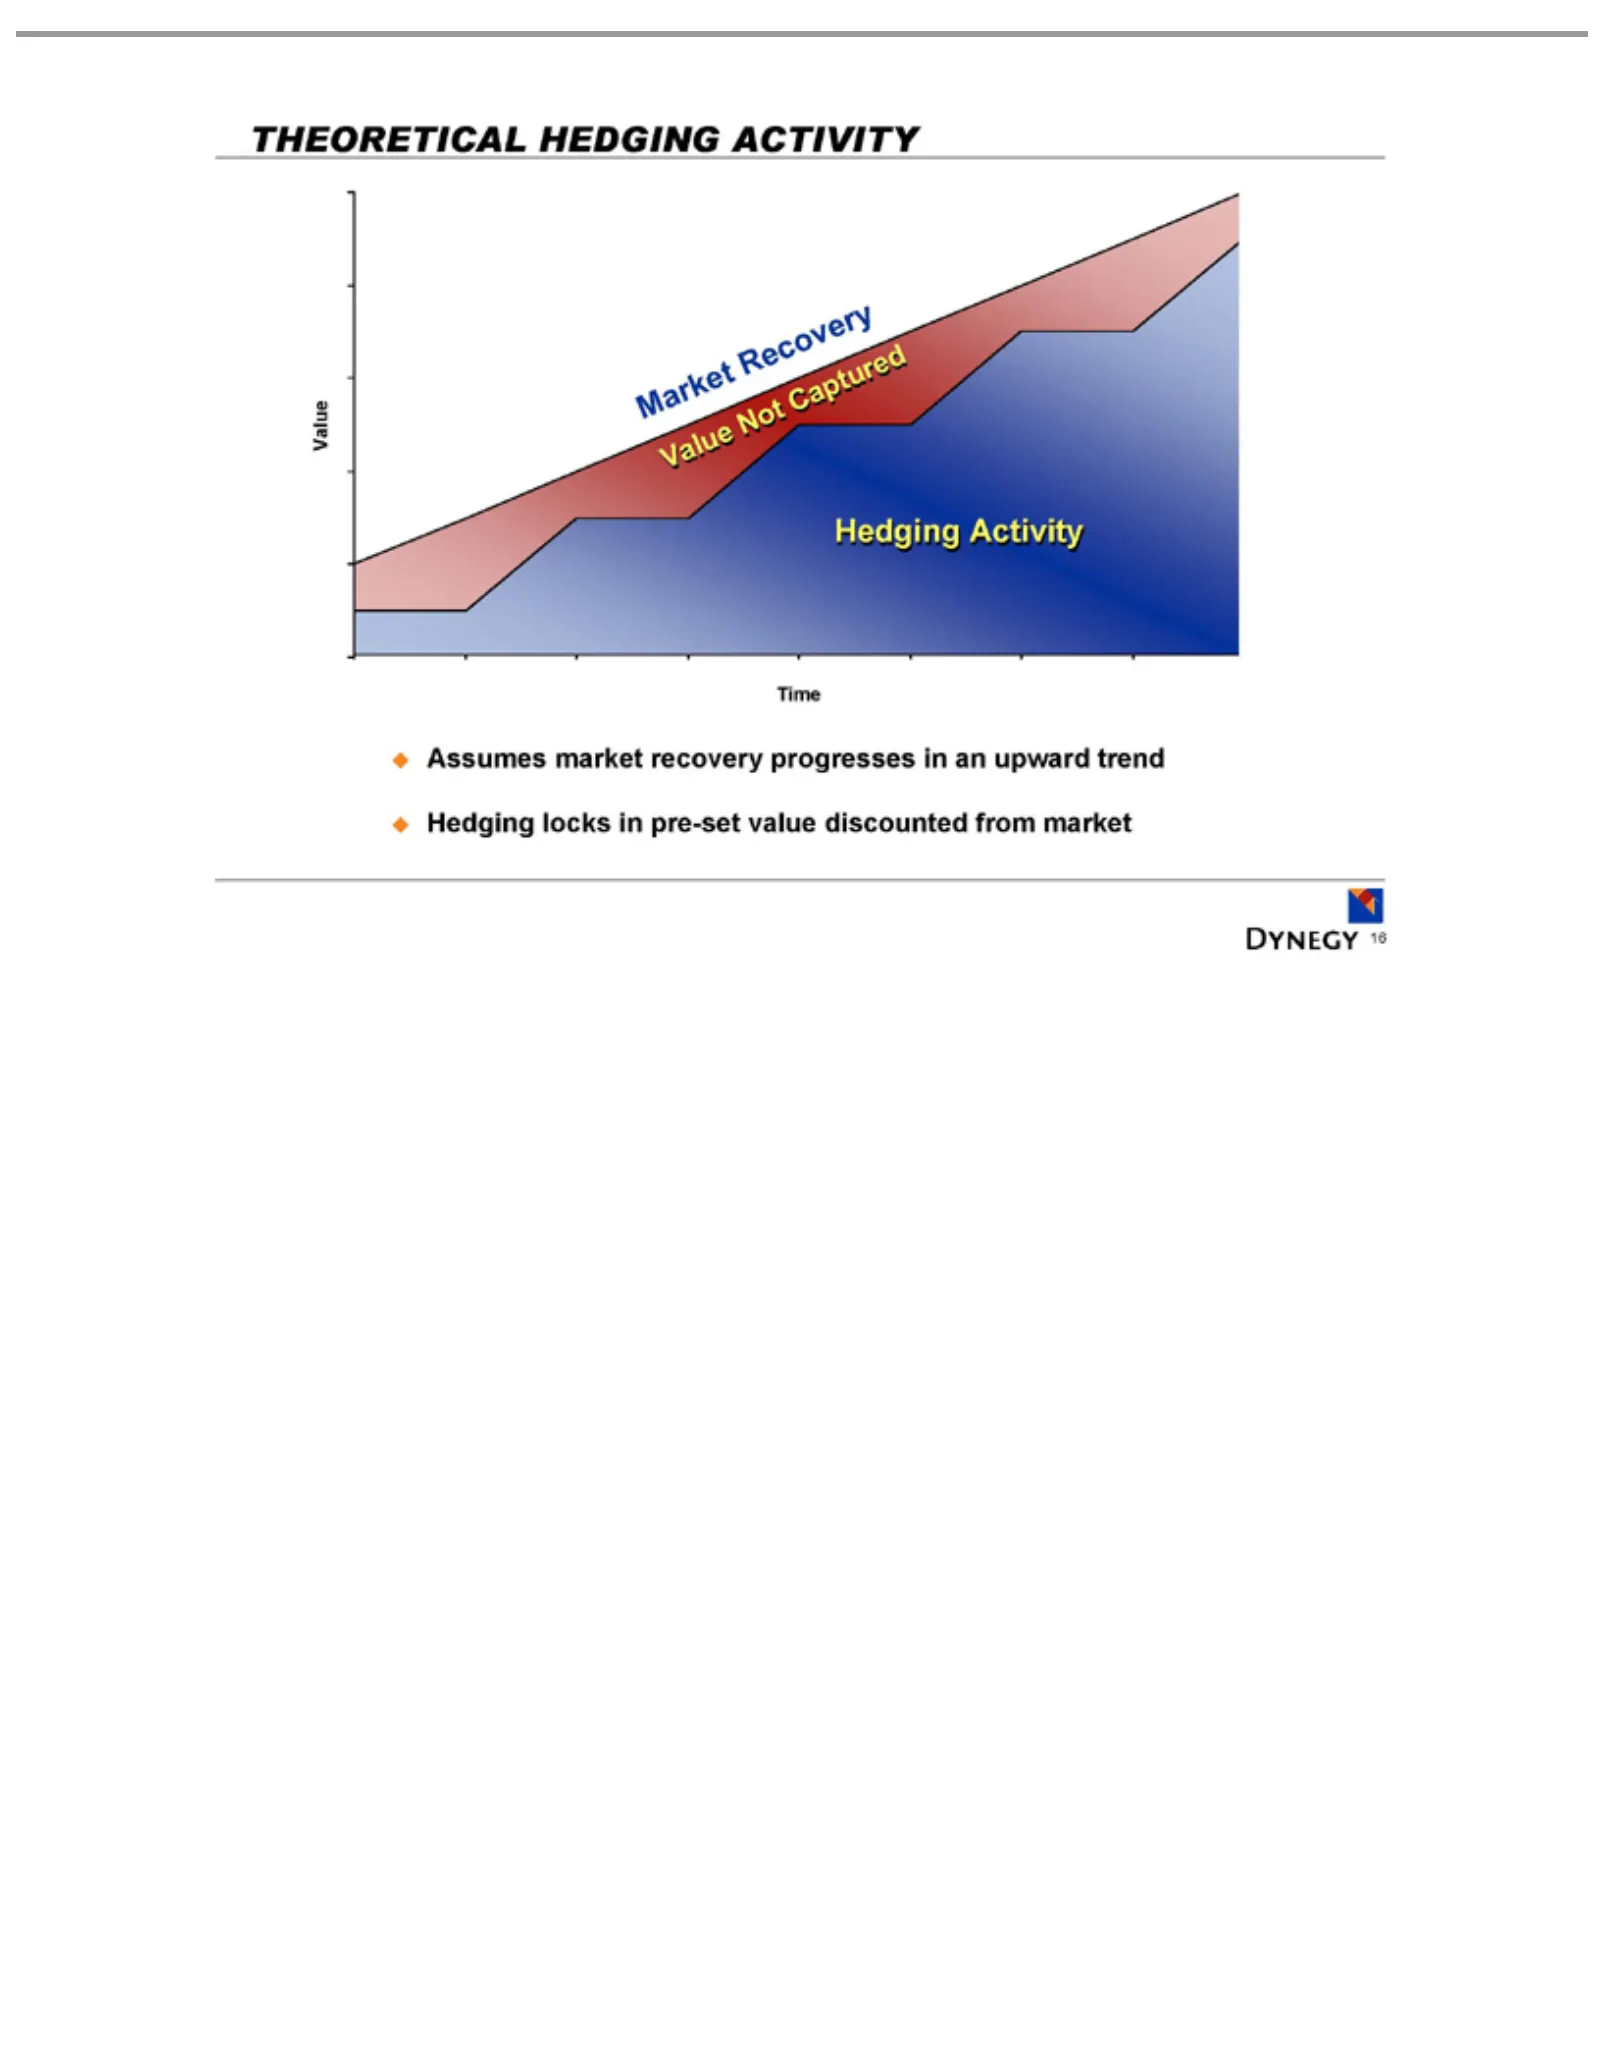
Slide 16: Theoretical Hedging Activity
THEORETICAL Market Value Assumes Time Hedging 16 Not Recovery Activity locks market Captured in recovery pre-set HEDGING value progresses ACTIVITY discounted in anfrom upward market trend
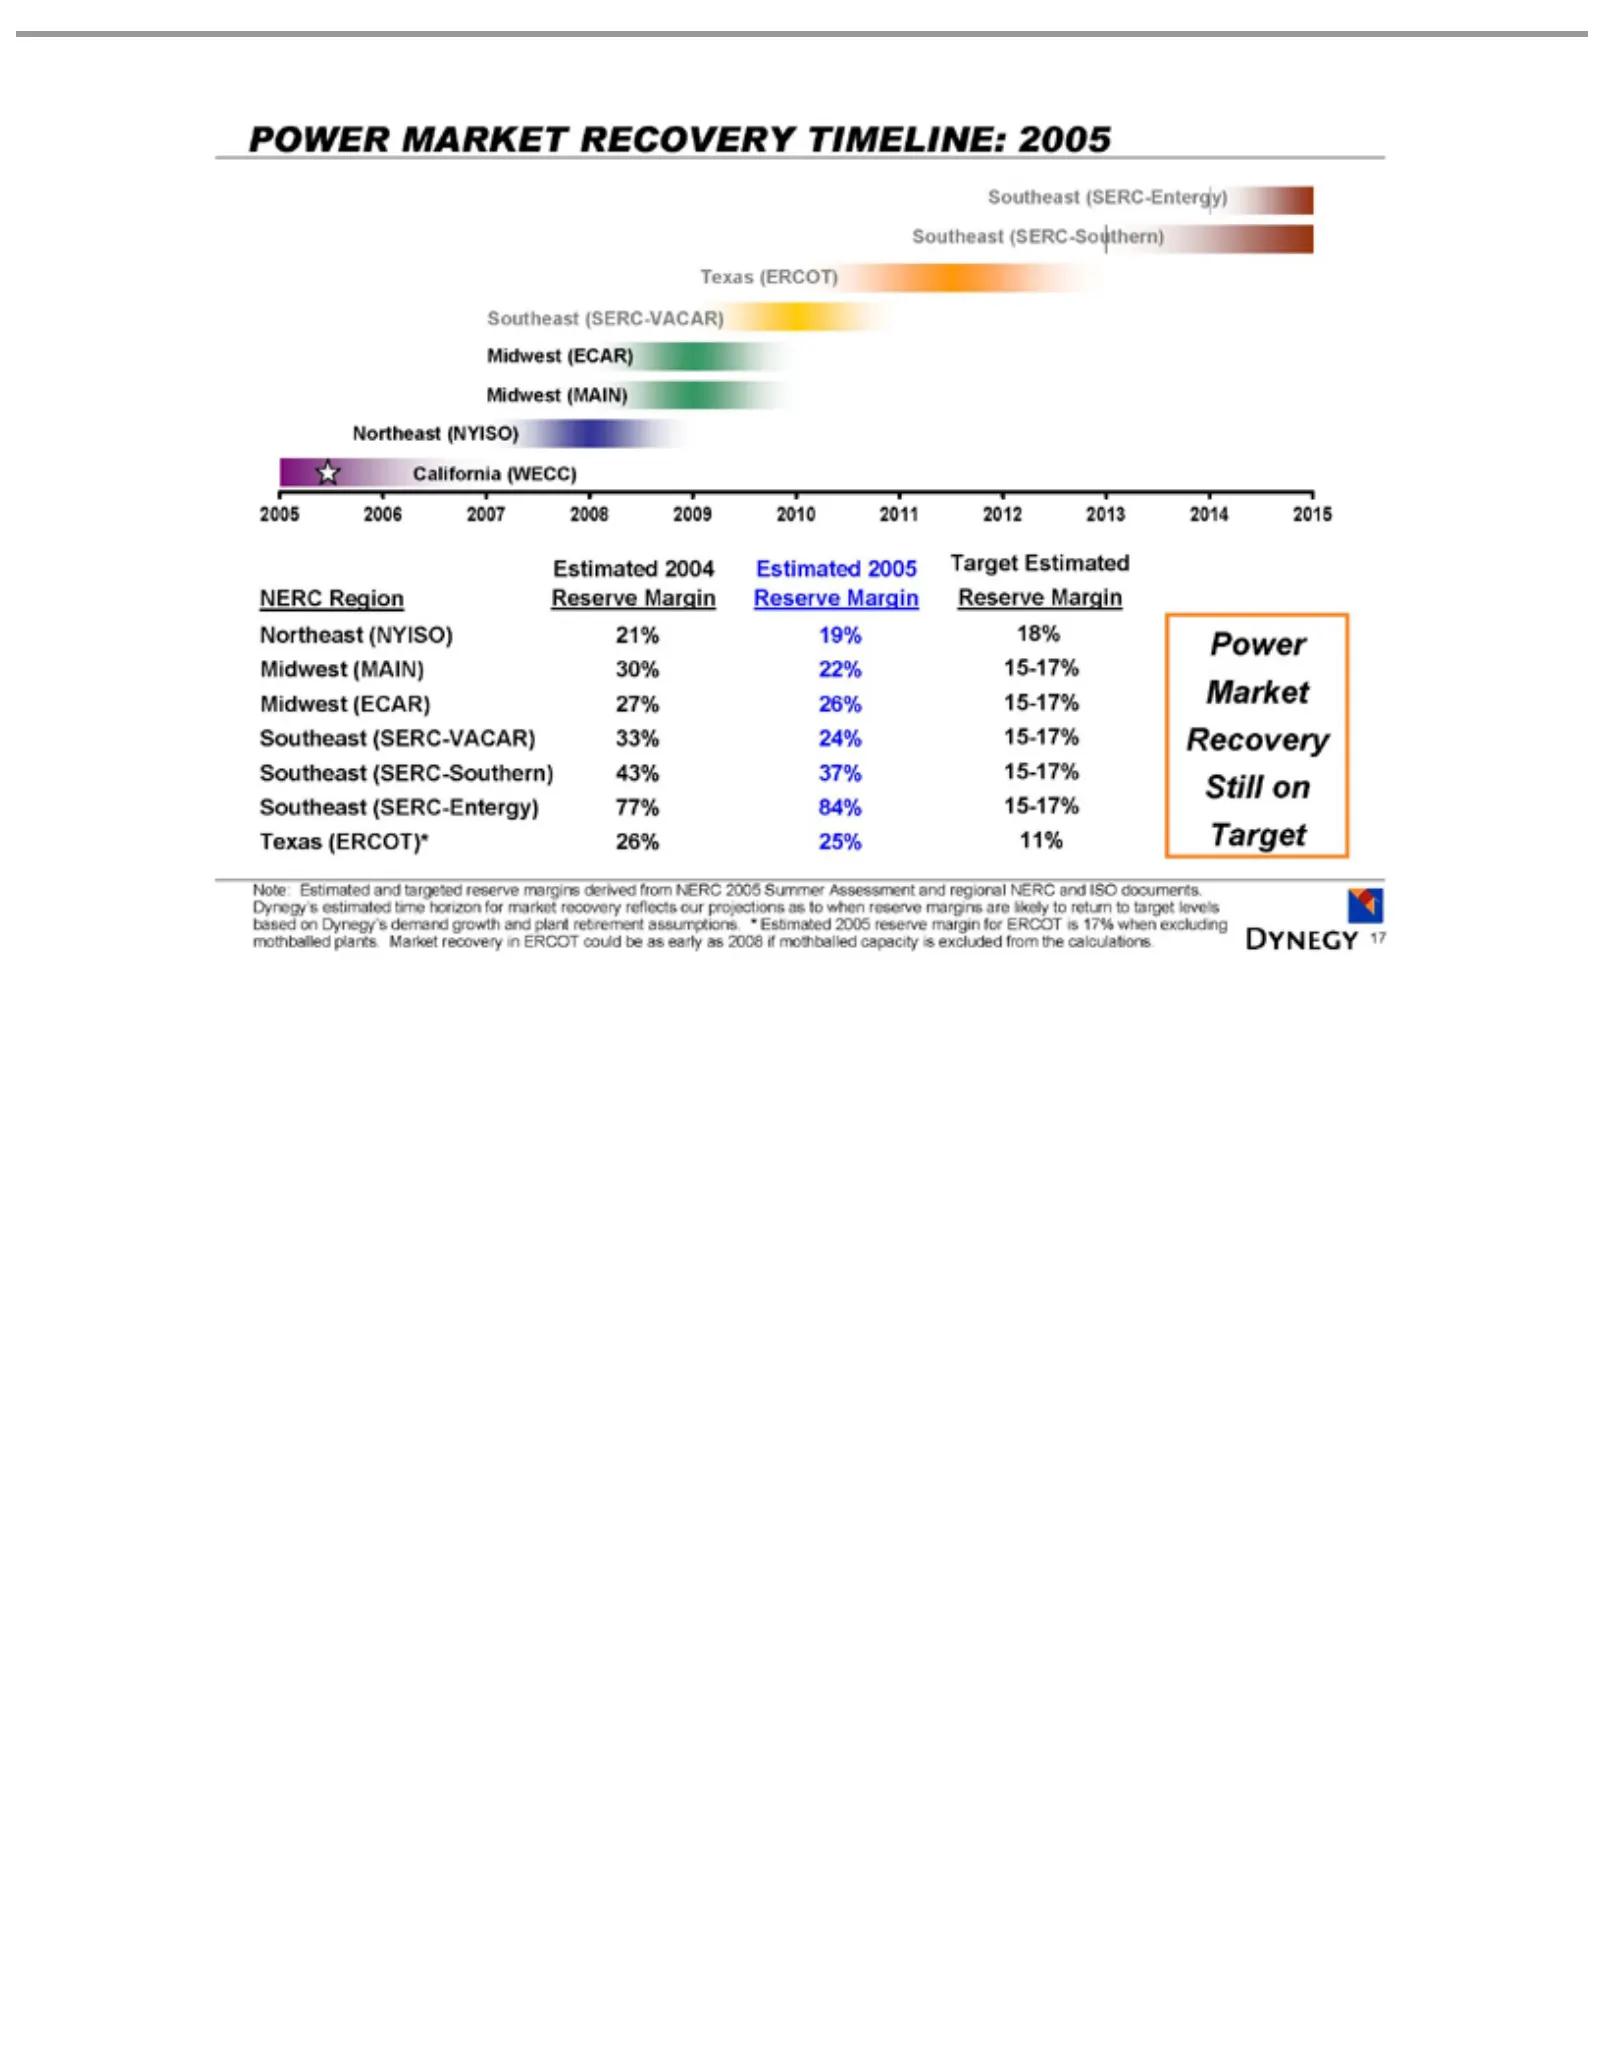
Slide 17: Power Market Recovery Timeline
POWER California 2005 NERC Northeast Midwest Southeast Texas Power Note: our 17% 17 projections when 2006 Estimated (ERCOT) (ERCOT)* Market Region MARKET (MAIN) (ECAR) (NYISO) (SERC-VACAR) (SERC-Southern) (SERC-Entergy) (WECC) excluding 2007 Recovery Estimated asand 2008 26% 30% 27% to21% RECOVERY w
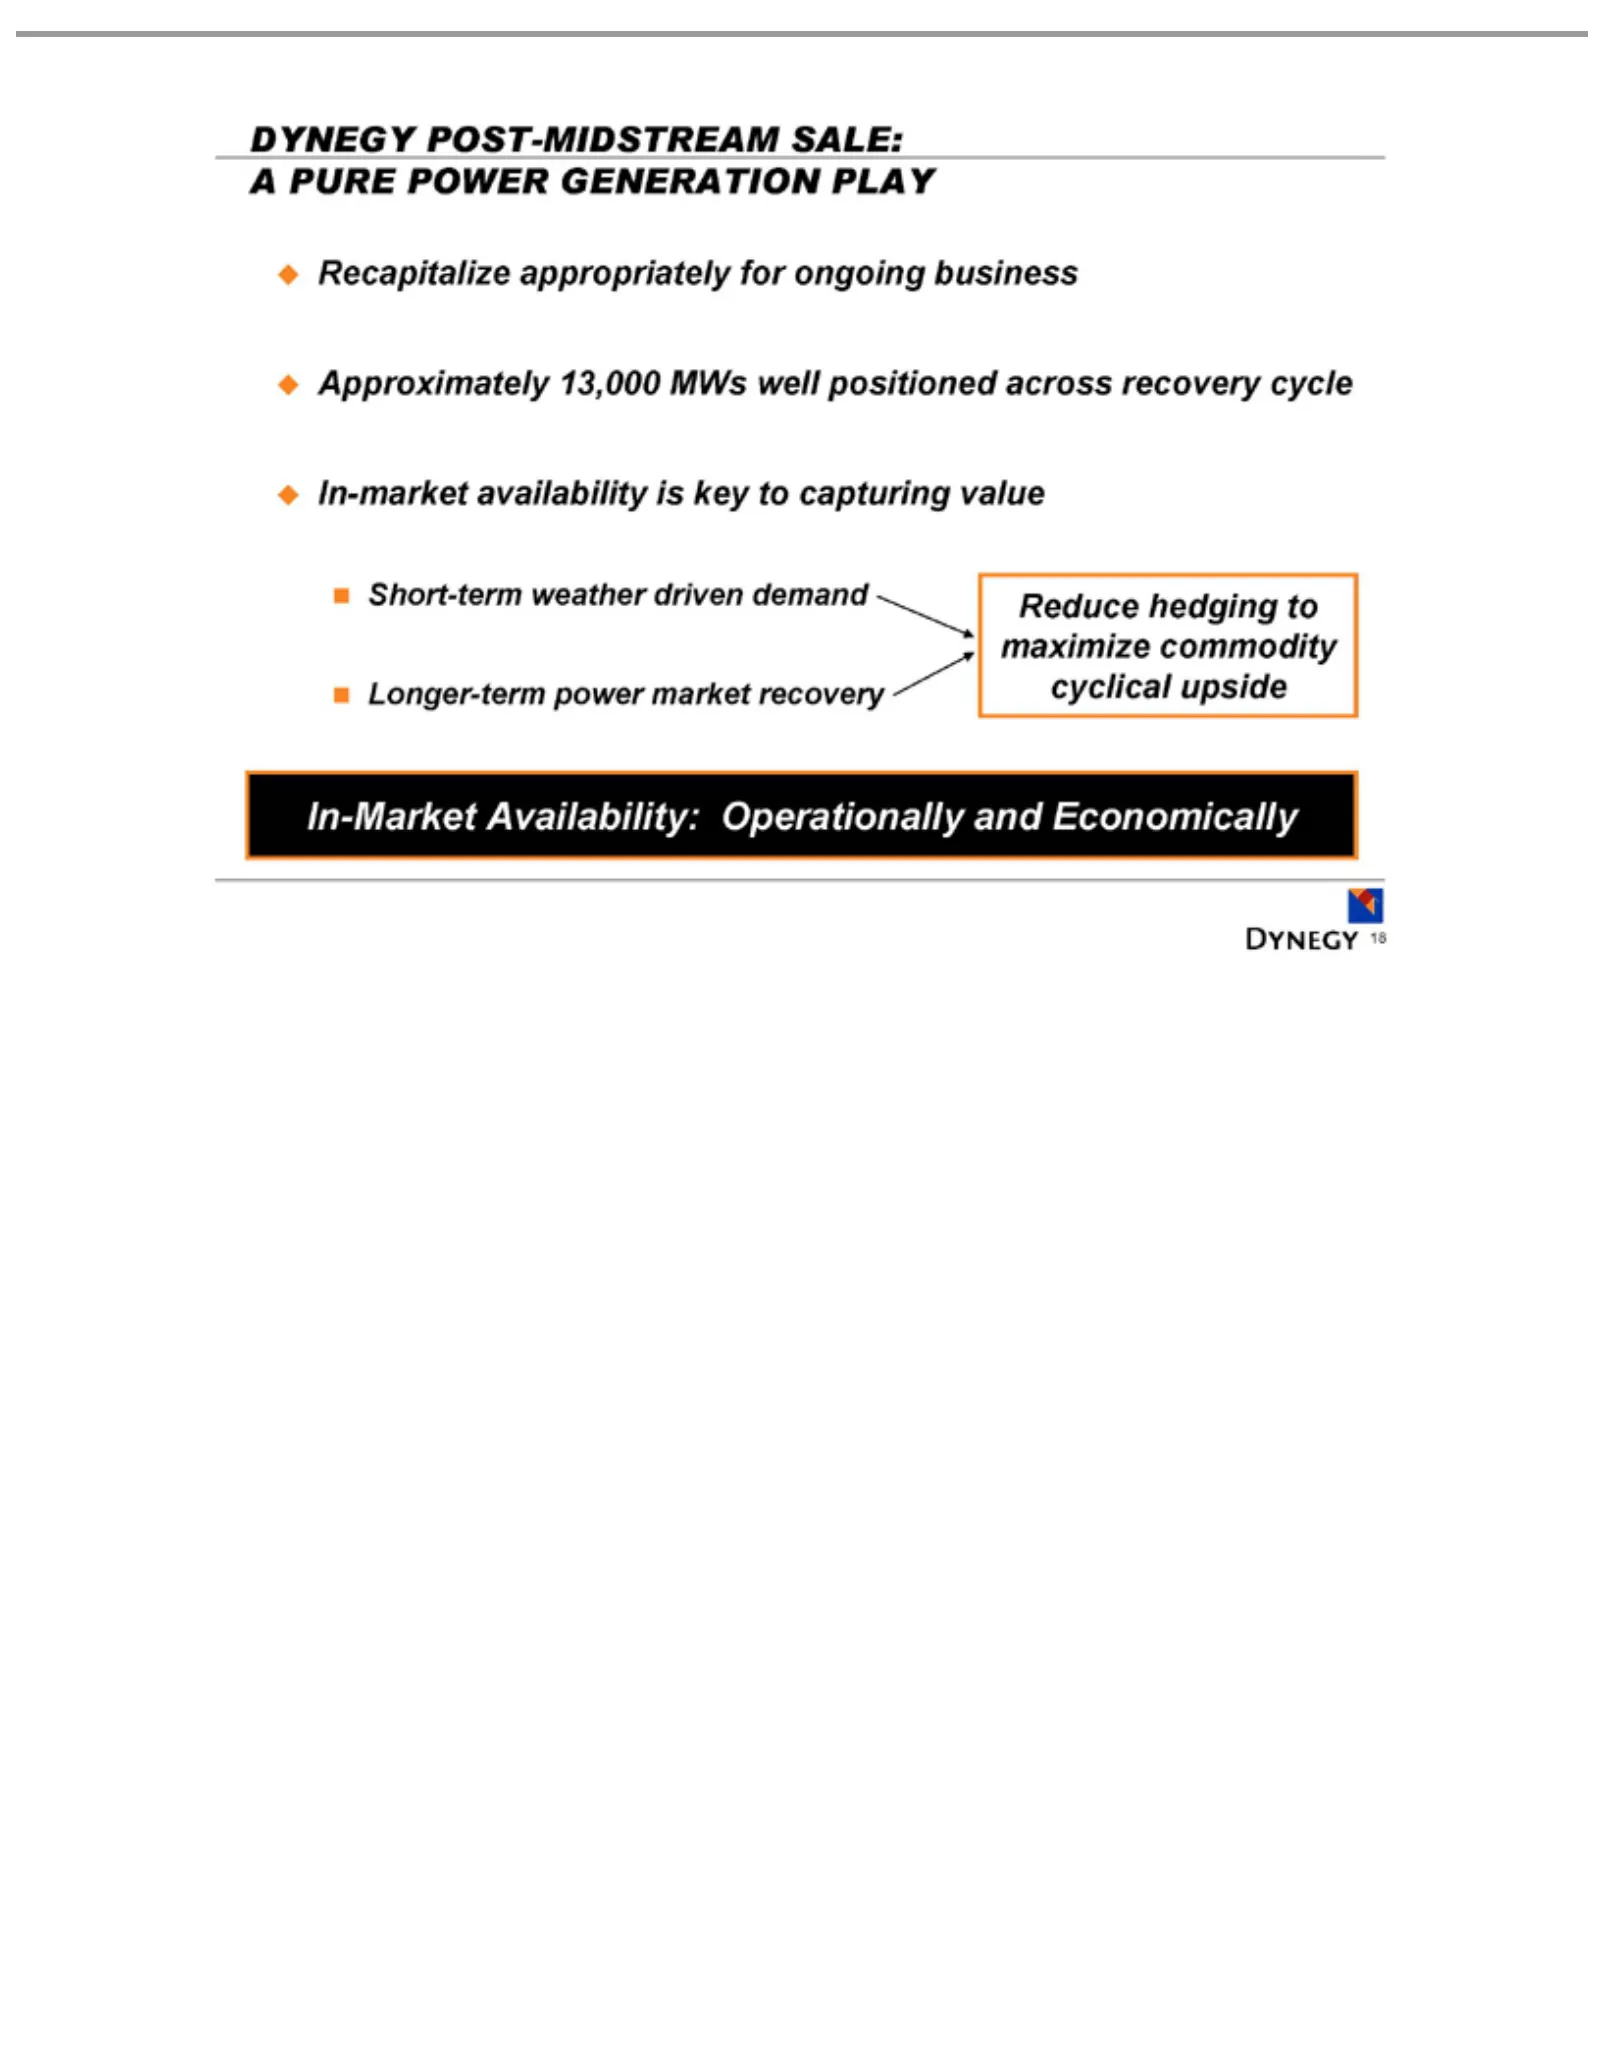
Slide 18: In-Market Availability: Operationally and Economically
DYNEGY Recapitalize Approximately In-market Short-term Longer-term Reduce In-Market 18 hedging availability Availability: POST-MIDSTREAM weather appropriately power 13,000 to maximize driven market isMWs Operationally key for demand recovery to well commodity ongoing capturing SALE: positioned and b
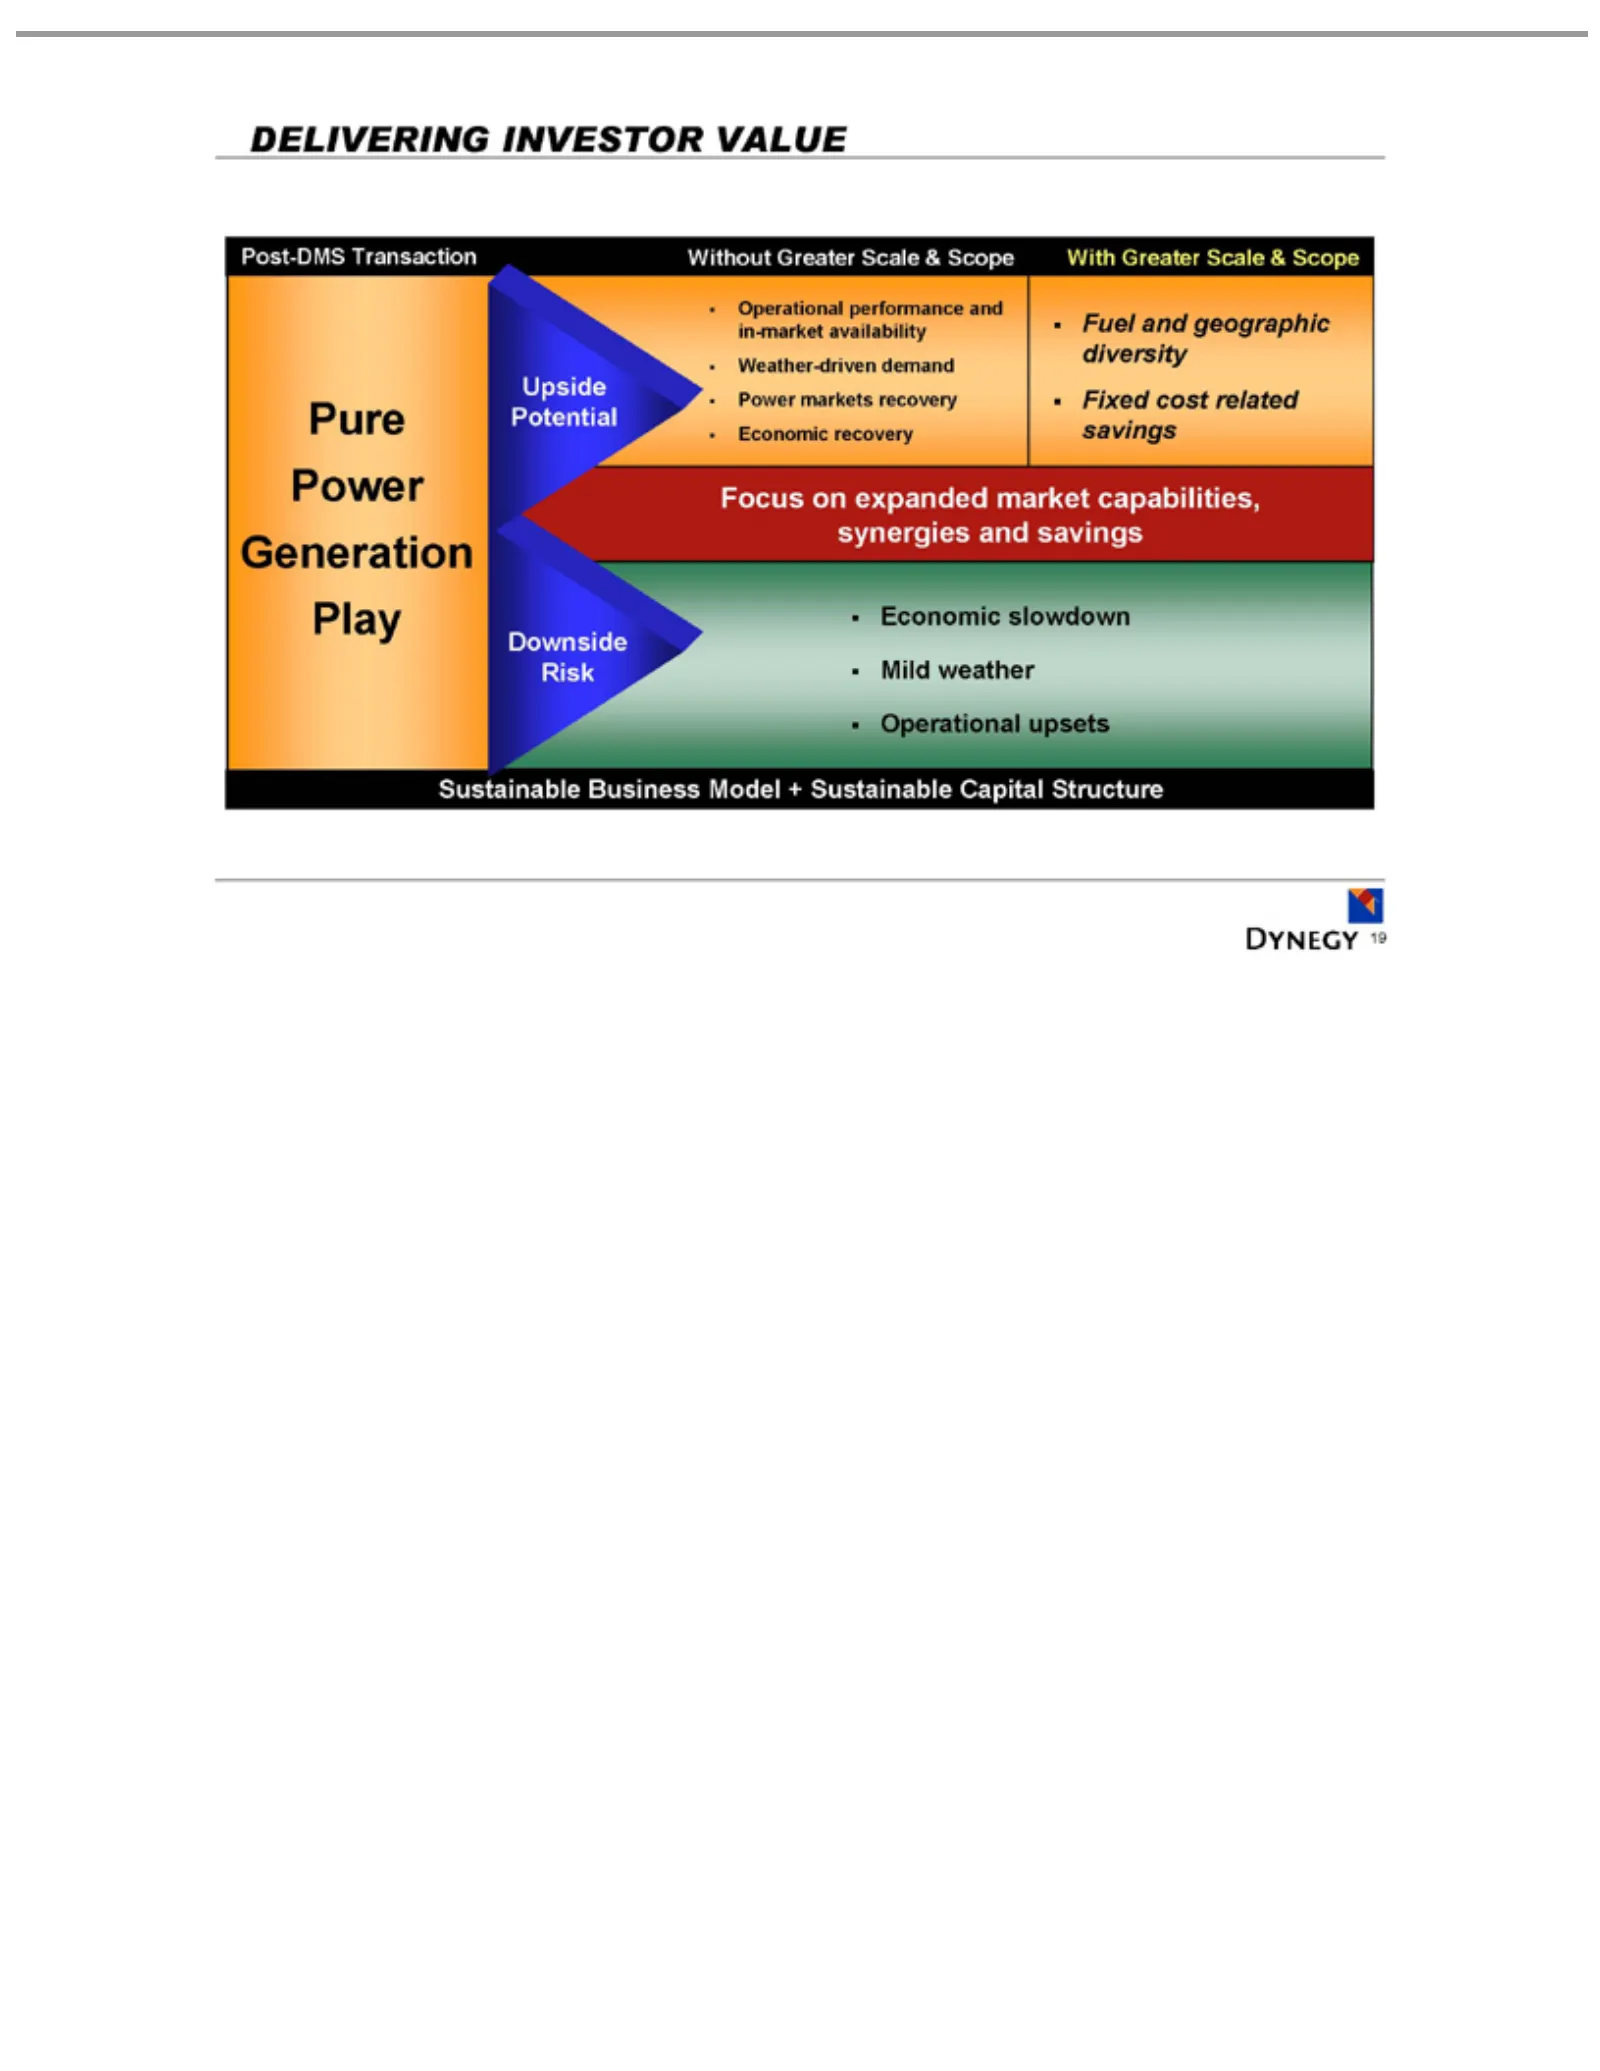
Slide 19: Delivering Investor Value
DELIVERING Post-DMS Without With Pure Upside Downside Operational Fuel Focus Economic Sustainable 19 and Power Greater on Potential Greater geographic expanded slowdown Risk Transaction Business Generation performance Scale INVESTOR Scale & market diversity Mild Model Scope &Play Scope and weather c
Slide 20: Appendix
APPENDIX
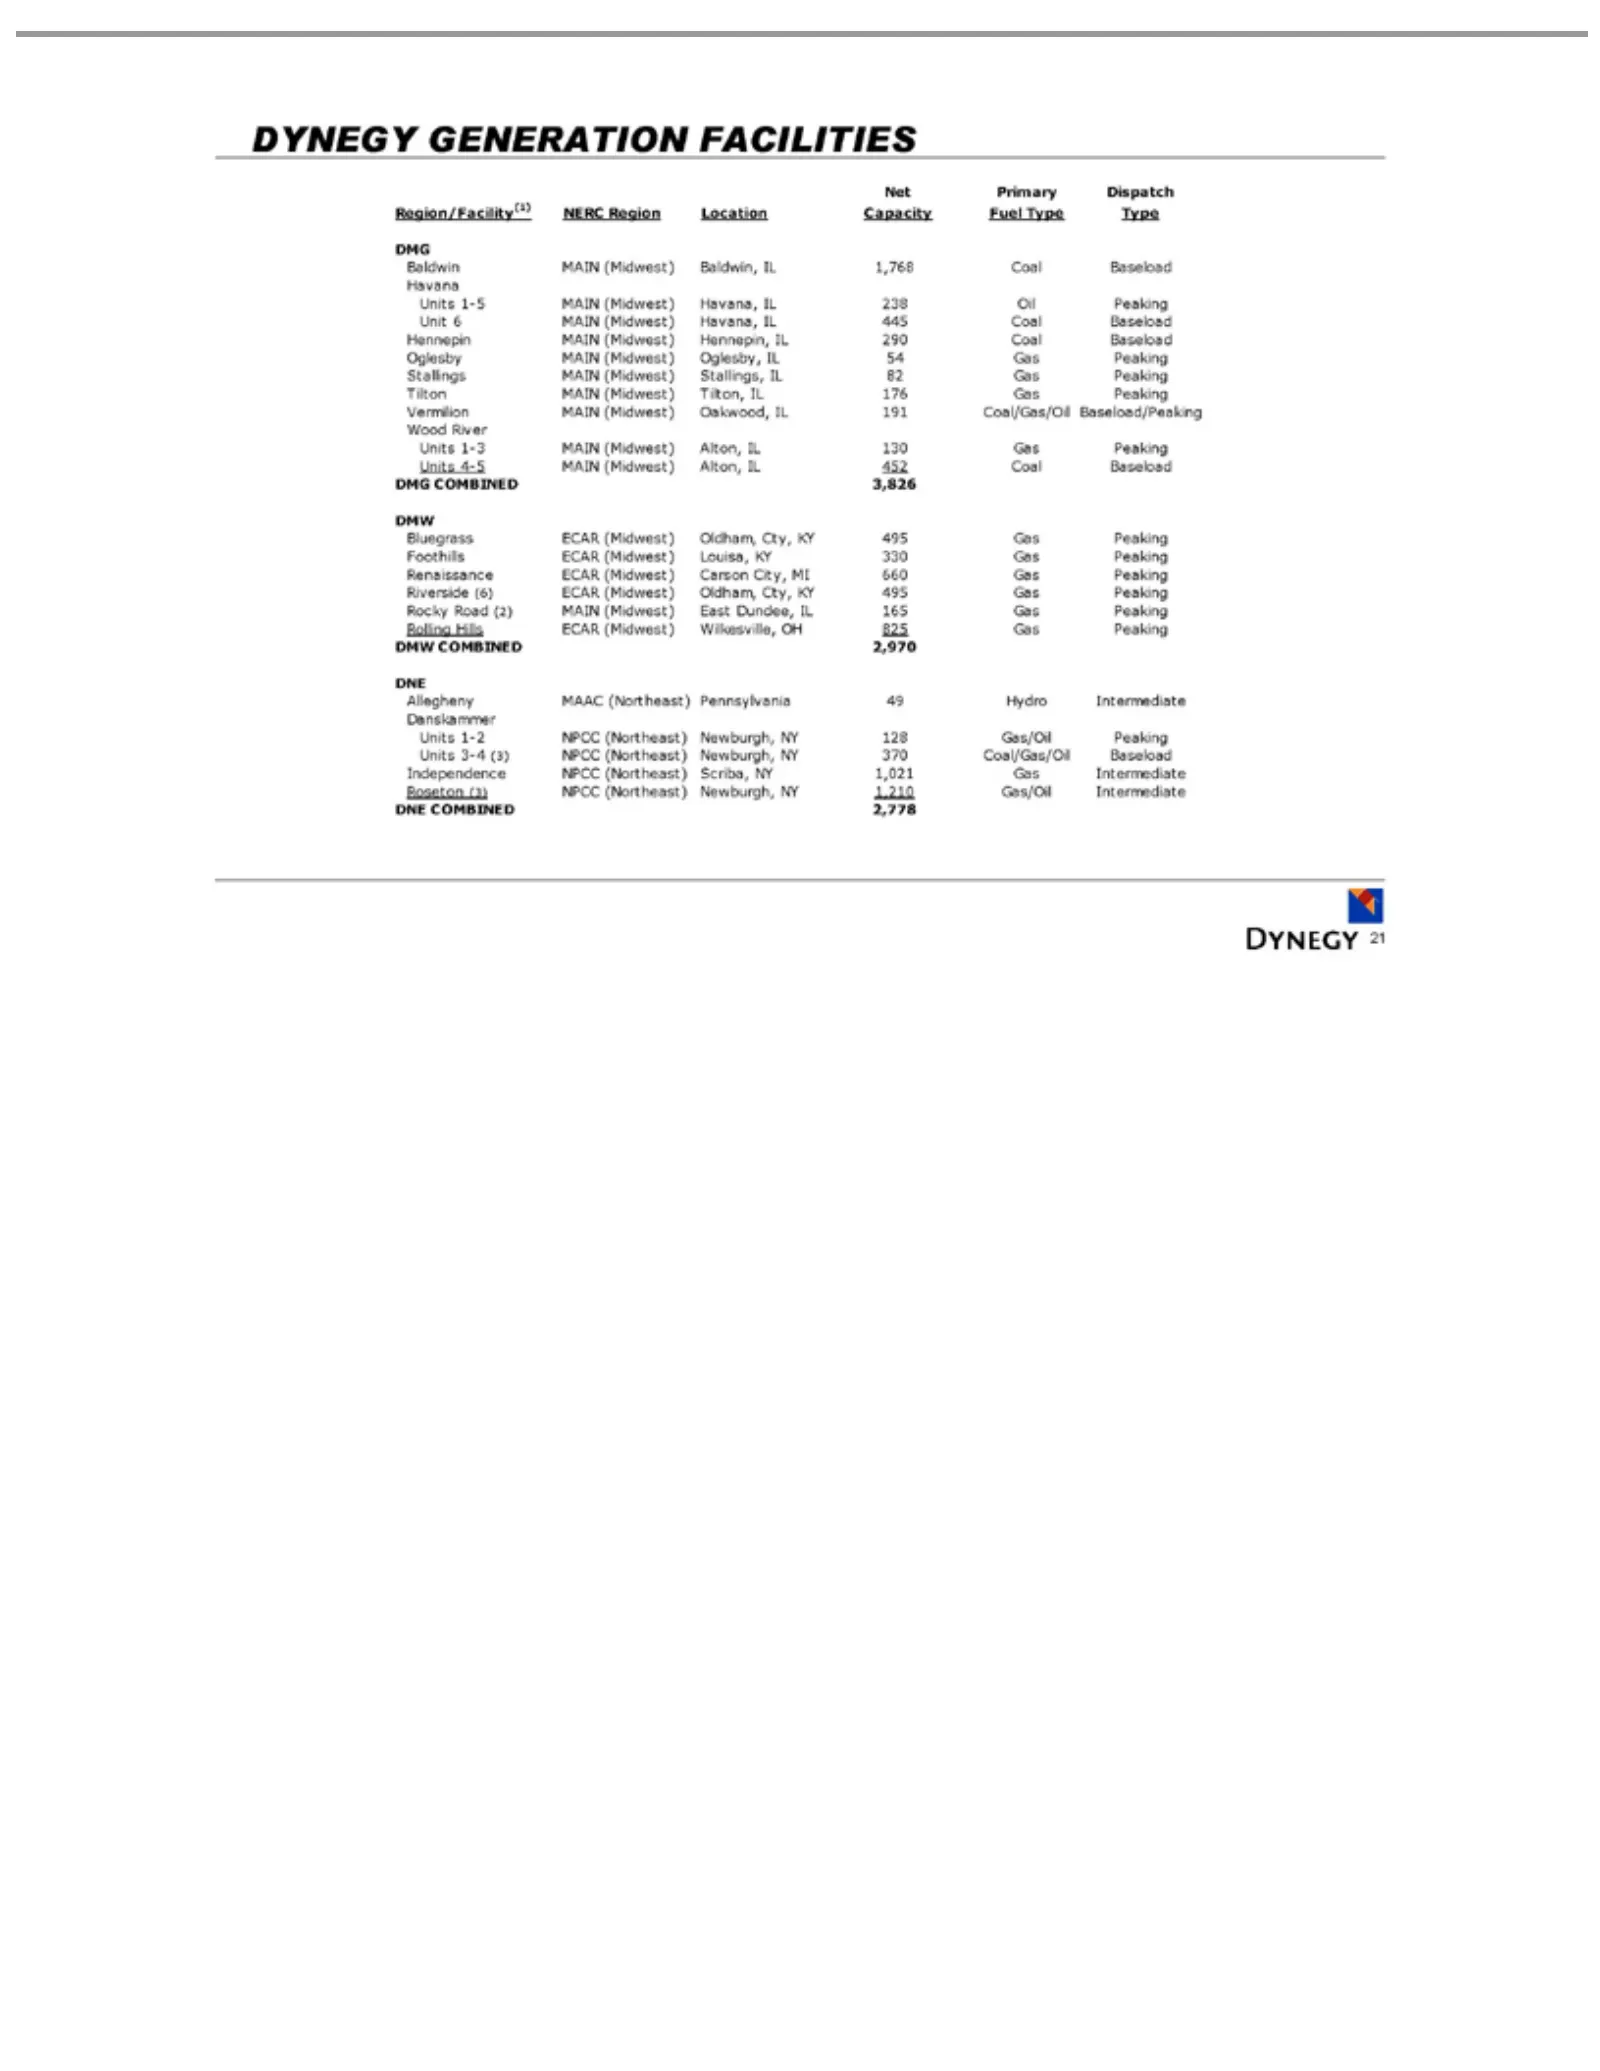
Slide 21: Dynegy Generation Facilities
DYNEGY Net Region/Facility(1) Baldwin Havana Unit Hennepin Oglesby Stallings Tilton Vermilion Wood DMG Bluegrass Foothills Renaissance Riverside Rocky Rolling DMW Allegheny Danskammer Units Independence Roseton DNE 21 Primary 6COMBINED 1-5 1-3 4-5 1-2 3-4 COMBINED River MAIN MAIN COMBINED Road Hills
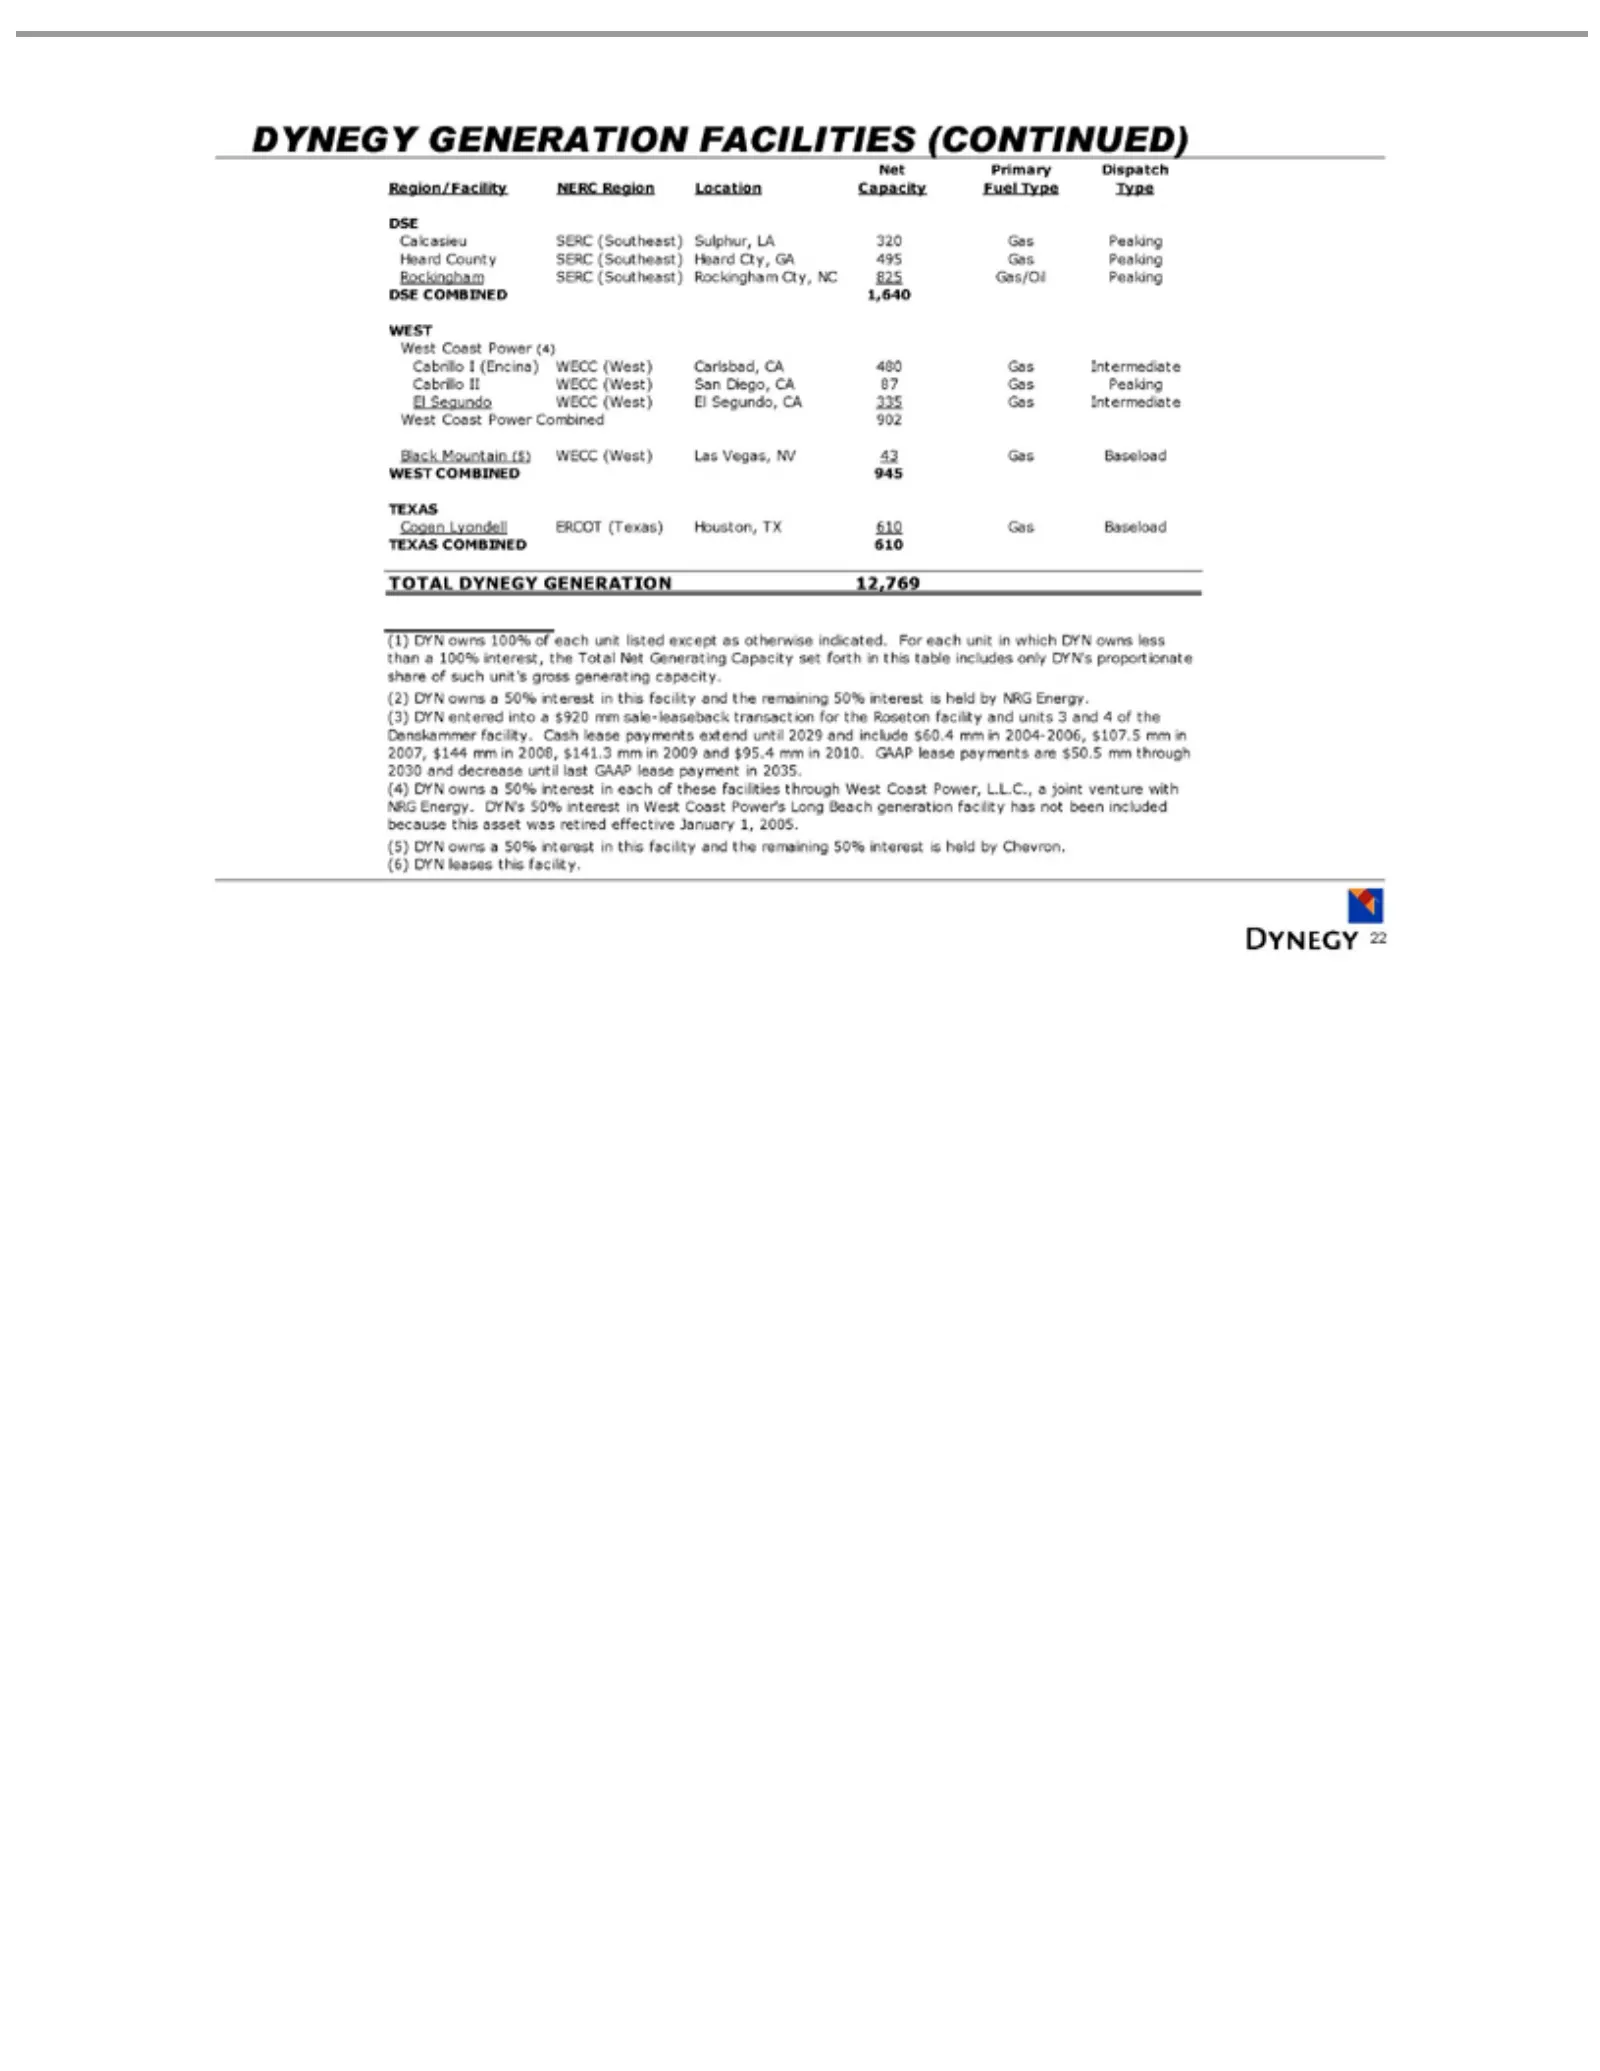
Slide 22: Dynegy Generation Facilities (Continued)
DYNEGY Region/Facility Calcasieu Heard Rockingham DSE Cabrillo El West Black WEST Cogen TEXAS TOTAL (1) only (2) (3) 2004-2006, (4) 2035. facility (5) 22 Segundo DYN DYN’s COMBINED Coast Mountain County Lyondell COMBINED has DYNEGY COMBINED Iowns II entered (Encina) SERC WECC GENERATION not Power $1
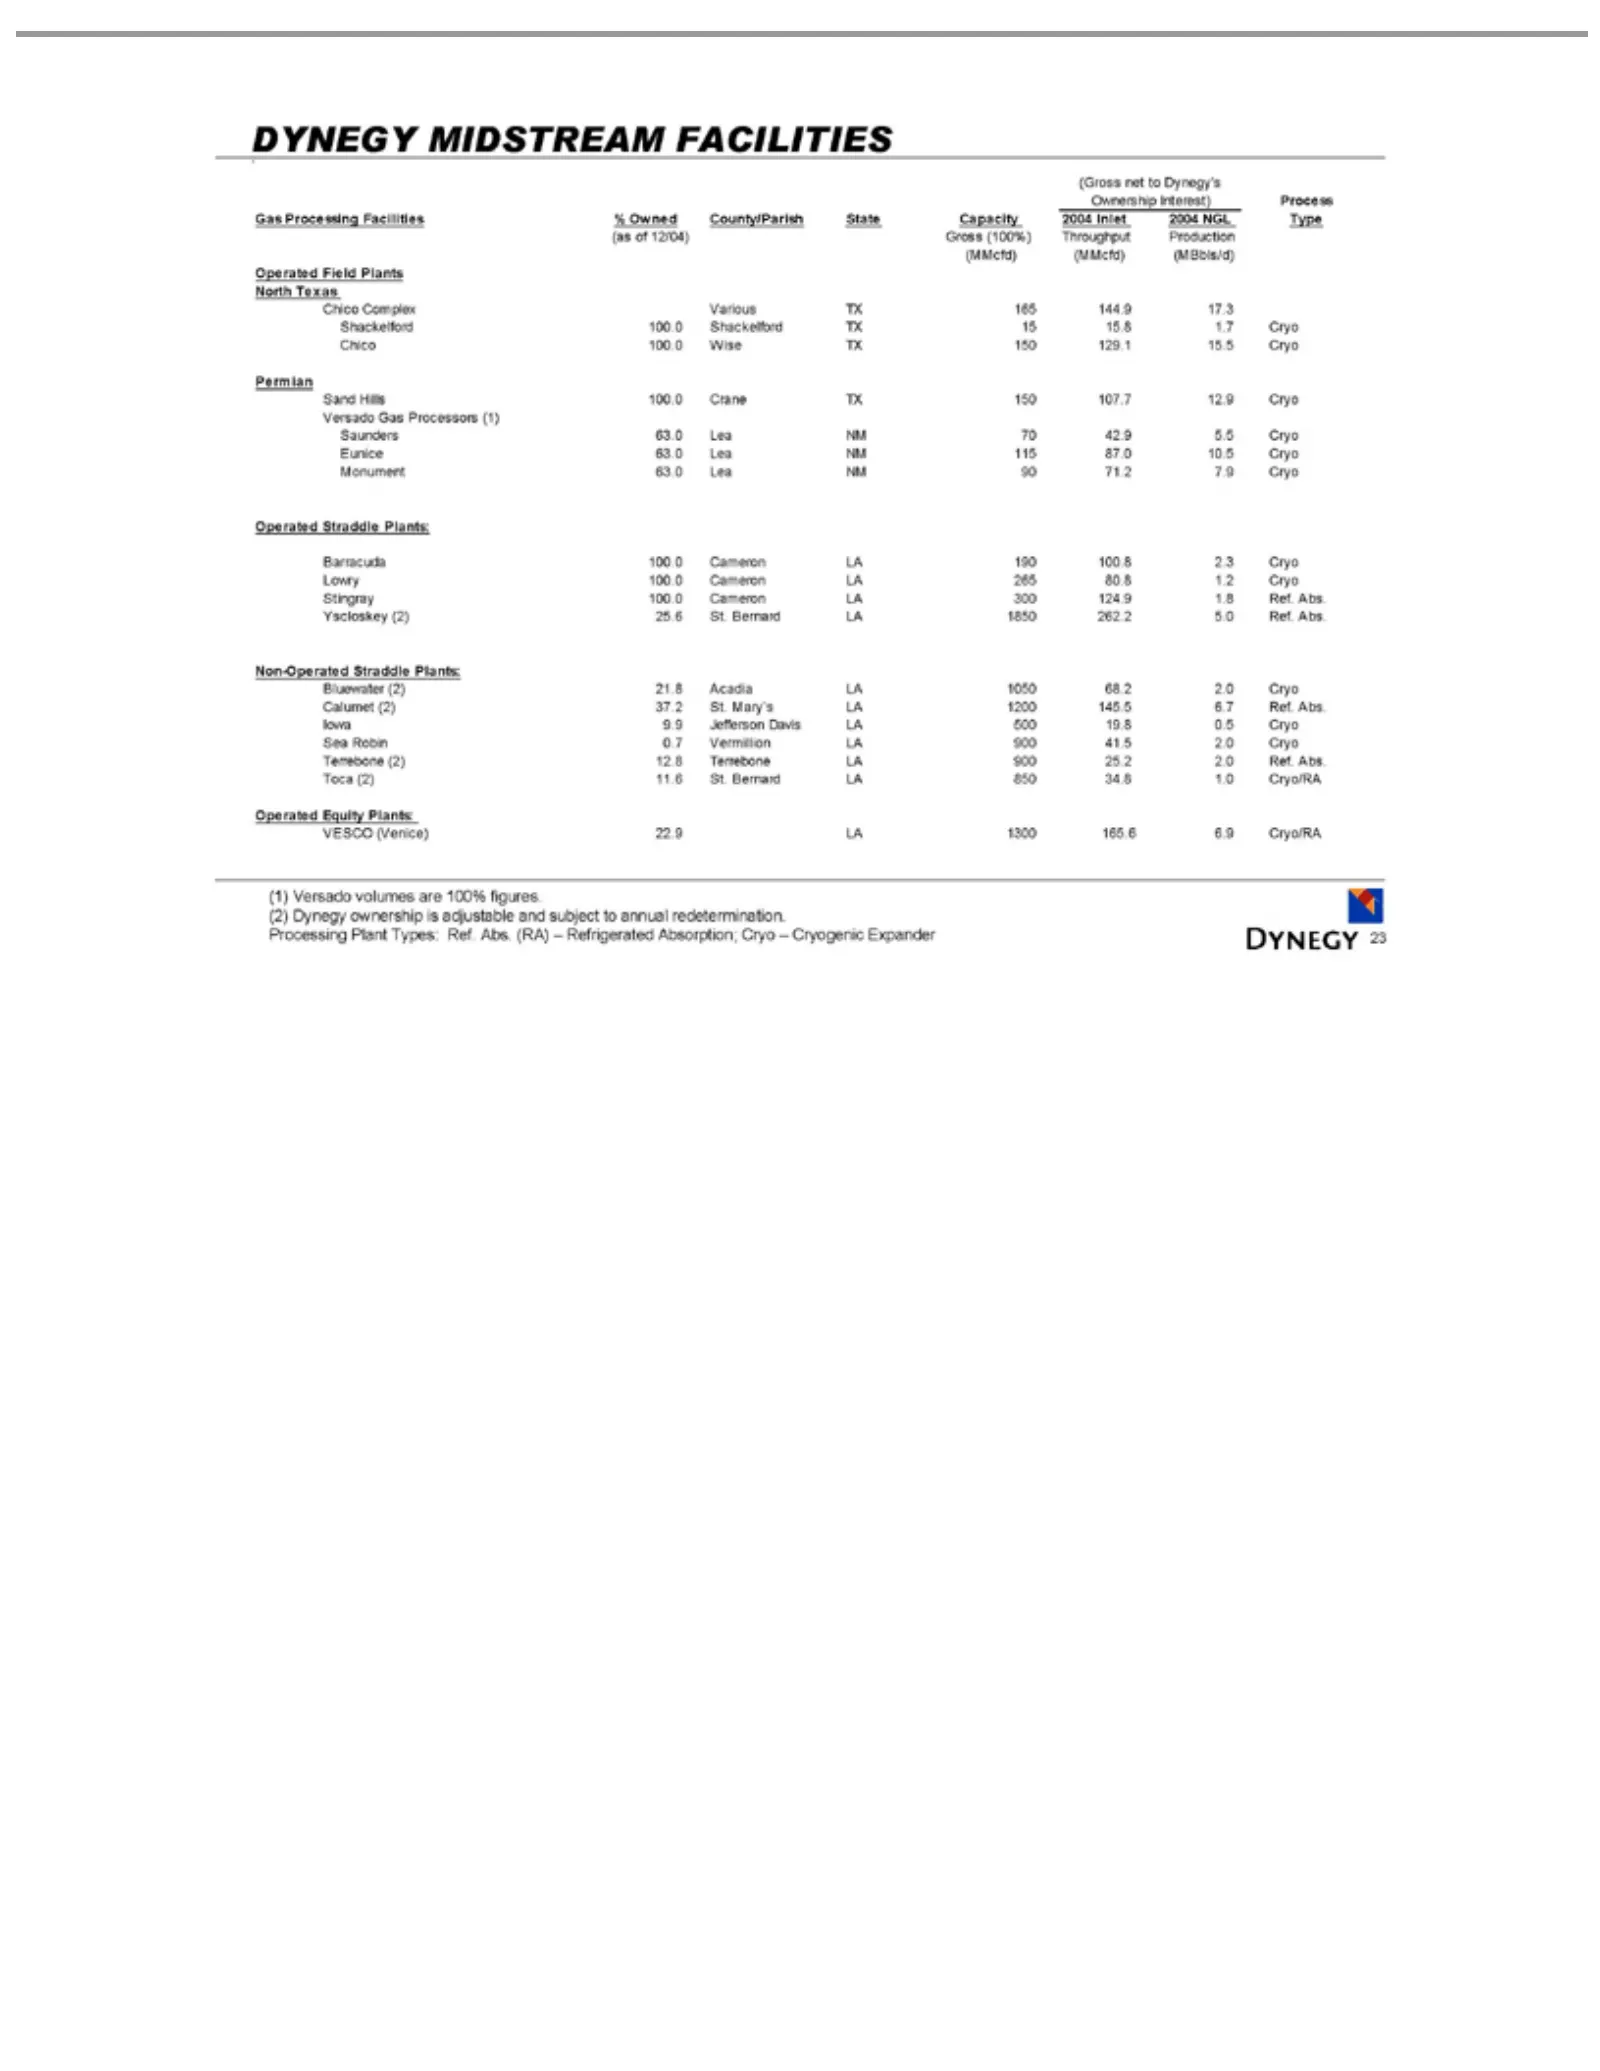
Slide 23: Dynegy Midstream Facilities
DYNEGY (Gross Ownership Gas (as North Shackelford Chico Sand Permian Versado Saunders Eunice Monument Barracuda Lowry Stingray Yscloskey Non-Operated Bluewater Calumet Iowa Sea Terrebone Toca Operated VESCO (1) (2) Processing 23 Versado Dynegy of Robin Processing (2) 9.9 Hills 12/04) Texas Complex 1
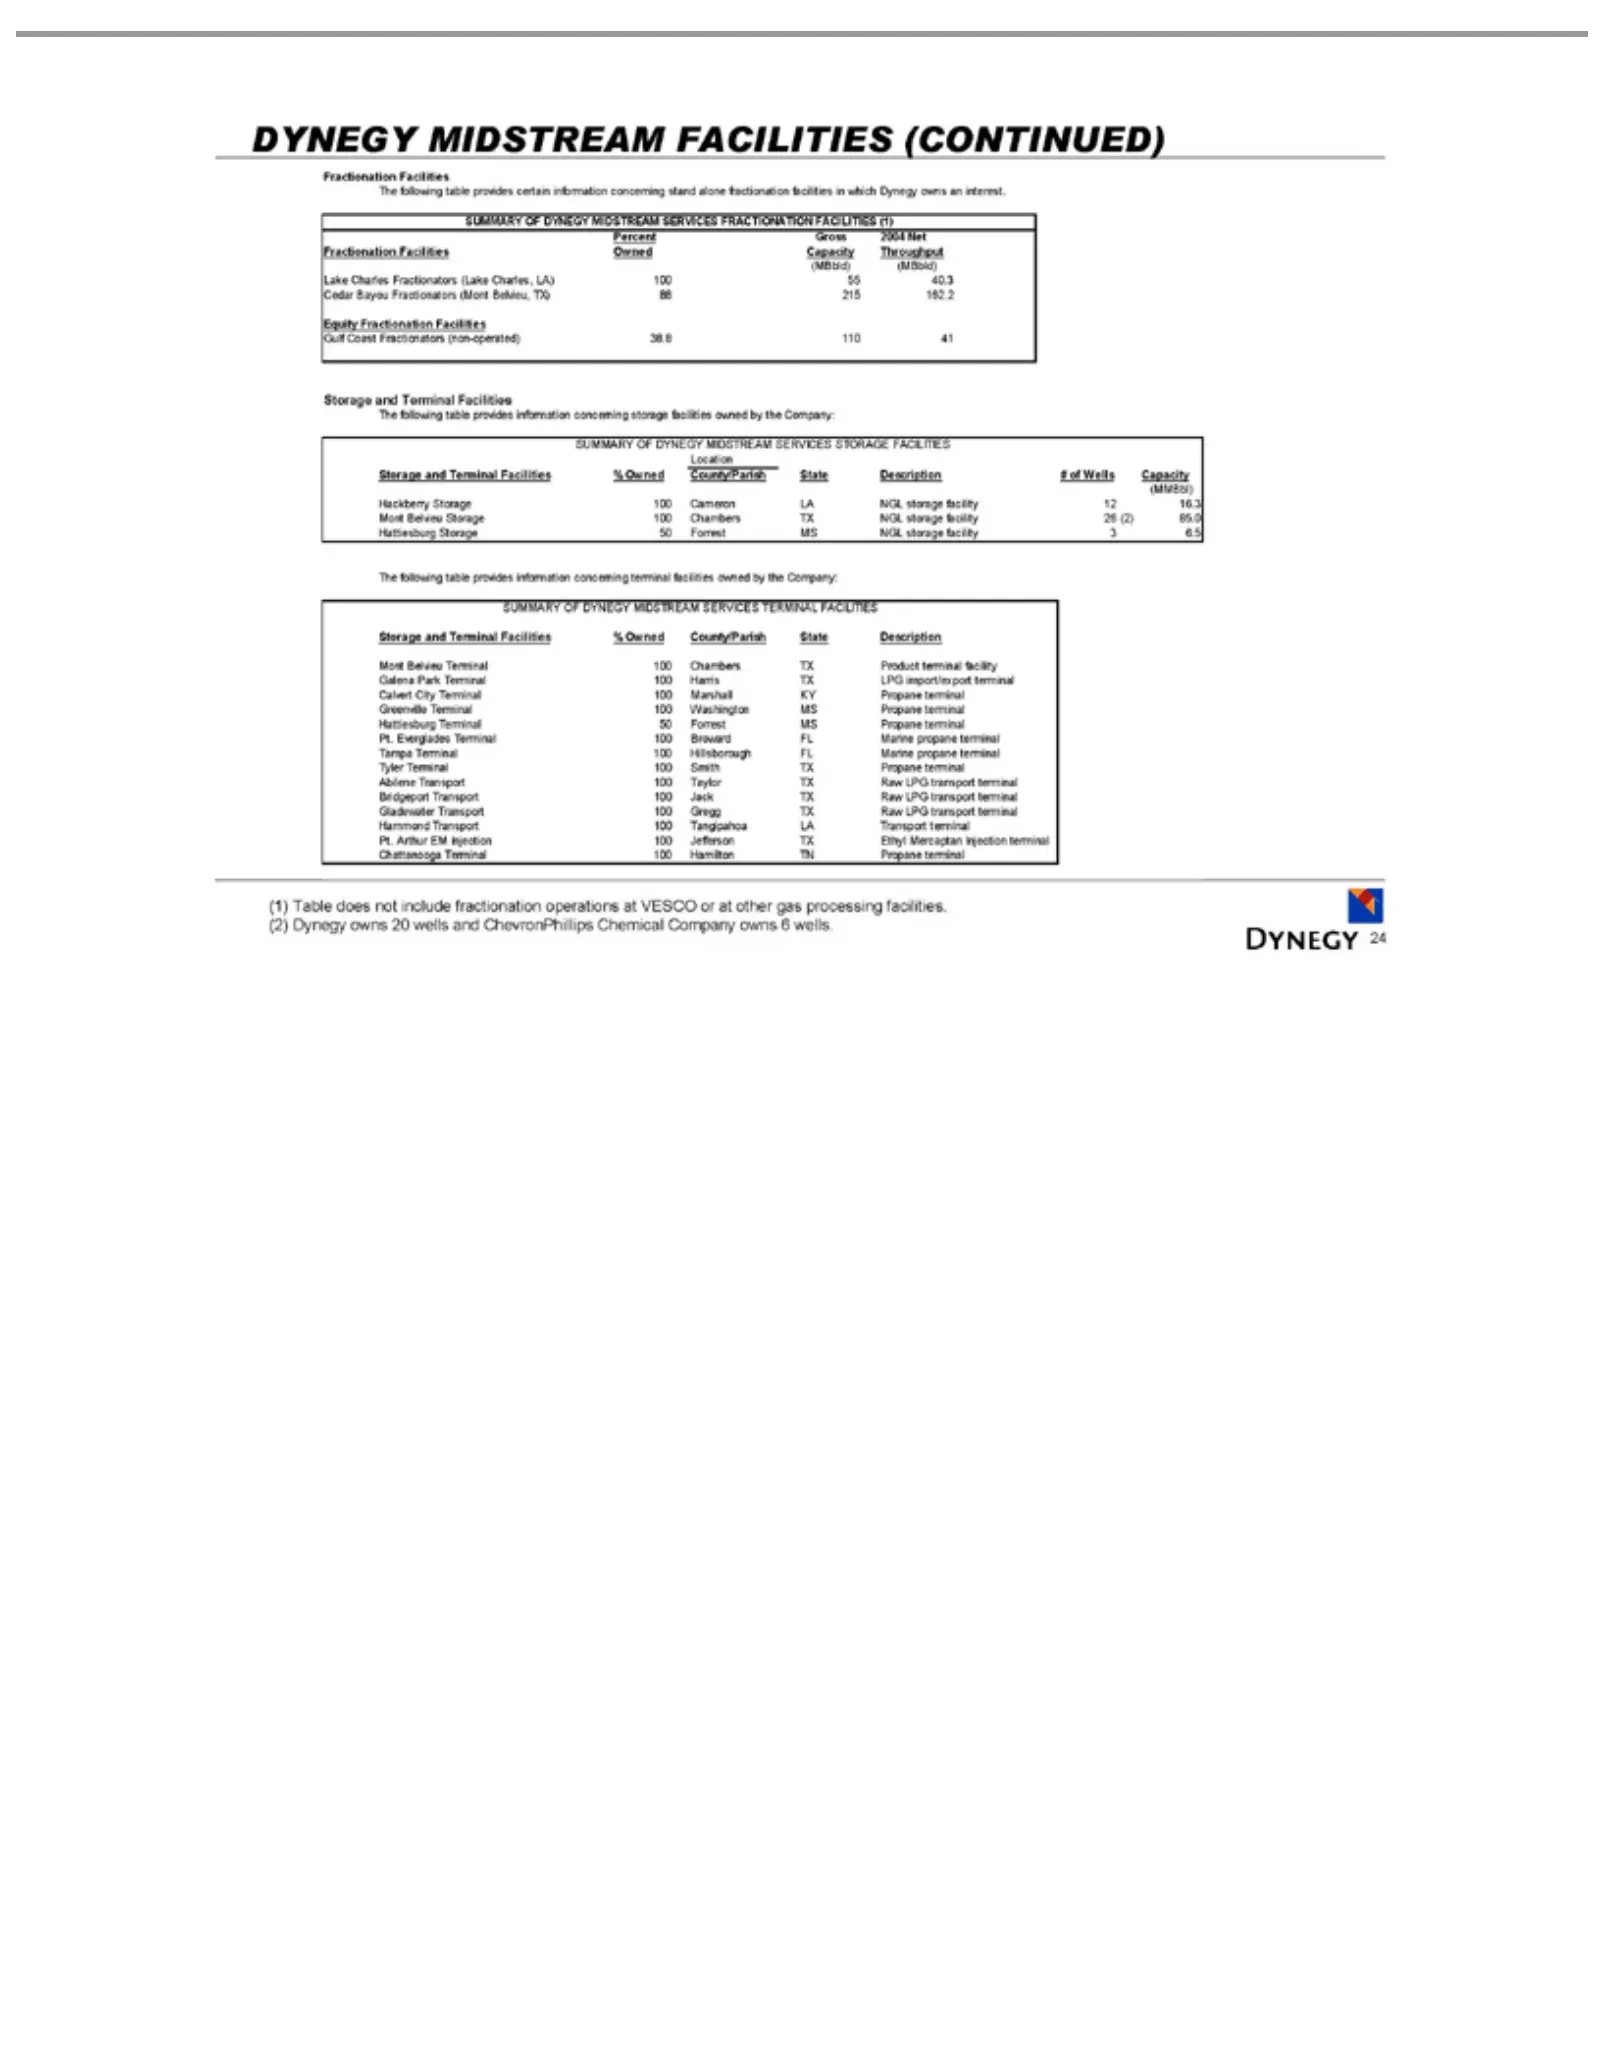
Slide 24: Summary of Dynegy Midstream Facilities
DYNEGY Percent Fractionation (MBbld) Lake Cedar Equity Gulf Location Hackberry (MMBbl) The SUMMARY Storage Mont Galena Calvert Greenville Hattiesburg Tampa Tyler Abilene Bridgeport Gladewater Hammond Pt. Chattanooga (1) 24 Arthur Everglades Table following Coast Charles Terminal Belvieu Bayou Fracti
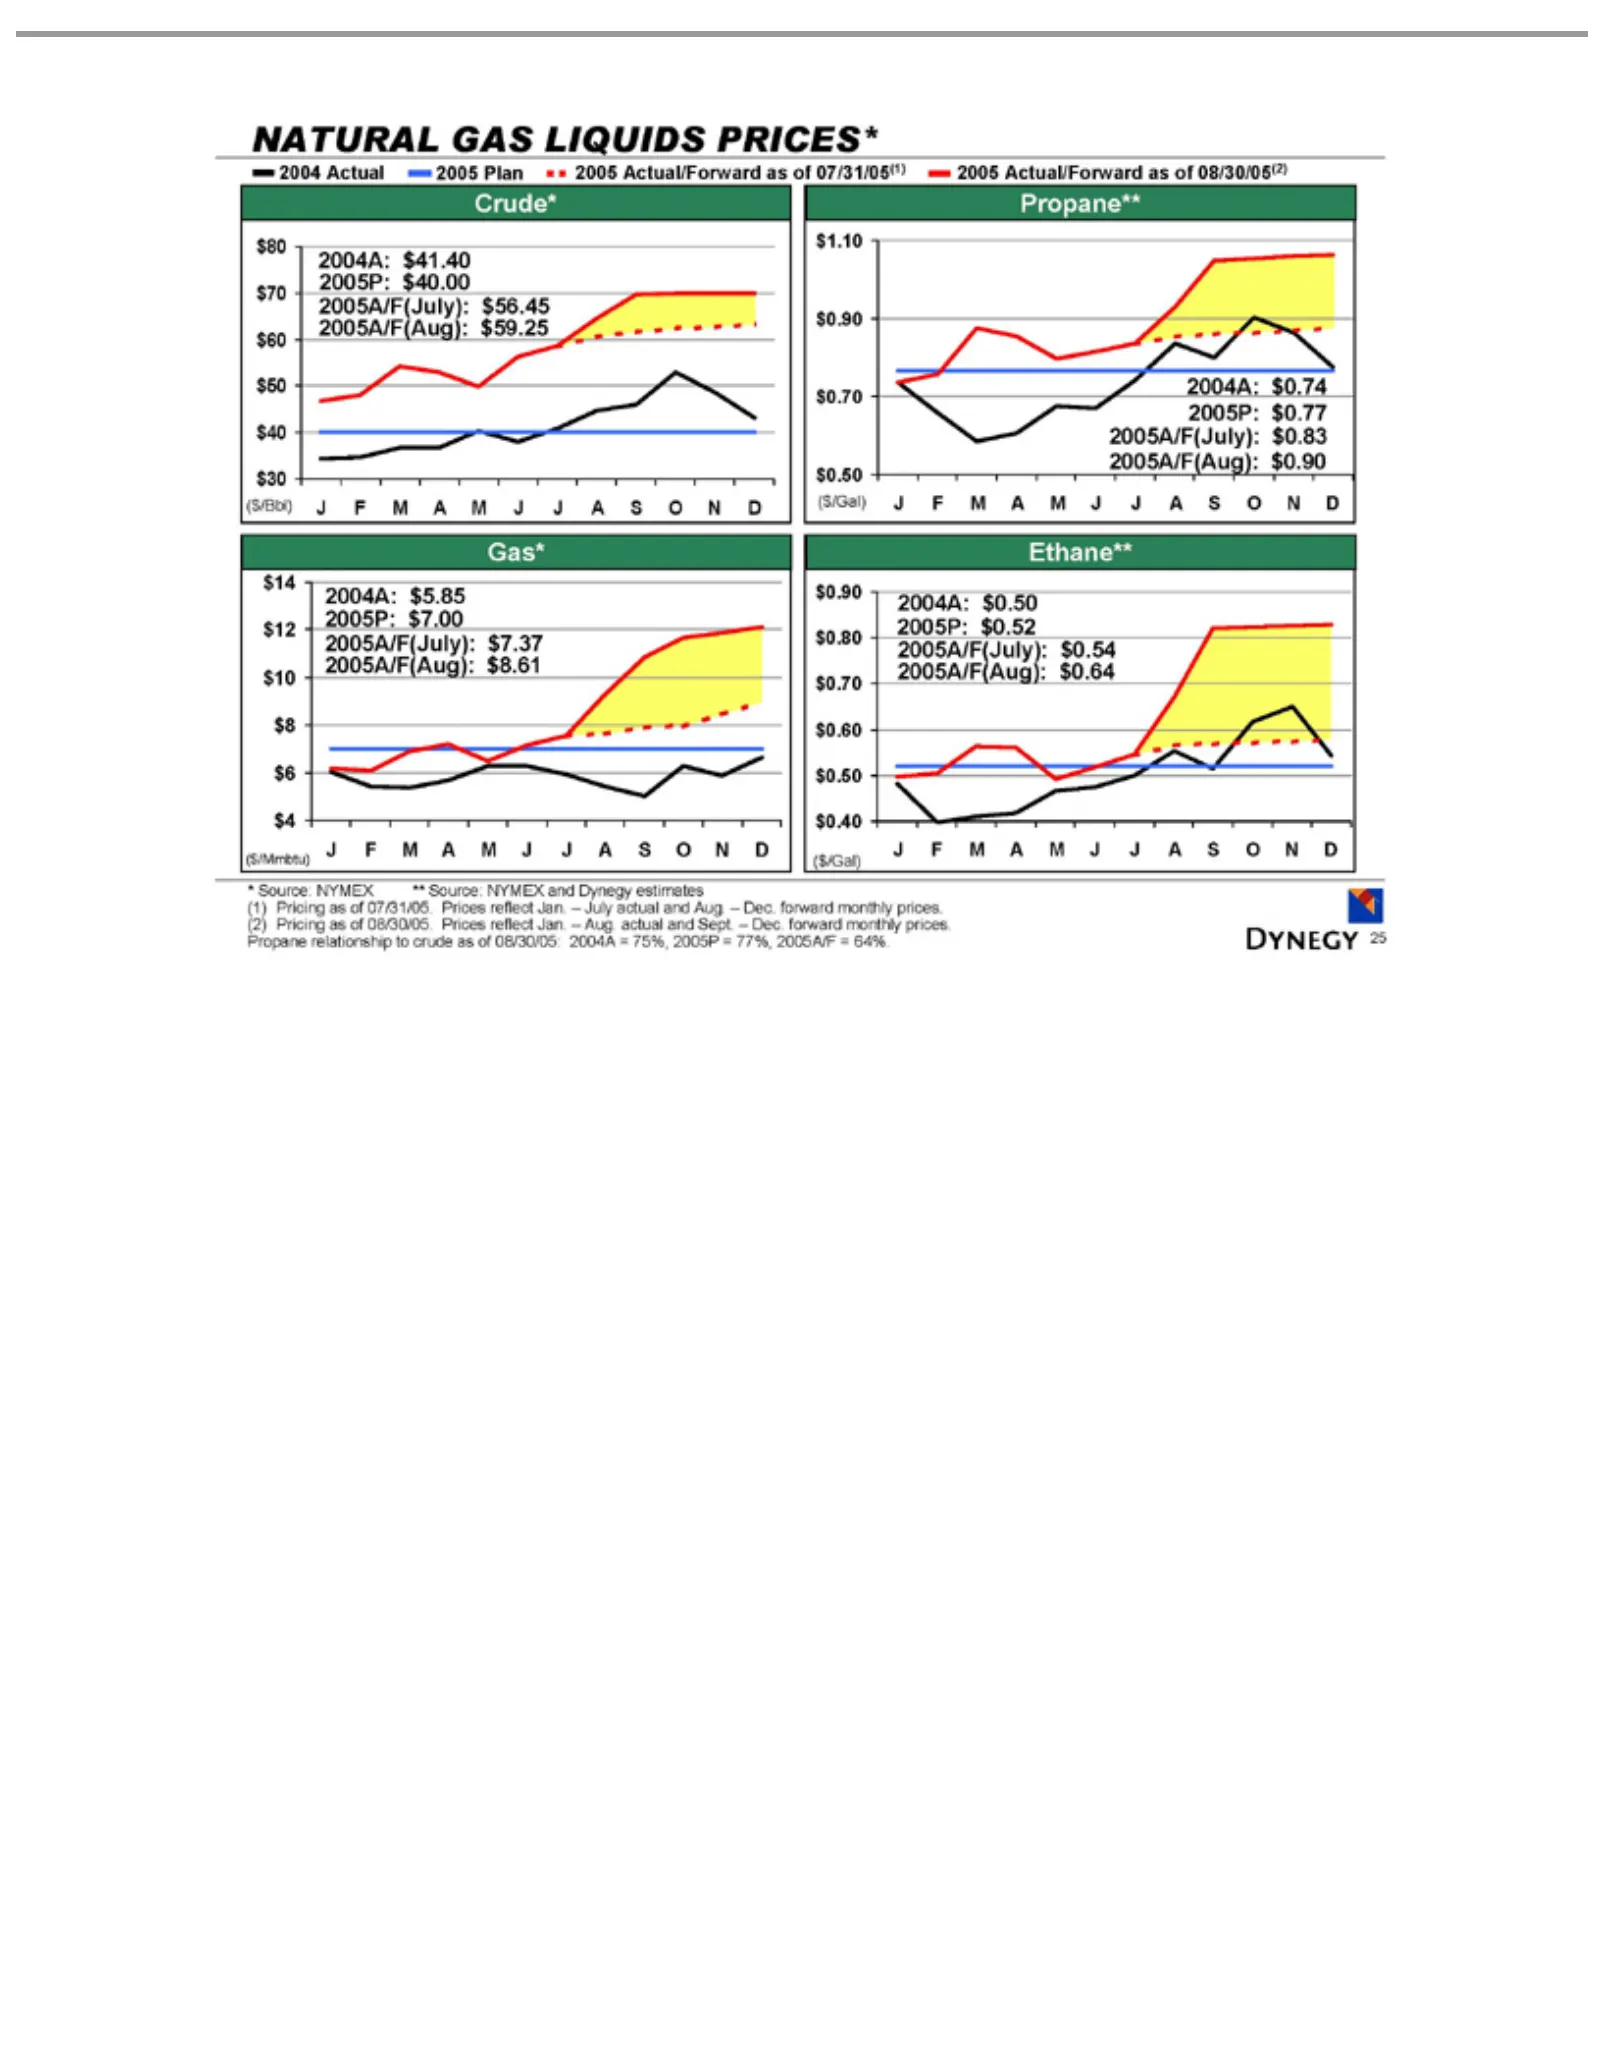
Slide 25: Natural Gas and Liquids Prices
NATURAL 2004 Crude* ($/Bbl) $30 Propane** $0.50 Gas* ($/Mmbtu) Ethane** 2004A: ($/Gal) 2005P: 2005A/F(July): J2005A/F(Aug): * (1) prices. 25FSource: Pricing MActual $14 APropane $40.00 $0.77 $7.00 $0.52 $80 $41.40 $0.74 $5.85 $0.50 M$0.90 NYMEX $12 $1.10 as JGAS $70 2005 Jof $10 Arelationship $56.45
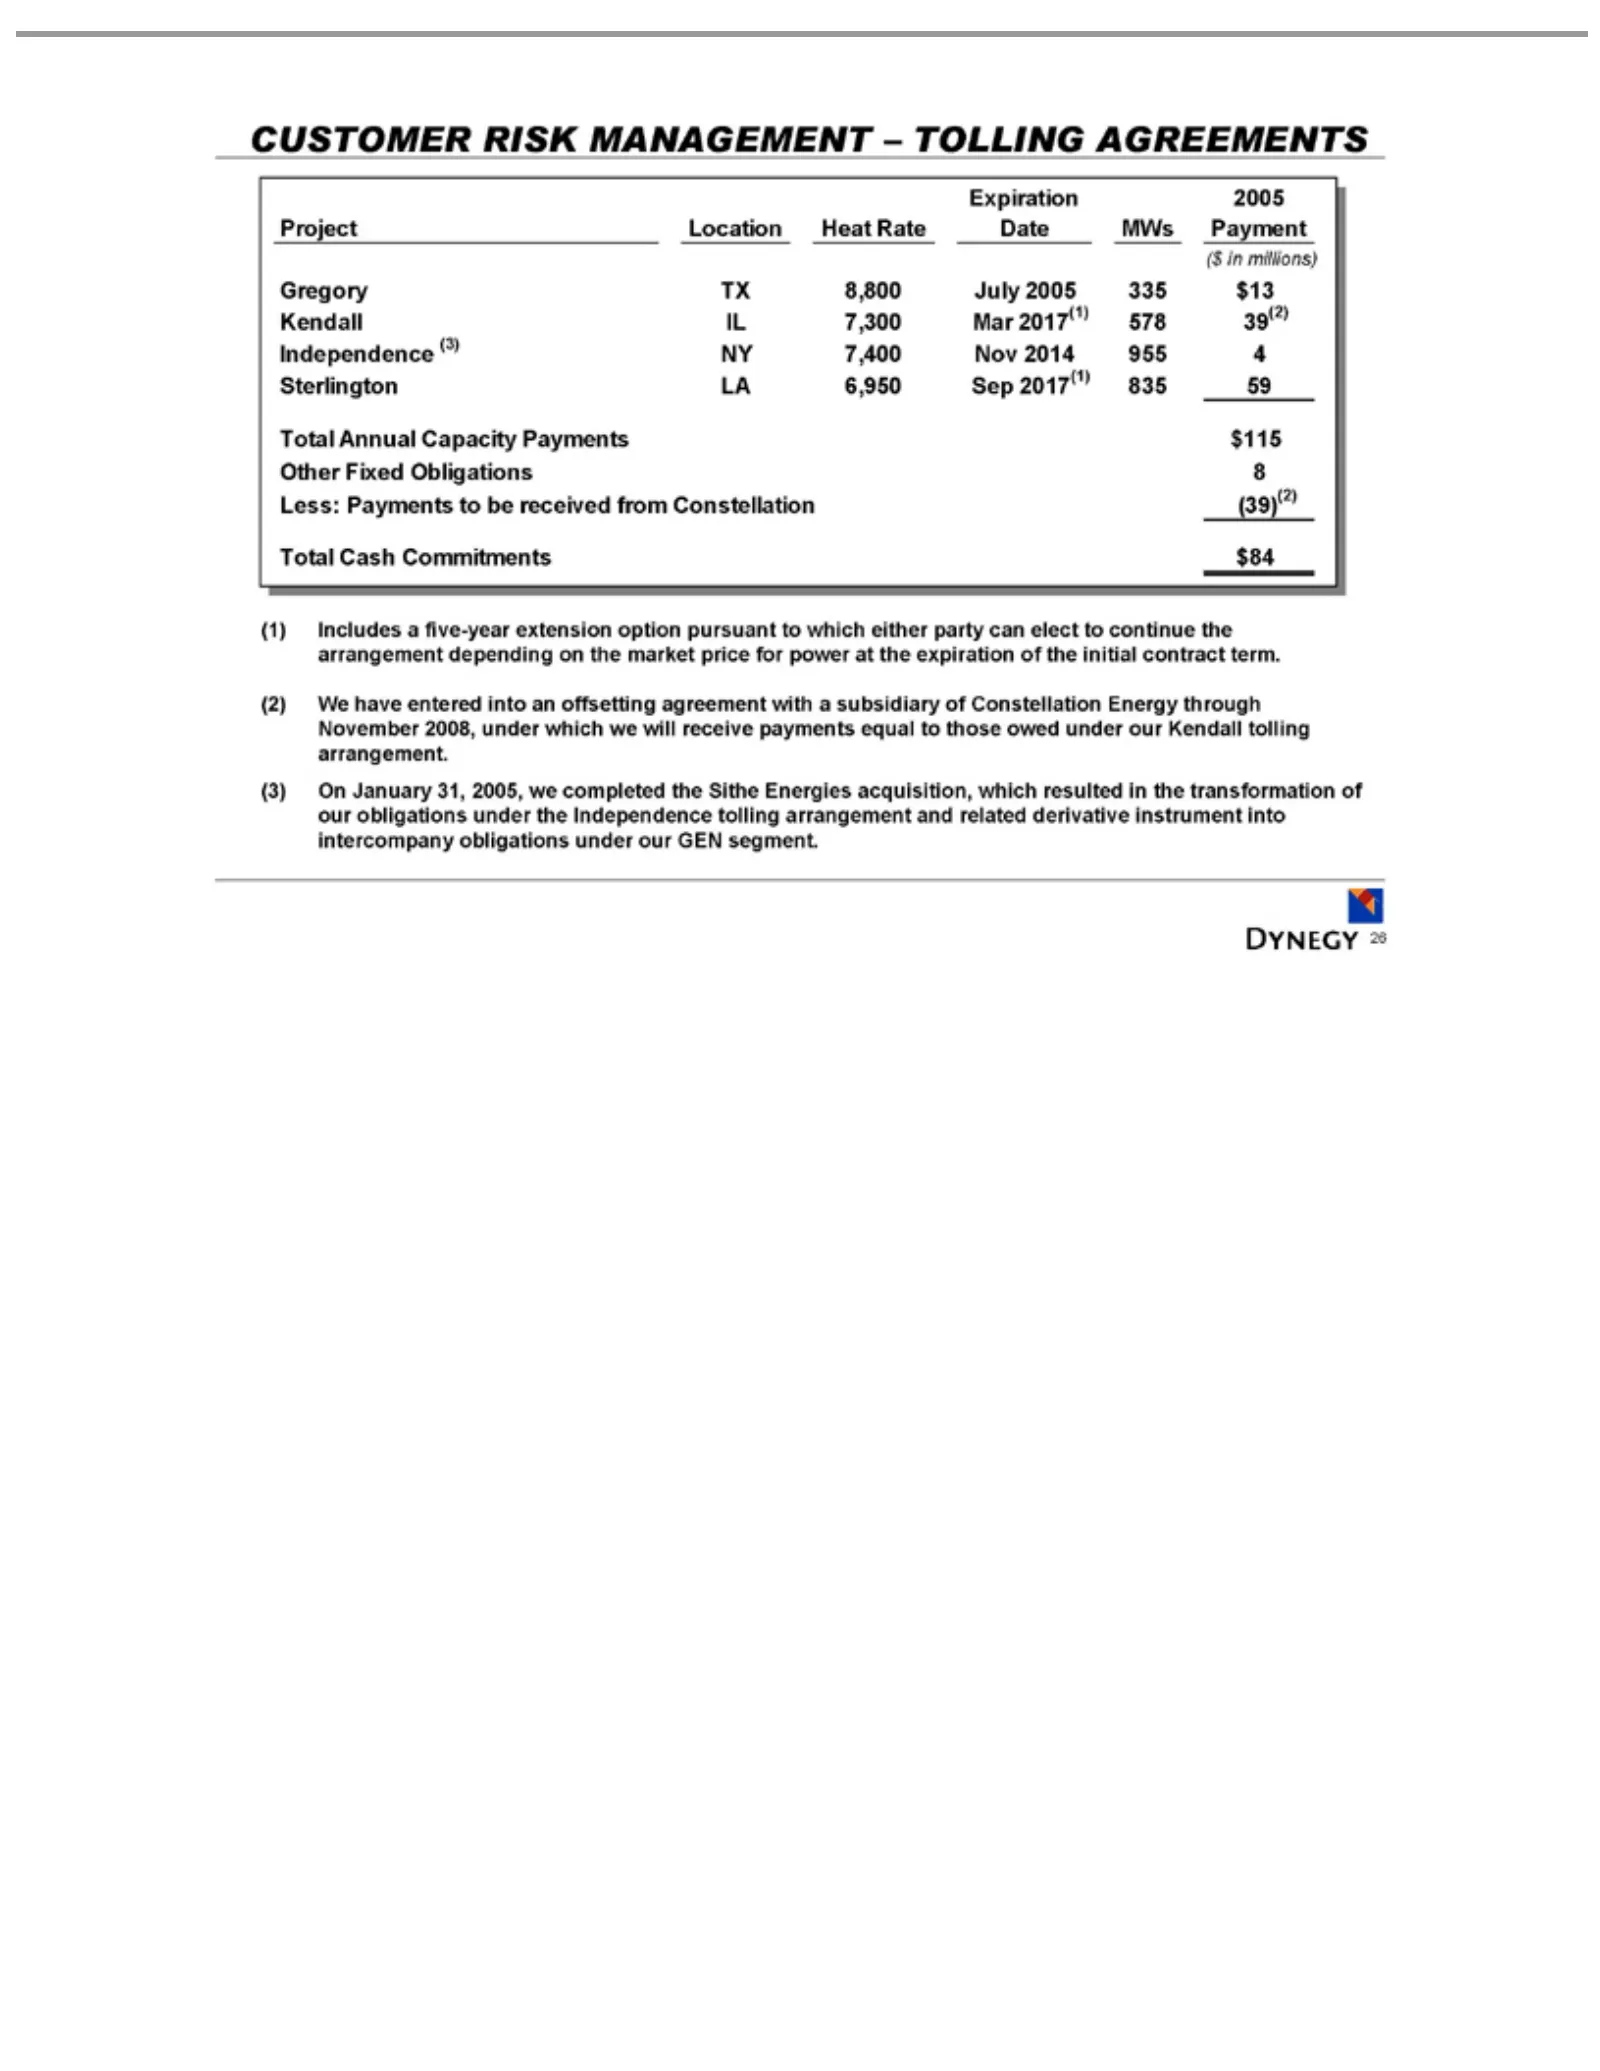
Slide 26: Risk Management: Tolling Agreements
CUSTOMER Expiration Project ($ Gregory Kendall Independence Sterlington Other Less: Total (1) (2) tolling (3) instrument 26 inWe Includes Onmillions) Annual Cash Payments Fixed arrangement. January have Location IL TX2005 into Commitments 7,300 LA aObligations entered 8,800 Capacity RISK five-year (
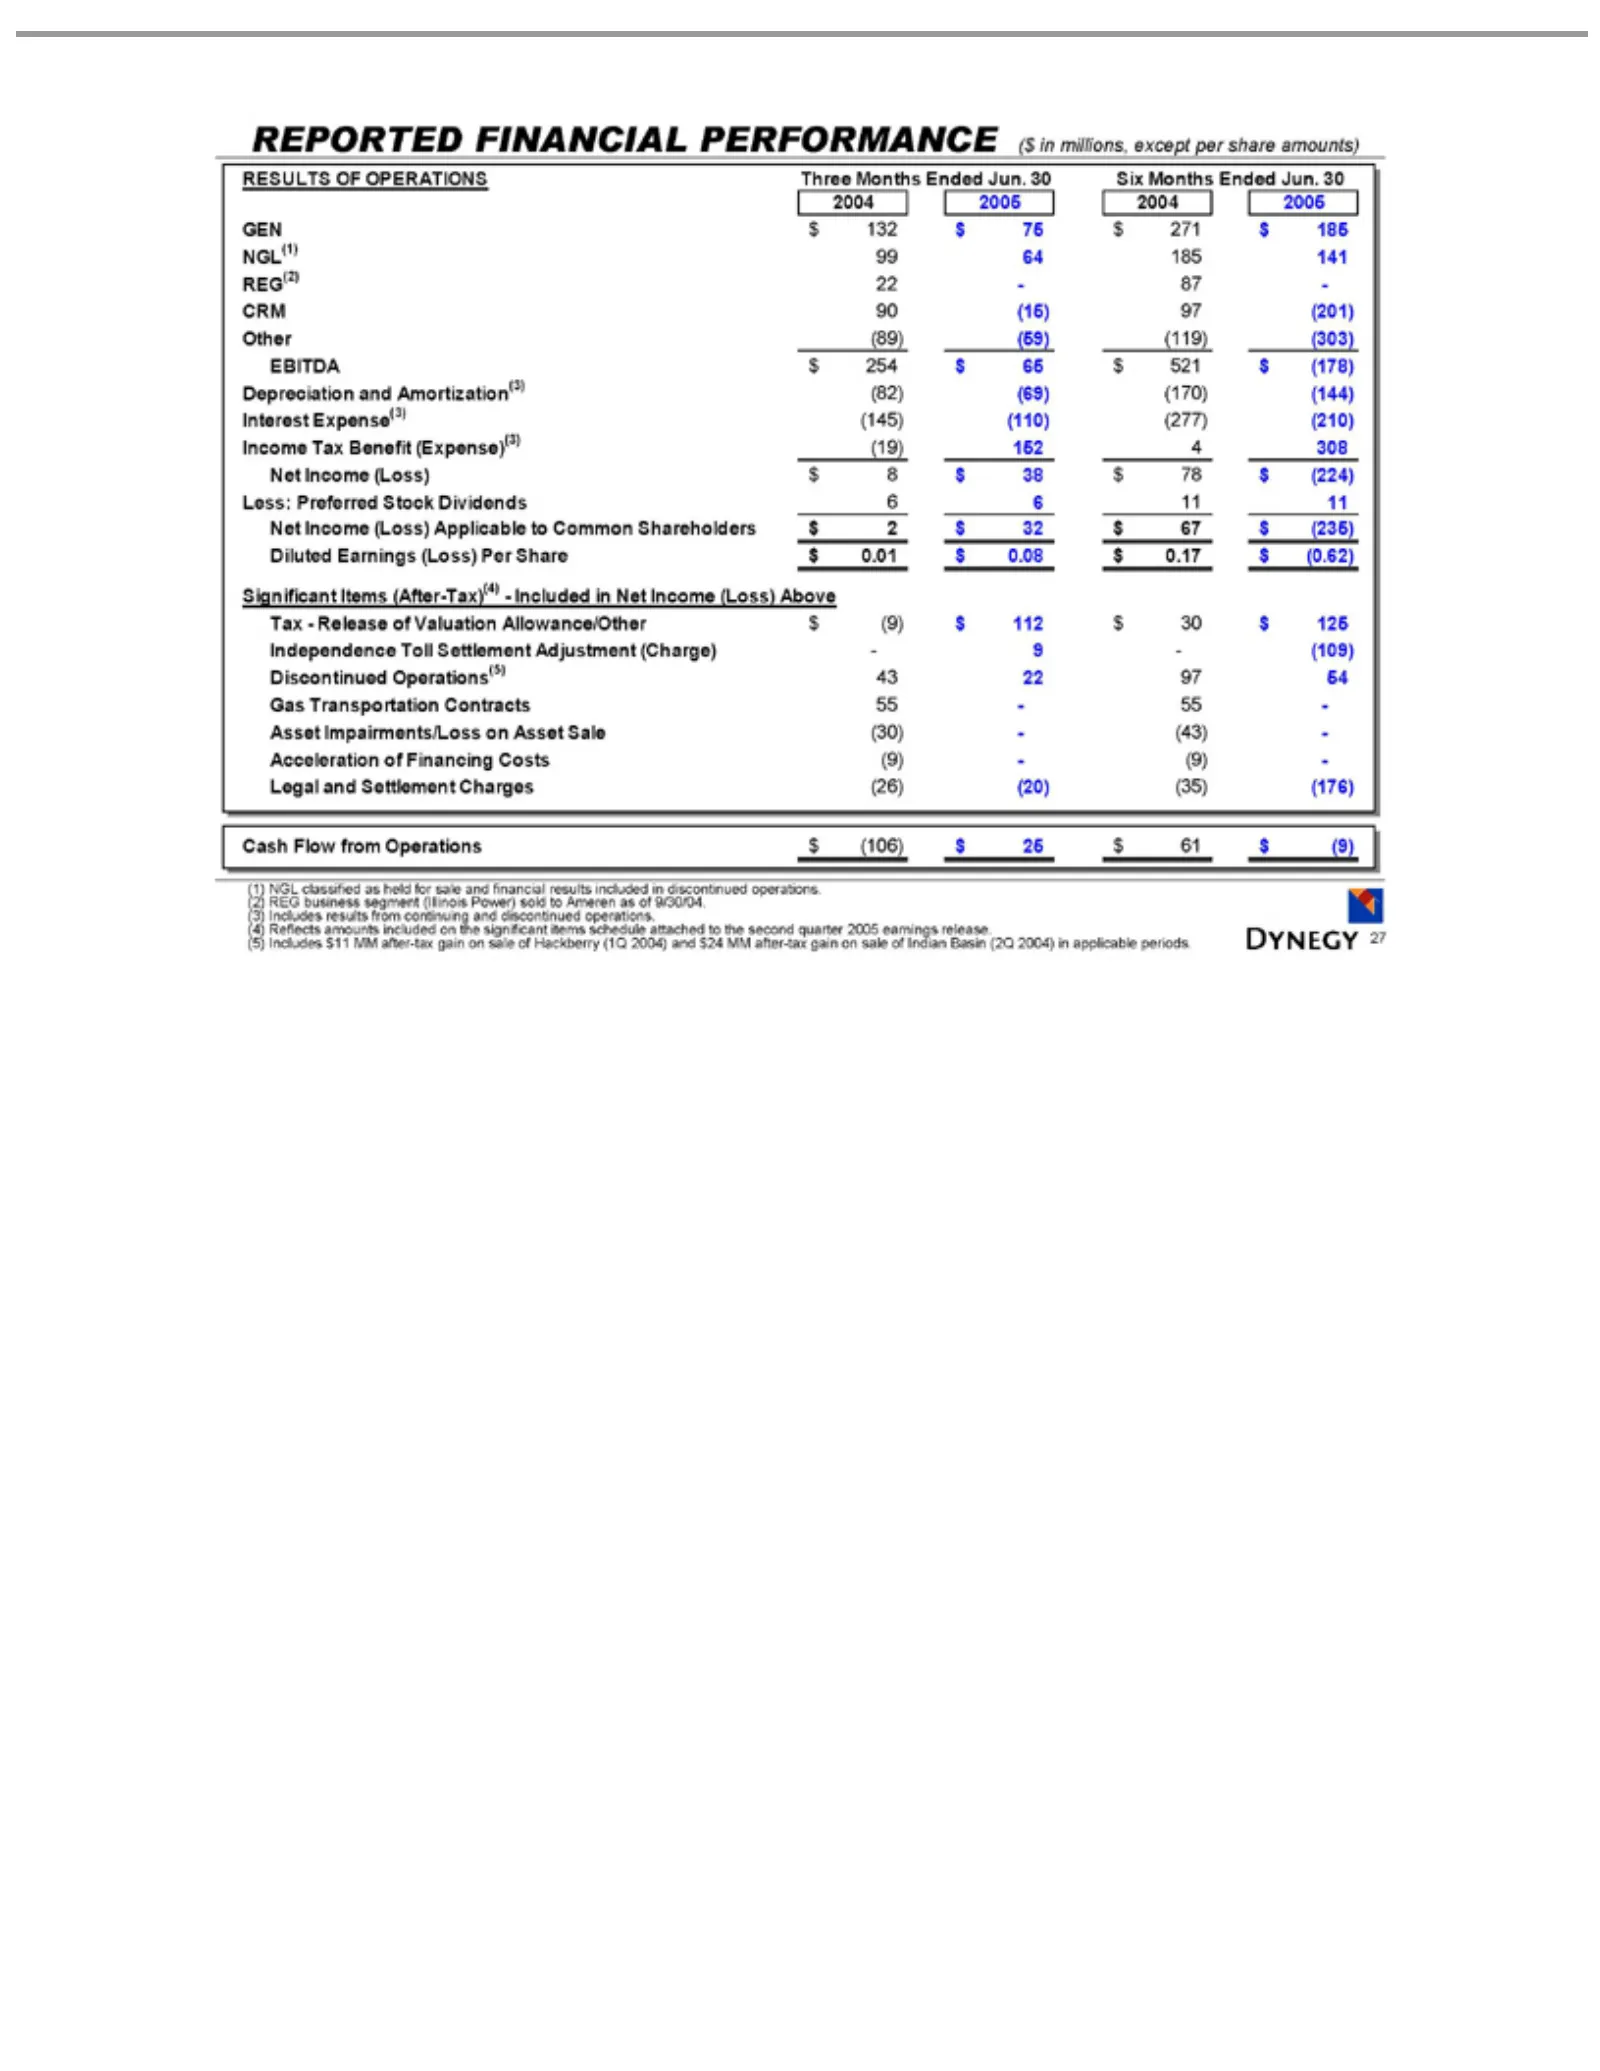
Slide 27: Reported Results of Financial Performance
REPORTED RESULTS 2004 GEN NGL(1) REG(2) CRM Other EBITDA Depreciation Interest Income Less: Net Diluted Significant Tax—Release Independence Discontinued Gas Asset Acceleration Legal Cash (1) (3) (4) (5) 27 NGL Reflects Includes Income Transportation 2005 Flow $132 Preferred Impairments/Loss 90 and
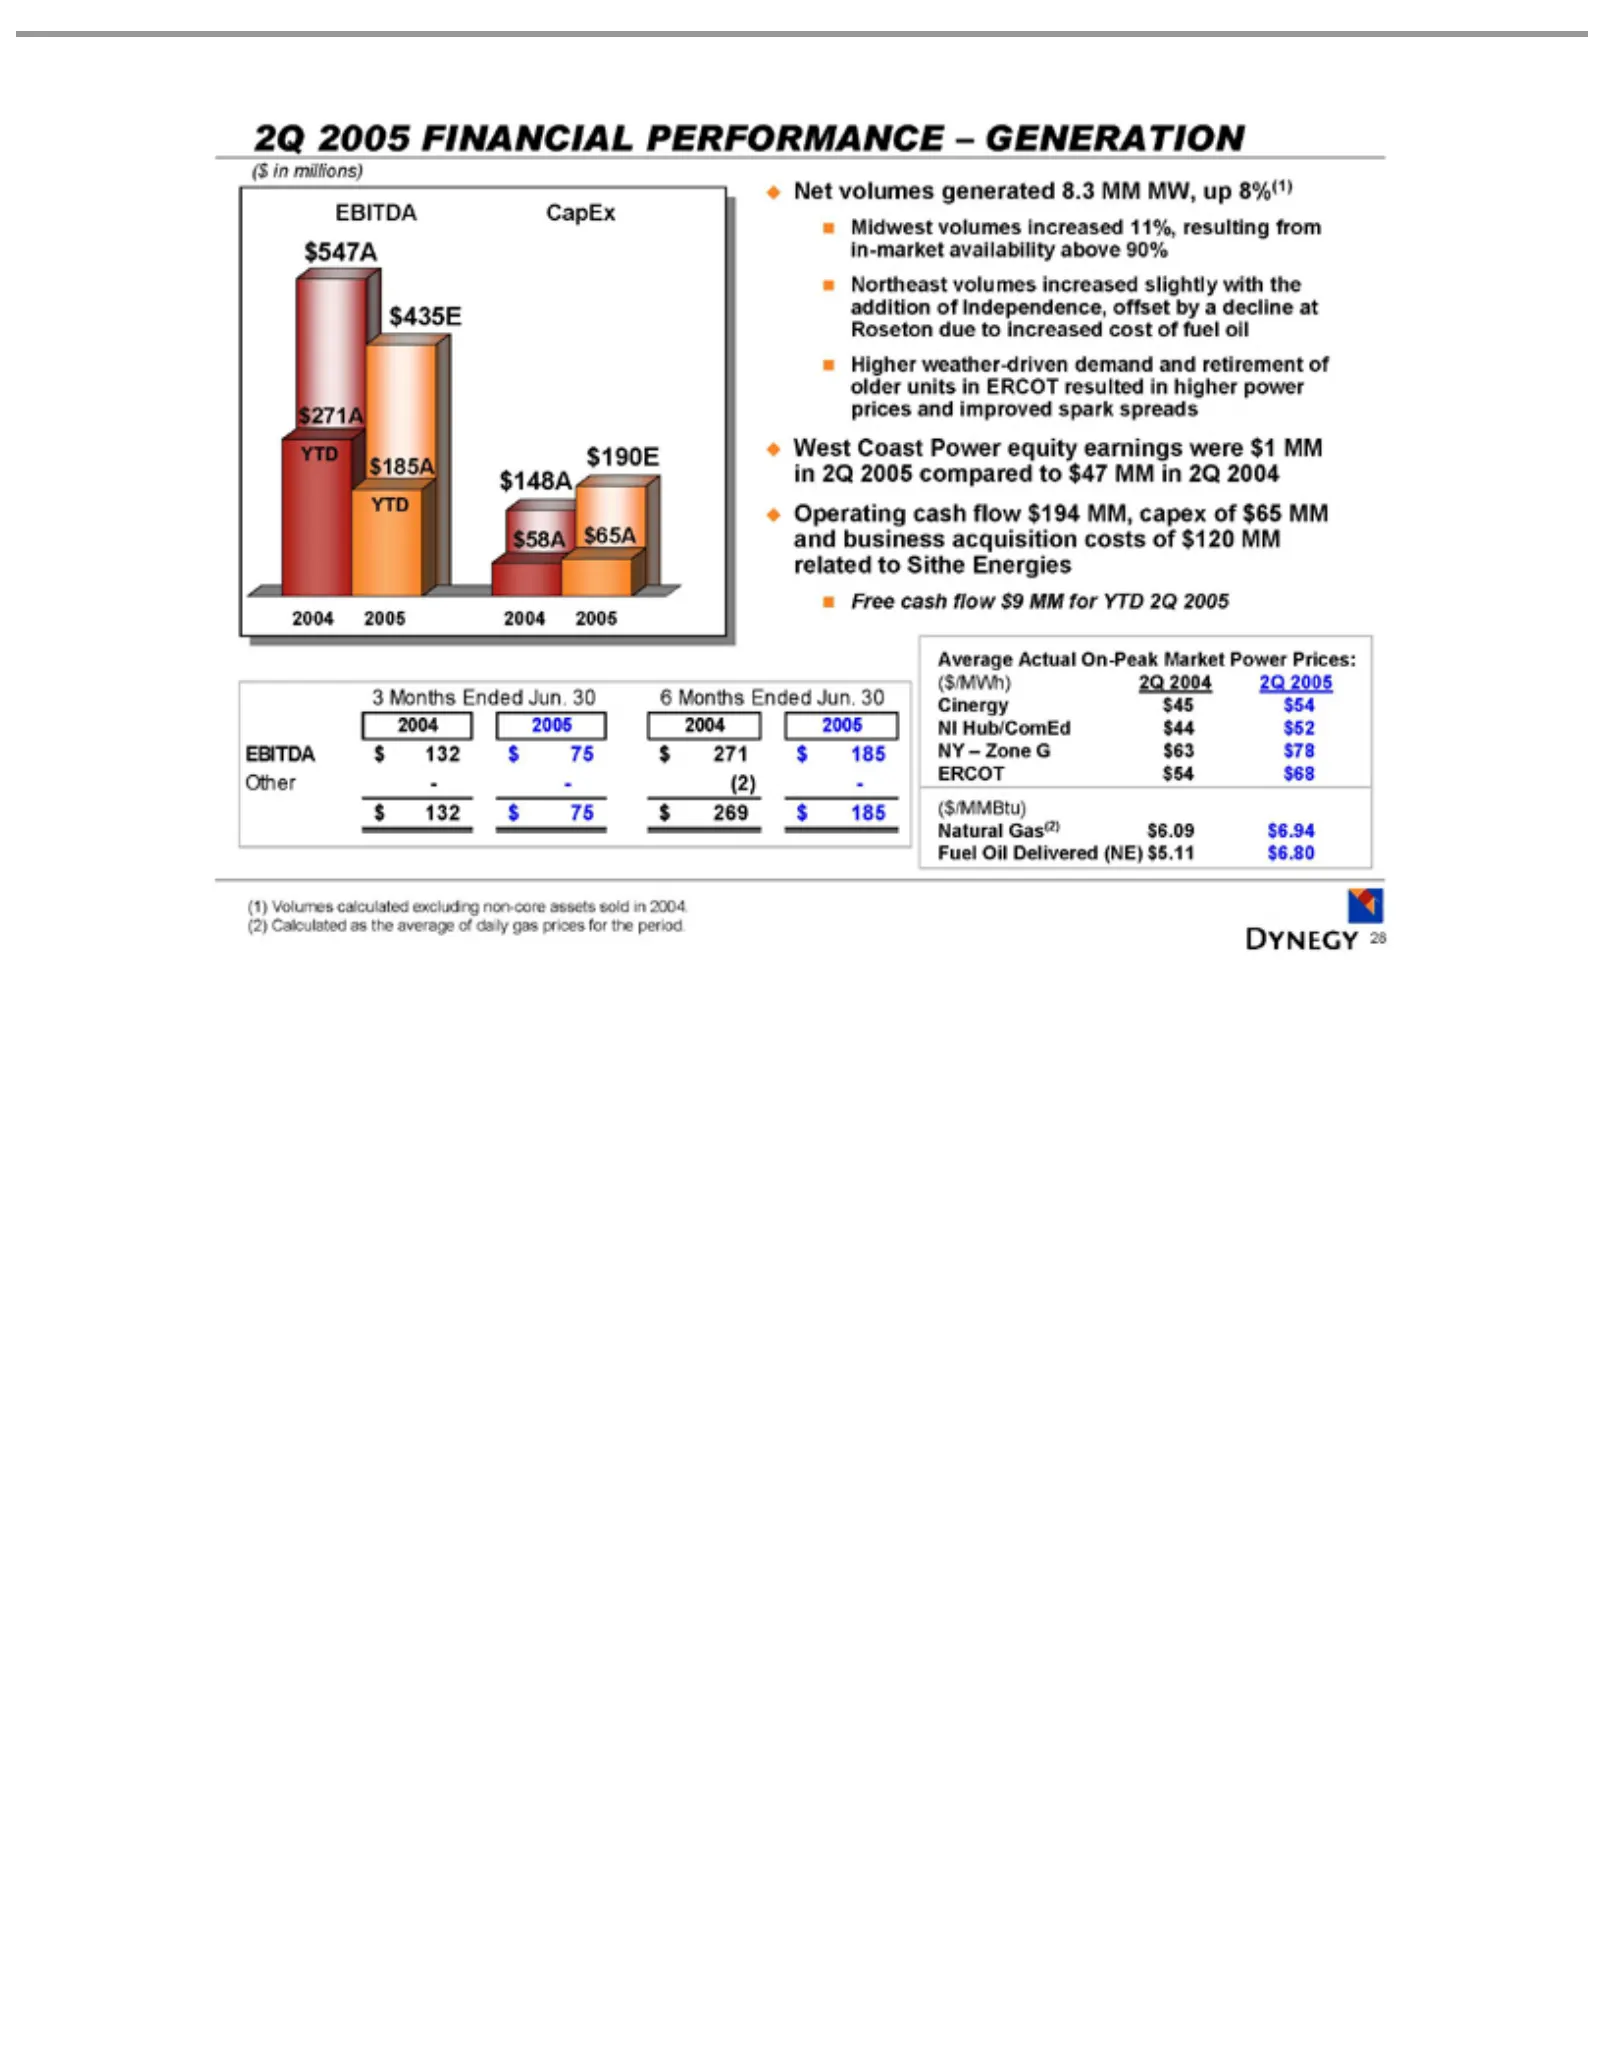
Slide 28: Financial Performance: Power Generation
2QMonths ($ $58A $148A $185A YTD $65A Net Midwest Northeast Higher West Operating Free 3 2004 EBITDA Other $132 Average ($/MWh) Cinergy NI NY ERCOT Natural ($/MMBtu) Fuel (1) 28 in Hub/ComEd Volumes 2005 –volumes cash Oil millions) Coast 2005 $75 Zone $190E - weather-driven -Gas(2) $45 Actual $54 De
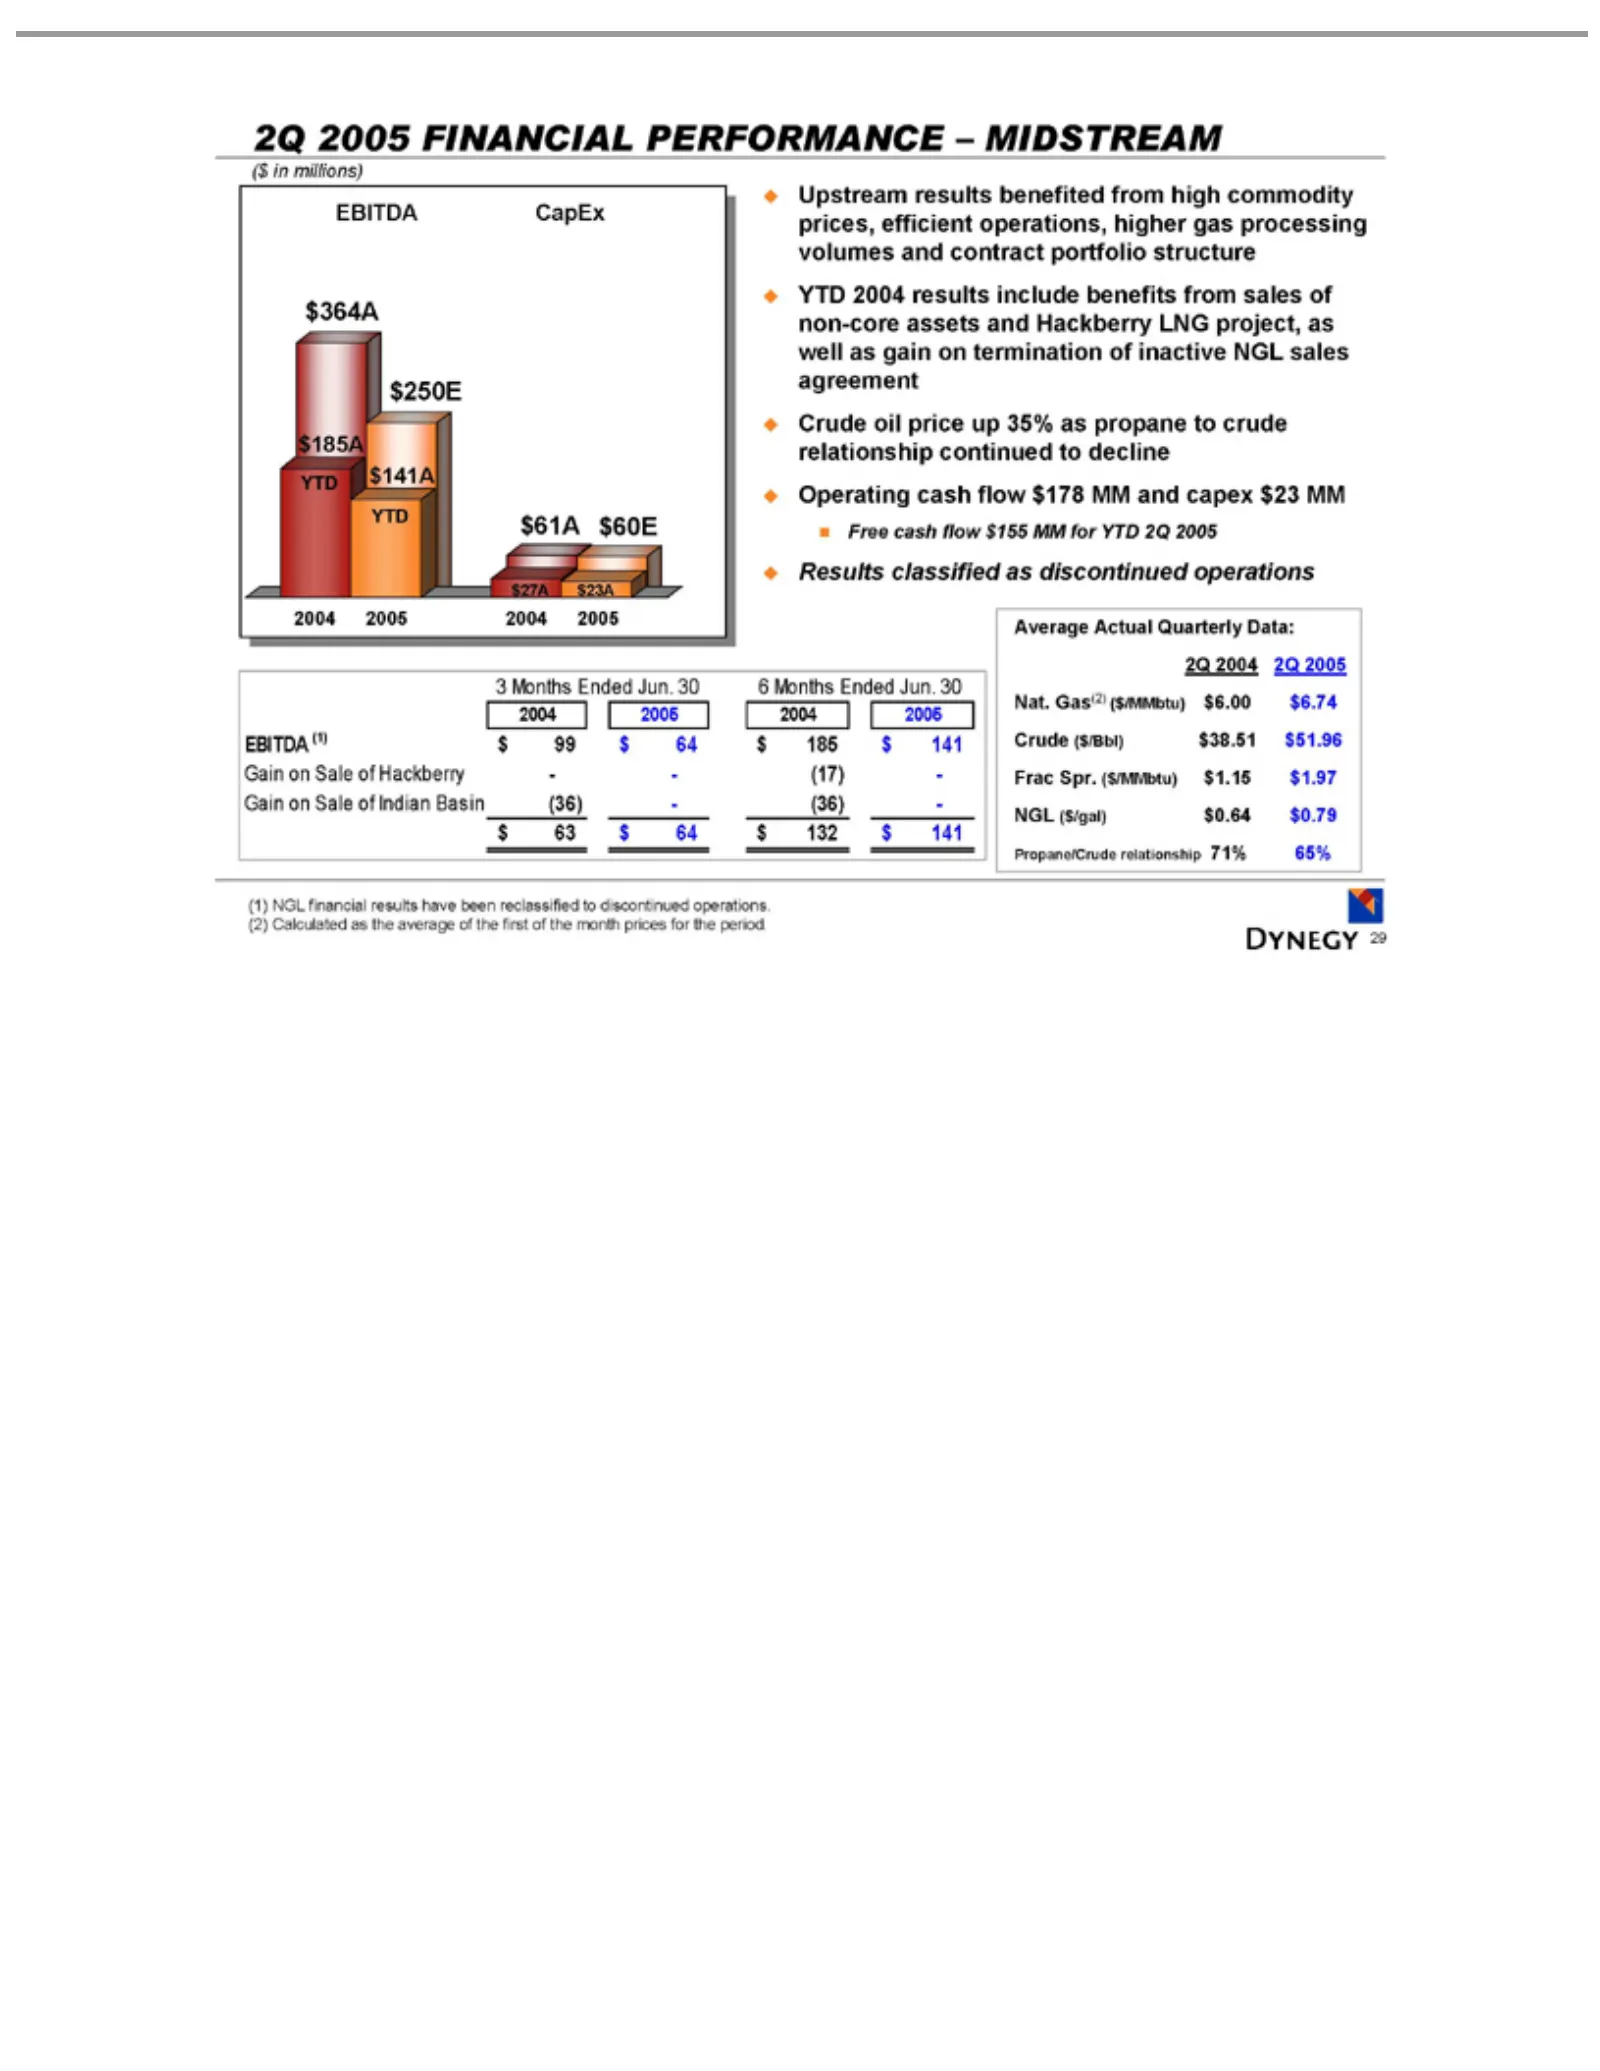
Slide 29: Financial Performance: Midstream
($Months $250E $27A $61A $23A 3 2004 EBITDA Gain $63 Upstream YTD Operating Free Results Average 2Q Nat. Crude Frac NGL Propane/Crude (1) 29 inNGL 2005 2004 $64 Gas(2) cash Spr. millions) on 2005 ($/gal) 2004 $60E oil ($/Bbl) $141A classified Sale $132 Actual financial FINANCIAL 2Q CapEx (1) ($/MMbt
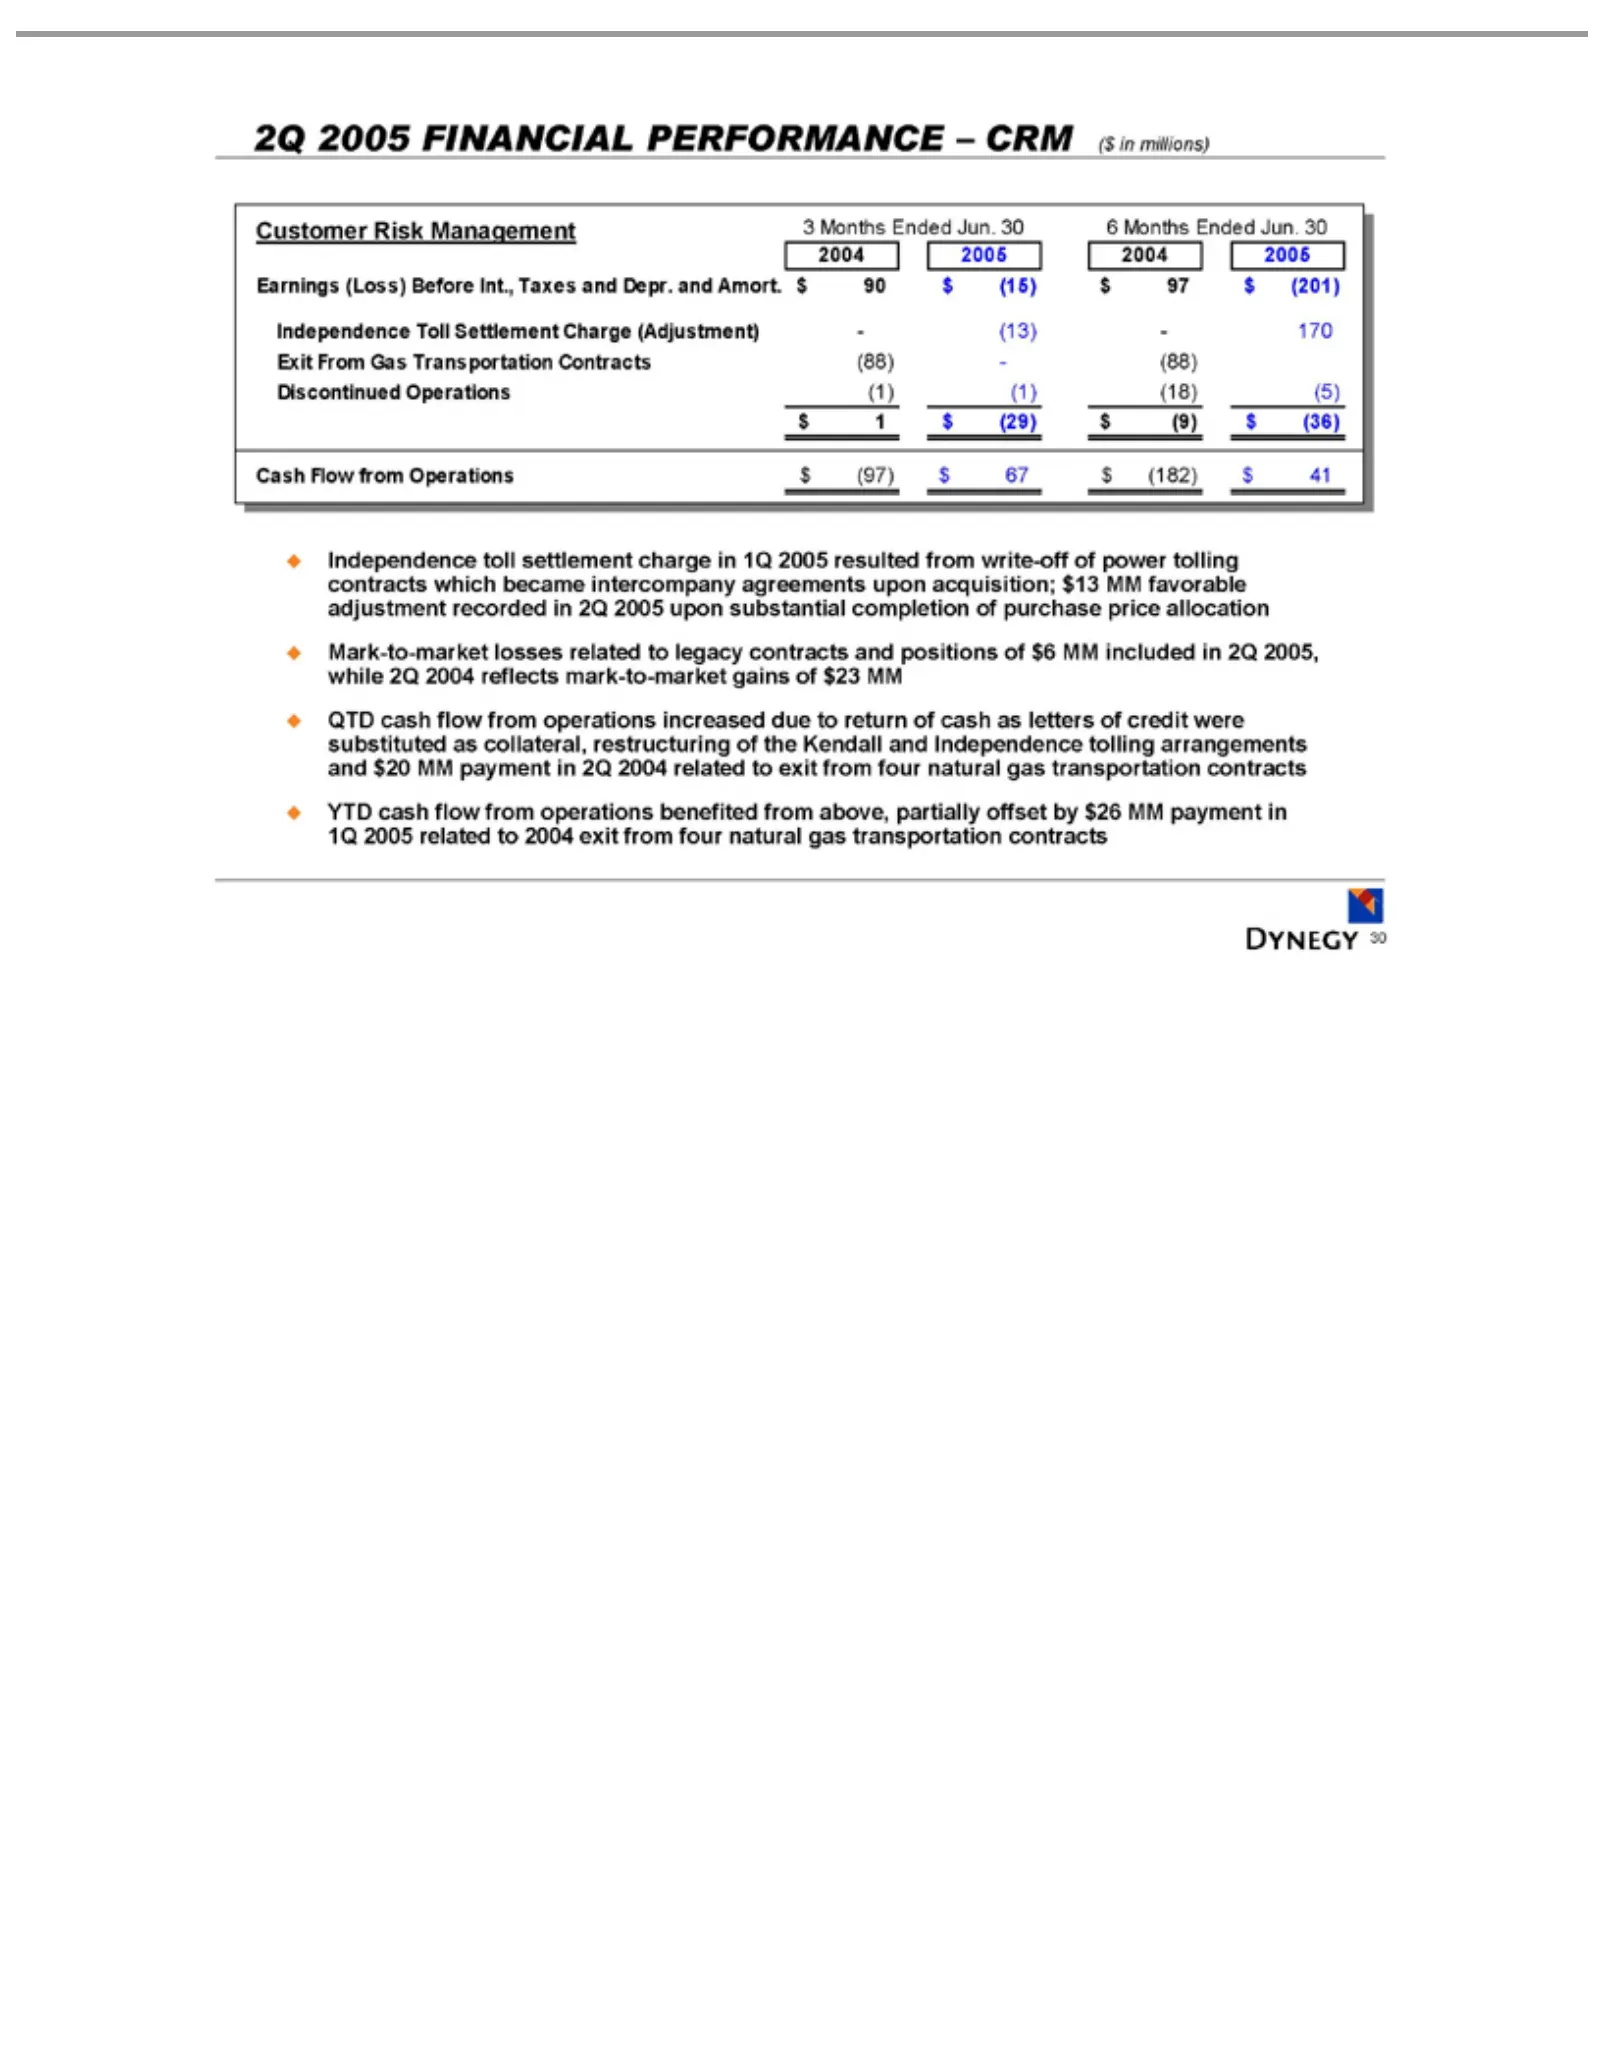
Slide 30: Financial Performance: Customer Risk Management
2Q2Q Customer Earnings Exit Discontinued $1 Cash Independence in market QTD payment 2004 30 $(29) 2005 From 2005 exit Flow cash 2005 gains $(9) in FINANCIAL (Loss) from Risk flow Gas 2004 from 2Q upon of $(36) Operations Toll toll Transportation four 2004 Management from $23 Before 2005 Operations s
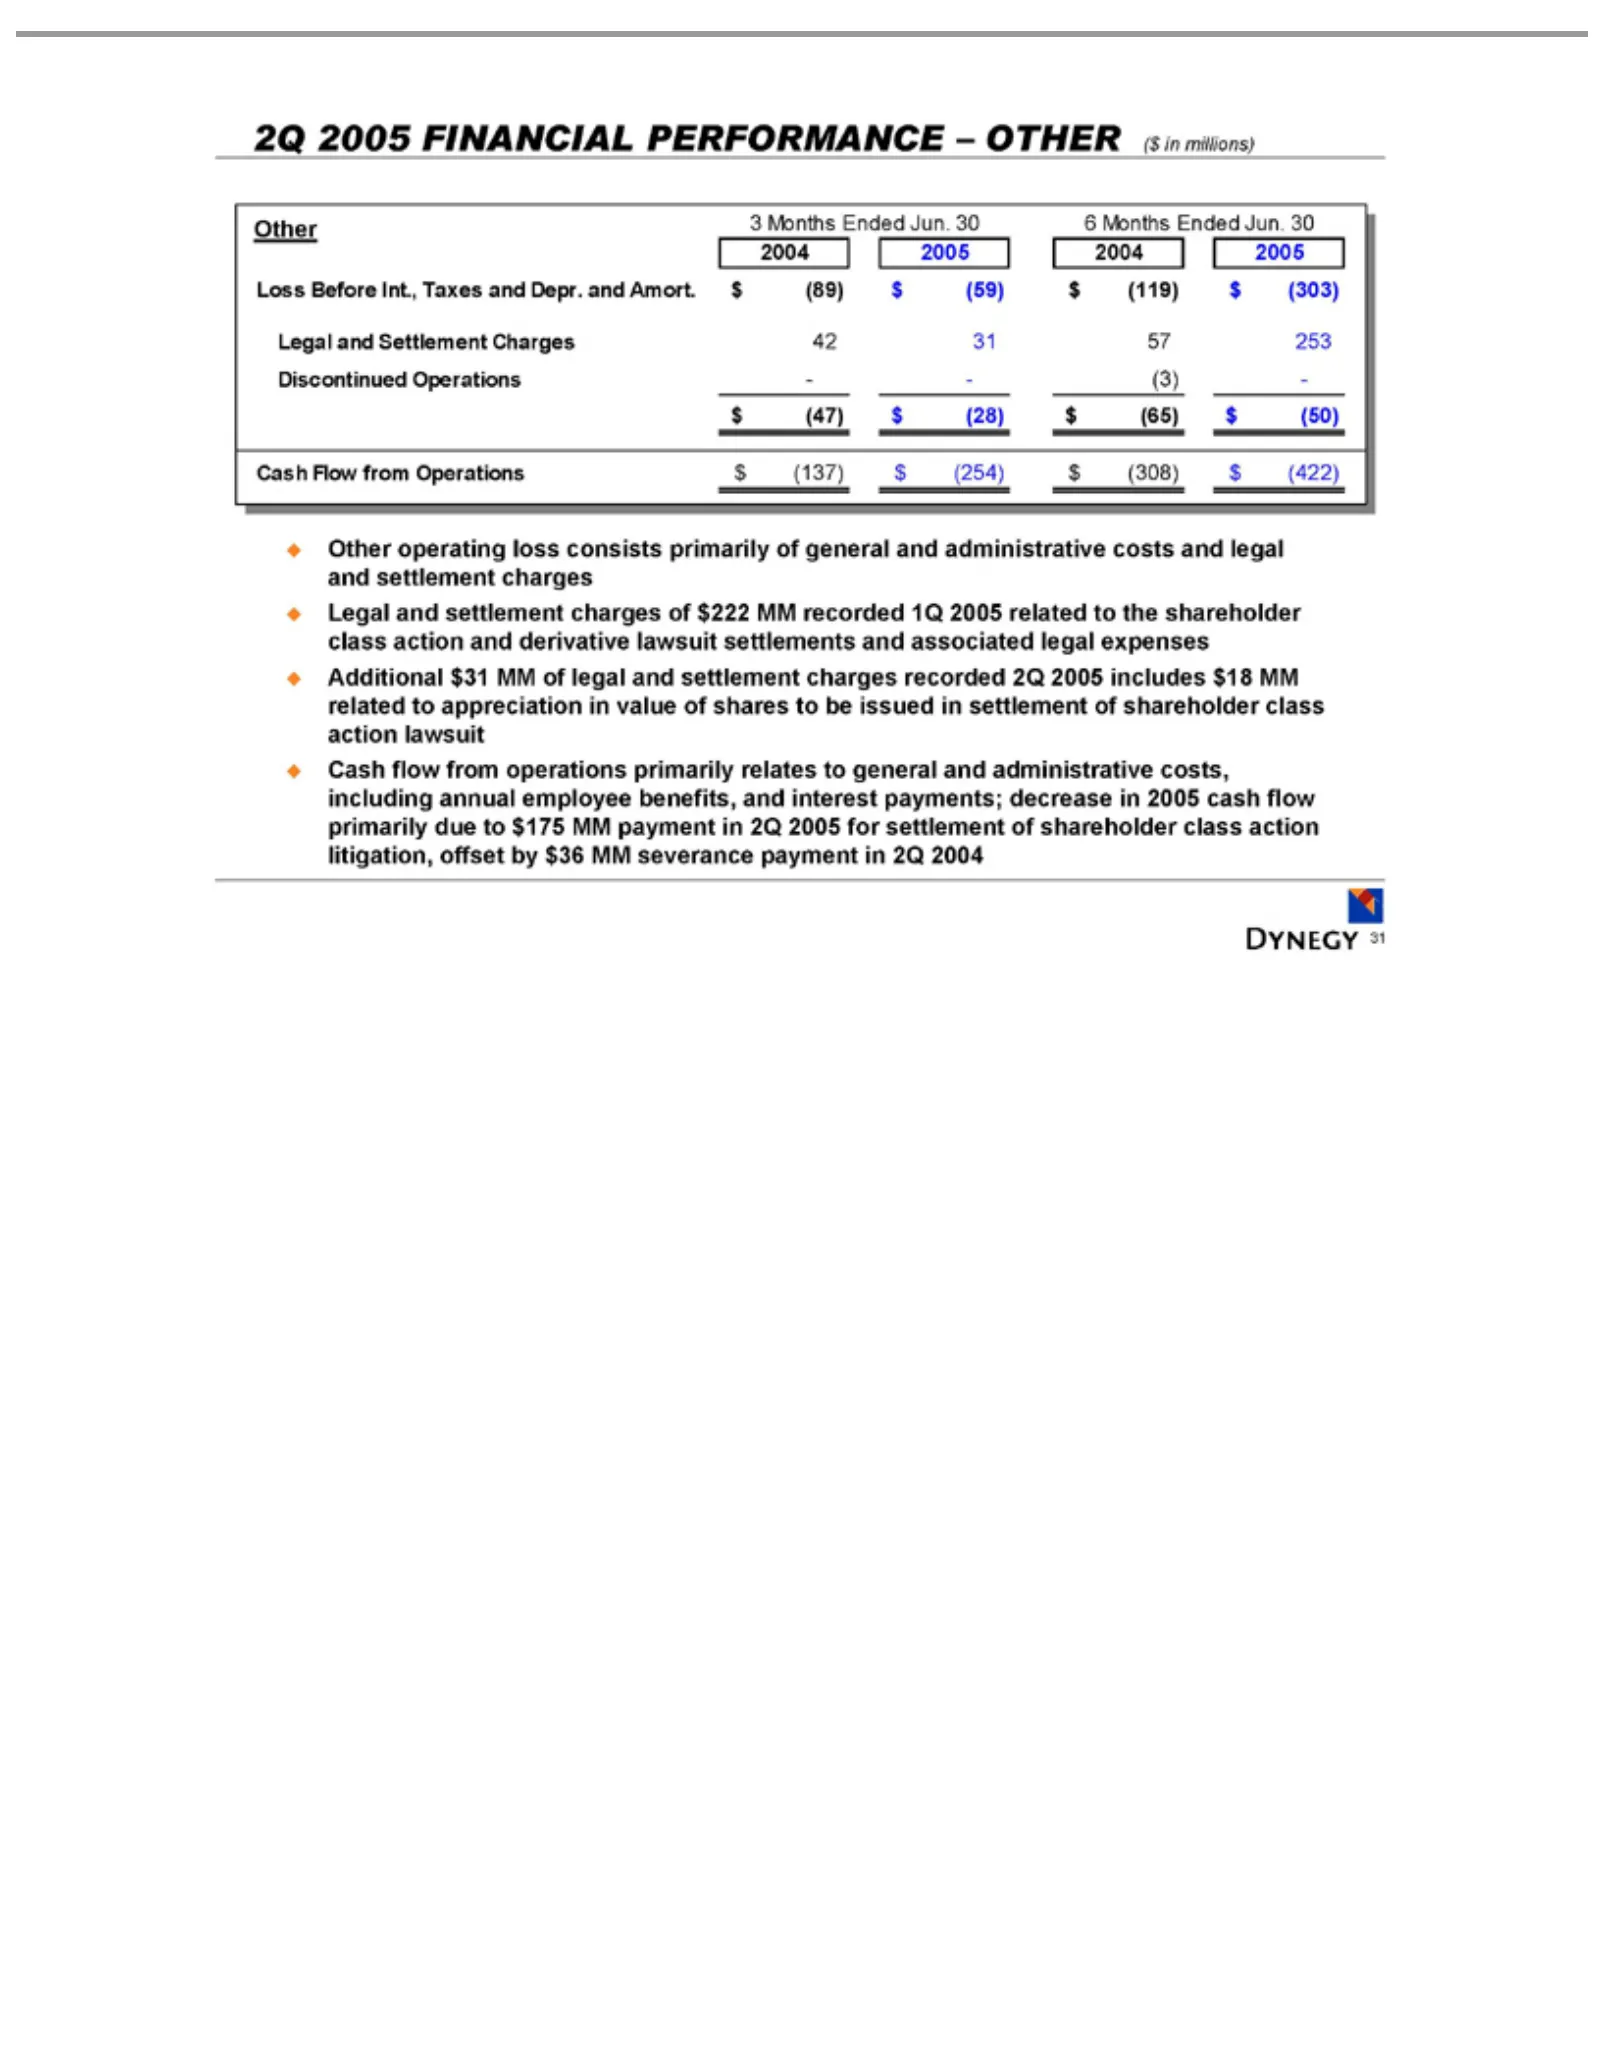
Slide 31: Financial Performance: Other
2Q 2005 2004 Loss Legal Discontinued $(47) Cash Other class shares payments; 31 Before action 2005 Flow $(28) and 3toMonths operating FINANCIAL be Settlement decrease 2004 from $(65) and issued Int., Operations loss derivative Ended 2005 Operations Taxes $(50) ininconsists Charges settlement 2005 PE
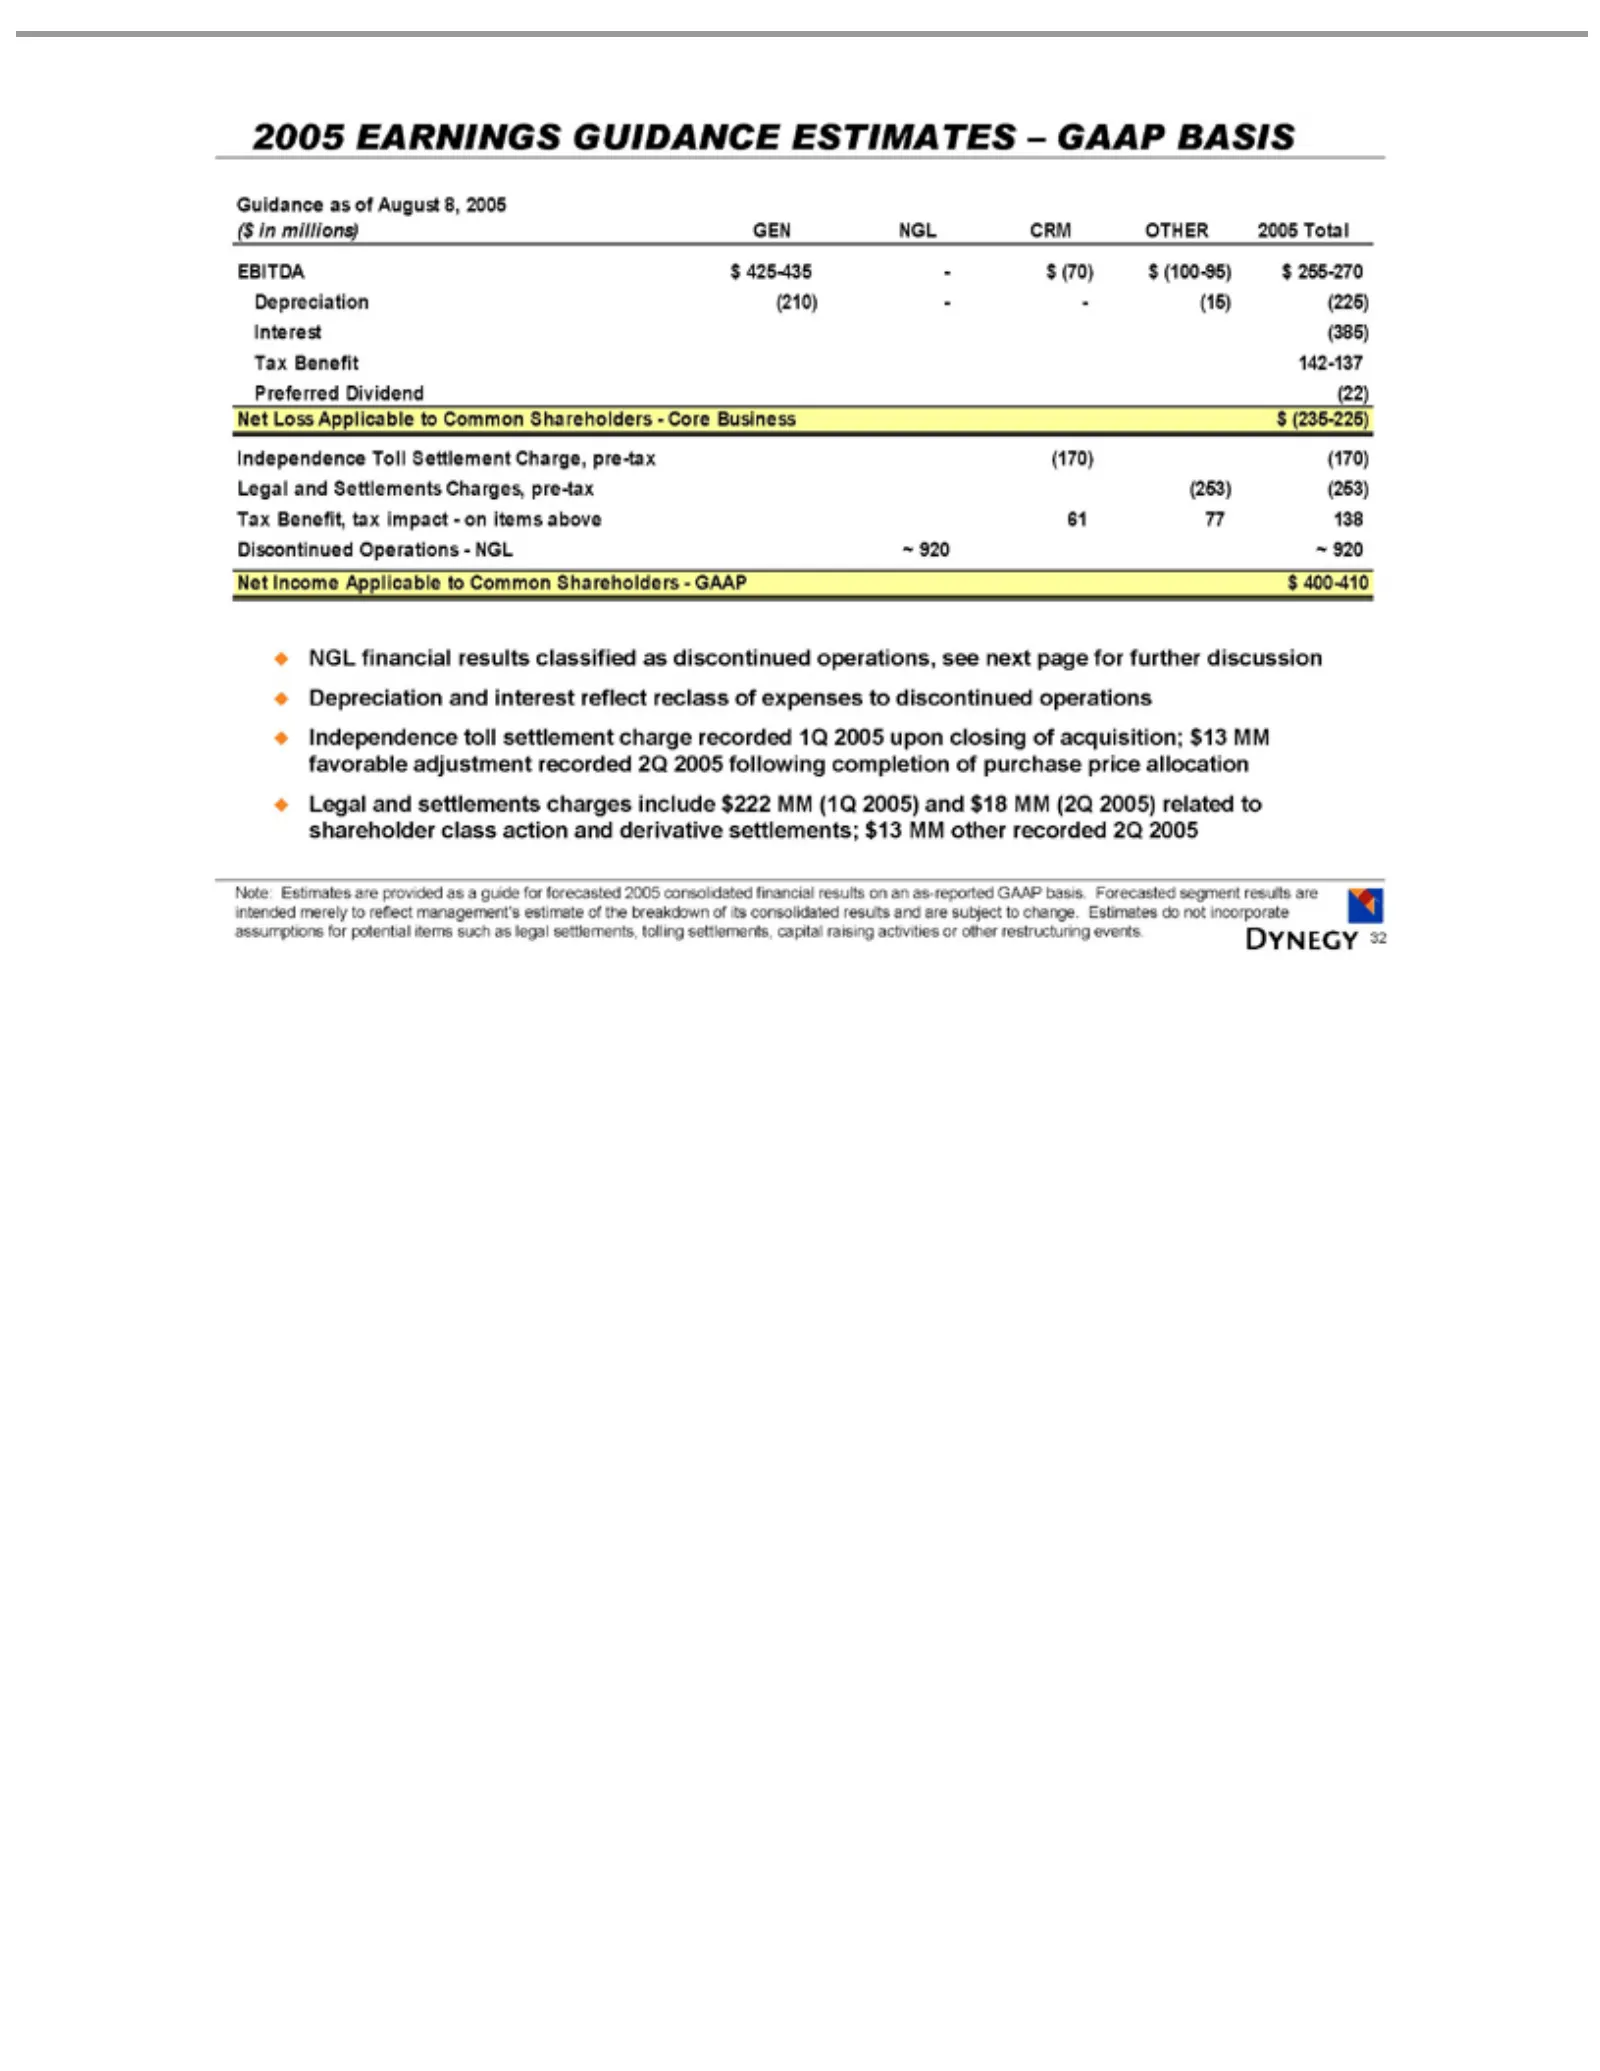
Slide 32: 2005 Earnings Guidance
2005 Guidance ($ EBITDA Depreciation Interest Preferred Independence Legal Tax Discontinued Net NGL settlement include Note: estimate raising 32 inIncome Loss Benefit Benefit, millions) EARNINGS financial Estimates and activities $222 (385) of Applicable $425-435 Dividend as Settlements charge the A
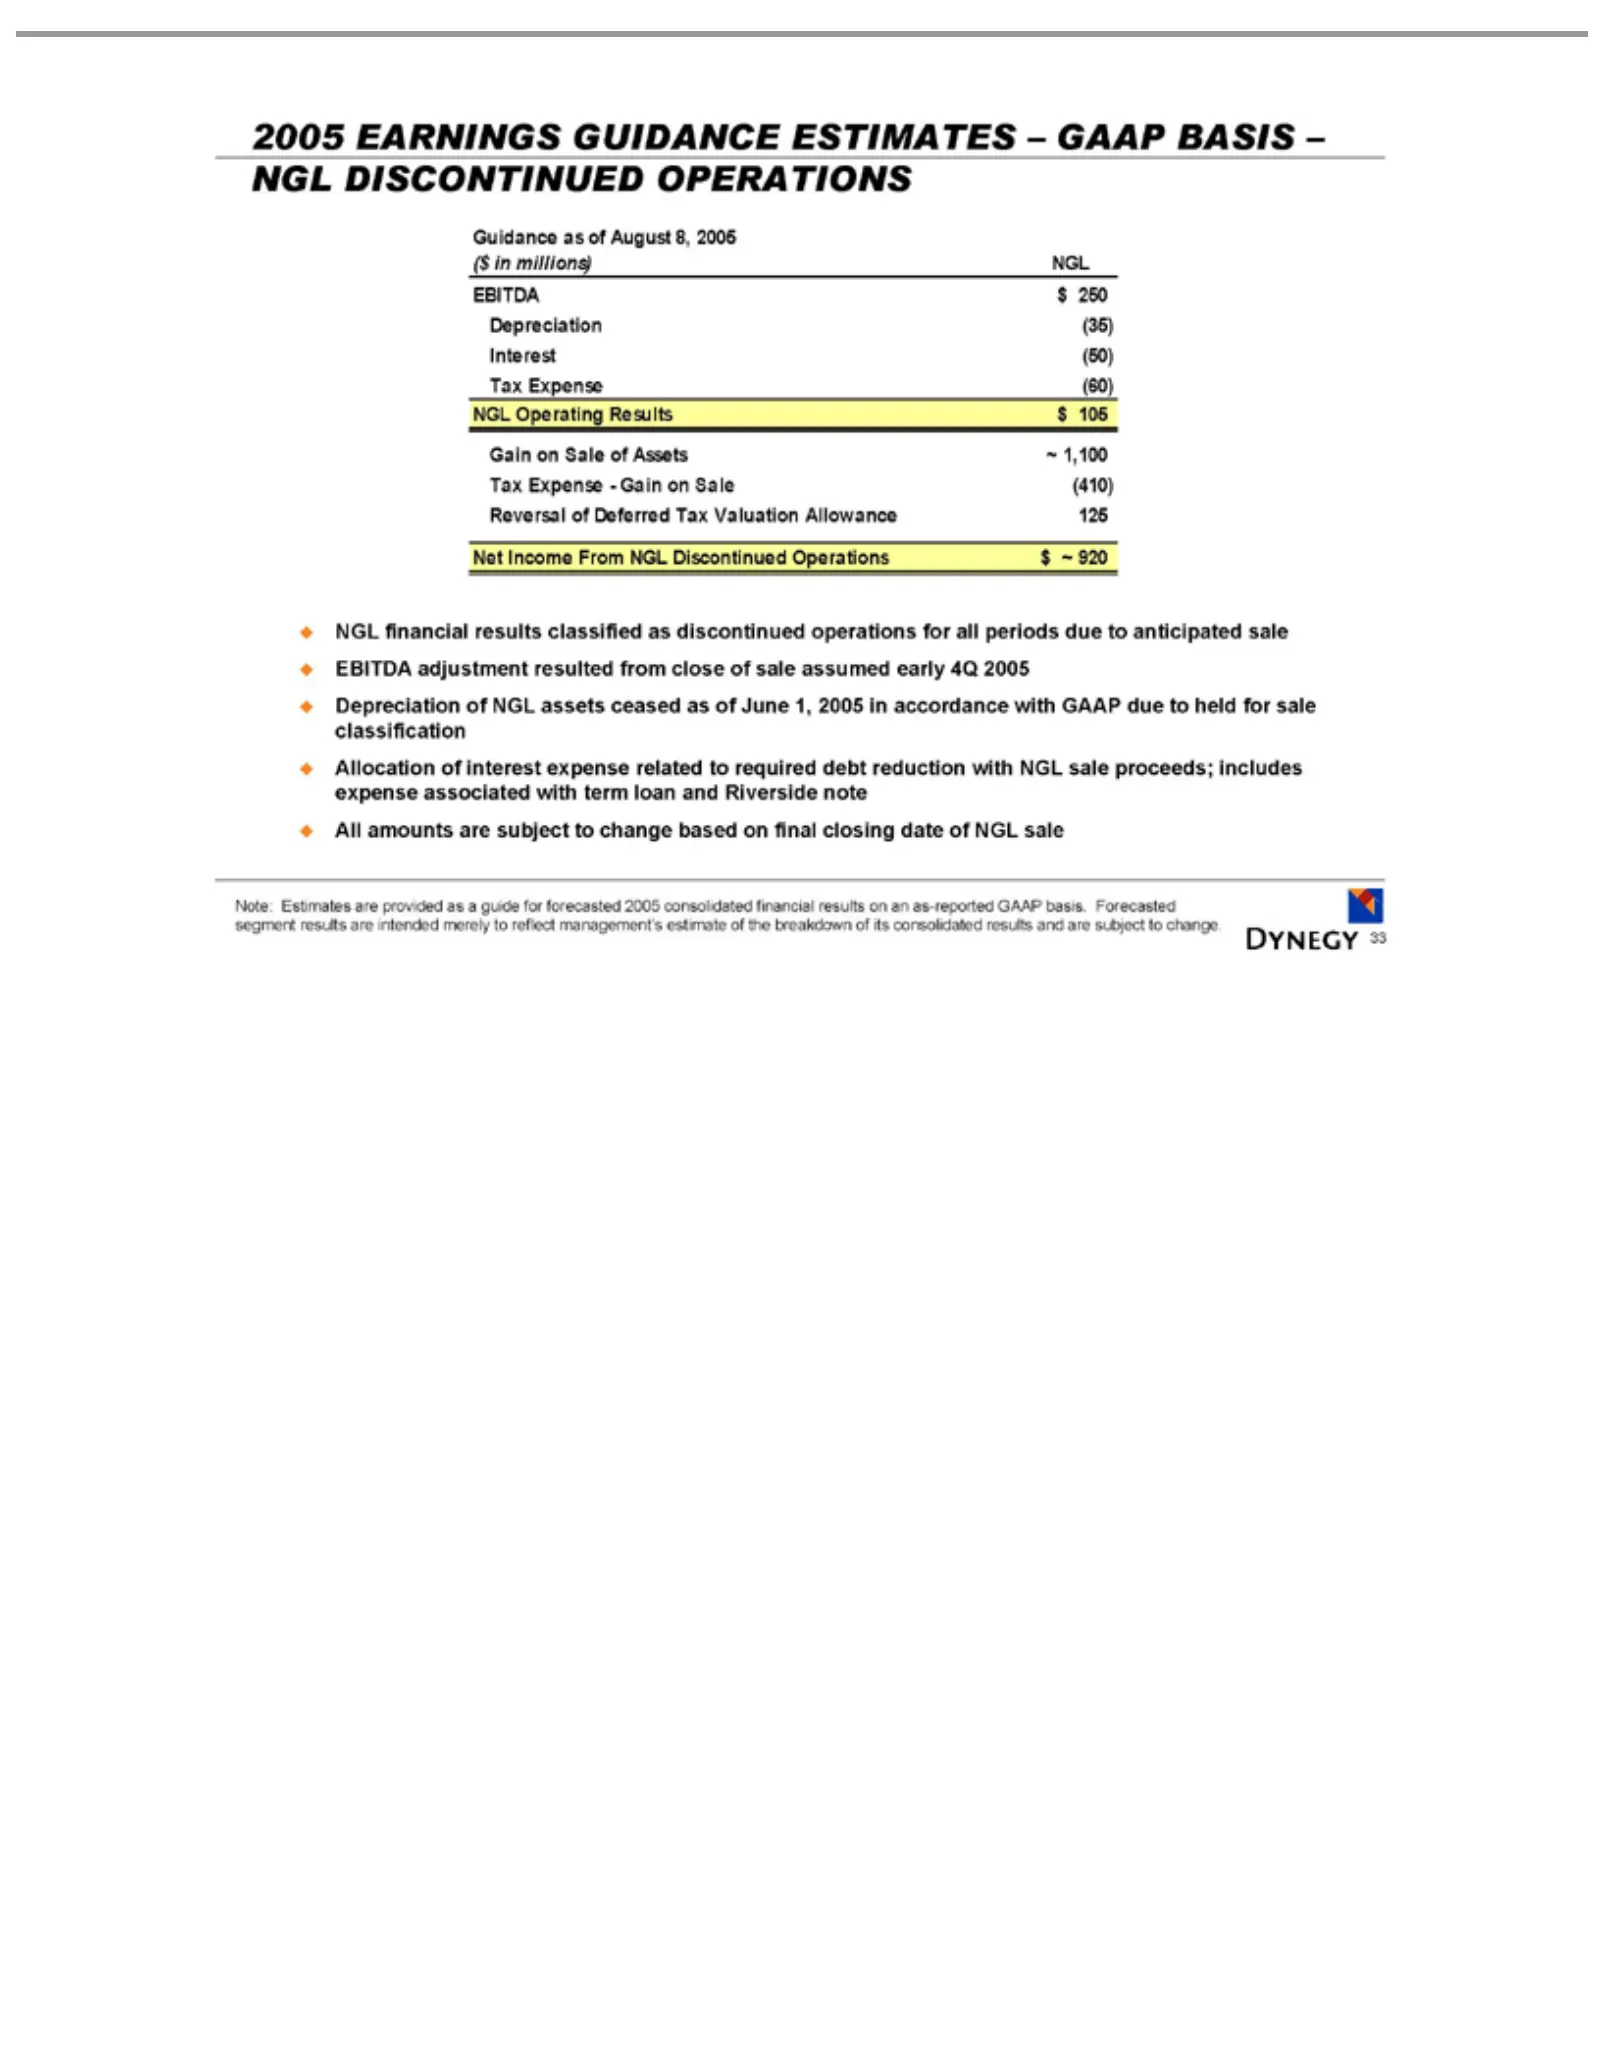
Slide 33: 2005 Earnings Guidance: GAAP Basis and Discontinued Operations
2005 Guidance ($ EBITDA Depreciation Interest Gain Tax Reversal Net NGL ceased associated Note: estimate 33 inIncome Expense Expense—Gain millions) on EARNINGS Operating financial Estimates as(50) Sale of of $250 of as with the Deferred From June of (60) (35) ofNGL results breakdown August term Asse
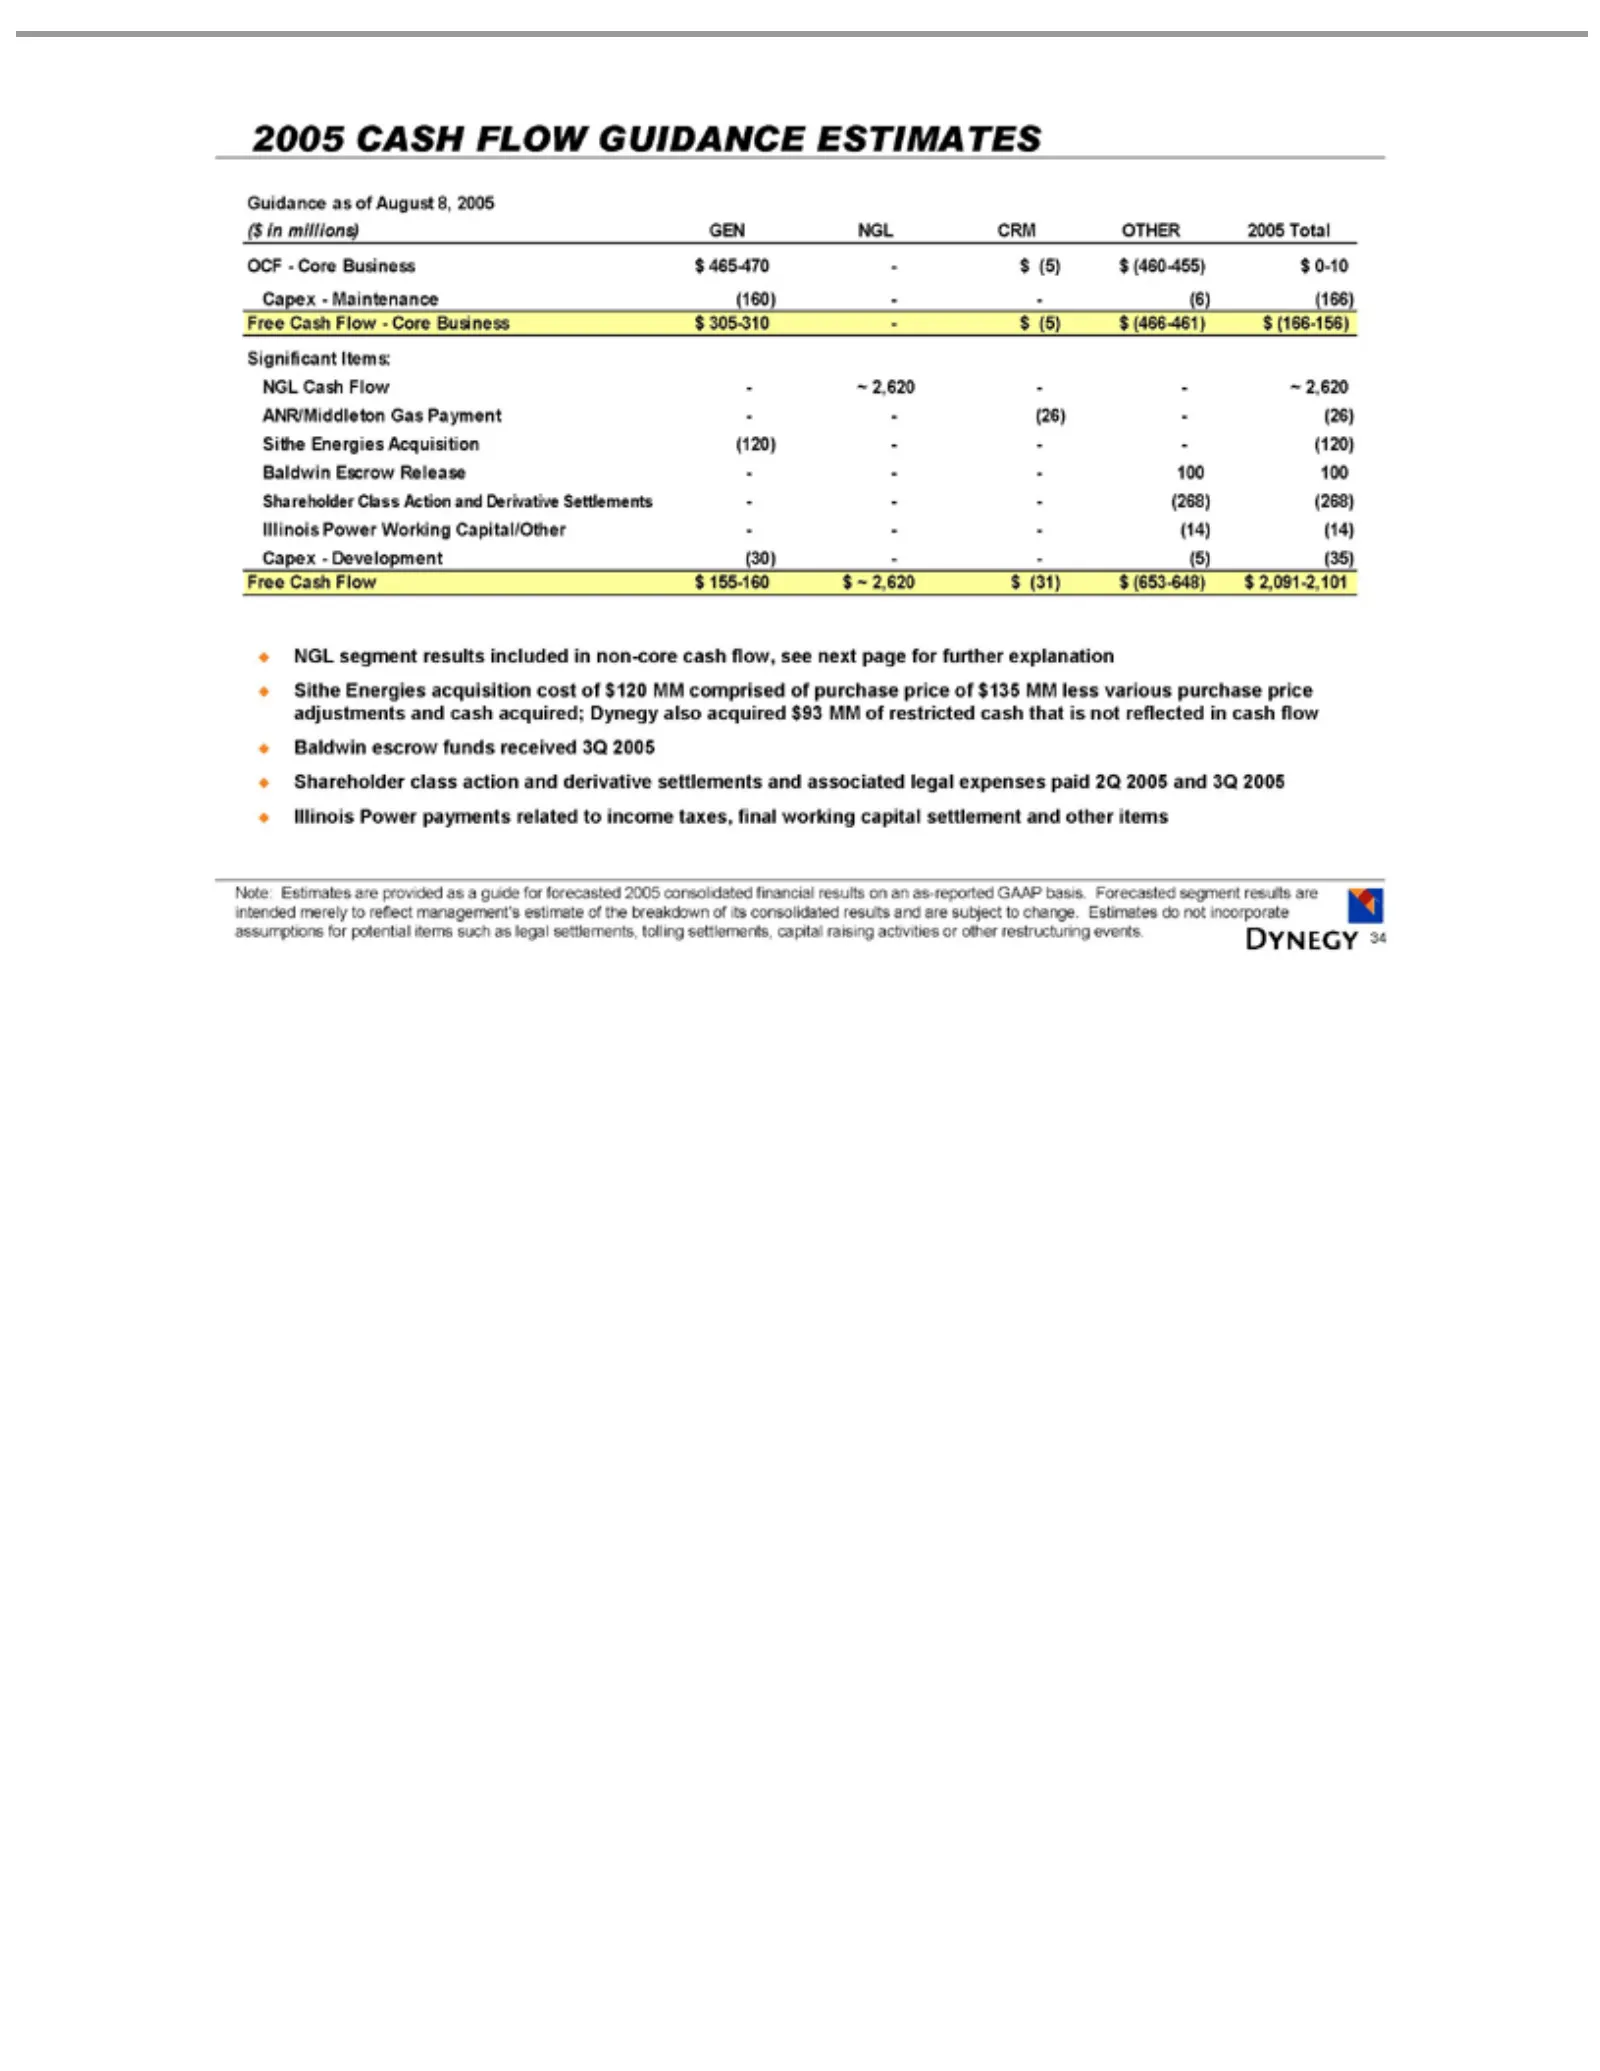
Slide 34: 2005 Cash Flow Guidance
2005 Guidance ($ OCF—Core Capex—Maintenance Significant ANR/Middleton Baldwin Shareholder Illinois Capex—Development Free NGL Sithe is payments Note: estimate raising 34 not in Cash millions) CASH Cash segment Energies reflected Estimates activities Power of Escrow as related Flow—Core Flow Flow Ite
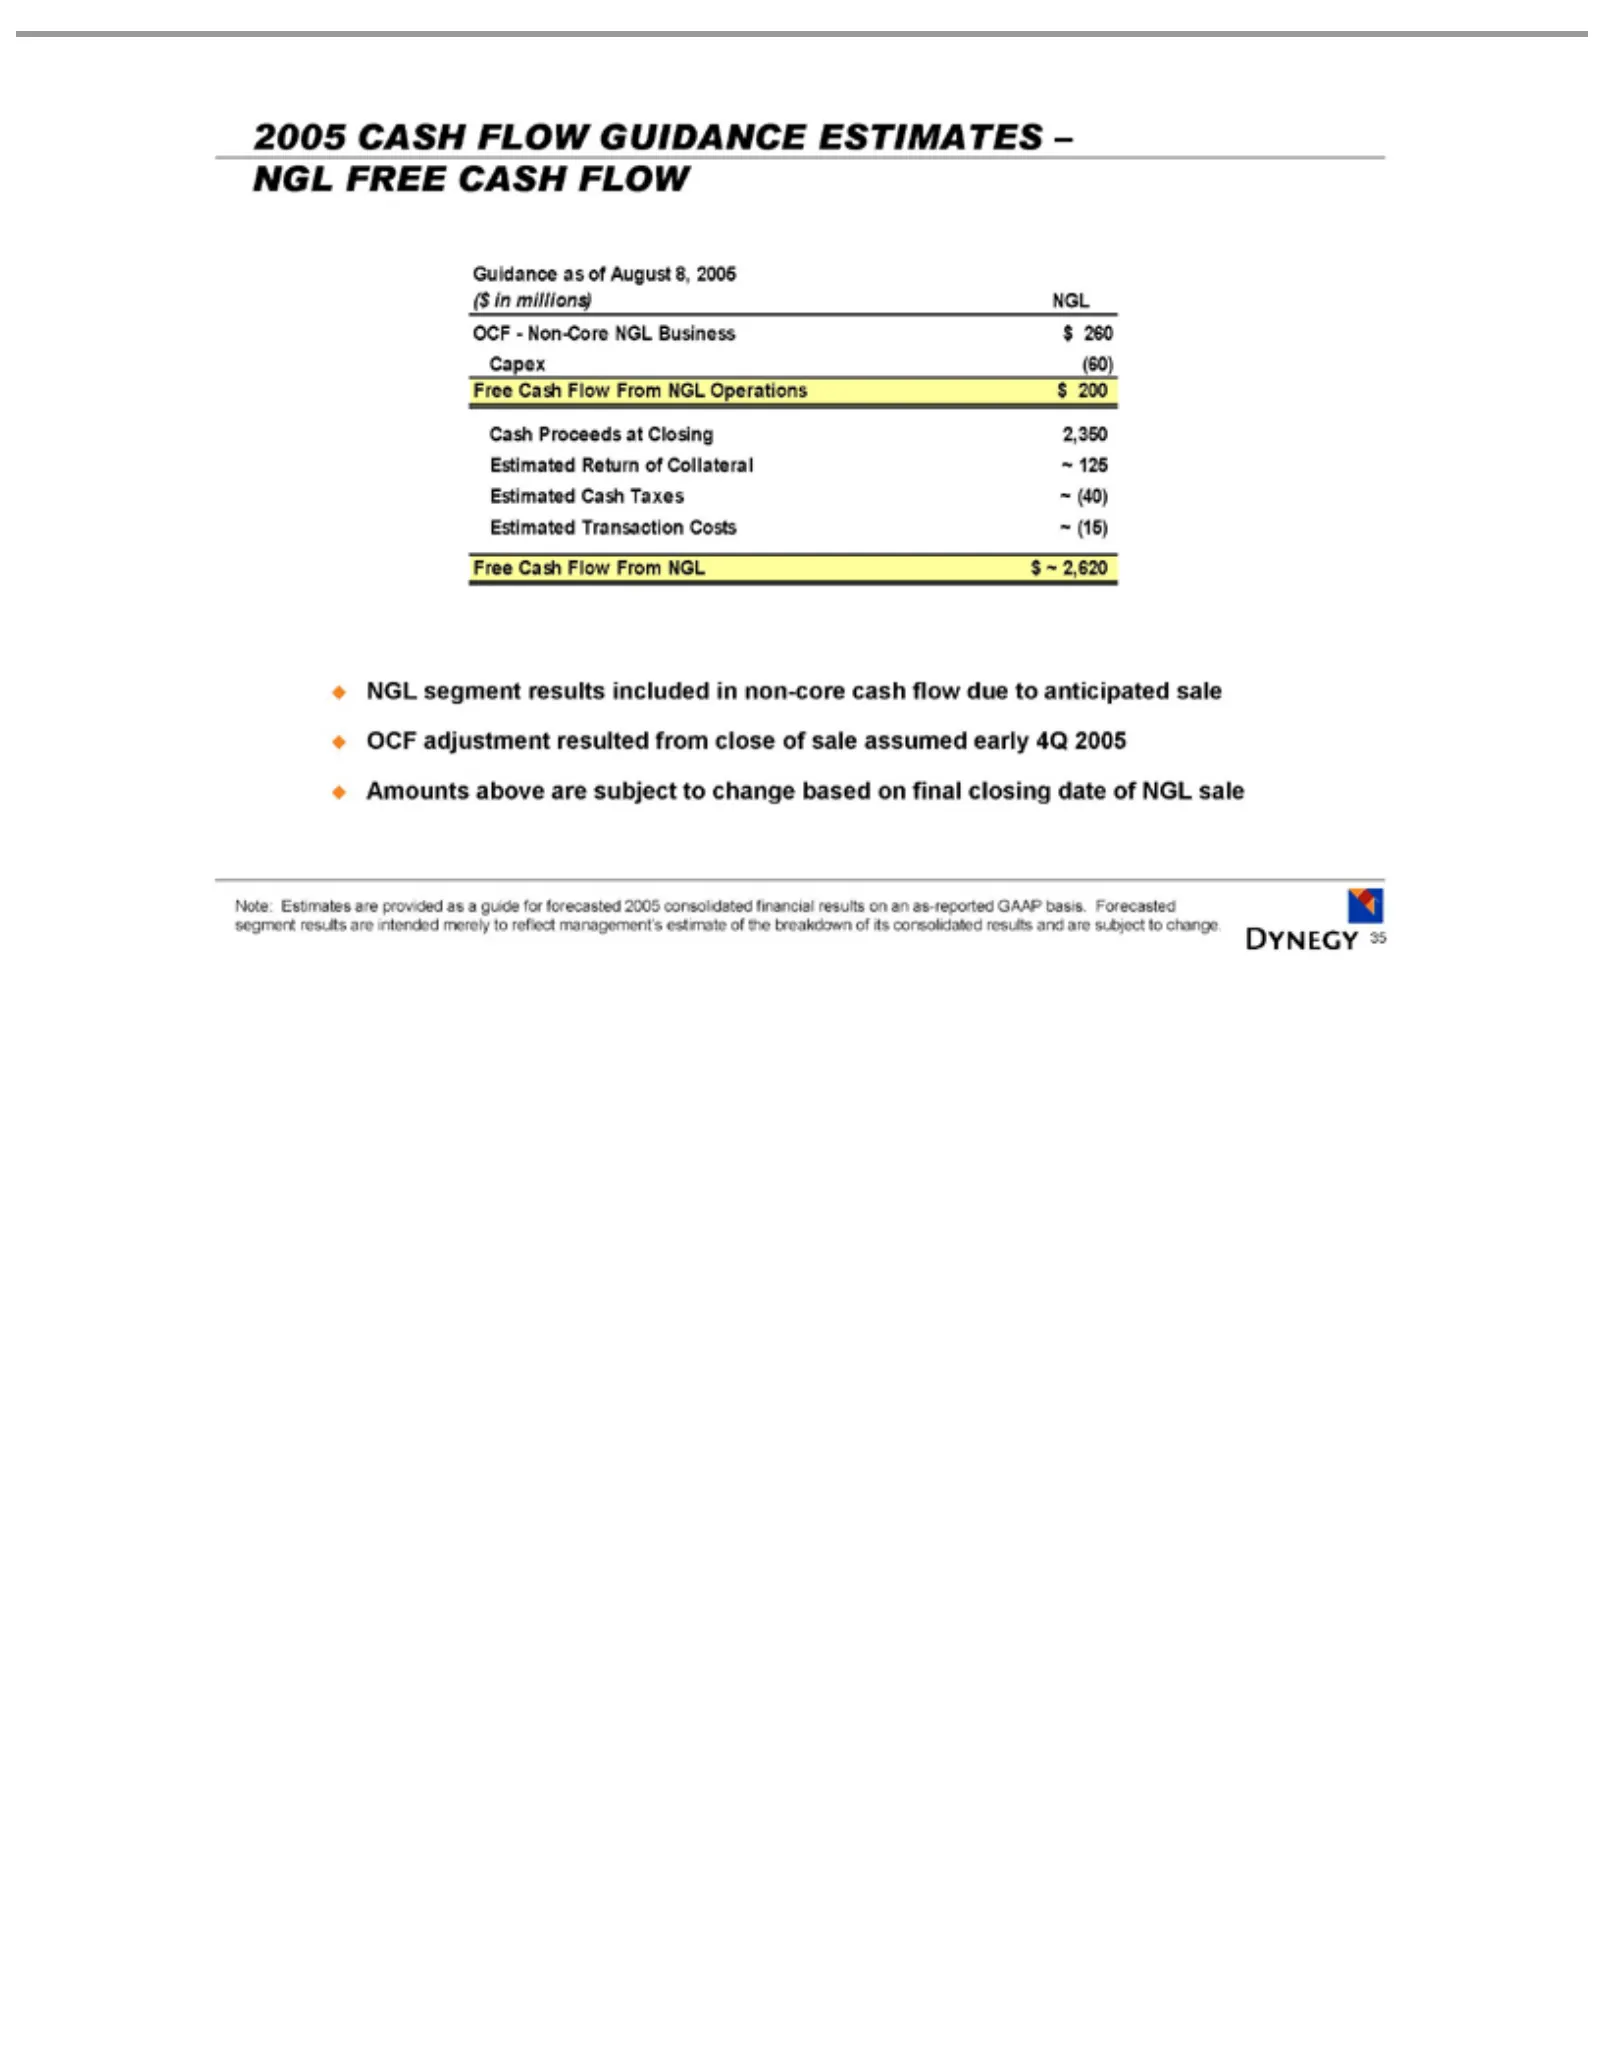
Slide 35: 2005 Cash Flow Guidance: Non-Core and Free Cash Flow
2005 Guidance ($ OCF—Non-Core Capex Cash Estimated Free NGL closing Note: estimate 35 in Cash millions) CASH Proceeds segment Estimates (60) date ofas Transaction Return Cash Flow the of of FLOW results NGL at breakdown NGL August Taxes From are Closing NGL ofprovided GUIDANCE Collateral sale includ
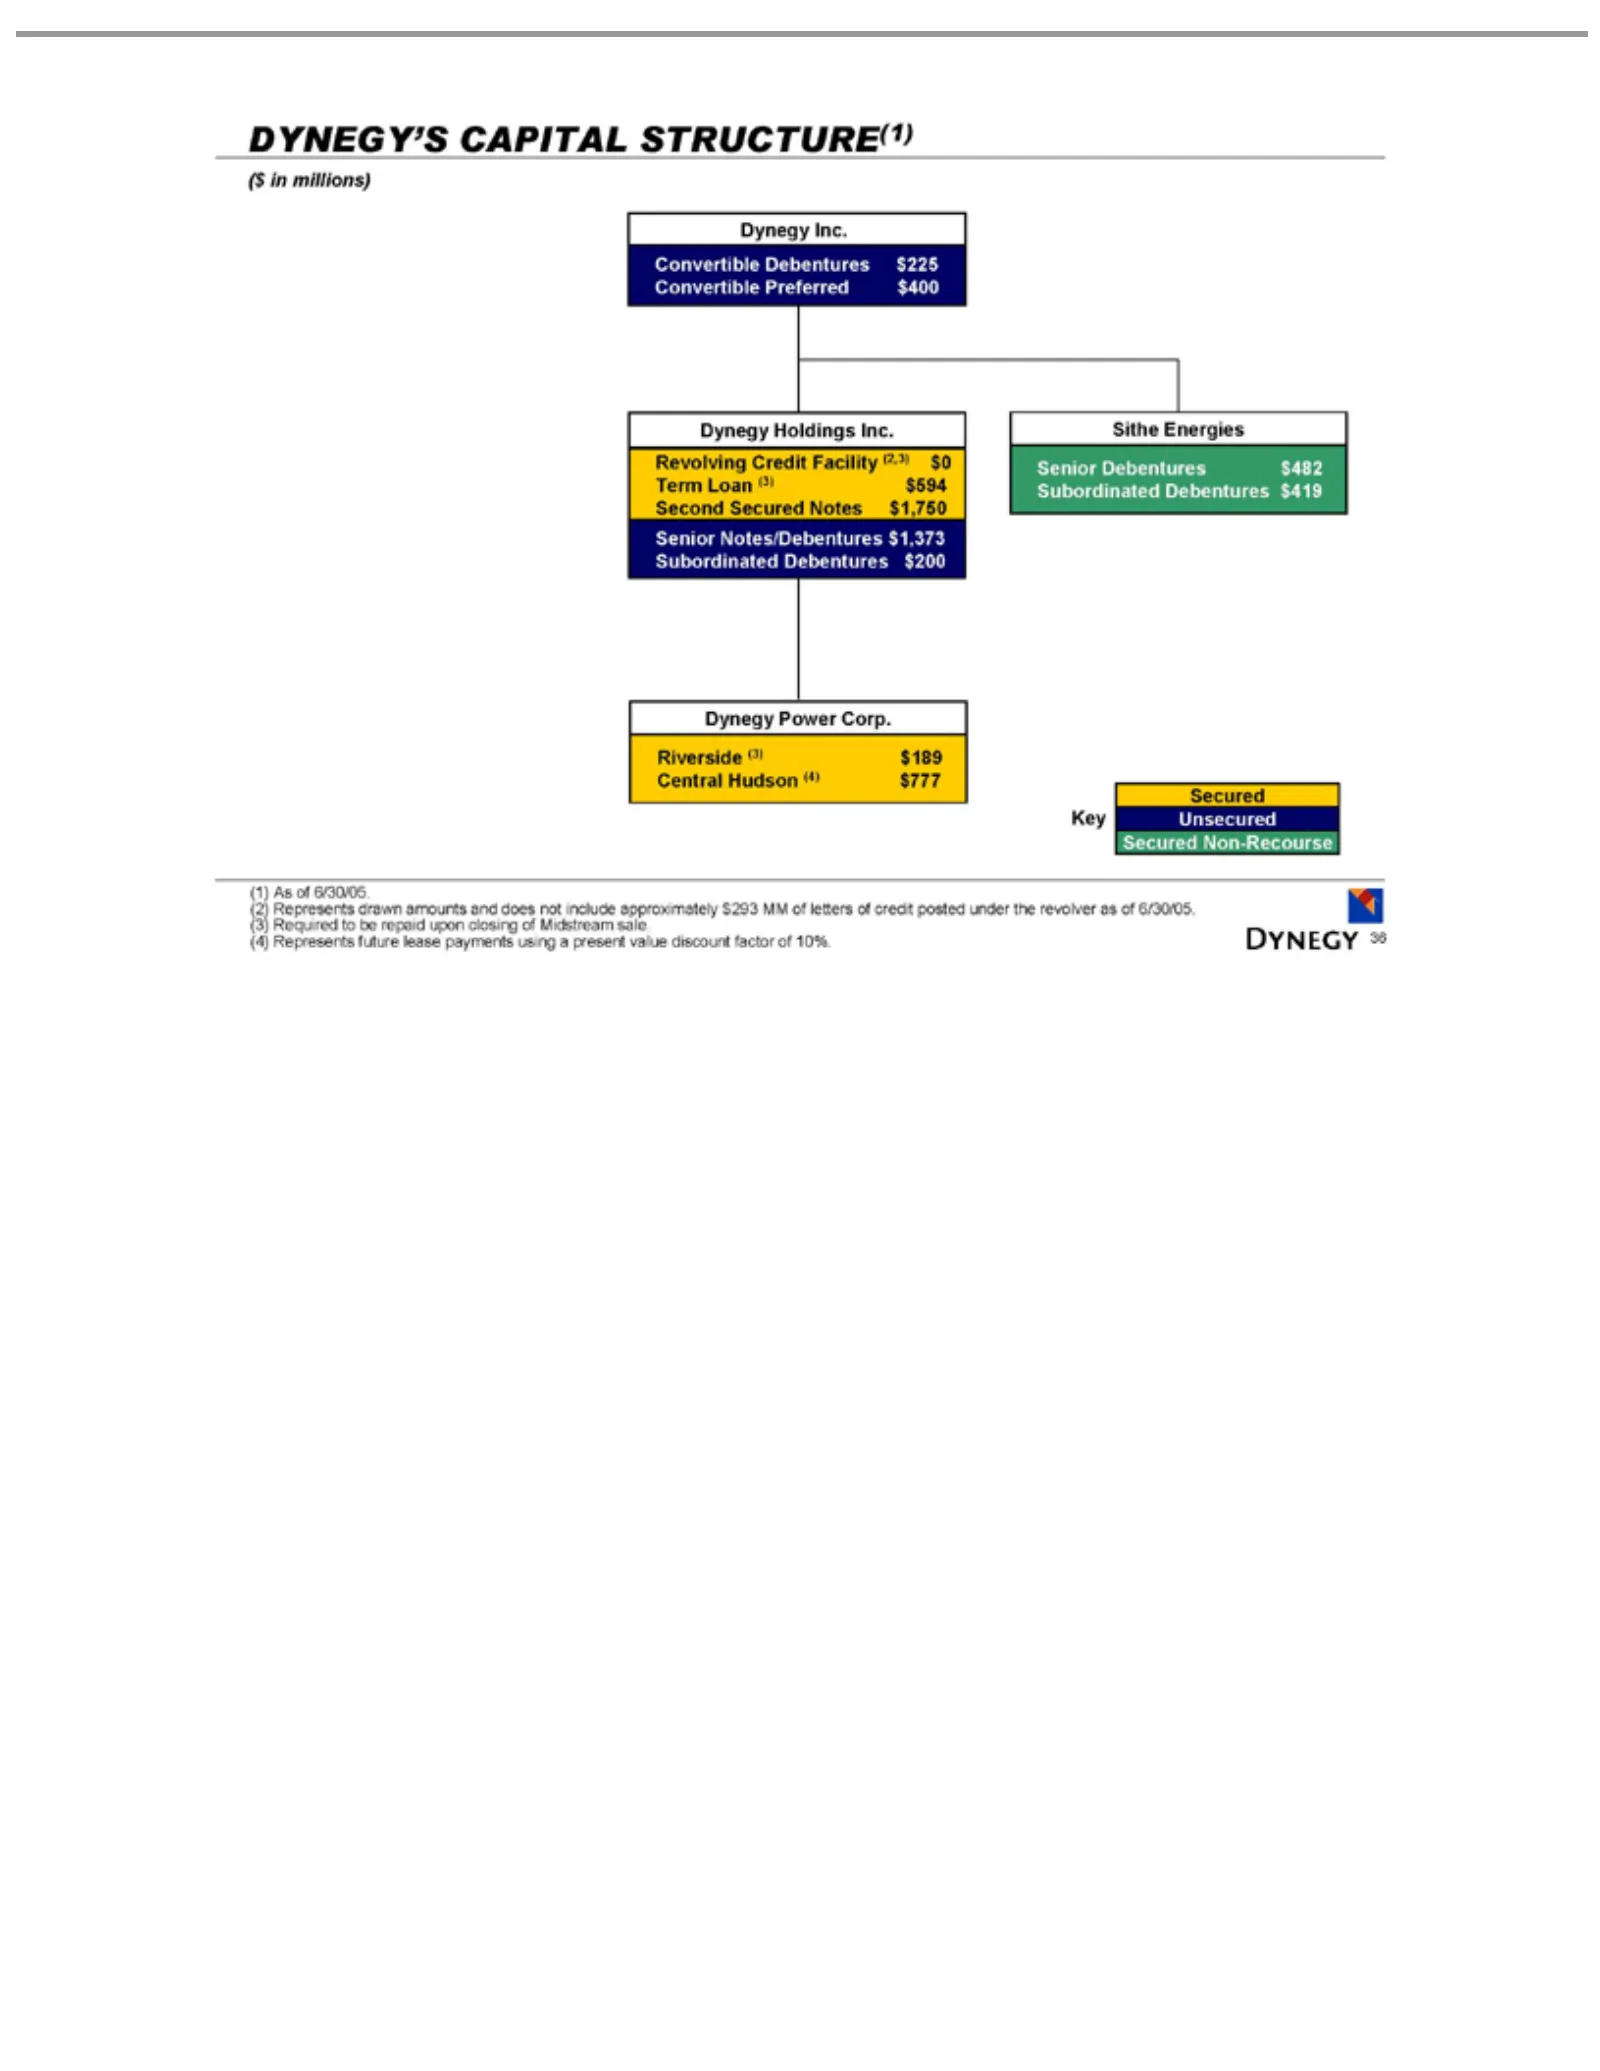
Slide 36: Dynegy's Capital Structure
DYNEGY’S ($ Convertible Revolving Term Second Sithe Senior Subordinated Dynegy Riverside Secured Key (1) (2) (4) 36 in As Represents millions) Energies Loan of Notes/Debentures Debentures Secured Inc Holdings Power Unsecured 6/30/05. (3) Credit (3) Debentures Preferred CAPITAL $189 Debentures drawn
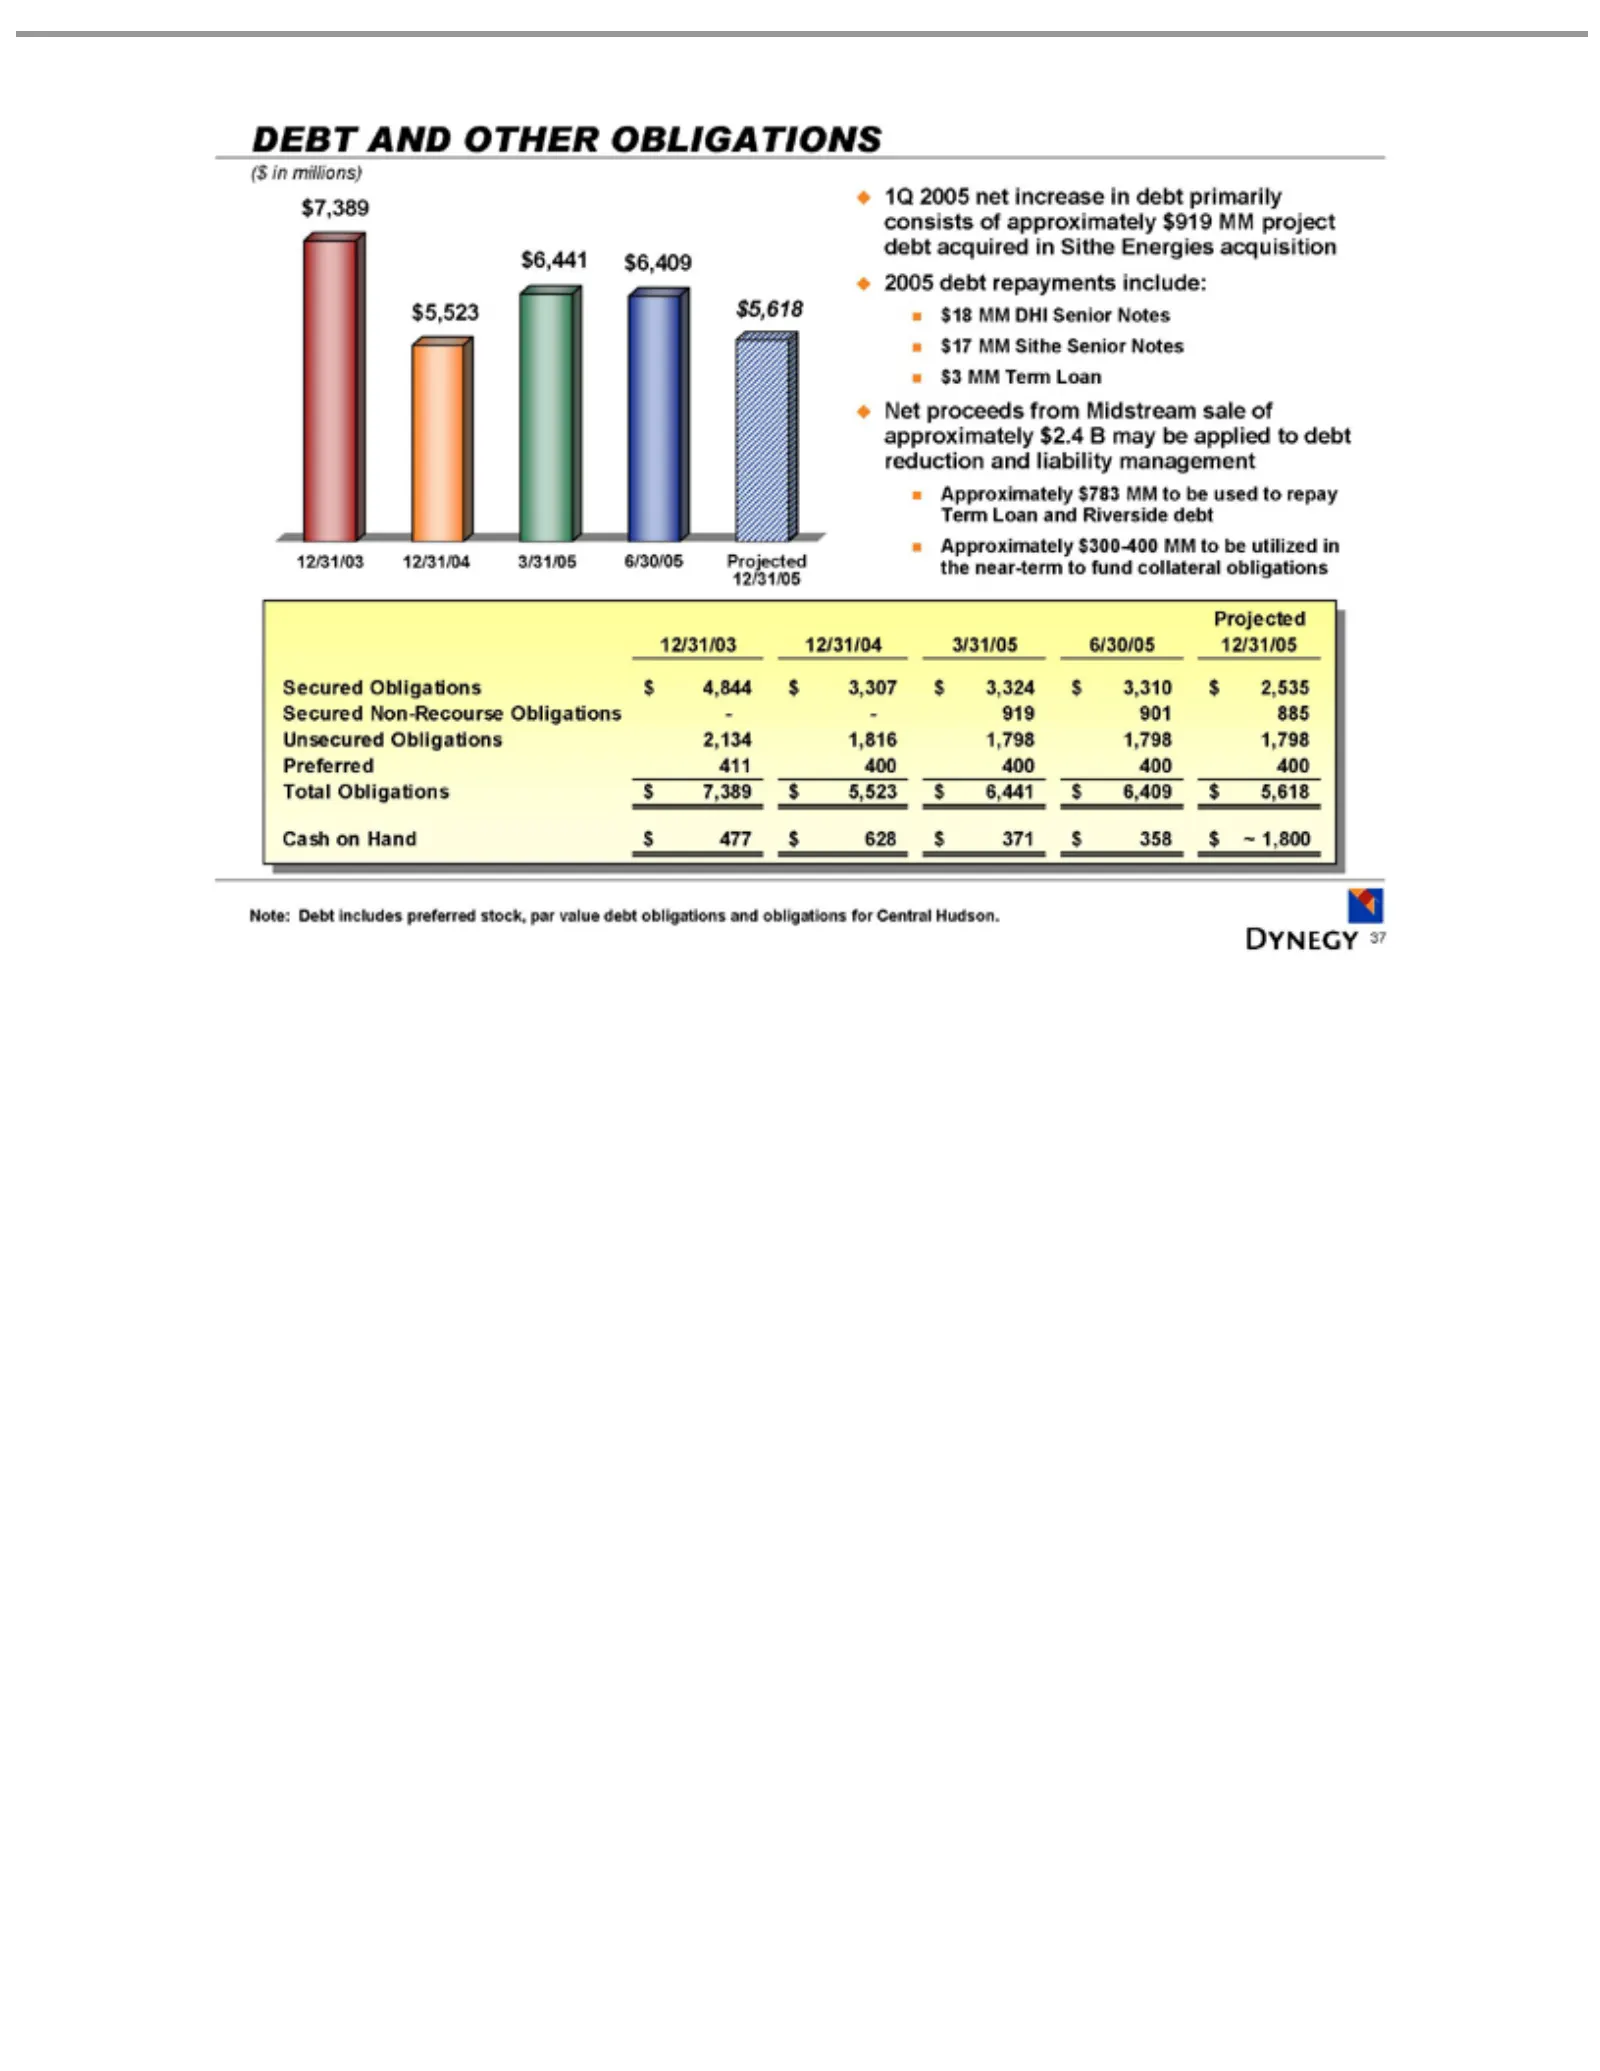
Slide 37: Debt and Other Obligations
DEBT ($ 1Q Sithe Net Approximately 12/31/03 Projected Secured Unsecured Preferred Total Cash Note: 37 in2005 proceeds millions) on Obligations Senior Debt AND Obligations Non-Recourse Hand net 12/31/04 411 Obligations includes Notes increase OTHER from 400 $477 $7,389 $783 $7,389 400 3/31/05 Midstre
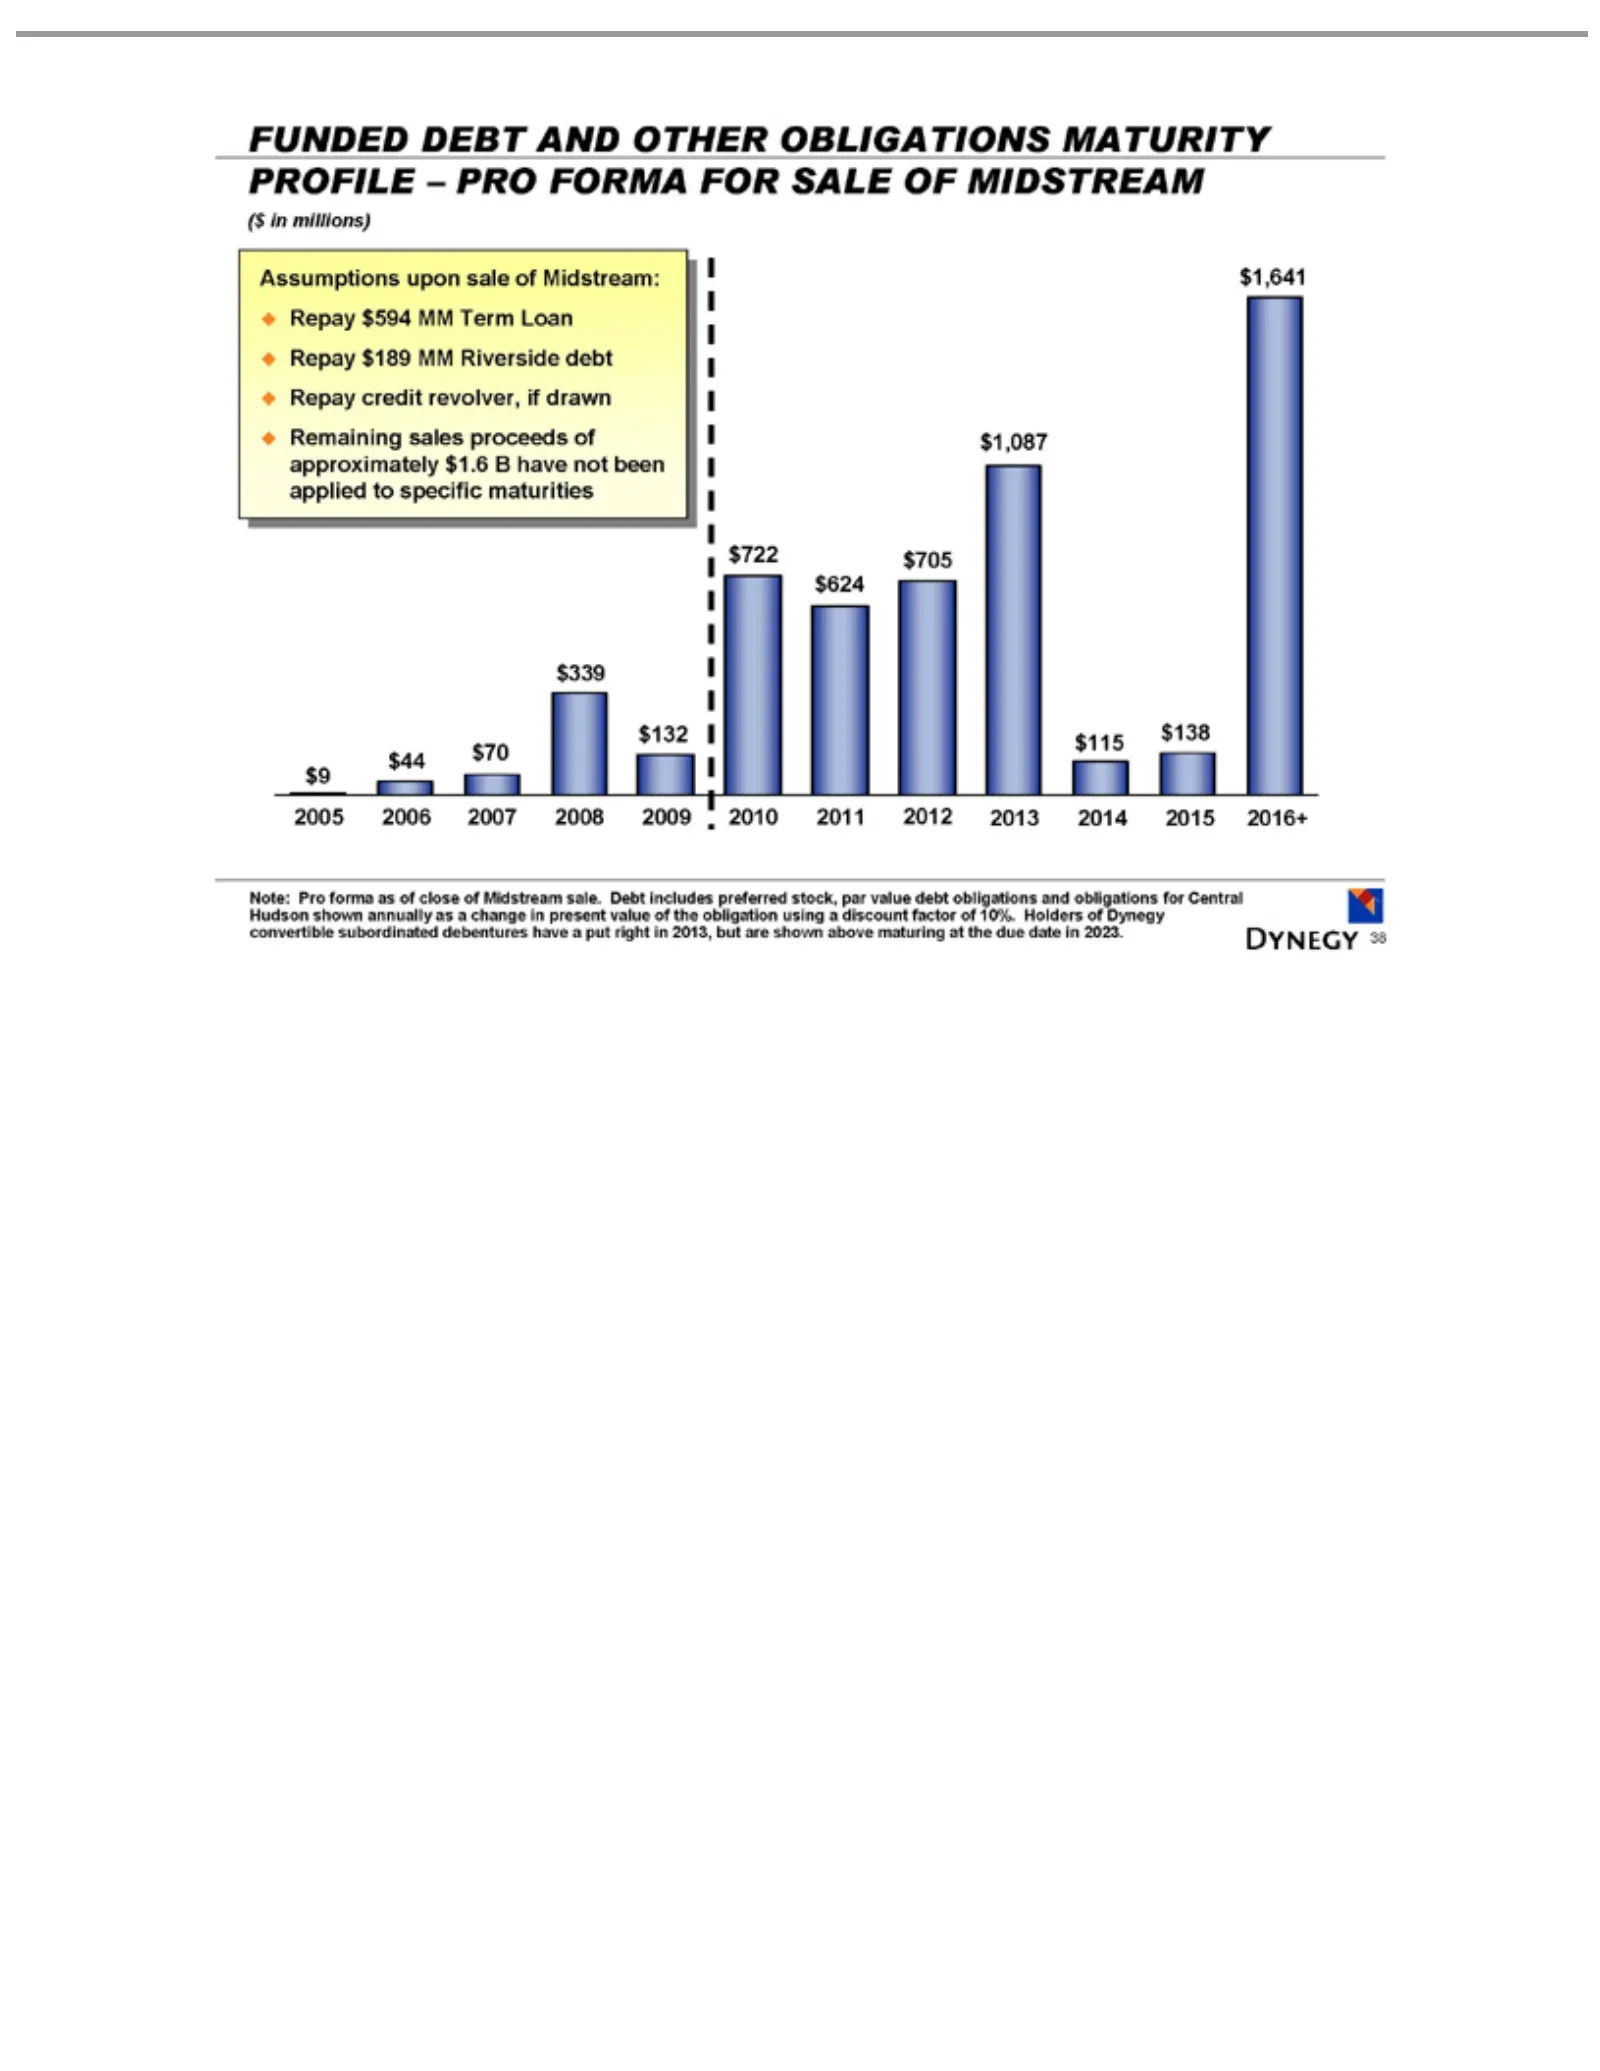
Slide 38: Debt and Other Obligations Maturity Profile Pro Forma
FUNDED ($ Assumptions Repay 2006 $44 2007 2008 2009 2010 2011 2012 2013 2014 2015 Note: 2016+ obligation 38 in millions) $705 $70 $339 $132 $722 $624 $1,087 $115 $138 $1,641 Pro $594 forma using DEBT MM upon aas Term AND discount sale of close Loan OTHER of Midstream: factor ofRepay Midstream OBLIGA
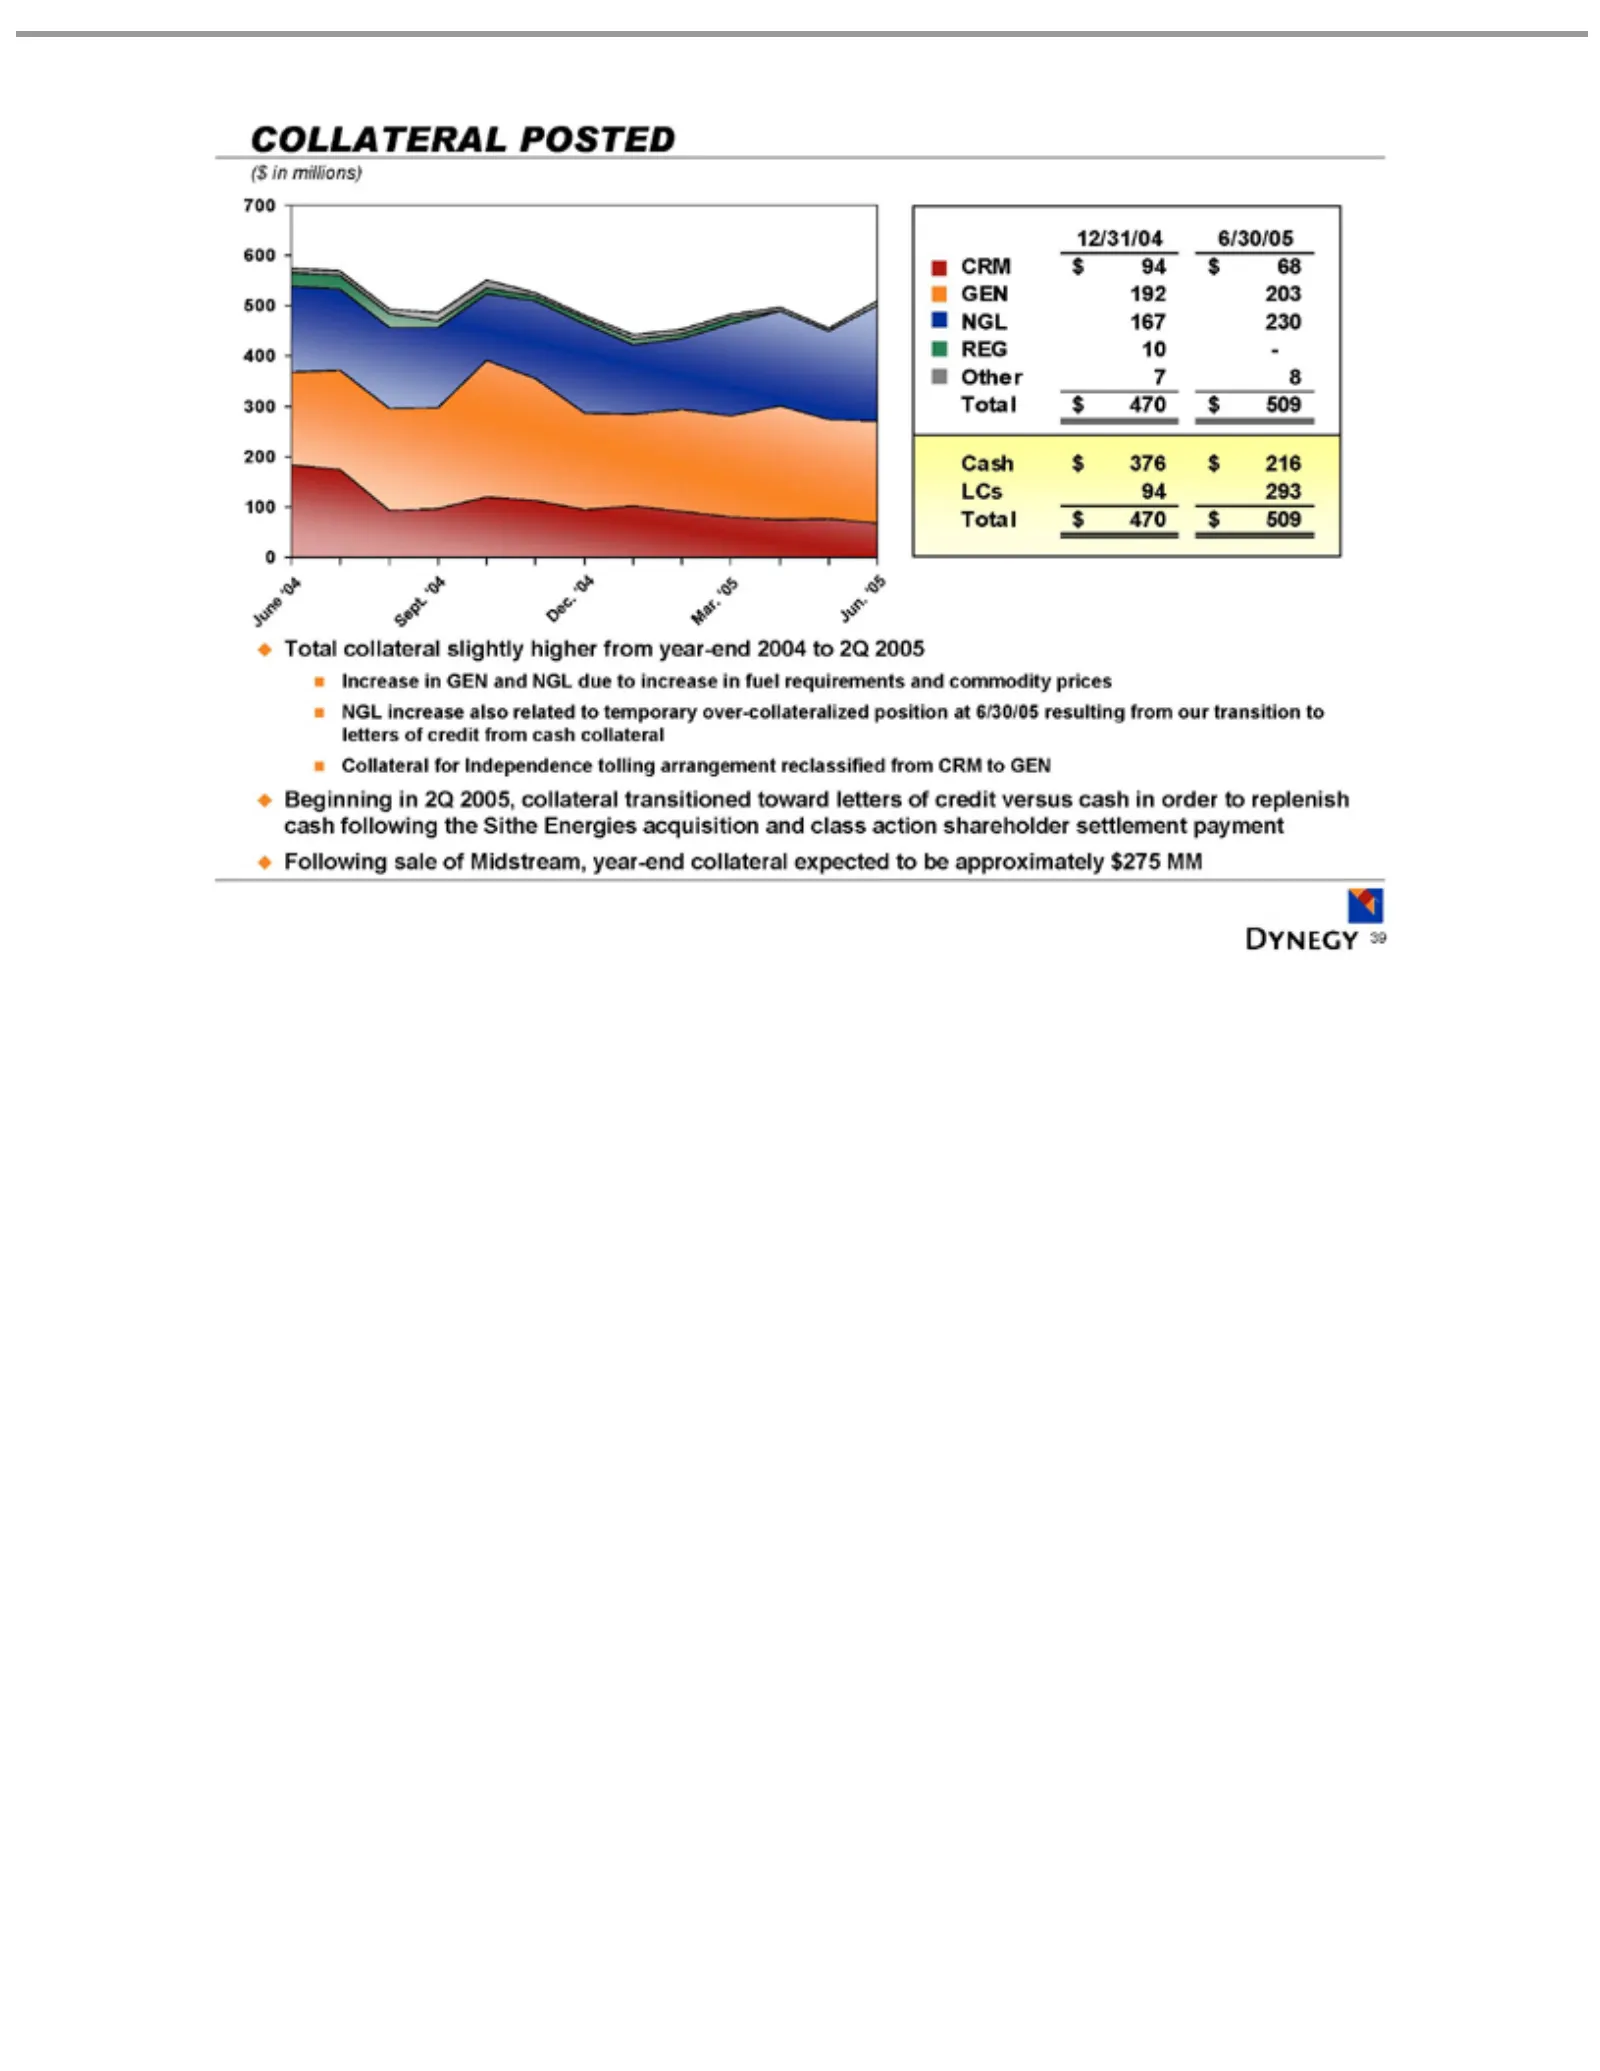
Slide 39: Collateral Posted
COLLATERAL ($ 700 June Sept. Dec. Mar. Jun. 12/31/04 CRM GEN REG Other Cash LCs Total Increase NGL reclassified Beginning Following 39 in600 ‘94 ‘04 ‘millions) 10 $376 167 increase ‘04 $470 collateral 192 05 $94 704 05 293 8-500 in 6/30/05 230 203 $68 sale in $216 $509 GEN from 400 2Q also of slight
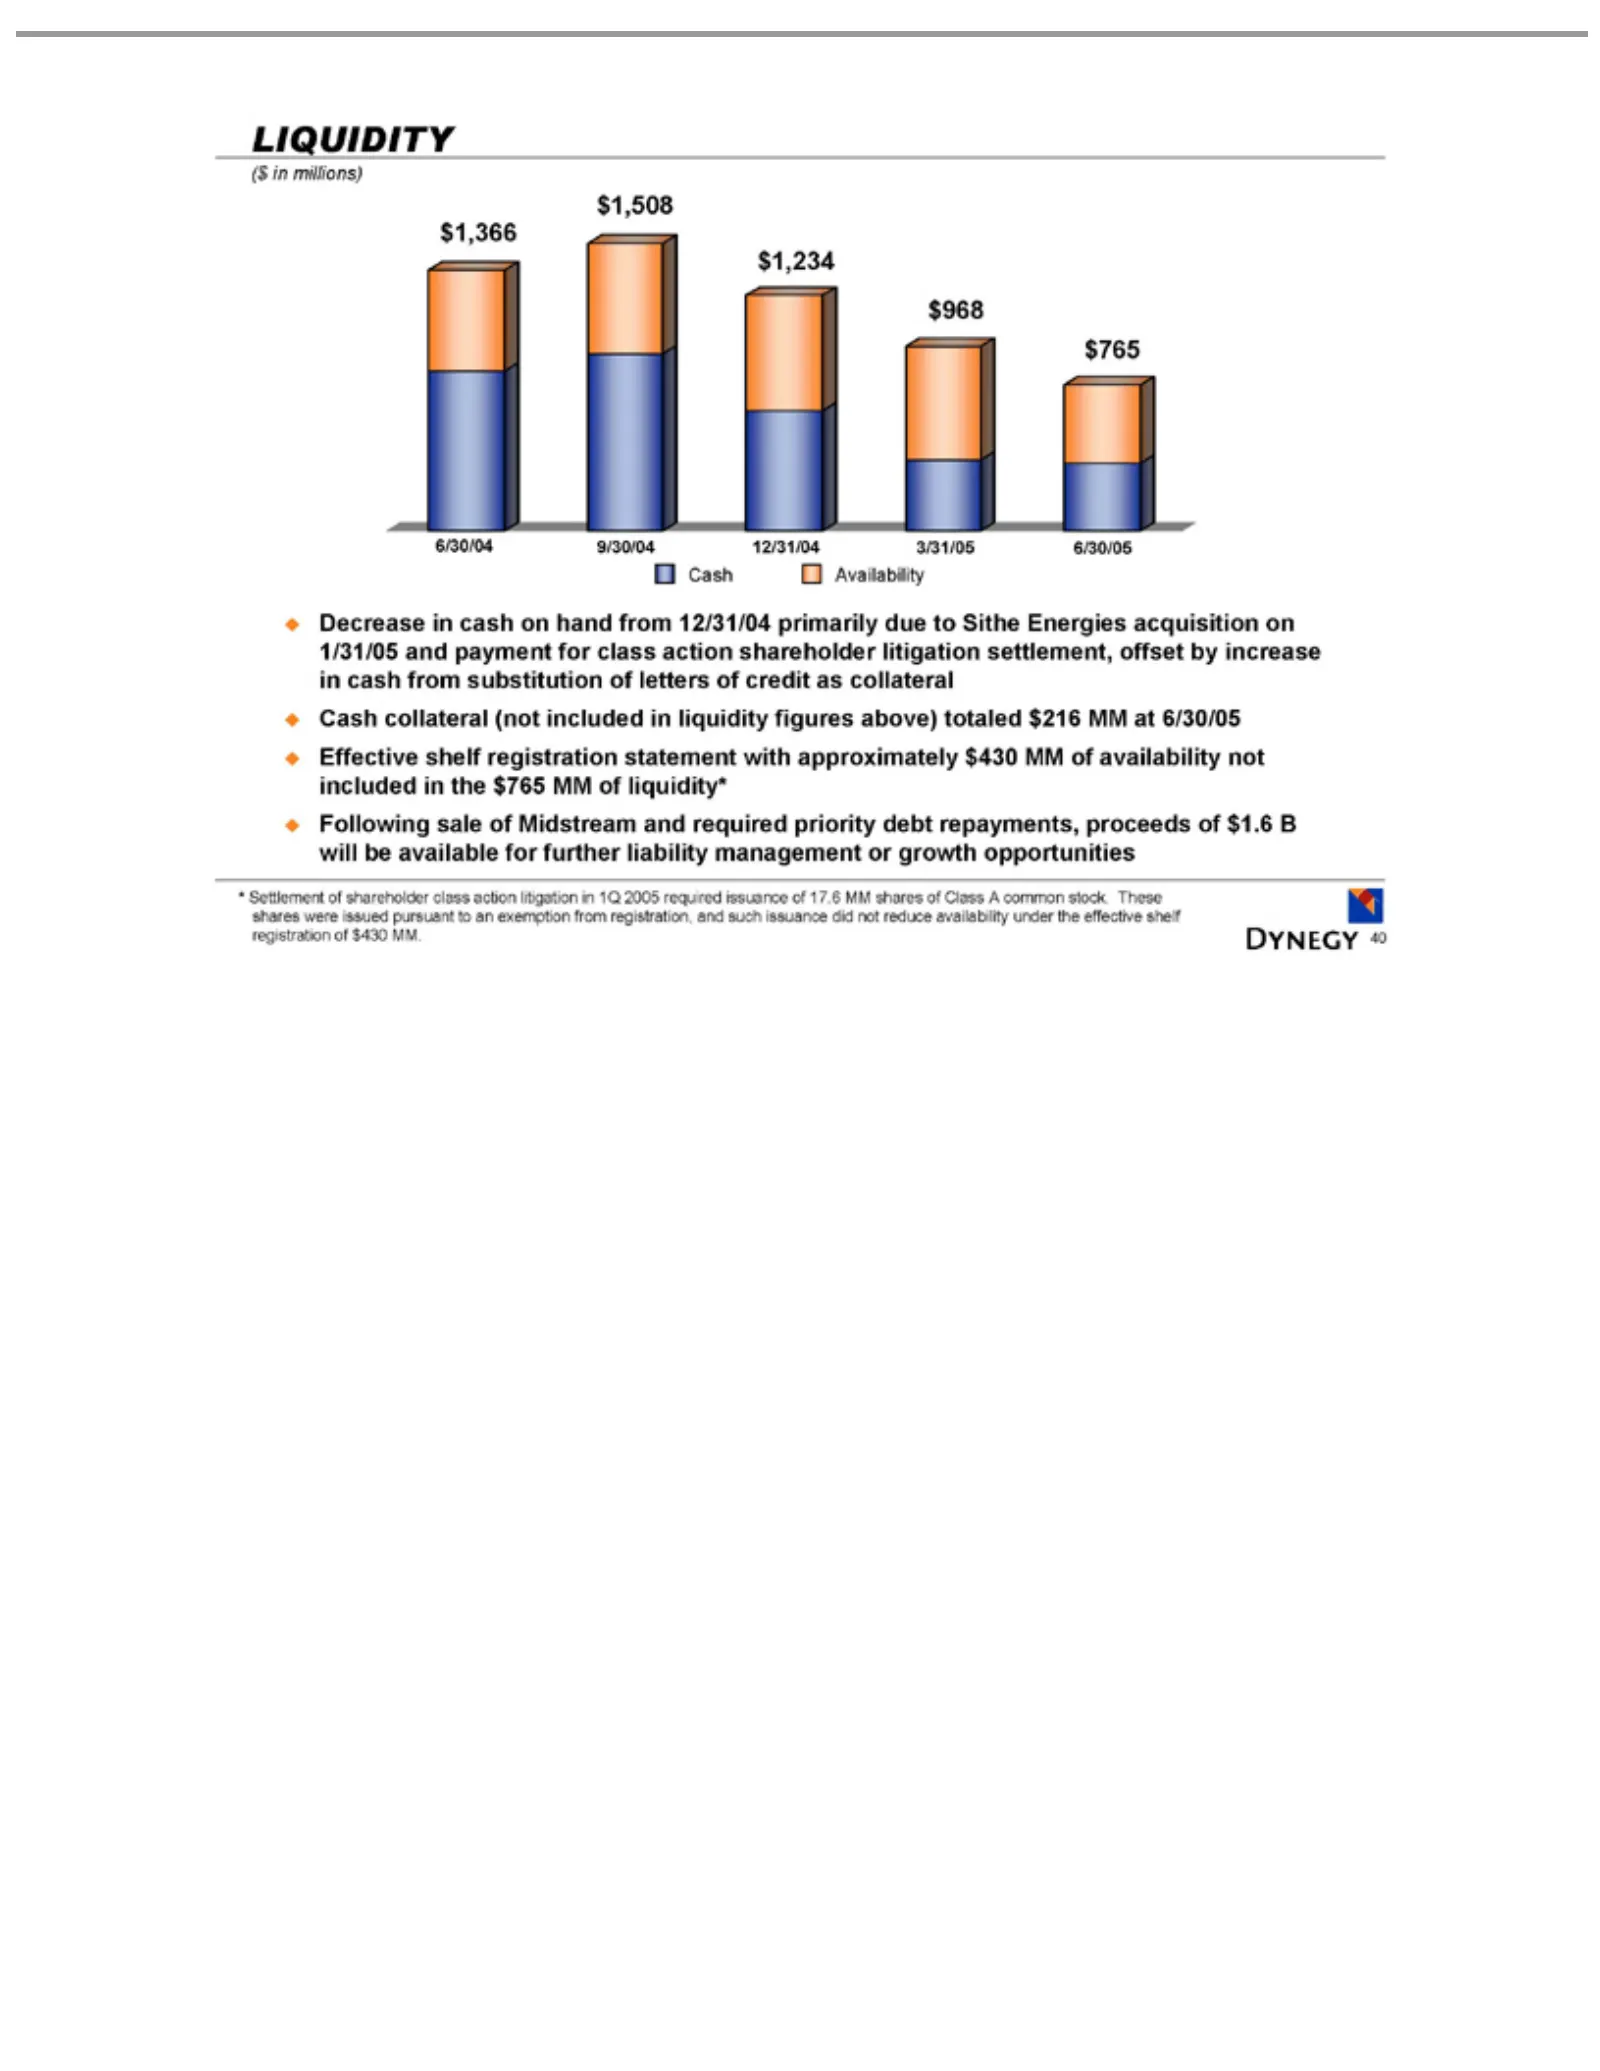
Slide 40: Liquidity
($Settlement LIQUIDITY 6/30/04 9/30/04 12/31/04 3/31/05 Cash 6/30/05 Decrease substitution availability growth * such 40 in issuance millions) Availability opportunities $1,508 $1,234 $765 $968 in not of cash ofdid $1,366 letters included shareholder on nothand of reduce credit infrom the class avai
Slide 41: GAAP Reconciliation: Earnings Guidance
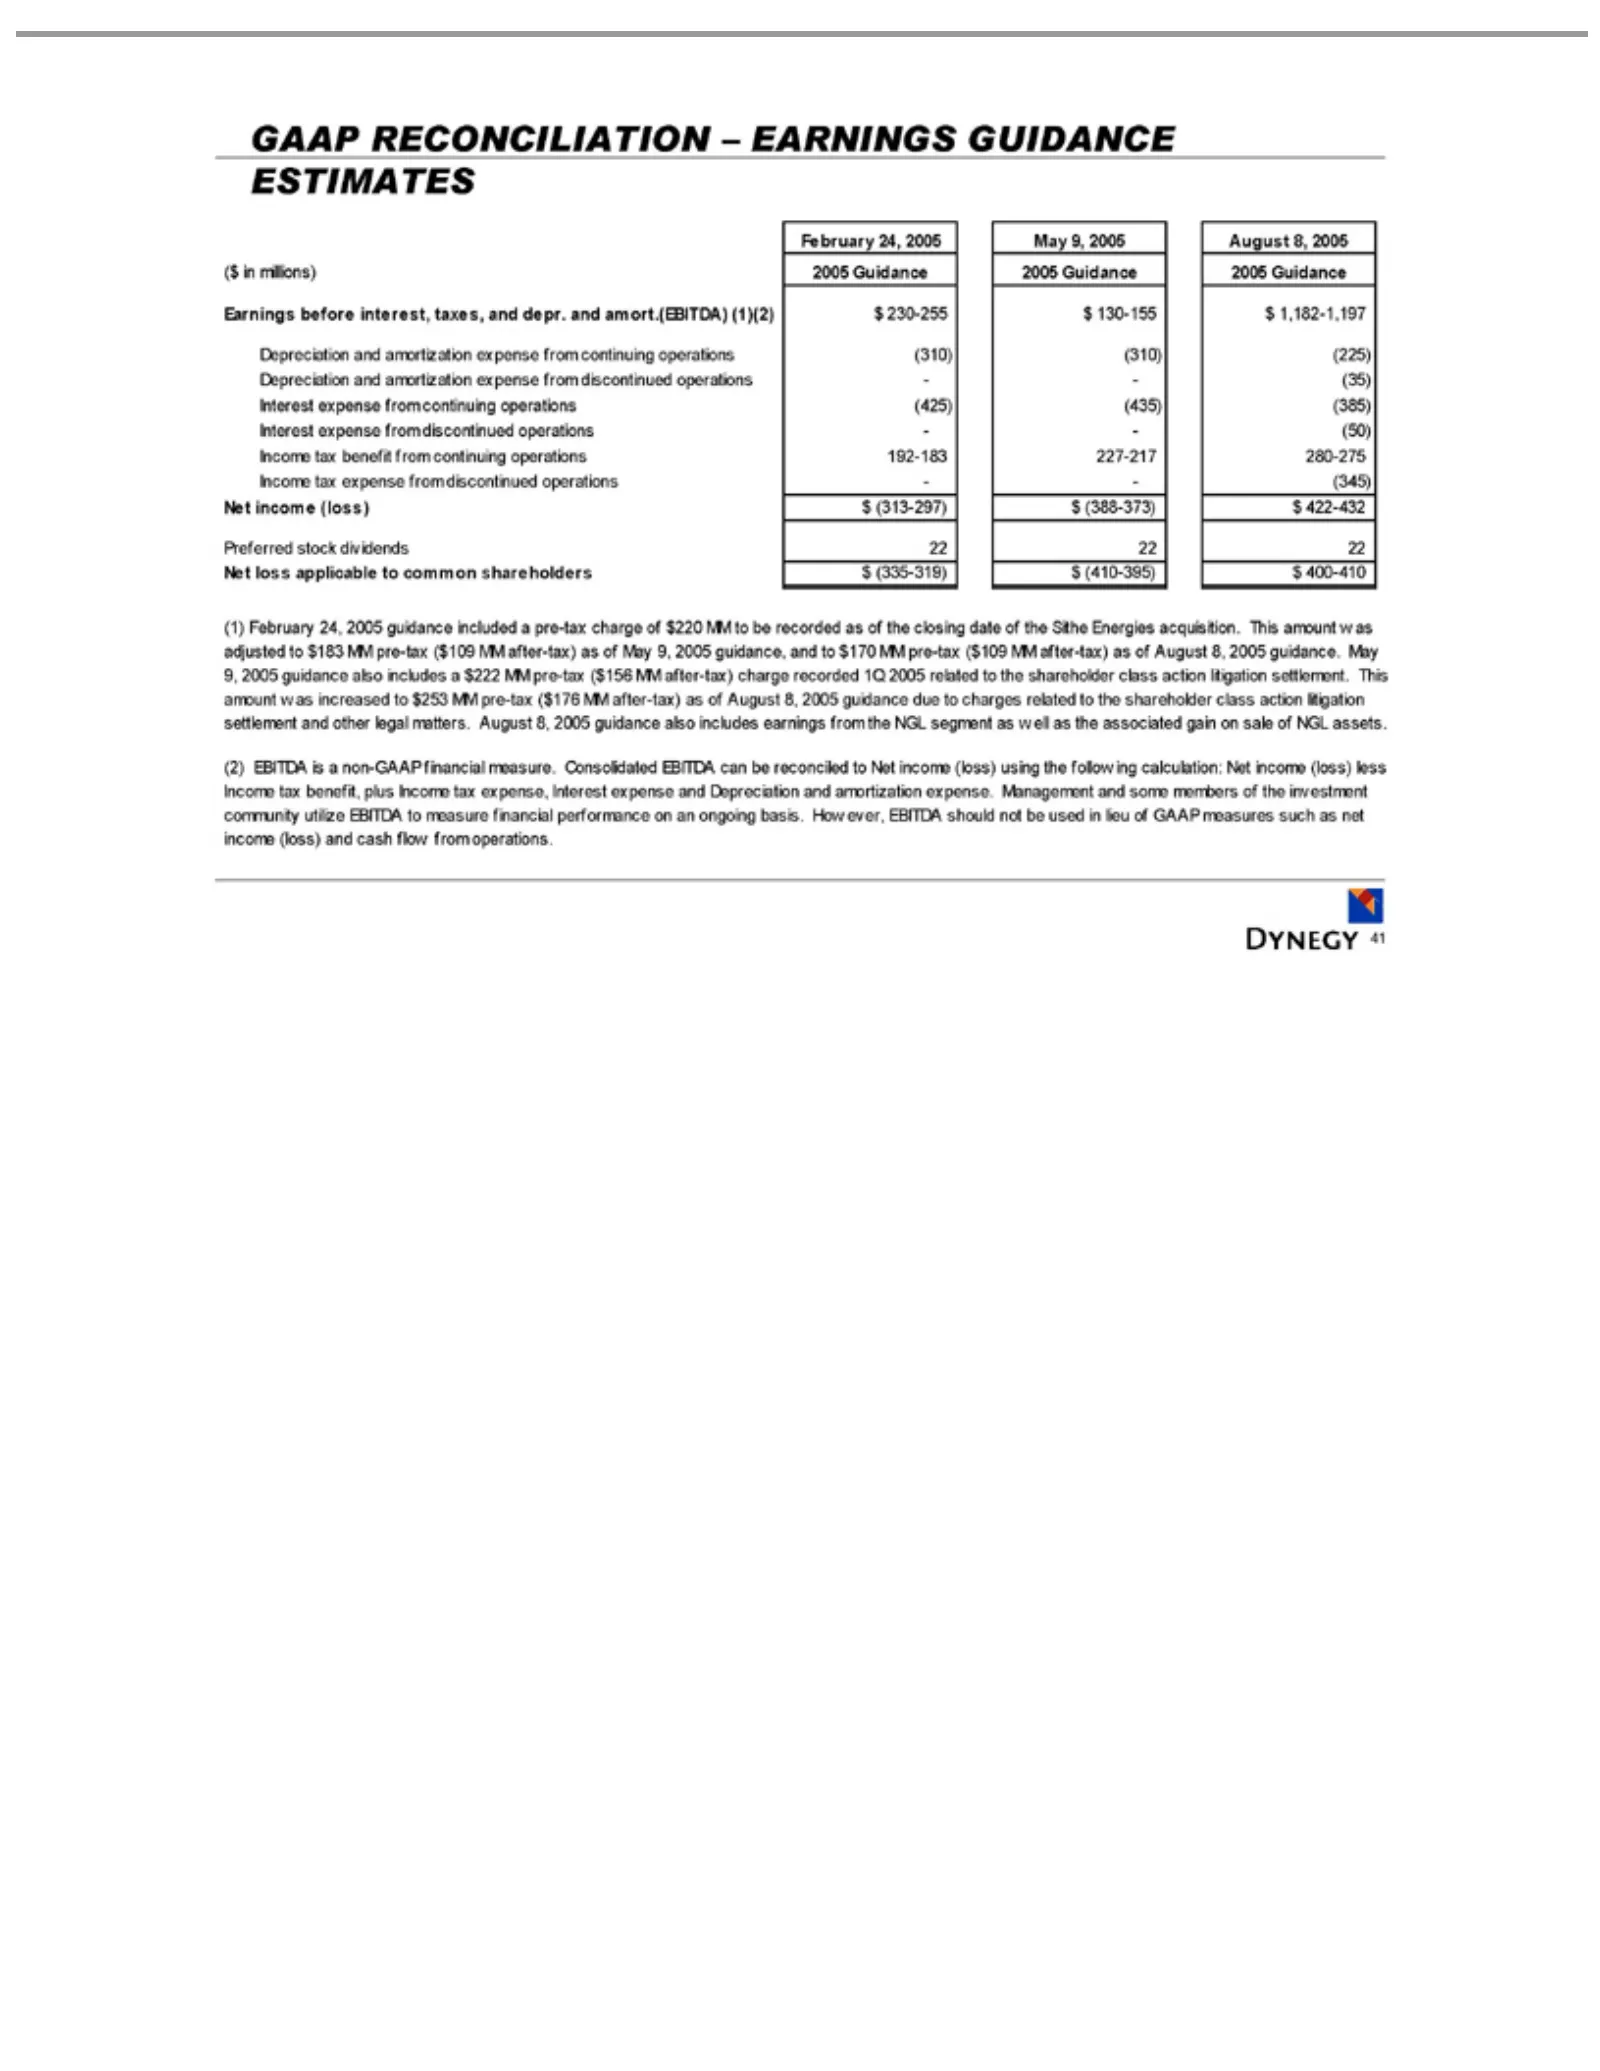
GAAP February ($ Earnings Depreciation Interest Income Preferred Net (1) MM charge charges of (2) tax ongoing 41 inEBITDA NGL February expense, income loss after-tax) millions) recorded RECONCILIATION expense tax related assets. applicable basis. before 24, stock benefit expense (loss) Interest 24,
Slide 42: GAAP Reconciliation: Three Months Ended June 30
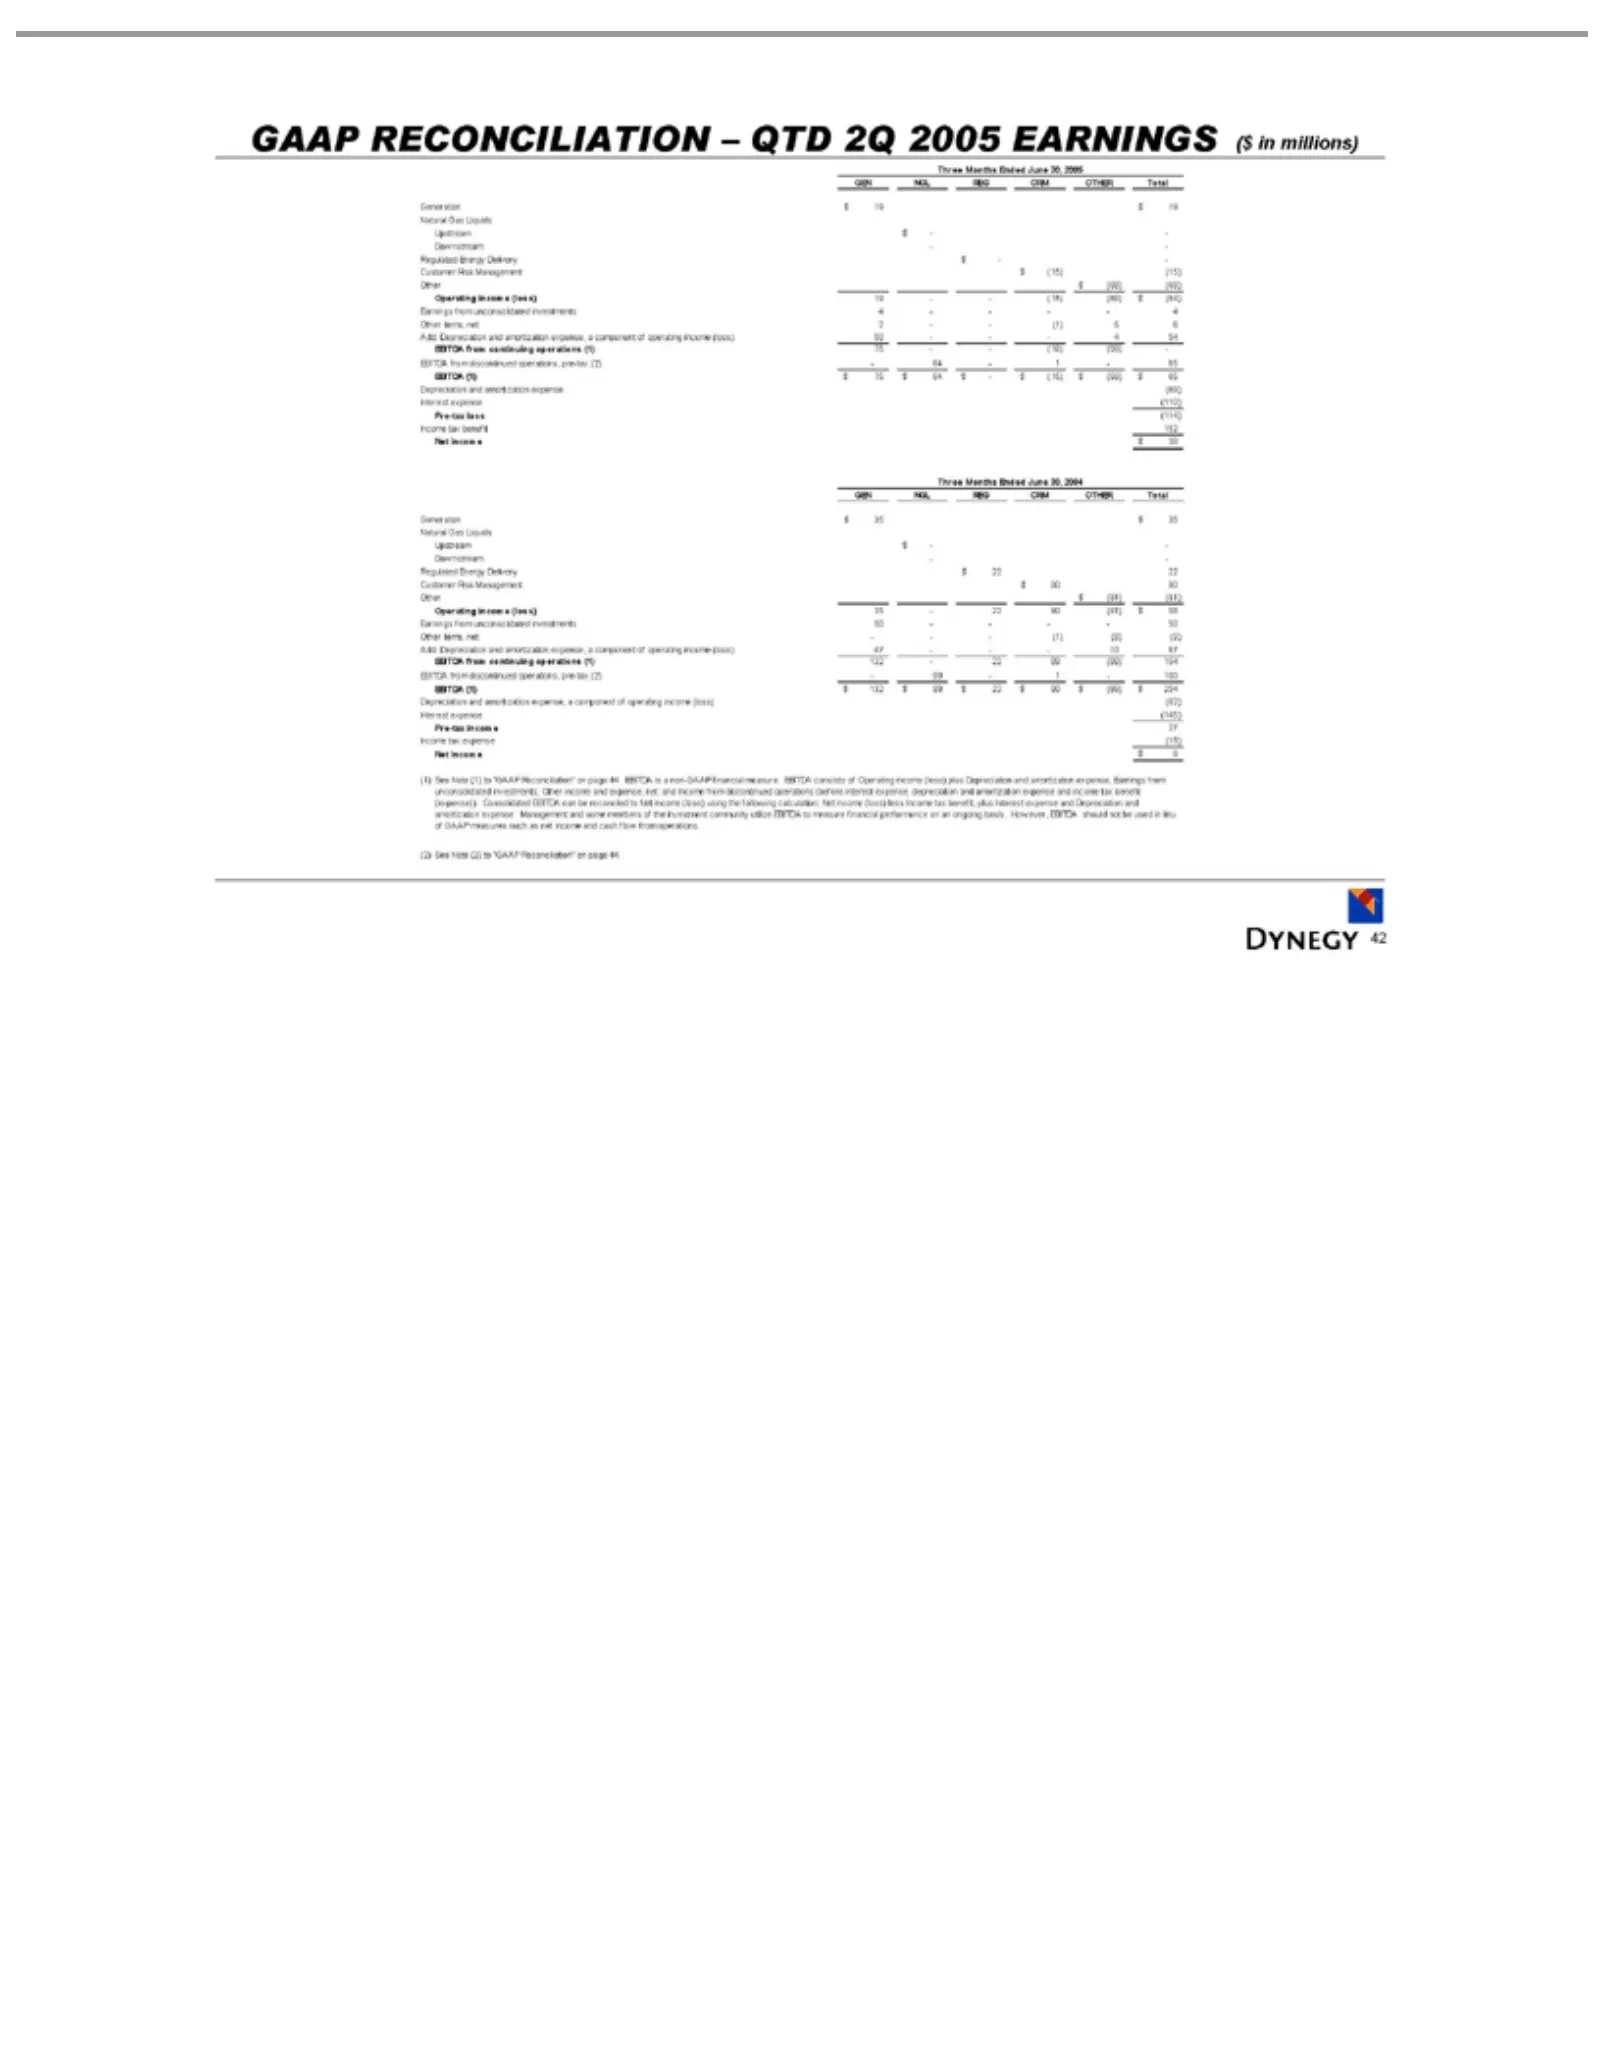
GAAP Downstream Three GEN Generation Natural Upstream Dow Regulated Customer Operating Other Add: EBITDA Depreciation Interest Pre-tax Income Net (1) Earnings benefit and used (2) 42 See income amortization in nstream Depreciation NGL $(68) $(91) items, Months RECONCILIATION (expense)). Note lieu lo
Slide 43: GAAP Reconciliation: Six Months Ended June 30
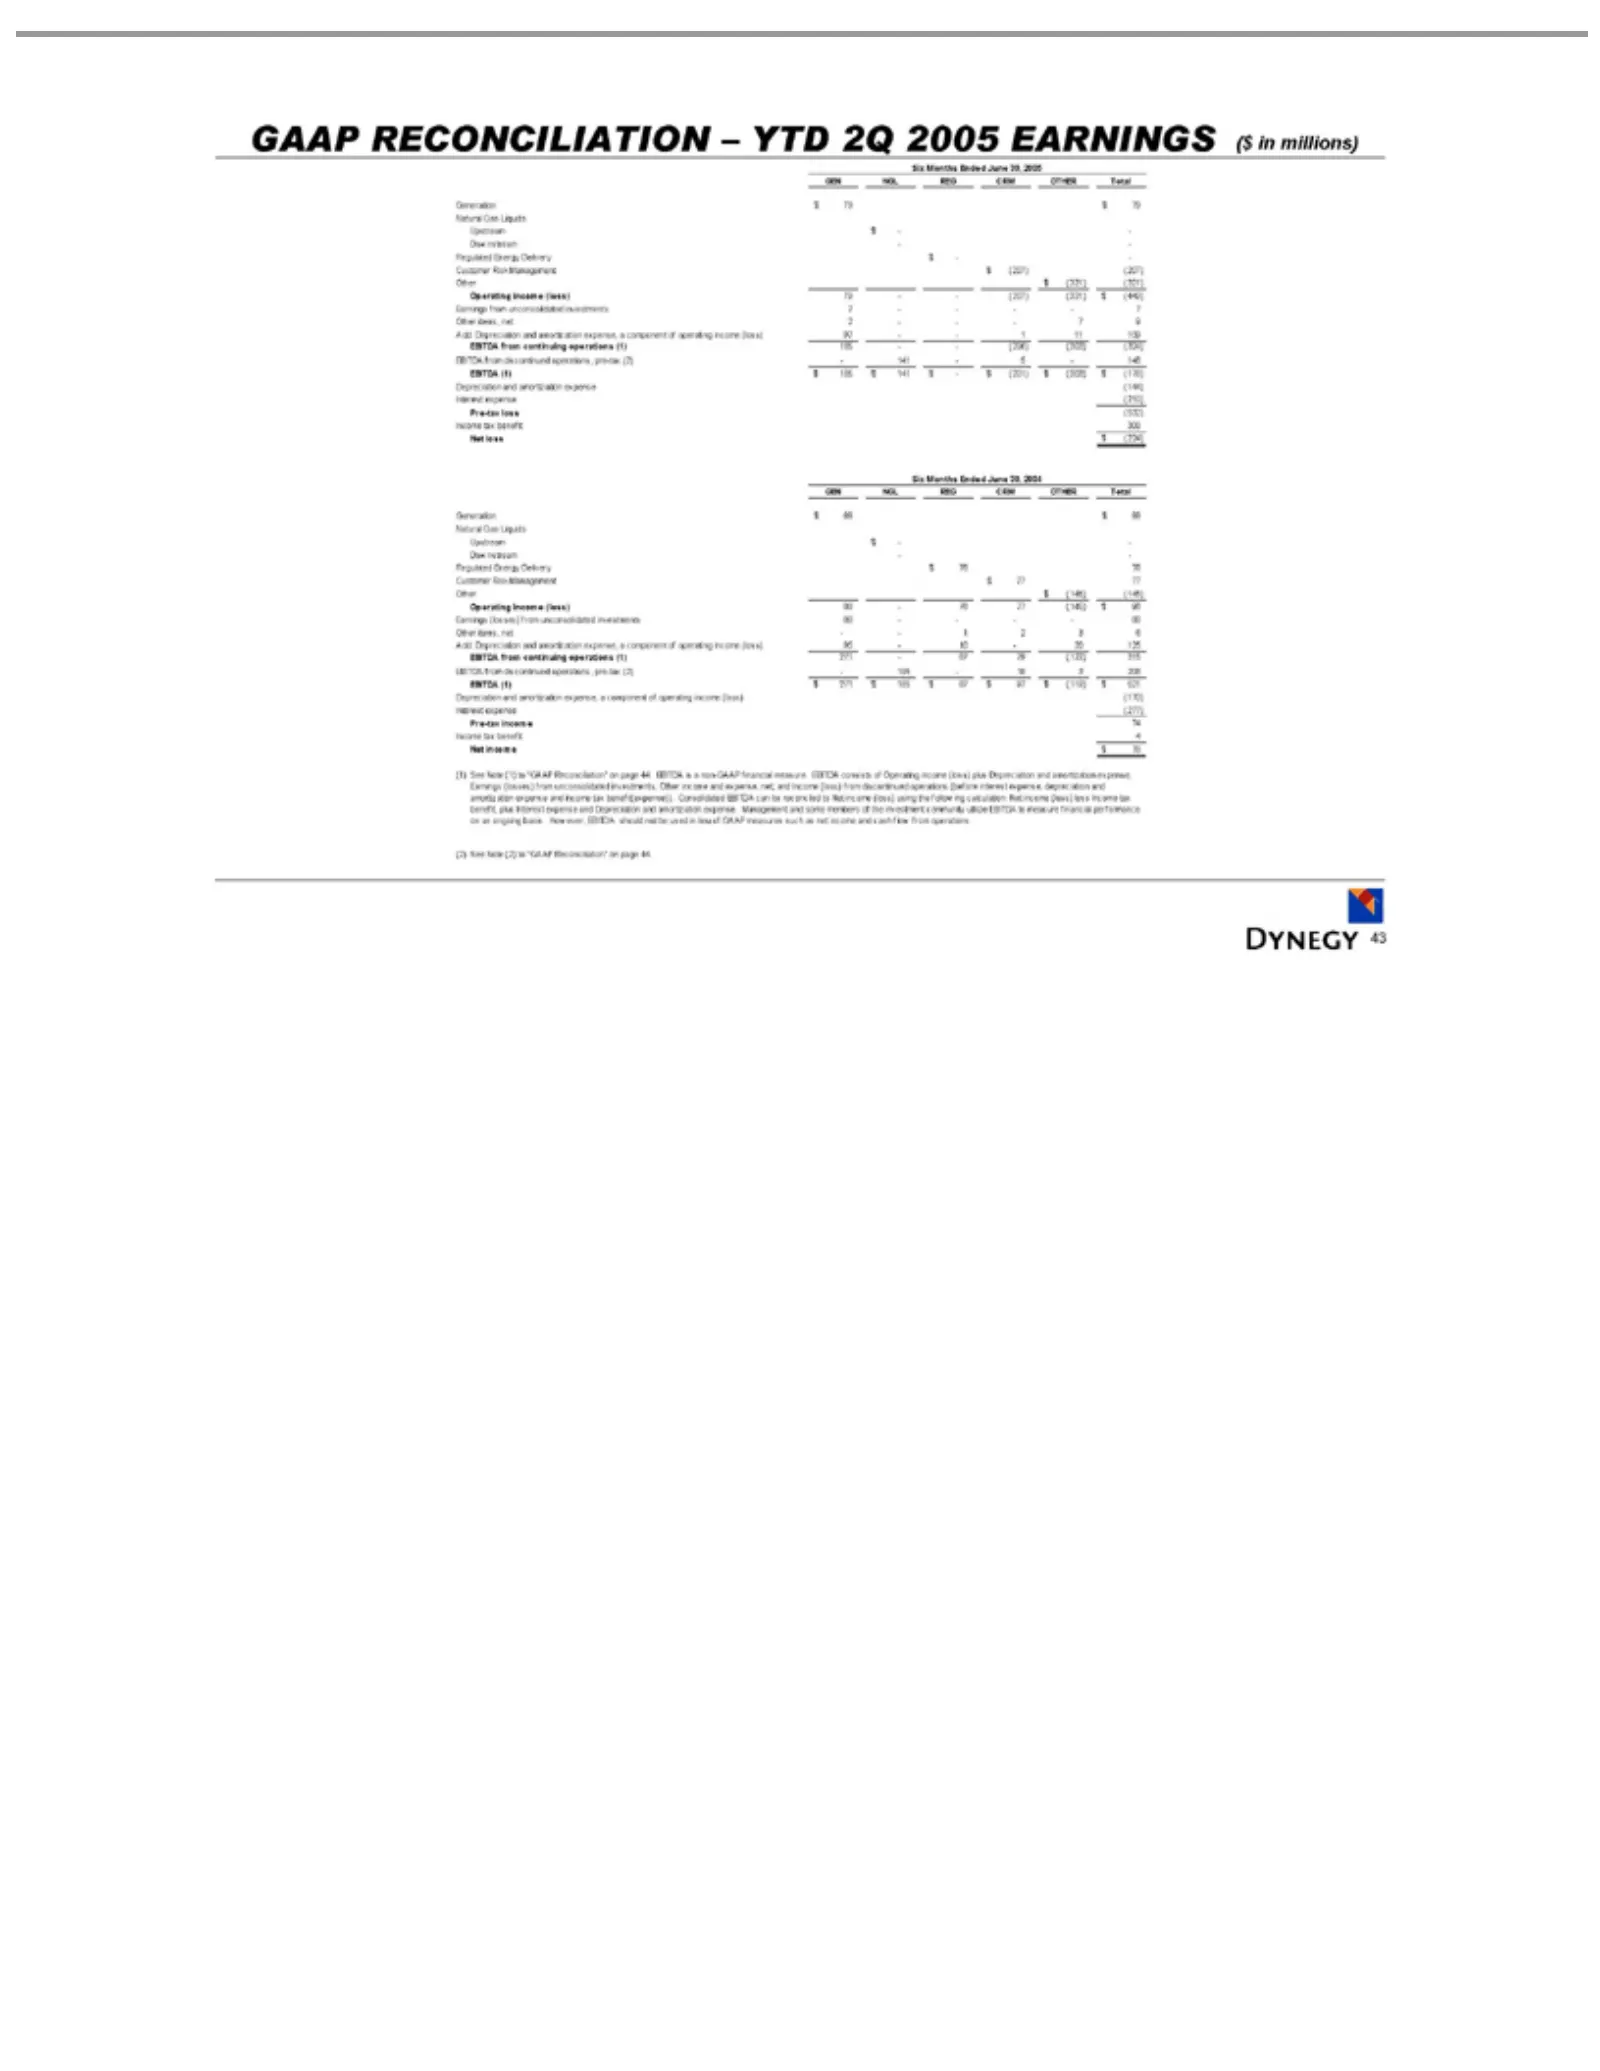
GAAP Six GEN Generation Natural Upstream Downstream Regulated Customer Operating Other Add: EBITDA Interest Pre-tax Income Net (1) Earnings and Depreciation should (2) 43 See Months loss income Depreciation NGL $(321) $(145) items, not RECONCILIATION Note loss income Gas expense tax $(224) from (los
Slide 44: GAAP Reconciliation: EBITDA
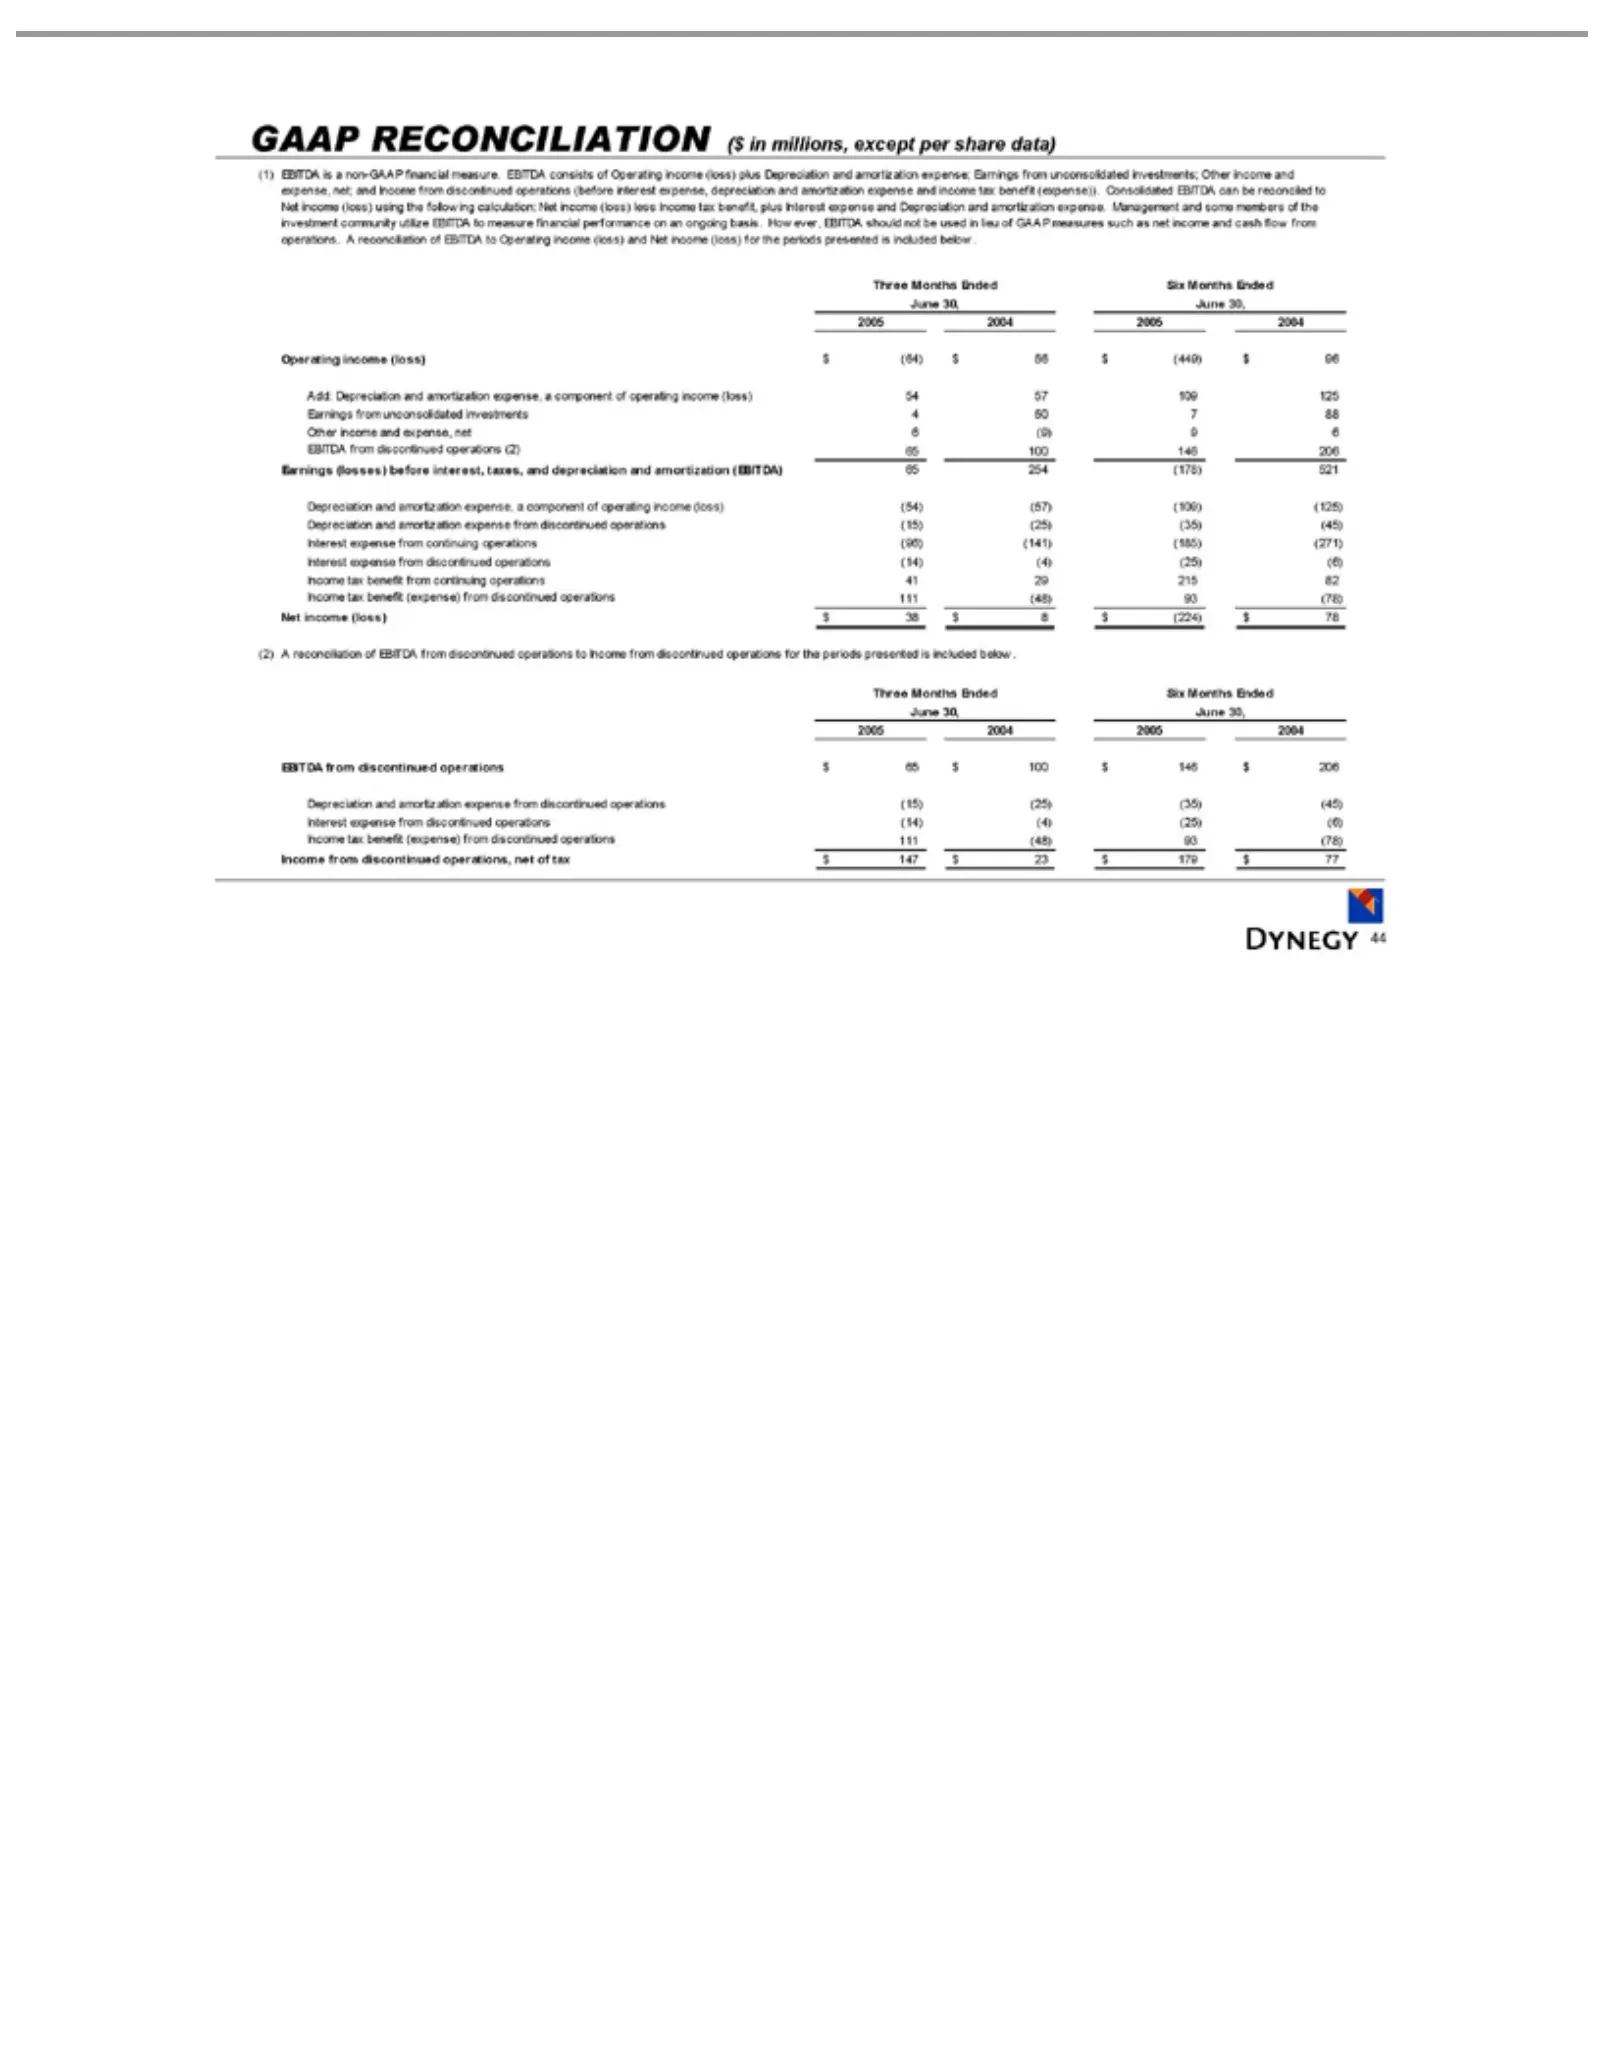
GAAP (1) reconciled members and Operating Add: Other Earnings Net (2) Three June 2005 EBITDA Depreciation Interest Income 44 A EBITDA expense, cash income 30, Depreciation 2004 reconciliation income Months RECONCILIATION expense tax from June flow from (losses) ofincome to 2005 benefit (loss) the is
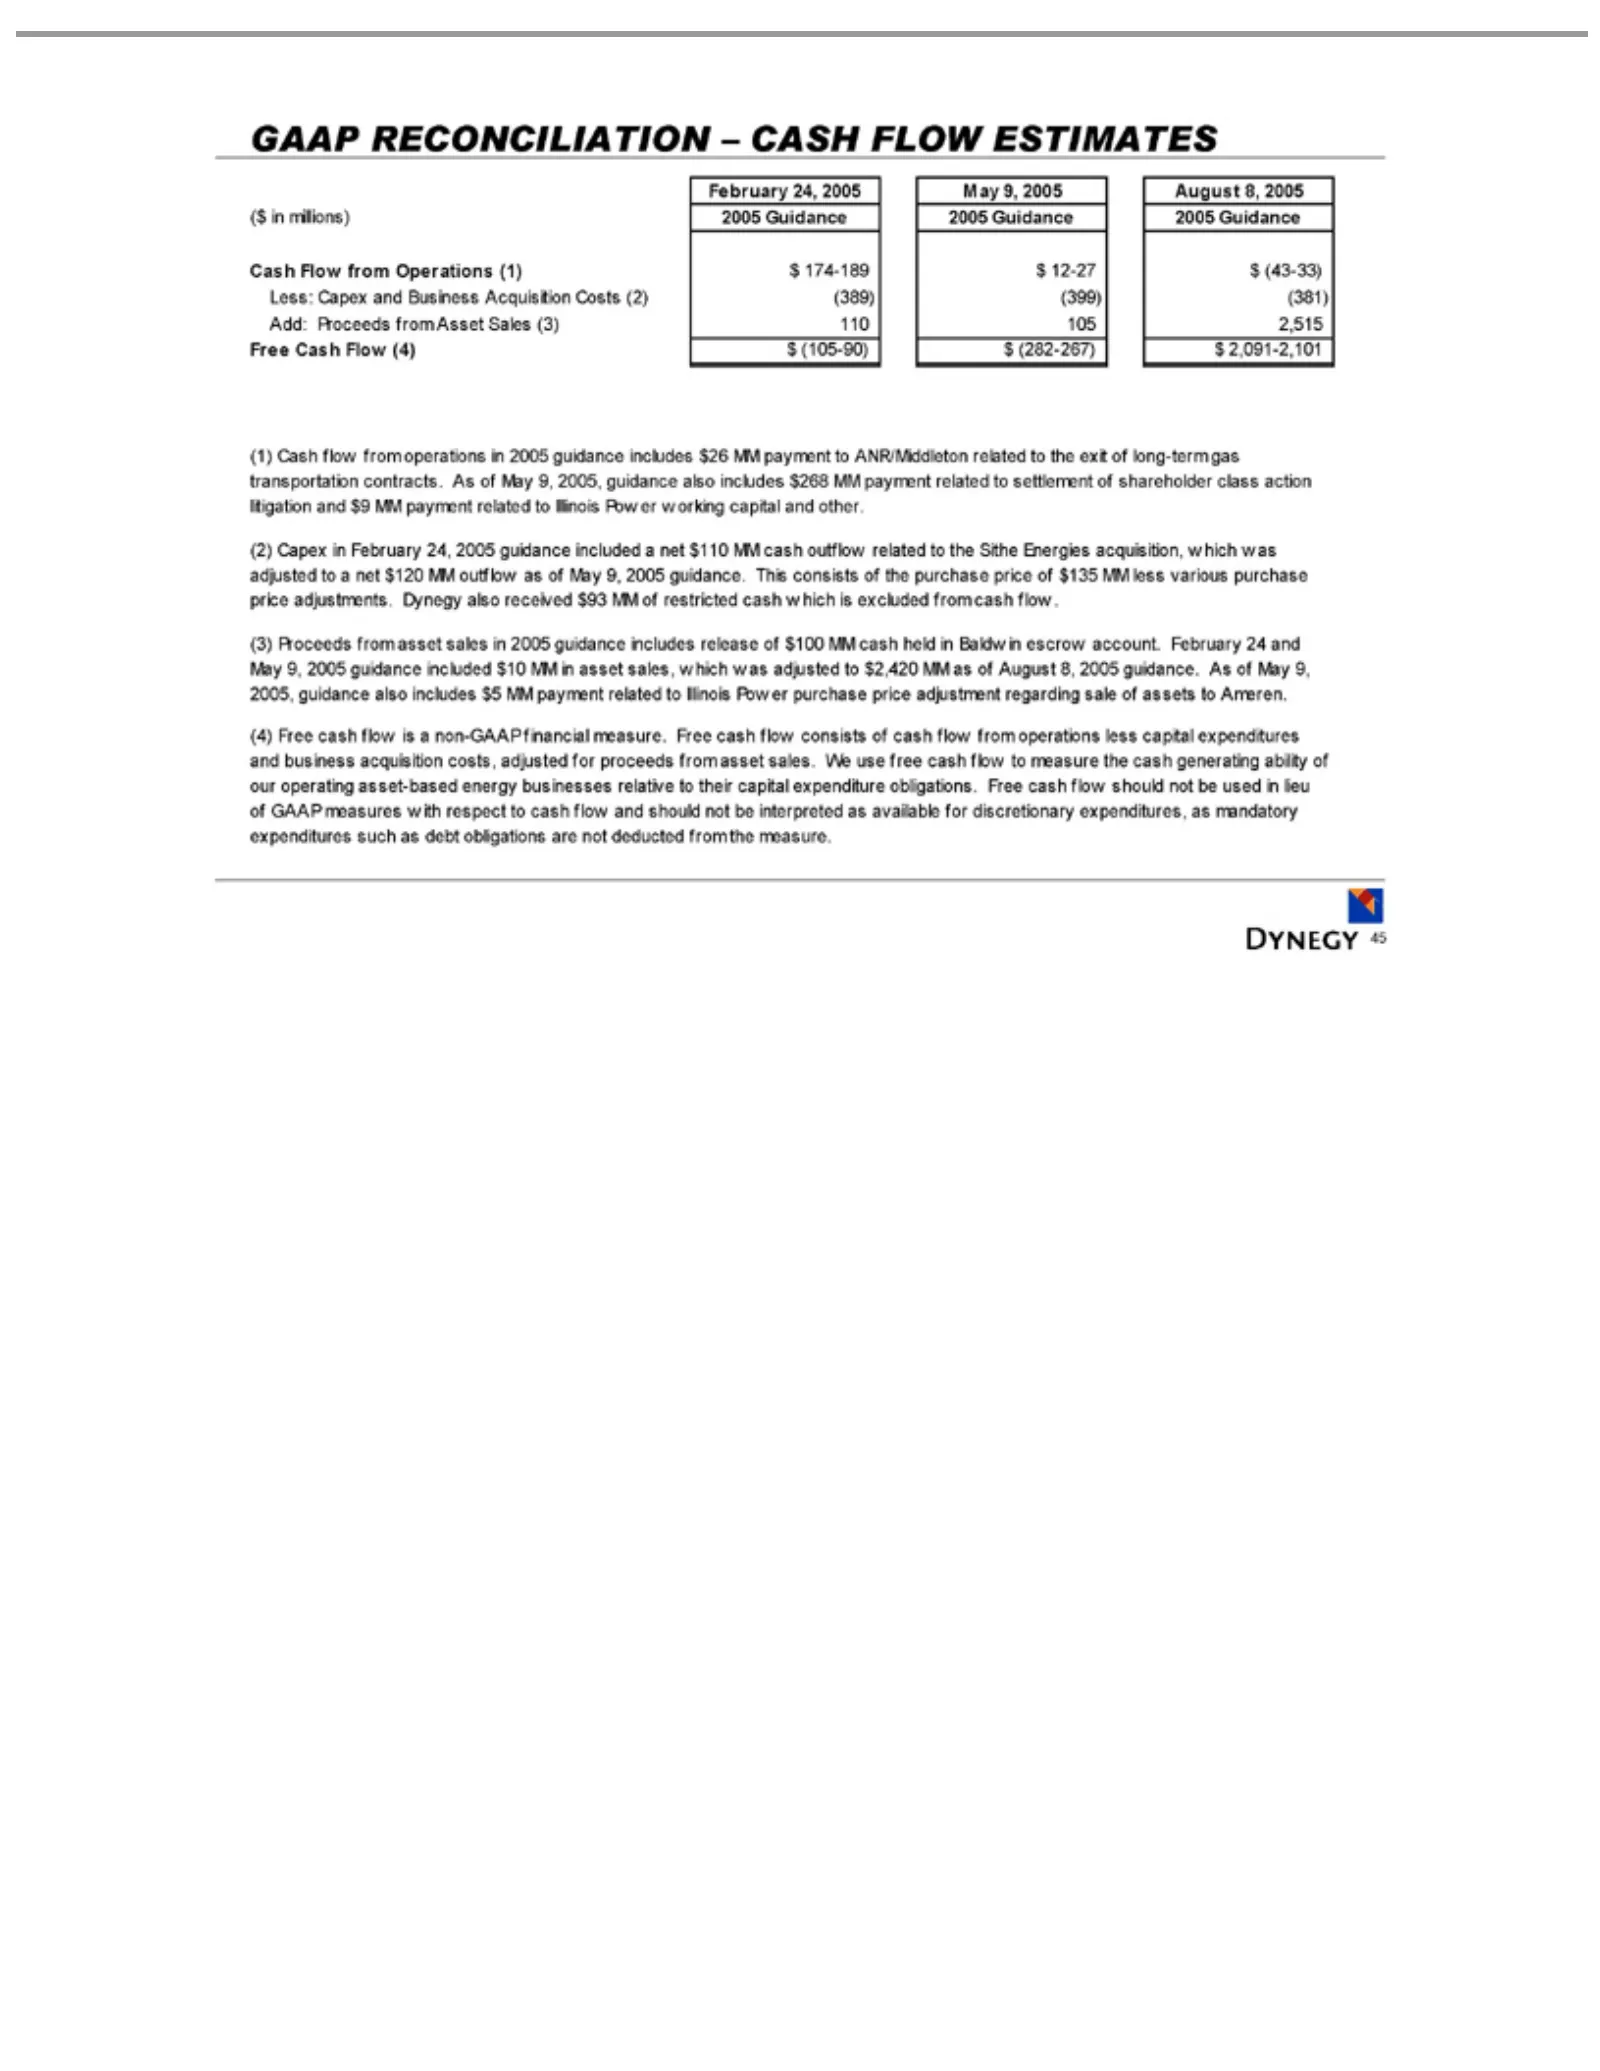
Slide 45: GAAP Reconciliation: Cash Flow Estimates
GAAP February ($ Cash Less: Add: Free (1) $268 (2) This (3) adjusted (4) Ameren. sales. lieu the 45 inFree Cash Capex Proceeds measure. of Cash consists millions) Proceeds MM Flow Capex We GAAP RECONCILIATION cash to flow 24, use in Flow payment from $2,420 and February from 2005 of flow free from m
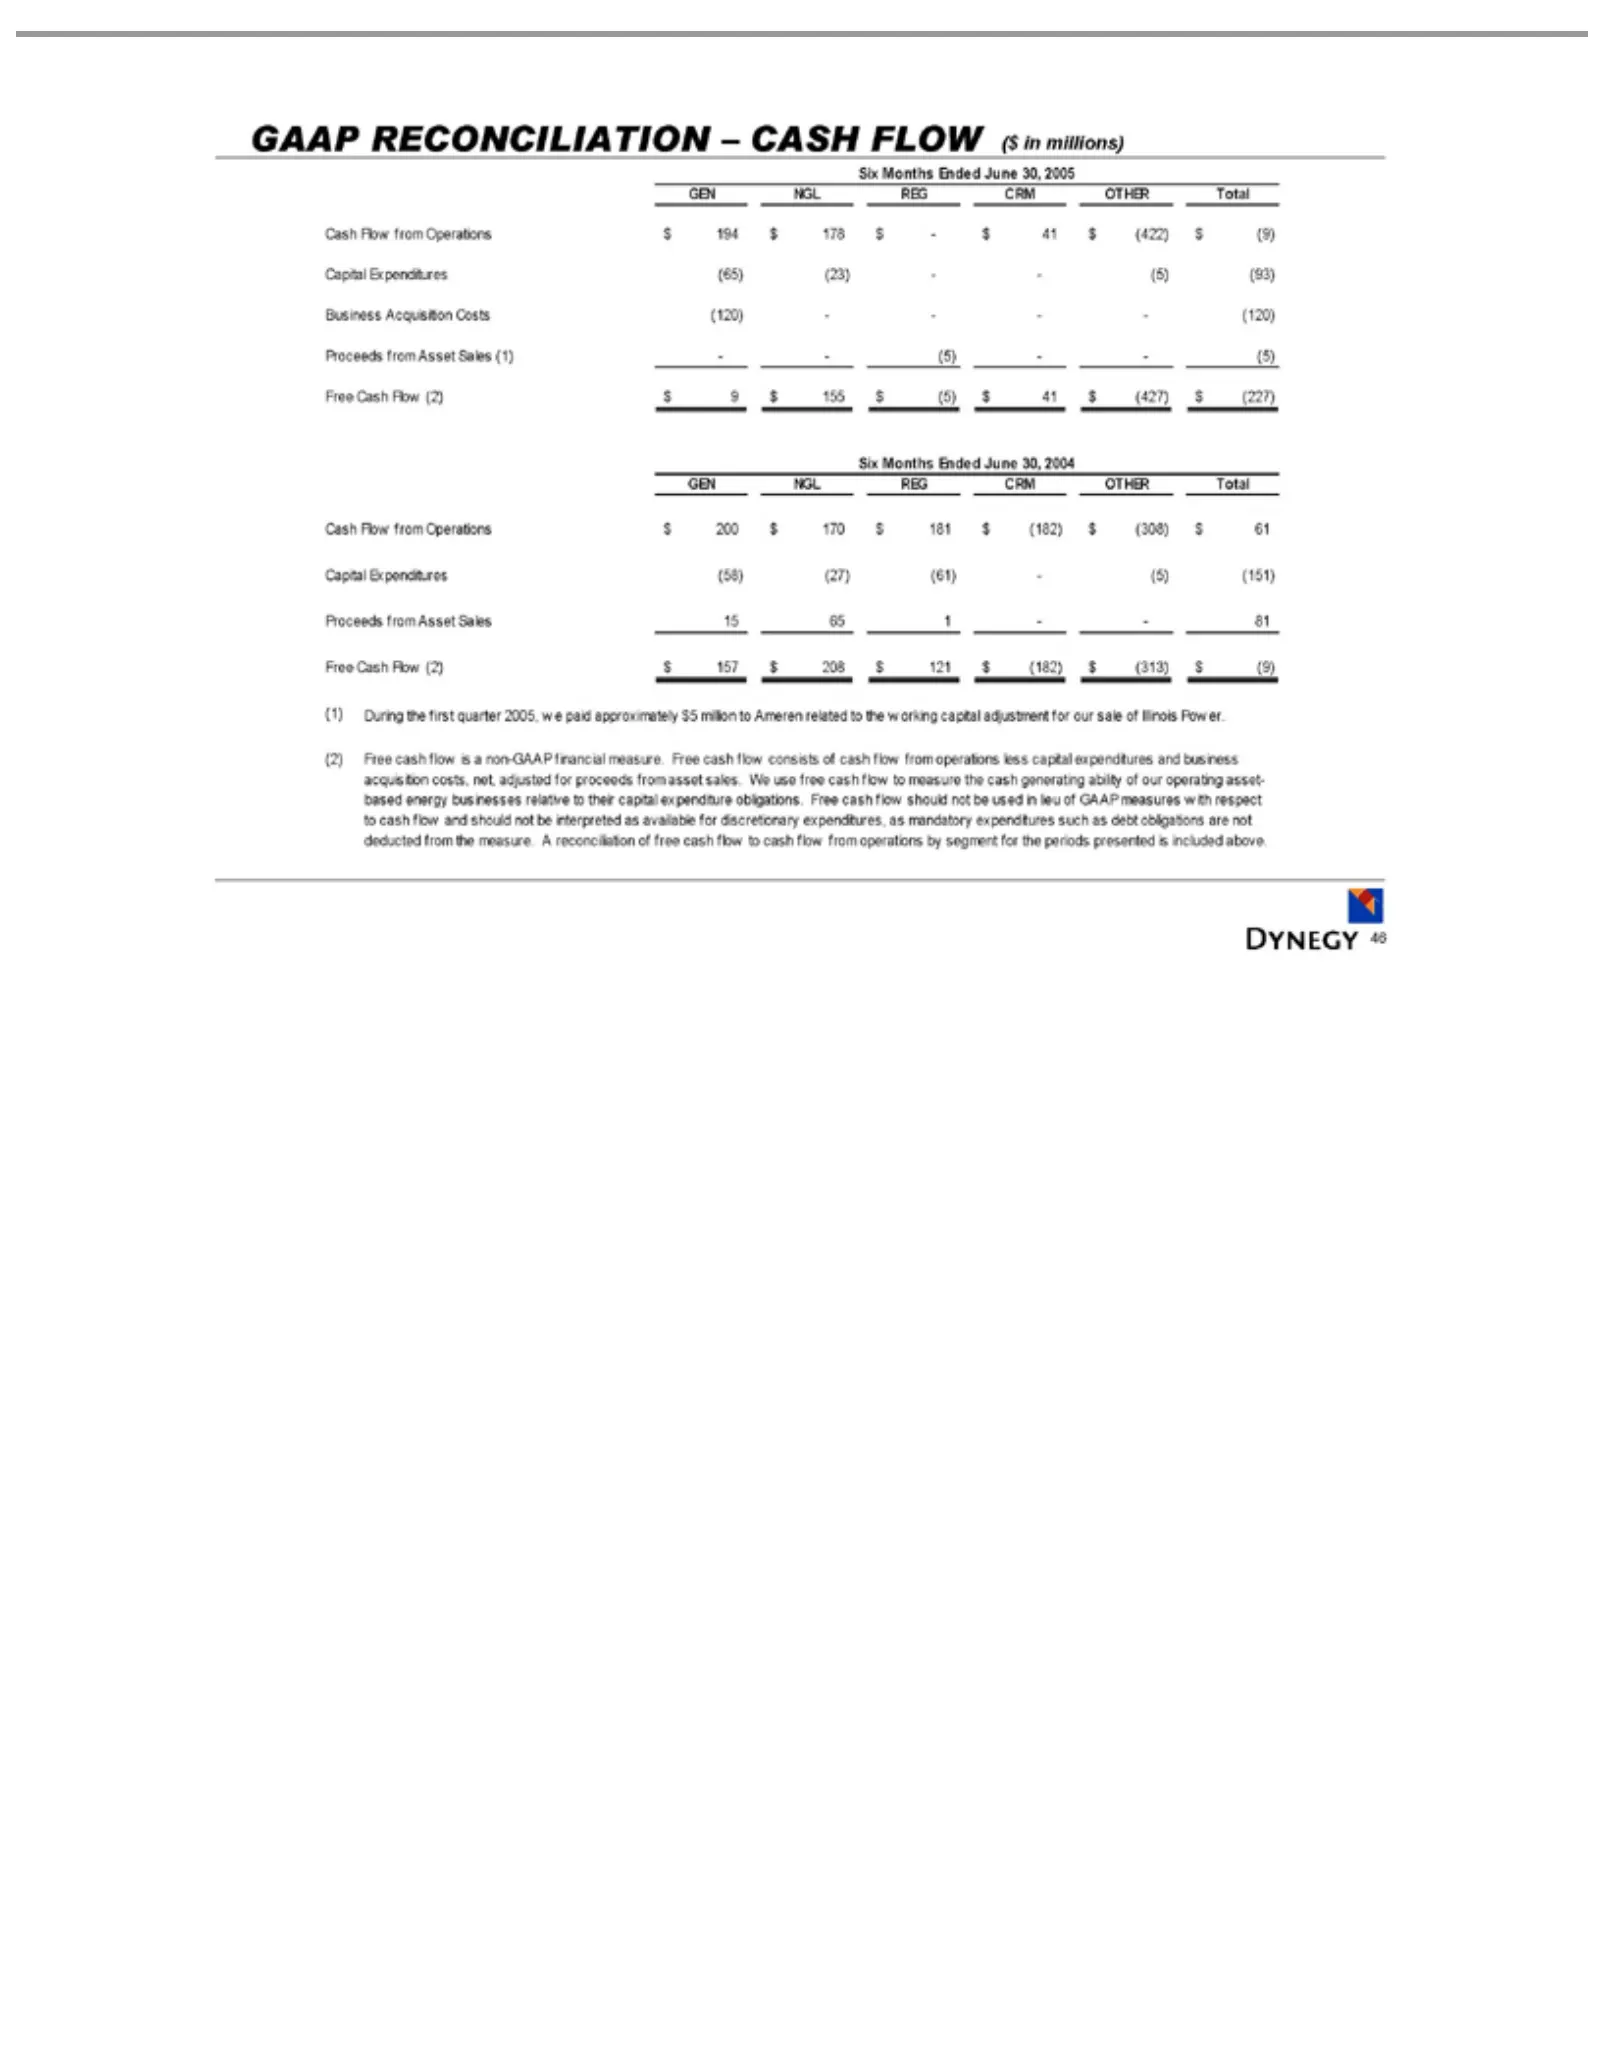
Slide 46: GAAP Reconciliation: Free Cash Flow
GAAP Business Six GEN Cash Capital Proceeds Free (1) (2) asset used deducted 46 During Free Months Cash in sales. Flow NGL RECONCILIATION lieu Expenditures cash Acquisition from Flow the from REG We of Ended flow GAAP first Asset the use (2) Operations CRM measure. is June free quarter $9 $157 aSale
Source: SEC EDGAR · 8-K filed Sep 7, 2005
More decks from Dynegy Inc
 FY2017 Earnings Presentation30 slides · Feb 26, 2018
 Debt Investor Presentation (December 2017)10 slides · Dec 11, 2017
 Merger or Acquisition (October 2017)28 slides · Oct 31, 2017
 Debt Investor Presentation (October 2016)44 slides · Oct 3, 2016
 IPO Roadshow (June 2016)17 slides · Jun 15, 2016
 Investor Day (April 2014)94 slides · Apr 11, 2014