Temple-Inland — Investor Presentation (February 2009)
43 slides from Temple-Inland's investor presentation, Feb 23, 2009

Slide 1: Our job is to be the best: Investor Presentation
1 Our job is to be the best Investor Presentation

Slide 2: Forward Looking Statements
Forward Looking Statements 2 This presentation contains “forward-looking statements” within the meaning of the federal securities laws. These statements reflect management’s current views with respect to future events and are subject to risk and uncertainties. We note that a variety of factors and u

Slide 3: Create Superior and Sustainable Value
Create Superior and Sustainable Value 3 Maximize ROI Profitably grow our business
Slide 4: 2008 Scorecard
2008 Scorecard 4 Maximize ROI 4.5% ROI Corrugated Packaging 11.3% ROI Above cost of capital returns for third consecutive year Highest relative improvement last 6 years Second highest in peer group Building Products (7.1)% ROI Significantly outperformed peer group Cash positive last 3 quarters of 20
Slide 5: 2008 Actions to Maximize ROI
2008 Actions to Maximize ROI 5 Improved asset utilization Box plant transformation Matched production to demand Lowered inventories Exited hardboard siding business Lowered costs S, G & A / total cost lowest in industry Reduced unallocated by $24 million, or 24% Reduced overall headcount by 11% Lowe

Slide 6: 2008 Actions to Profitably Grow Our Business
2008 Actions to Profitably Grow Our Business 6 PBL acquisition GreenGlass TM
Slide 7: Temple-Inland 80% Corrugated Packaging 20% Building Products
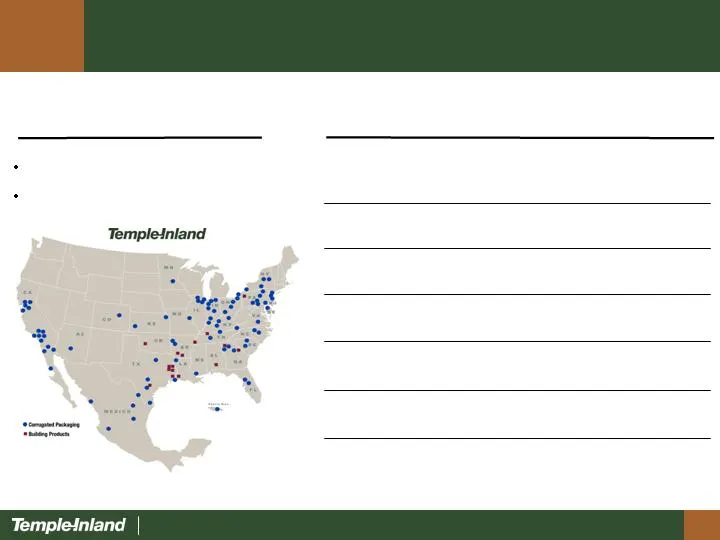
Temple-Inland 80% Corrugated Packaging 20% Building Products 7 Corrugated Packaging Building Products Business Description Financial Highlights $364 6.3% $2,570 $161 $3,850 2007 $111 $331 $133 $134 EBIT $317 $542 $339 $340 EBITDA $3,884 $4,096 $3,723 $3,587 Revenue 4.5% $2,484 2008 5.5% $2,431 2005
Slide 8: Corrugated Packaging Segment Highlights
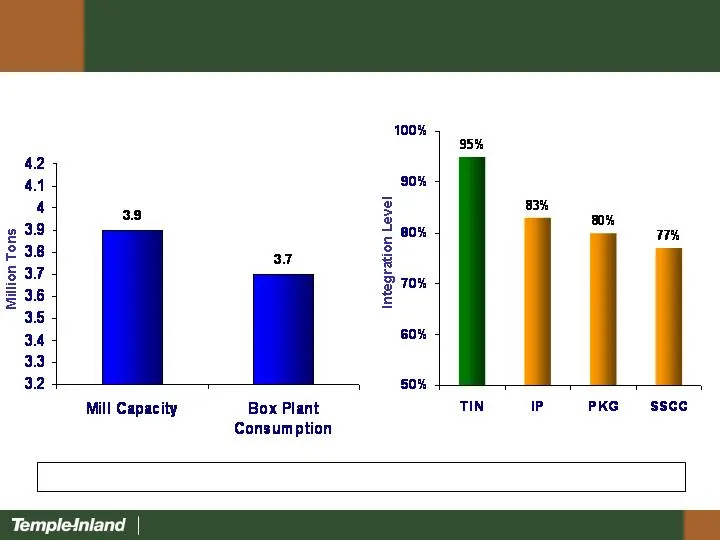
Corrugated Packaging Segment Highlights 8 7 mills - 3.9 million tons 63 converting facilities - 3.7 million tons # 3 industry producer Best-positioned paper grade Business Highlights Financial Highlights $429 14.3% $2,004 $287 $3,044 2007 $371 $408 $280 $255 $185 EBITDA 11.3% 12.5% 5.6% 4.7% 0.8% RO

Slide 9: Corrugated Packaging Strategic Initiatives
Corrugated Packaging Strategic Initiatives 9 Maintain high integration level - Box plant consumption = mill capacity Drive for low cost - Asset utilization and manufacturing excellence Improve mix and margins - Sales excellence Grow business - Organically / Acquisition Lowering Costs, Improving Effi
Slide 10: Integration Level – Highest in the Industry
Integration Level – Highest in the Industry 10 Temple-Inland is the most integrated producer of corrugated containers
Slide 11: Lower Converting Costs and Higher Productivity
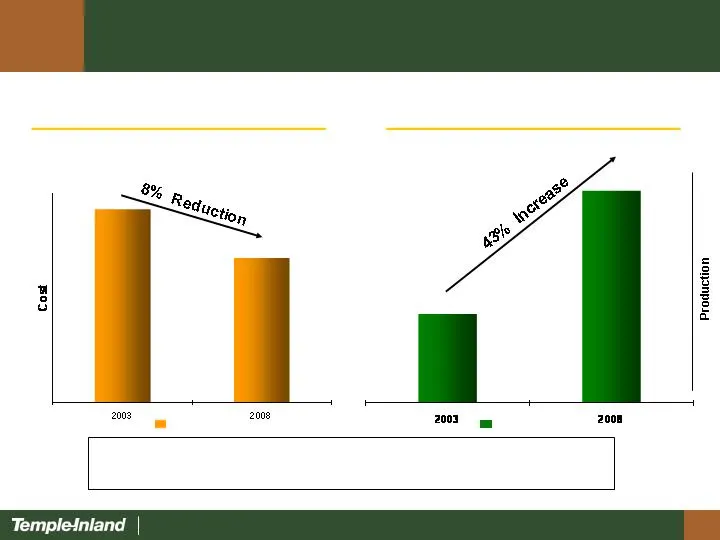
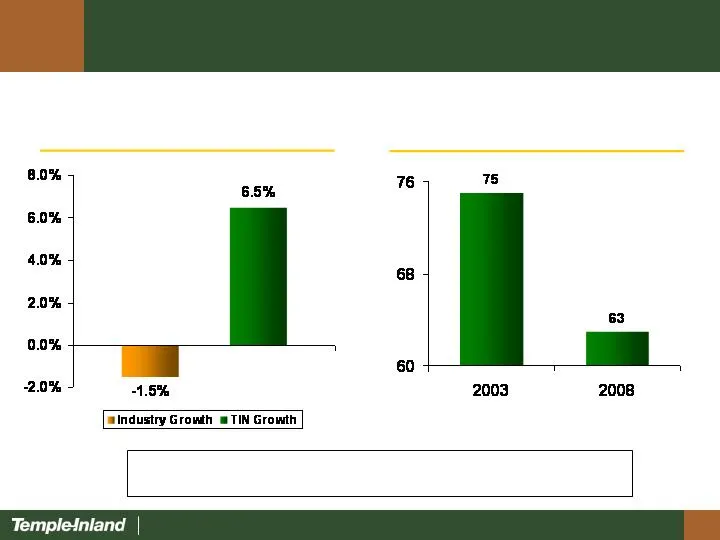
Lower Converting Costs and Higher Productivity 11 Produced 203,000 tons more boxes despite closure of 12 converting facilities since 2003 Lowering Converting Costs Improving Box Plant Productivity Cost per ton Boxes per hour
Slide 12: 24/7 Plants
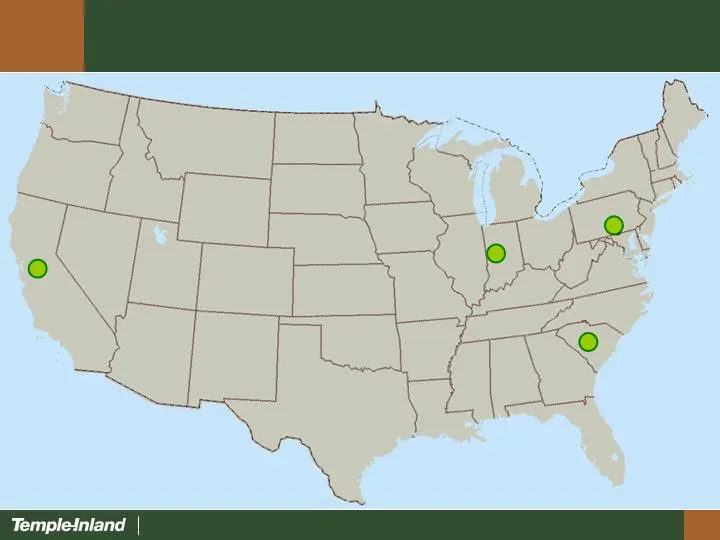
24/7 Plants 12 Tracy, CA Biglerville, PA Lexington, SC Crawfordsville, IN
Slide 13: Structural Cost Change Underway
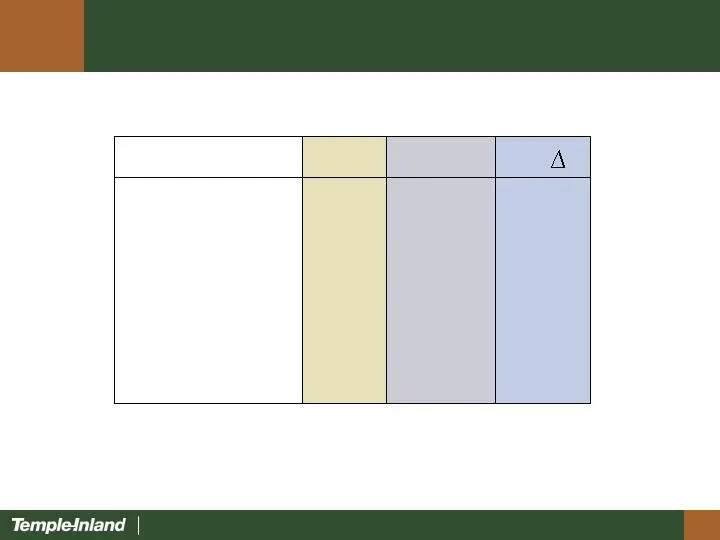
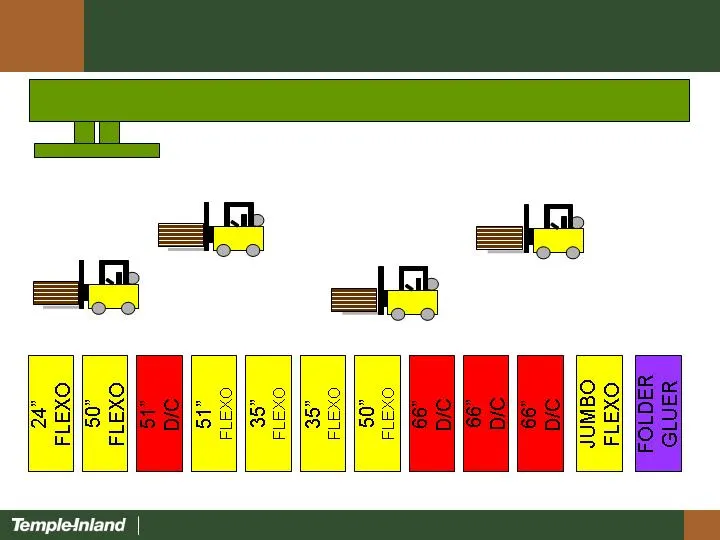
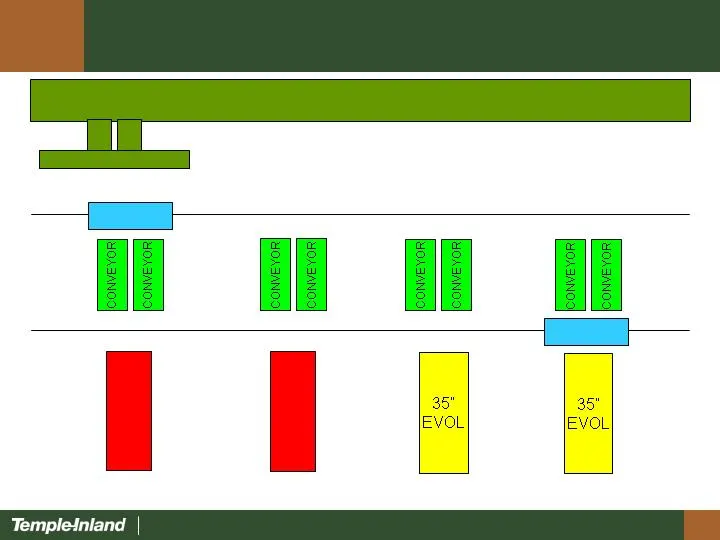
Structural Cost Change Underway 13 (34%) $ Cost/Ton (24%) People (48%) Machines % Future Old Fewer machines, fewer people, and lower costs
Slide 14: Asset Utilization Lexington Plant – Old Layout
Asset Utilization Lexington Plant – Old Layout 14 98” CORRUGATOR 12 Machines
Slide 15: Asset Utilization Lexington Plant – New Layout
Asset Utilization Lexington Plant – New Layout 15 98” CORRUGATOR T-CART T-CART 66” D/C 66” D/C 4 Machines

Slide 16: Improve Mix and Margins
Improve Mix and Margins 16 Centralized pricing decision making Structured and disciplined approach to market Target customers where we can create value
Slide 17: Shipments by End-Use Industry
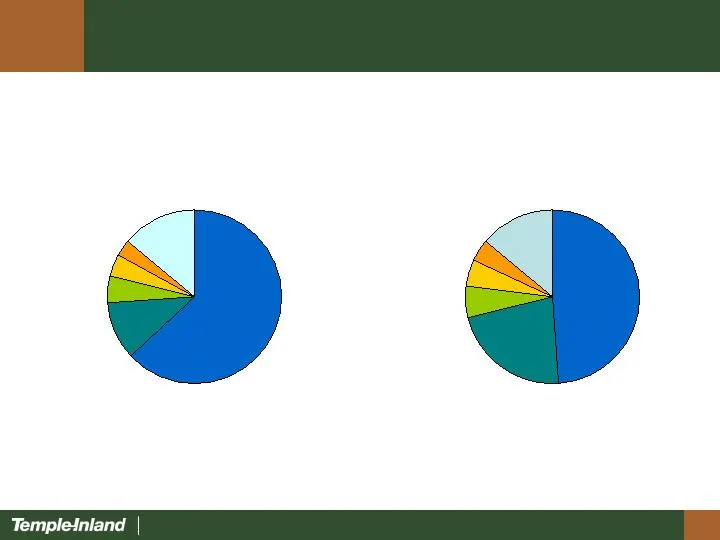
Shipments by End-Use Industry 17 Food & Beverage 63% Misc. Mfg. 3% Other 14% Chemicals 4% Rubber & Plastics 5% Paper & Allied 11% Food & Beverage 49% Paper & Allied 22% Rubber & Plastics 6% Chemicals 5% Misc. Nondurables 4% Misc. Durable Goods 14% Temple-Inland Industry* *Source: Fibre Box Associati
Slide 18: Box Shipment Growth Exceeding Industry
Box Shipment Growth Exceeding Industry 18 Cumulative Shipment Growth from 2003 - 2008 TIN Converting Facilities TIN box shipment growth exceeds industry despite closure of 12 converting facilities since 2003

Slide 19: Premier Boxboard Acquisition Update
Premier Boxboard Acquisition Update 19 Acquired in July 2008 for $87M 4.7x avg. EBITDA inclusive of synergies Synergy realization ahead of schedule Ramp-up production of value added white-top linerboard
Slide 20: Corrugated Packaging – 2nd Highest ROA in Industry
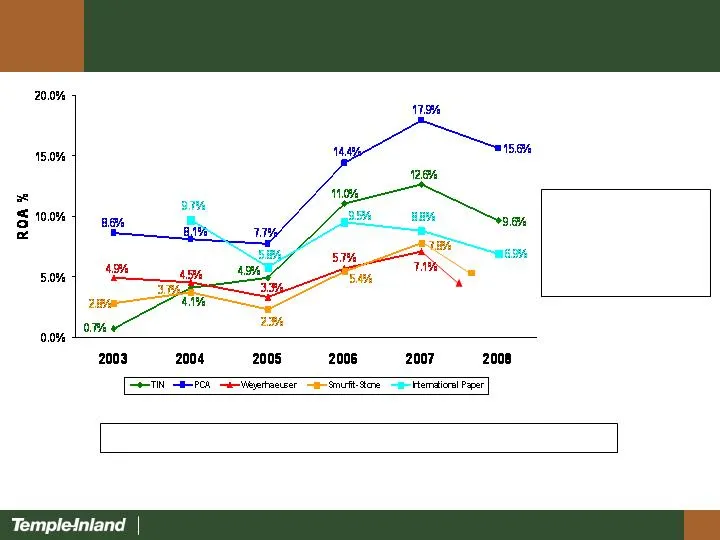
Corrugated Packaging – 2nd Highest ROA in Industry 20 TIN has highest ROA improvement relative to Peer Group Notes: (1) As reported by segment for TIN, IP and Weyerhaeuser. For TIN and IP, the asset base was adjusted to include acquisitions made in Q3 2008. (2) For PCA, EBIT = Gross profit-selling a
Slide 21: 2008 Comparative Quarterly ROA Trends
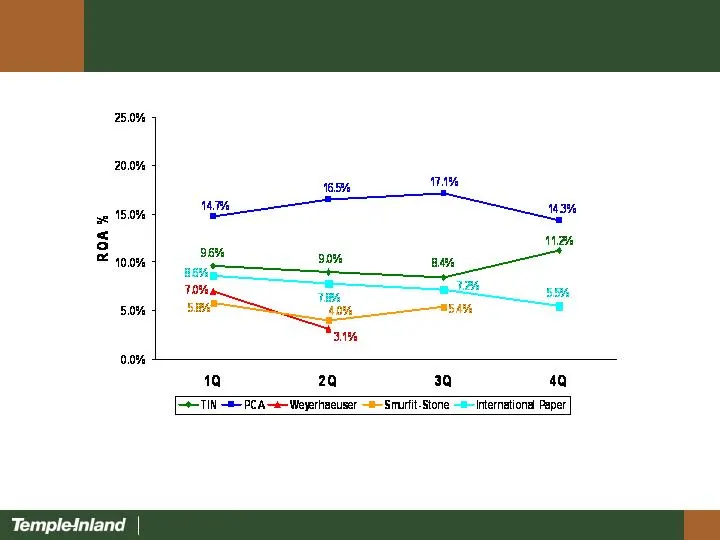
2008 Comparative Quarterly ROA Trends 21 Notes: (1) As reported by segment for TIN, IP and Weyerhaeuser. For TIN and IP, the asset base was adjusted to include acquisitions made in Q3 2008. (2) For PCA EBIT = Gross profit-selling and administrative expenses. (3) For SSCC, EBIT as reported by segment

Slide 22: North American Corrugated Packaging Industry Fundamentals
North American Corrugated Packaging Industry Fundamentals 22 Consolidating industry Significant capacity rationalization and downtime Improved pricing
Slide 23: North American Containerboard Market Share 1998 versus Today
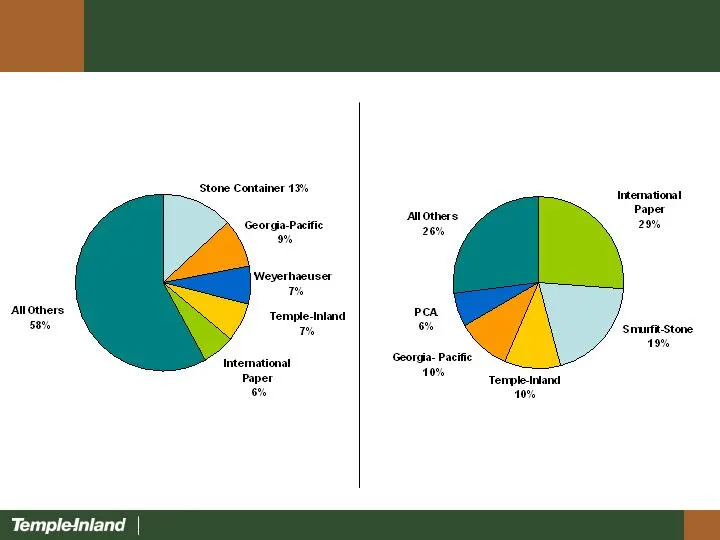
North American Containerboard Market Share 1998 versus Today 23 Top 5 Producers= 42% 1998 2009 Top 5 Producers= 74%
Slide 24: Containerboard Capacity Changes and Operating Rate
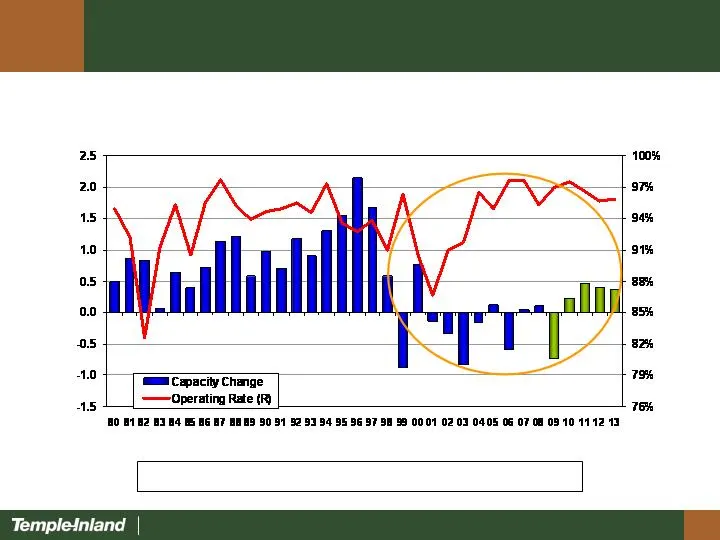
Corrugated Packaging Industry Containerboard Capacity Changes and Operating Rate 24 Net capacity reductions of 5% from 1999 - 2006 (Million Short Tons) Source: RISI
Slide 25: Linerboard Pricing Trends
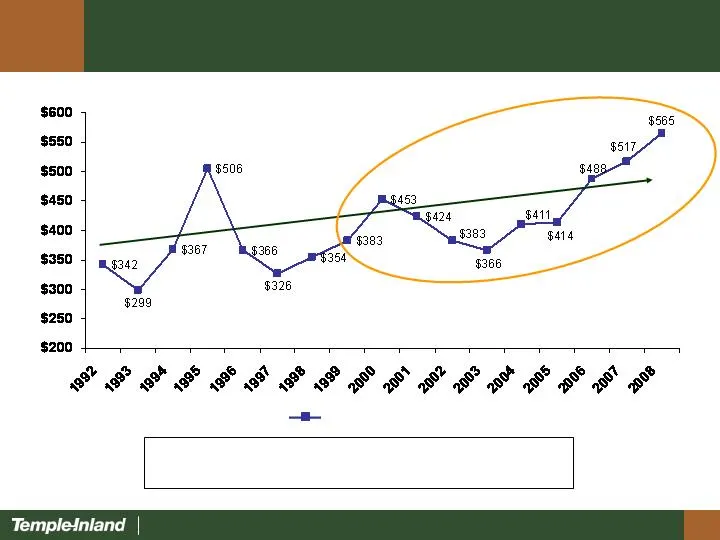
Linerboard Pricing Trends 25 Improved industry fundamentals has led to higher average prices and reduced volatility Source: RISI Linerboard ($/ton) Improved Linerboard Pricing

Slide 26: Corrugated Packaging Summary
Corrugated Packaging Summary 26 Track record of success Simple, effective strategy…execution = results Industry discipline
Slide 27: Building Products
Building Products 27 Portfolio of Products Lumber Gypsum Particleboard MDF Lowest quartile cost converting operations Located near large, high-growth markets Financial Highlights Business Highlights $53 1.4% $562 $8 $806 2007 ($40) $221 $125 $129 EBIT $8 $265 $160 $167 EBITDA (7.1%) $560 $694 2008 3
Slide 28: Building Products Strategic Initiatives
Building Products Strategic Initiatives 28 Deliver tailored portfolio of building products Products for new home, repair and remodeling and commercial markets Drive low cost Manufacturing excellence Serve growing markets Favorable demographics Provide sales excellence Unequaled customer service
Slide 29: Dimensional
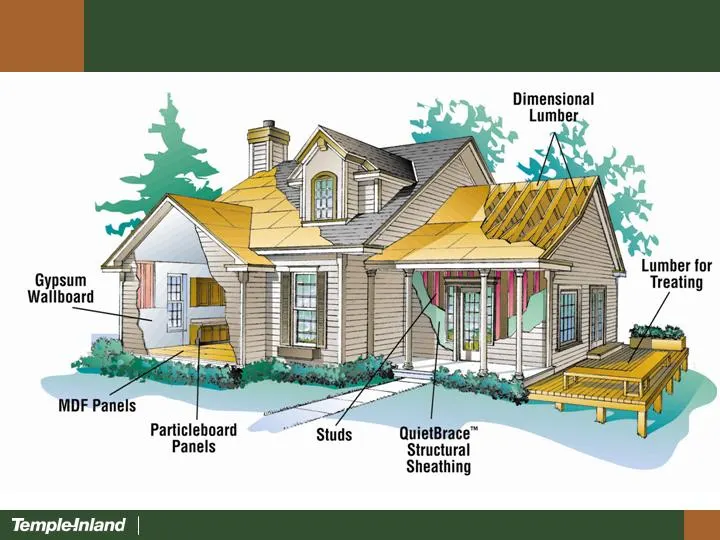
Dimensional Lumber for Gypsum Treating Wallboard MOF Panels Particleboard ~~ Stutis QuietBrace™ Panels Structural Sheathing Templetniand |
Slide 30: Lumber
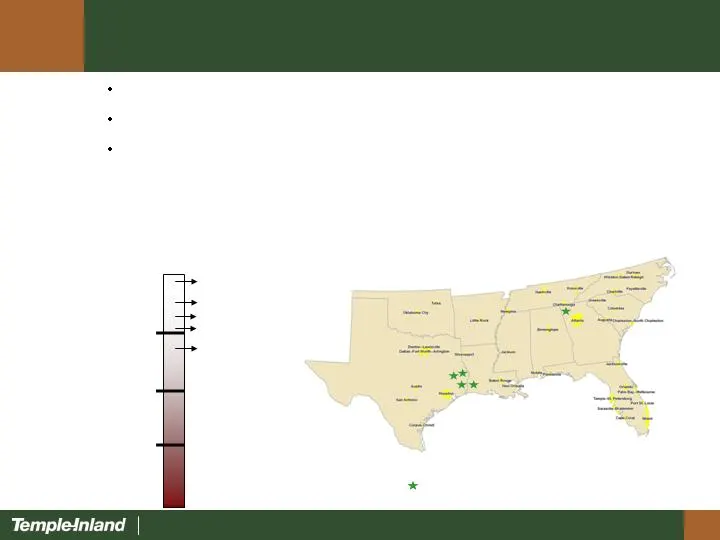
Lumber 30 Buna Pineland Diboll Rome DeQuincy Lumber Competitive Position Sawmill Locations Temple-Inland Sawmills 1st Quartile 2nd Quartile 3rd Quartile 4th Quartile Source: Beck & RISI Studies Temple-Inland Sawmills Sawmill Locations Low cost, state of art manufacturing system Logistically advantag
Slide 31: Gypsum
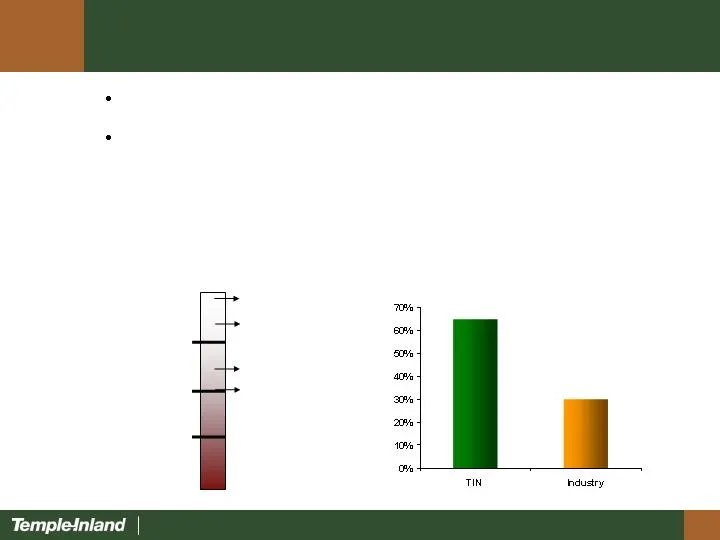
Gypsum 31 Synthetic Gypsum Furnish Gypsum Competitive Position Cumberland Fletcher W. Memphis McQueeney 1st Quartile 2nd Quartile 3rd Quartile 4th Quartile Source: Internal Analysis Low-cost manufacturing system Synthetic gypsum furnish 65% vs. 30% for industry
Slide 32: Industrial Panels - Particleboard & MDF
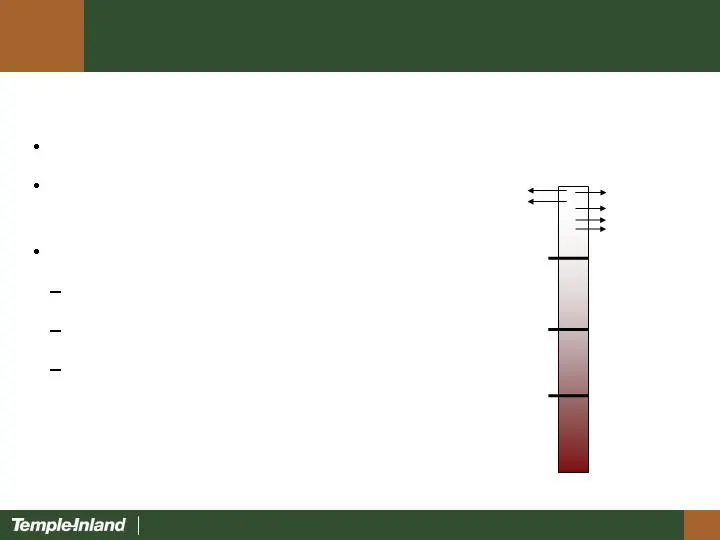
Industrial Panels - Particleboard & MDF 32 Panels Competitive Position Monroeville Hope Diboll Thomson 1st Quartile 2nd Quartile 3rd Quartile 4th Quartile Source: Beck Study PB MDF El Dorado Mt. Jewett Lowest cost system High-value engineered family of products Targeted markets Kitchen cabinets Lami
Slide 33: Building Products EBITDA Trends
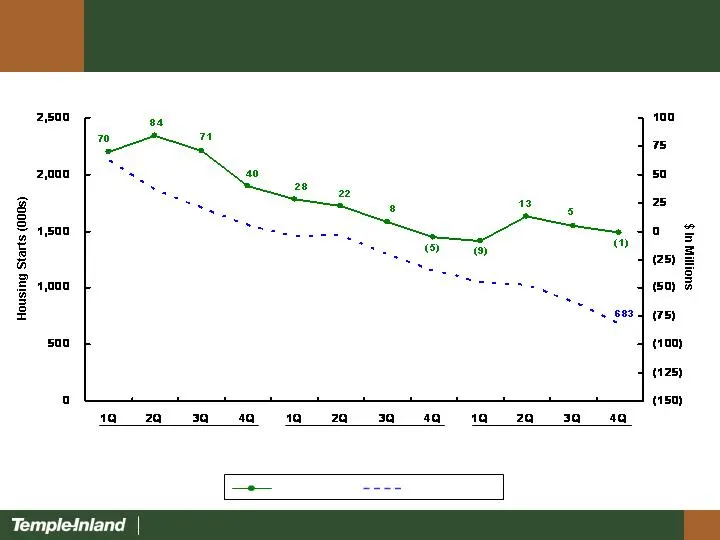
Building Products EBITDA Trends 33 Housing Starts TIN EBITDA 1,460 2006 2007 2008 2,127
Slide 34: Fundamental Drivers of Housing Demand
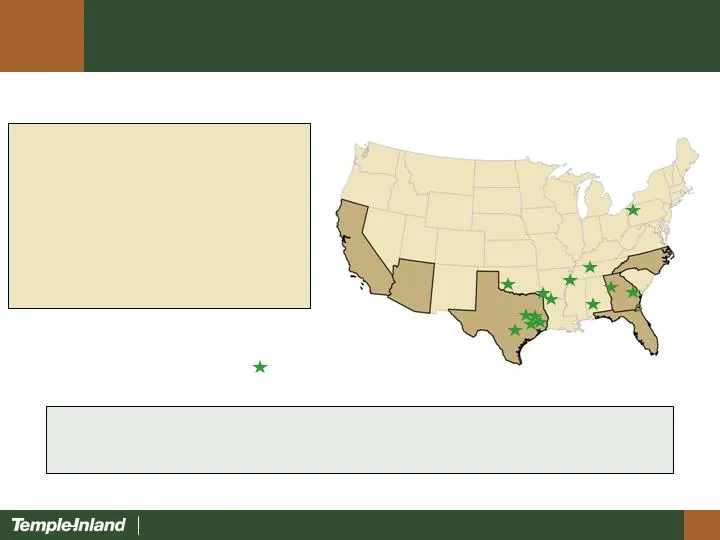
Fundamental Drivers of Housing Demand 34 Over the longer term, the outlook for housing markets is favorable. The RISI forecast calls for an average production level of 2 million units in 2011 – 2023. 2000 – 2030 Population Growth + 80 million New Jobs + 45 million New Households + 20 million Texas C

Slide 35: Building Products - Summary
Building Products - Summary 35 Low cost Location near large and growing markets Positive long-term demand driven by demographics Historically strong ROI and significant cash flow

Slide 36: Comparative S, G & A Expenses
Comparative S, G & A Expenses 36 9.5% 10.1% 10.3% Wtd. Avg. SG&A /Total Cost of Peers** TIN Rank 9 mos./2008 2,858 6.9% 2007 3,699 8.4% 2006 3,797 8.4% Temple-Inland S, G & A Total Cost * S, G & A/Total Cost ($ In Millions) * Total cost = S, G & A + Cost of sales **Peers include: International Paper
Slide 37: Year–End, 2008 Debt Structure
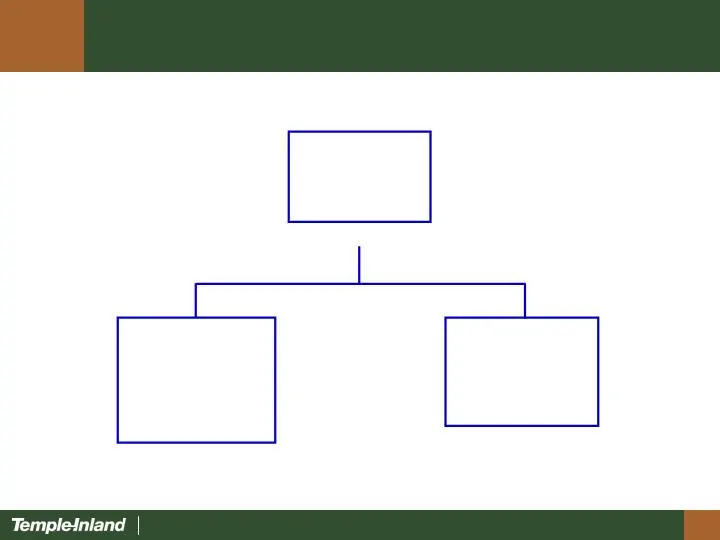
Year– End, 2008 Debt Structure 37 Total Debt $1,192 Borrowings Under Committed Credit Facilities $351 Term Debt $841 ($ In millions)
Slide 38: Term Debt Maturity Profile as of Year–End, 2008
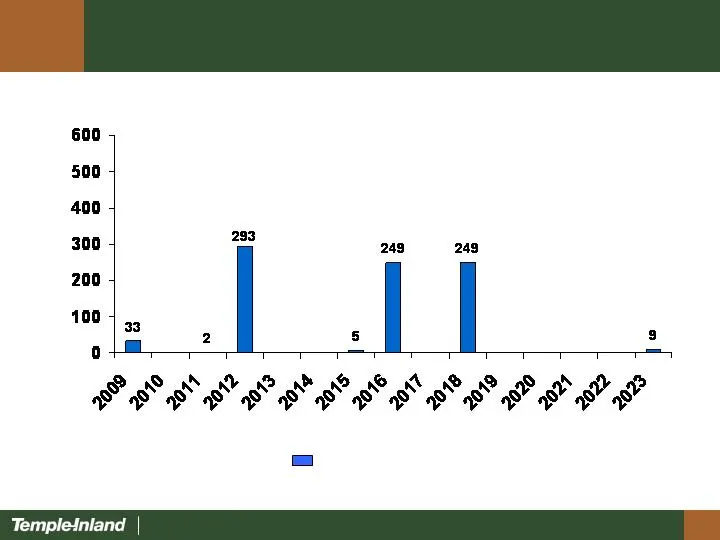
Term Debt Maturity Profile as of Year–End, 2008 ($ in millions) 38 Existing term debt

Slide 39: Year-End, 2008 Committed Credit Facilities
Year-End, 2008 Committed Credit Facilities 39 Accounts Receivable Committed Securitization Credit Facility Agreements Total ($ In Millions) * Best 4 out of last 5 quarters. 4Q/2008 = 4.6x Committed $ 250 $ 835 $1,085 Less: Borrowings (190 ) (161 ) (351 ) Letters of credit - (19 ) (19 ) Unused borrow
Slide 40: Estimated PPA Funded Status No Required Cash Contribution in 2009
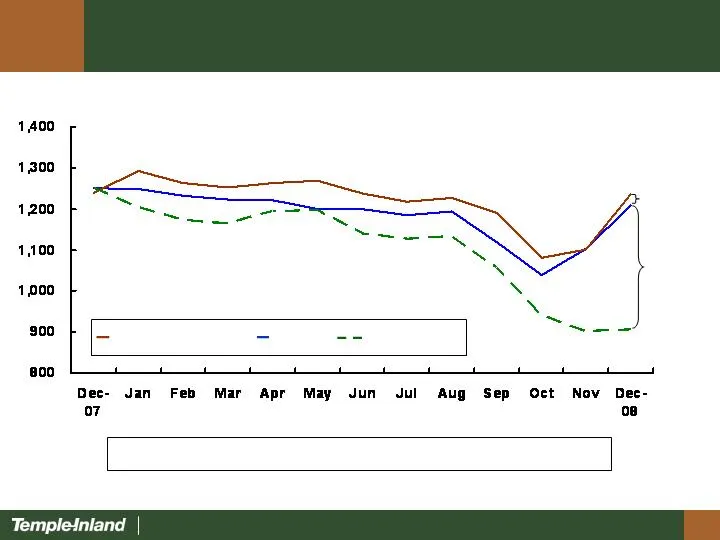
Estimated PPA Funded Status No Required Cash Contribution in 2009 40 $1,250 $1,208 $906 $1,239 $1,236 $(302)MM $(28)MM Typical Plan Assets TIN Assets Estimated PPA Accumulated Benefit (ABO) Pension expense $41MM in 2009 vs. $37MM in 2008 ($ In Millions)

Slide 41: 2009 Financial Priorities
2009 Financial Priorities 41 Return cash to shareholders Dividend Reduce debt Invest in our business 2009 cap ex 59% of depreciation Grow

Slide 42: Create Superior and Sustainable Value
Create Superior and Sustainable Value 42 Maximize ROI Profitably grow our business

Slide 43: Our job is to be the best
43 Our job is to be the best February 2009
Source: SEC EDGAR · 8-K filed Feb 23, 2009
More decks from Temple-Inland Inc
 Q2 2011 Earnings Presentation17 slides · Jul 21, 2011
 Proxy Contest (June 2011)43 slides · Jun 20, 2011
 Merger or Acquisition (June 2011)38 slides · Jun 6, 2011
 Q1 2011 Earnings Presentation16 slides · Apr 20, 2011
 Investor Presentation (February 2011)35 slides · Feb 14, 2011
 Q4 2010 Earnings Presentation28 slides · Feb 8, 2011