SUSS MicroTec SE · XETR:SMHN
SUSS MicroTec — Investor Presentation (2011)
43 slides from SUSS MicroTec's investor presentation, Sep 25, 2011
Slide 1: Company Presentation
Company Presentation Investor Presentation February 2011 Summer/Fall 2011 0
Slide 2: Disclaimer
Disclaimer This presentation contains forward-looking statements relating to the business, financial performance and earnings of SUSS MicroTec AG and its subsidiaries and associates. Forward-looking statements are based on current plans, estimates, projections and expectations and are therefore subj
Slide 3: Content
Content I. Executive Summary II. Products and Markets III. Growth Opportunities IV. Financials V. Outlook VI. Appendix 2
Slide 4: SUSS MicroTec Spotlight
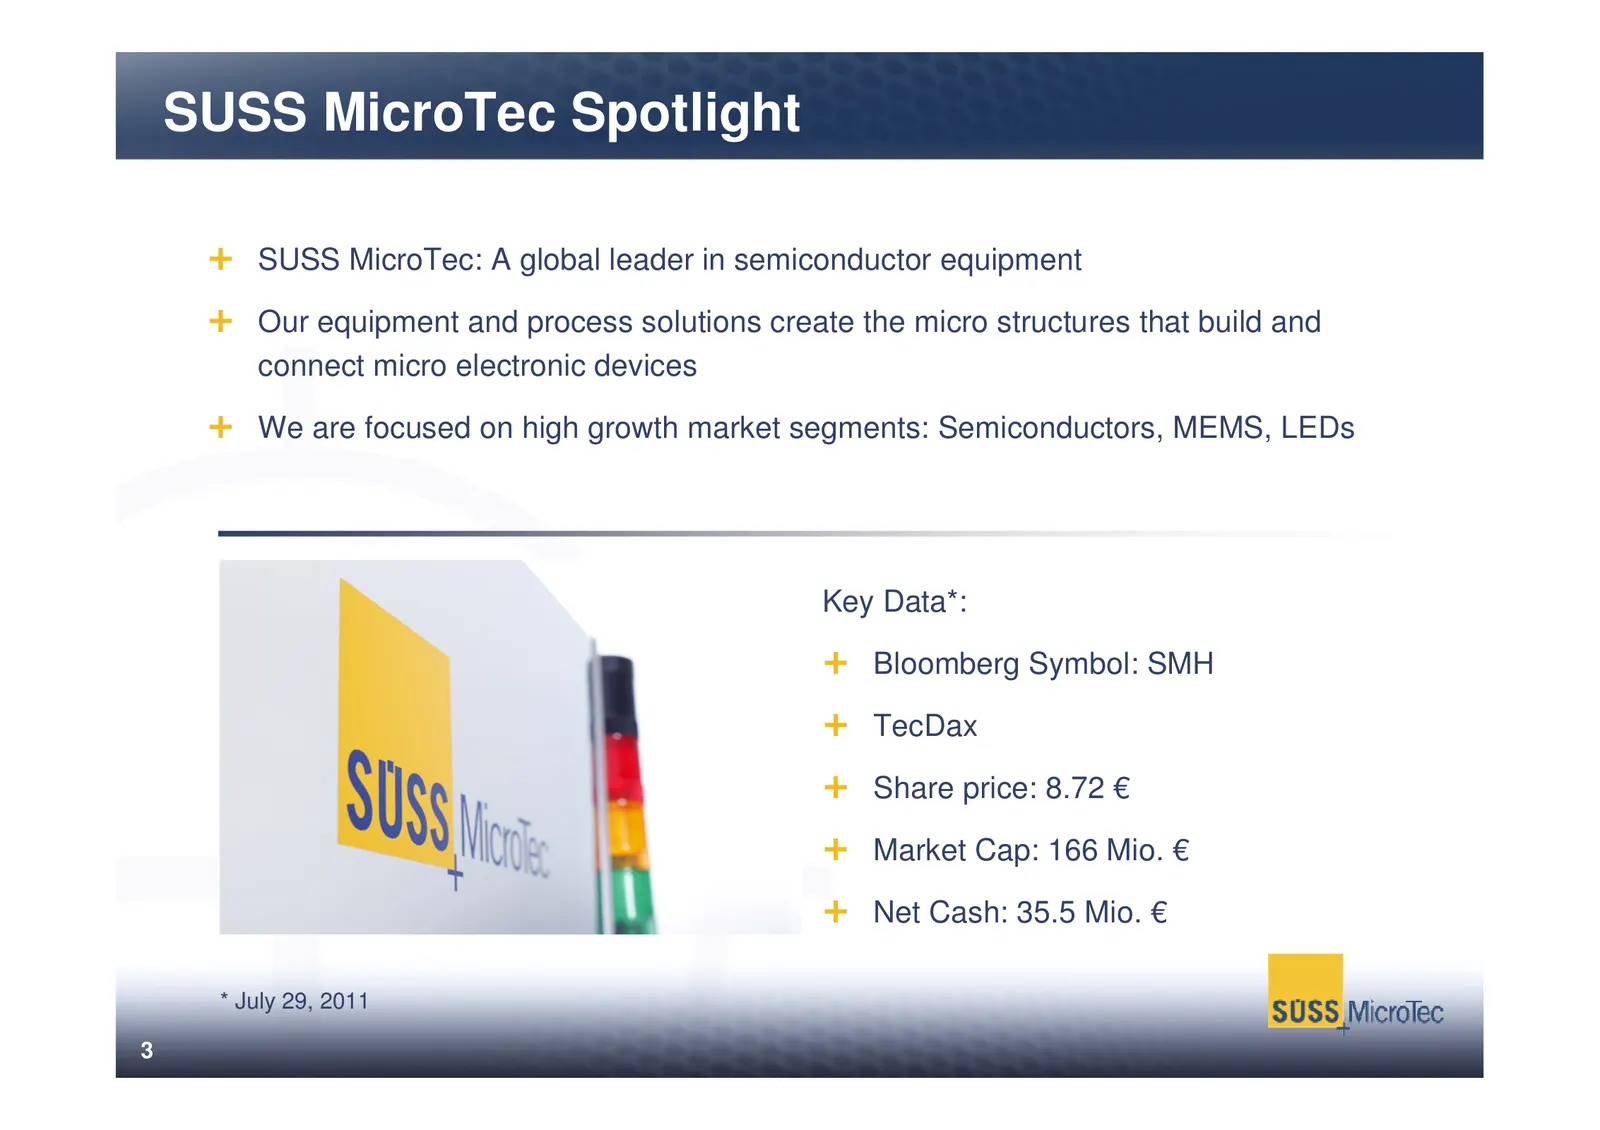
SUSS MicroTec Spotlight SUSS MicroTec: A global leader in semiconductor equipment Our equipment and process solutions create the micro structures that build and connect micro electronic devices We are focused on high growth market segments: Semiconductors, MEMS, LEDs Key Data*: Bloomberg Symbol: SMH
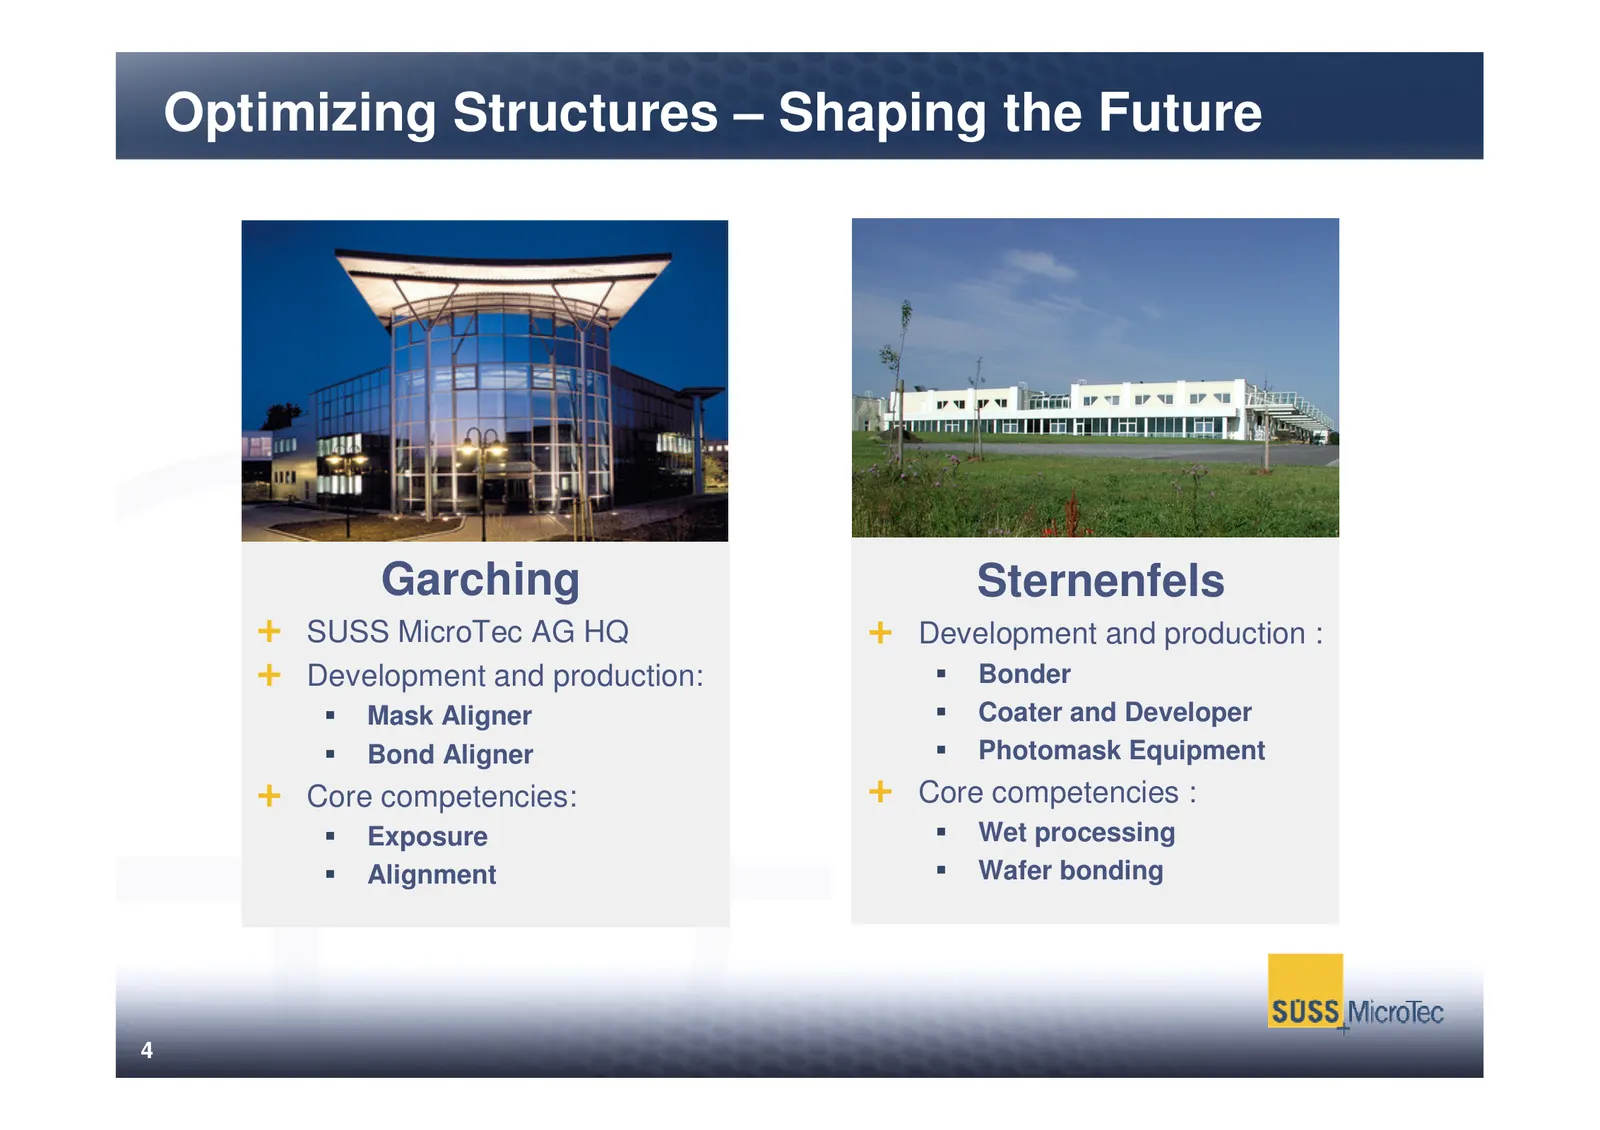
Slide 5: Optimizing Structures – Shaping the Future
Optimizing Structures – Shaping the Future Garching Sternenfels SUSS MicroTec AG HQ Development and production : Development and production: Bonder Mask Aligner Coater and Developer Bond Aligner Photomask Equipment Core competencies: Core competencies : Exposure Wet processing Alignment Wafer bondin
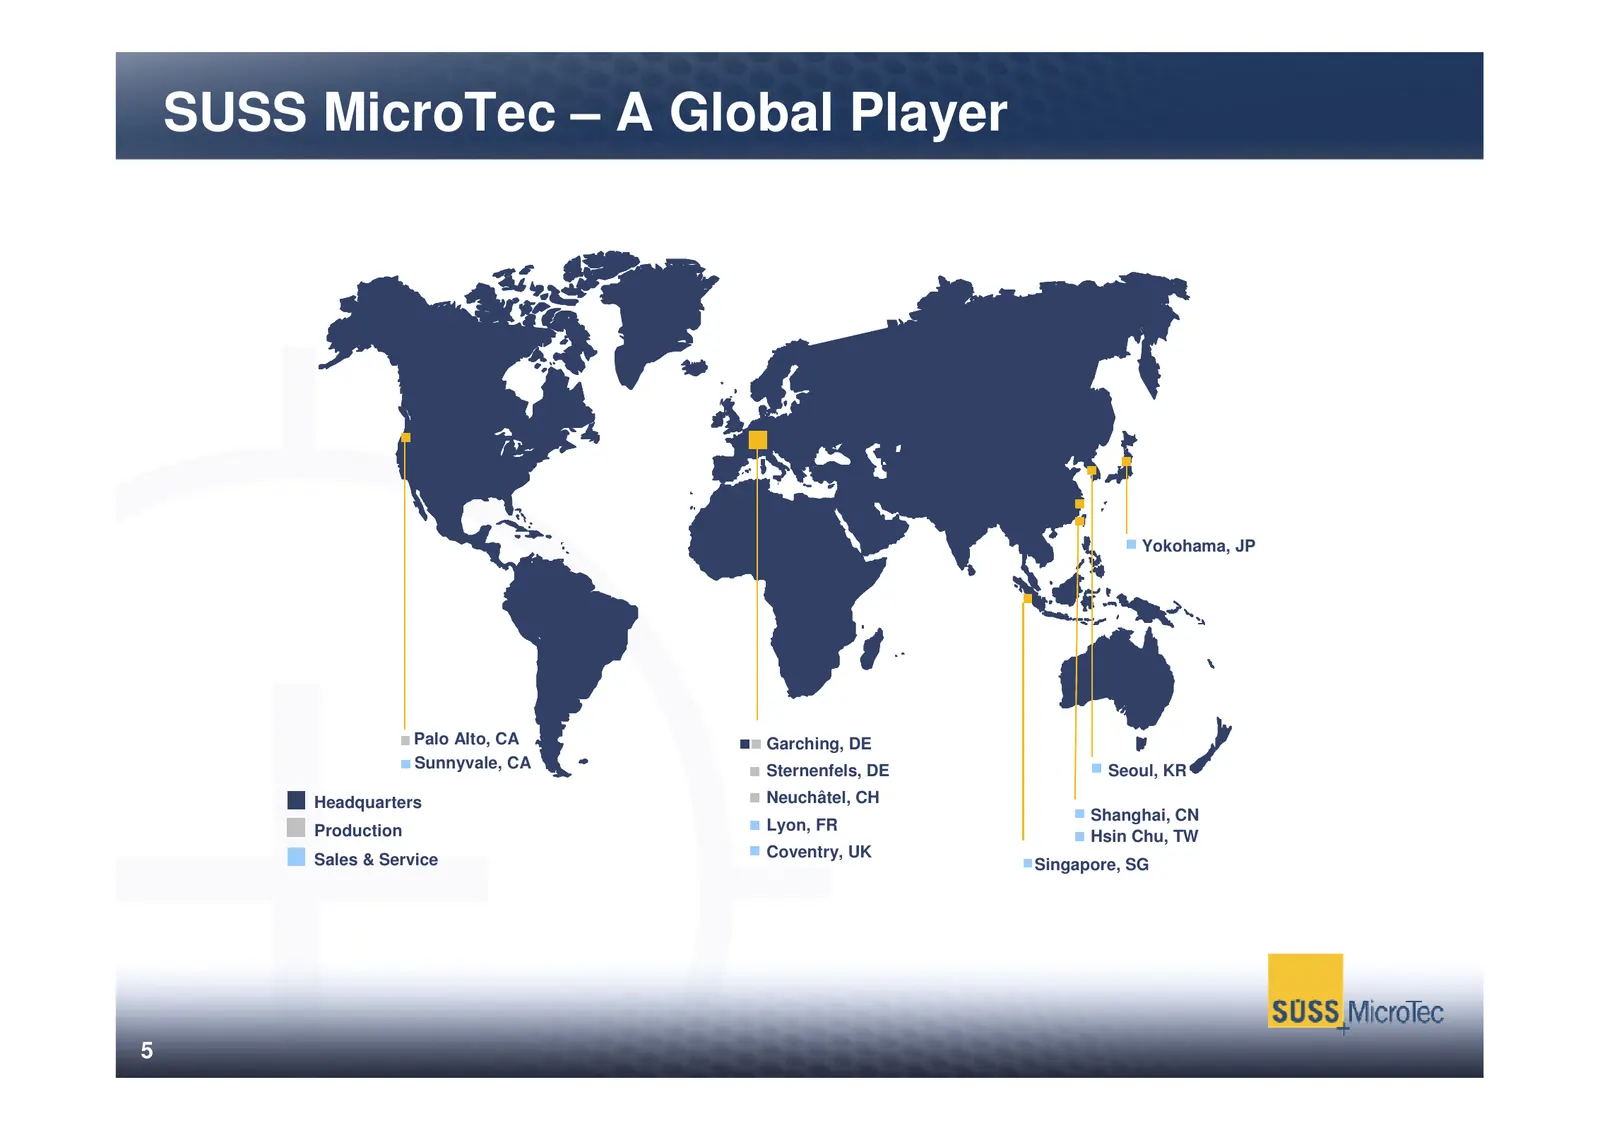
Slide 6: SUSS MicroTec – A Global Player
SUSS MicroTec – A Global Player Yokohama, JP Palo Alto, CA Garching, DE Sunnyvale, CA Sternenfels, DE Seoul, KR Headquarters Neuchâtel, CH Shanghai, CN Production Lyon, FR Hsin Chu, TW Sales & Service Coventry, UK Singapore, SG 5
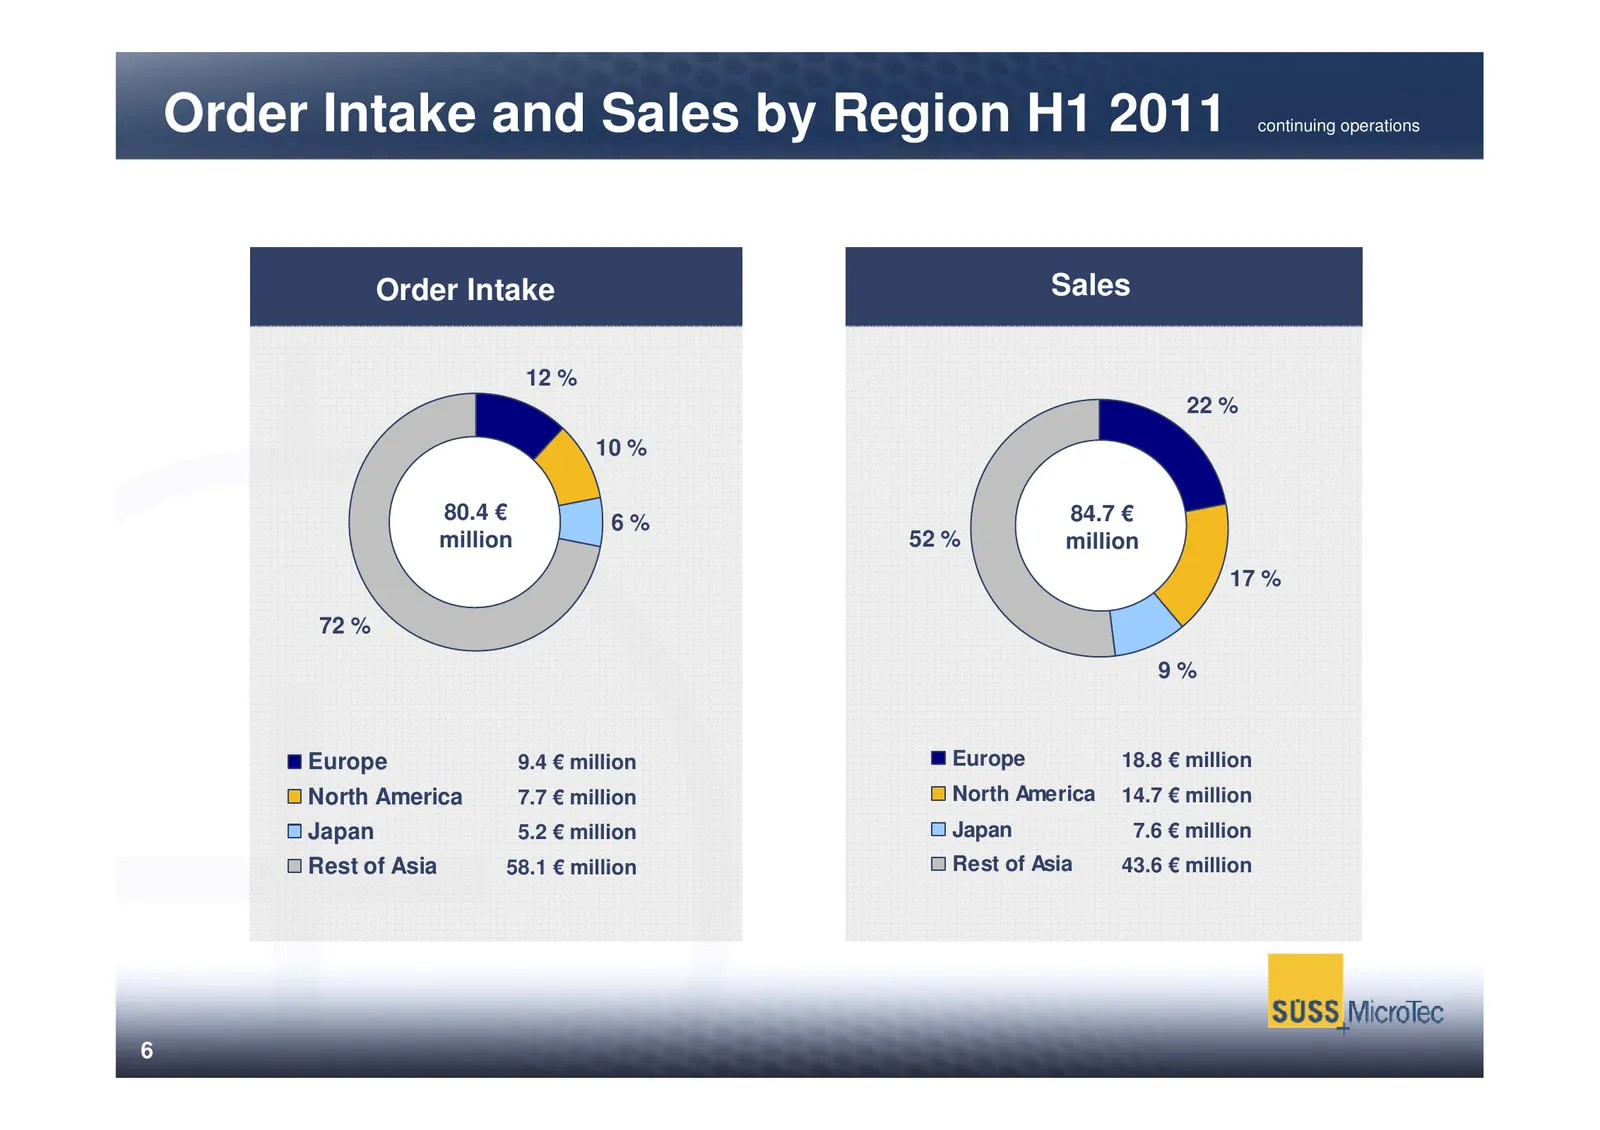
Slide 7: Order Intake and Sales by Region H1 2011
Order Intake and Sales by Region H1 2011 continuing operations Order Intake Sales 12 % 22 % 10 % 80.4 € 6% 84.7 € million 52 % million 17 % 72 % 9% Europe 9.4 € million Europe 18.8 € million North America 7.7 € million North America 14.7 € million Japan 5.2 € million Japan 7.6 € million Rest of Asia
Slide 8: Content
Content I. Executive Summary II. Products and Markets III. Growth Opportunities IV. Financials V. Outlook VI. Appendix 7
Slide 9: SUSS MicroTec In The Value Chain
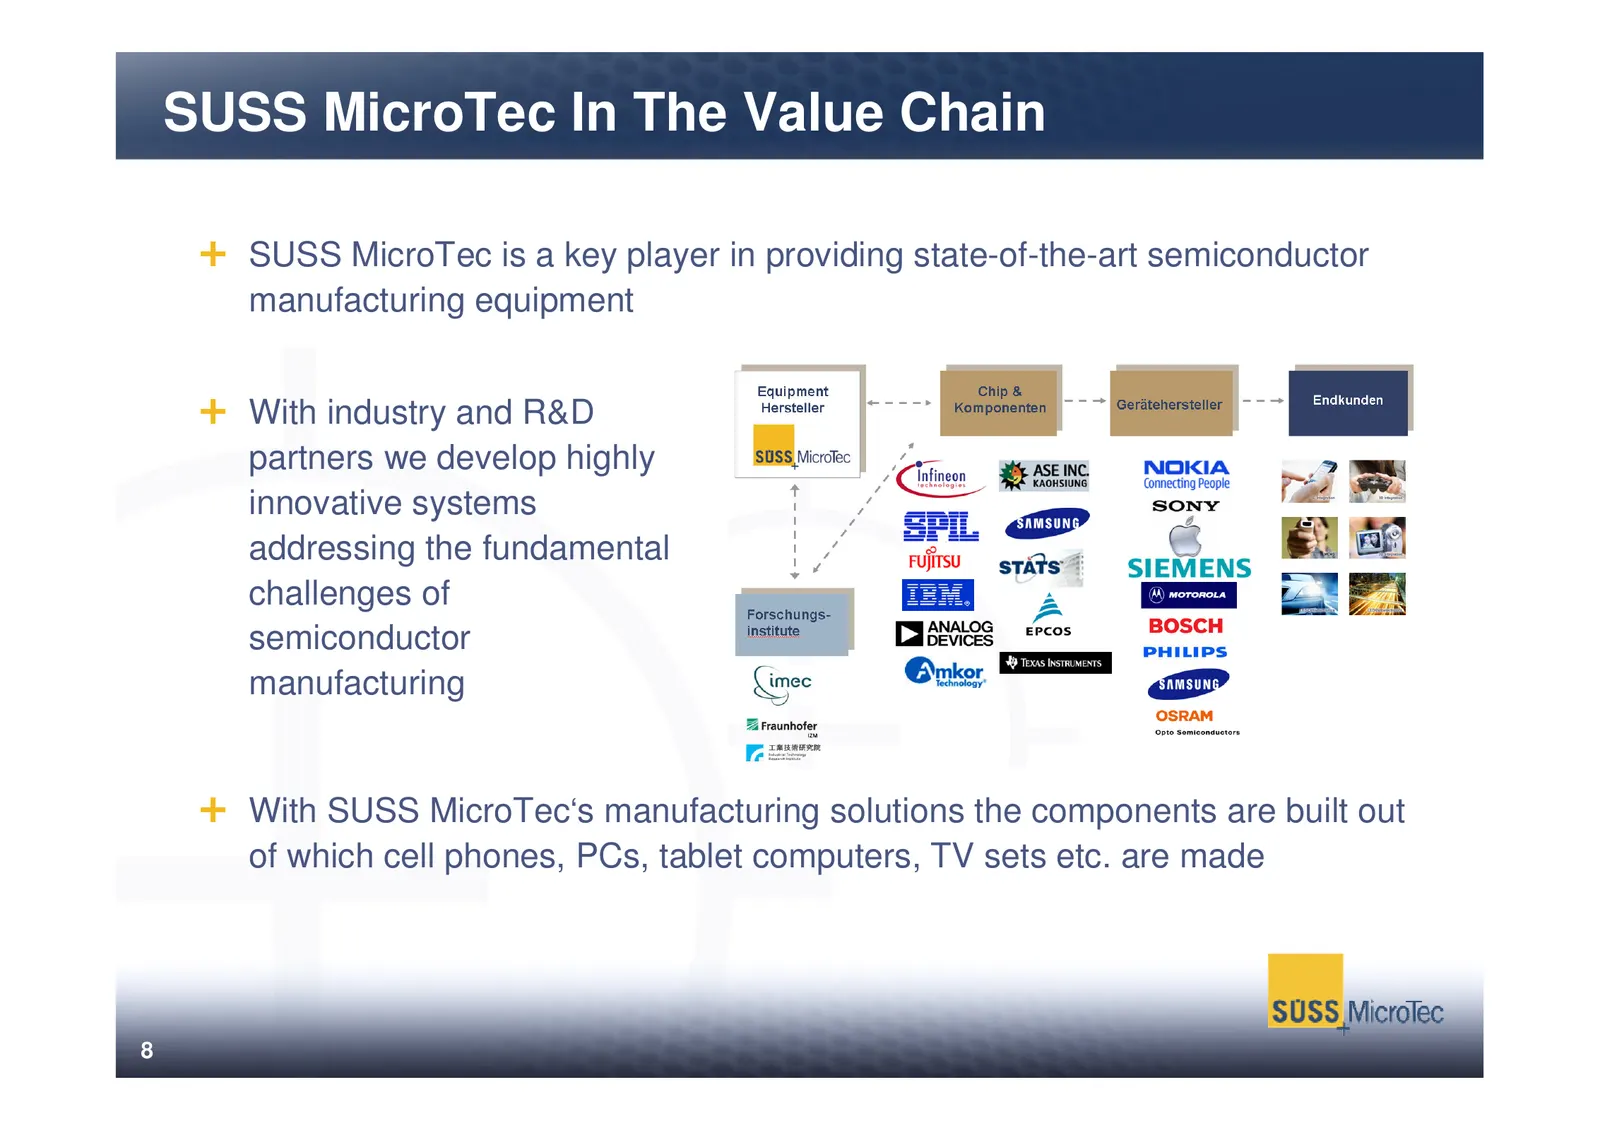
SUSS MicroTec In The Value Chain SUSS MicroTec is a key player in providing state-of-the-art semiconductor manufacturing equipment With industry and R&D partners we develop highly innovative systems addressing the fundamental challenges of semiconductor manufacturing With SUSS MicroTec‘s manufacturi
Slide 10: Divisions and Products
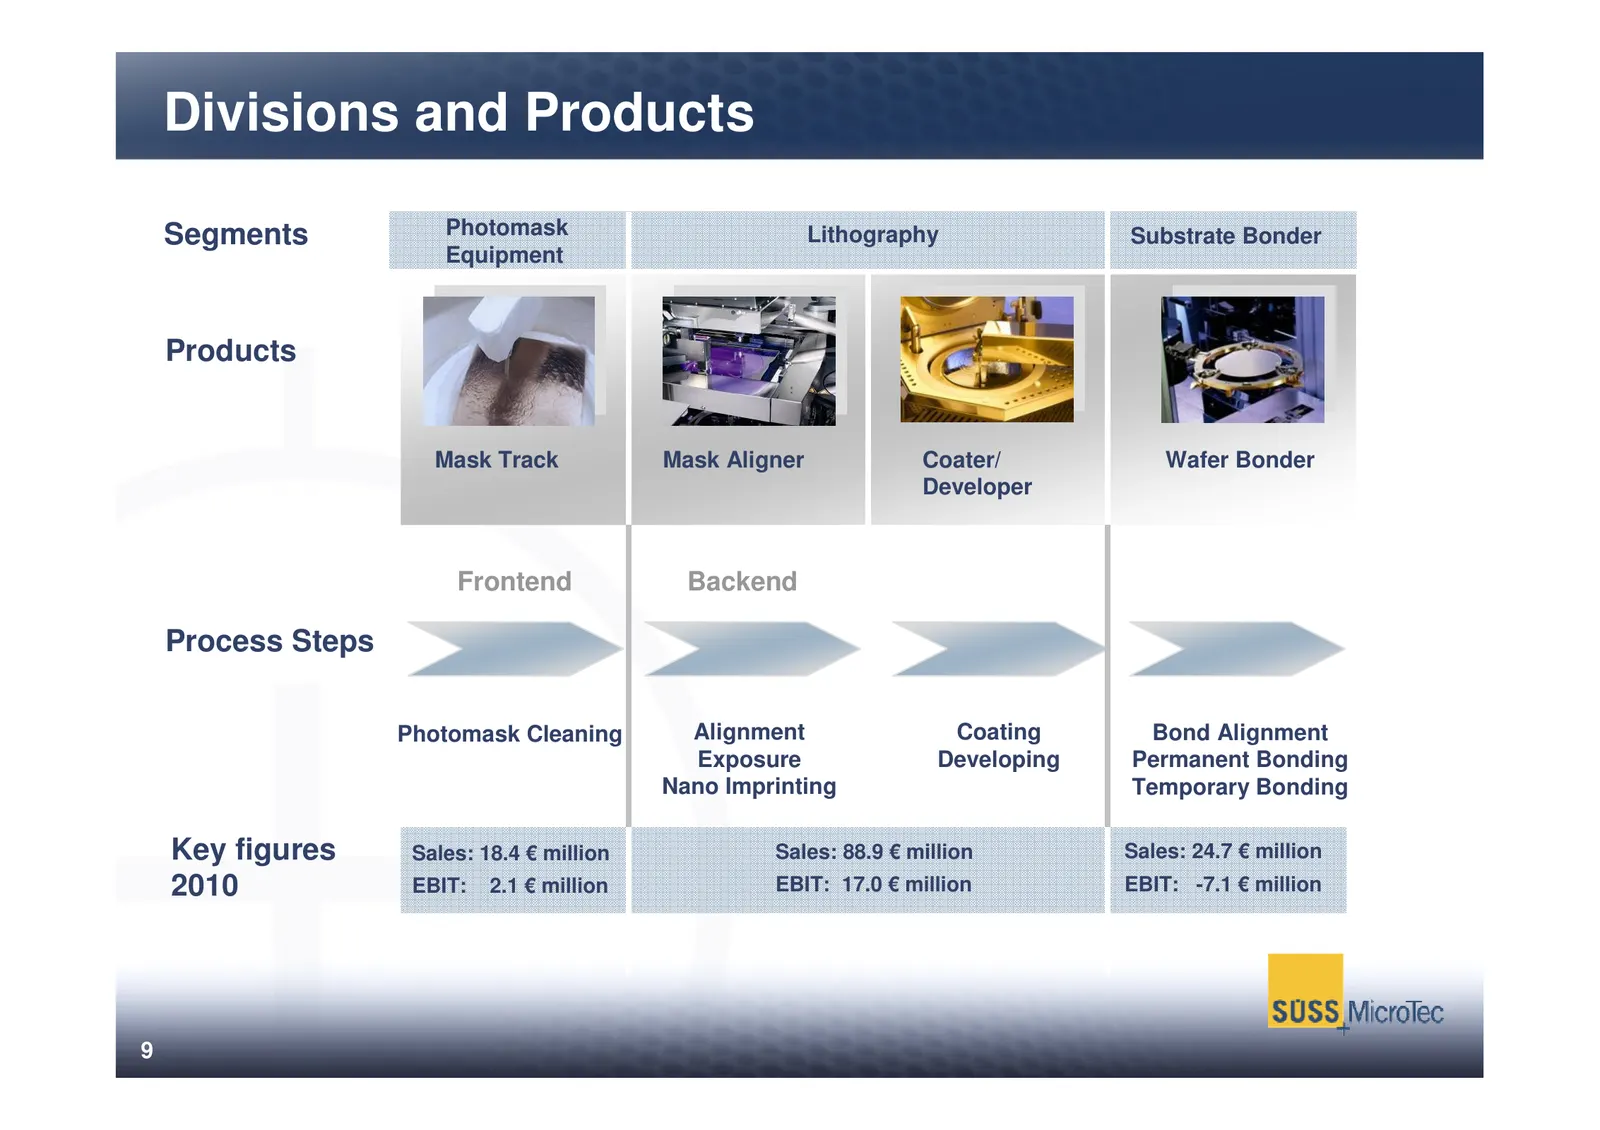
Divisions and Products Segments Photomask Lithography Substrate Bonder Equipment Products Mask Track Mask Aligner Coater/ Wafer Bonder Developer Frontend Backend Process Steps Photomask Cleaning Alignment Coating Bond Alignment Exposure Developing Permanent Bonding Nano Imprinting Temporary Bonding
Slide 11: Products and Markets
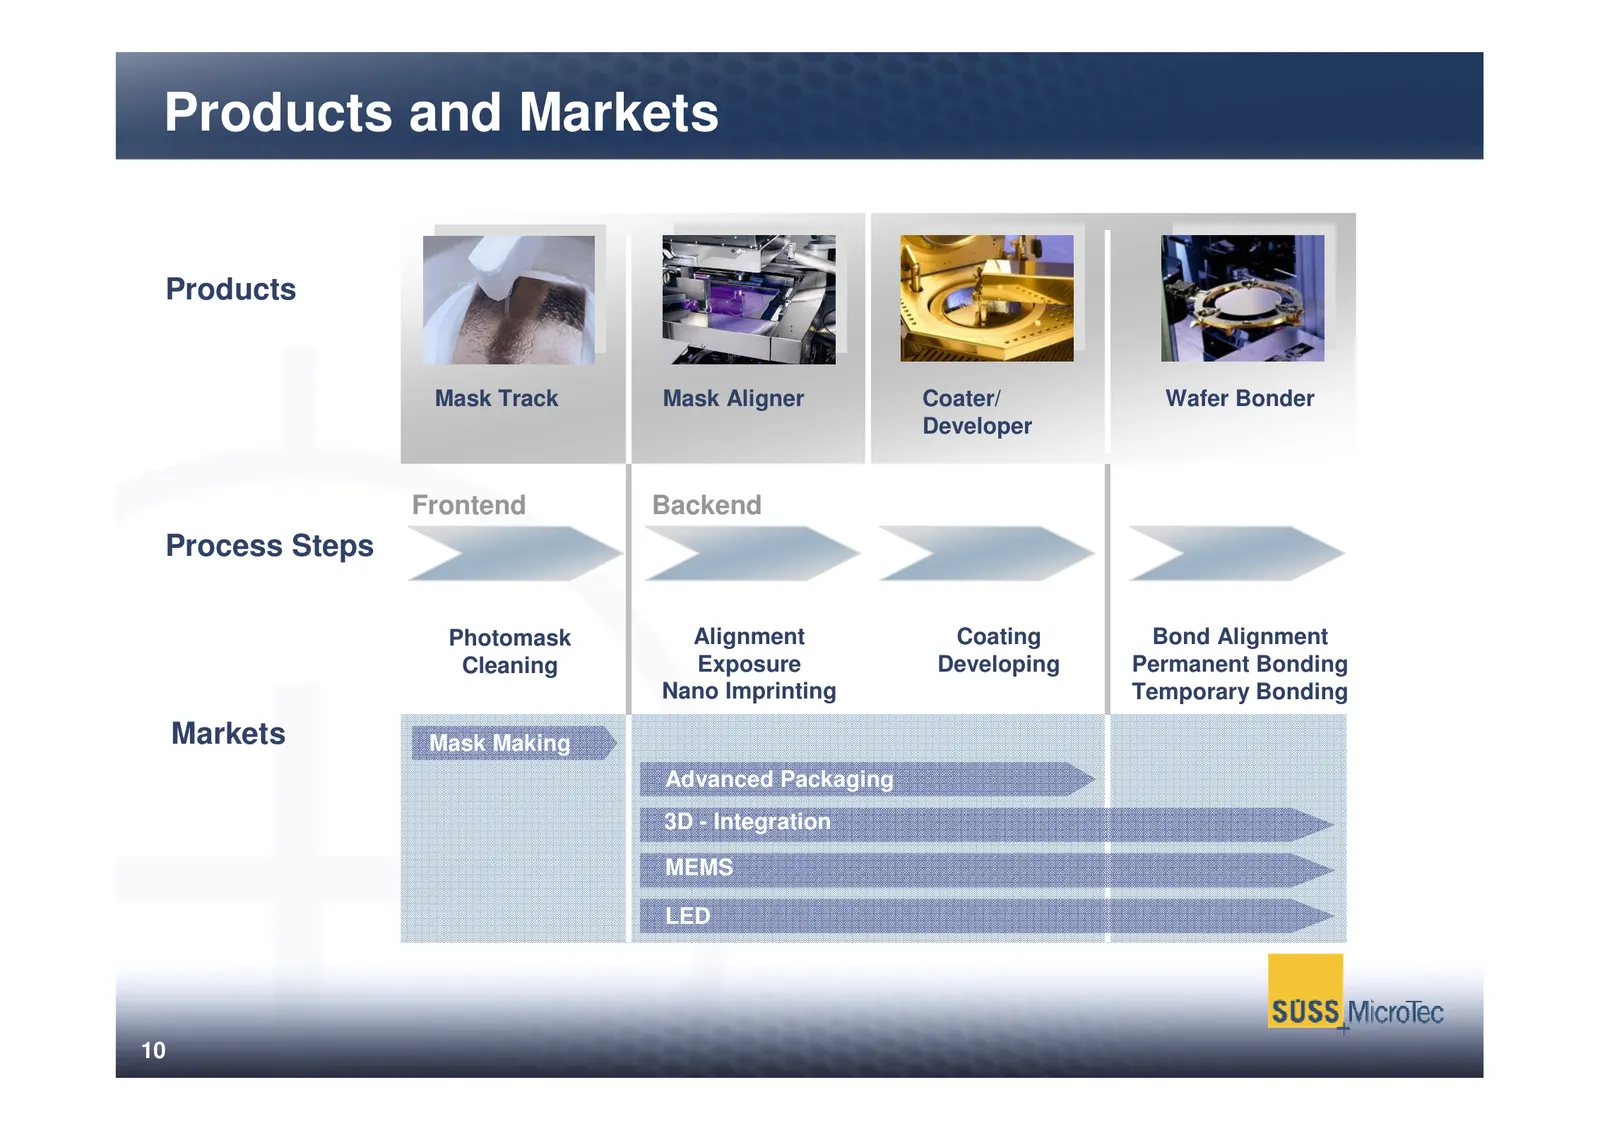
Products and Markets Products Mask Track Mask Aligner Coater/ Wafer Bonder Developer Frontend Backend Process Steps Photomask Alignment Coating Bond Alignment Cleaning Exposure Developing Permanent Bonding Nano Imprinting Temporary Bonding Markets Mask Making Advanced Packaging 3D - Integration MEMS
Slide 12: Semiconductors
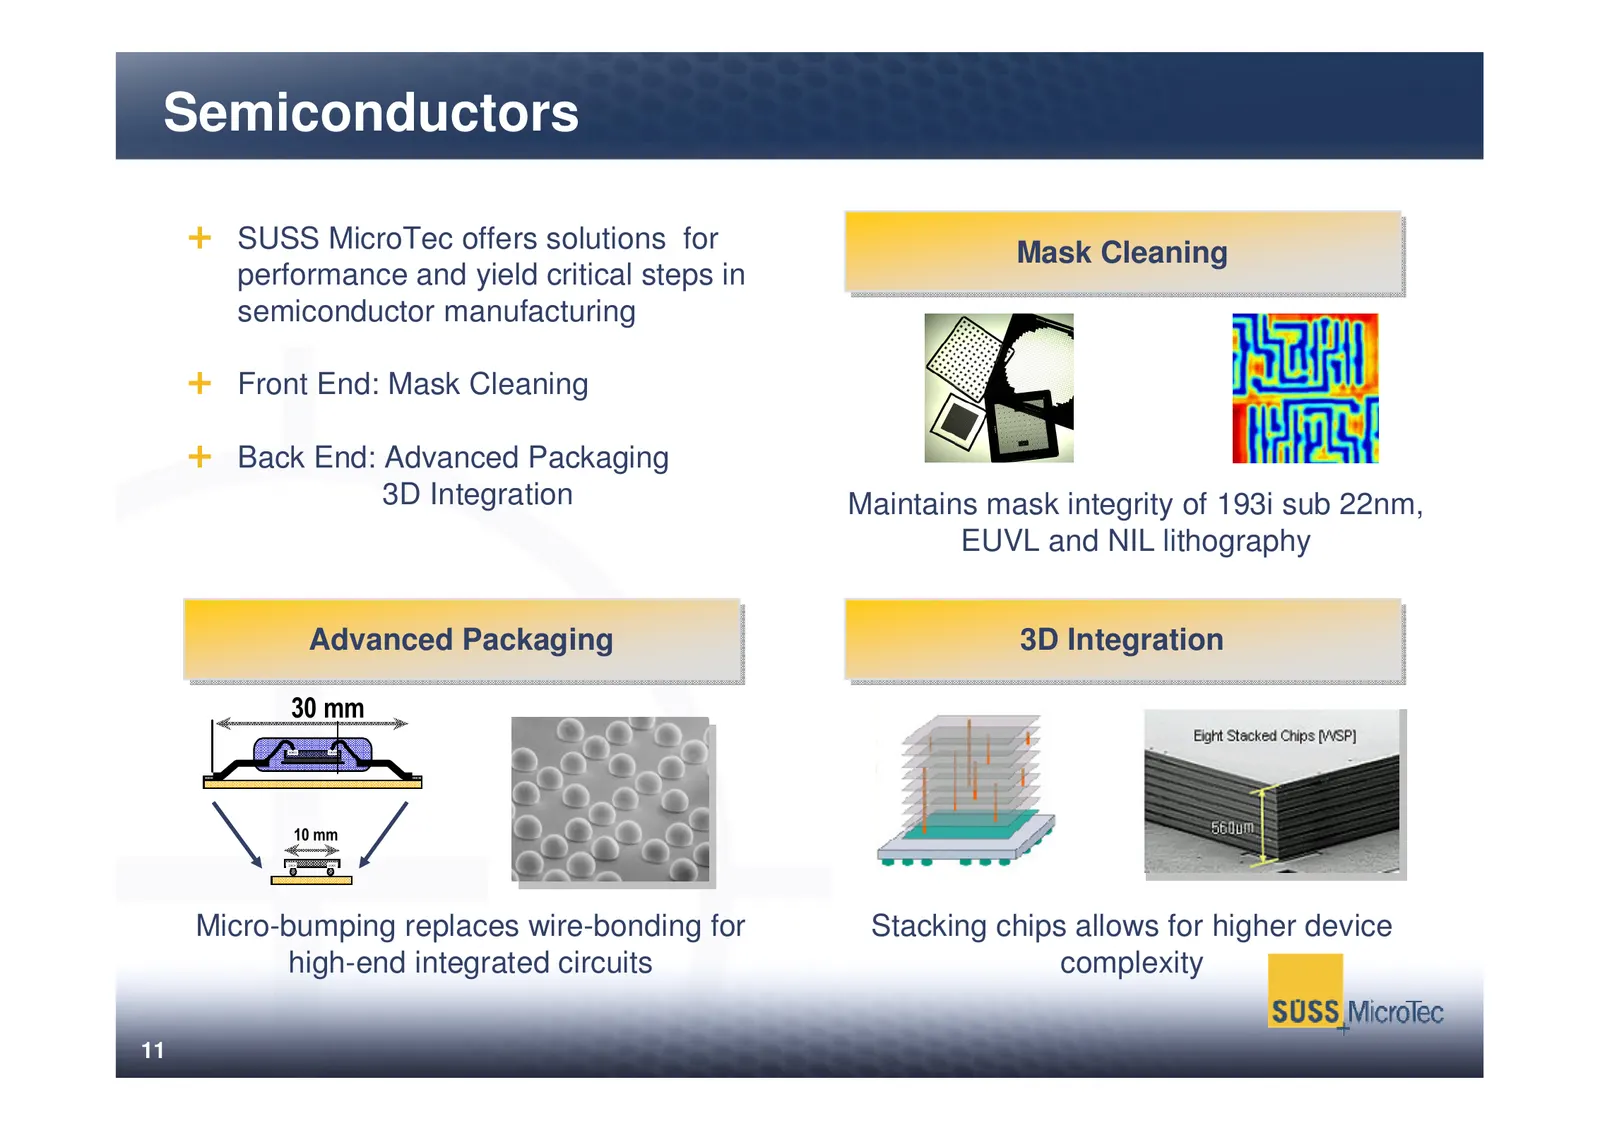
Semiconductors SUSS MicroTec offers solutions for Mask Mask Cleaning Cleaning performance and yield critical steps in semiconductor manufacturing Front End: Mask Cleaning Back End: Advanced Packaging 3D Integration Maintains mask integrity of 193i sub 22nm, EUVL and NIL lithography Advanced Advanced
Slide 13: MEMS and LED
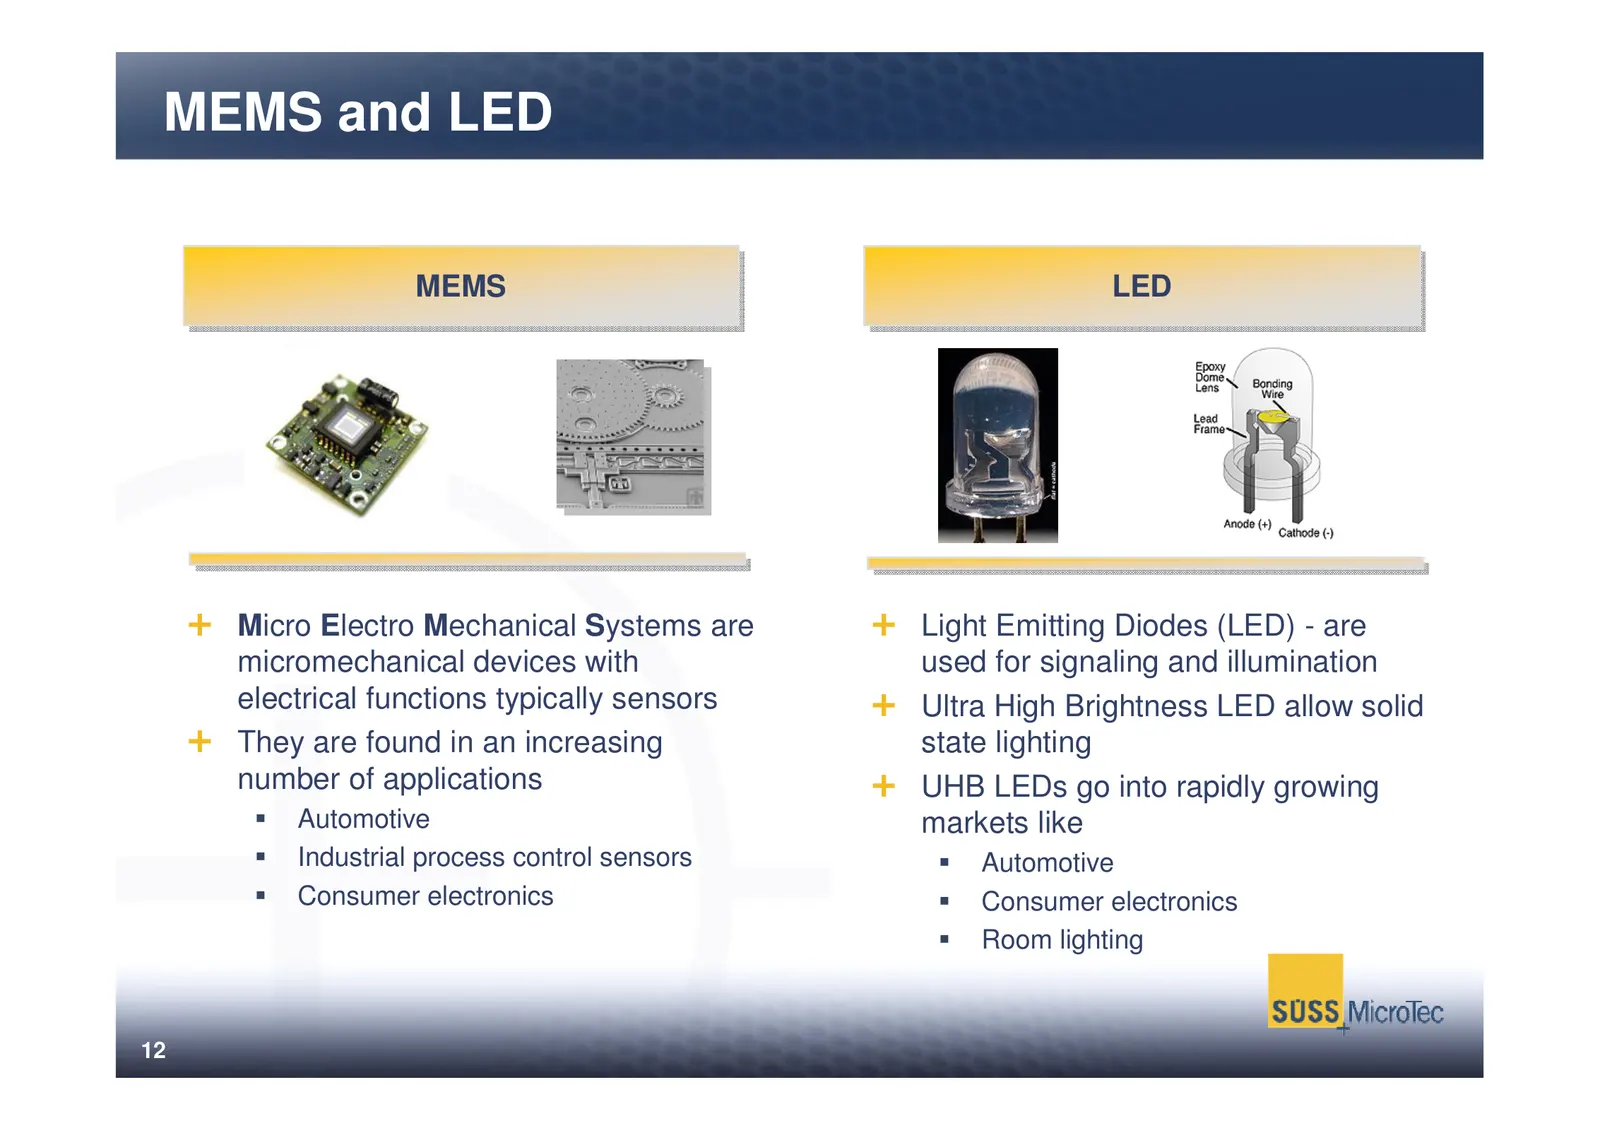
MEMS and LED MEMS MEMS LED LED Micro Electro Mechanical Systems are Light Emitting Diodes (LED) - are micromechanical devices with used for signaling and illumination electrical functions typically sensors Ultra High Brightness LED allow solid They are found in an increasing state lighting number of
Slide 14: Content
Content I. Executive Summary II. Products and Markets III. Growth Opportunities IV. Financials V. Outlook VI. Appendix 13
Slide 15: Mega Trends driving the Industry
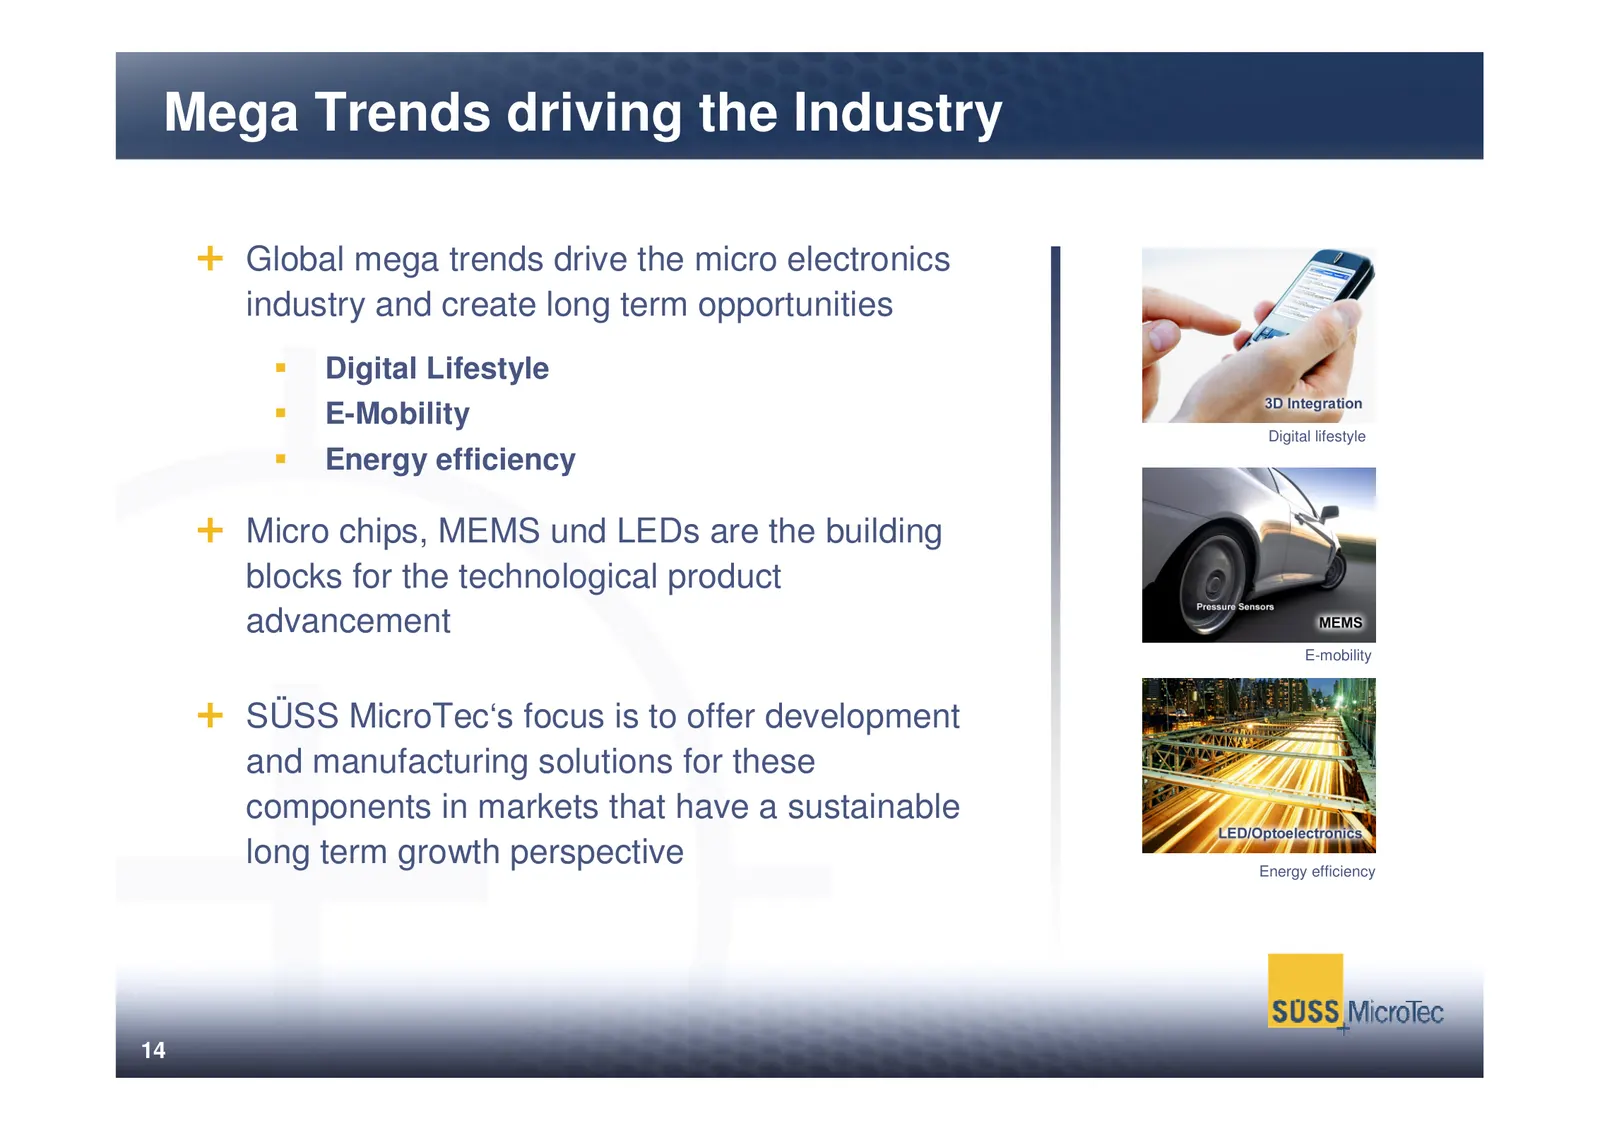
Mega Trends driving the Industry Global mega trends drive the micro electronics industry and create long term opportunities Digital Lifestyle E-Mobility Digital lifestyle Energy efficiency Micro chips, MEMS und LEDs are the building blocks for the technological product advancement E-mobility SÜSS Mi
Slide 16: Enabling Semiconductor Trends
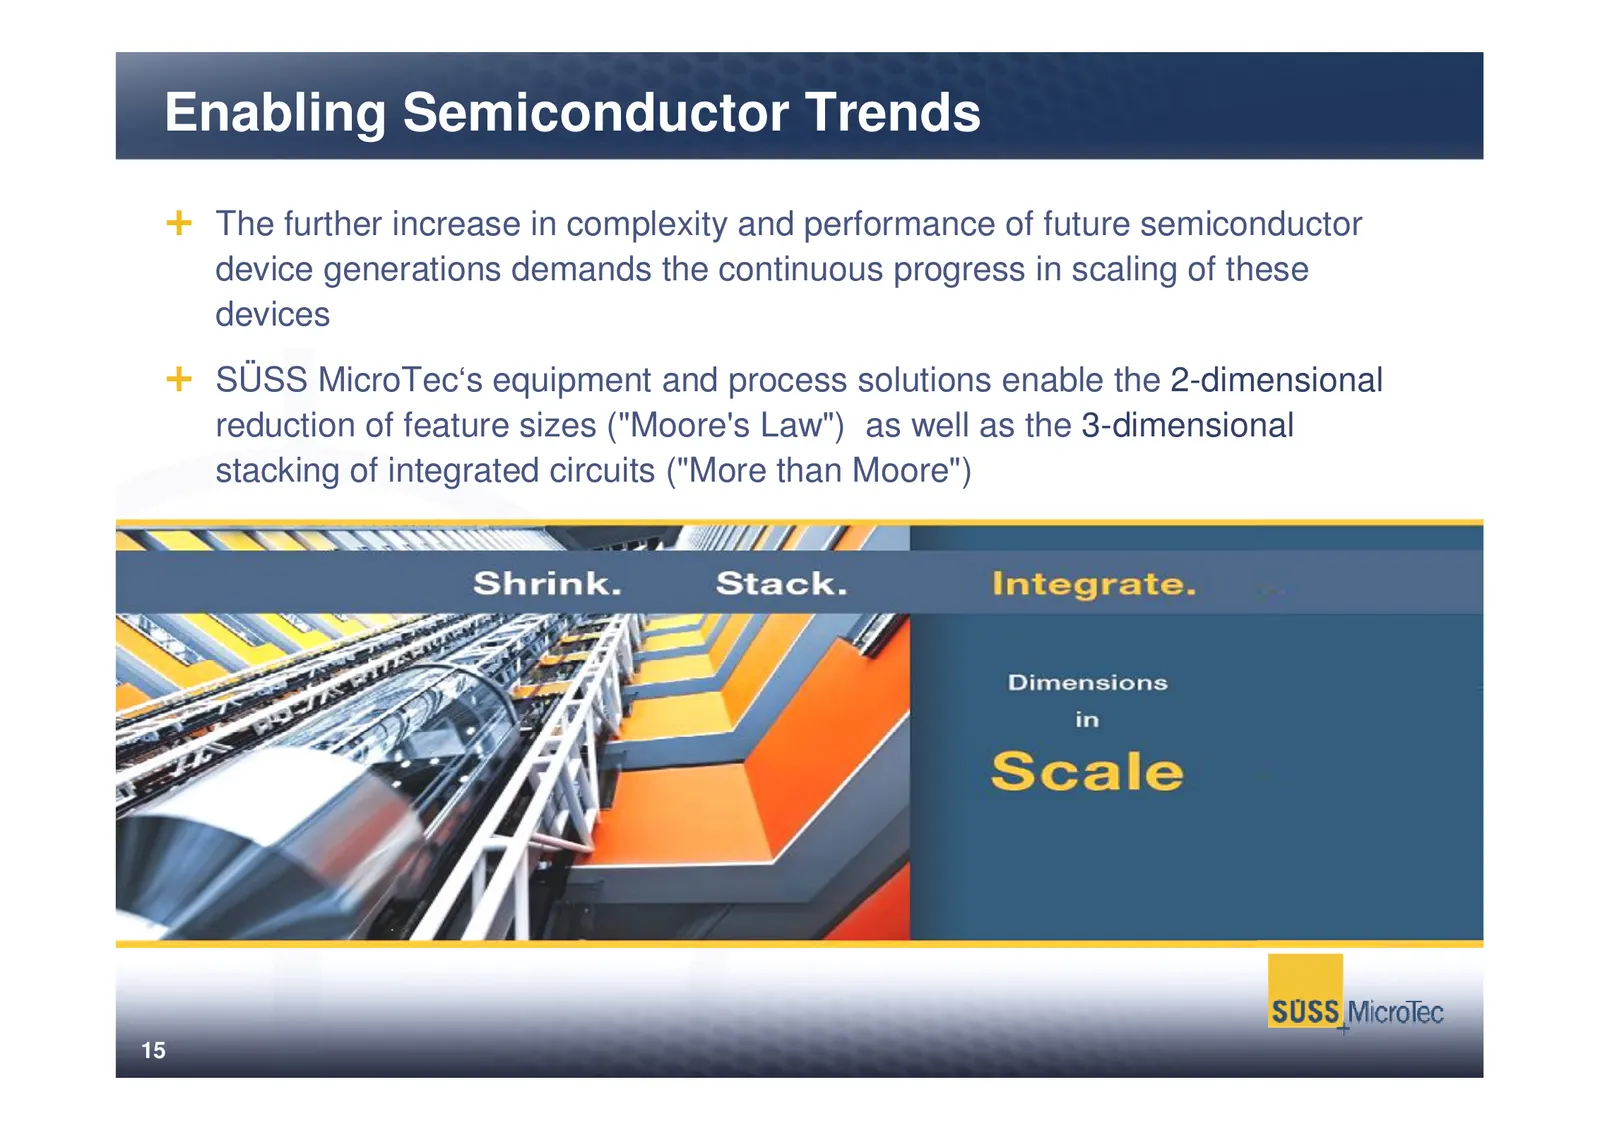
Enabling Semiconductor Trends The further increase in complexity and performance of future semiconductor device generations demands the continuous progress in scaling of these devices SÜSS MicroTec‘s equipment and process solutions enable the 2-dimensional reduction of feature sizes ("Moore's Law")
Slide 17: 2-D vs. 3-D Scaling
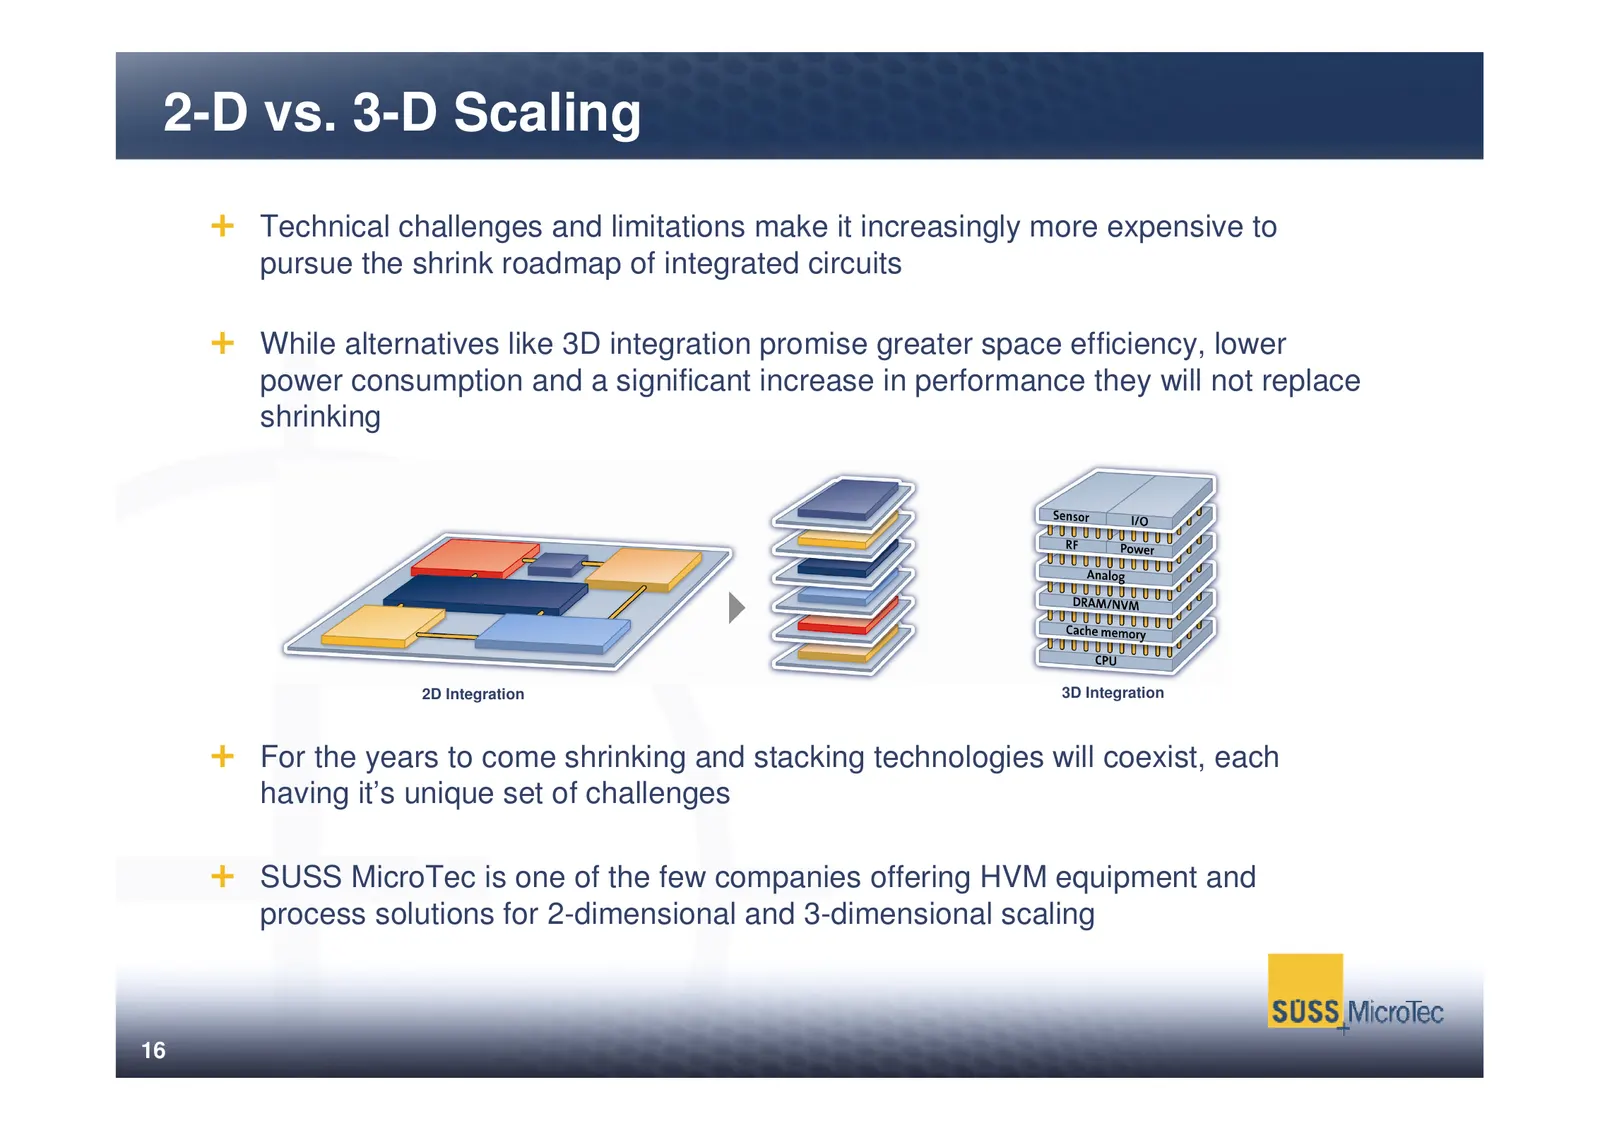
2-D vs. 3-D Scaling Technical challenges and limitations make it increasingly more expensive to pursue the shrink roadmap of integrated circuits While alternatives like 3D integration promise greater space efficiency, lower power consumption and a significant increase in performance they will not re
Slide 18: Growth Opportunities
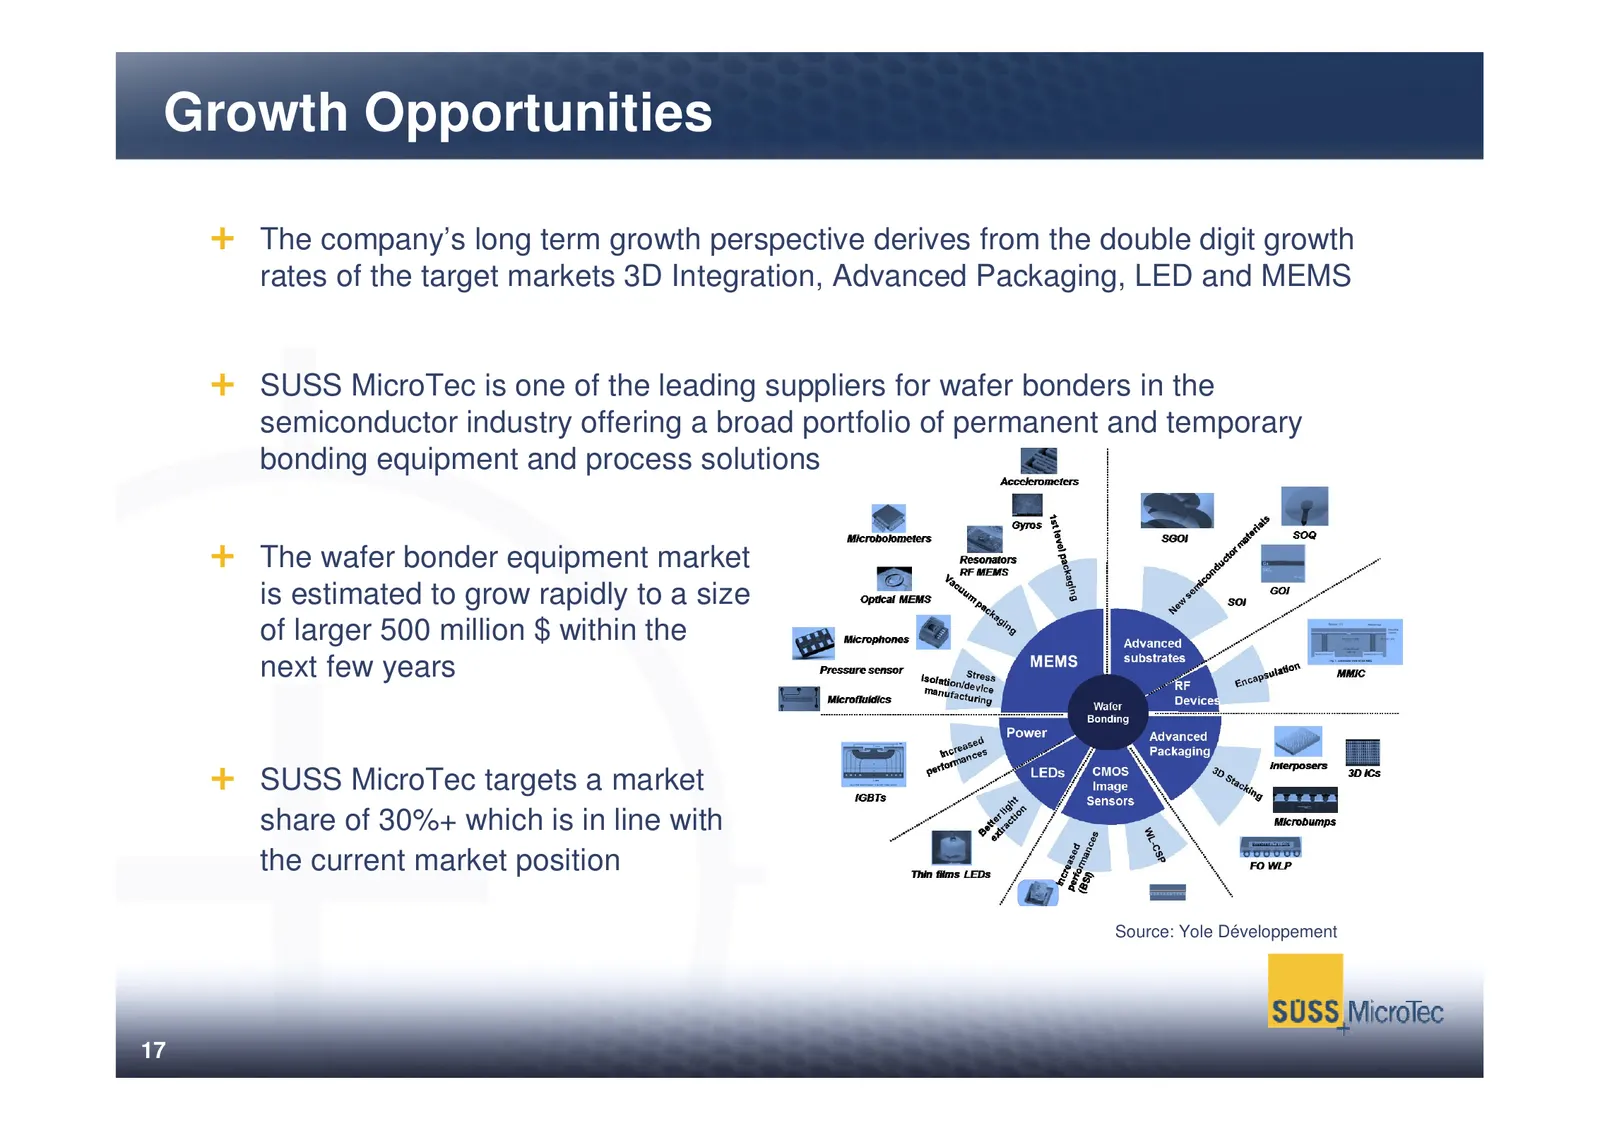
Growth Opportunities The company’s long term growth perspective derives from the double digit growth rates of the target markets 3D Integration, Advanced Packaging, LED and MEMS SUSS MicroTec is one of the leading suppliers for wafer bonders in the semiconductor industry offering a broad portfolio o
Slide 19: Market Forecasts
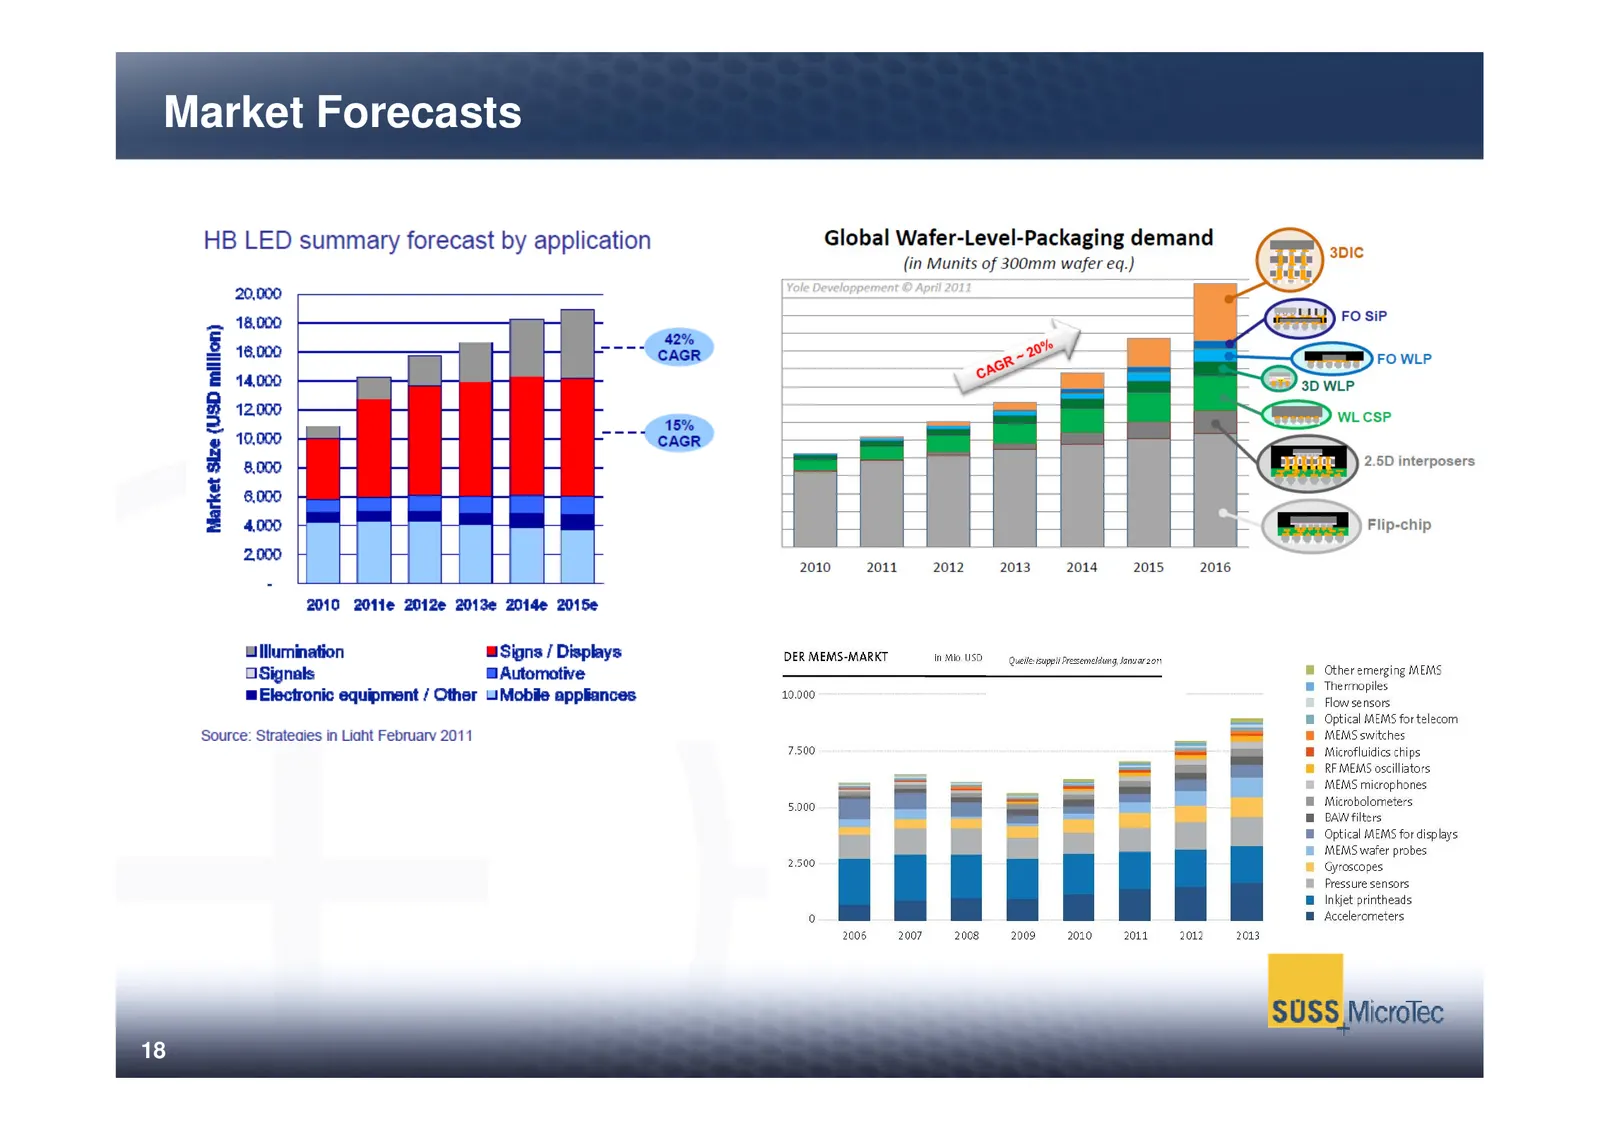
Market Forecasts HB LED summary forecast by application 20,000 18,000 18,000 14,000 12,000 10,000 Market Size (USD million) Ulllurnination OSignals 2010 2011e Wize 2013e 2Wide 2015e Signs / Displays BAutomotive Electronic equipment / Other 4 Mobile appliances Source: Strateaies in Liaht February 201
Slide 20: Sternenfels – Site for volume manufacturing
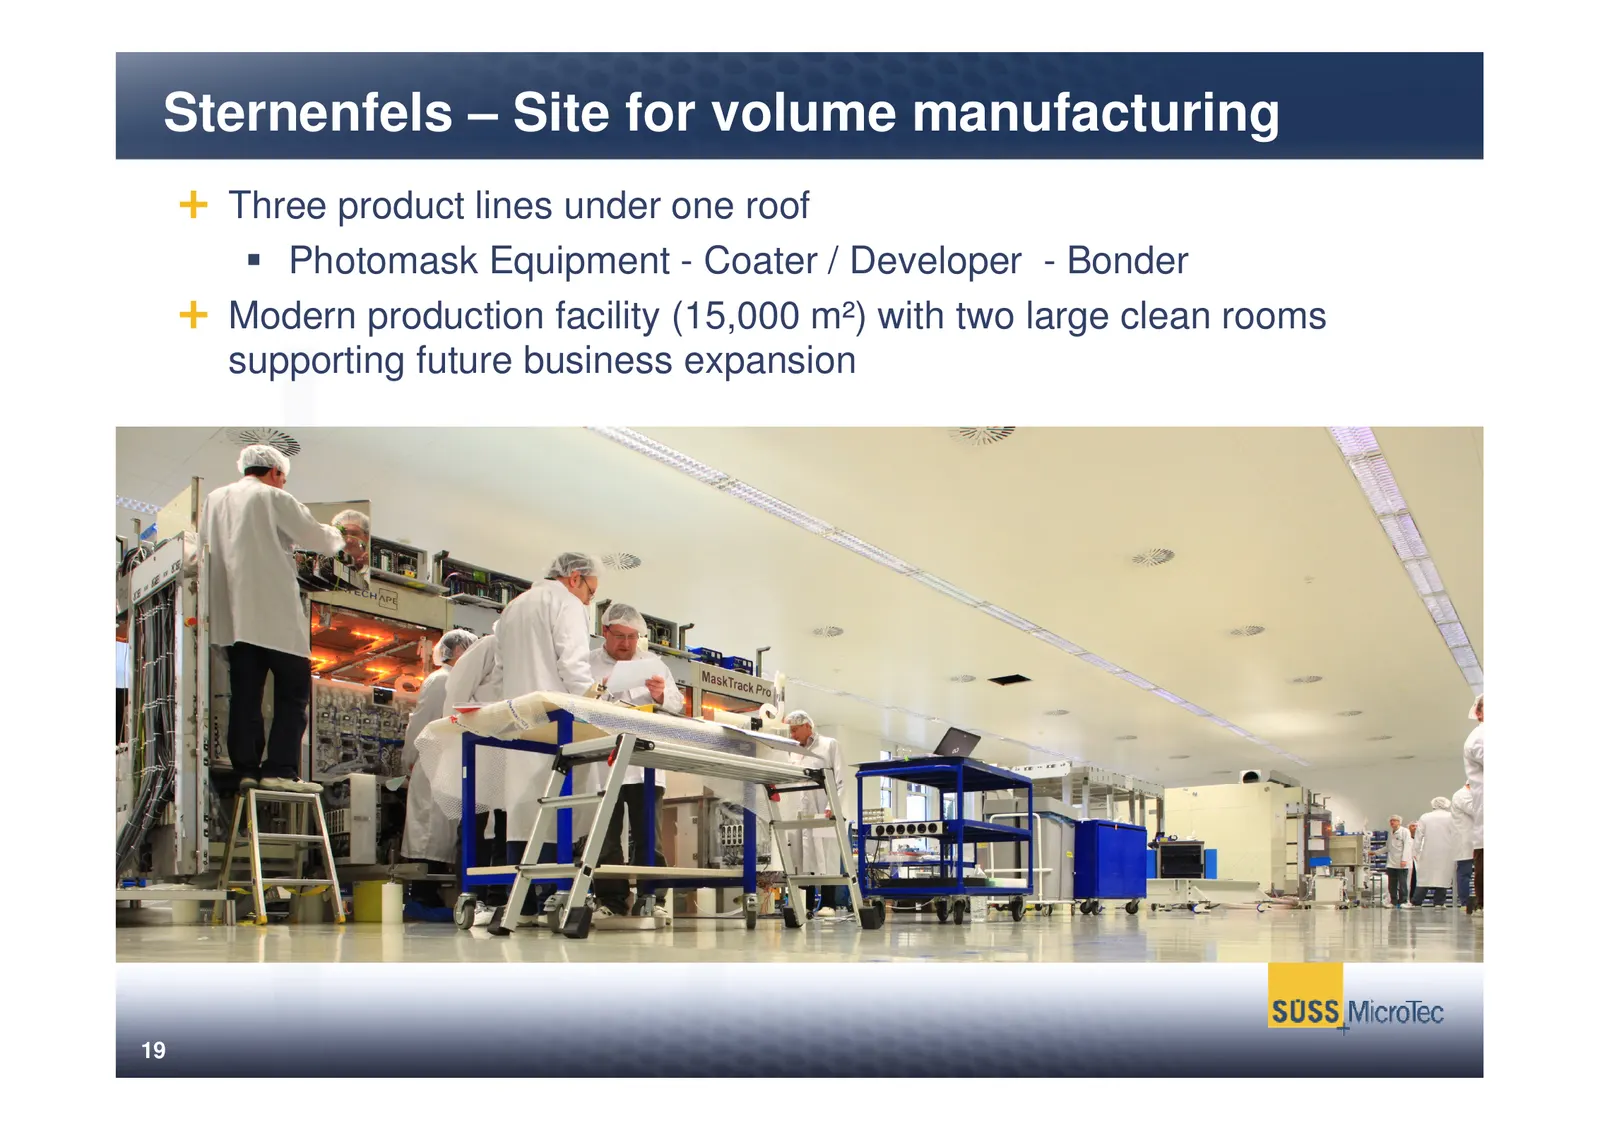
Sternenfels – Site for volume manufacturing Three product lines under one roof Photomask Equipment - Coater / Developer - Bonder Modern production facility (15,000 m²) with two large clean rooms supporting future business expansion 19
Slide 21: Shaping the future
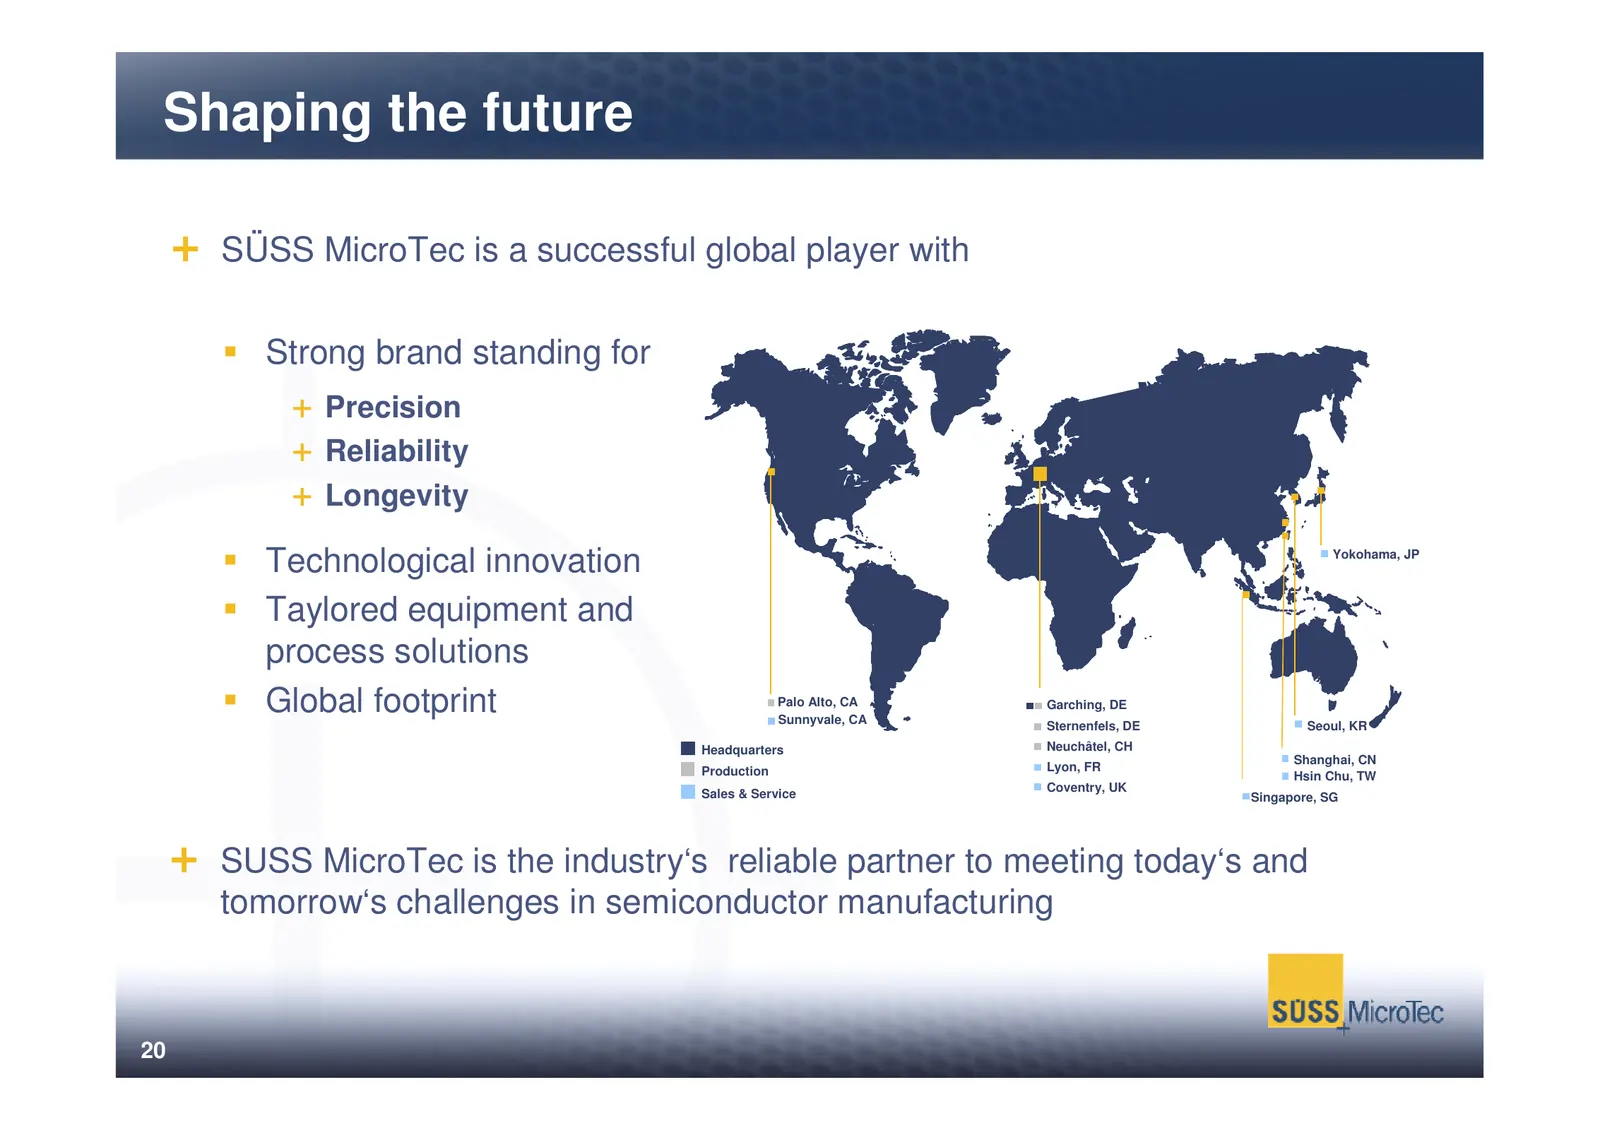
Shaping the future SÜSS MicroTec is a successful global player with Strong brand standing for Precision Reliability Longevity Technological innovation Yokohama, JP Taylored equipment and process solutions Global footprint Palo Alto, CA Sunnyvale, CA Garching, DE Sternenfels, DE Seoul, KR Headquarter
Slide 22: Content
Content I. Executive Summary II. Products and Markets III. Growth Opportunities IV. Financials V. Outlook VI. Appendix 21
Slide 23: 30 Months Business Development
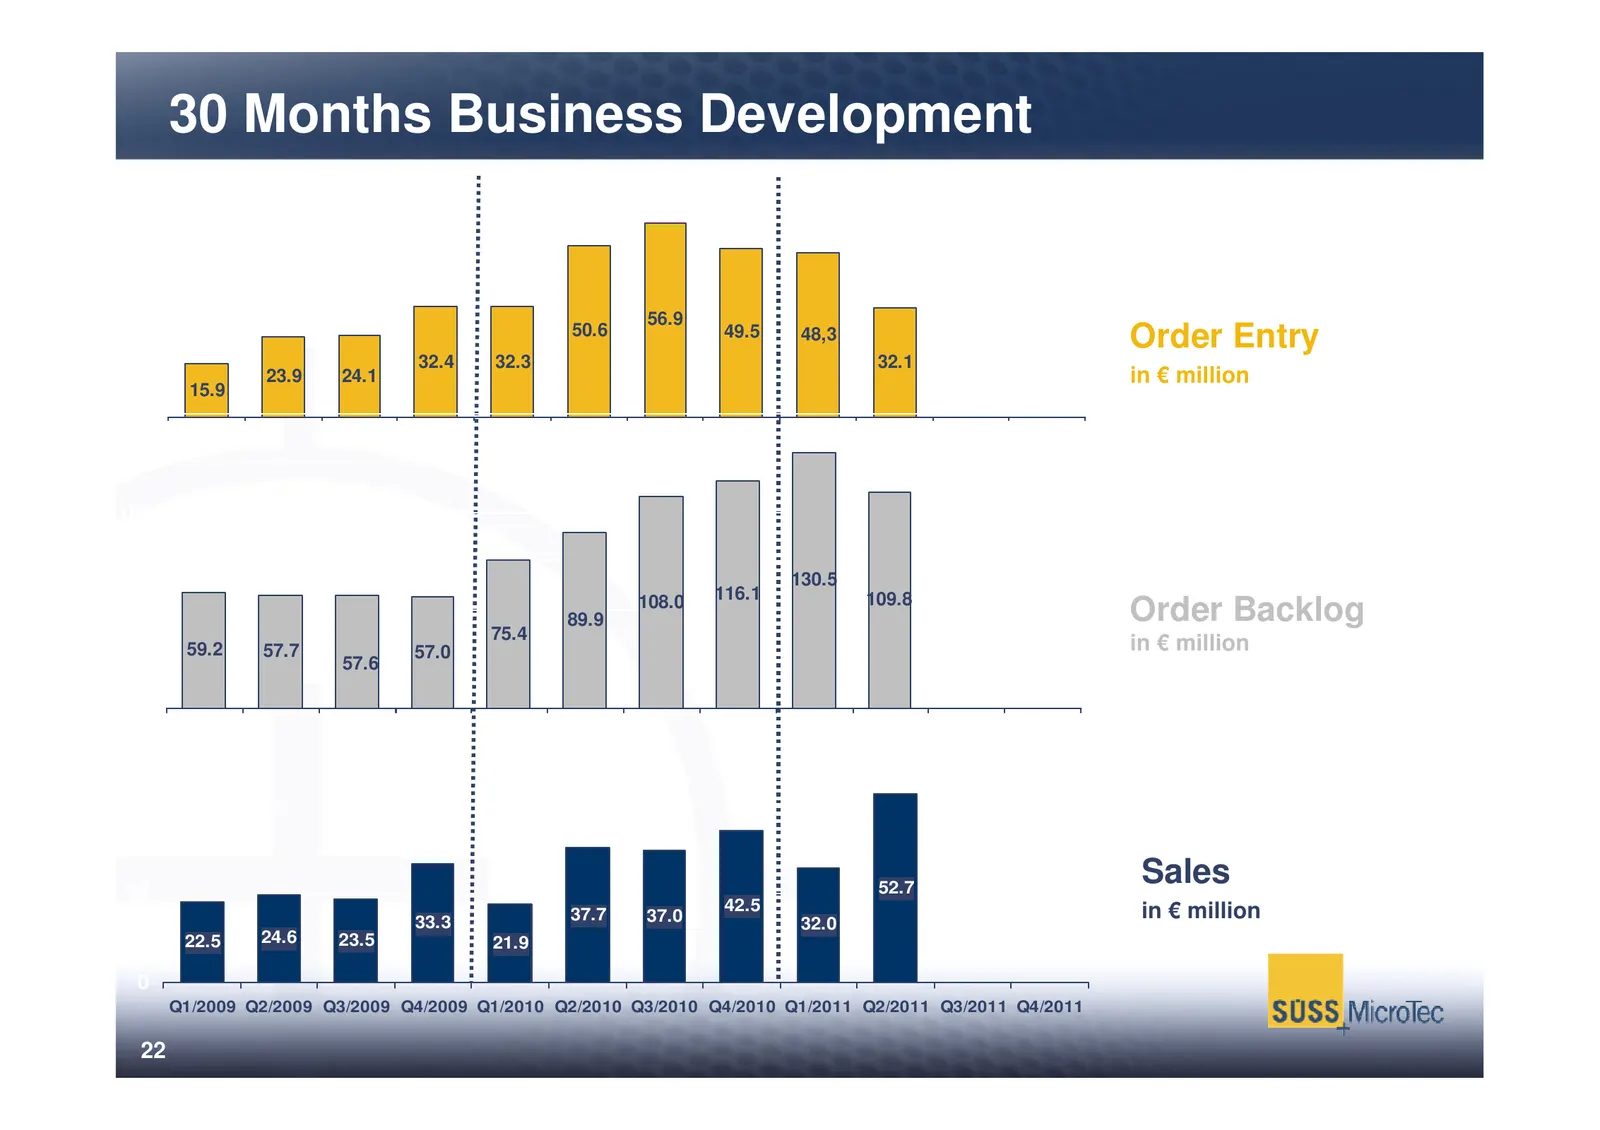
30 Months Business Development 56.9 50.6 49.5 48,3 Order Entry 32.4 32.3 32.1 23.9 24.1 in € million 15.9 150 125 100 75 130.5 116.1 109.8 50 89.9 108.0 Order Backlog 75.4 59.2 57.7 57.0 in € million 25 57.6 750 50 52.7 Sales 25 42.5 in € million 33.3 37.7 37.0 32.0 22.5 24.6 23.5 21.9 0 Q1/2009 Q2/
Slide 24: EBIT, Free Cash Flow and Net Cash Development
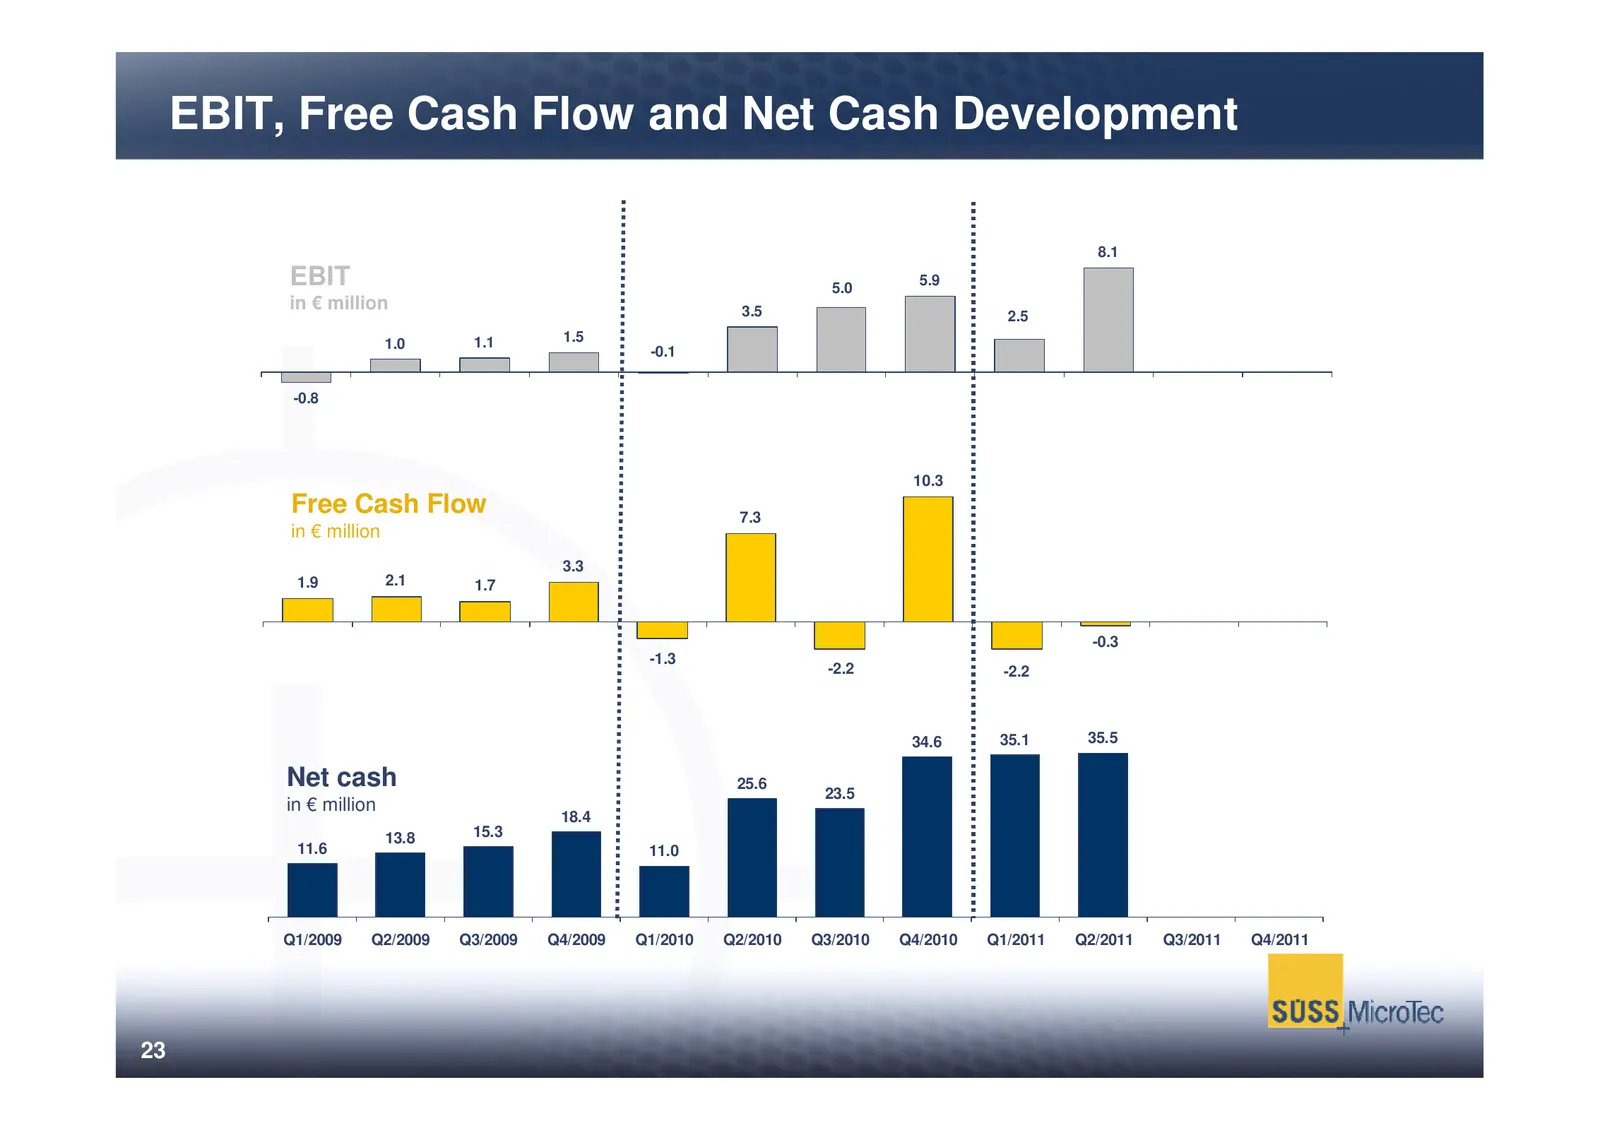
EBIT, Free Cash Flow and Net Cash Development 8.1 EBIT 5.0 5.9 in € million 3.5 2.5 1.0 1.1 1.5 -0.1 20 -0.8 15 10.3 10 Free Cash Flow 7.3 in € million 5 3.3 1.9 2.1 1.7 0 -0.3 -1.3 -2.2 -2.2 -5 34.6 35.1 35.5 Net cash 25.6 23.5 in € million 18.4 13.8 15.3 11.6 11.0 Q1/2009 Q2/2009 Q3/2009 Q4/2009 Q
Slide 25: Key Financials
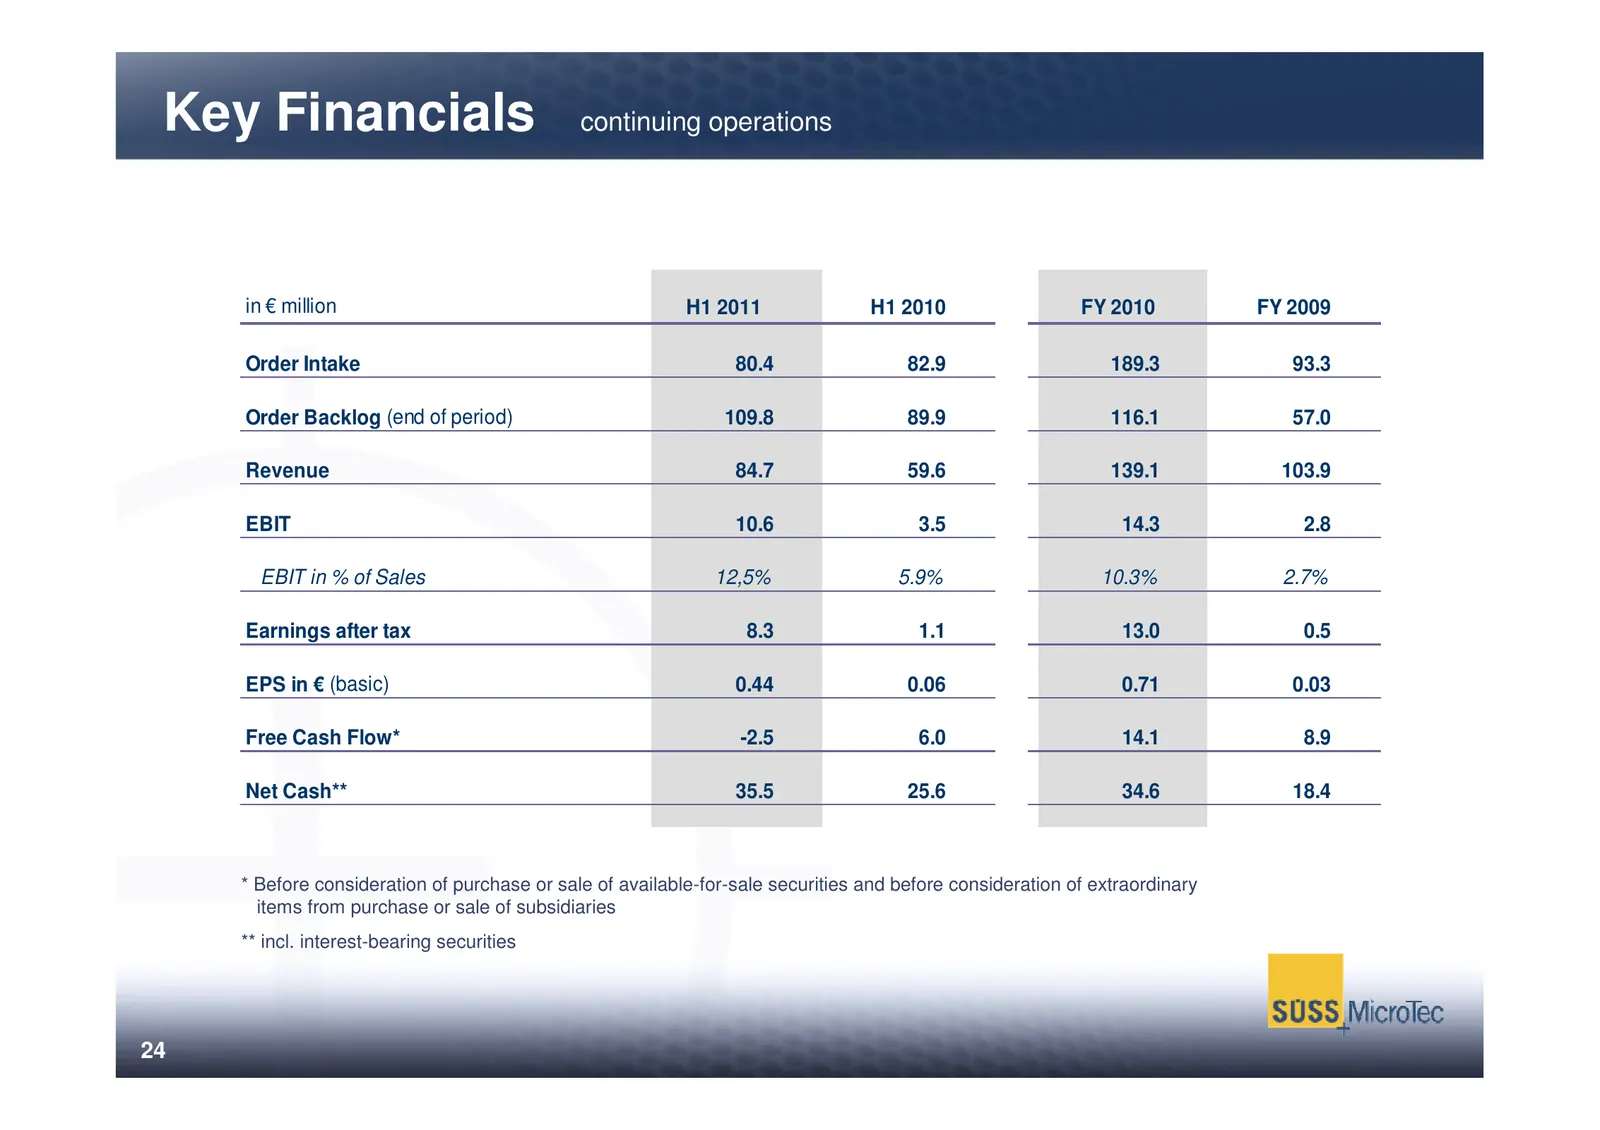
Key Financials continuing operations in € million H1 2011 H1 2010 FY 2010 FY 2009 Order Intake 80.4 82.9 189.3 93.3 Order Backlog (end of period) 109.8 89.9 116.1 57.0 Revenue 84.7 59.6 139.1 103.9 EBIT 10.6 3.5 14.3 2.8 EBIT in % of Sales 12,5% 5.9% 10.3% 2.7% Earnings after tax 8.3 1.1 13.0 0.5 EP
Slide 26: Segment Reporting H1 2011
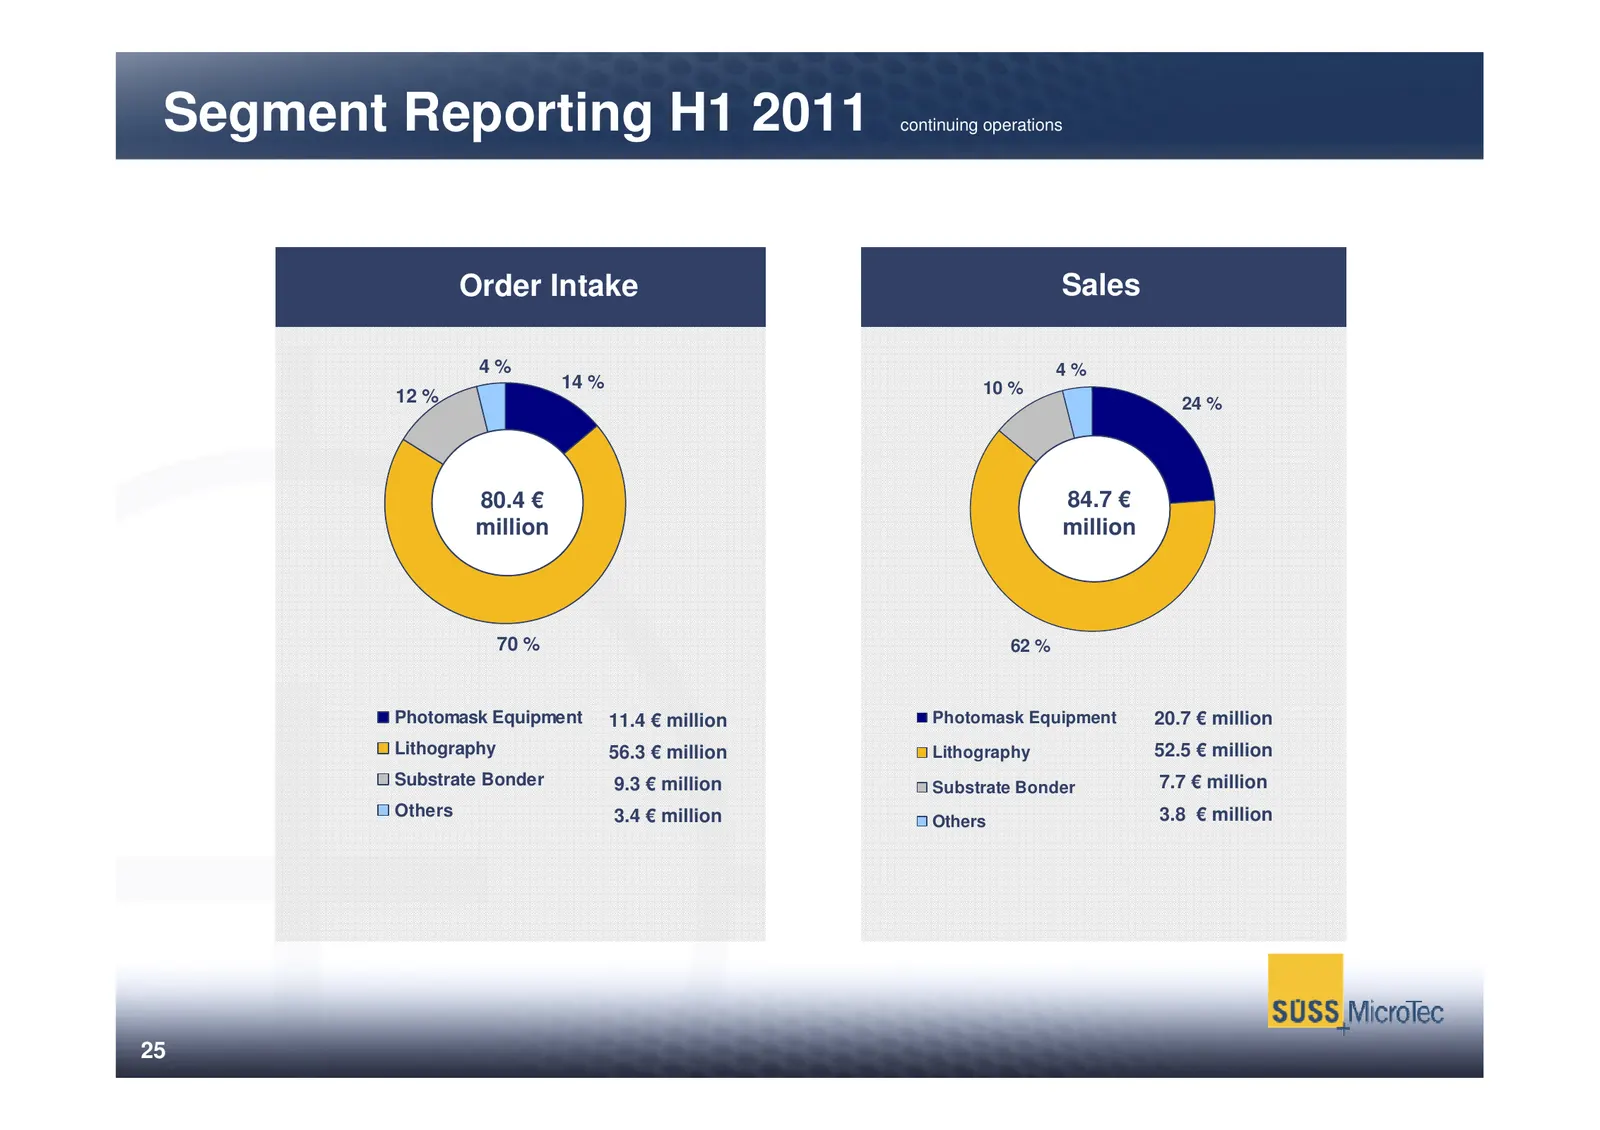
Segment Reporting H1 2011 continuing operations Order Intake Sales 4% 4% 14 % 10 % 12 % 24 % 80.4 € 84.7 € million million 70 % 62 % Photomask Equipment 11.4 € million Photomask Equipment 20.7 € million Lithography 56.3 € million Lithography 52.5 € million Substrate Bonder 9.3 € million Substrate Bo
Slide 27: Segment Reporting H1 2011 continuing operations
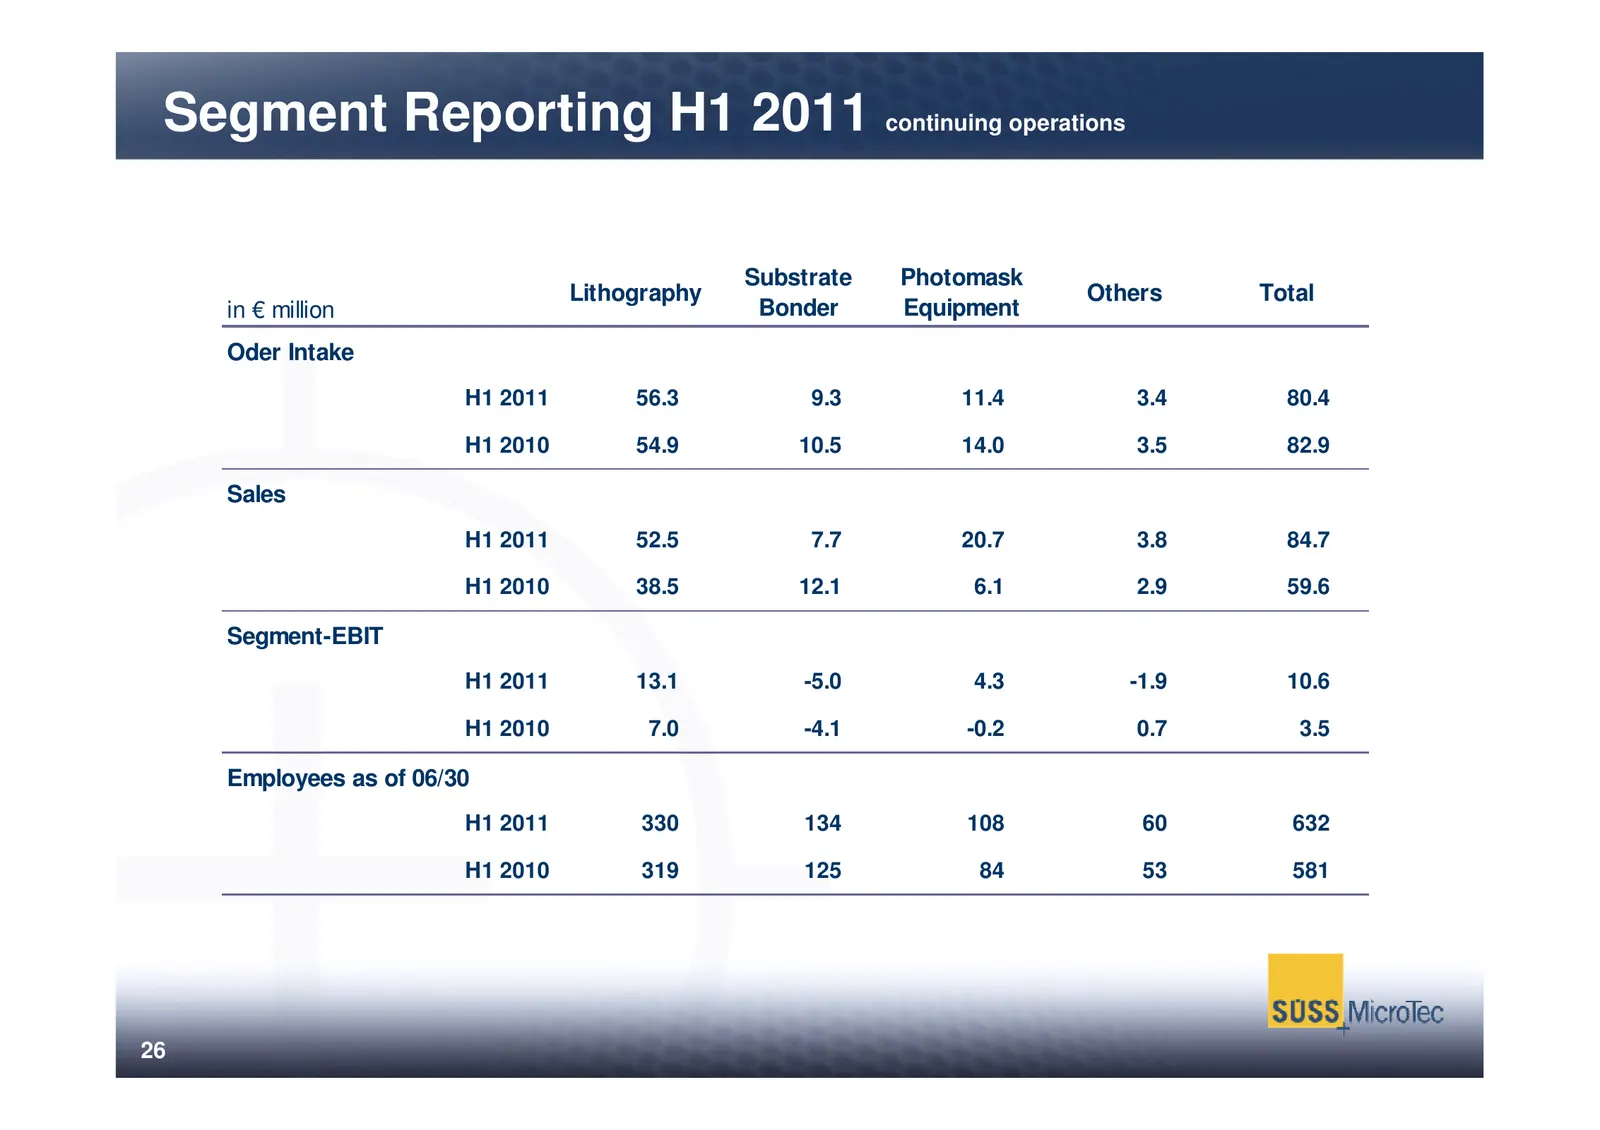
Segment Reporting H1 2011 continuing operations Substrate Photomask Lithography Others Total in € million Bonder Equipment Oder Intake H1 2011 56.3 9.3 11.4 3.4 80.4 H1 2010 54.9 10.5 14.0 3.5 82.9 Sales H1 2011 52.5 7.7 20.7 3.8 84.7 H1 2010 38.5 12.1 6.1 2.9 59.6 Segment-EBIT H1 2011 13.1 -5.0 4.3
Slide 28: Content
Content I. Executive Summary II. Products and Markets III. Growth Opportunities IV. Financials V. Outlook VI. Appendix 27
Slide 29: Outlook
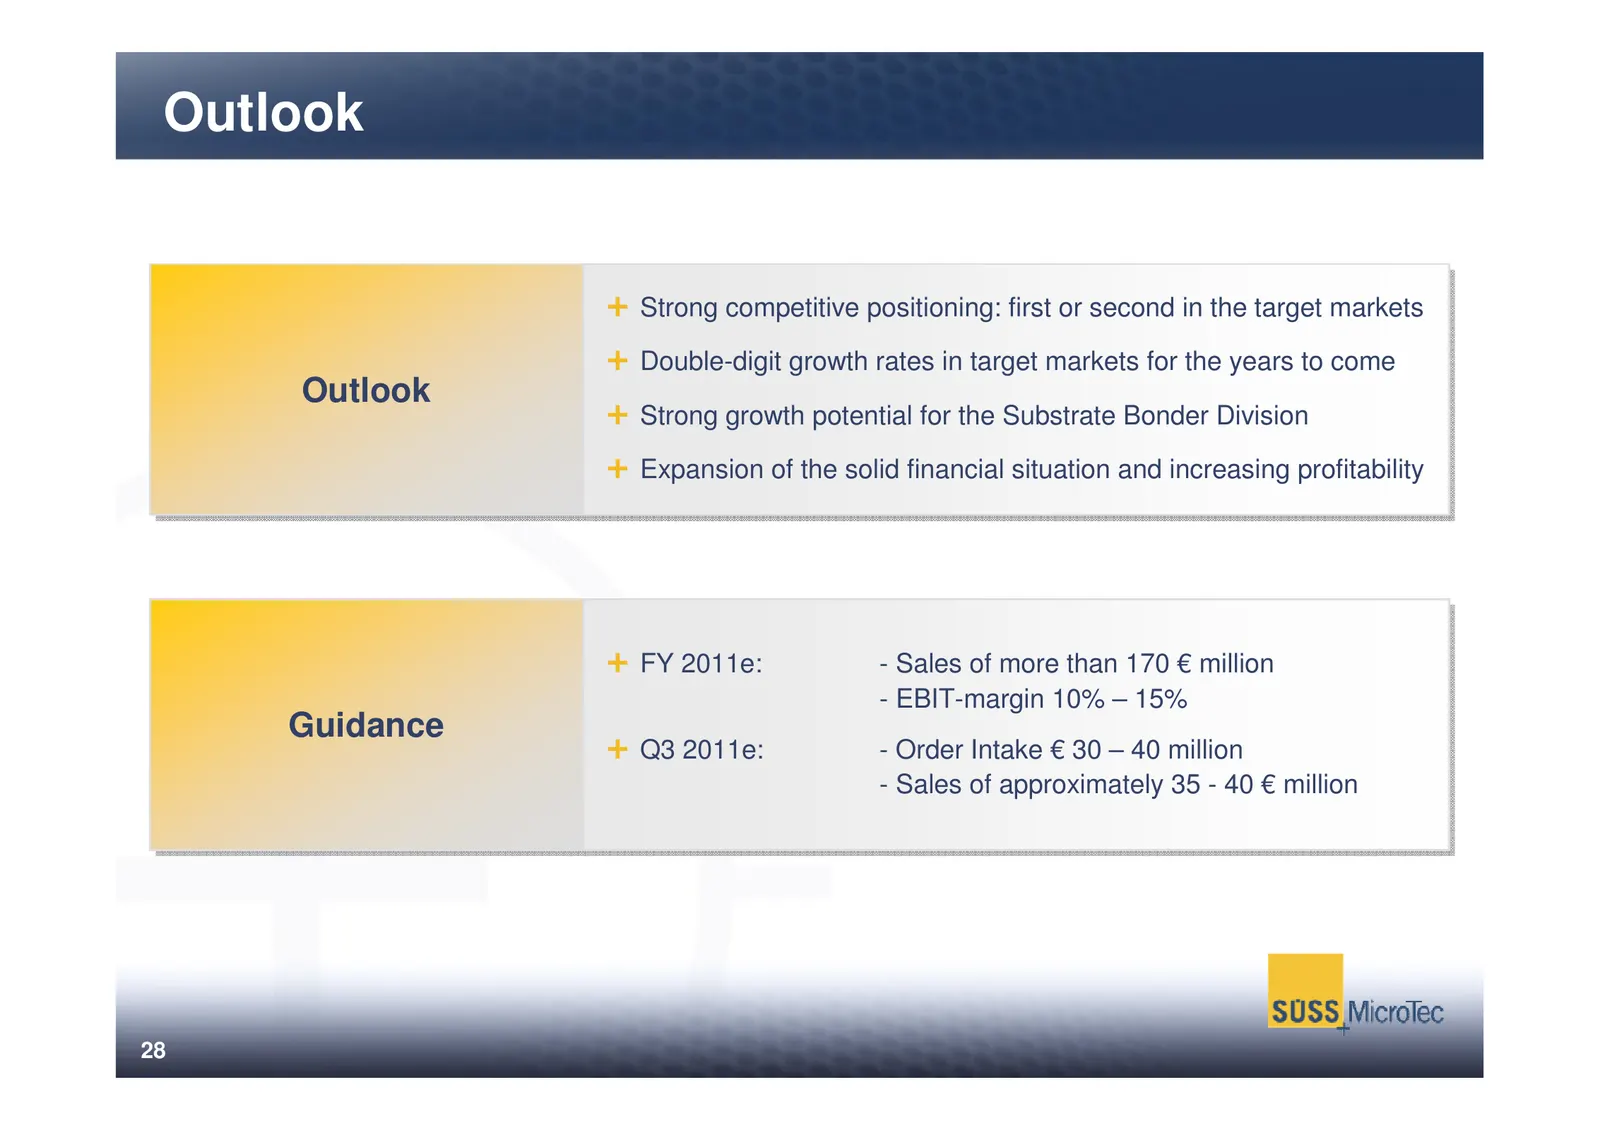
Outlook Strong competitive positioning: first or second in the target markets Double-digit growth rates in target markets for the years to come Outlook Outlook Strong growth potential for the Substrate Bonder Division Expansion of the solid financial situation and increasing profitability FY 2011e:
Slide 30: Investment case
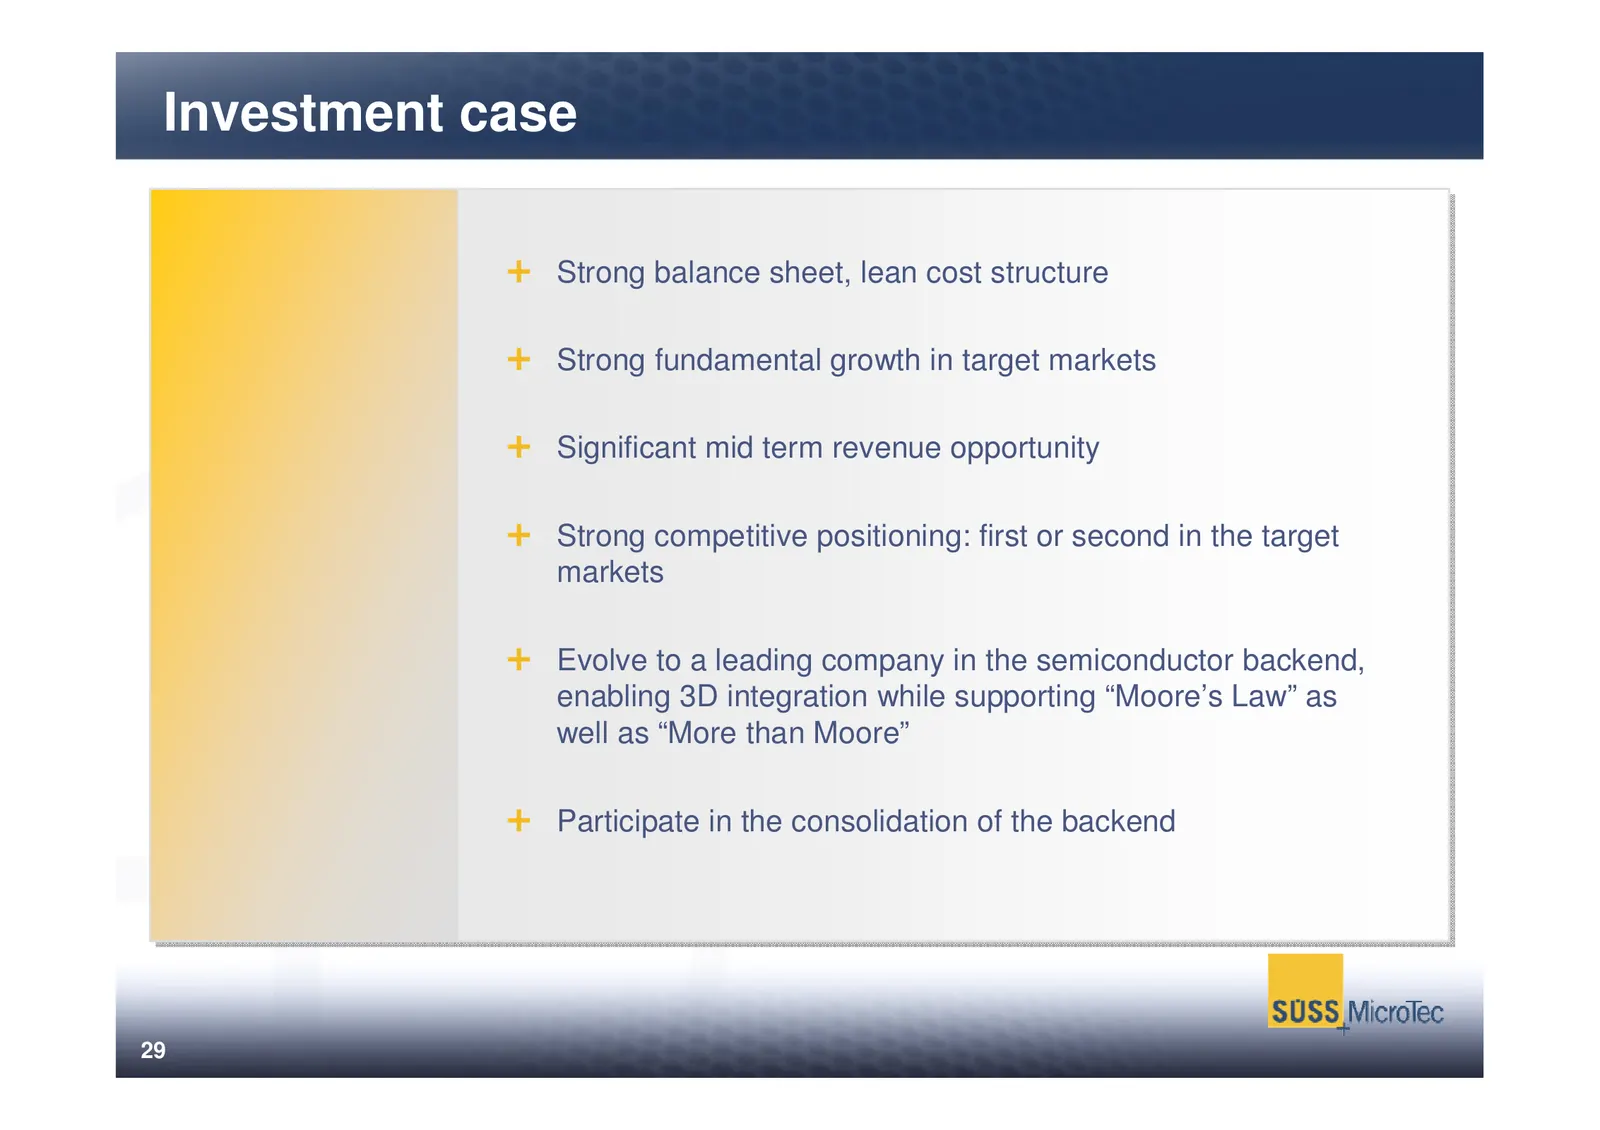
Investment case Strong balance sheet, lean cost structure Strong fundamental growth in target markets Significant mid term revenue opportunity Strong competitive positioning: first or second in the target markets Evolve to a leading company in the semiconductor backend, enabling 3D integration while
Slide 31: Content
Content I. Executive Summary II. Products and Markets III. Growth Opportunities IV. Financials V. Outlook VI. Appendix 30
Slide 32: SUSS MicroTec Share - Overview
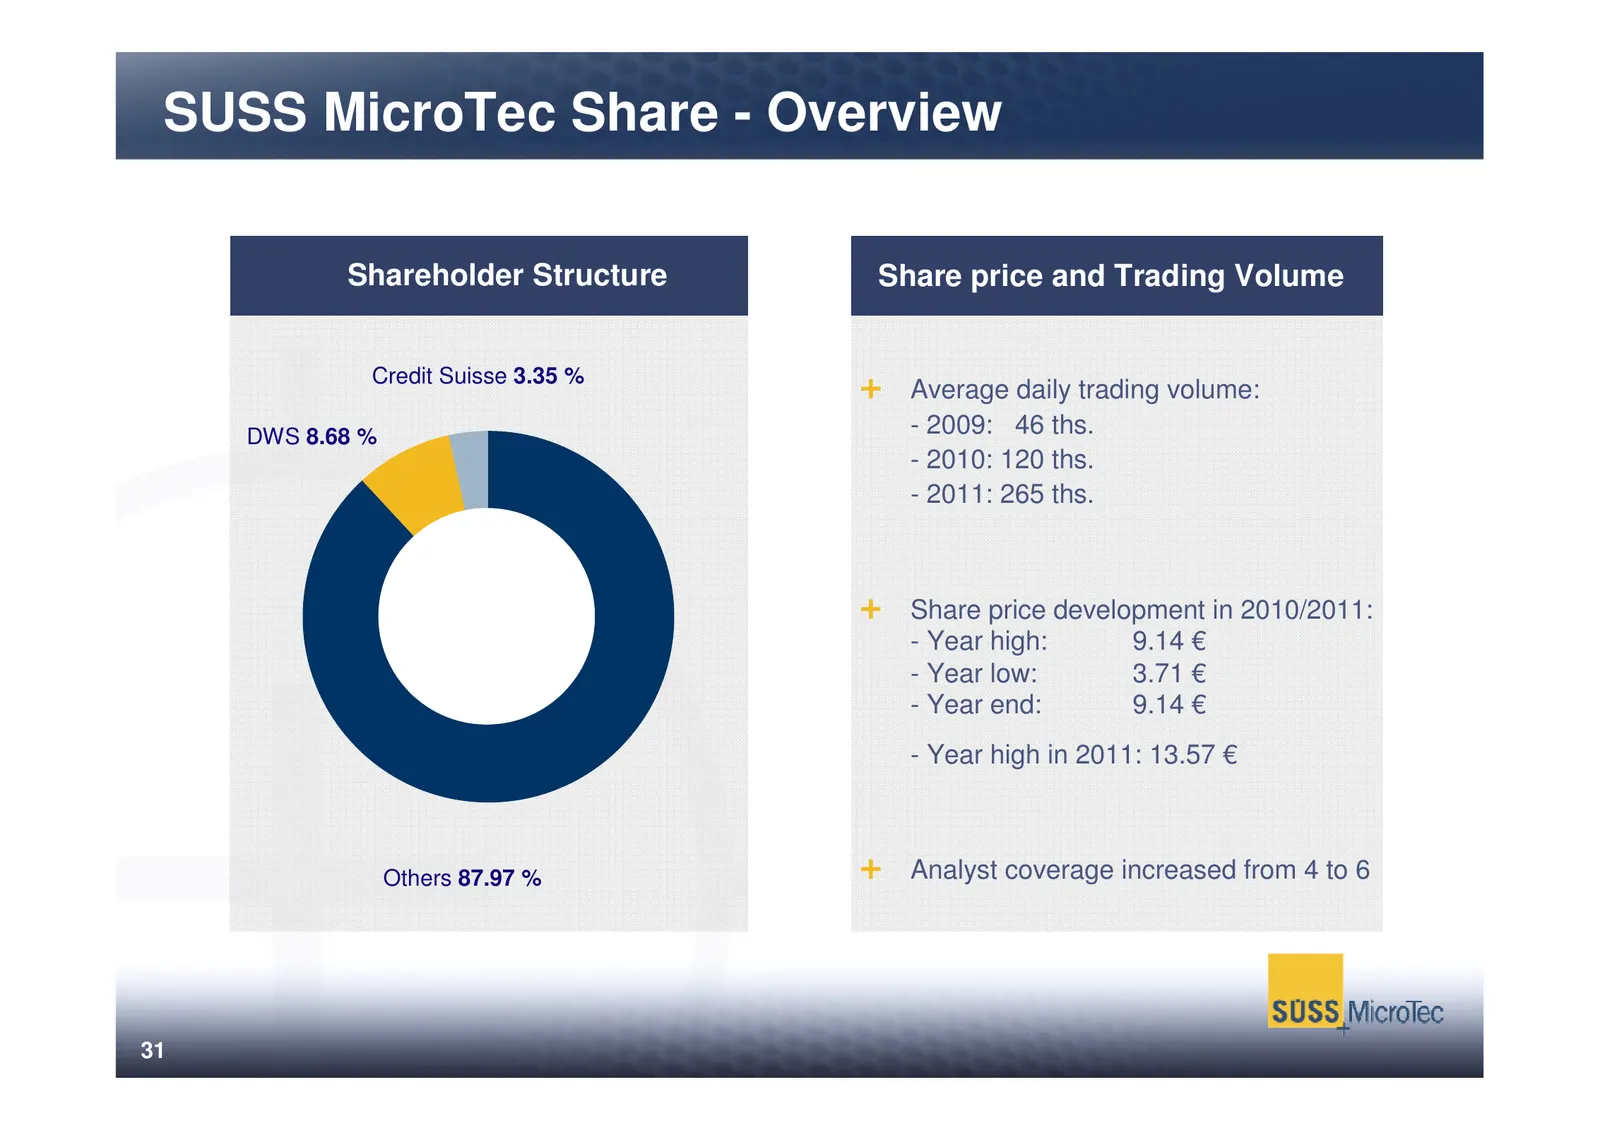
SUSS MicroTec Share - Overview Shareholder Structure Share price and Trading Volume Credit Suisse 3.35 % Average daily trading volume: DWS 8.68 % - 2009: 46 ths. - 2010: 120 ths. - 2011: 265 ths. Share price development in 2010/2011: - Year high: 9.14 € - Year low: 3.71 € - Year end: 9.14 € - Year h
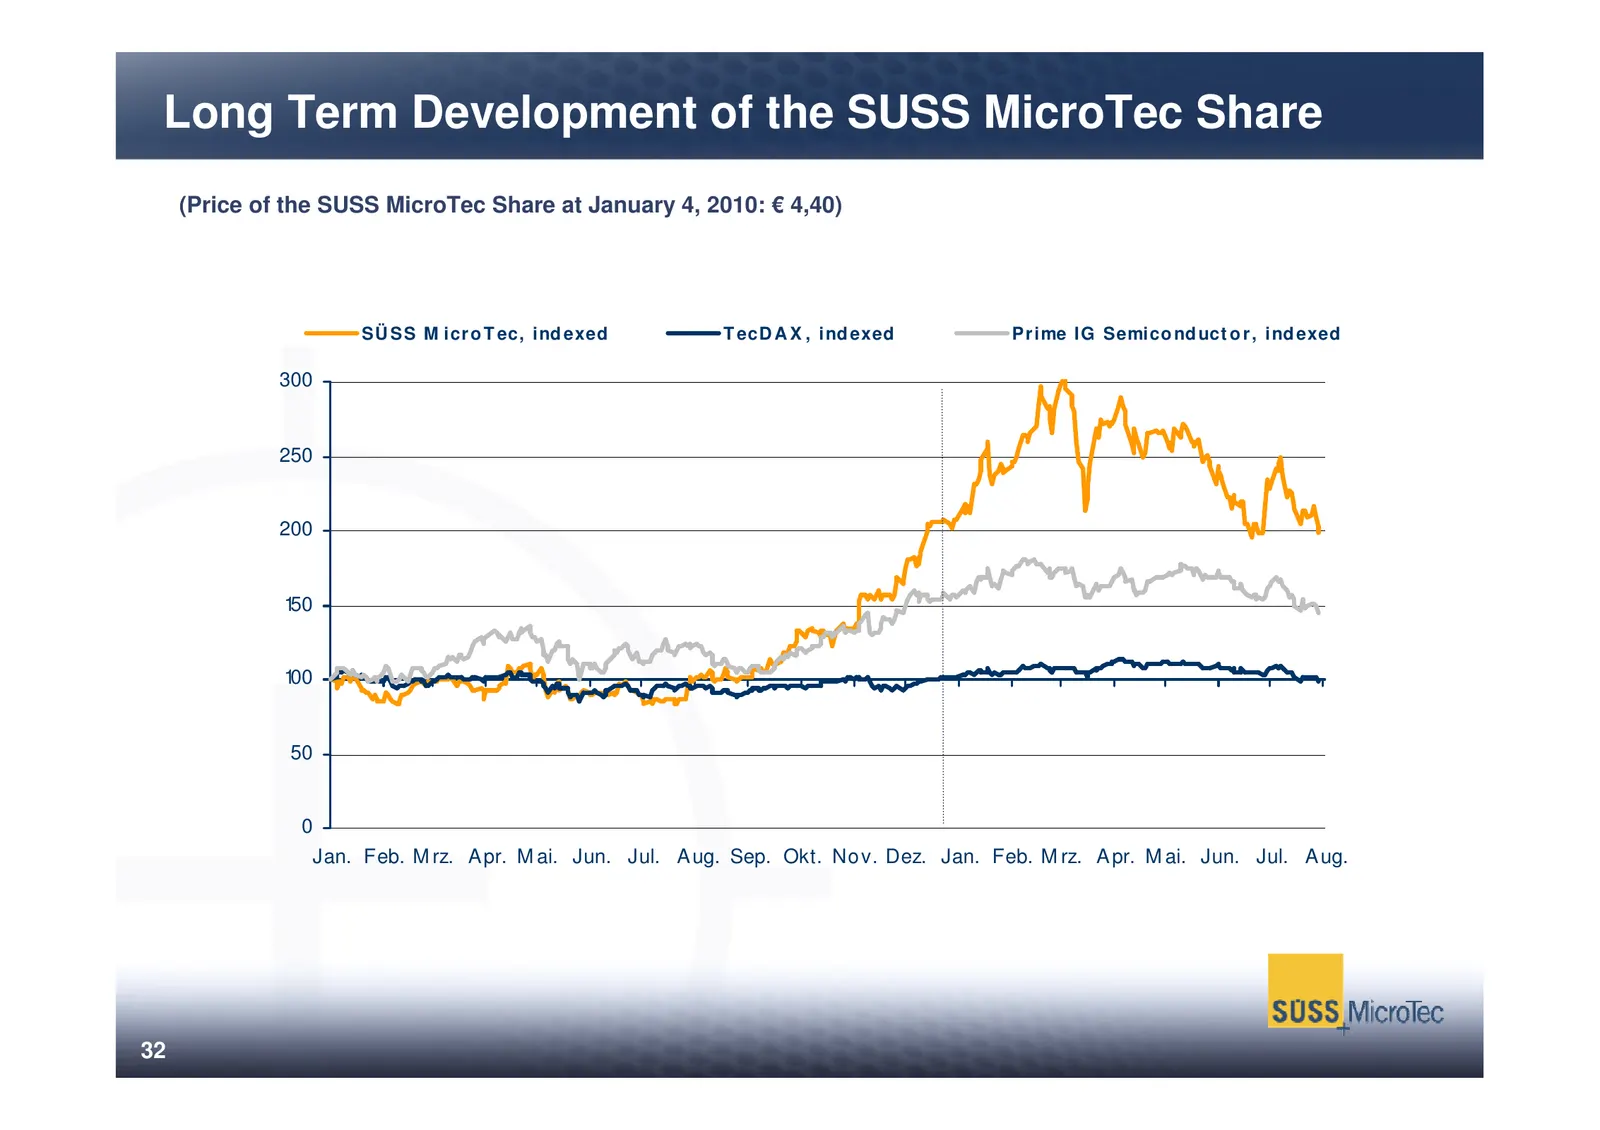
Slide 33: Long Term Development of the SUSS MicroTec Share
Long Term Development of the SUSS MicroTec Share (Price of the SUSS MicroTec Share at January 4, 2010: € 4,40) SÜ SS M icr o T ec, ind exed T ecD A X , ind exed Pr ime IG Semico nd uct o r , ind exed 300 250 200 150 100 50 0 Jan. Feb. M rz. A pr. M ai. Jun. Jul. A ug. Sep. Okt. No v. Dez. Jan. Feb.
Slide 34: Investor Relations Information
Investor Relations Information Contact Financial Calendar 2011 Franka Schielke Interim Report 2011 August 4 TMT Conference Commerzbank, Frankfurt August 31 Tel.: +49 (0) 89-32007- 161 Fax.: +49 (0) 89-32007- 451 UBS Best of Germany Conference, New York September 14 / 15 Email: franka.schielke@suss.c
Slide 35: The Restructuring Measures in Numbers
The Restructuring Measures in Numbers Purchase price ground and building: 4.4 € million Purchase of HamaTech Purchase price HamaTech: 3.8 € million Earn-out payment in 2011: 300,000 € Cash inflow in 2010: 3.3 € million € Sale of Test Systems Cash inflow in 2011: 3.3 Mio. € (from Cascade-shares) furt
Slide 36: Example: MEMS
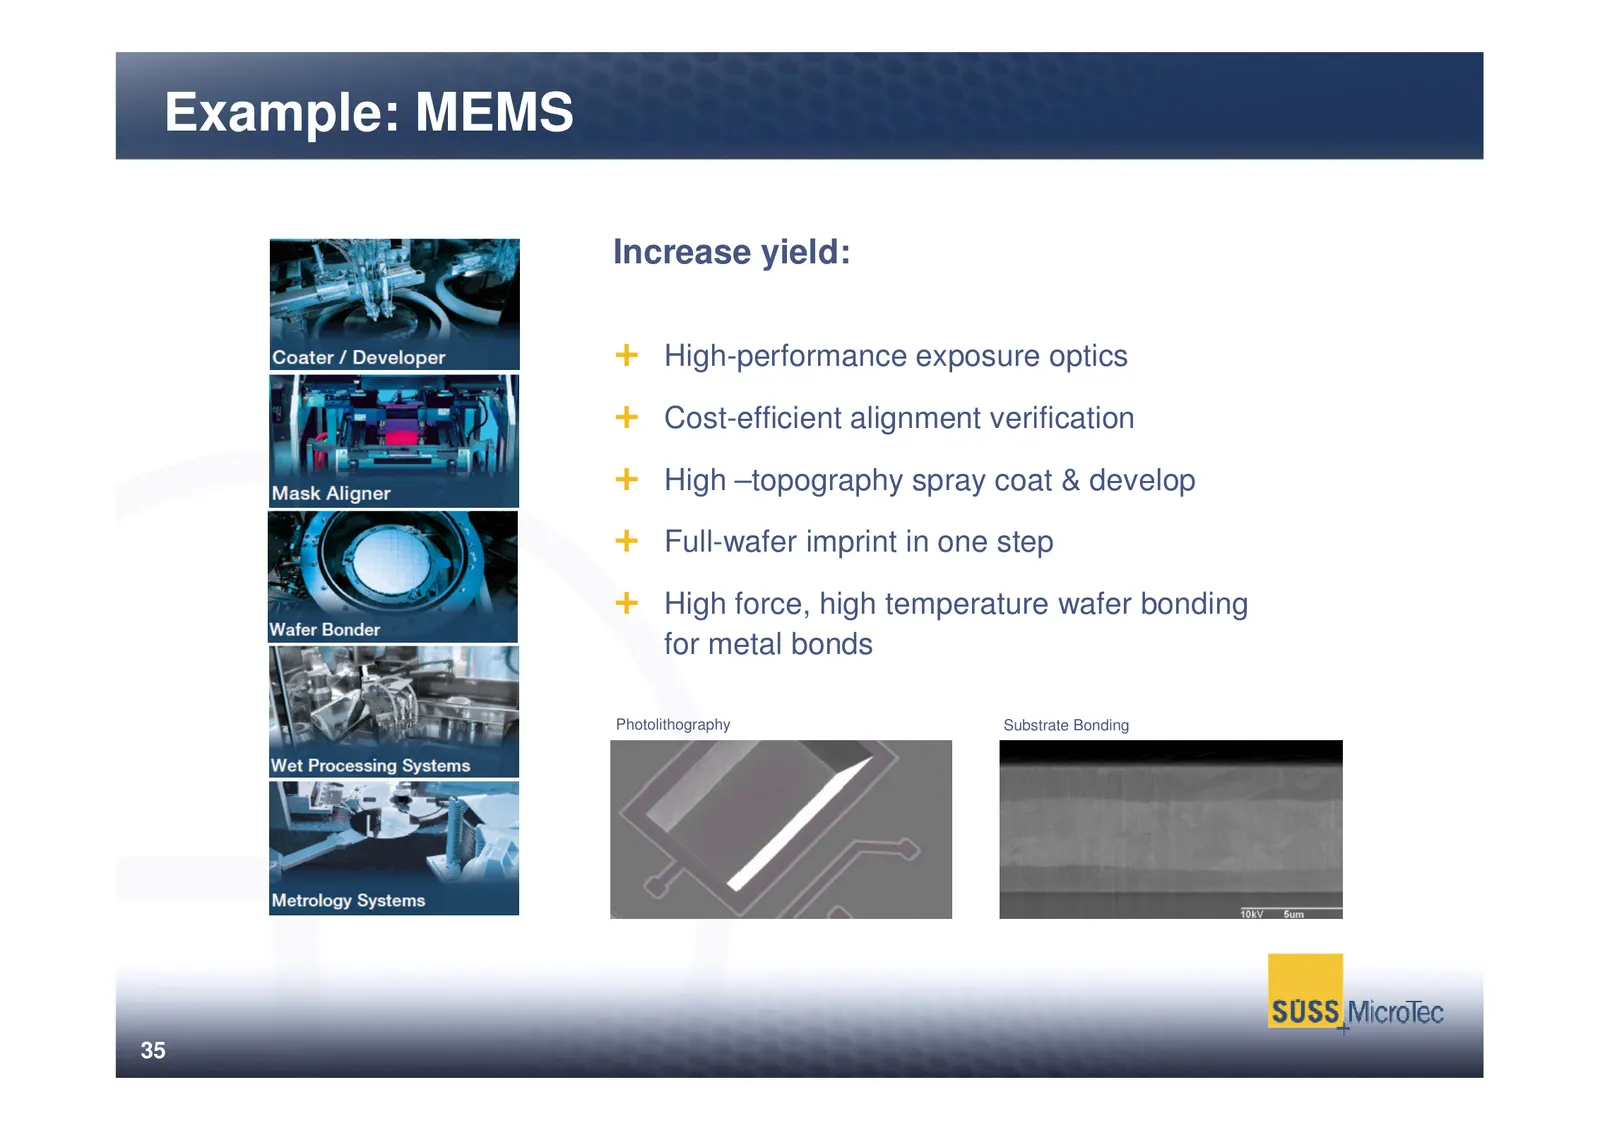
Example: MEMS Increase yield: High-performance exposure optics Cost-efficient alignment verification High –topography spray coat & develop Full-wafer imprint in one step High force, high temperature wafer bonding for metal bonds Photolithography Substrate Bonding 35
Slide 37: Example: LED
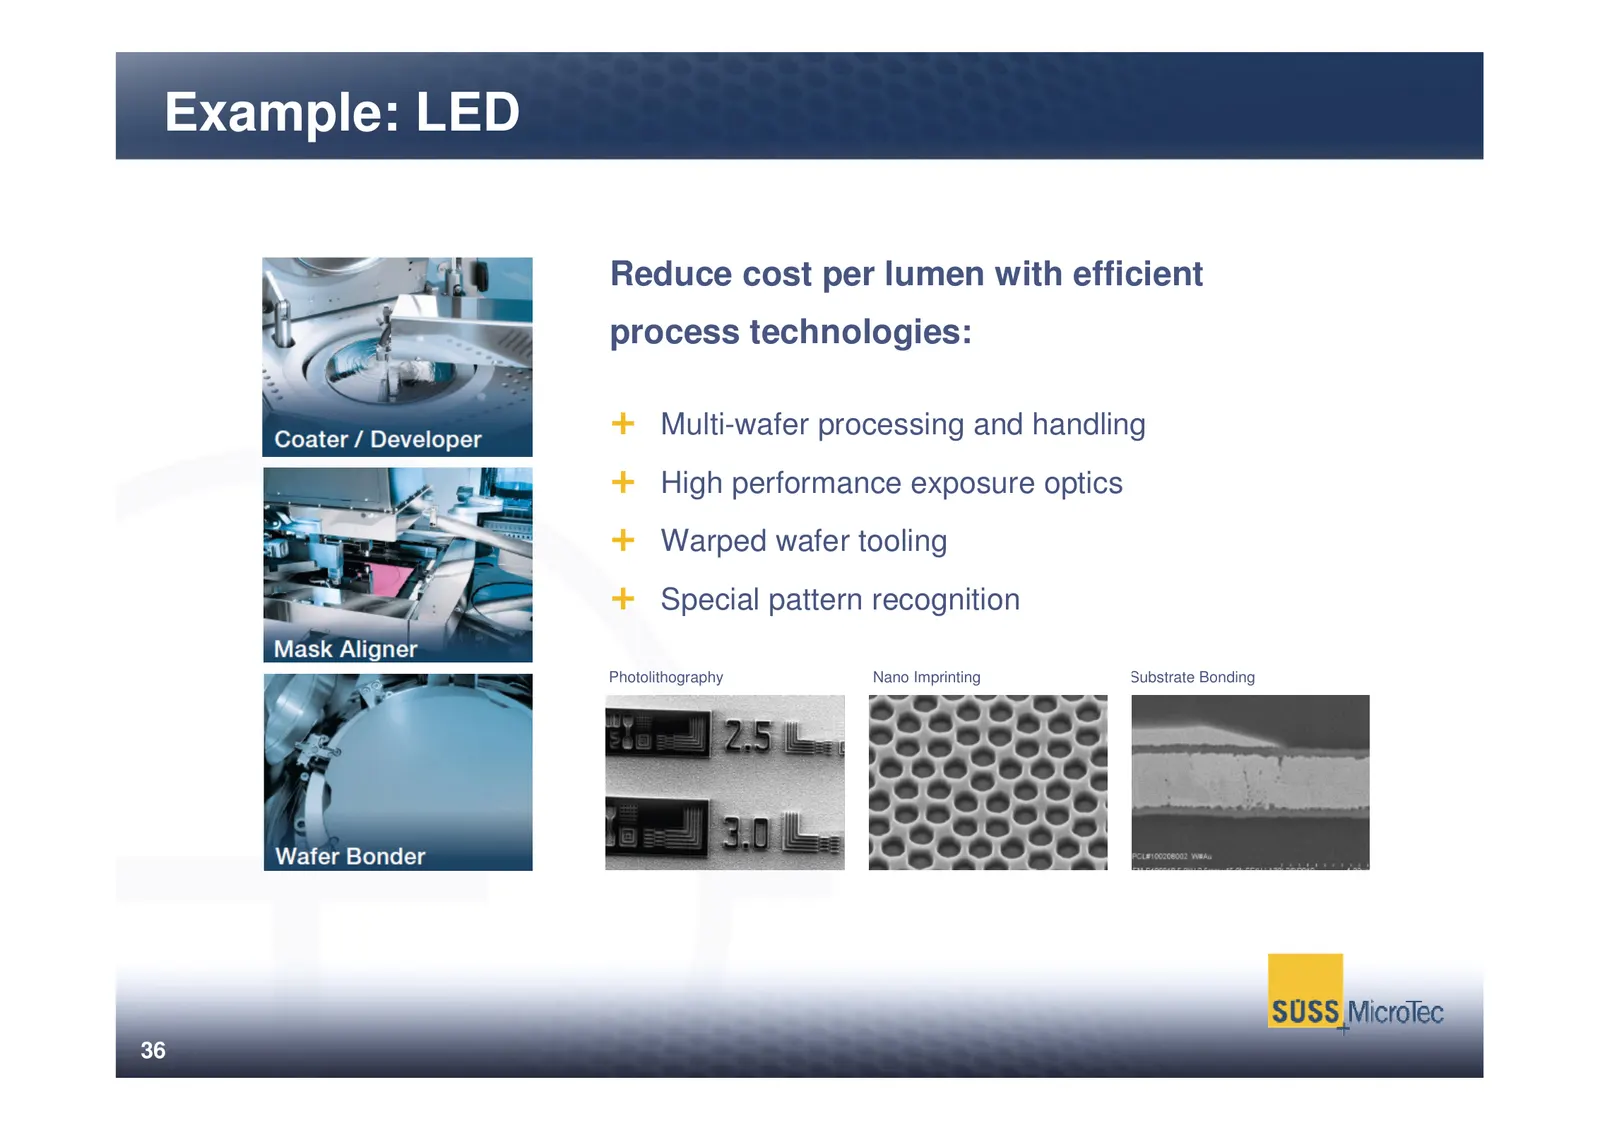
Example: LED Reduce cost per lumen with efficient process technologies: Multi-wafer processing and handling High performance exposure optics Warped wafer tooling Special pattern recognition Photolithography Nano Imprinting Substrate Bonding 36
Slide 38: Example: 3D-Integration
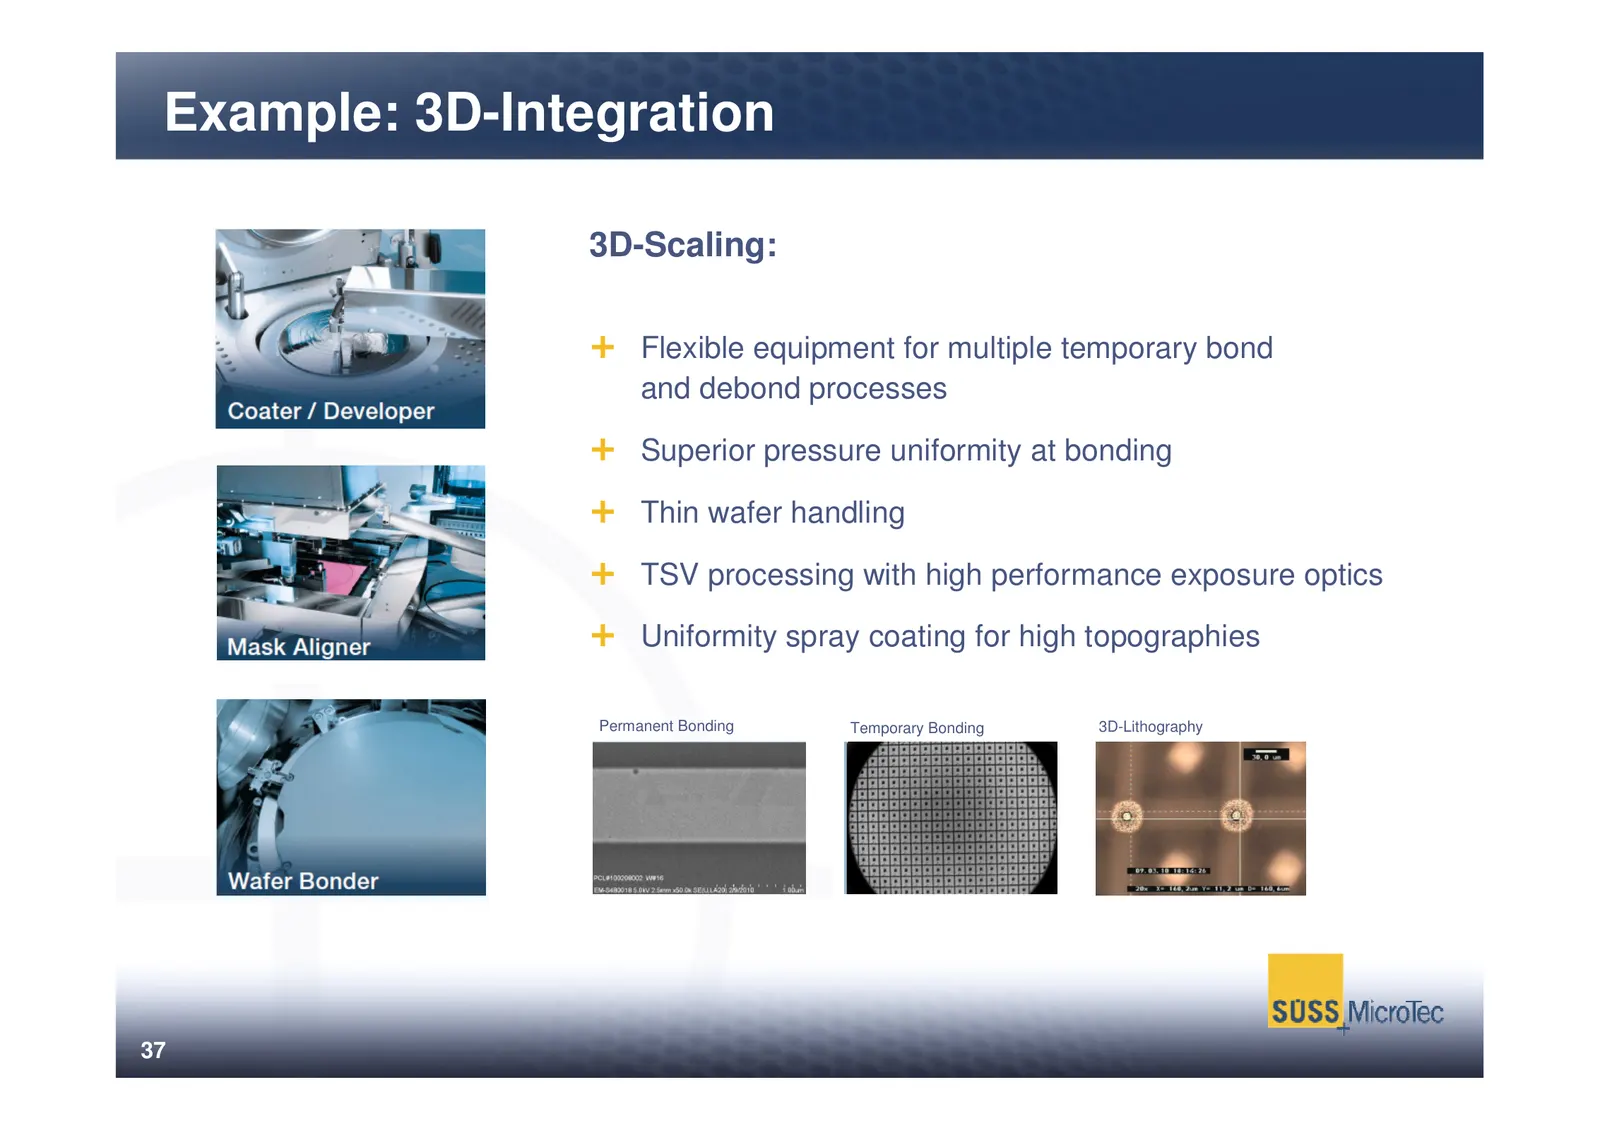
Example: 3D-Integration 3D-Scaling: Flexible equipment for multiple temporary bond and debond processes Superior pressure uniformity at bonding Thin wafer handling TSV processing with high performance exposure optics Uniformity spray coating for high topographies Permanent Bonding Temporary Bonding
Slide 39: 3D Integration: Chip Design Using the Third Dimension
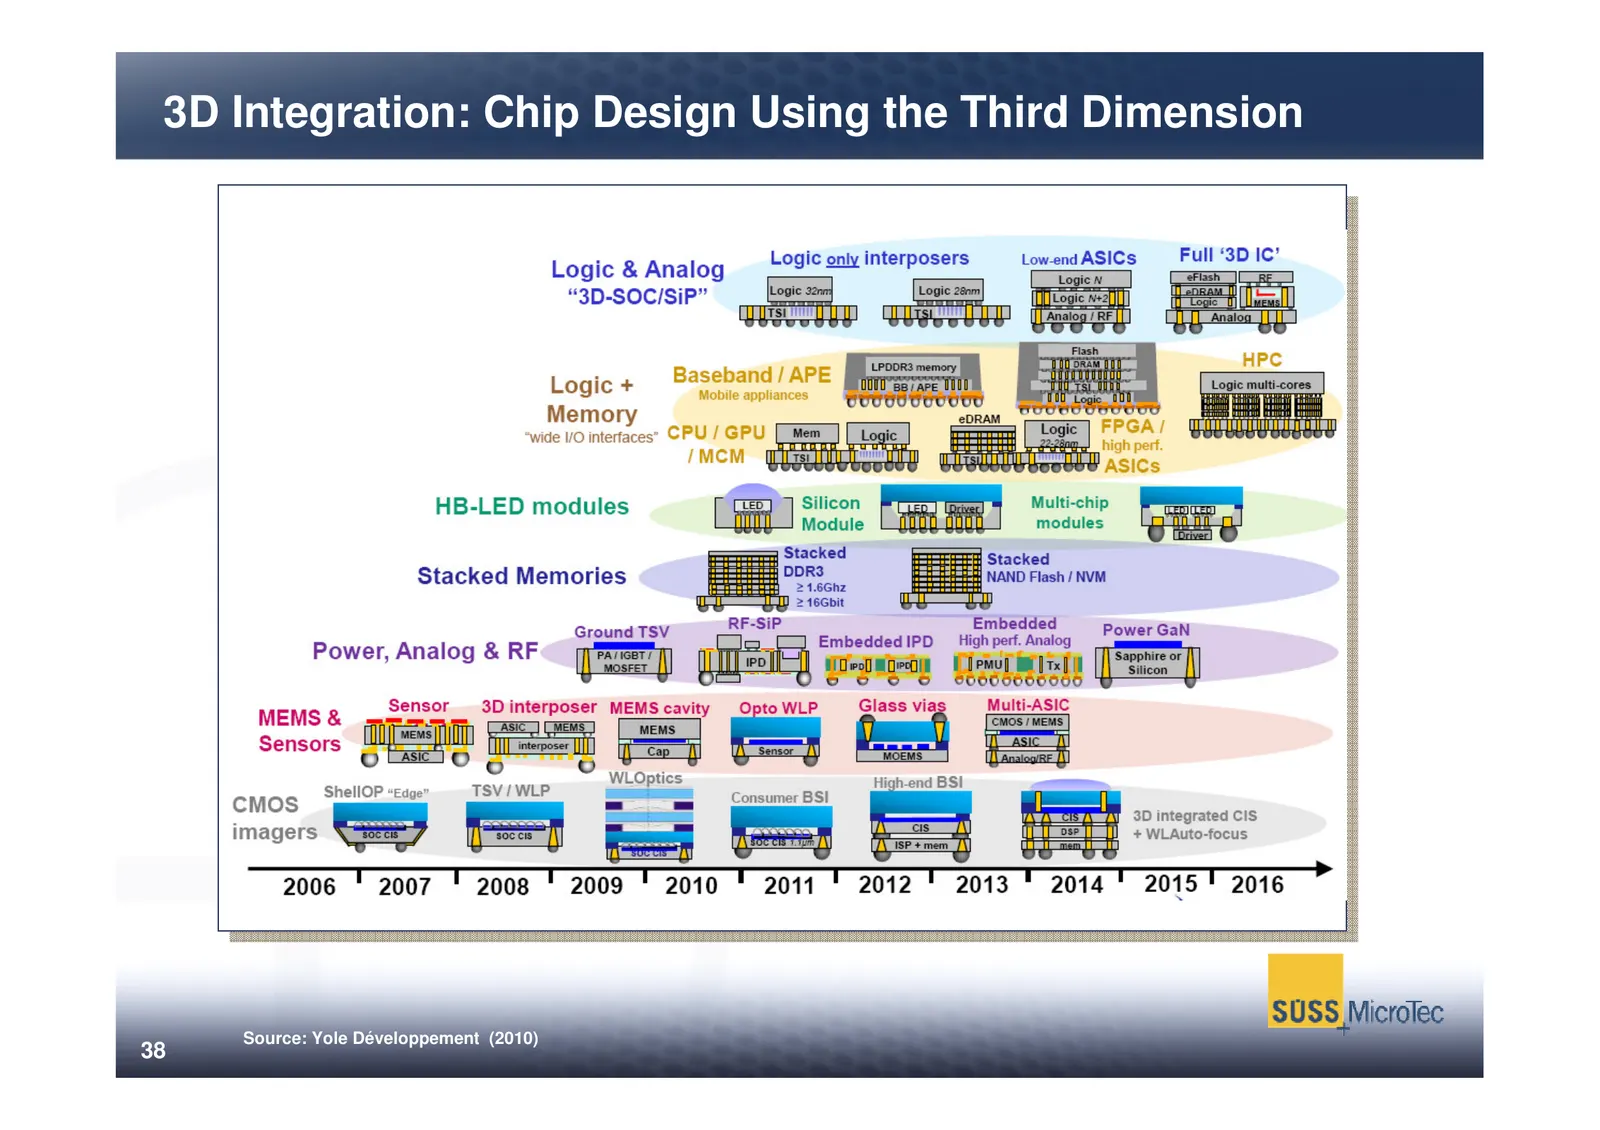
3D Integration: Chip Design Using the Third Dimension Source: Yole Développement (2010) 38
Slide 40: Thin Wafer Handling with SUSS Equipment
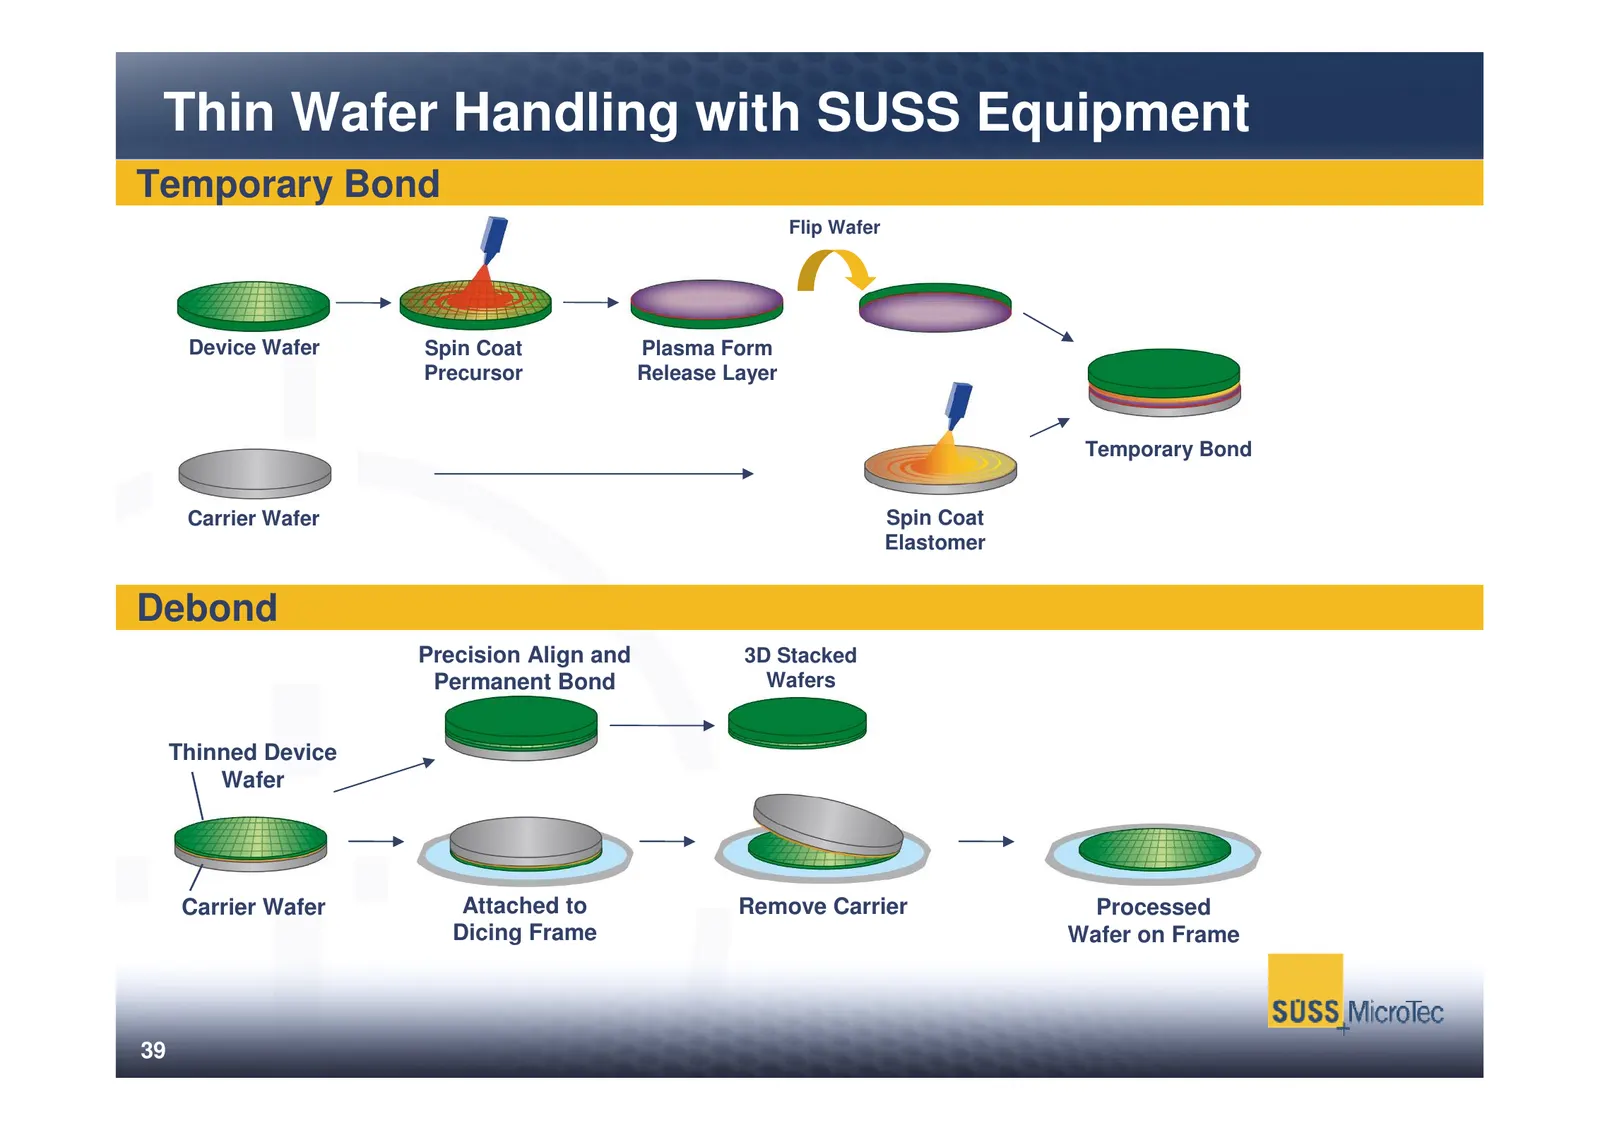
Thin Wafer Handling with SUSS Equipment Temporary Bond Flip Wafer Device Wafer Spin Coat Plasma Form Precursor Release Layer Temporary Bond Carrier Wafer Spin Coat Elastomer Debond Precision Align and 3D Stacked Permanent Bond Wafers Thinned Device Wafer Carrier Wafer Attached to Remove Carrier Proc
Slide 41: Sustainability: Example Data Traffic (3D Integration)
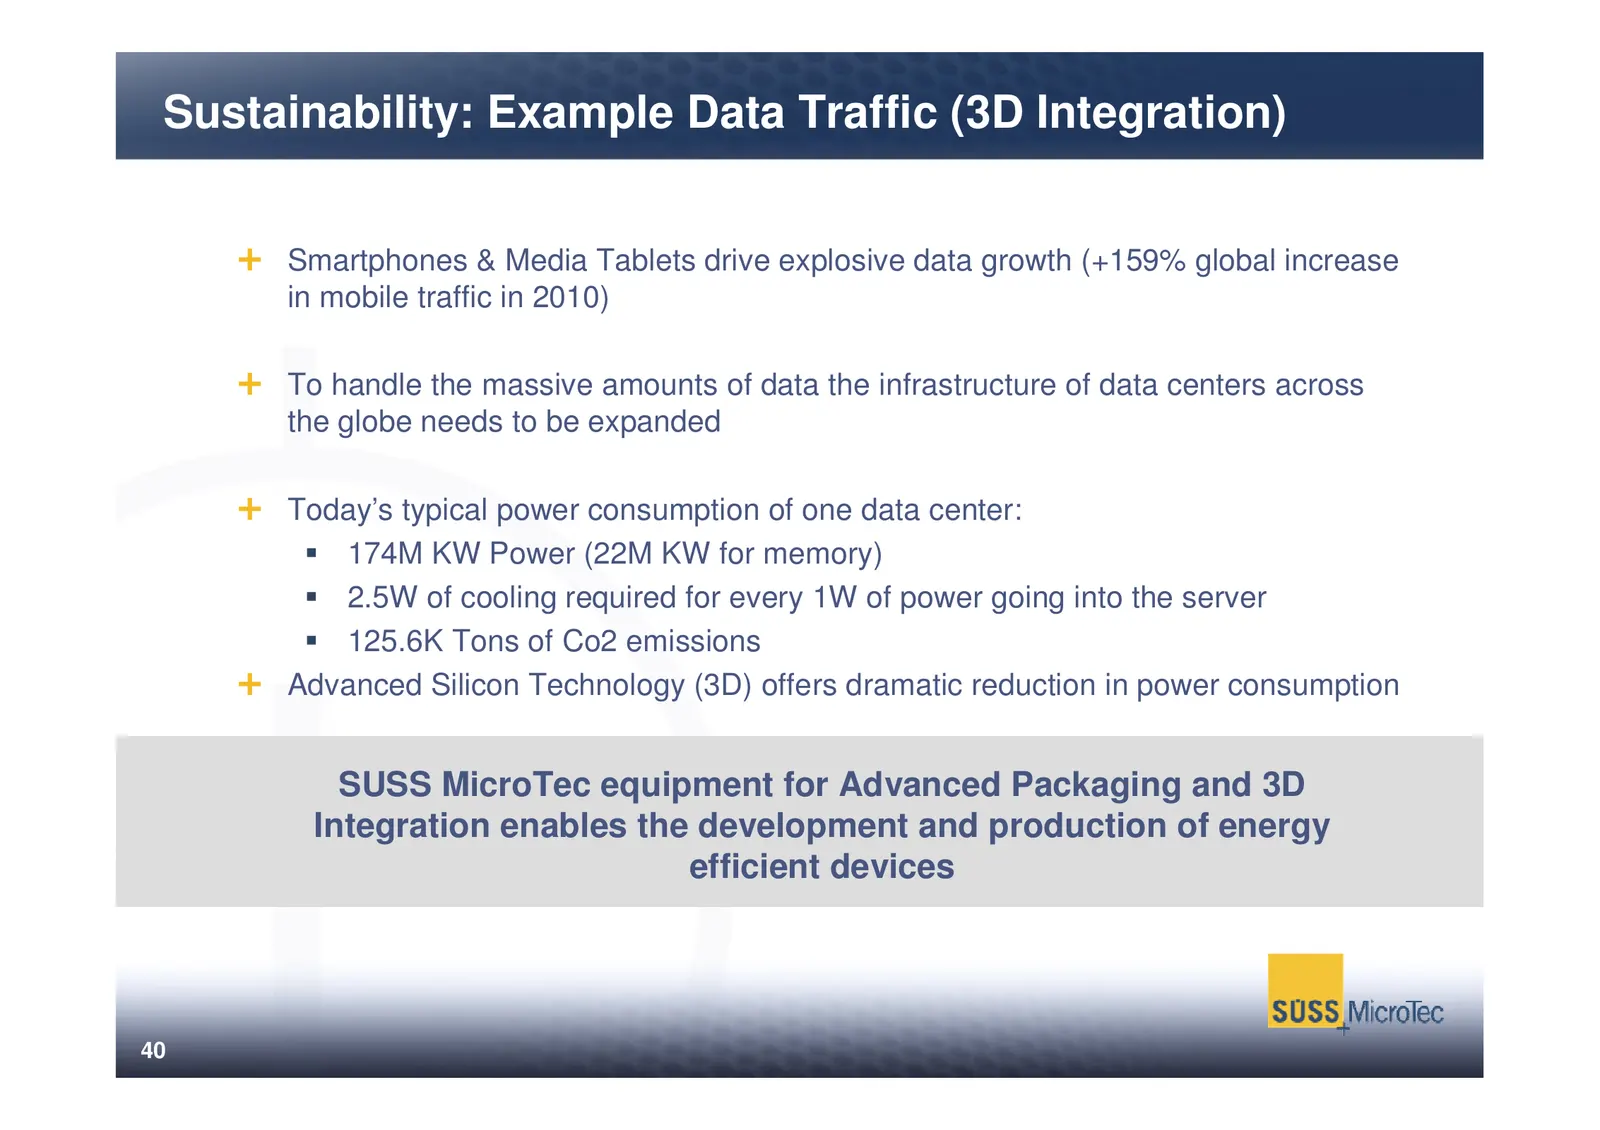
Sustainability: Example Data Traffic (3D Integration) Smartphones & Media Tablets drive explosive data growth (+159% global increase in mobile traffic in 2010) To handle the massive amounts of data the infrastructure of data centers across the globe needs to be expanded Today’s typical power consump
Slide 42: Sustainability: Case Study Data Centers
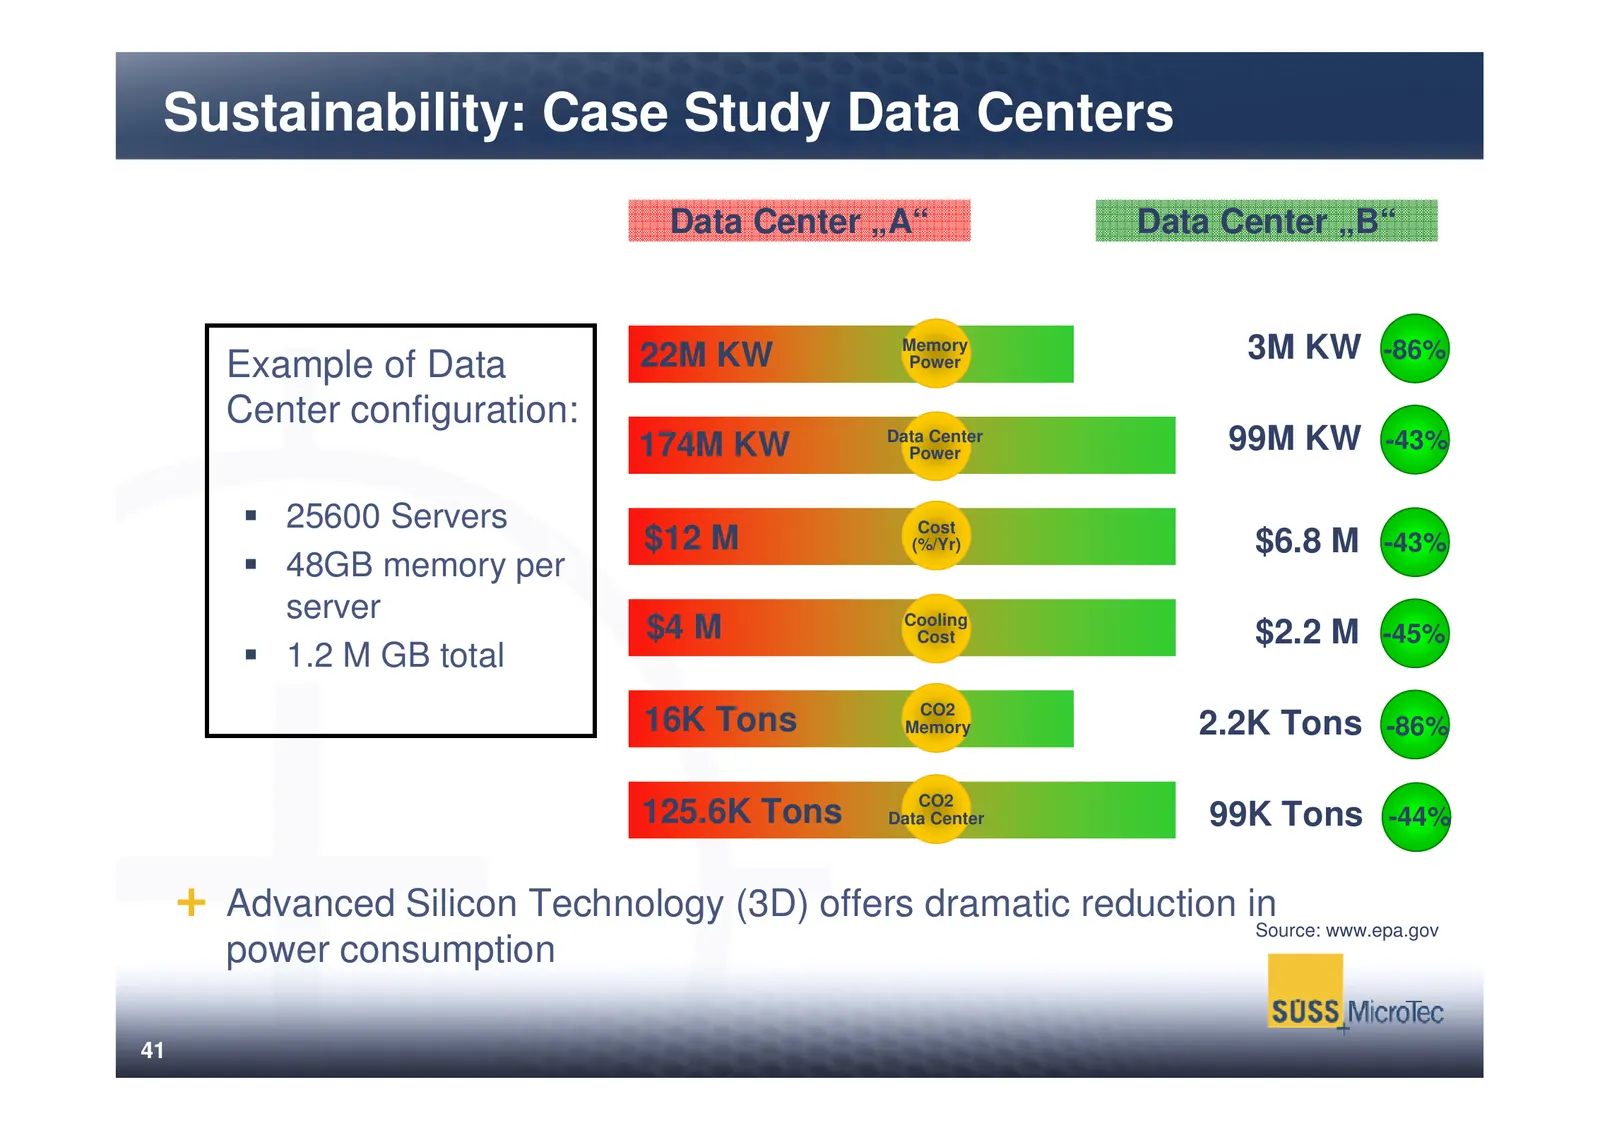
Sustainability: Case Study Data Centers Data Center „A“ Data Center „B“ 22M KW Memory 3M KW -86% Example of Data Power Center configuration: 174M KW Data Center Power 99M KW -43% 25600 Servers Cost $12 M (%/Yr) $6.8 M -43% 48GB memory per server $4 M Cooling Cost $2.2 M -45% 1.2 M GB total 16K Tons
Slide 43: SUSS Management Board
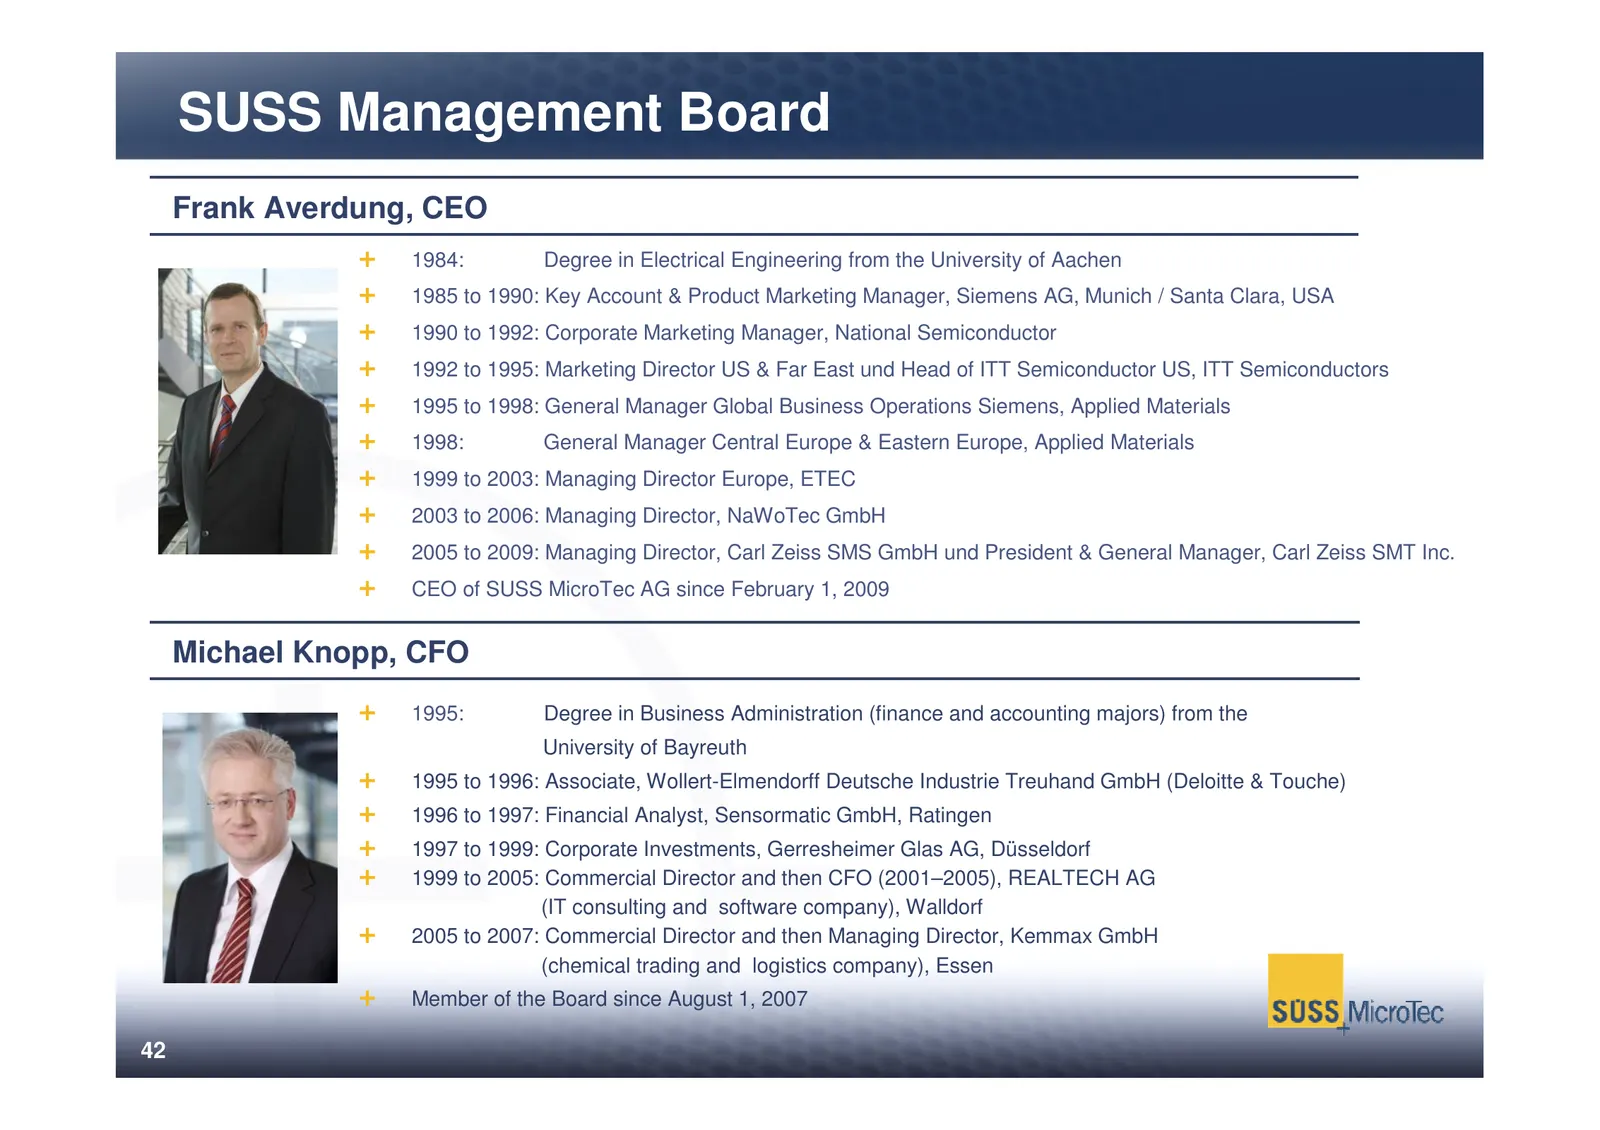
SUSS Management Board Frank Averdung, CEO 1984: Degree in Electrical Engineering from the University of Aachen 1985 to 1990: Key Account & Product Marketing Manager, Siemens AG, Munich / Santa Clara, USA 1990 to 1992: Corporate Marketing Manager, National Semiconductor 1992 to 1995: Marketing Direct
Source: Internet Archive copy of suss.com
More decks from SUSS MicroTec SE
 9M 2026 Earnings Presentation23 slides · Nov 5, 2026
 Investor Presentation (October 2026)41 slides · October 2026
 H1 2026 Earnings Presentation24 slides · Aug 6, 2026
 Q1 2026 Earnings Presentation19 slides · May 7, 2026
 FY2025 Earnings Presentation26 slides · Mar 30, 2026
 Investor Presentation (March 2026)42 slides · Mar 1, 2026