Sembcorp Industries Ltd. · SGX:U96
Sembcorp Industries — 9M2013 Earnings Presentation
17 slides from Sembcorp Industries's earnings presentation, Nov 11, 2013
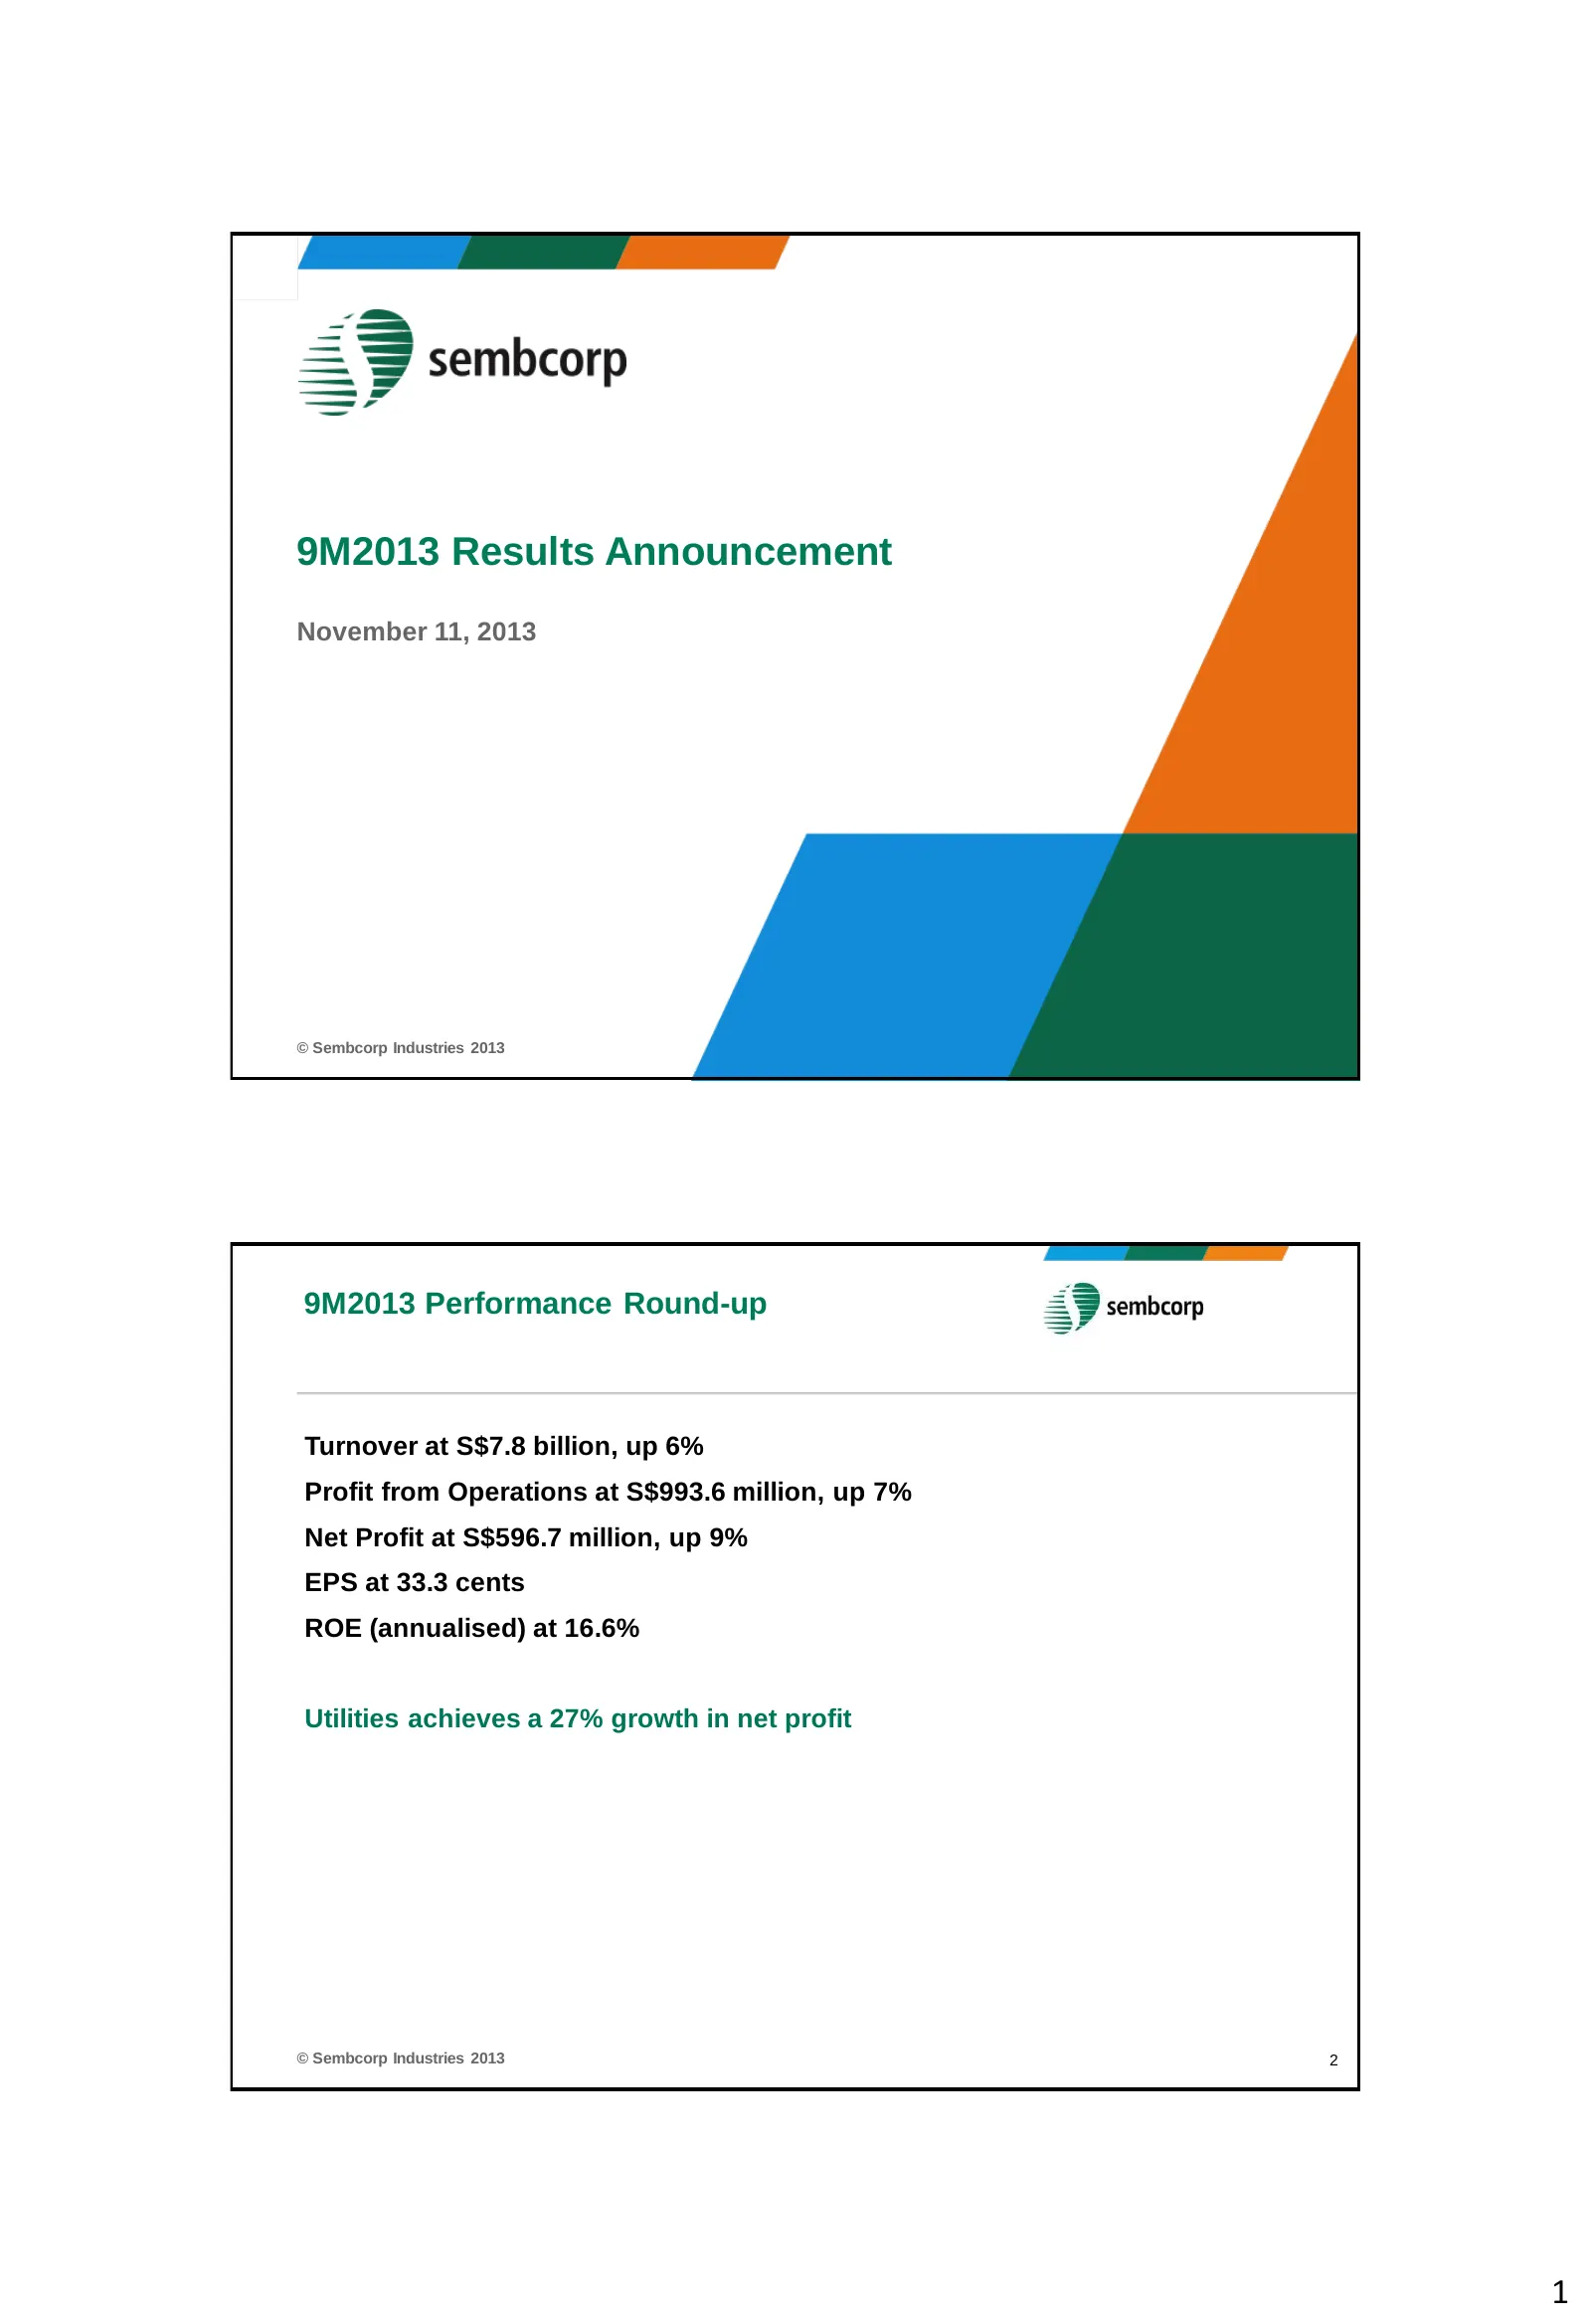
Slide 1: 9M2013 Results Announcement
9M2013 Results Announcement November 11, 2013 © Sembcorp Industries 2013 9M2013 Performance Round-up Turnover at S$7.8 billion, up 6% Profit from Operations at S$993.6 million, up 7% Net Profit at S$596.7 million, up 9% EPS at 33.3 cents ROE (annualised) at 16.6% Utilities achieves a 27% growth in n
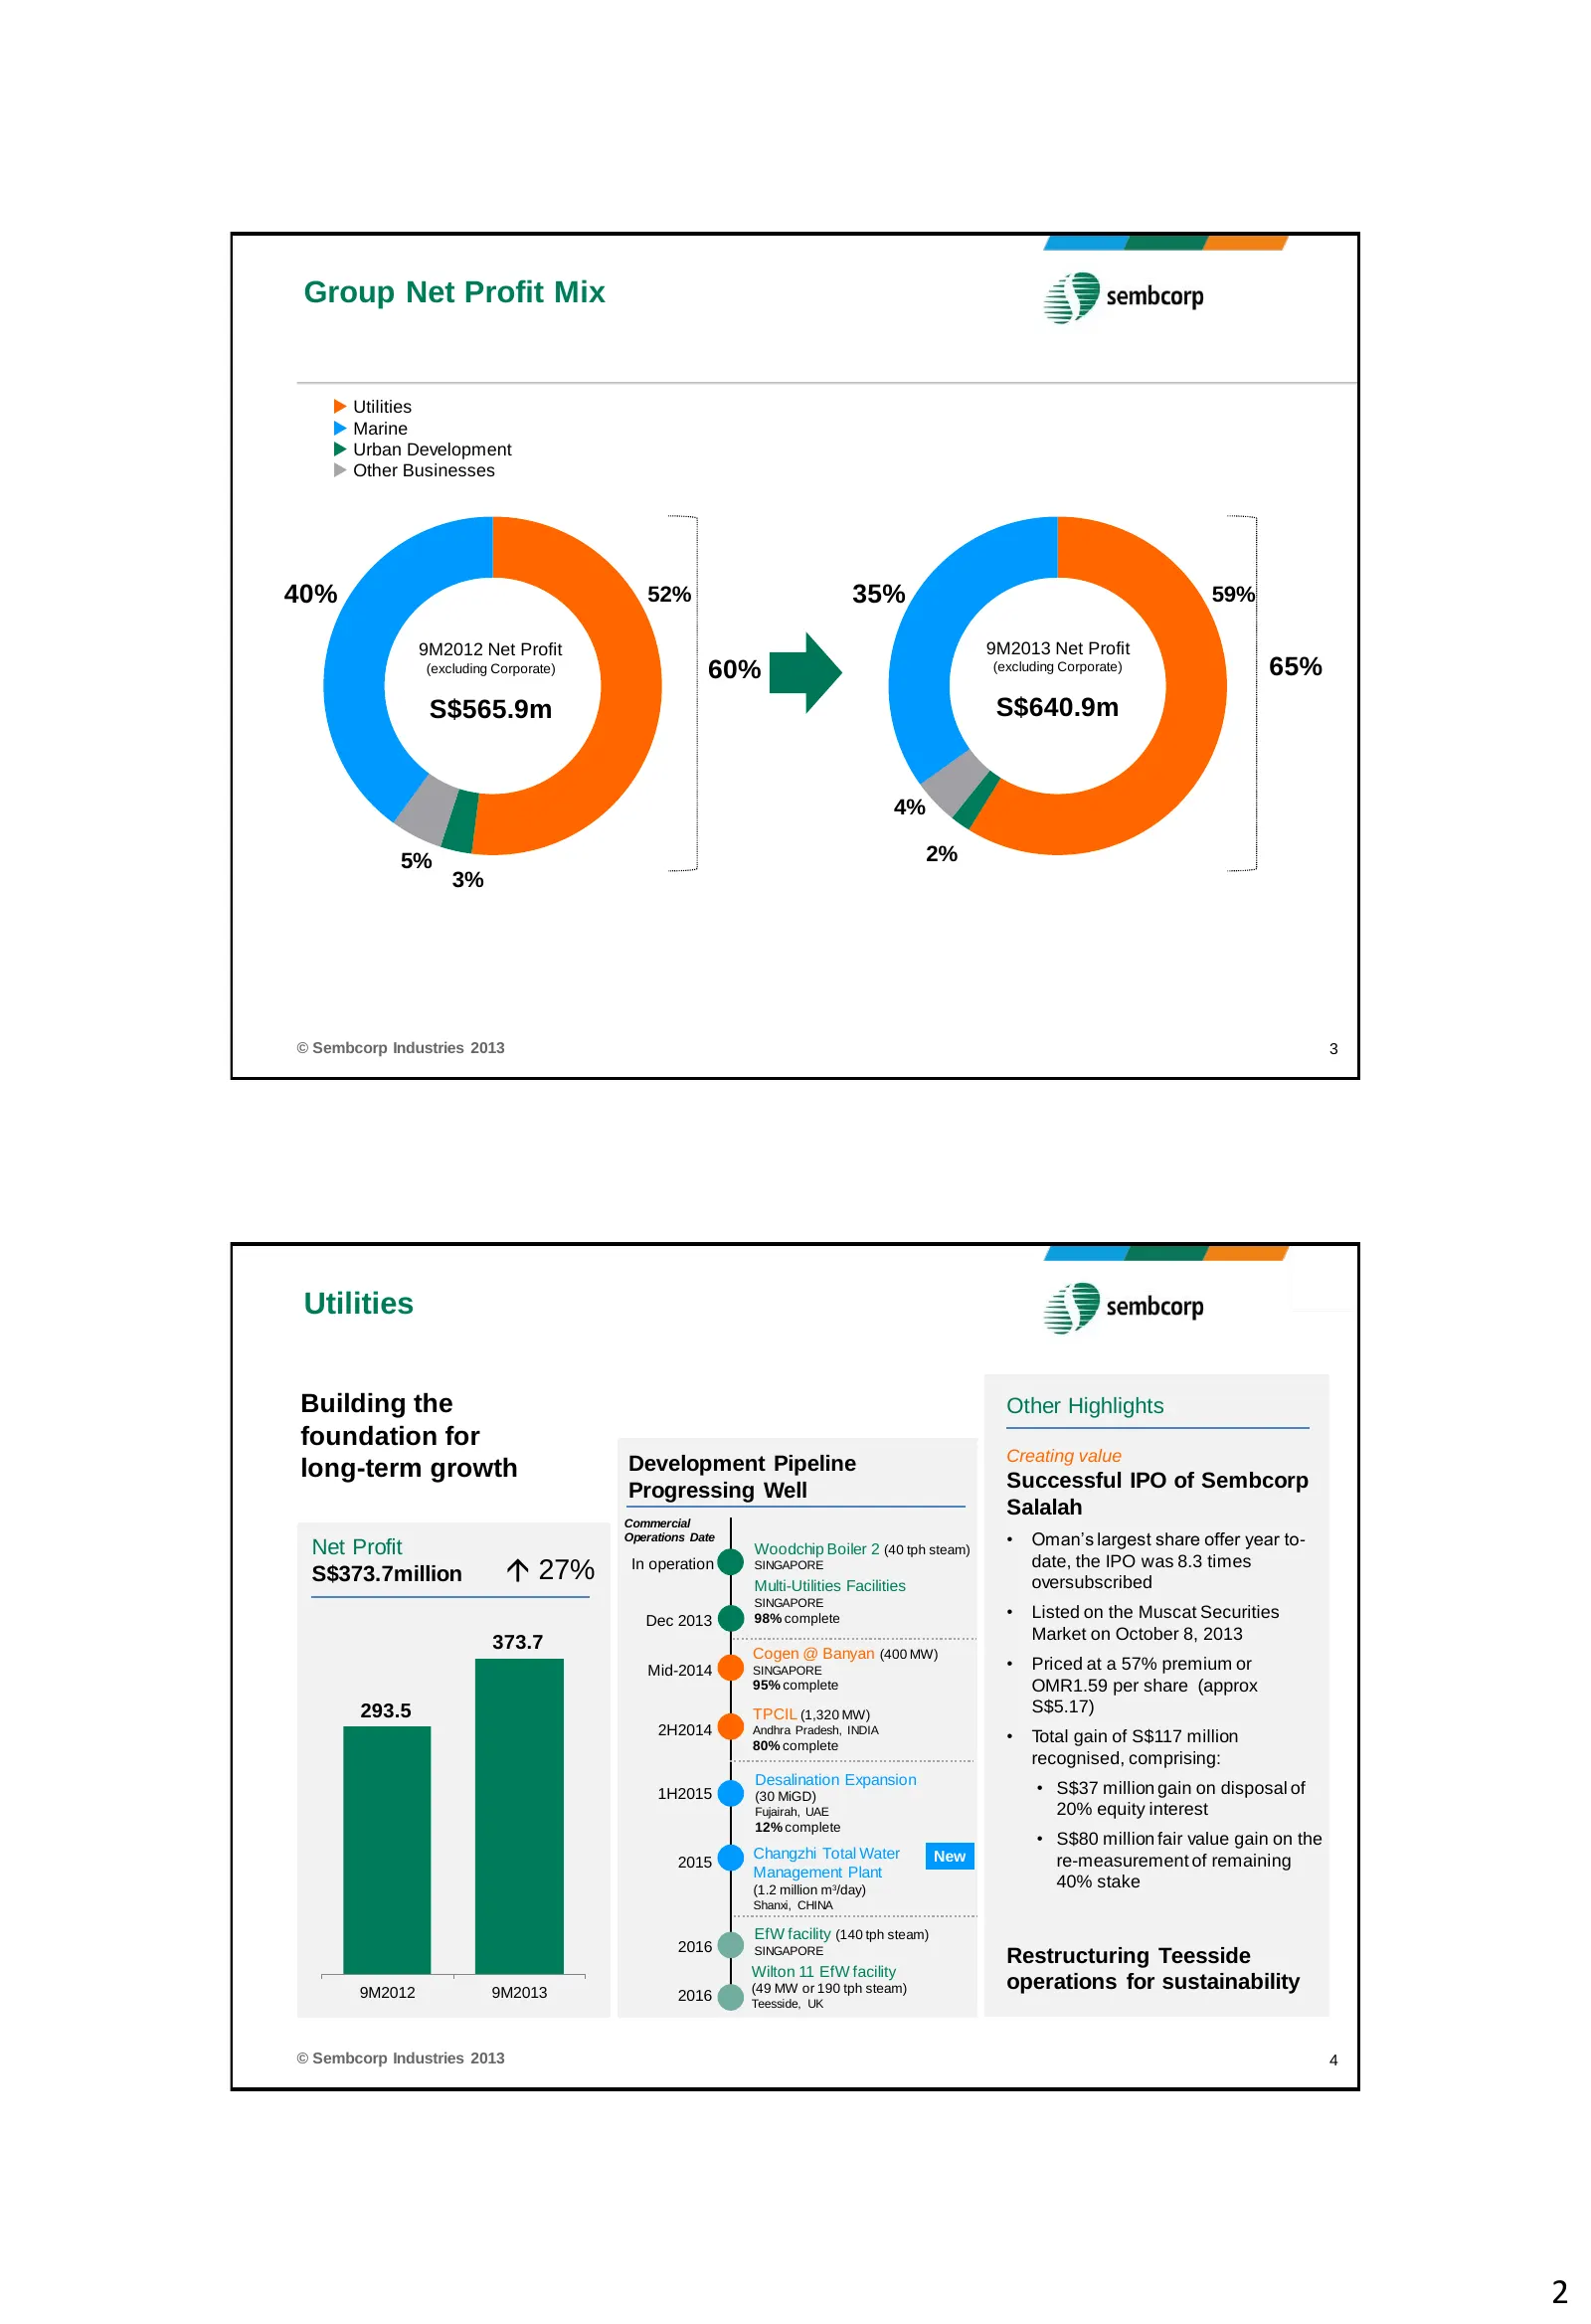
Slide 2: Group Net Profit Mix; Utilities
Group Net Profit Mix Utilities Marine Urban Development Other Businesses 40% 52% 35% 59% 9M2012 Net Profit 9M2013 Net Profit (excluding Corporate) 60% (excluding Corporate) 65% S$565.9m S$640.9m 4% 5% 2% 3% © Sembcorp Industries 2013 3 Utilities Building the Other Highlights foundation for D
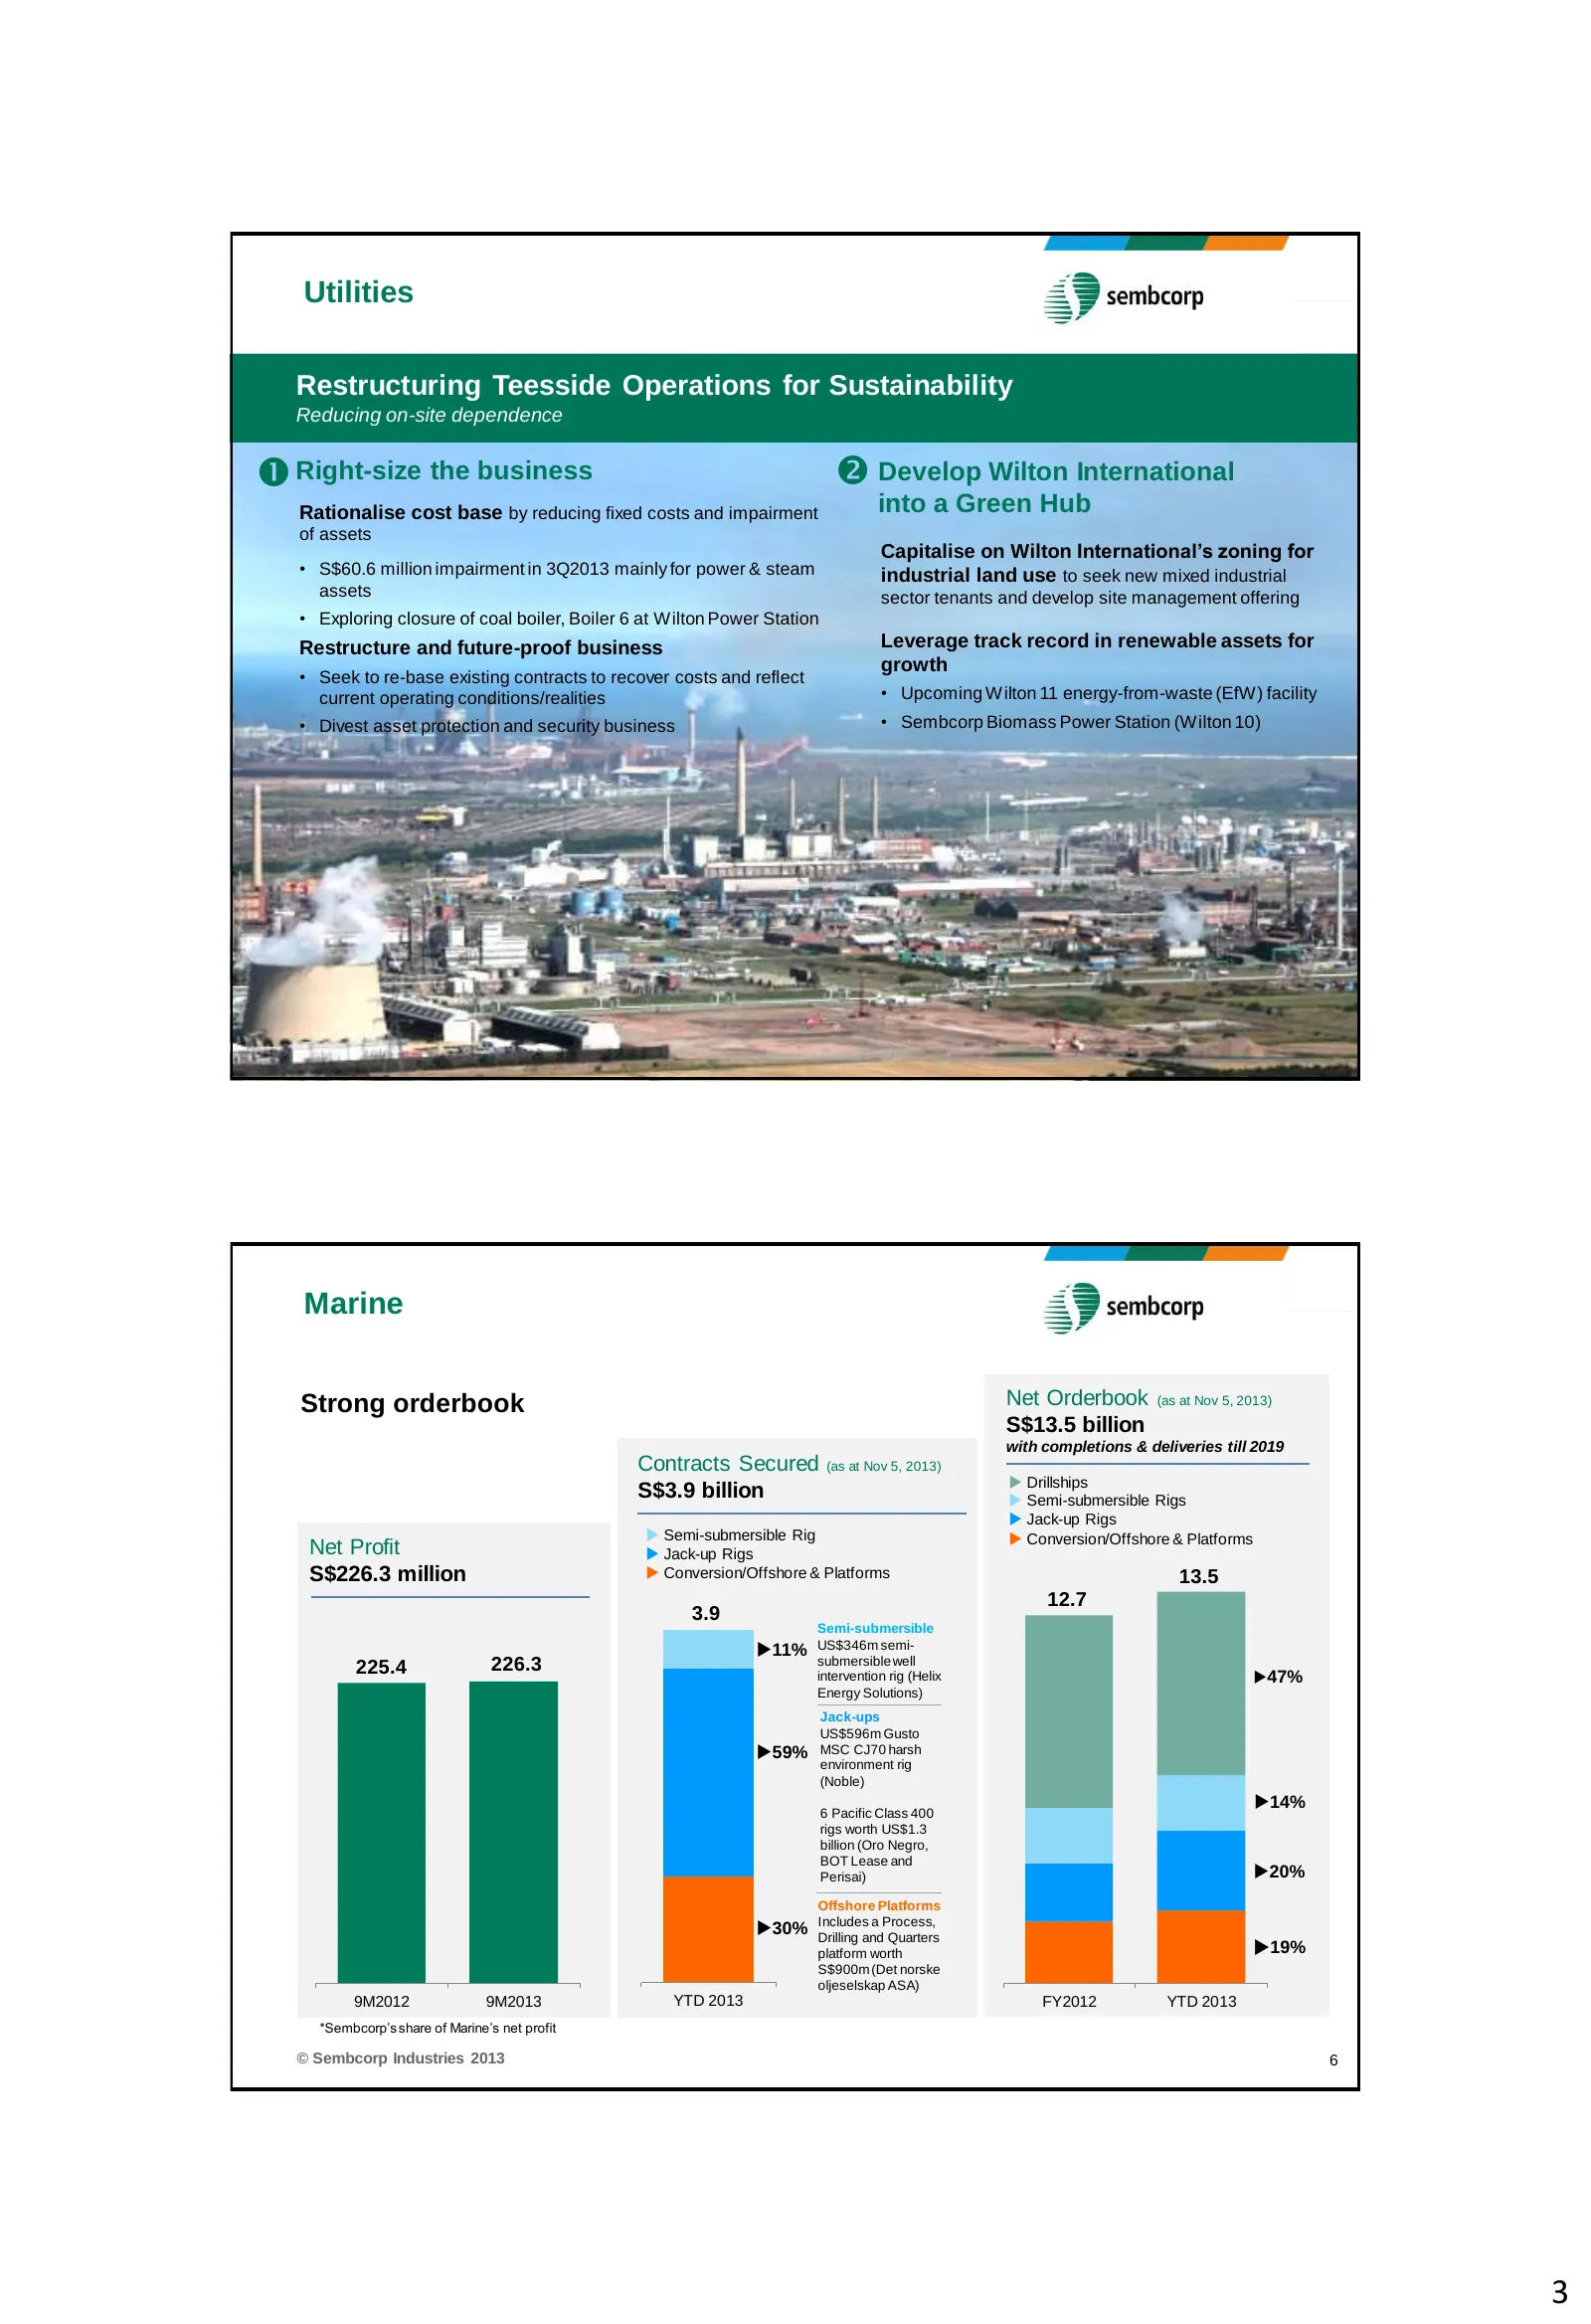
Slide 3: Restructuring Teesside Operations for Sustainability; Marine
Utilities Restructuring Teesside Operations for Sustainability Reducing on-site dependence Right-size the business Develop Wilton International Rationalise cost base by reducing fixed costs and impairment into a Green Hub of assets Capitalise on Wilton International’s zoning for • S$60.6 million
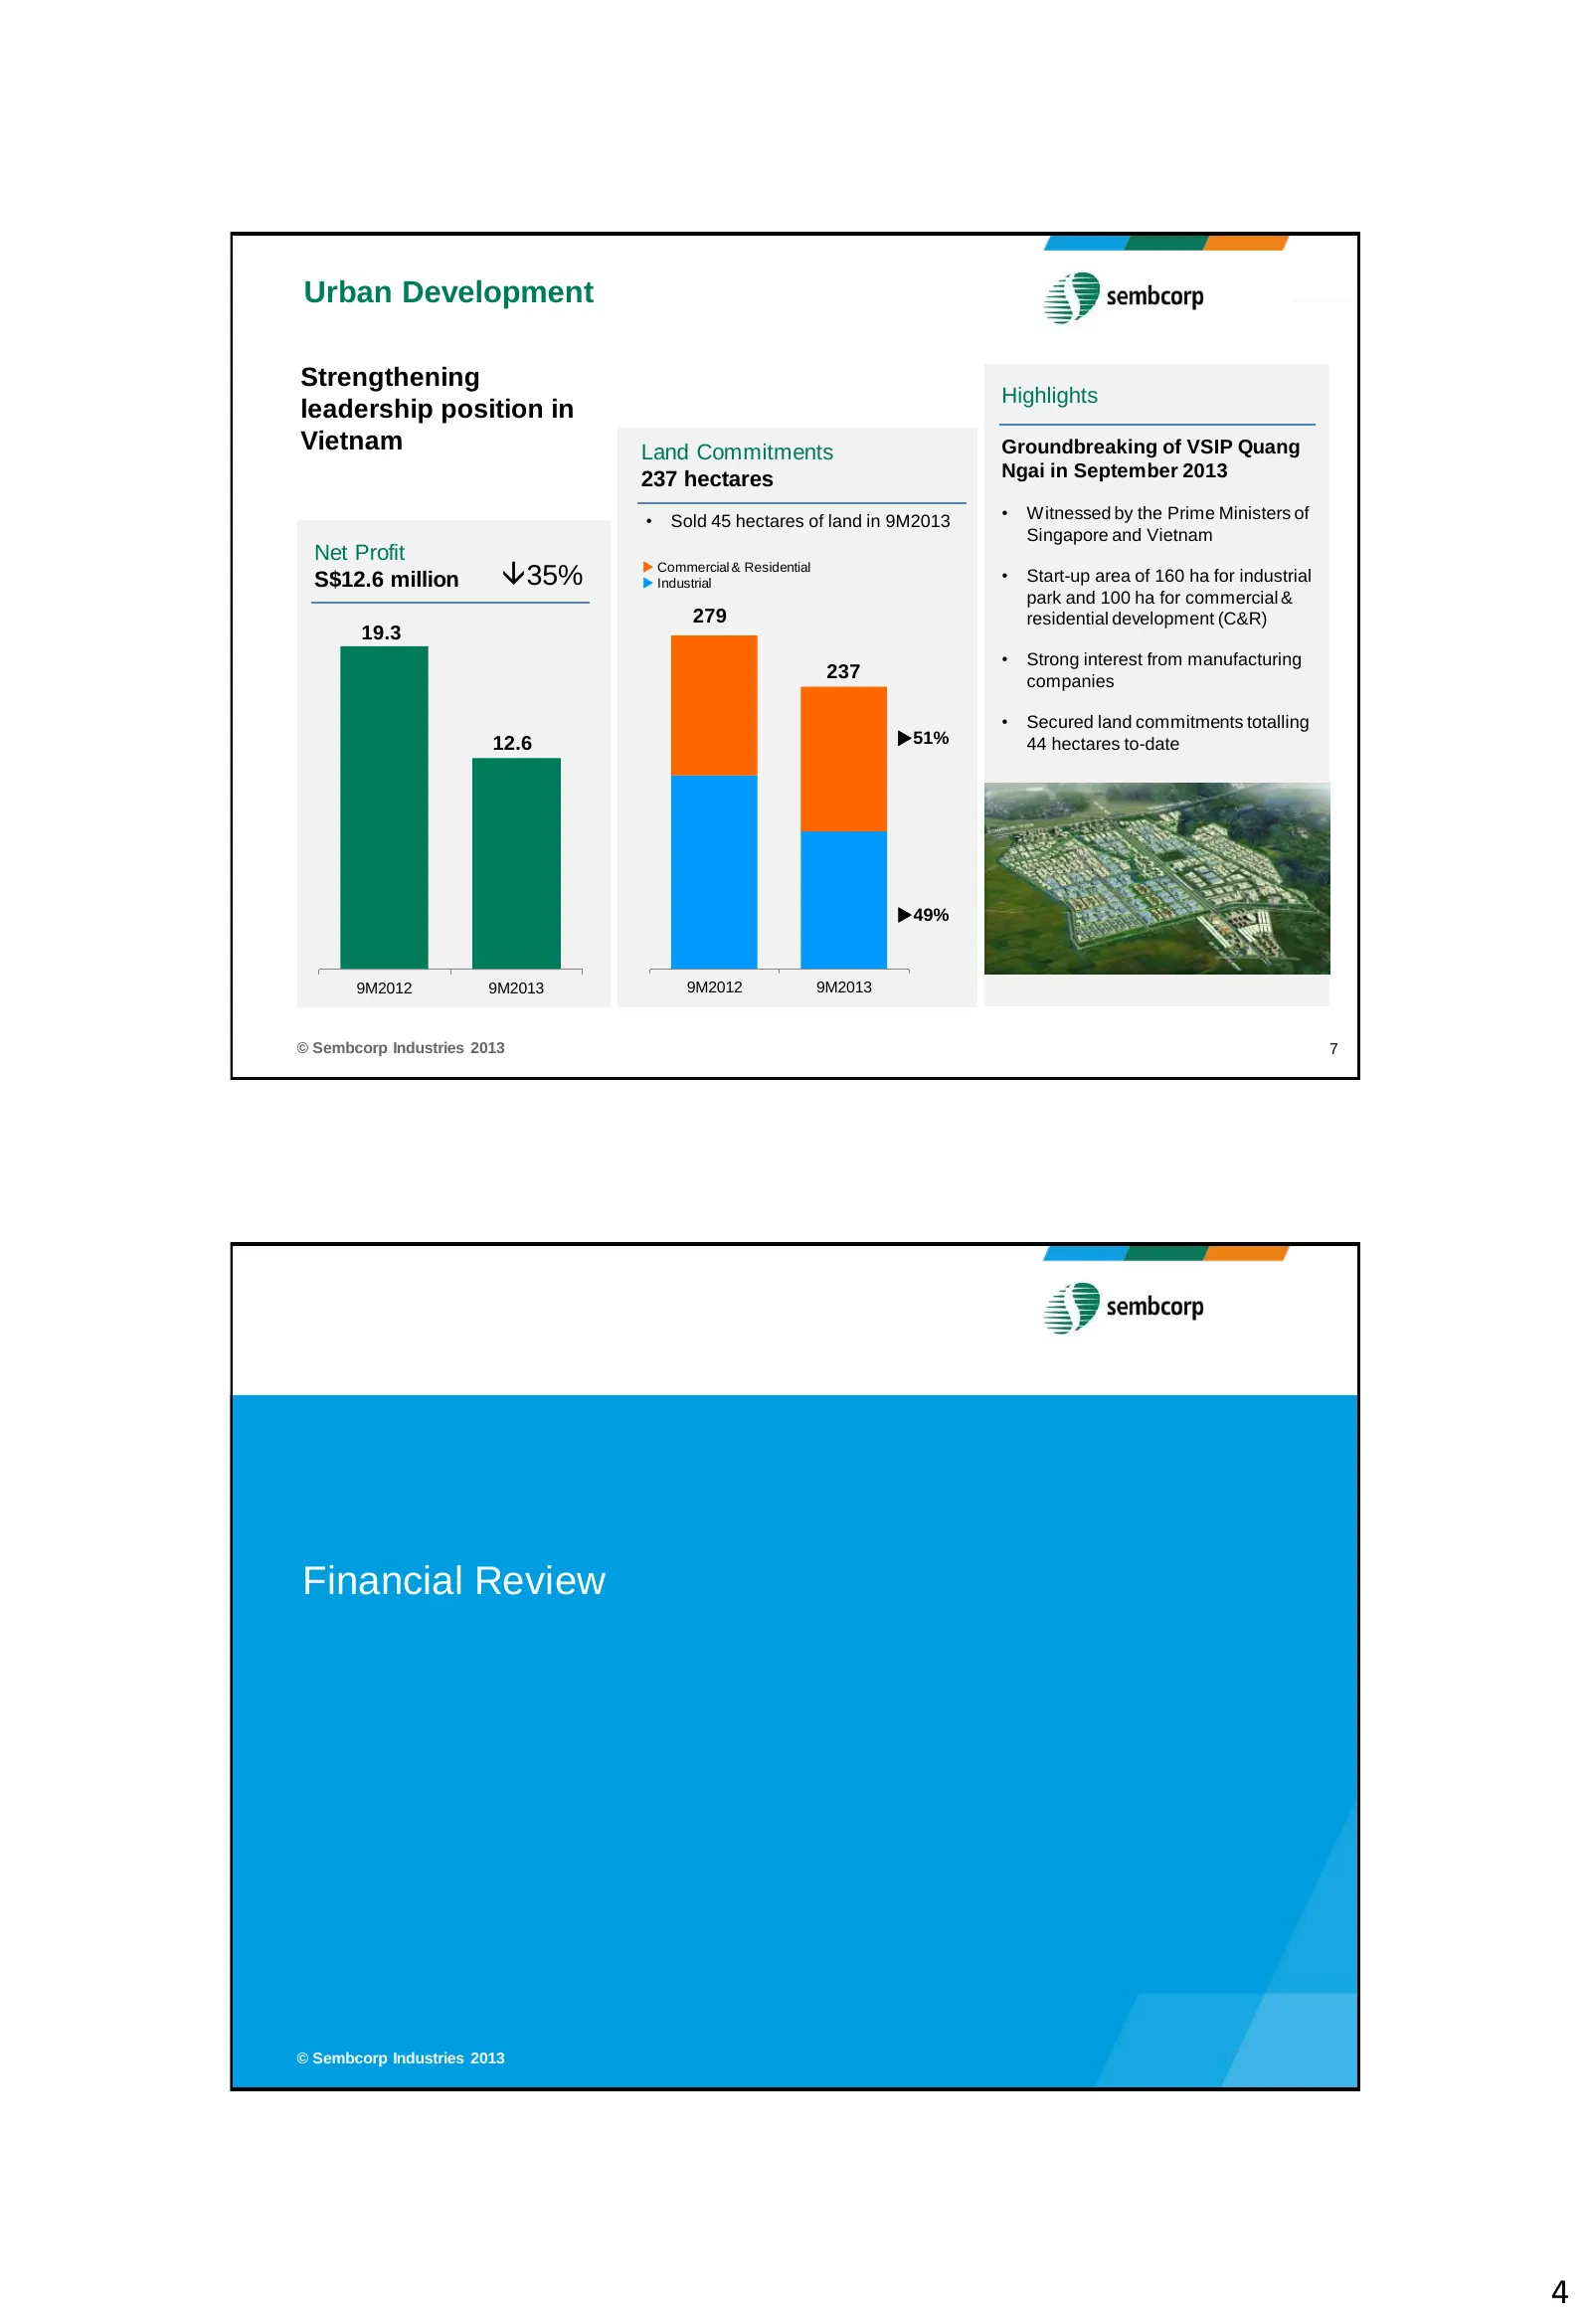
Slide 4: Urban Development; Financial Review
Urban Development Strengthening Highlights leadership position in Vietnam Land Commitments Groundbreaking of VSIP Quang 237 hectares Ngai in September 2013 • Sold 45 hectares of land in 9M2013 • Witnessed by the Prime Ministers of Singapore and Vietnam Net Profit S$12.6 million 35% Commercial & R
Slide 5: Group Profit & Loss; Group Turnover
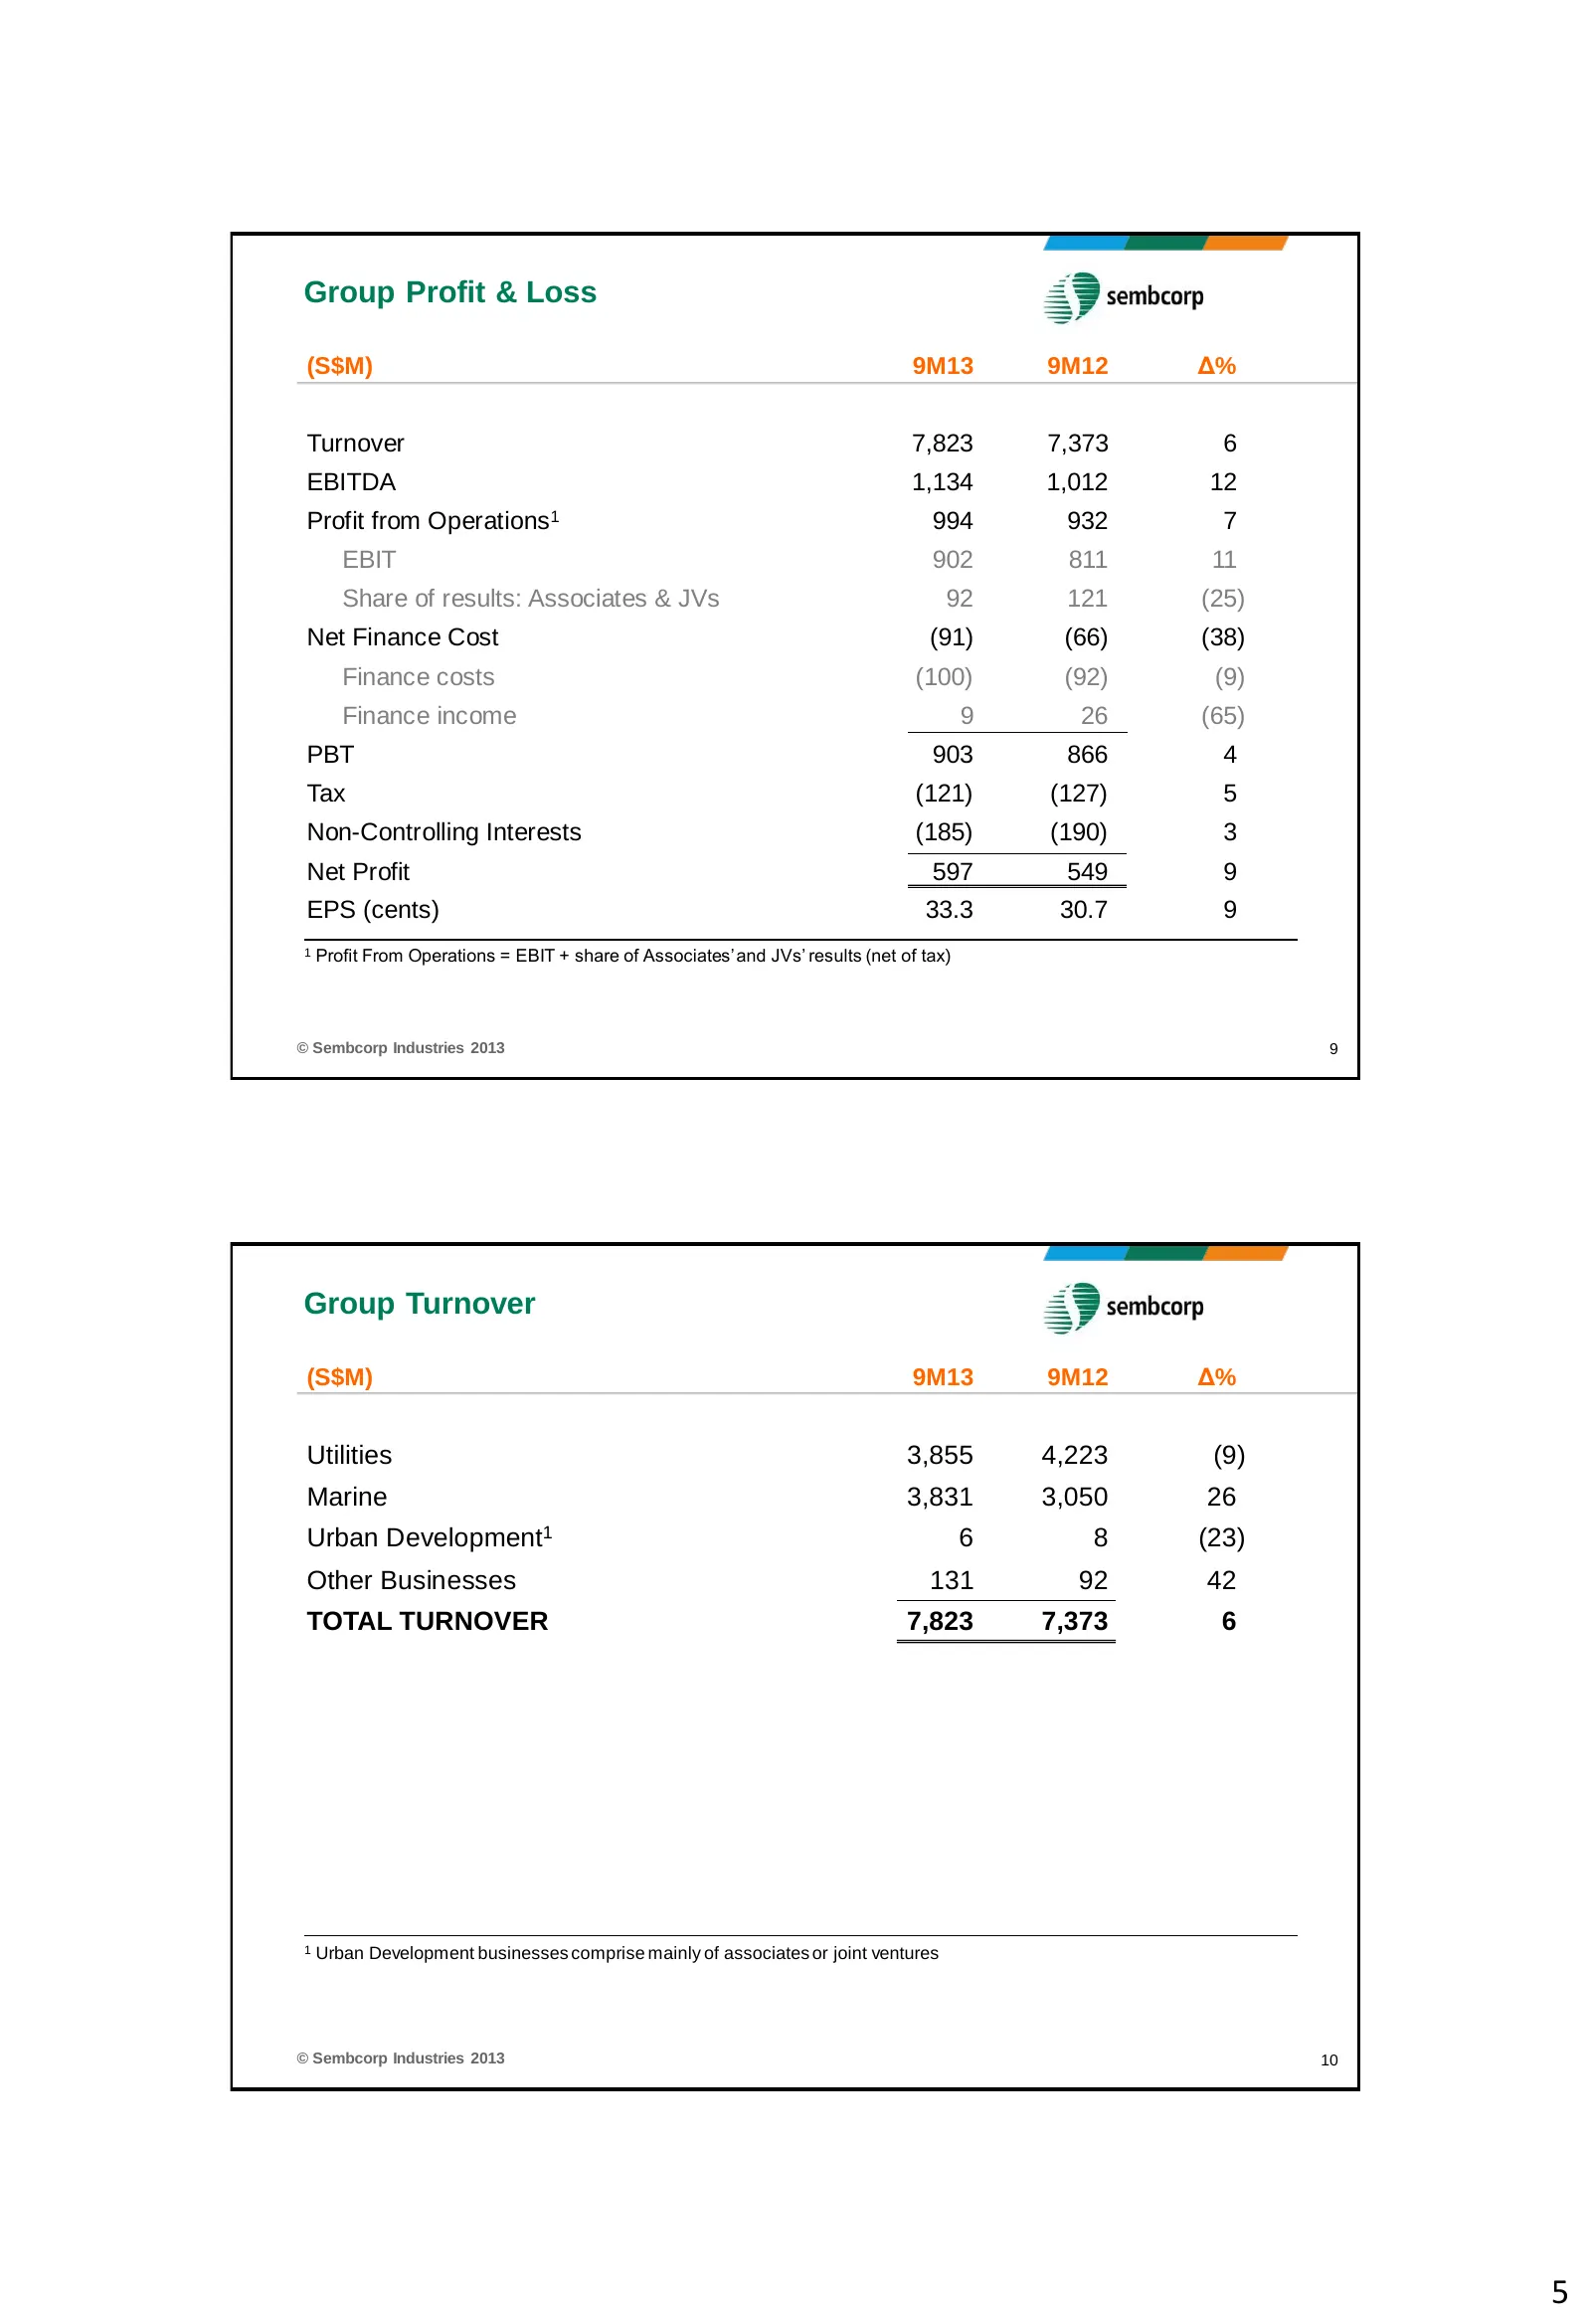
Group Profit & Loss (S$M) 9M13 9M12 Δ% Turnover 7,823 7,373 6 EBITDA 1,134 1,012 12 Profit from Operations 1 994 932 7 EBIT 902 811 11 Share of results: Associates & JVs 92 121 (25) Net Finance Cost (91) (66) (38) Finance costs (100) (92) (9) Finance income 9 26 (65) PBT 903 866 4 Tax (121) (127) 5
Slide 6: Group Profit from Operations; Group Net Profit
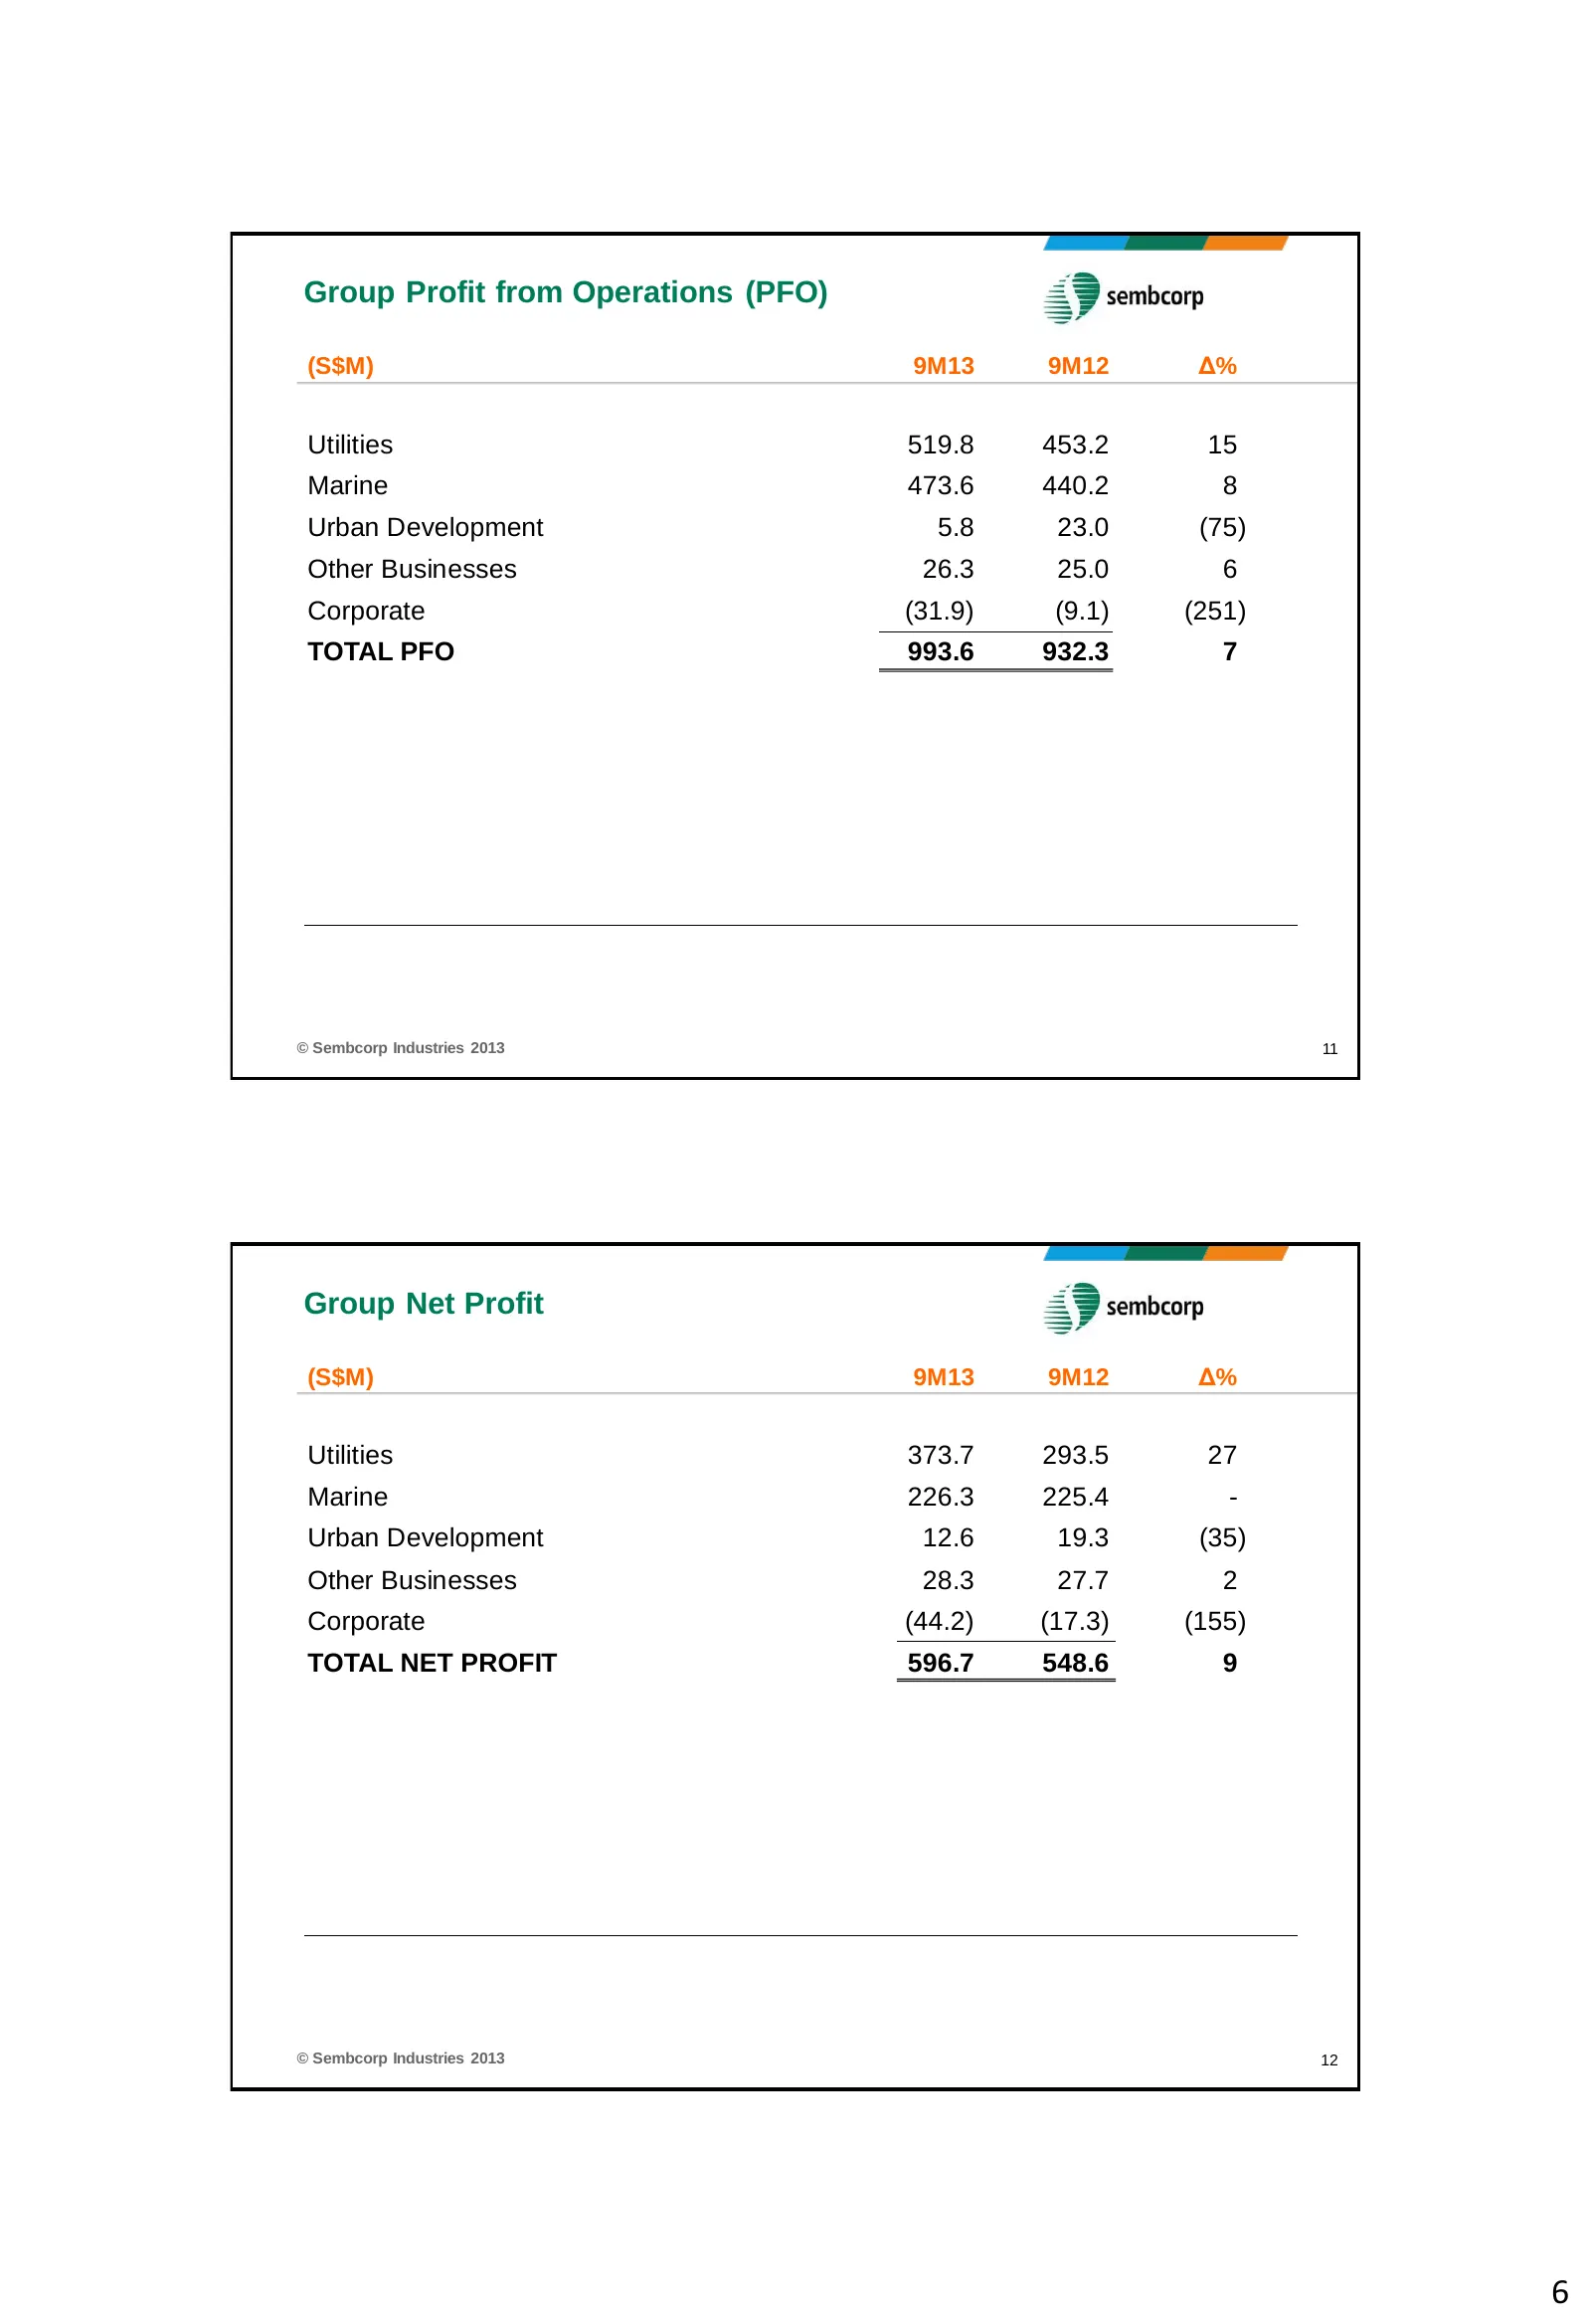
Group Profit from Operations (PFO) (S$M) 9M13 9M12 Δ% Utilities 519.8 453.2 15 Marine 473.6 440.2 8 Urban Development 5.8 23.0 (75) Other Businesses 26.3 25.0 6 Corporate (31.9) (9.1) (251) TOTAL PFO 993.6 932.3 7 © Sembcorp Industries 2013 11 Group Net Profit (S$M) 9M13 9M12 Δ% Utilities 373.7 293.
Slide 7: Utilities Net Profit
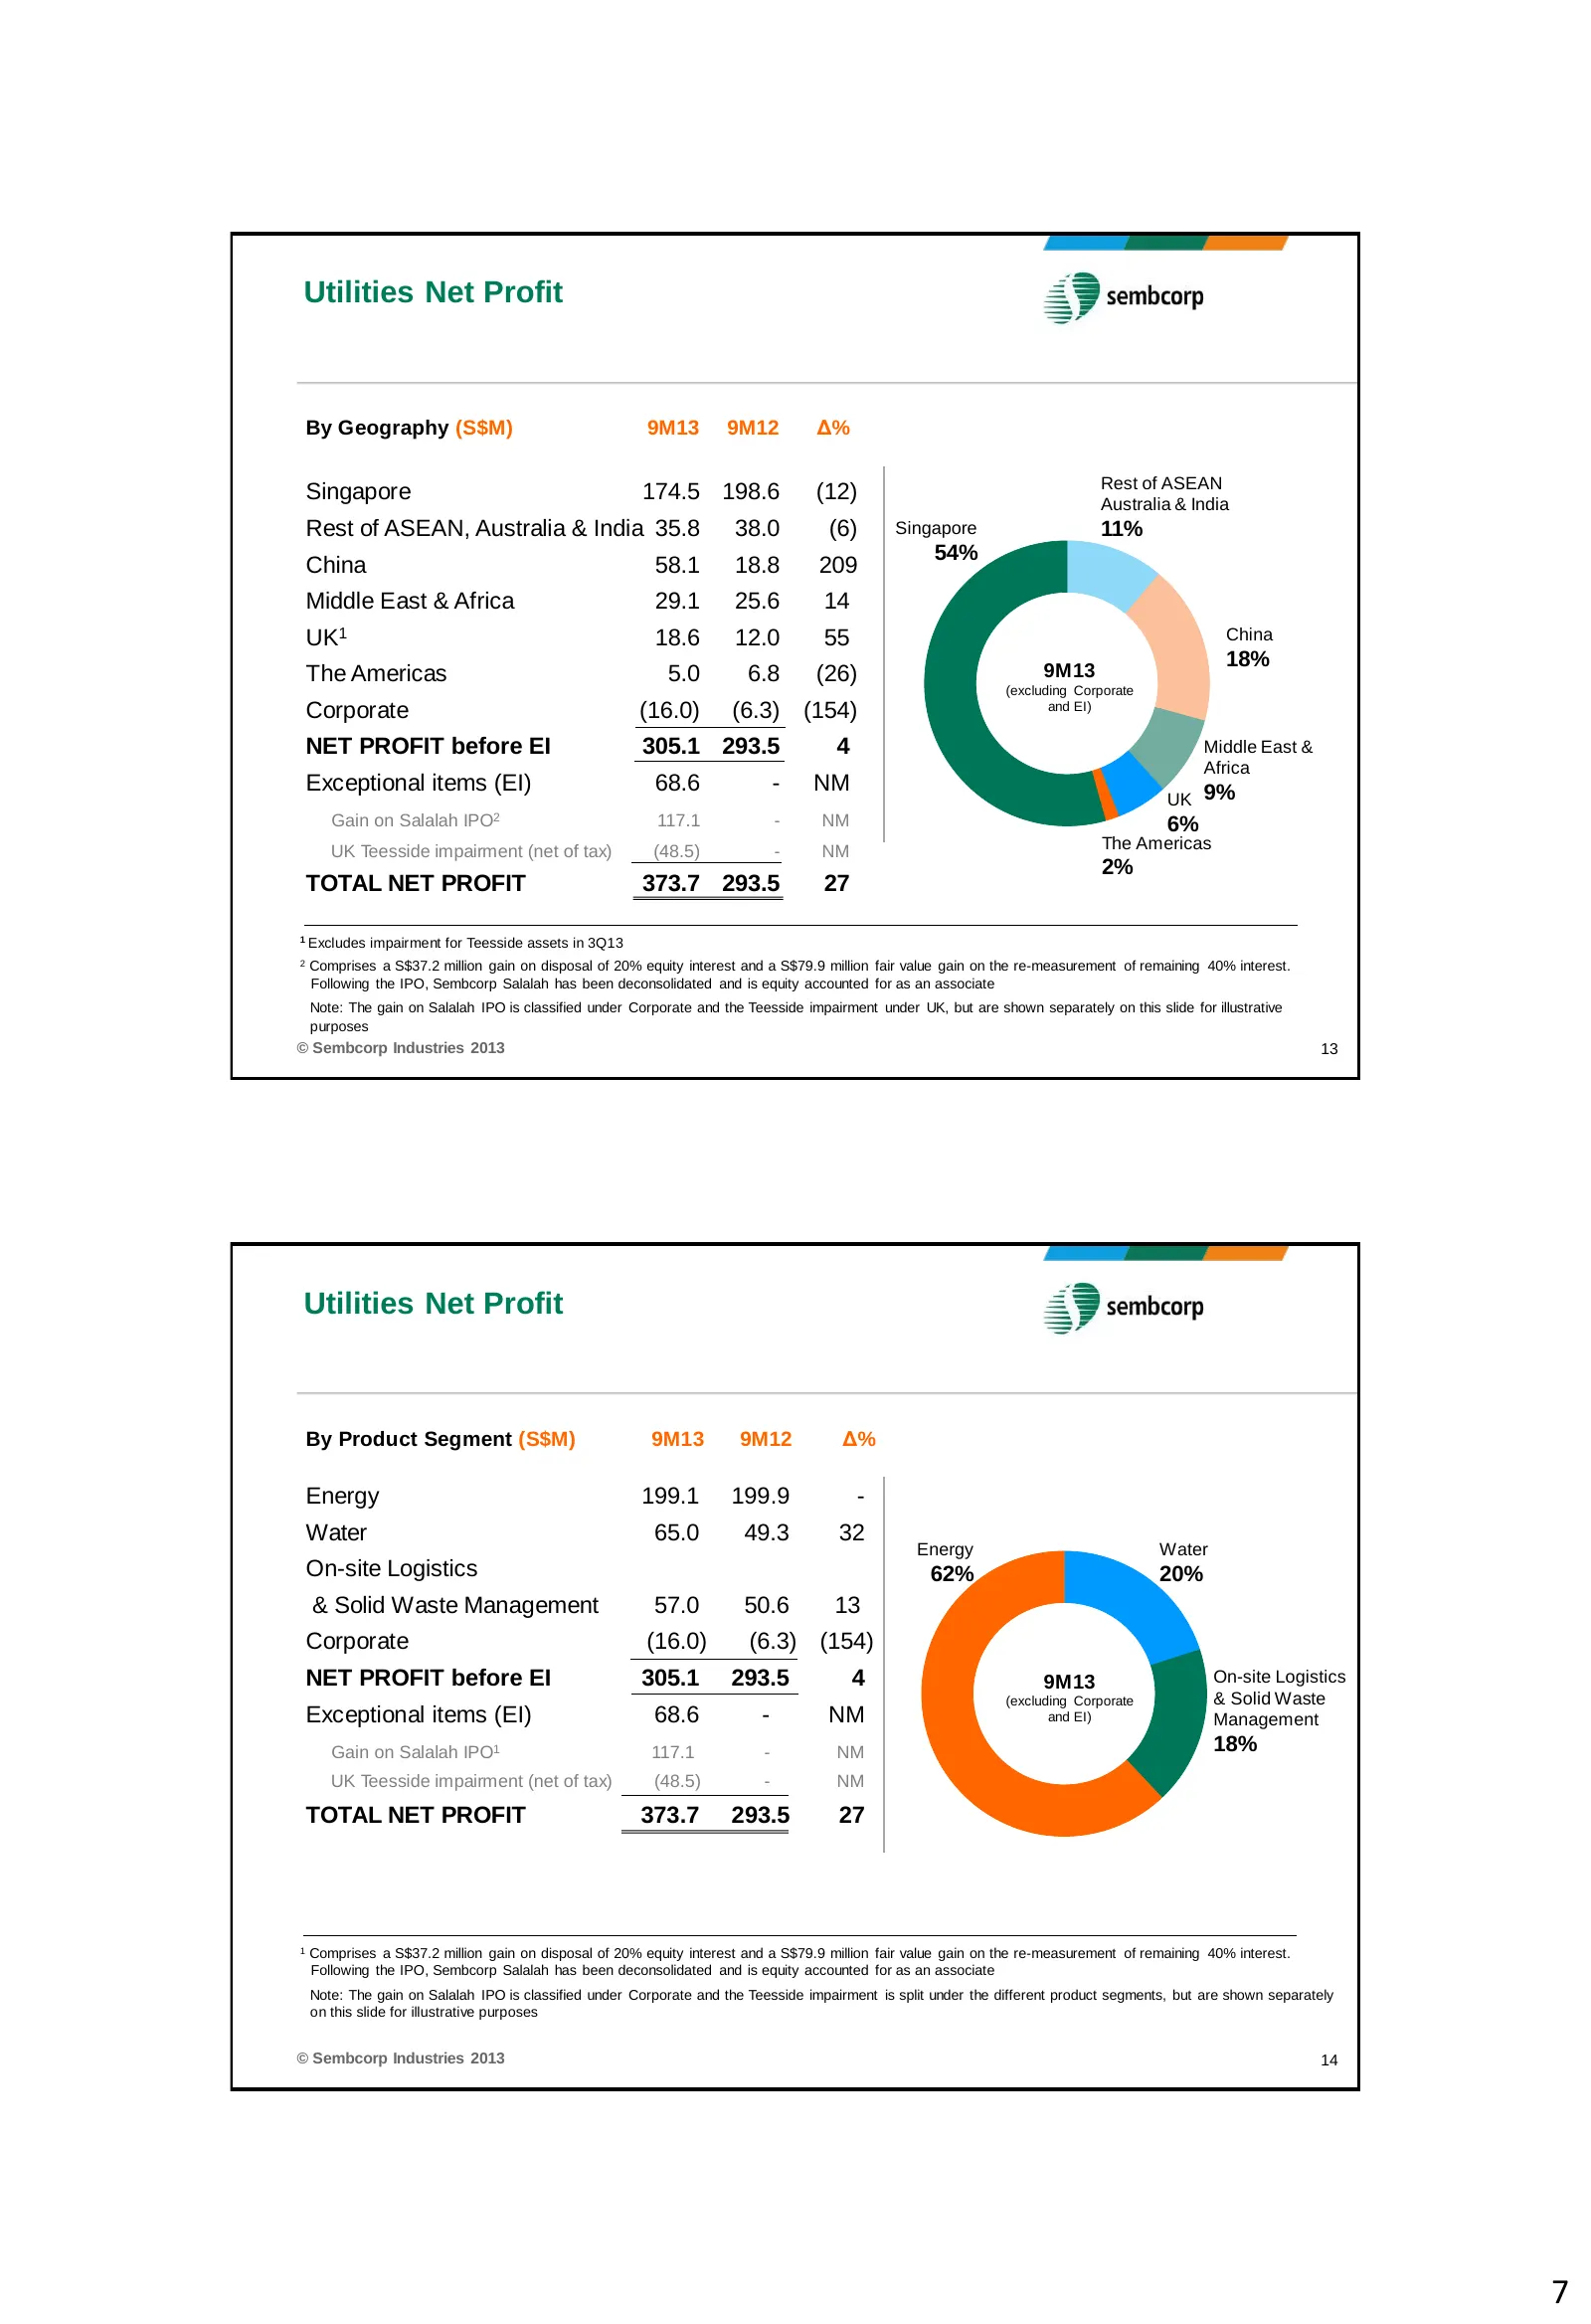
Utilities Net Profit By Geography (S$M) 9M13 9M12 Δ% Rest of ASEAN Singapore 174.5 198.6 (12) Australia & India Rest of ASEAN, Australia & India 35.8 38.0 (6) Singapore 11% 54% China 58.1 18.8 209 Middle East & Africa 29.1 25.6 14 UK1 18.6 12.0 55 China 18% The Americas 5.0 6.8 (26) 9M13 (excluding
Slide 8: Capex and Equity Investment; Group Free Cash Flow
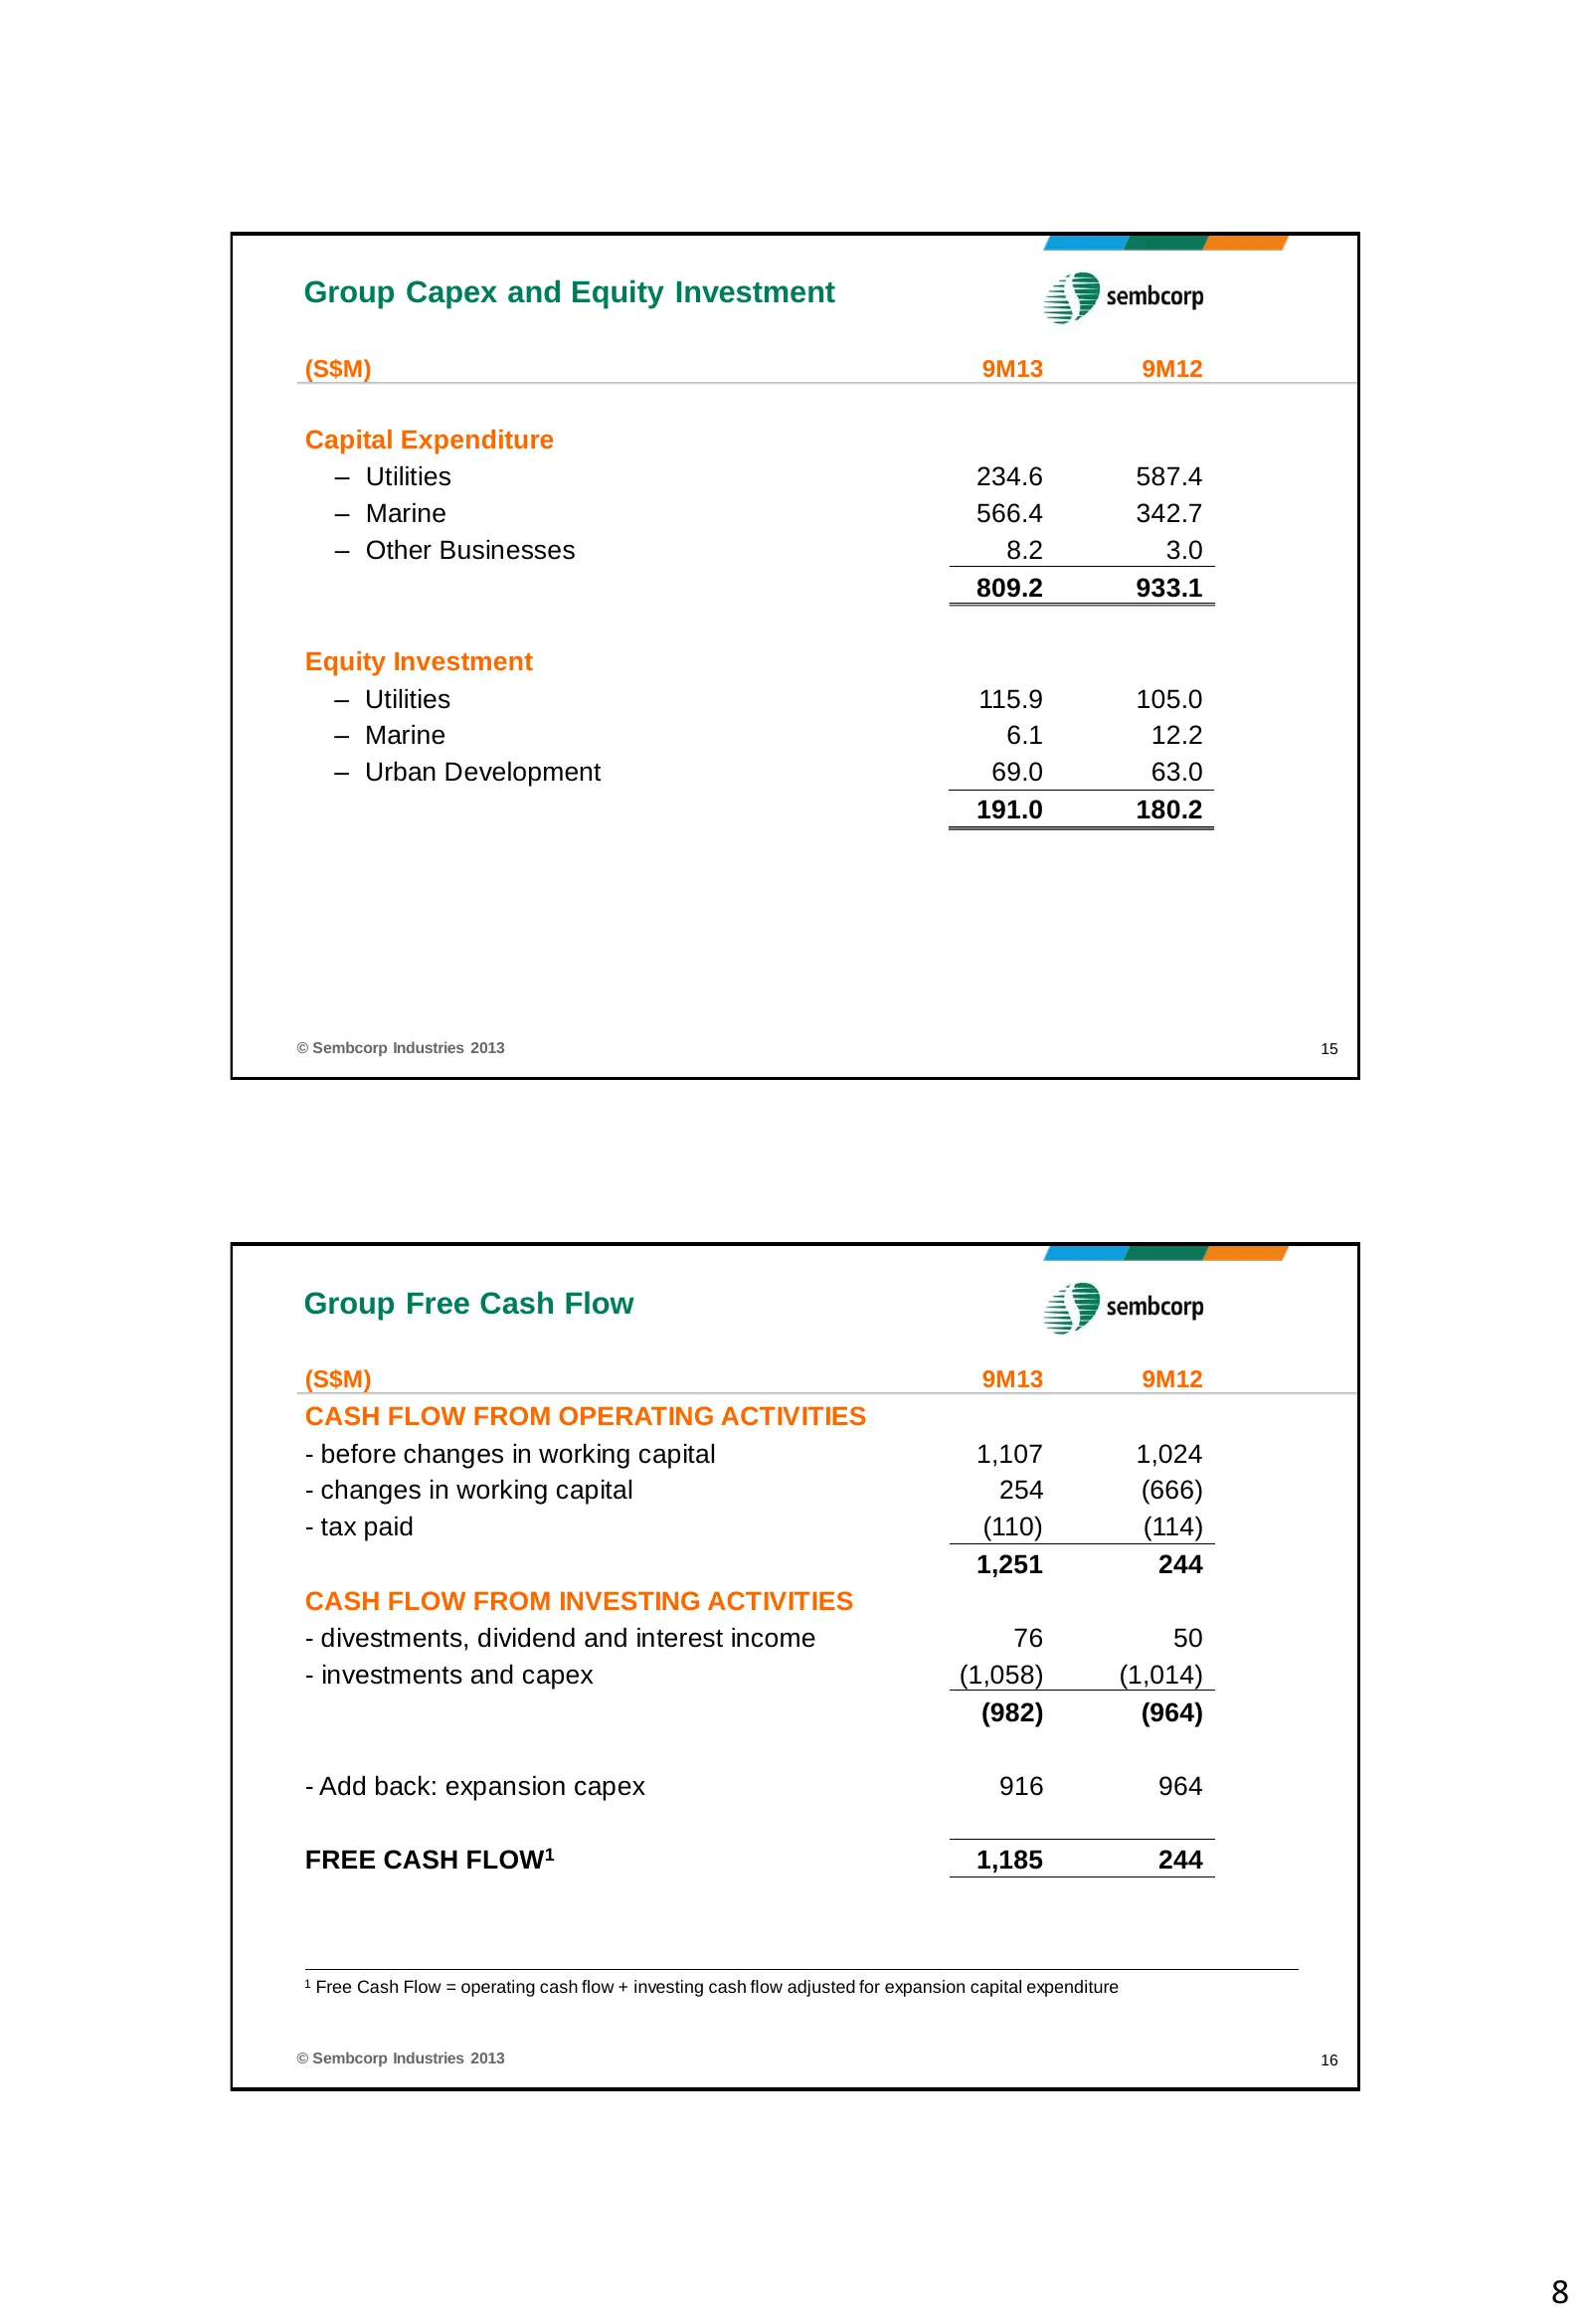
Group Capex and Equity Investment (S$M) 9M13 9M12 Capital Expenditure – Utilities 234.6 587.4 – Marine 566.4 342.7 – Other Businesses 8.2 3.0 809.2 933.1 Equity Investment – Utilities 115.9 105.0 – Marine 6.1 12.2 – Urban Development 69.0 63.0 191.0 180.2 © Sembcorp Industries 2013 15 Group Free Cas
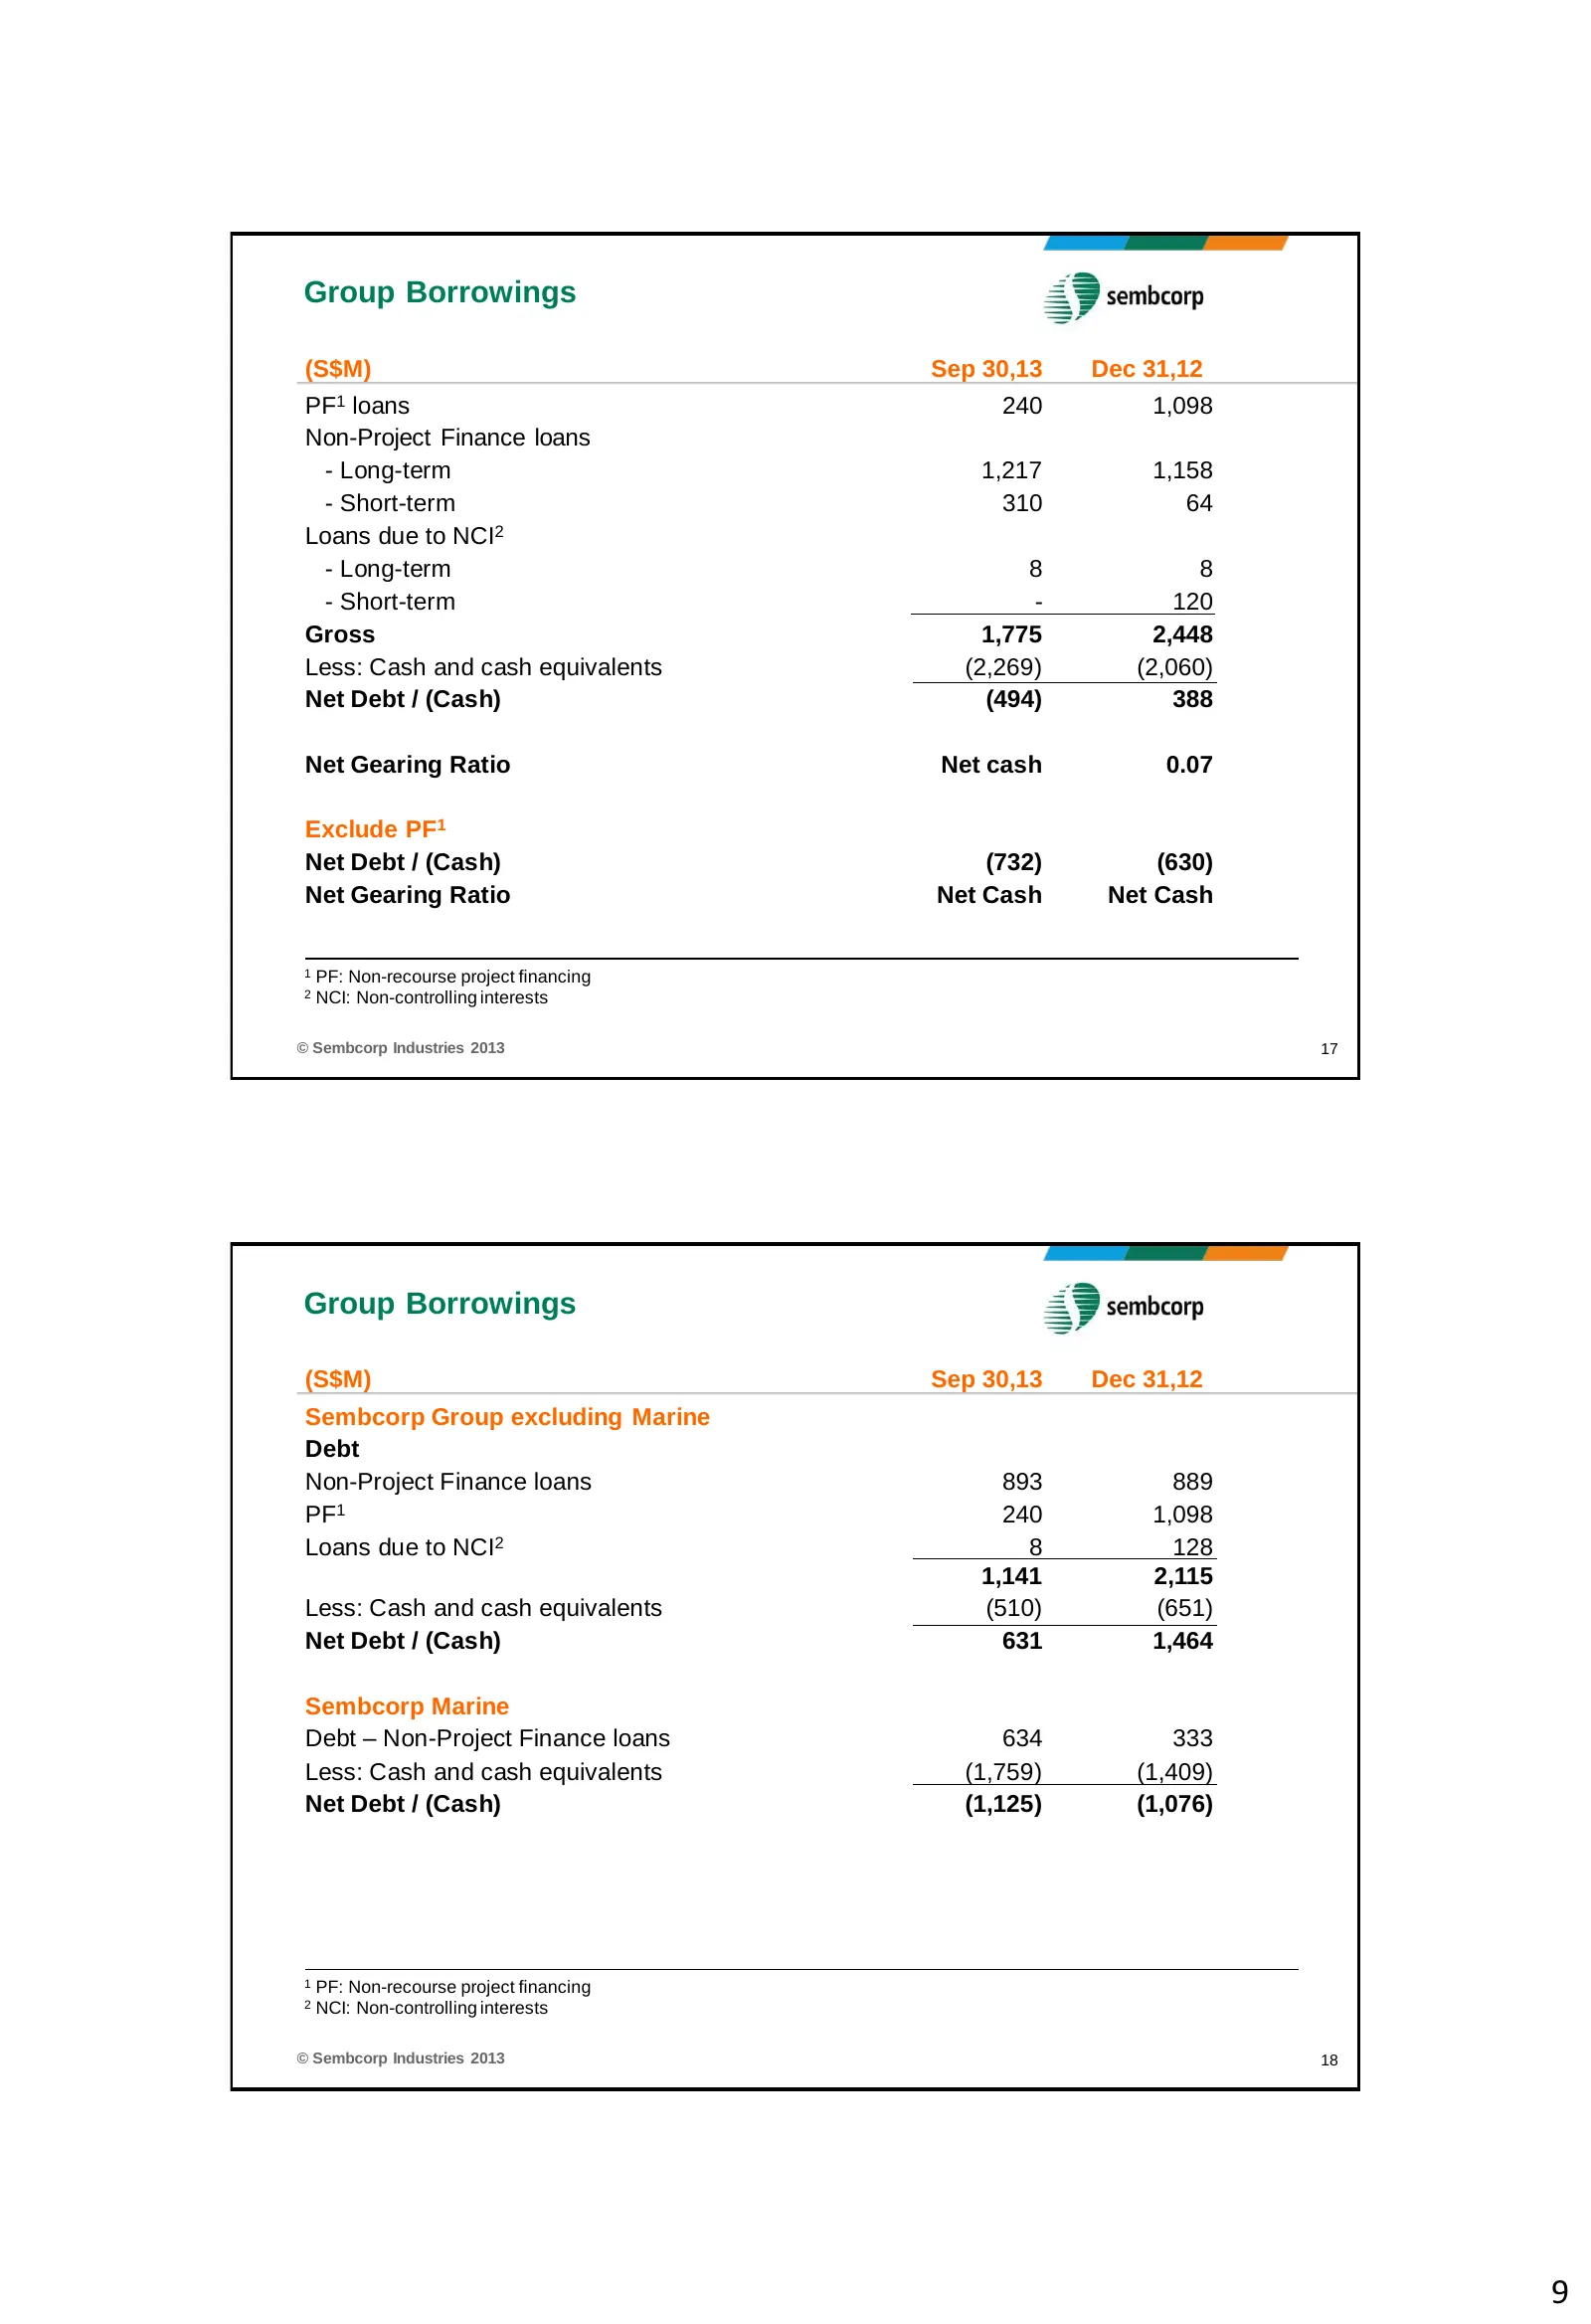
Slide 9: Group Borrowings
Group Borrowings (S$M) Sep 30,13 Dec 31,12 PF1 loans 240 1,098 Non-Project Finance loans - Long-term 1,217 1,158 - Short-term 310 64 Loans due to NCI2 - Long-term 8 8 - Short-term - 120 Gross 1,775 2,448 Less: Cash and cash equivalents (2,269) (2,060) Net Debt / (Cash) (494) 388 Net Gearing Ratio Ne
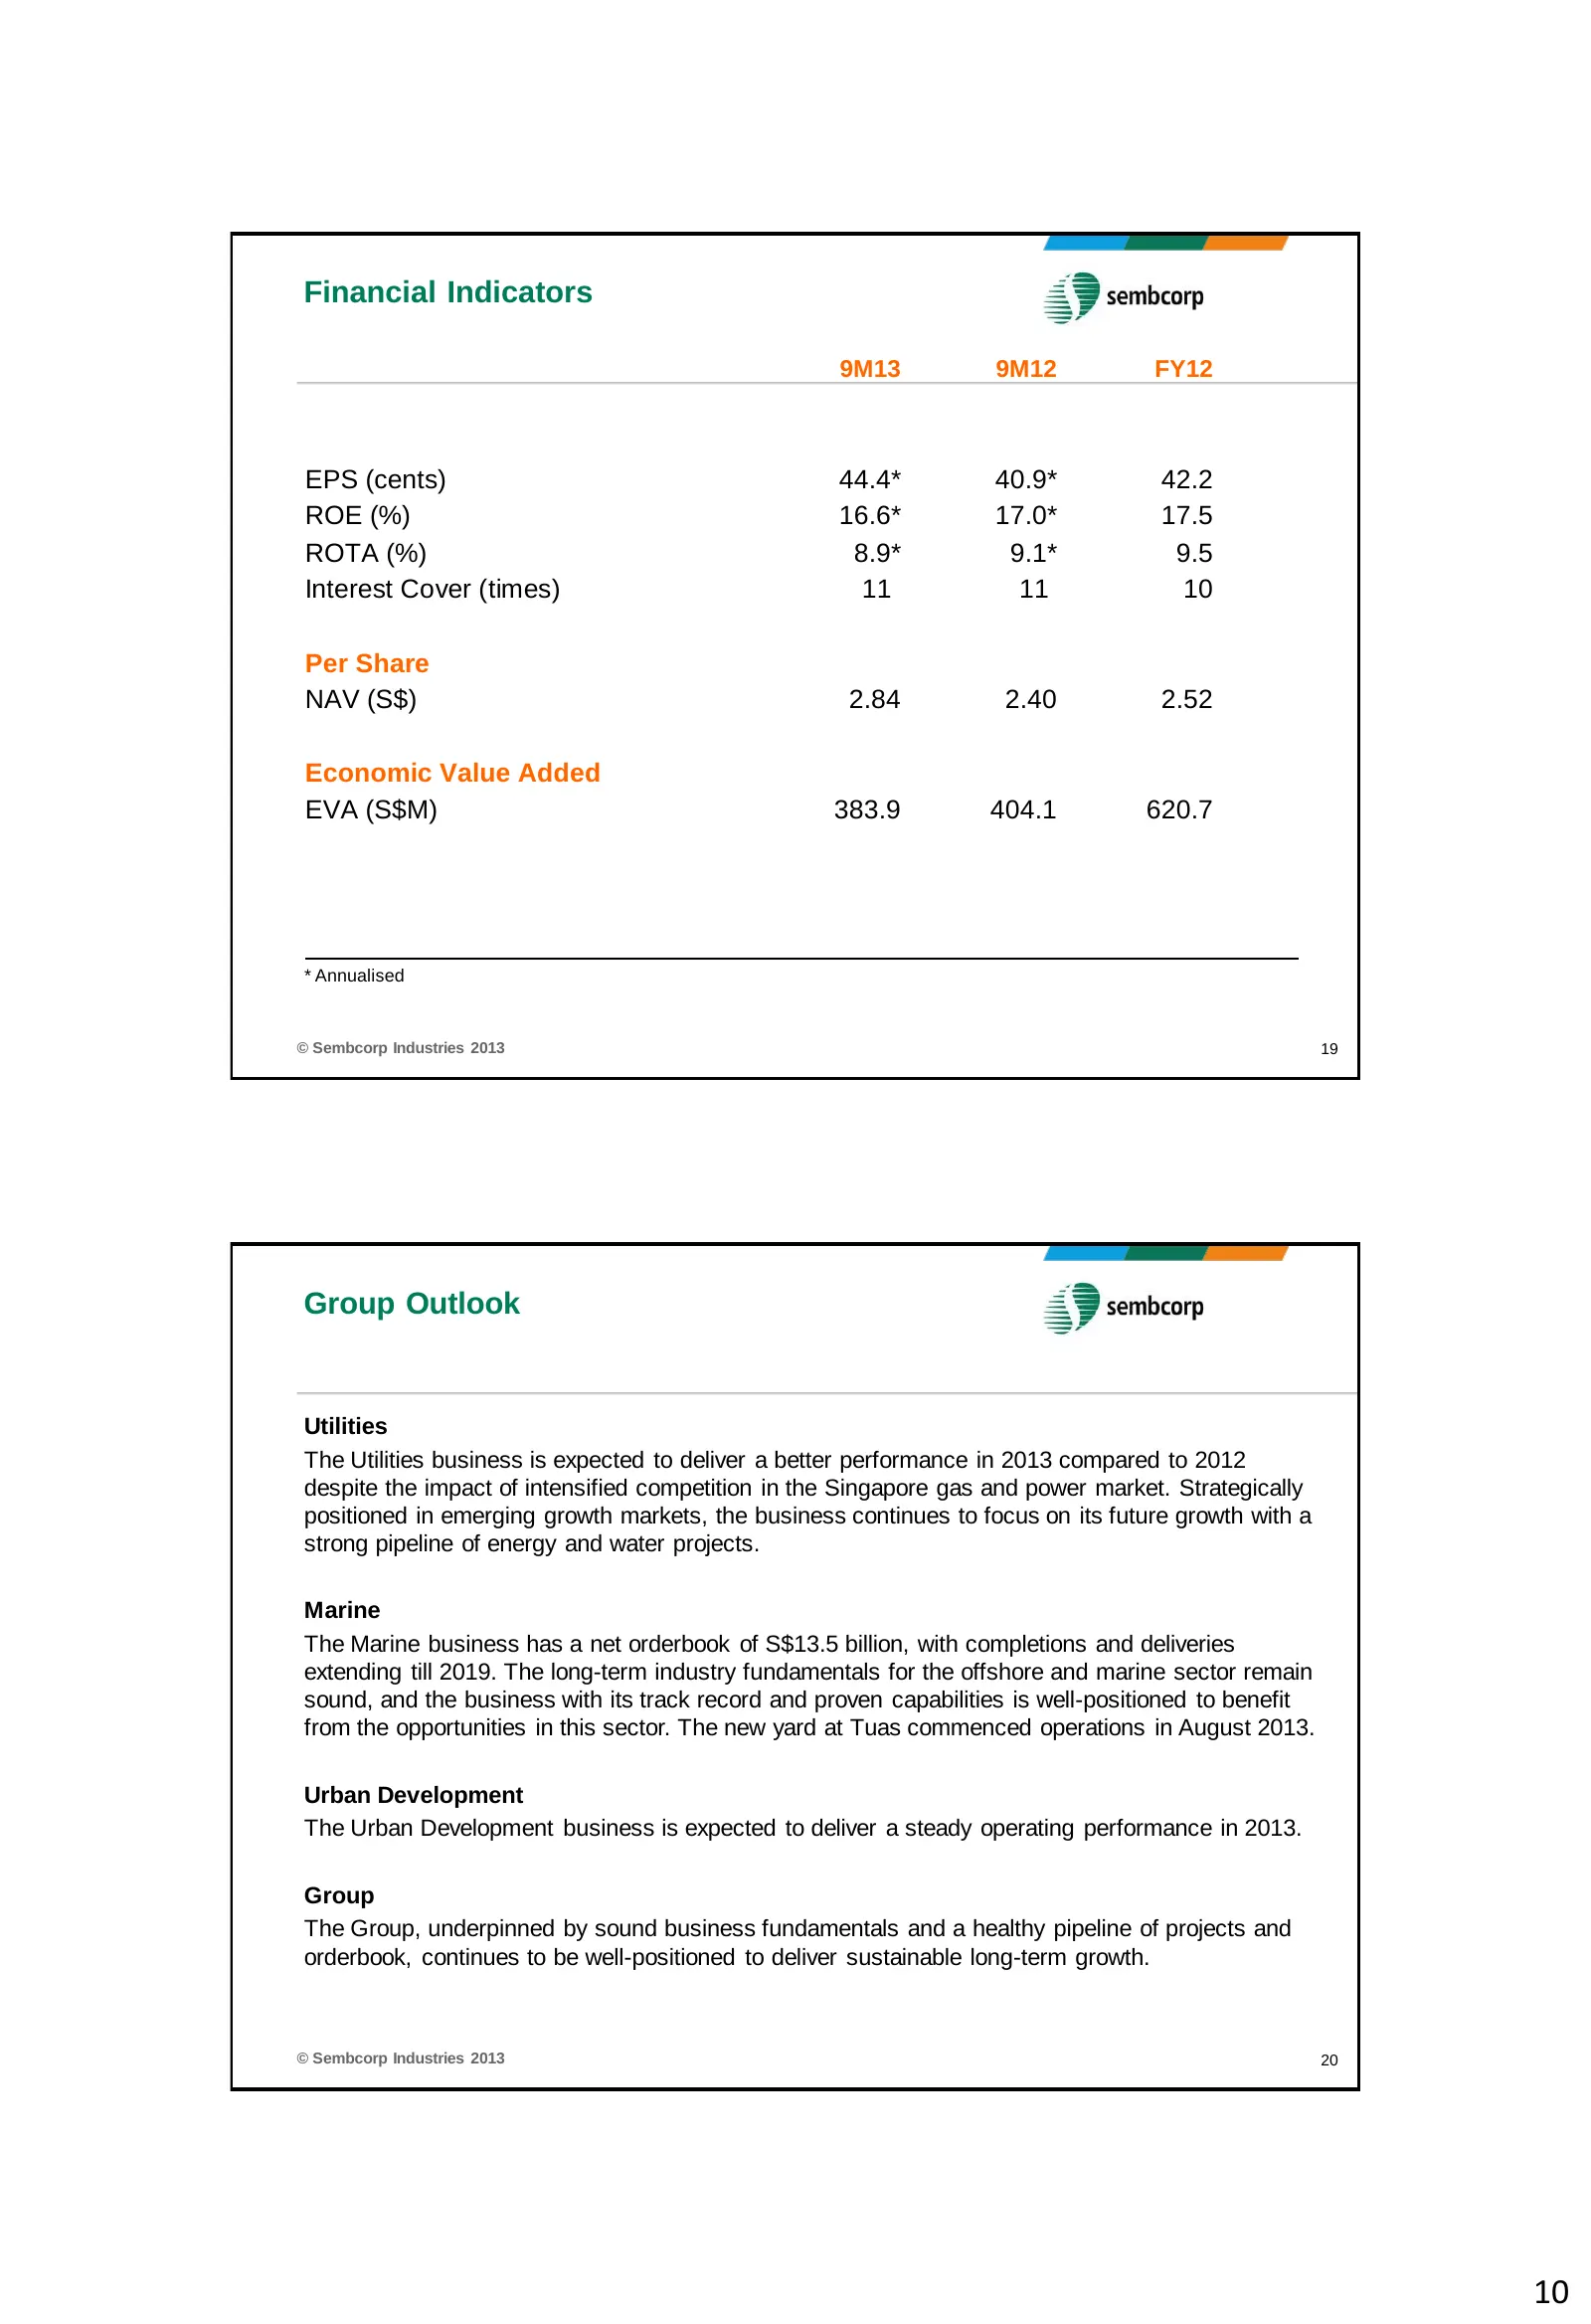
Slide 10: Financial Indicators; Group Outlook
Financial Indicators 9M13 9M12 FY12 EPS (cents) 44.4* 40.9* 42.2 ROE (%) 16.6* 17.0* 17.5 ROTA (%) 8.9* 9.1* 9.5 Interest Cover (times) 11 11 10 Per Share NAV (S$) 2.84 2.40 2.52 Economic Value Added EVA (S$M) 383.9 404.1 620.7 * Annualised © Sembcorp Industries 2013 19 Group Outlook Utilities The U
Slide 11: Disclaimer
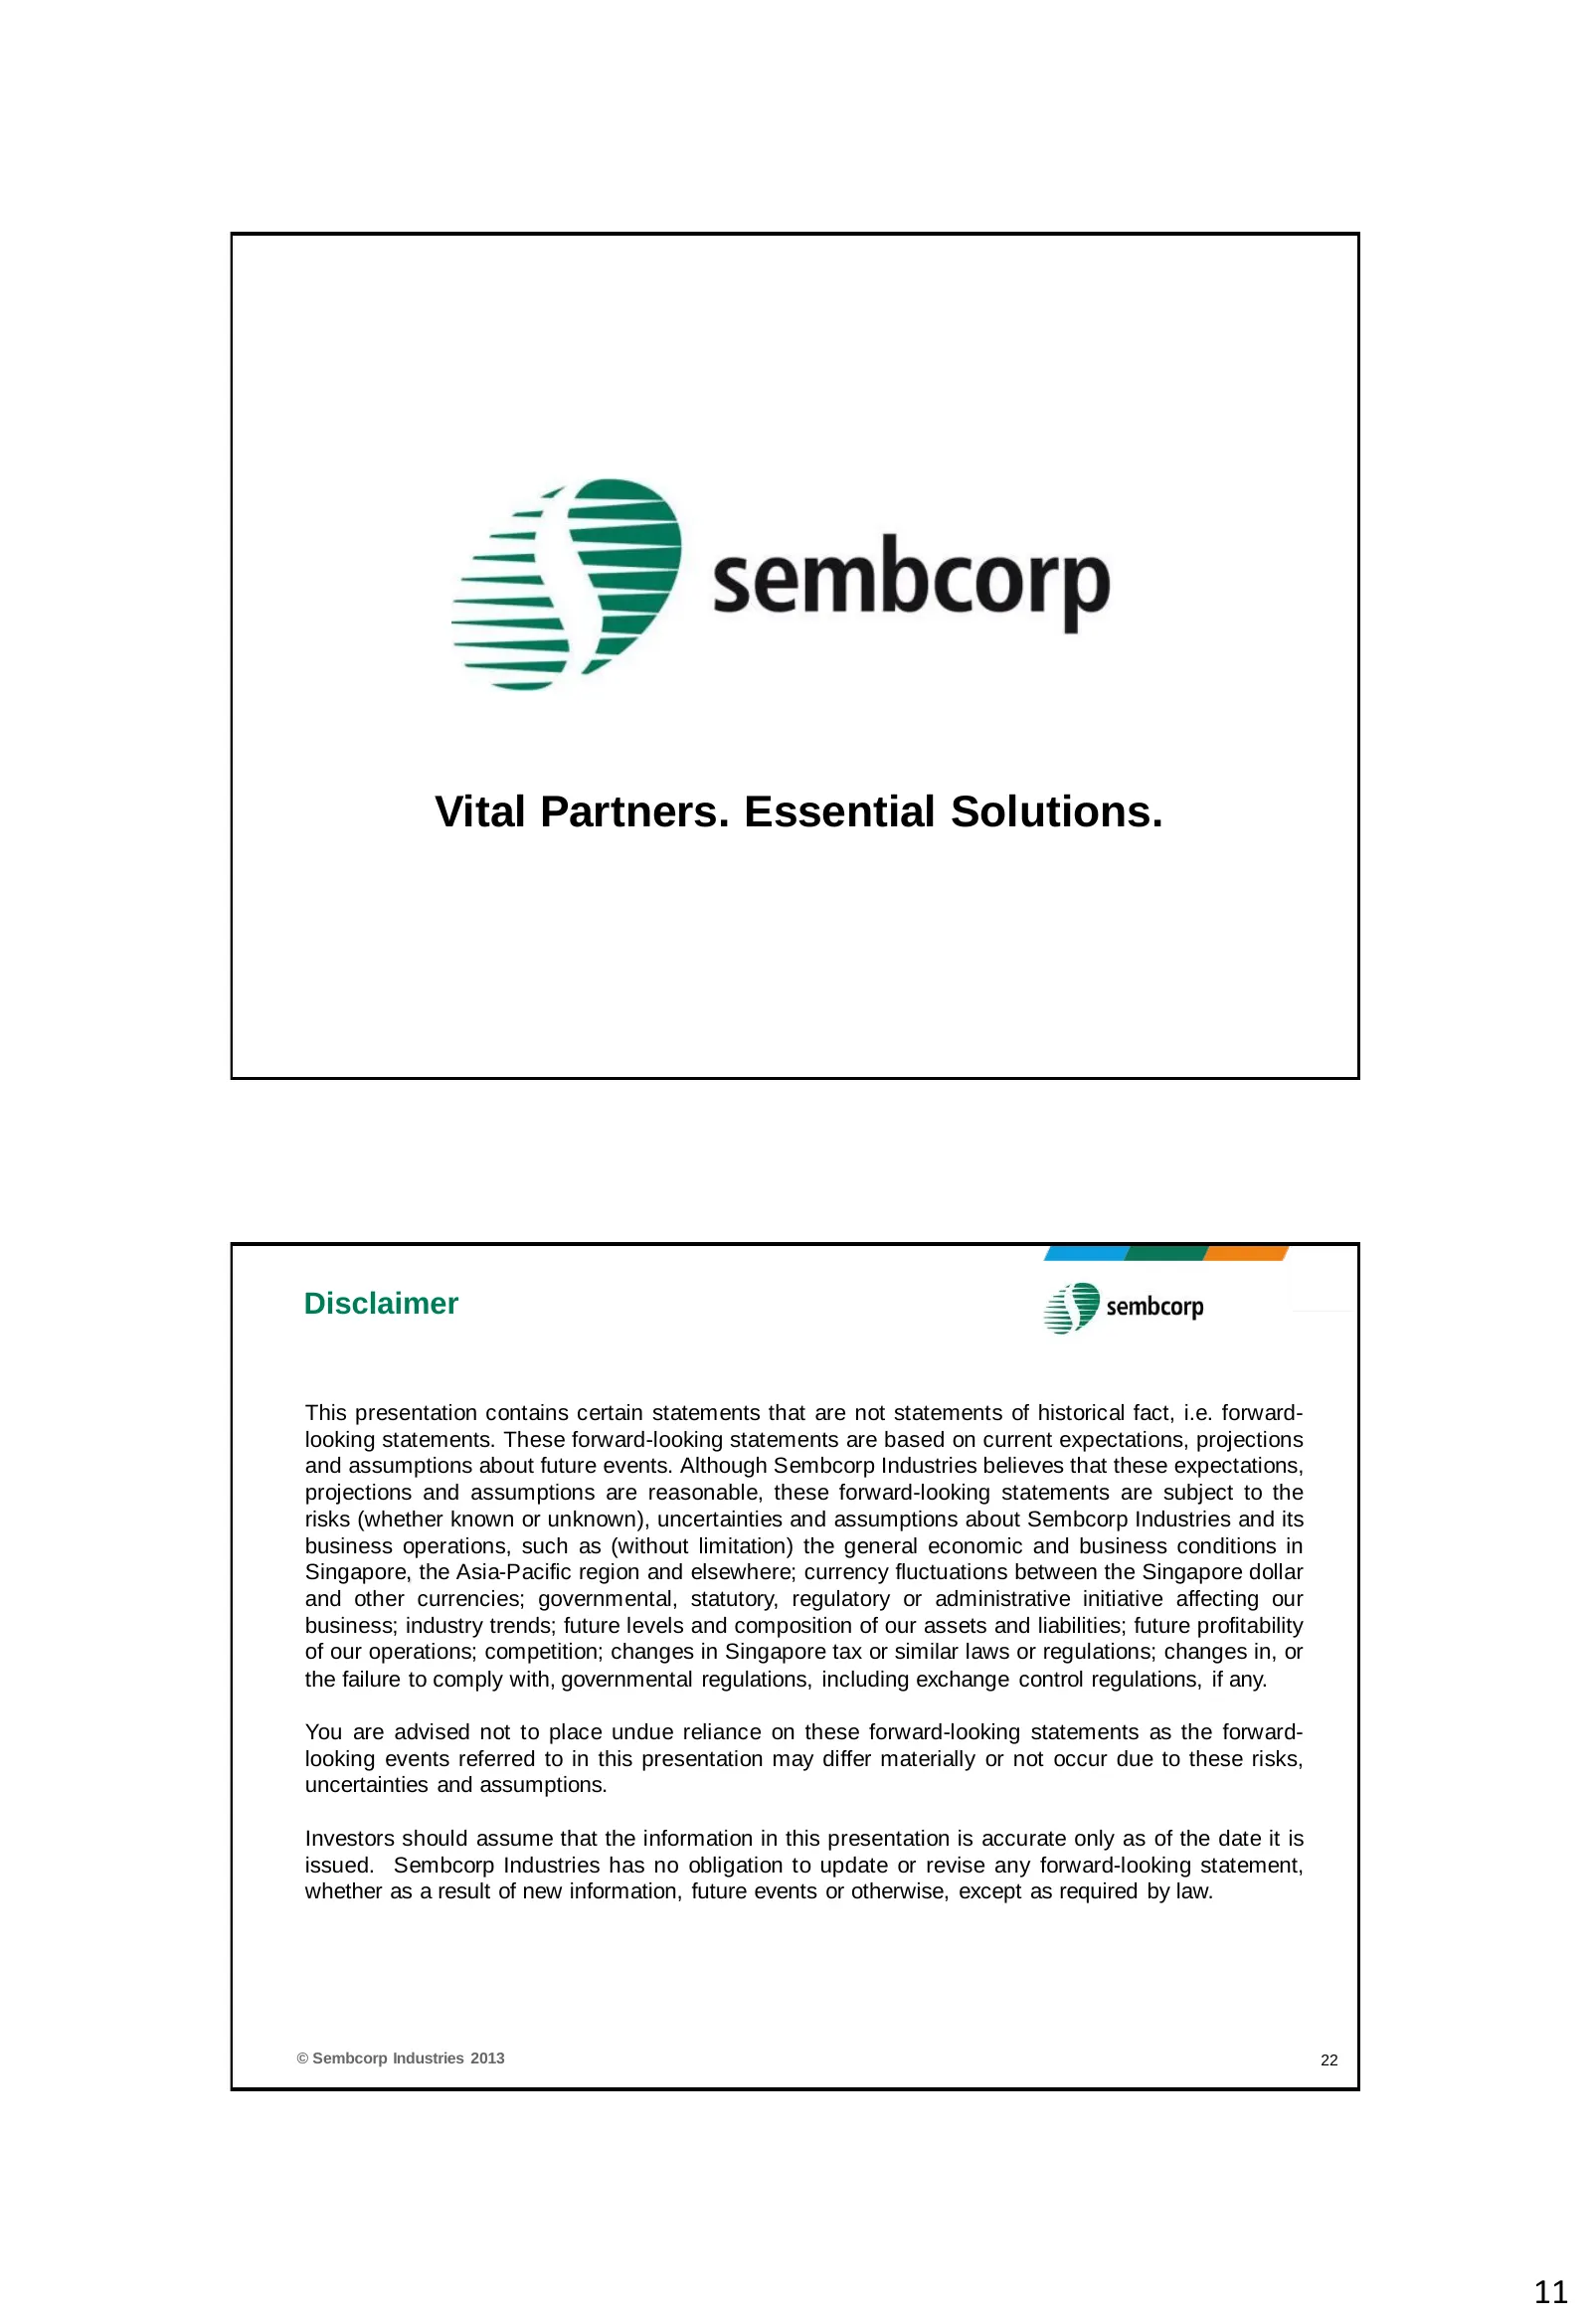
Vital Partners. Essential Solutions. Disclaimer This presentation contains certain statements that are not statements of historical fact, i.e. forward- looking statements. These forward-looking statements are based on current expectations, projections and assumptions about future events. Although Se
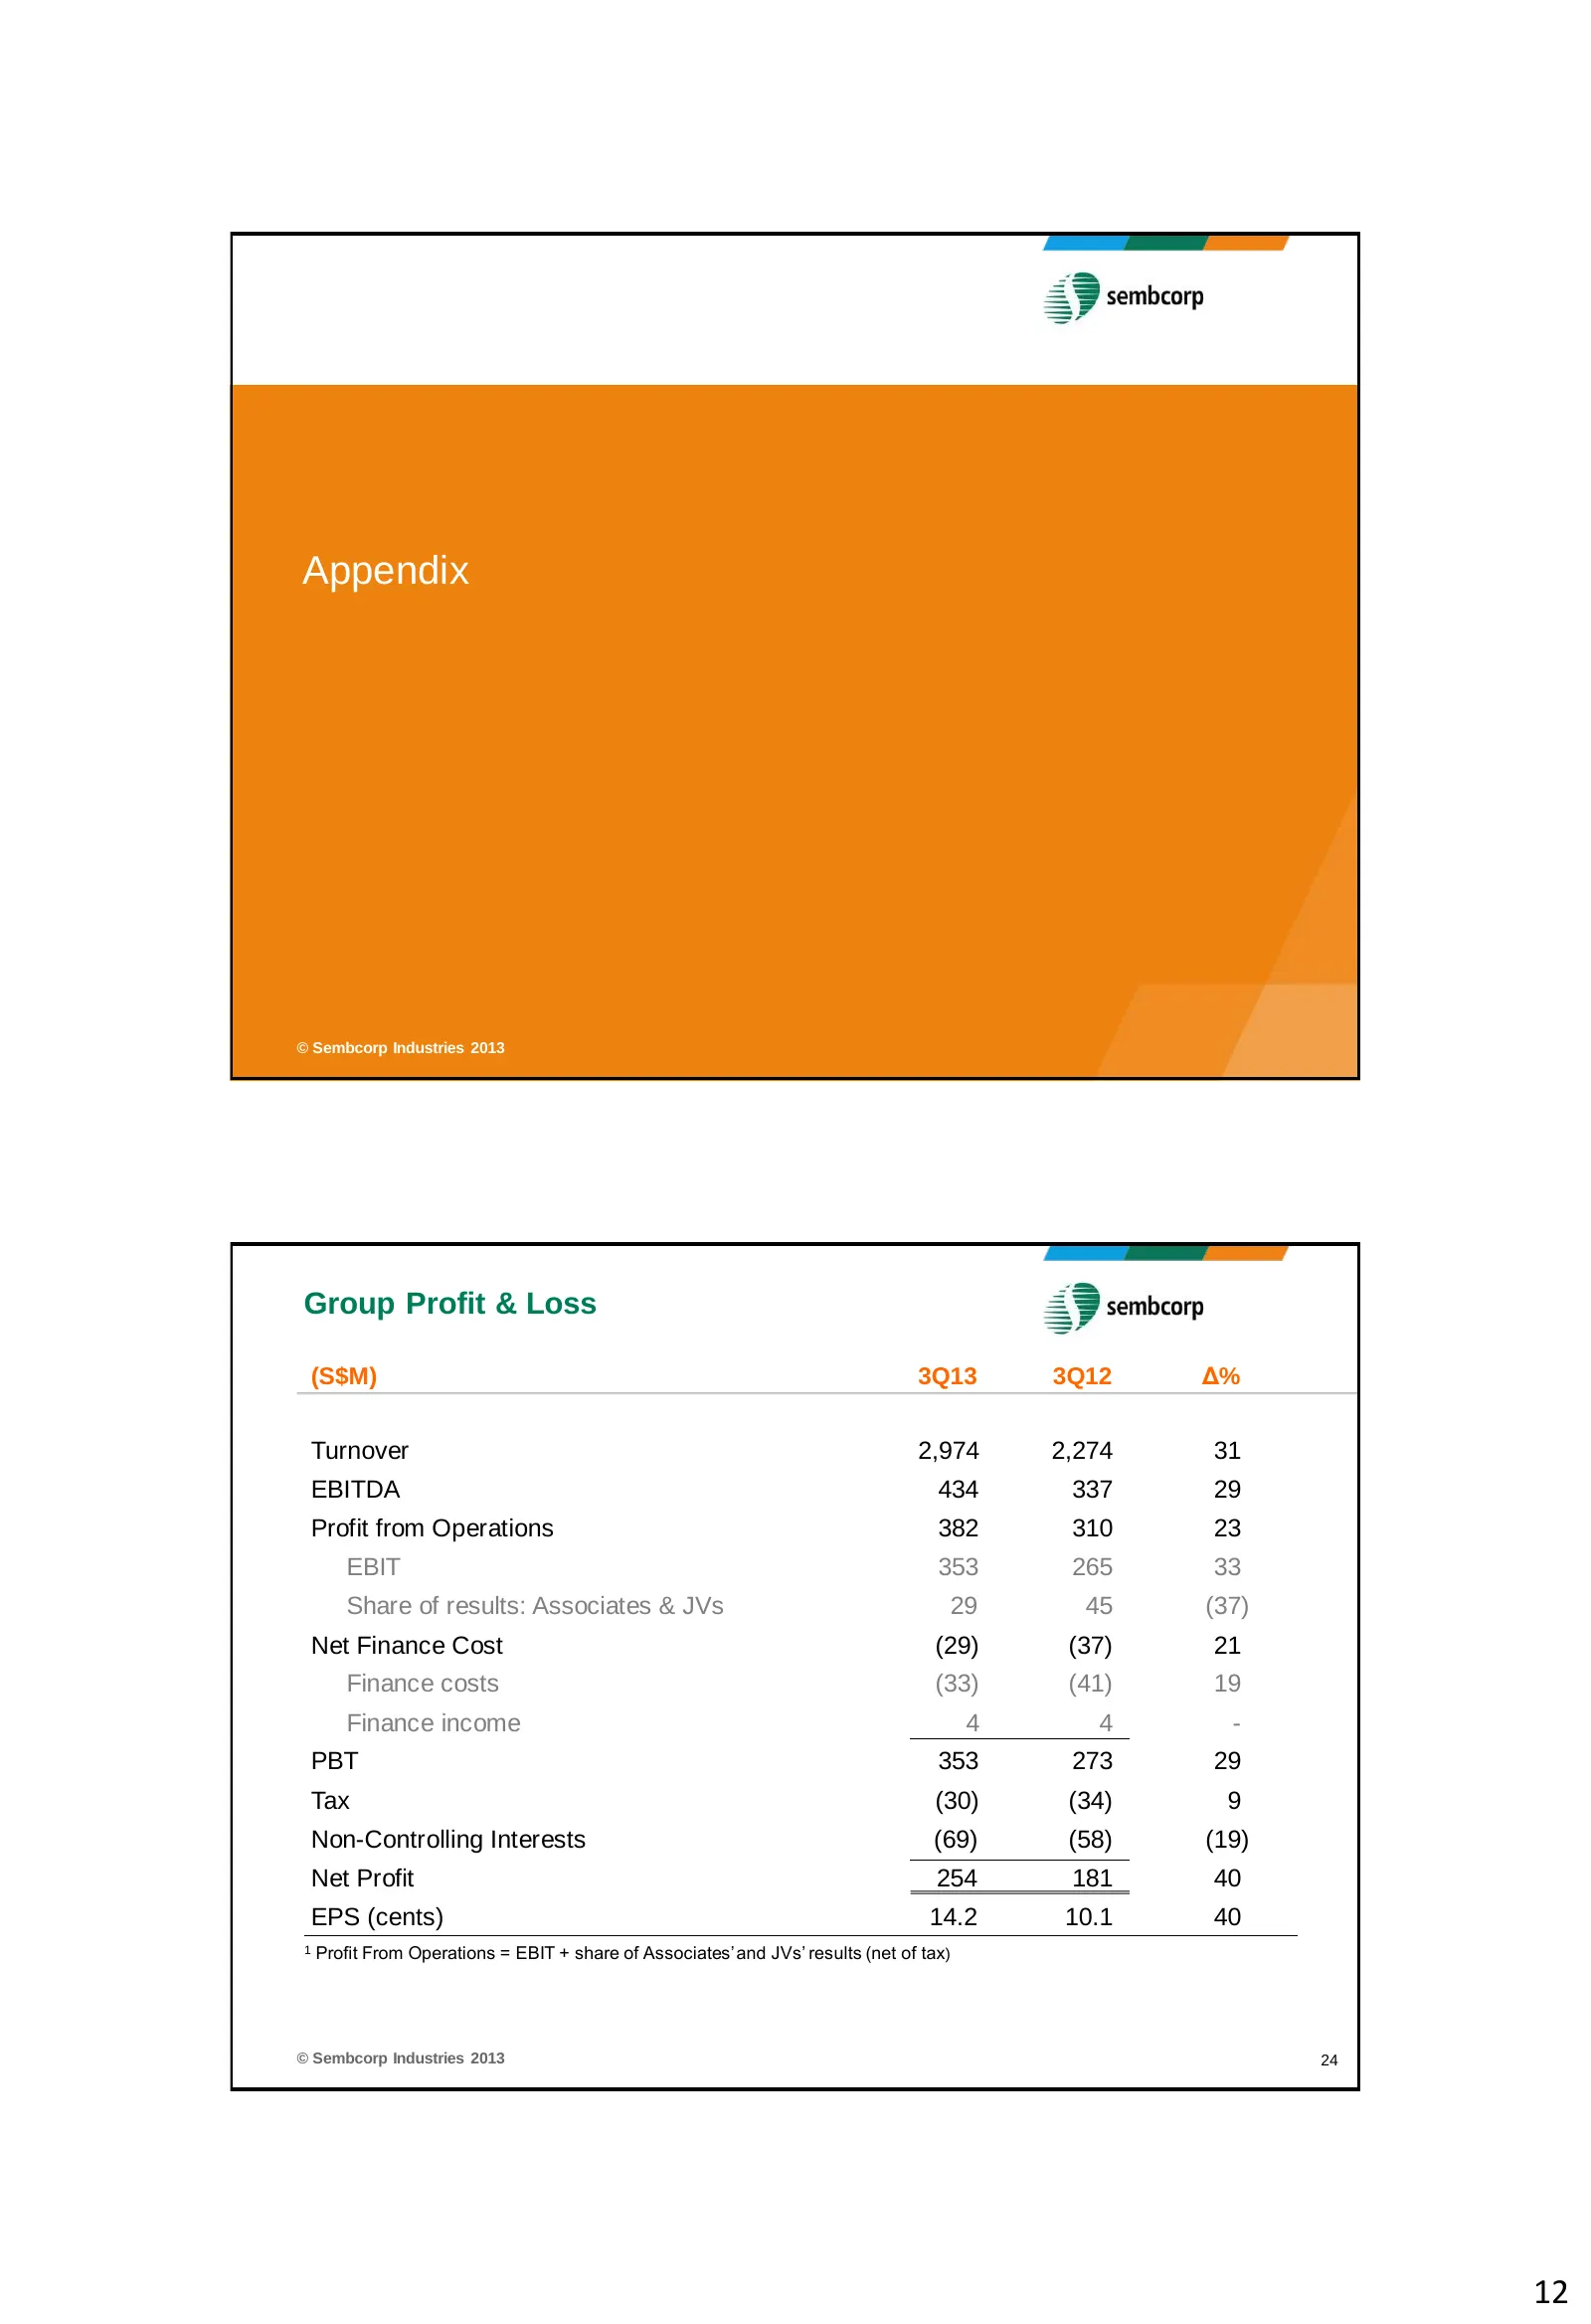
Slide 12: Appendix: Group Profit & Loss
Appendix © Sembcorp Industries 2013 Group Profit & Loss (S$M) 3Q13 3Q12 Δ% Turnover 2,974 2,274 31 EBITDA 434 337 29 Profit from Operations 382 310 23 EBIT 353 265 33 Share of results: Associates & JVs 29 45 (37) Net Finance Cost (29) (37) 21 Finance costs (33) (41) 19 Finance income 4 4 - PBT 353 2
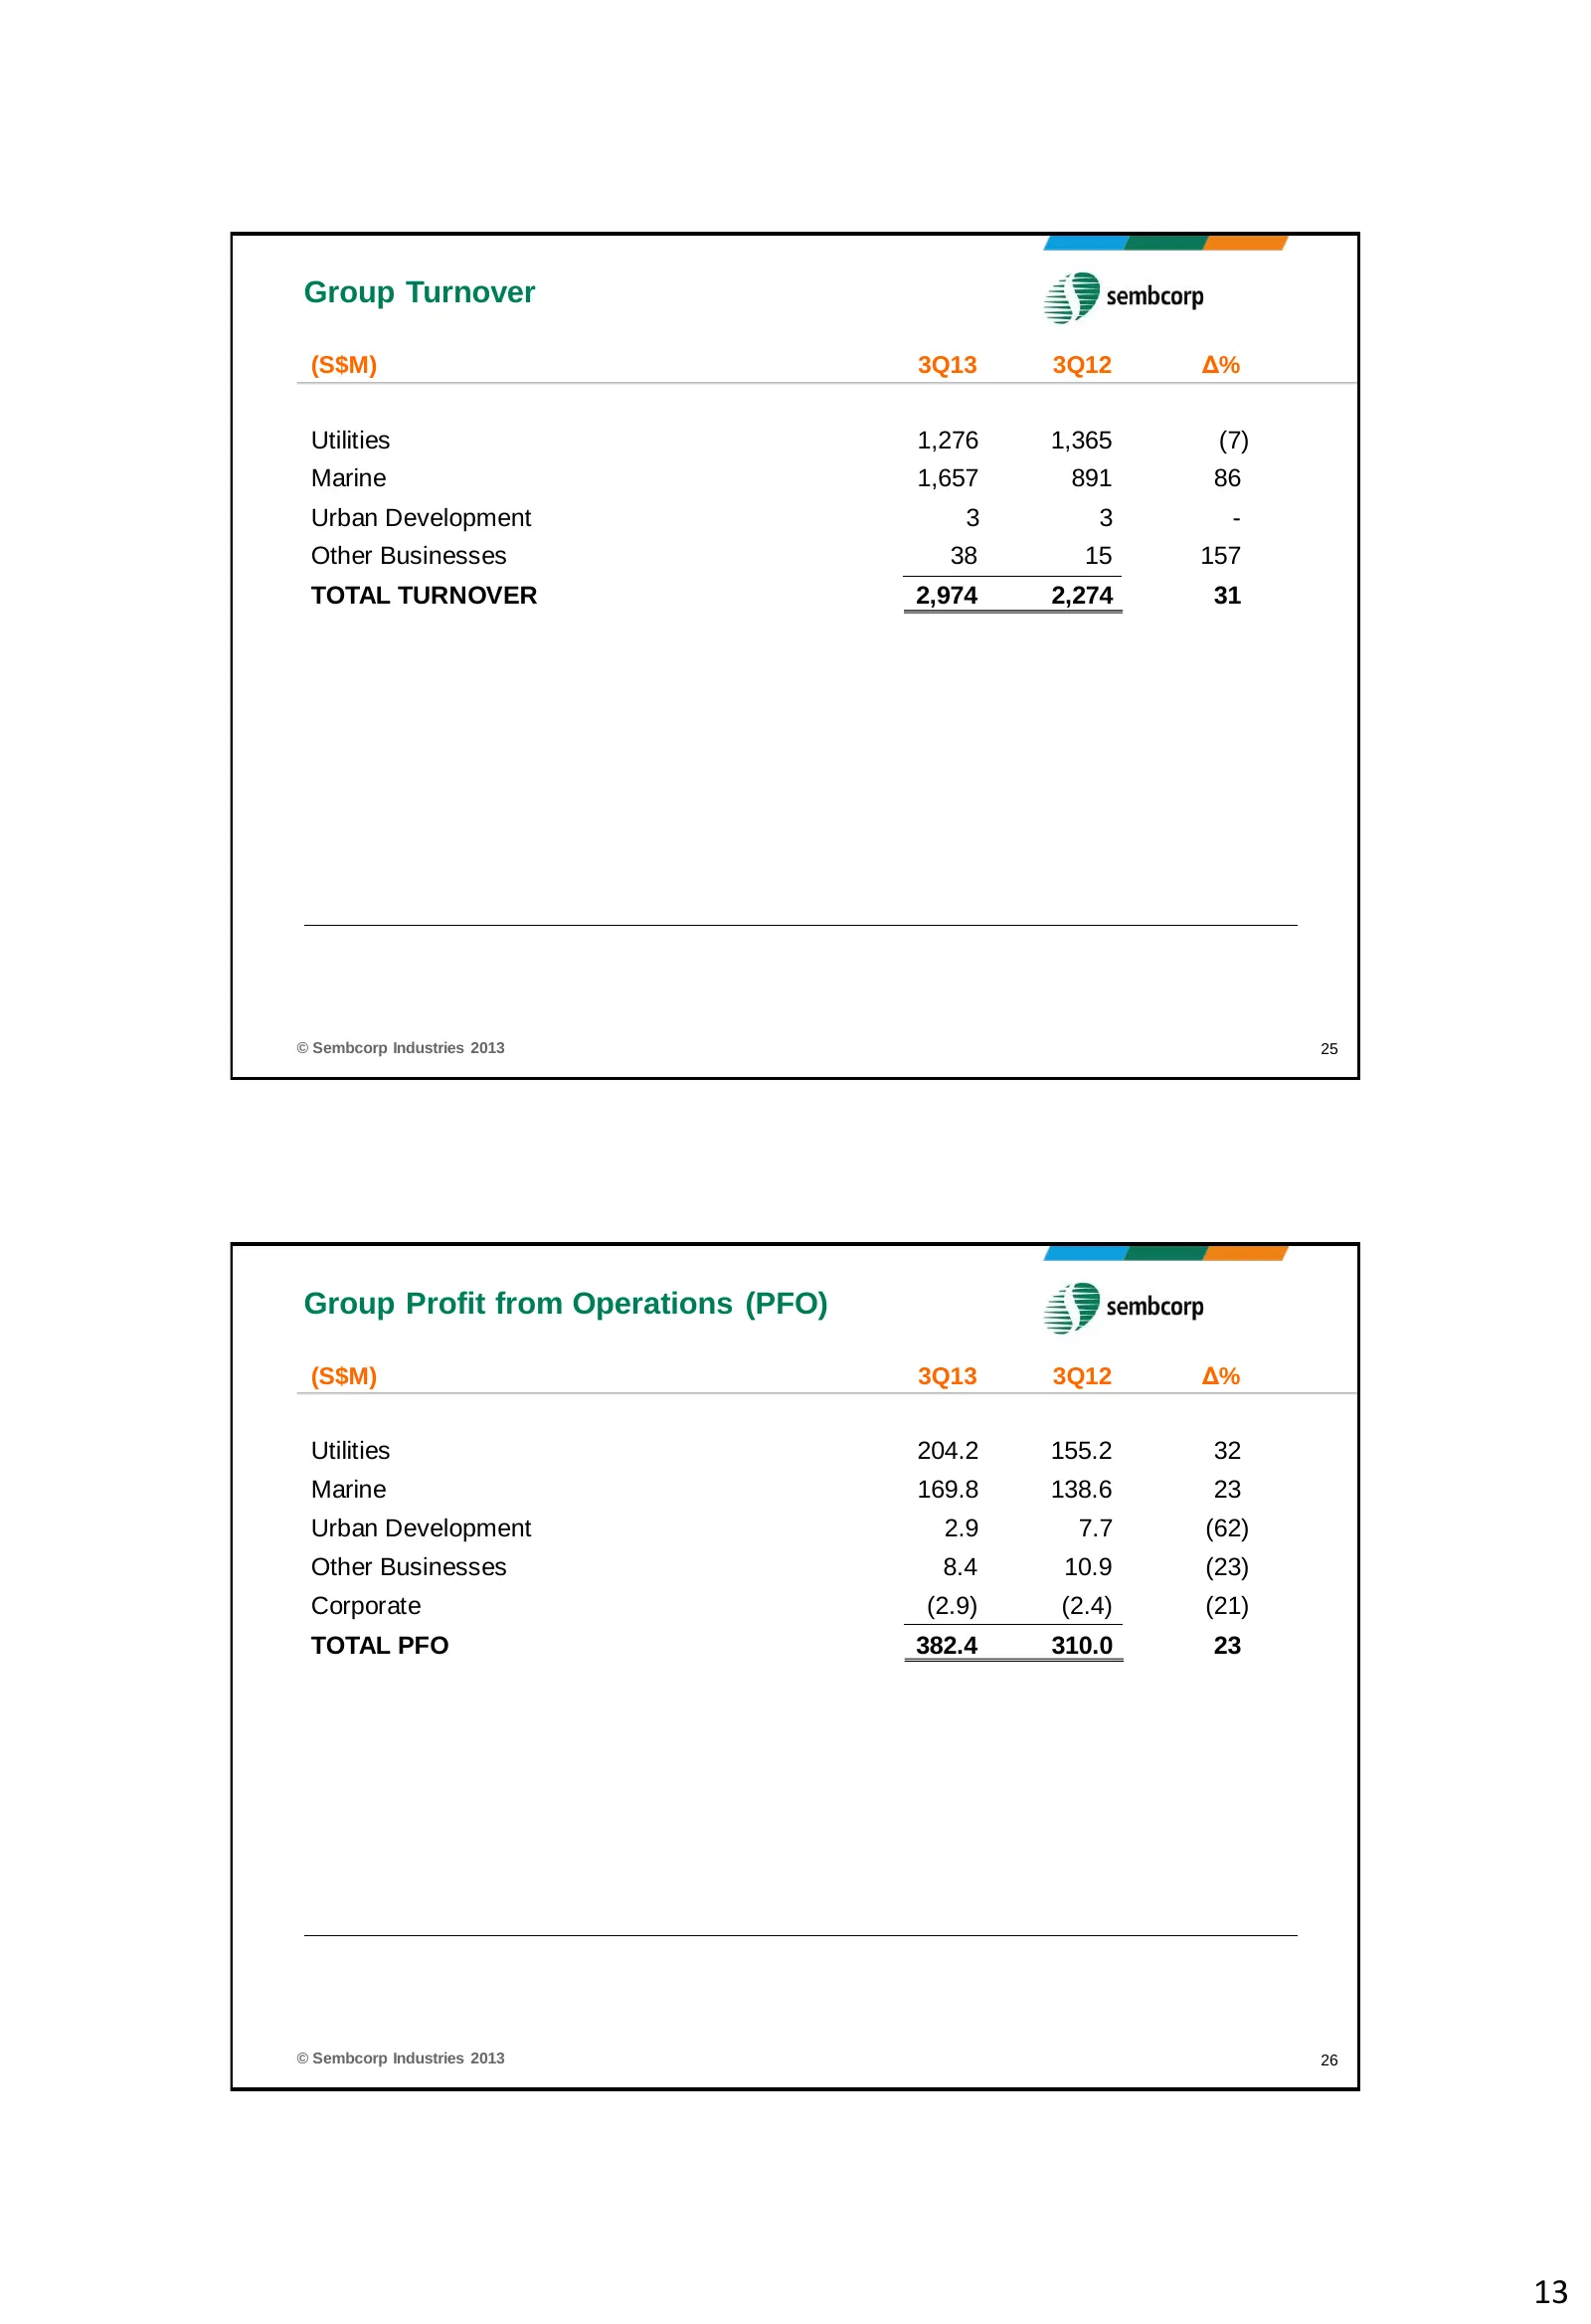
Slide 13: Group Turnover; Group Profit from Operations
Group Turnover (S$M) 3Q13 3Q12 Δ% Utilities 1,276 1,365 (7) Marine 1,657 891 86 Urban Development 3 3 - Other Businesses 38 15 157 TOTAL TURNOVER 2,974 2,274 31 © Sembcorp Industries 2013 25 Group Profit from Operations (PFO) (S$M) 3Q13 3Q12 Δ% Utilities 204.2 155.2 32 Marine 169.8 138.6 23 Urban De
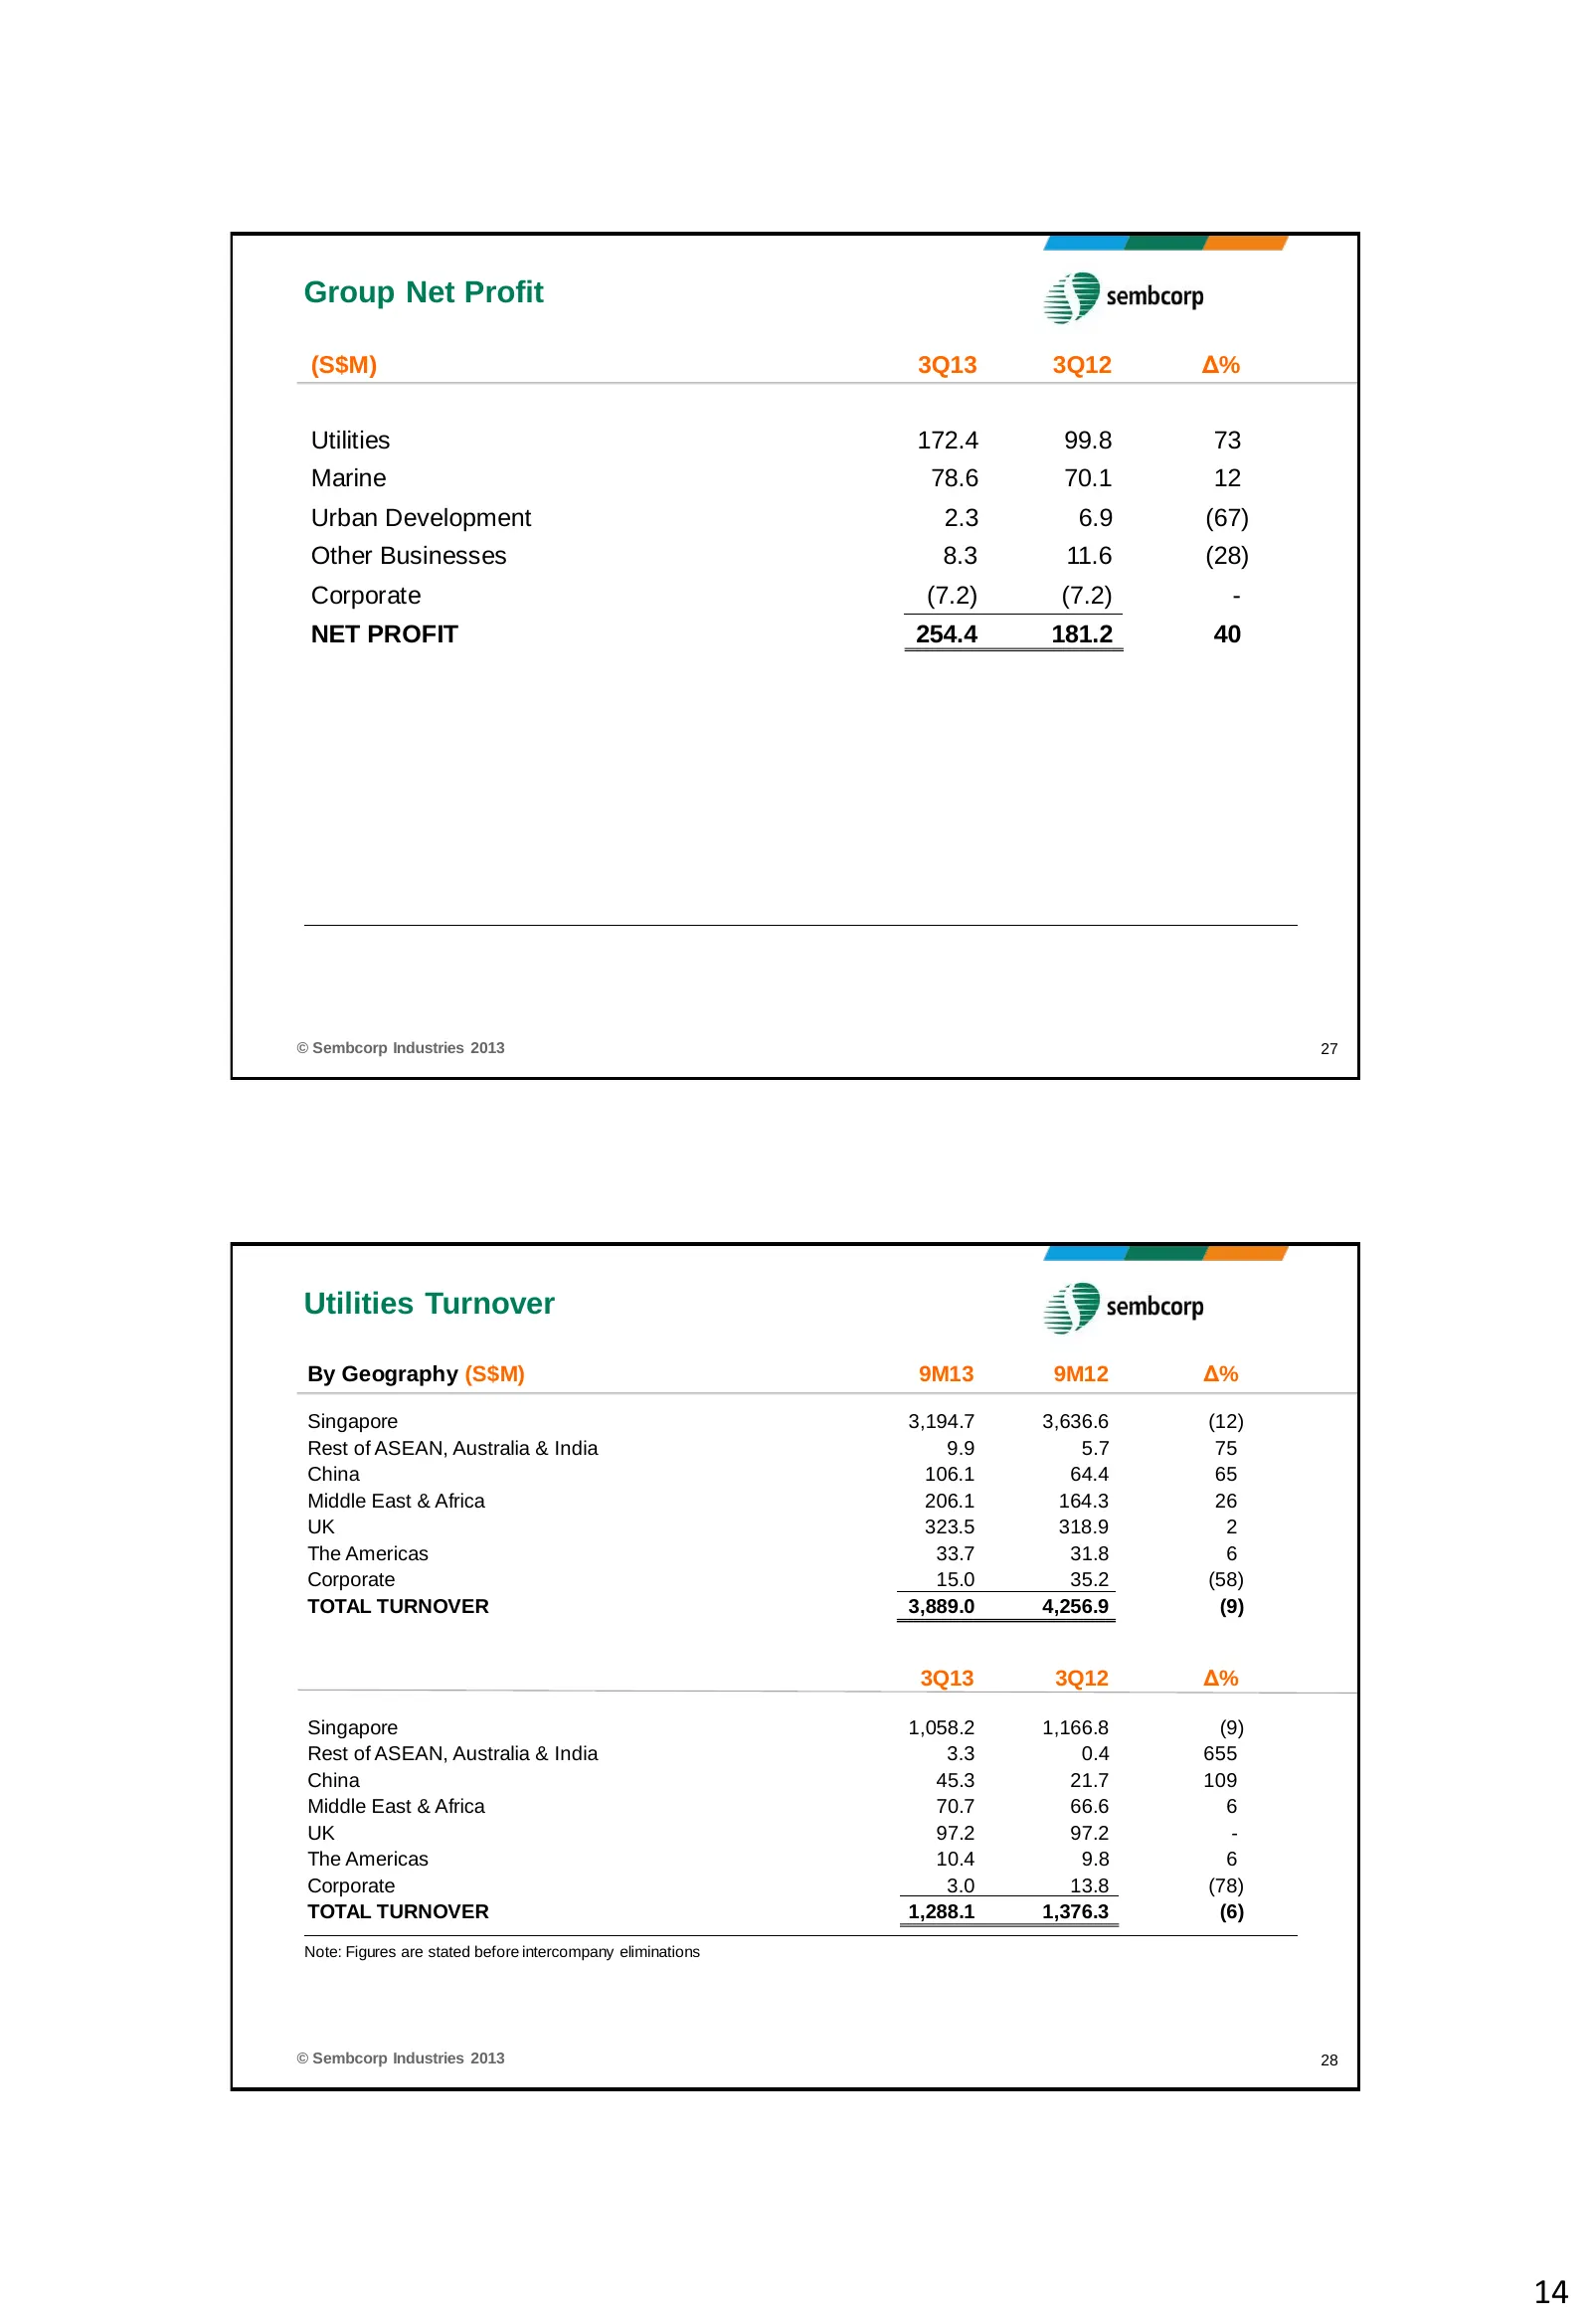
Slide 14: Group Net Profit; Utilities Turnover
Group Net Profit (S$M) 3Q13 3Q12 Δ% Utilities 172.4 99.8 73 Marine 78.6 70.1 12 Urban Development 2.3 6.9 (67) Other Businesses 8.3 11.6 (28) Corporate (7.2) (7.2) - NET PROFIT 254.4 181.2 40 © Sembcorp Industries 2013 27 Utilities Turnover By Geography (S$M) 9M13 9M12 Δ% Singapore 3,194.7 3,636.6 (
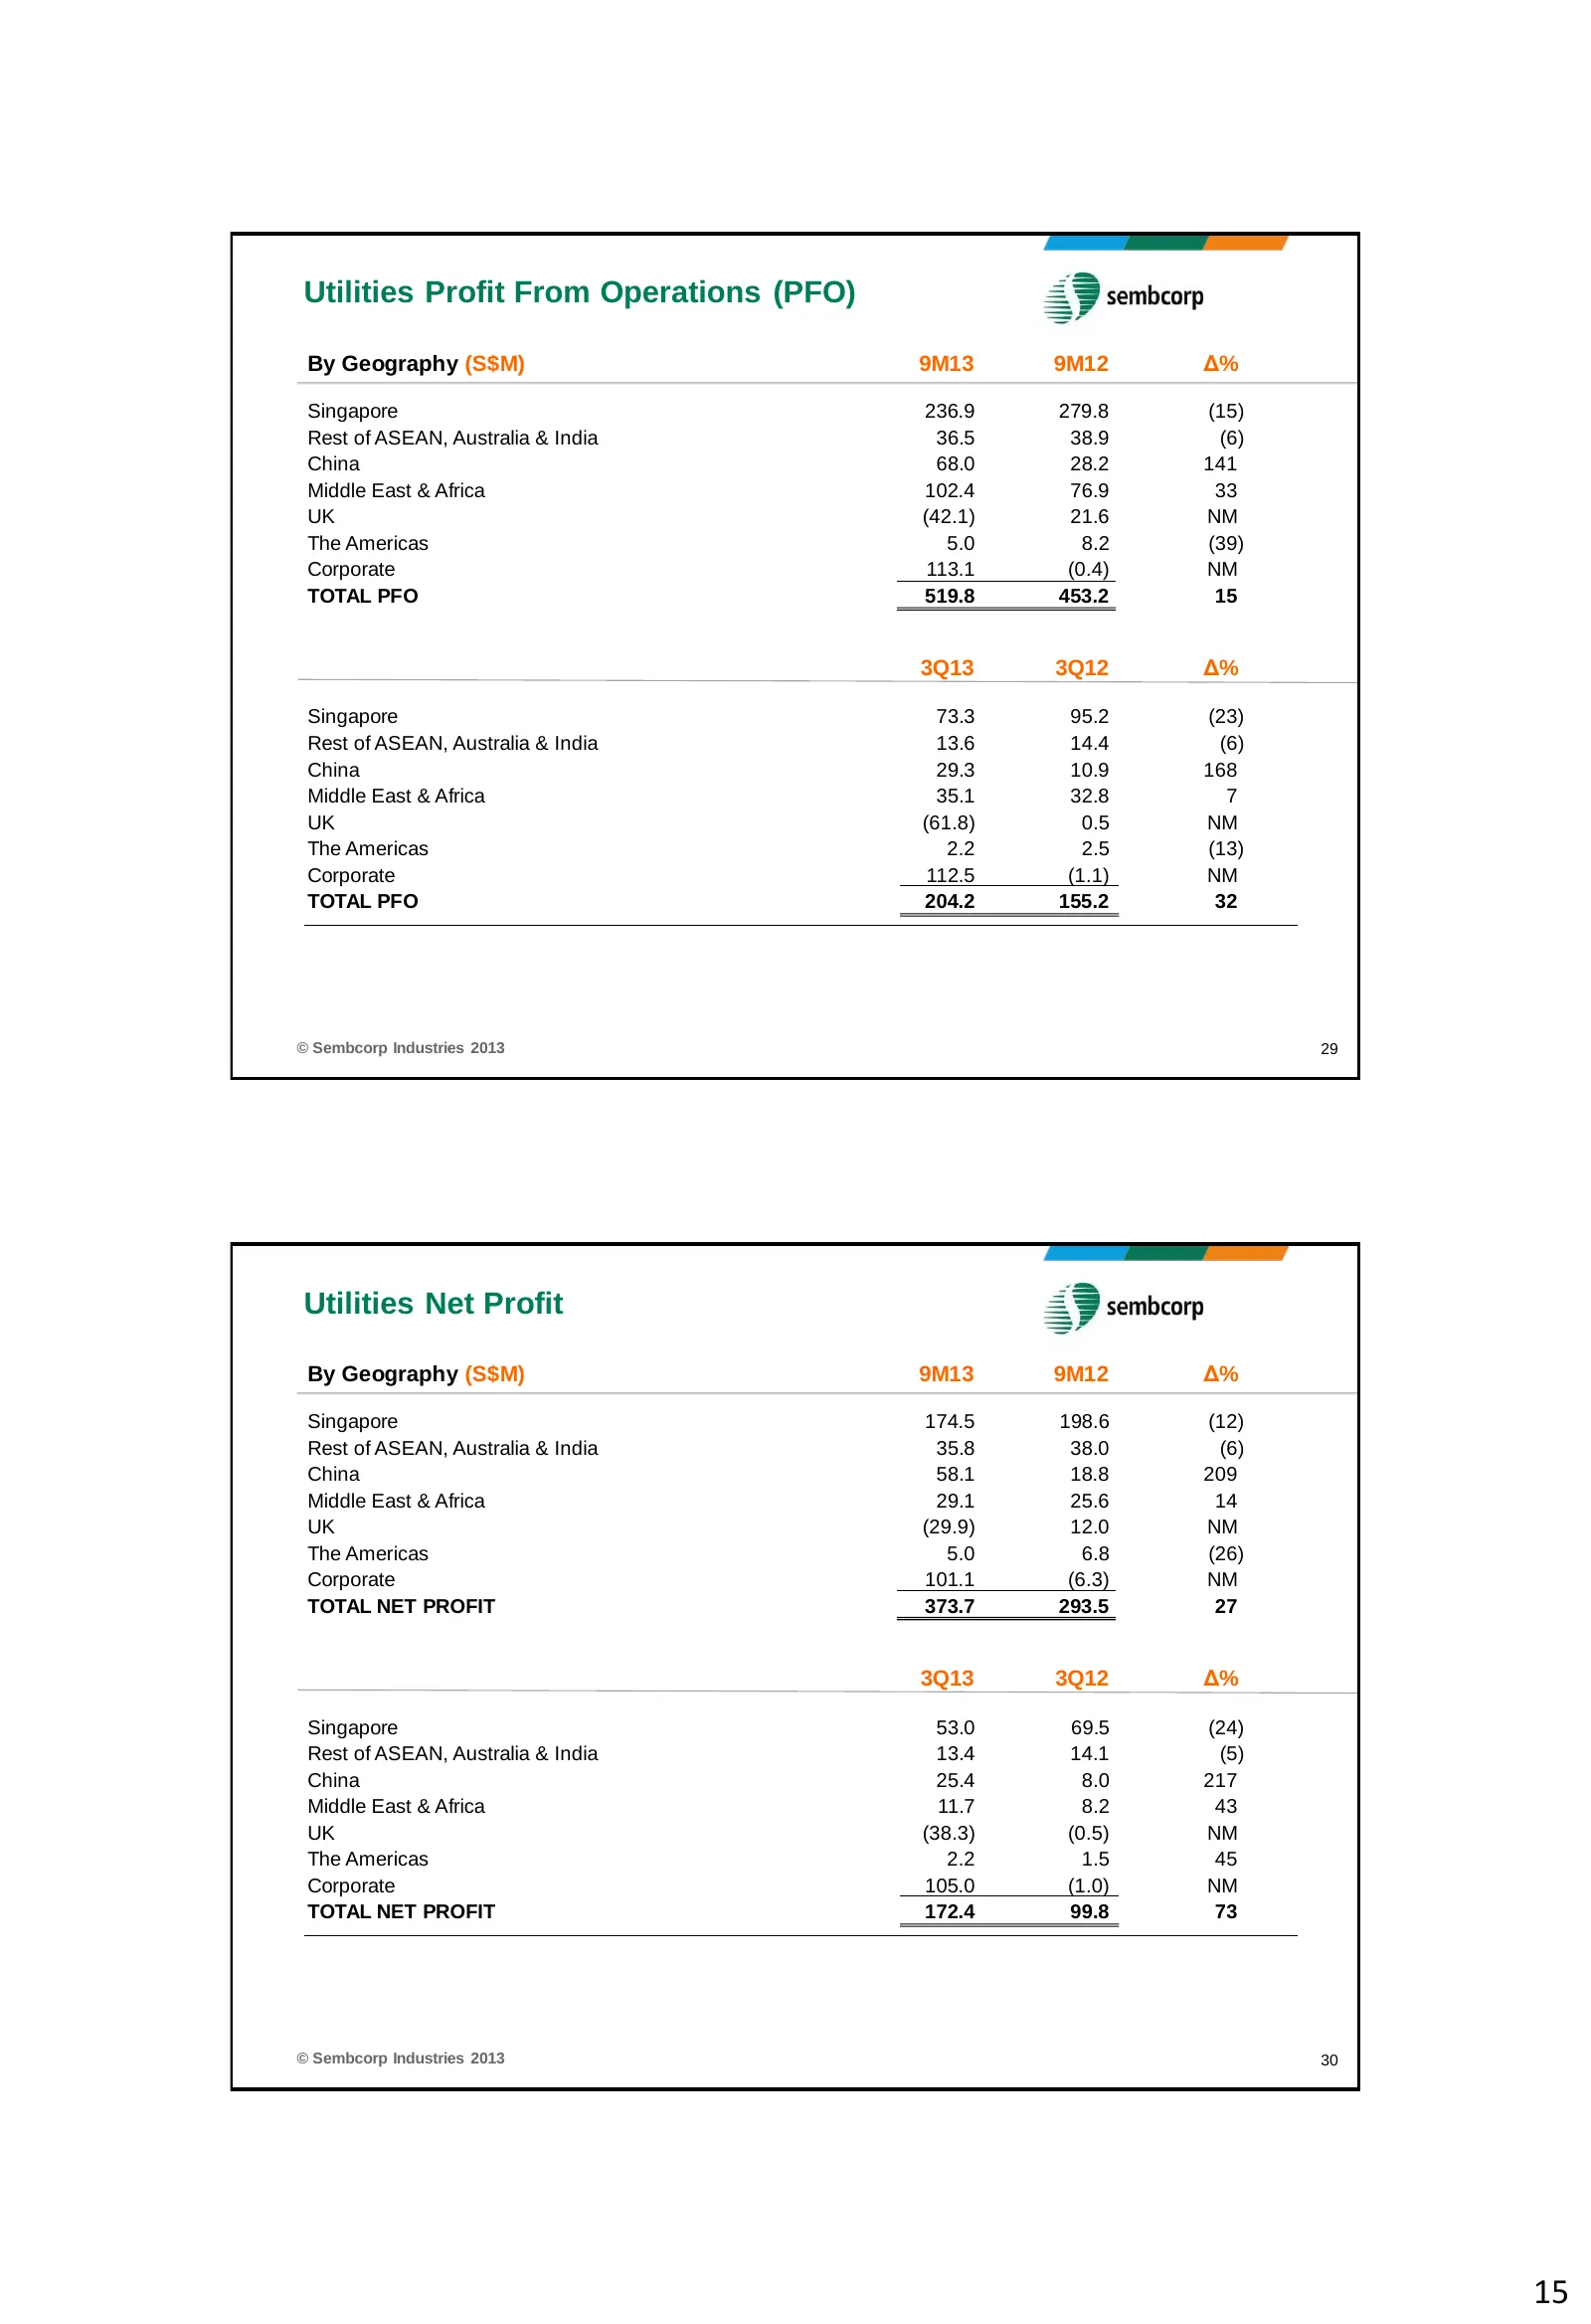
Slide 15: Utilities Profit From Operations; Utilities Net Profit
Utilities Profit From Operations (PFO) By Geography (S$M) 9M13 9M12 Δ% Singapore 236.9 279.8 (15) Rest of ASEAN, Australia & India 36.5 38.9 (6) China 68.0 28.2 141 Middle East & Africa 102.4 76.9 33 UK (42.1) 21.6 NM The Americas 5.0 8.2 (39) Corporate 113.1 (0.4) NM TOTAL PFO 519.8 453.2 15 3Q13 3
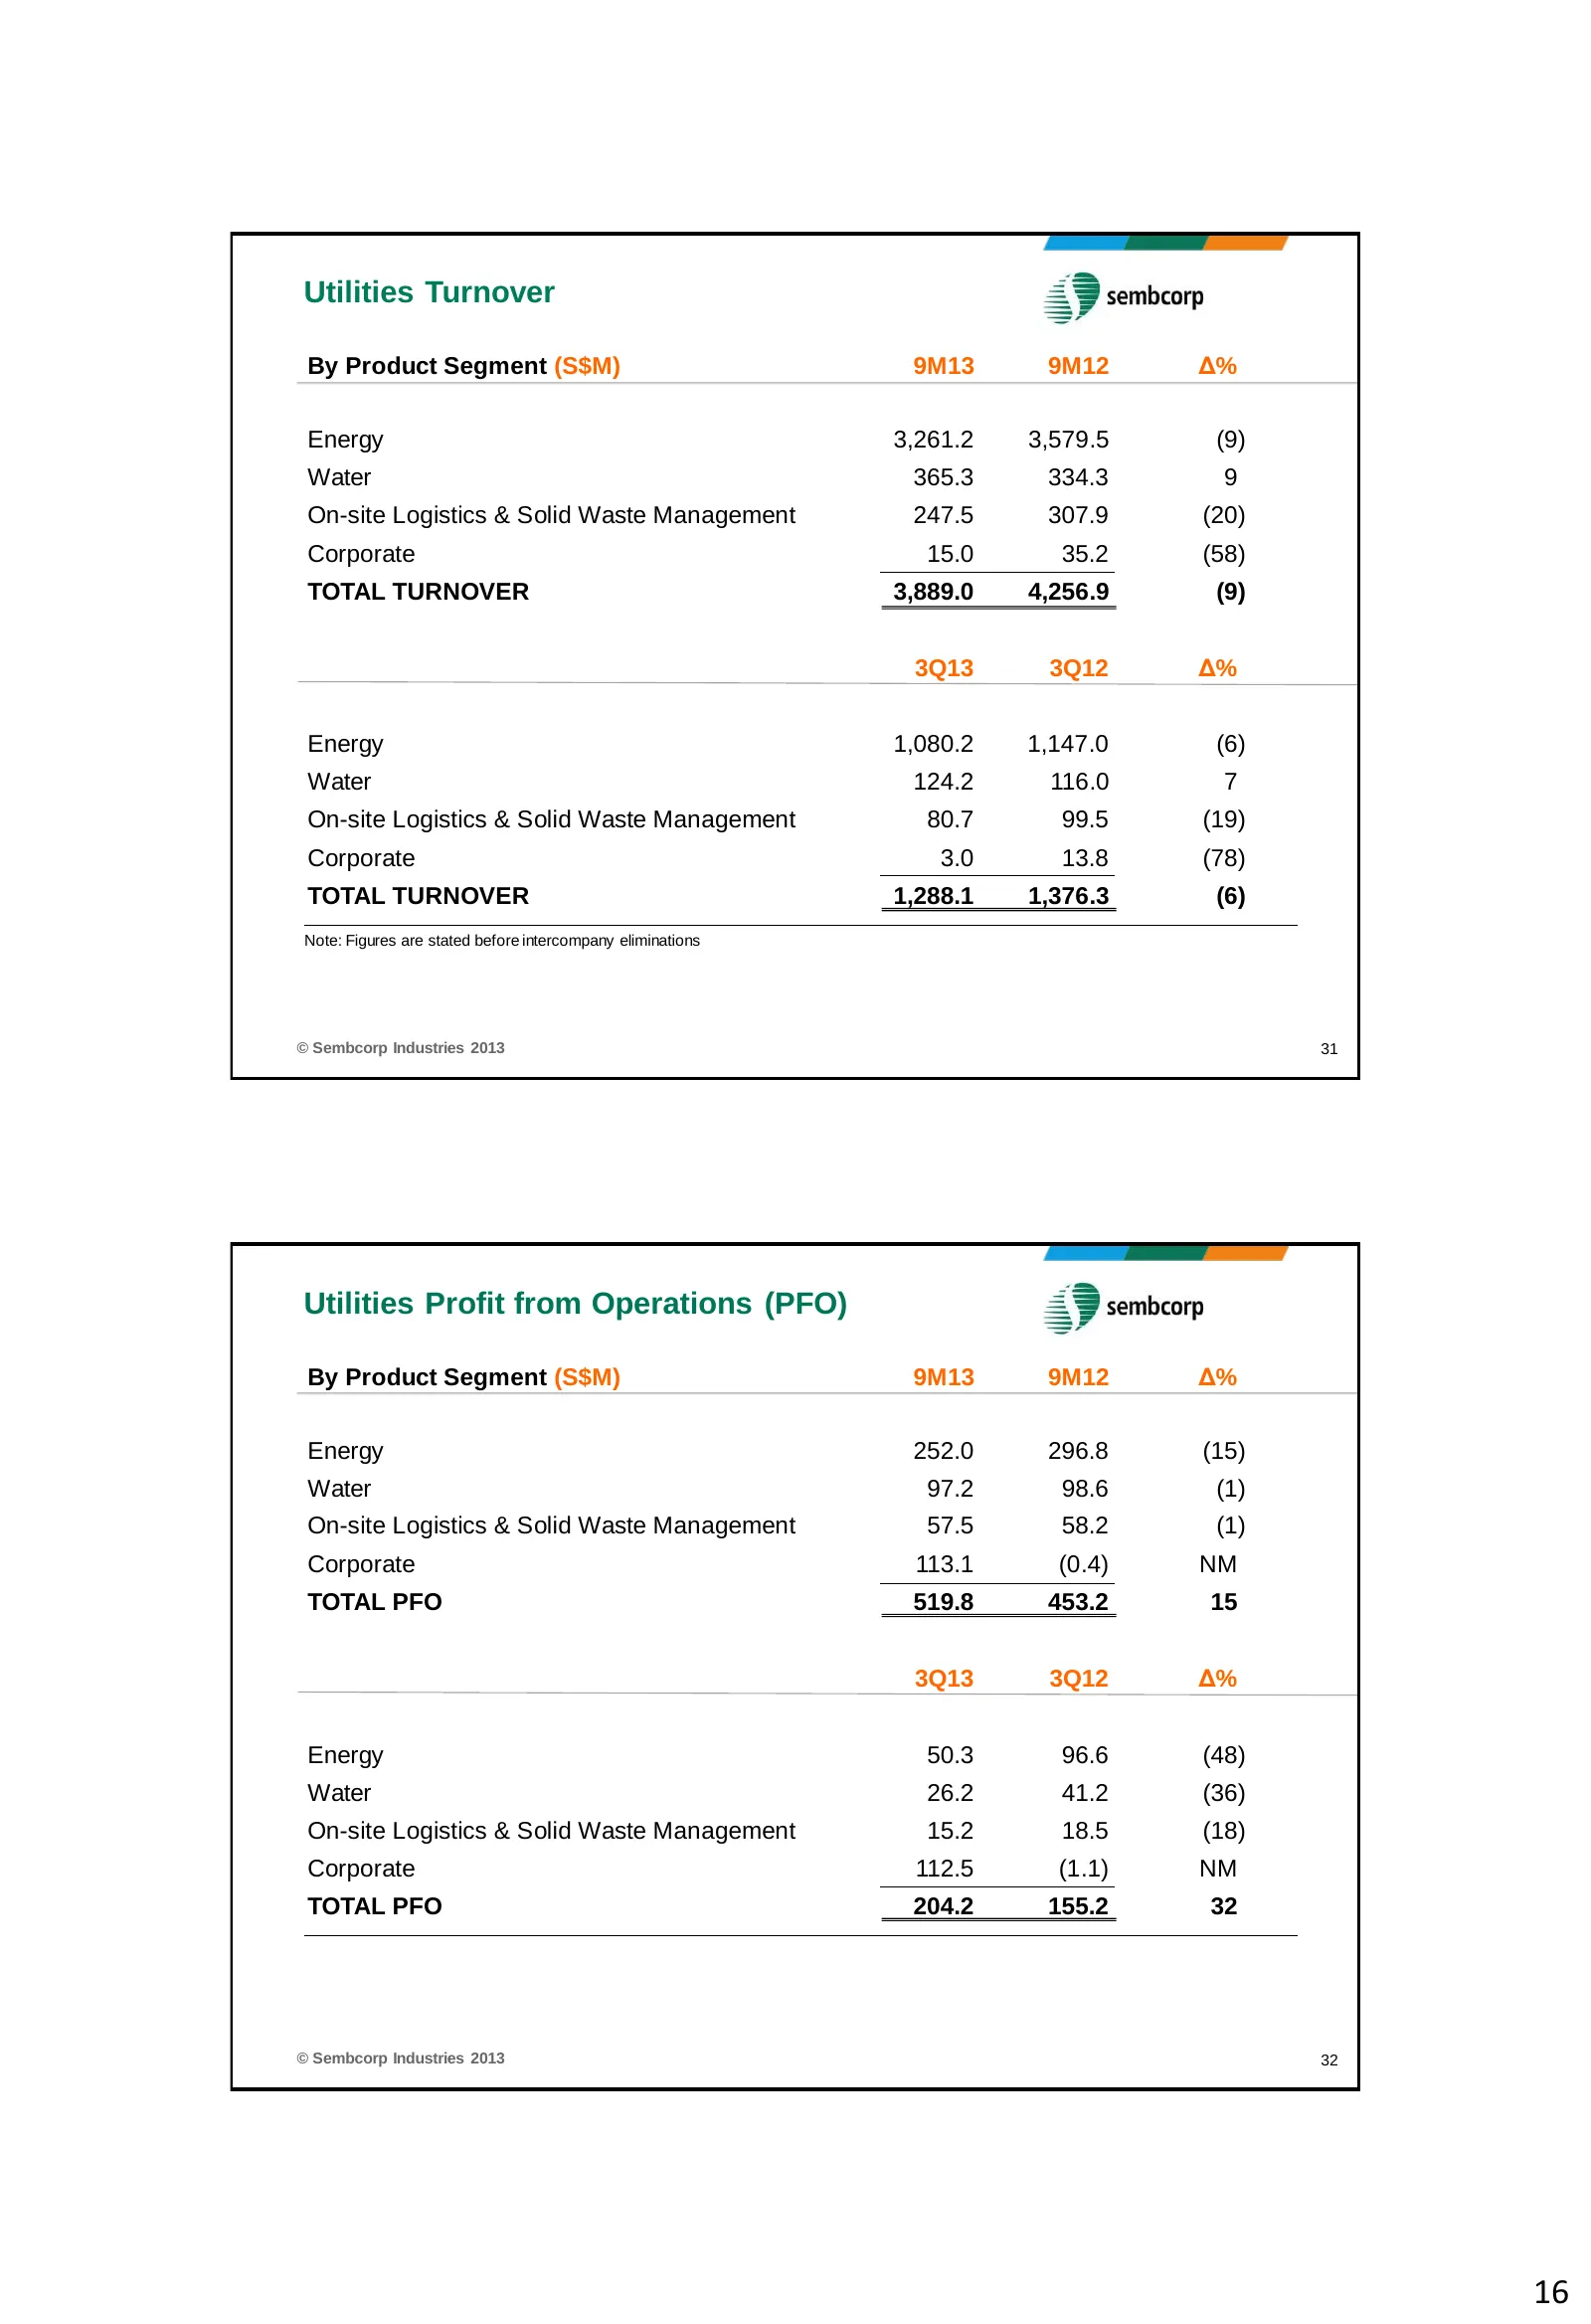
Slide 16: Utilities Turnover; Utilities Profit from Operations
Utilities Turnover By Product Segment (S$M) 9M13 9M12 Δ% Energy 3,261.2 3,579.5 (9) Water 365.3 334.3 9 On-site Logistics & Solid Waste Management 247.5 307.9 (20) Corporate 15.0 35.2 (58) TOTAL TURNOVER 3,889.0 4,256.9 (9) 3Q13 3Q12 Δ% Energy 1,080.2 1,147.0 (6) Water 124.2 116.0 7 On-site Logistic
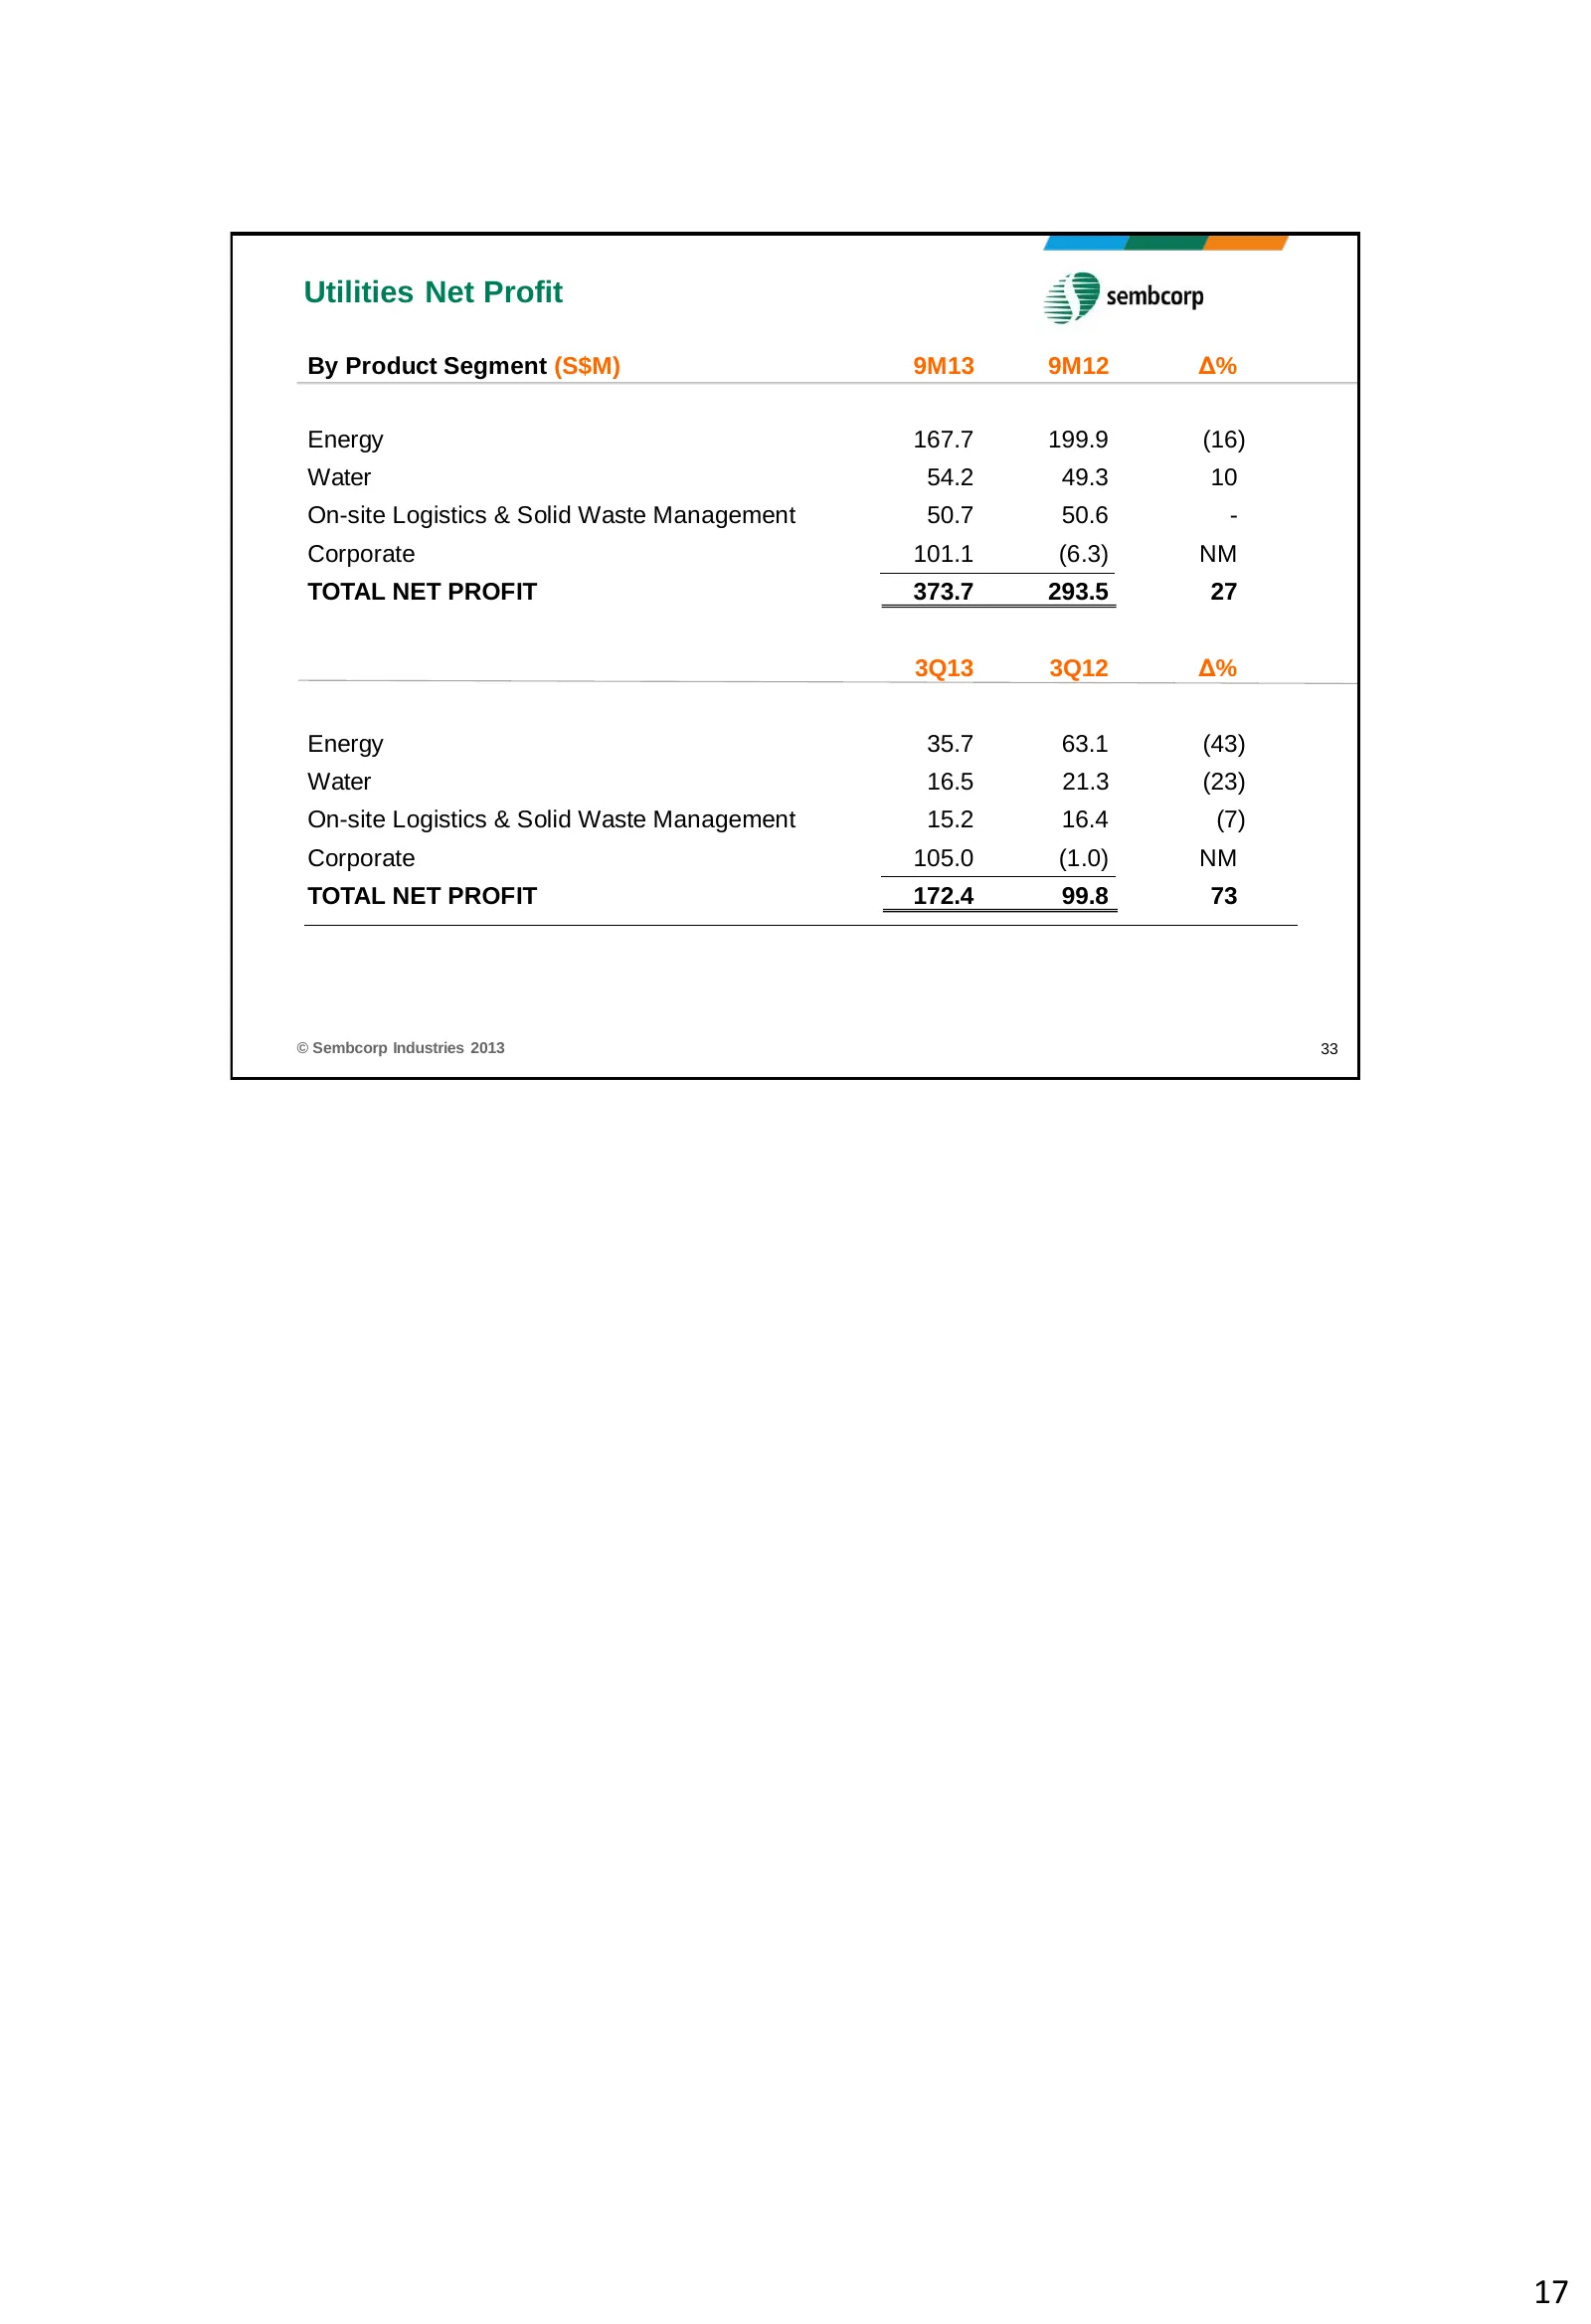
Slide 17: Utilities Net Profit
Utilities Net Profit By Product Segment (S$M) 9M13 9M12 Δ% Energy 167.7 199.9 (16) Water 54.2 49.3 10 On-site Logistics & Solid Waste Management 50.7 50.6 - Corporate 101.1 (6.3) NM TOTAL NET PROFIT 373.7 293.5 27 3Q13 3Q12 Δ% Energy 35.7 63.1 (43) Water 16.5 21.3 (23) On-site Logistics & Solid Wast
Source: Internet Archive copy of sembcorp.com
More decks from Sembcorp Industries Ltd.
 H1 2026 Earnings Presentation26 slides · Aug 13, 2026
 Investor Presentation (June 2026)52 slides · June 2026
 Shareholder Meeting (April 2026)11 slides · Apr 29, 2026
 FY2025 Earnings Presentation35 slides · Feb 25, 2026
 Merger or Acquisition (January 2026)13 slides · Jan 30, 2026
 Merger or Acquisition (December 2025)24 slides · Dec 11, 2025