Pepco — Non-Deal Roadshow (June 2010)
32 slides from Pepco's roadshow presentation, Jun 22, 2010
Slide 1: June 2010 Investor Meetings
/_ Pepco Holdings Inc June 2010 Investor Meetings
Slide 2: Safe Harbor Statement
Safe Harbor Statement Some of the statements contained in today’s presentations are forward-looking statements within the meaning of Section 21E of the Securities Exchange Act of 1934 and are subject to the safe harbor created by the Private Securities Litigation Reform Act of 1995. These statements
Slide 3: PHI’s Strategic Repositioning
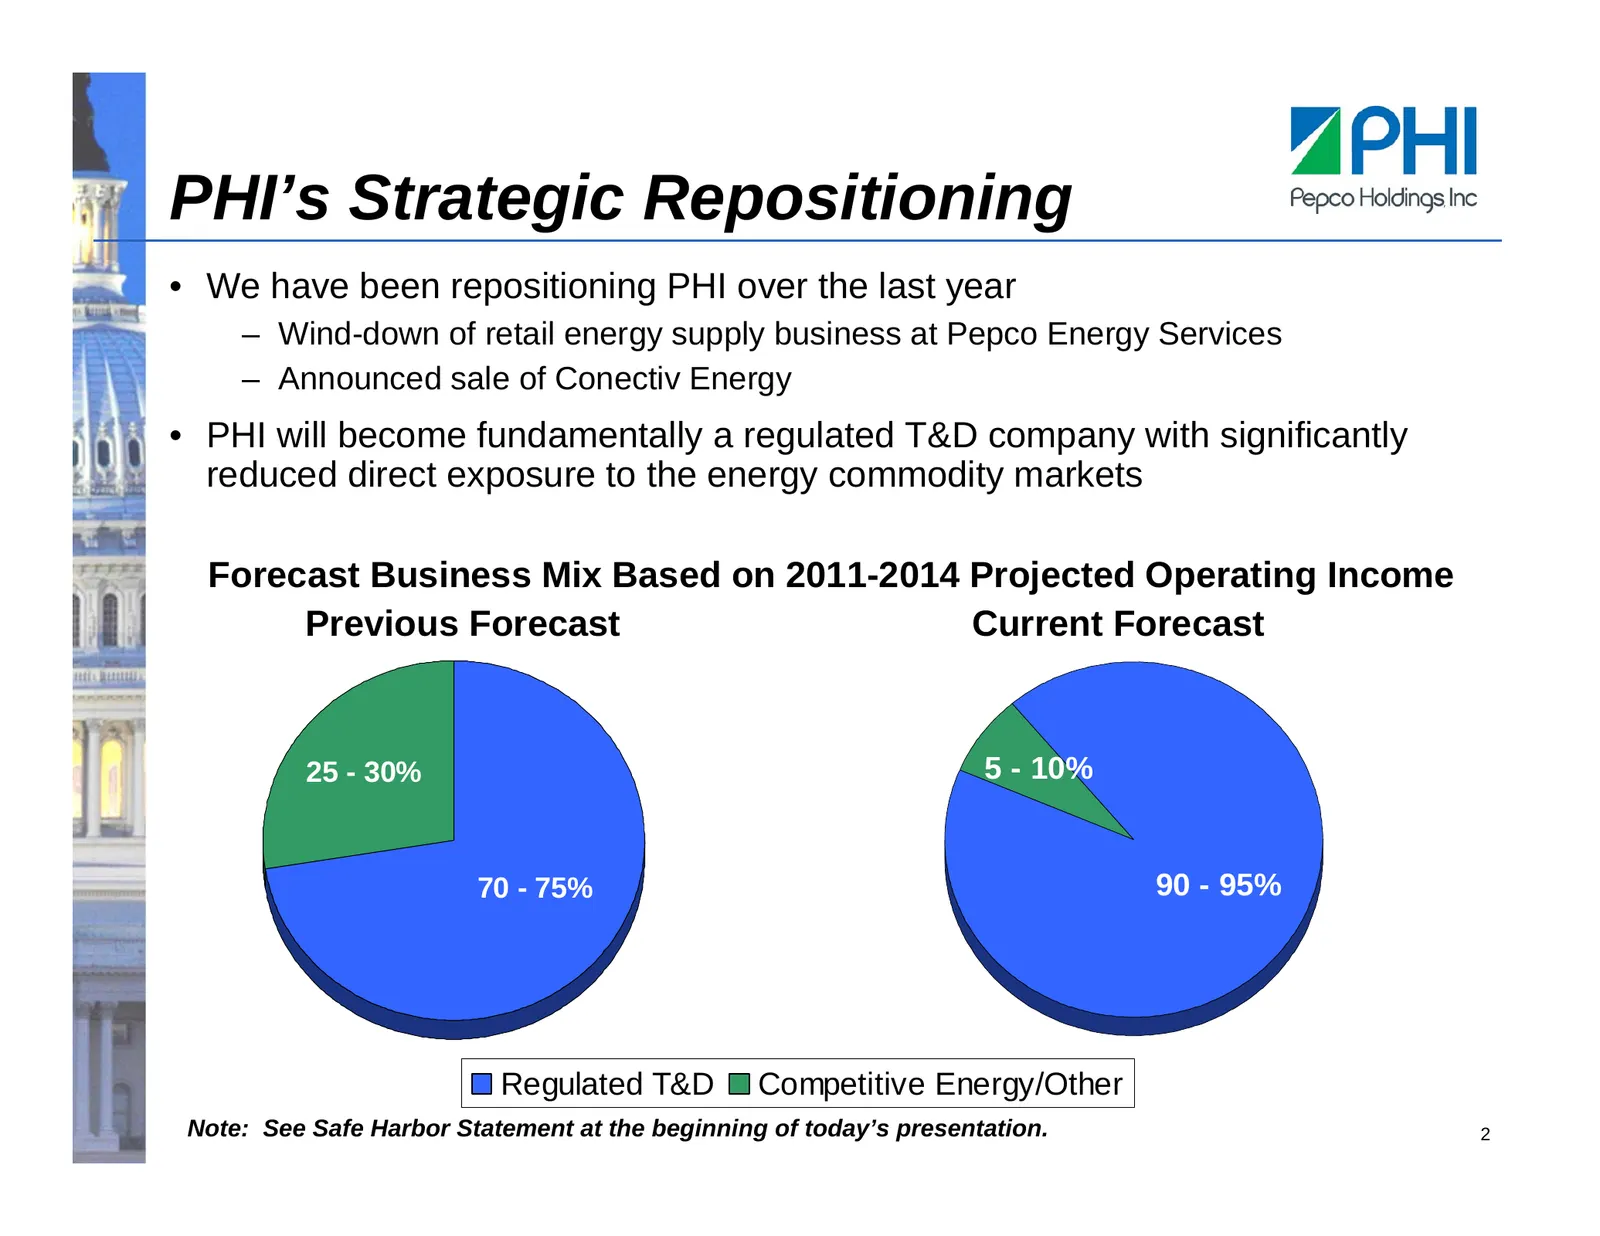
PHI’s Strategic Repositioning • We have been repositioning PHI over the last year – Wind-down of retail energy supply business at Pepco Energy Services – Announced sale of Conectiv Energy • PHI will become fundamentally a regulated T&D company with significantly reduced direct exposure to the energy
Slide 4: PHI’s Strategic Focus
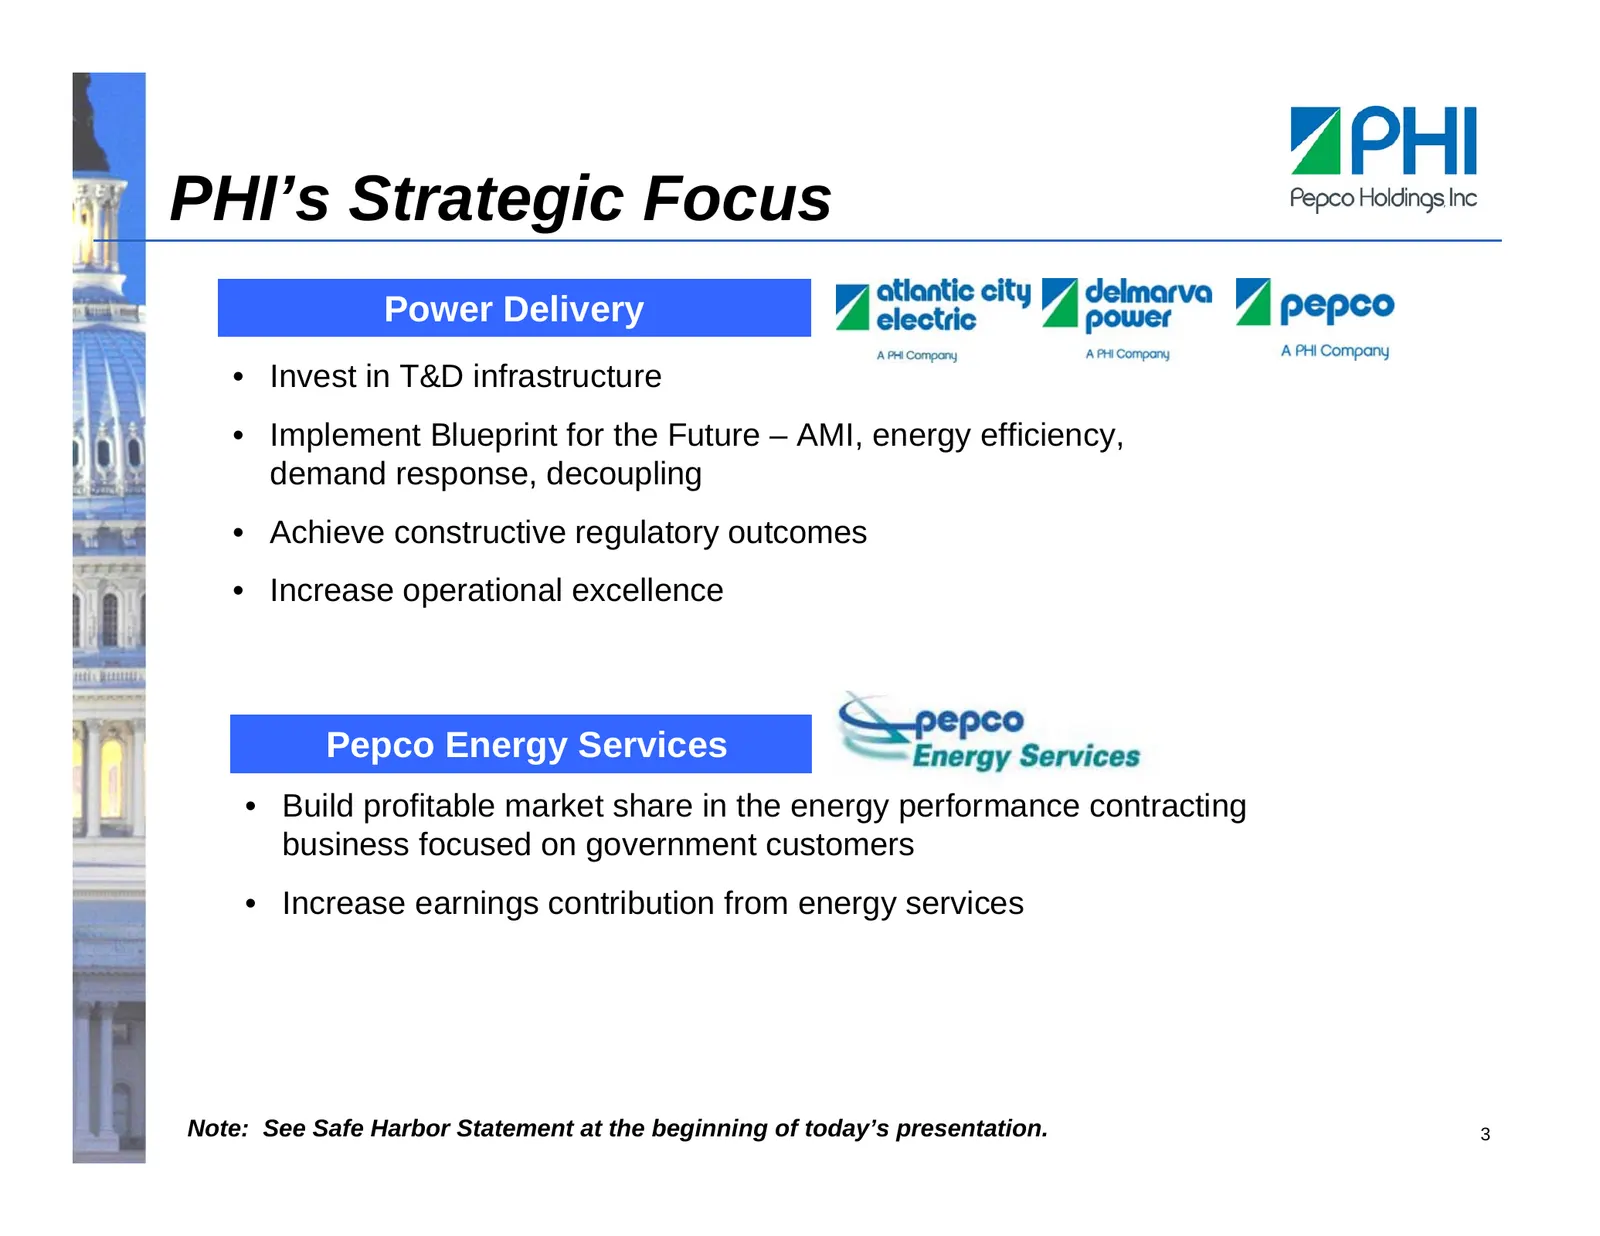
PHI’s Strategic Focus Power Delivery • Invest in T&D infrastructure • Implement Blueprint for the Future – AMI, energy efficiency, demand response, decoupling • Achieve constructive regulatory outcomes • Increase operational excellence Pepco Energy Services • Build profitable market share in the ene
Slide 5: Power Delivery Business Outlook
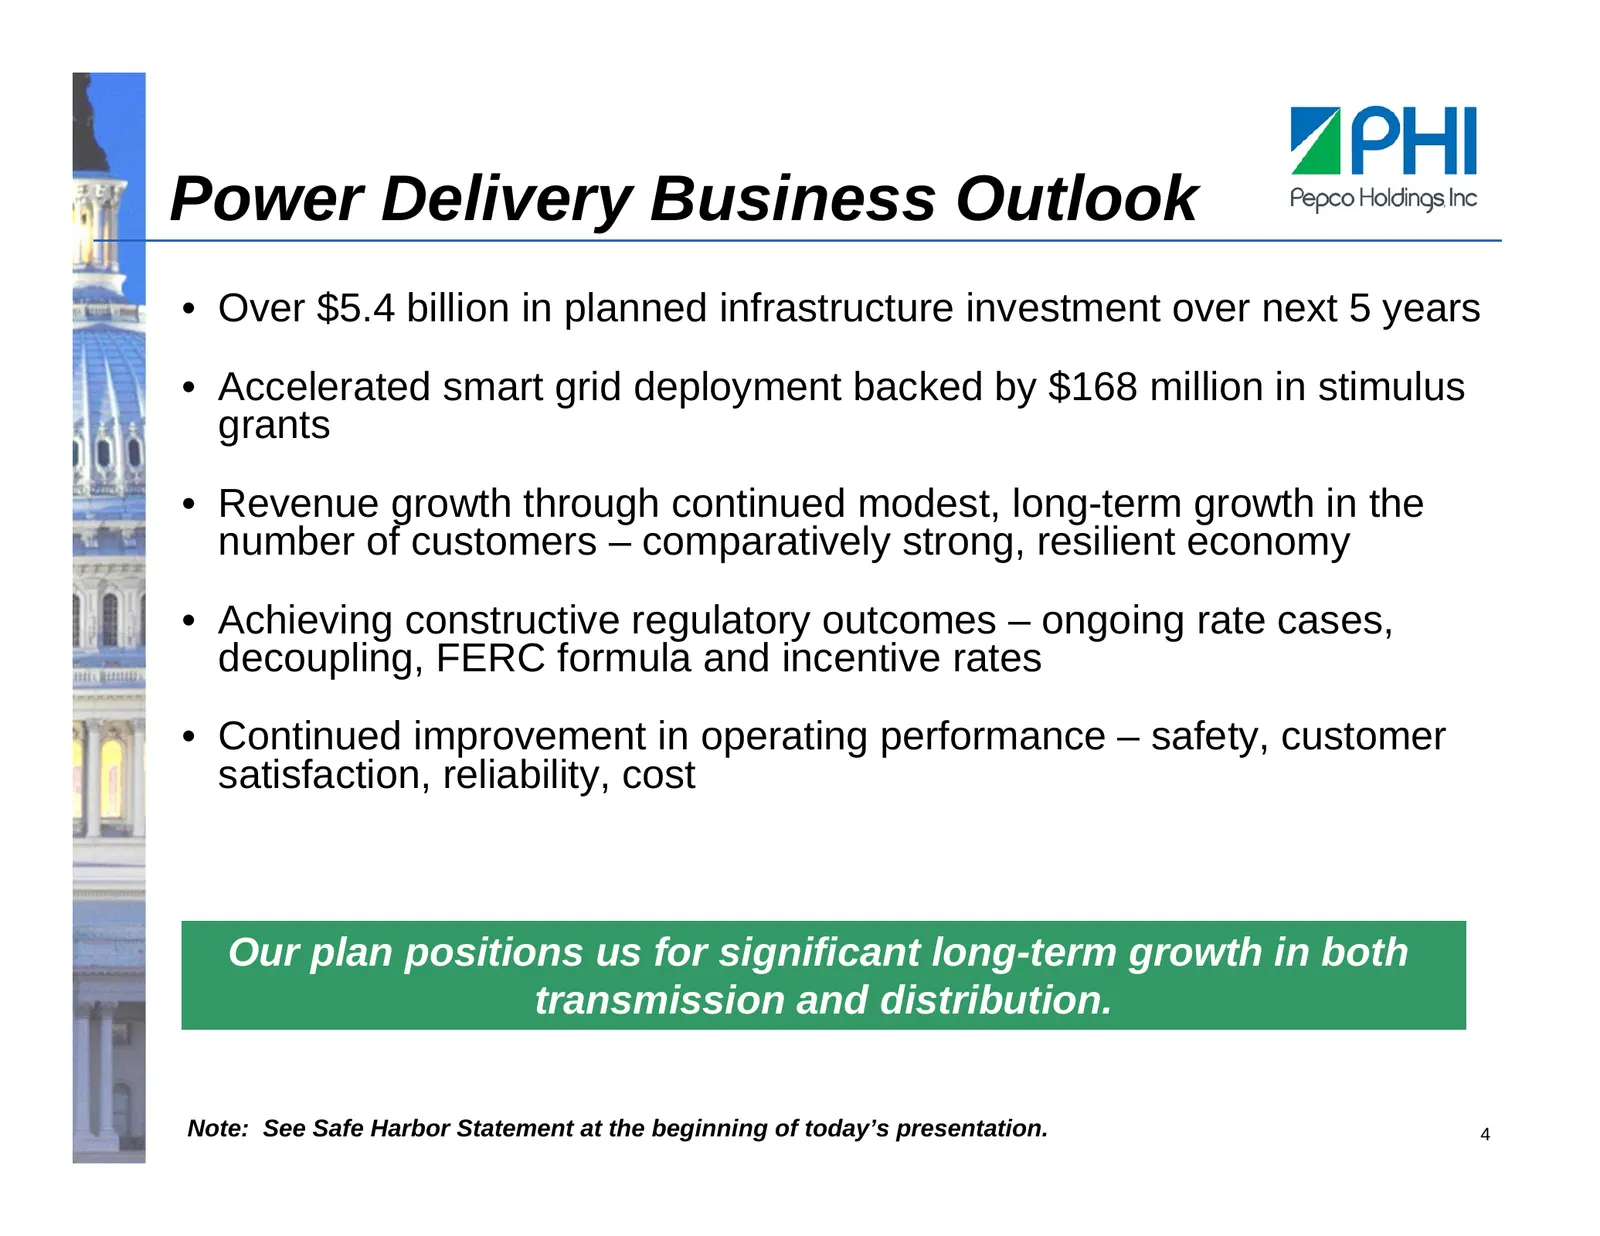
Power Delivery Business Outlook • Over $5.4 billion in planned infrastructure investment over next 5 years • Accelerated smart grid deployment backed by $168 million in stimulus grants • Revenue growth through continued modest, long-term growth in the number of customers – comparatively strong, resi
Slide 6: Power Delivery – The Driver of Growth
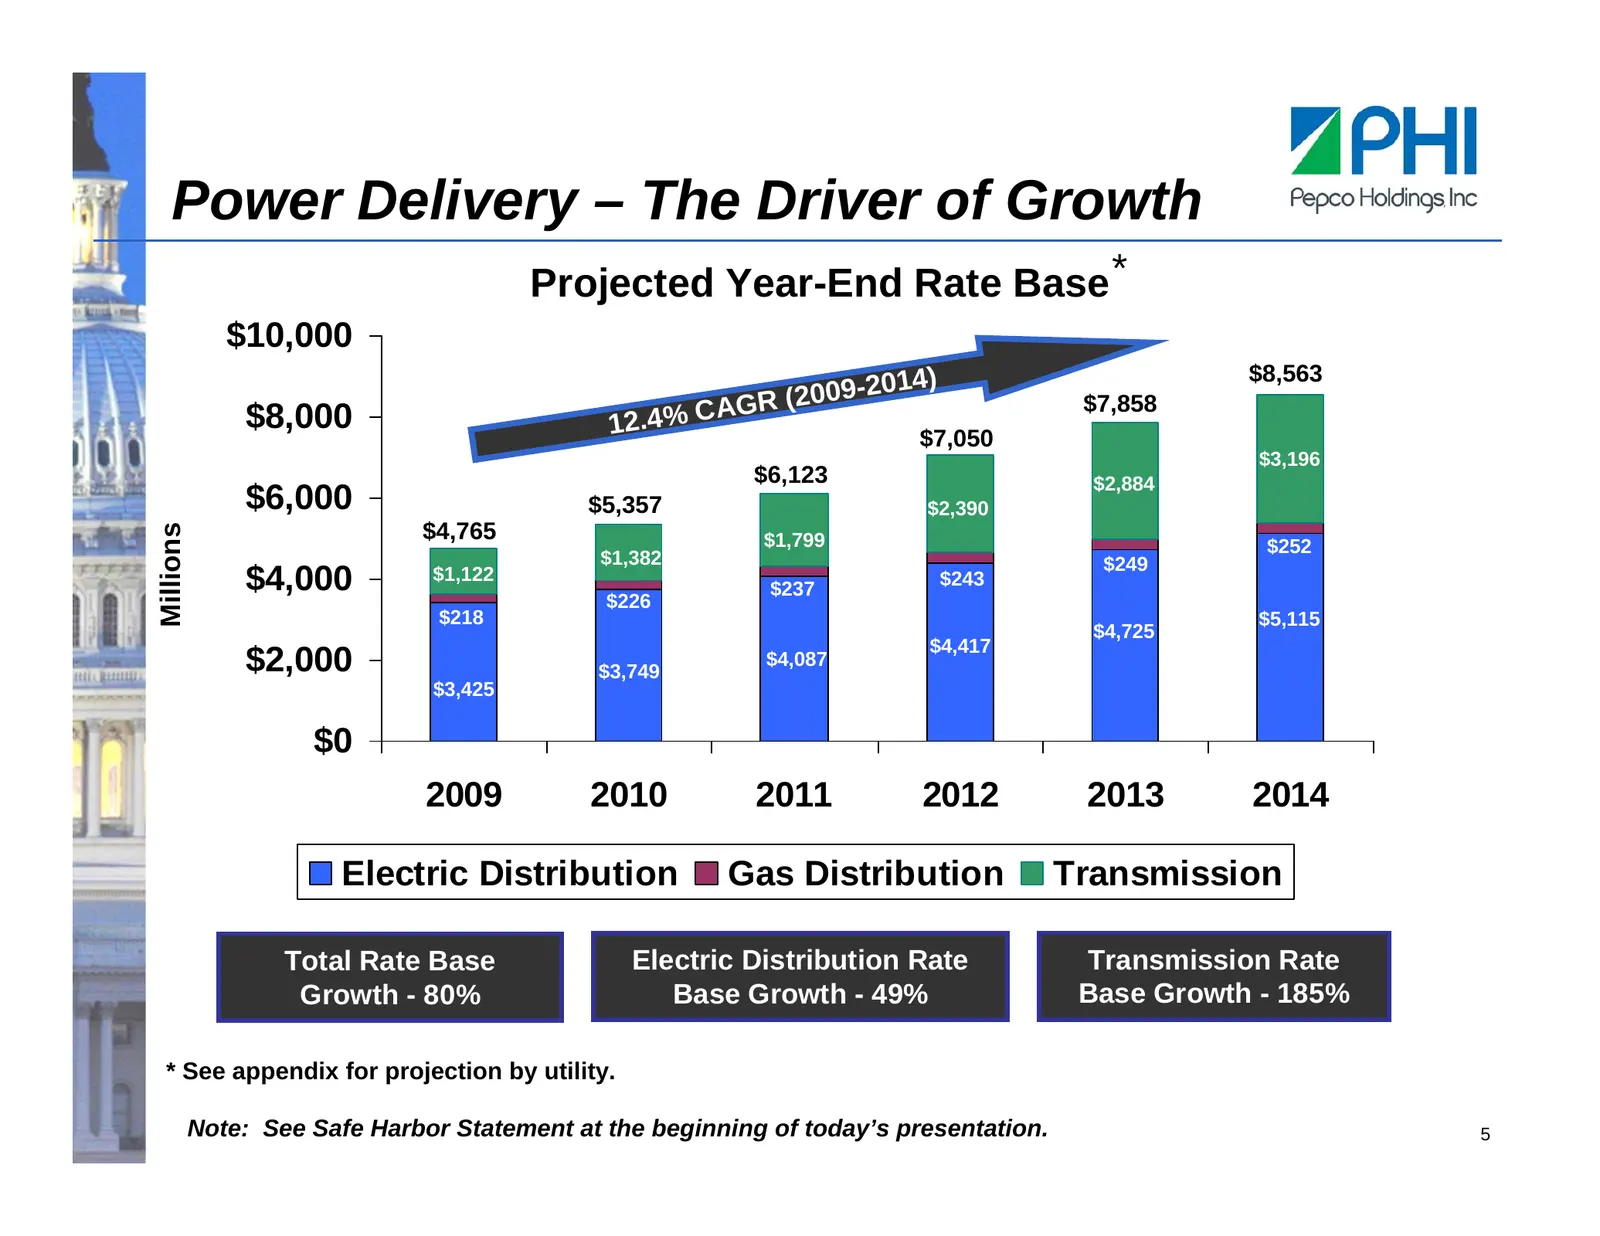
Power Delivery – The Driver of Growth Projected Year-End Rate Base * $10,000 $8,563 ( 2009-2014) AGR $7,858 $8,000 12.4% C $7,050 $3,196 $6,123 $2,884 $6,000 $5,357 $2,390 $4,765 Millions $1,799 $252 $1,382 $249 $4,000 $1,122 $237 $243 $226 $218 $5,115 $4,725 $4,417 $2,000 $3,749 $4,087 $3,425 $0 20
Slide 7: MAPP – Project Update
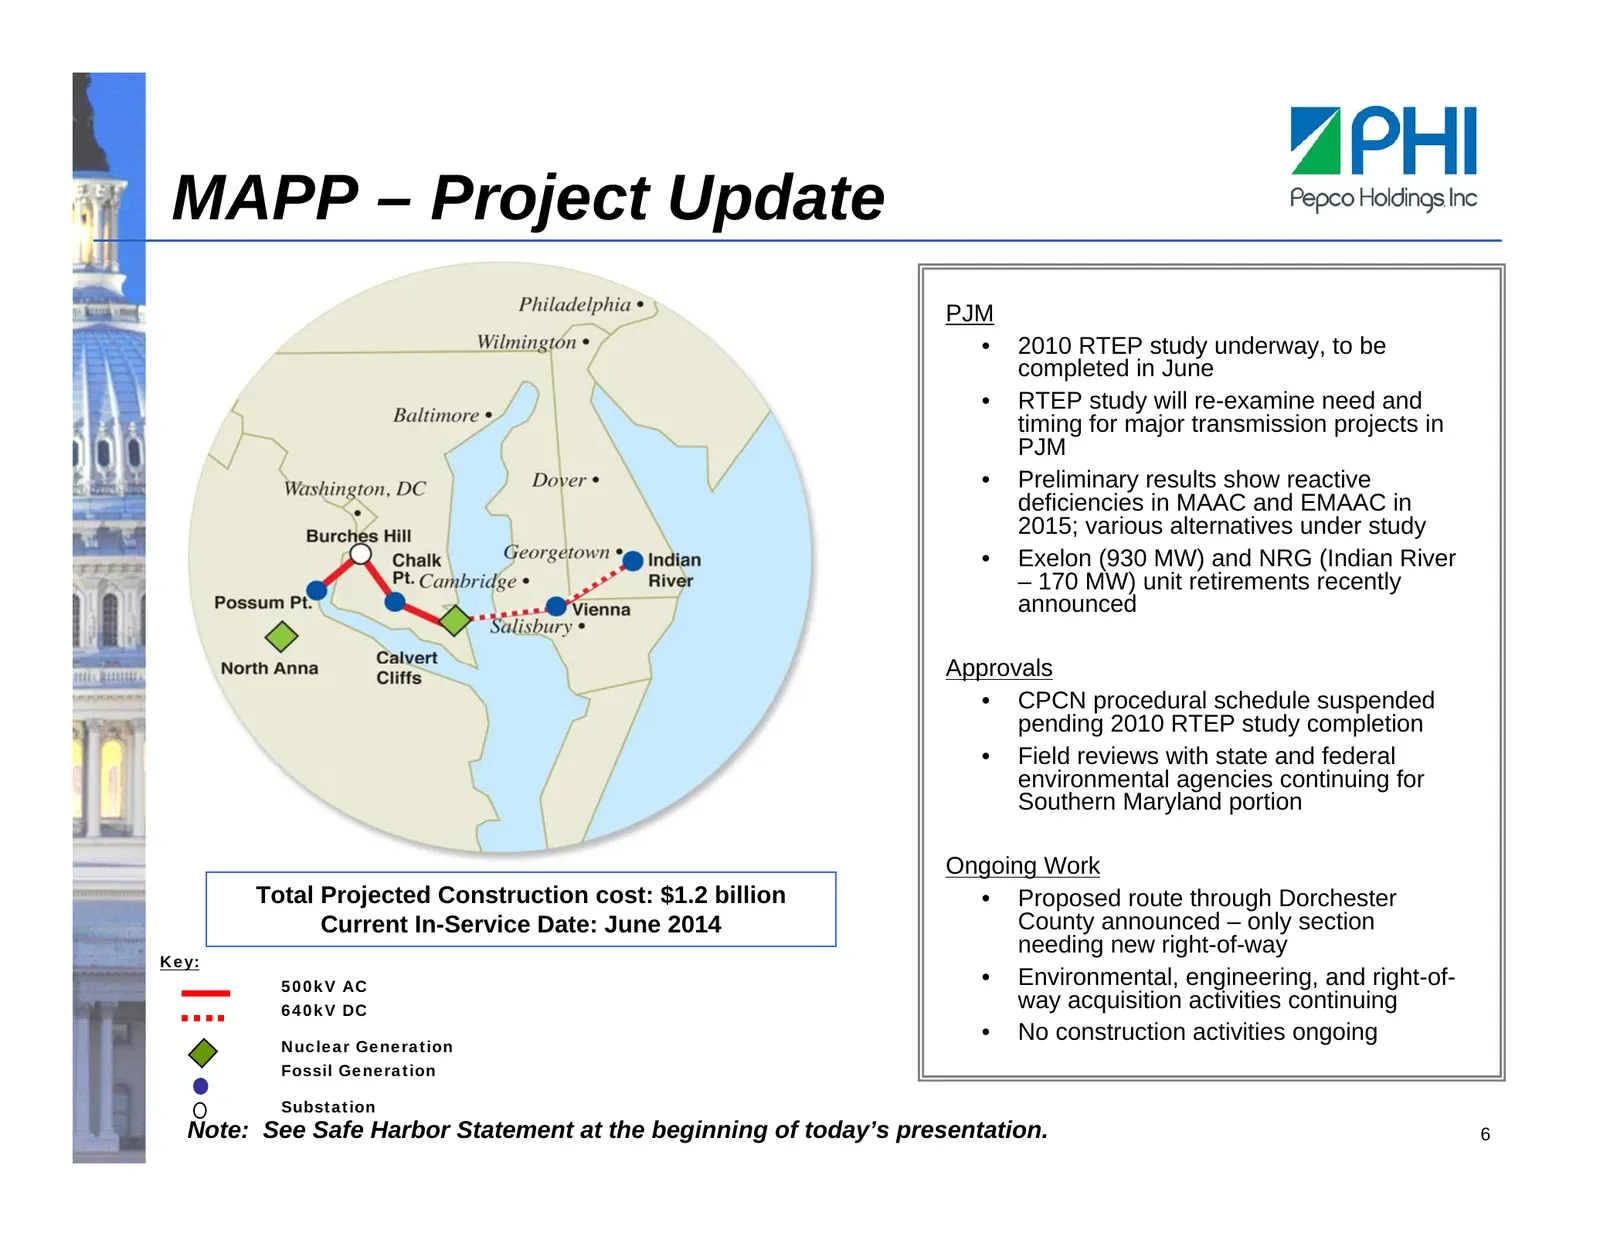
MAPP – Project Update PJM • 2010 RTEP study underway, to be completed in June • RTEP study will re-examine need and timing for major transmission projects in PJM • Preliminary results show reactive deficiencies in MAAC and EMAAC in 2015; various alternatives under study • Exelon (930 MW) and NRG (In
Slide 8: Blueprint for the Future
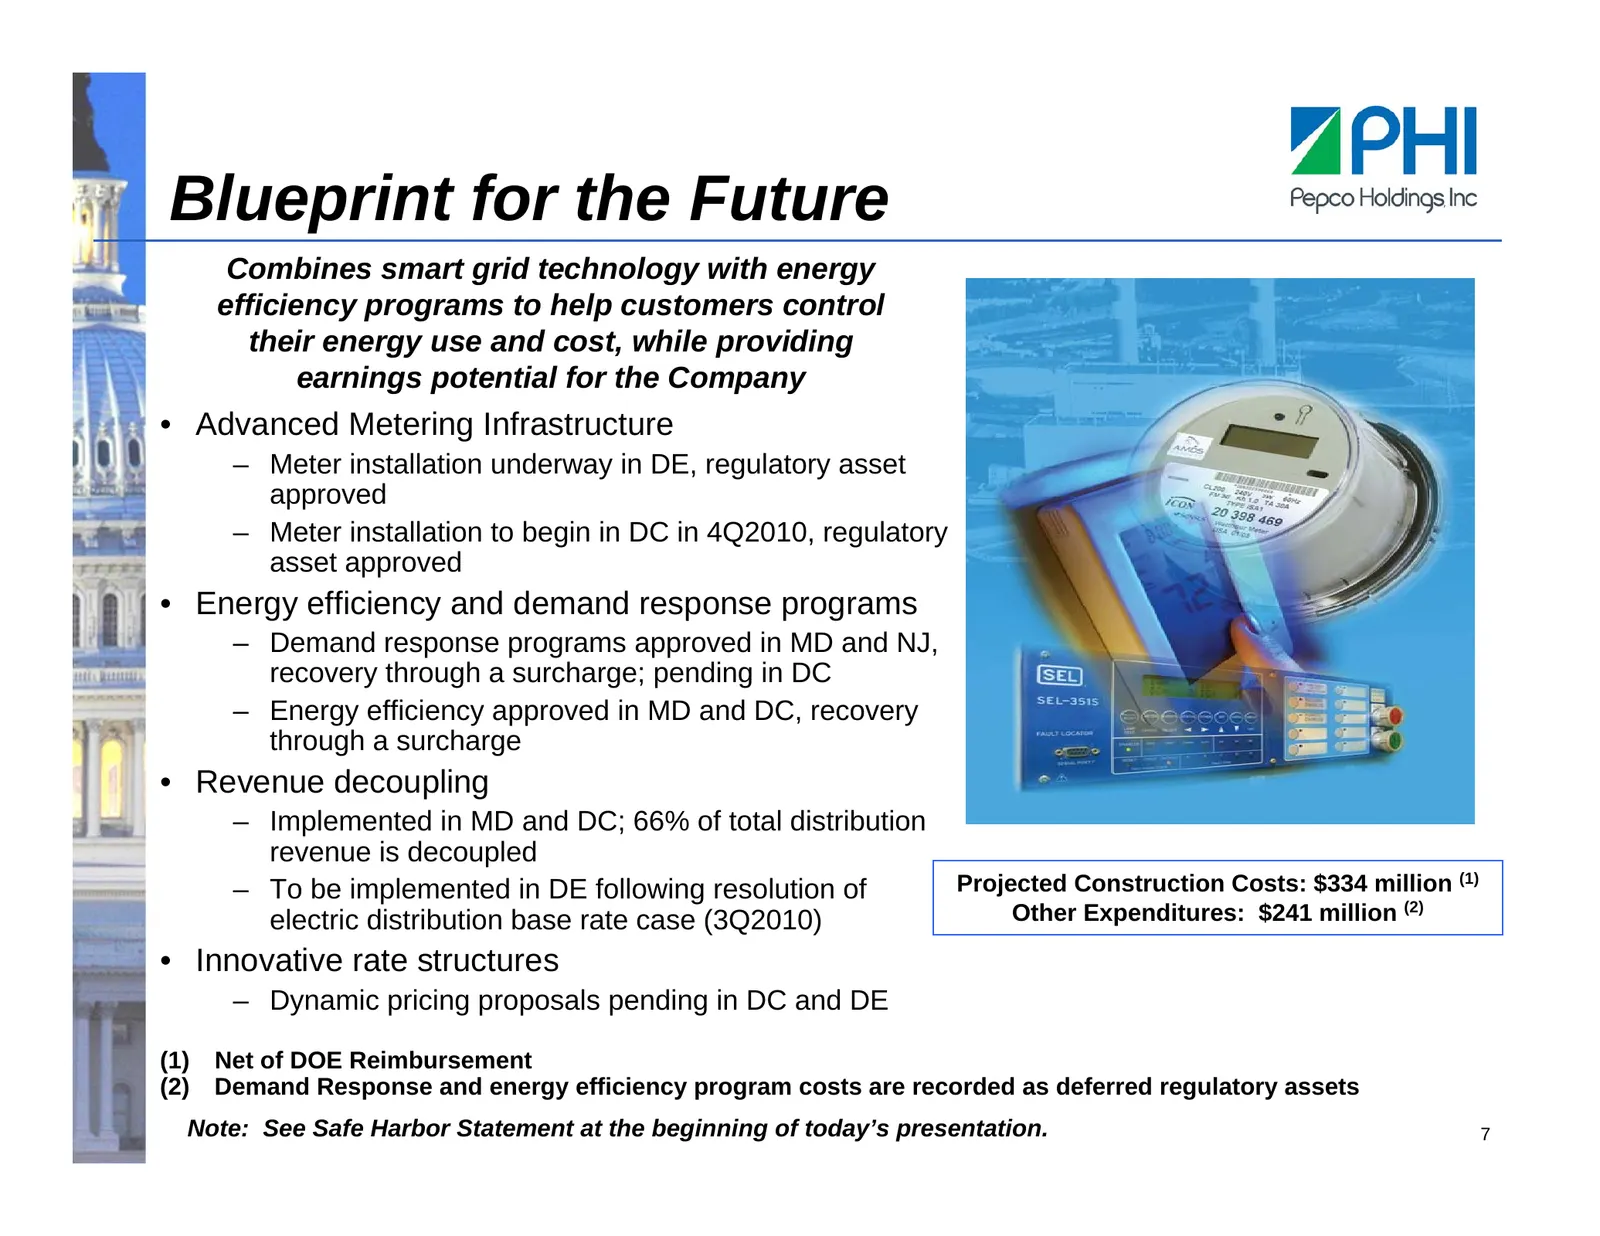
Blueprint for the Future Combines smart grid technology with energy efficiency programs to help customers control their energy use and cost, while providing earnings potential for the Company • Advanced Metering Infrastructure – Meter installation underway in DE, regulatory asset approved – Meter in
Slide 9: Regulatory Environment
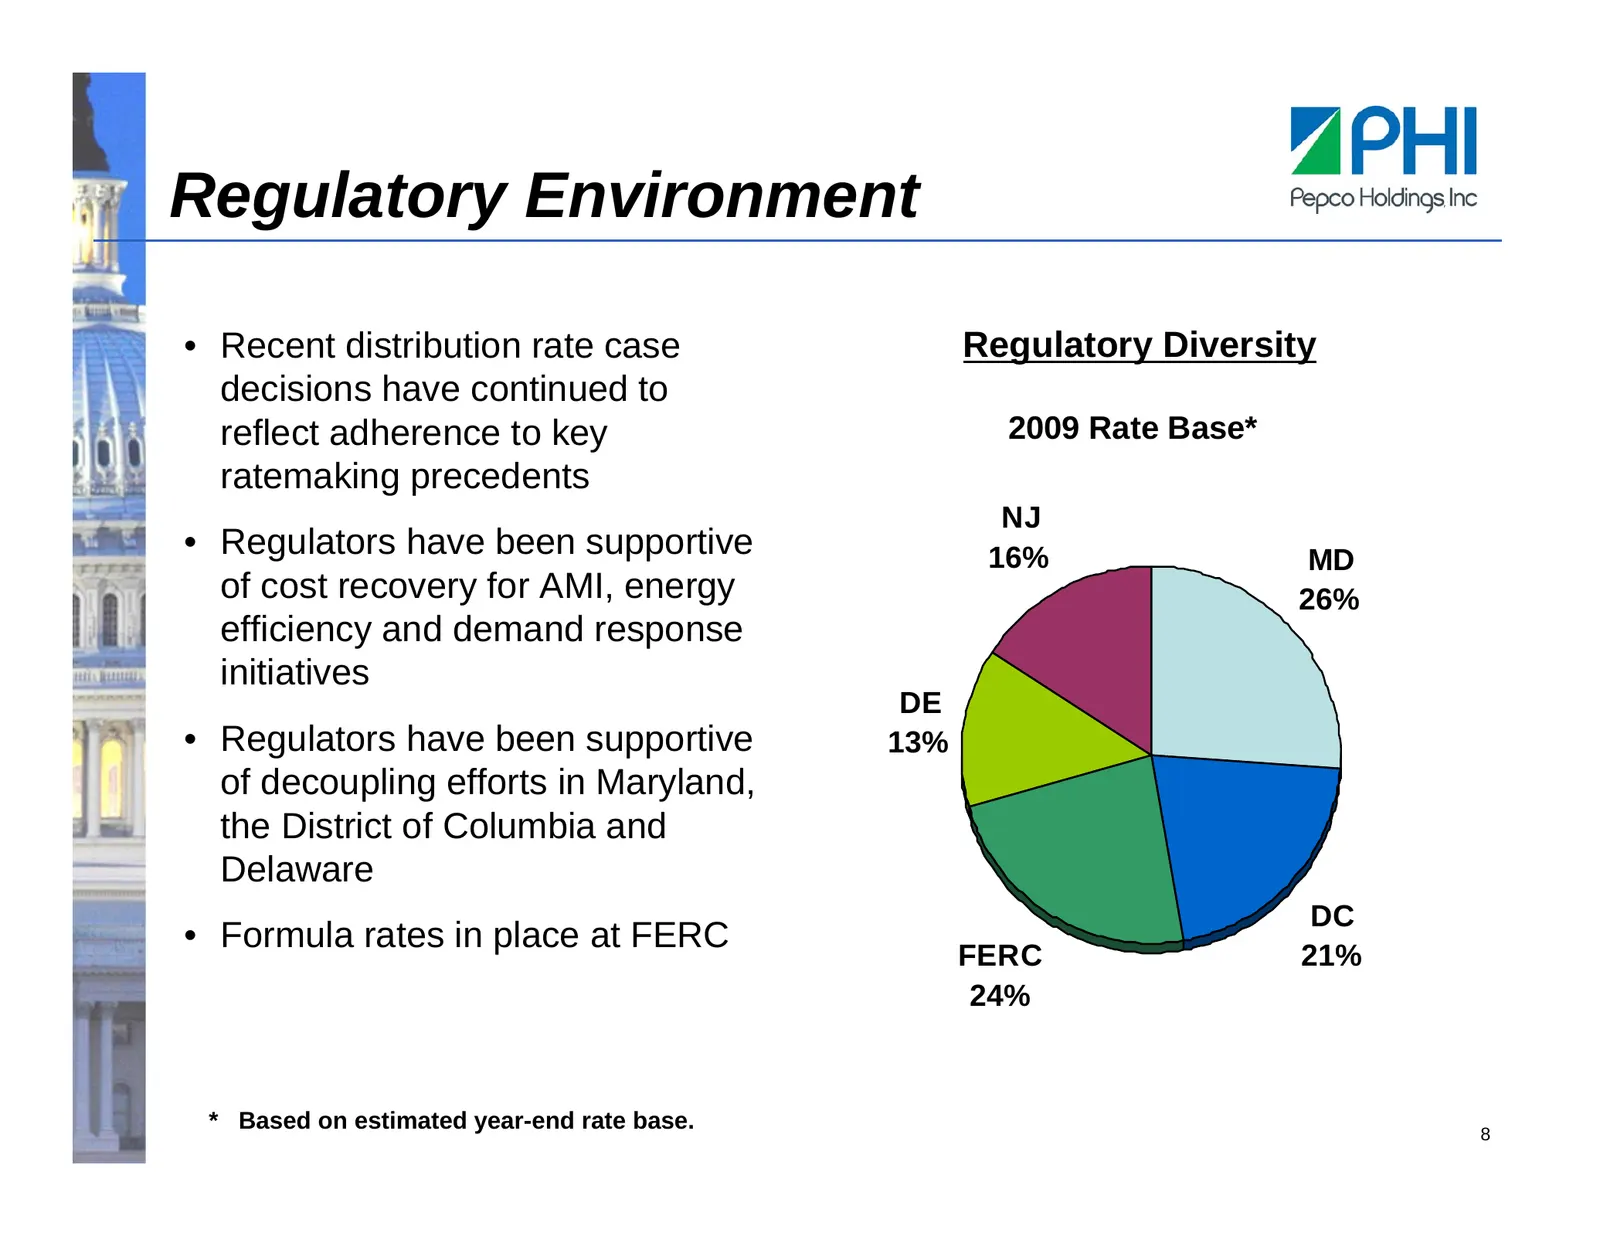
Regulatory Environment • Recent distribution rate case Regulatory Diversity decisions have continued to reflect adherence to key 2009 Rate Base* ratemaking precedents NJ • Regulators have been supportive 16% MD of cost recovery for AMI, energy 26% efficiency and demand response initiatives DE • Regu
Slide 10: Distribution Rate Cases – Most Recent Decisions
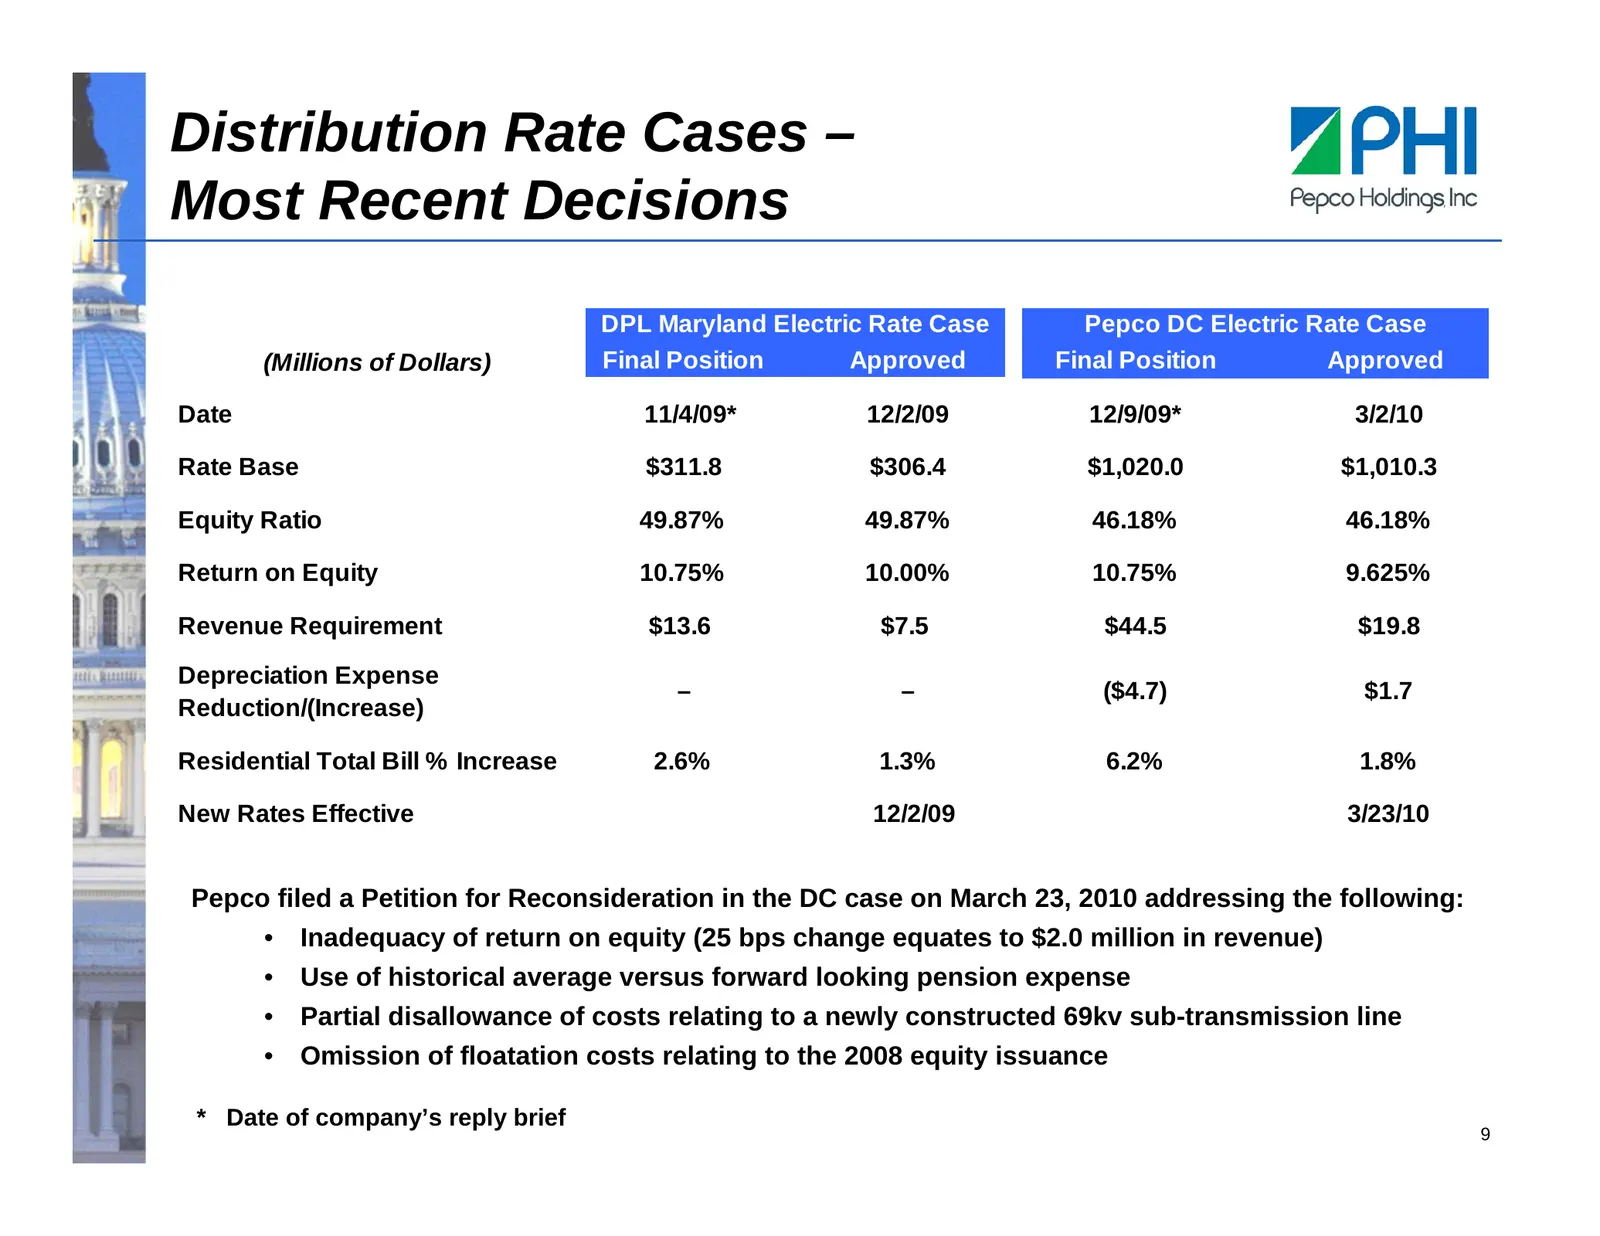
Distribution Rate Cases – Most Recent Decisions DPL Maryland Electric Rate Case Pepco DC Electric Rate Case (Millions of Dollars) Final Position Approved Final Position Approved Date 11/4/09* 12/2/09 12/9/09* 3/2/10 Rate Base $311.8 $306.4 $1,020.0 $1,010.3 Equity Ratio 49.87% 49.87% 46.18% 46.18% R
Slide 11: Distribution Rate Cases – Most Recent Decisions (continued)
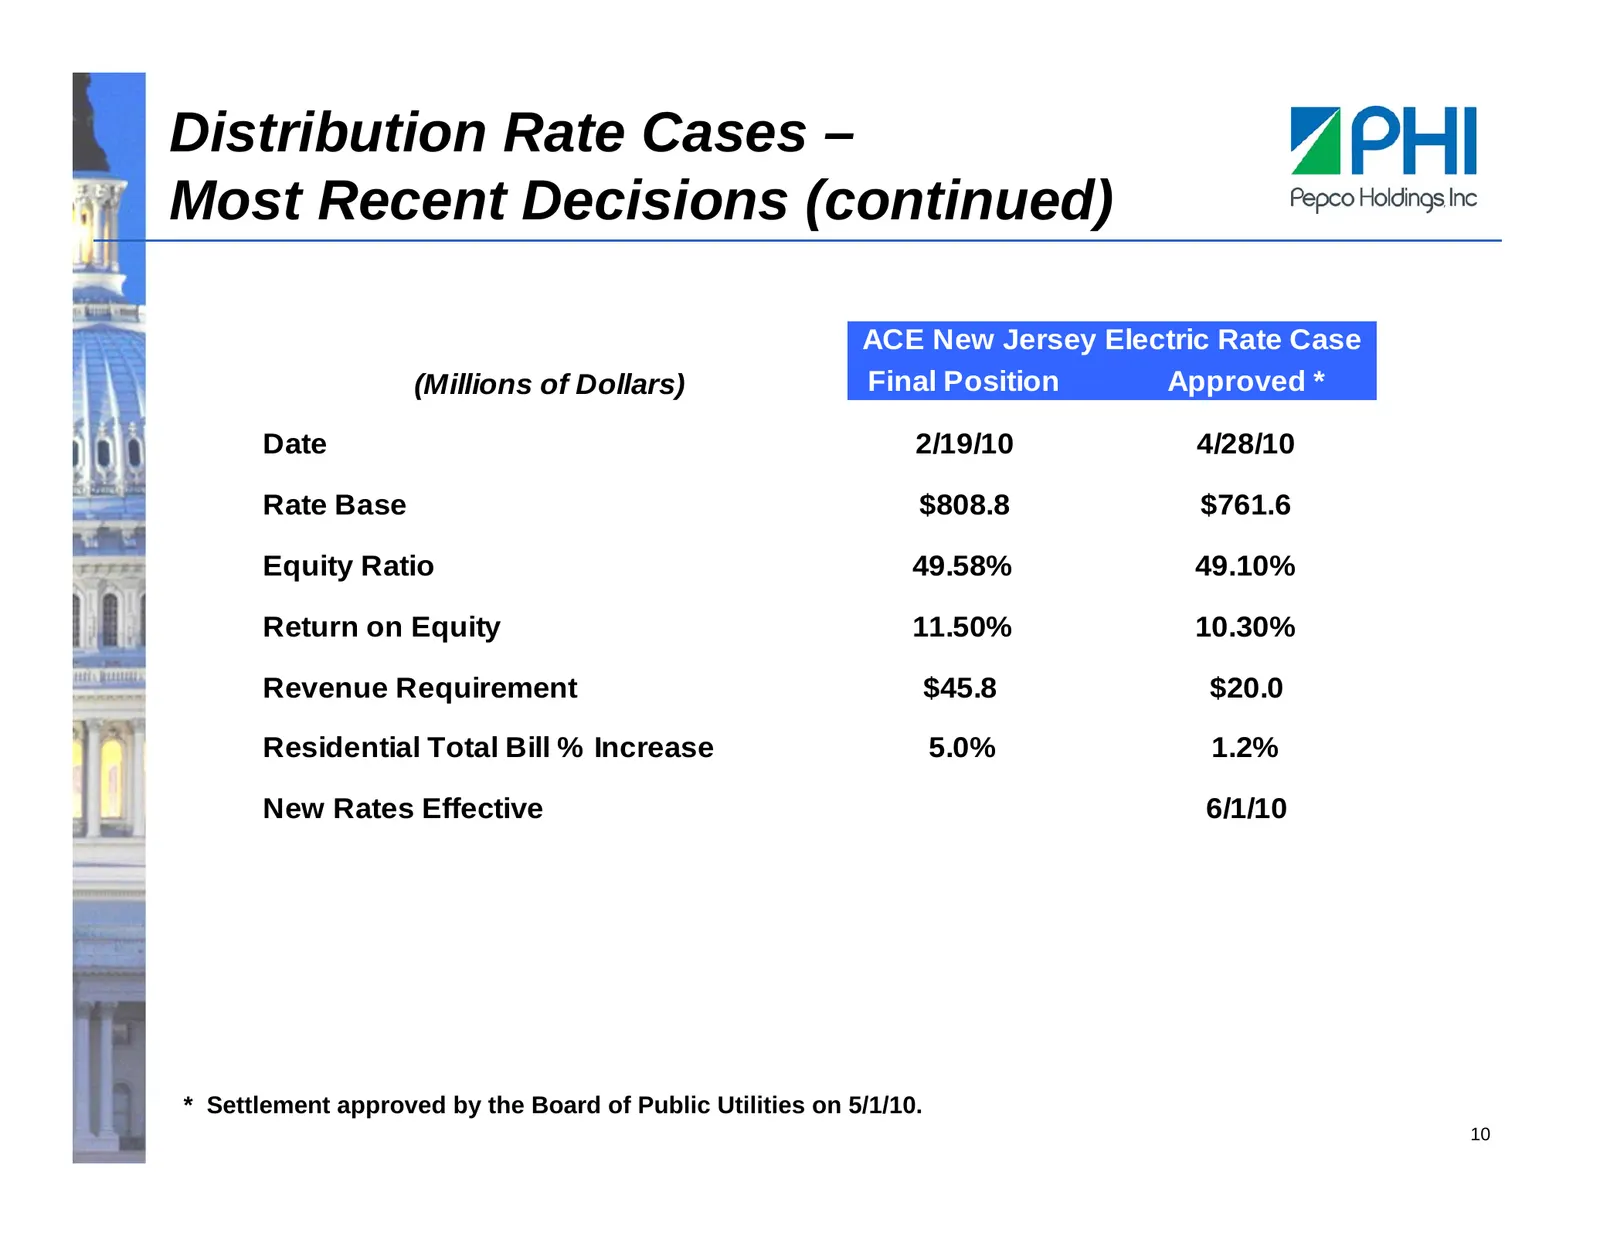
Distribution Rate Cases – Most Recent Decisions (continued) ACE New Jersey Electric Rate Case (Millions of Dollars) Final Position Approved * Date 2/19/10 4/28/10 Rate Base $808.8 $761.6 Equity Ratio 49.58% 49.10% Return on Equity 11.50% 10.30% Revenue Requirement $45.8 $20.0 Residential Total Bill
Slide 12: Distribution Rate Cases – Current Positions
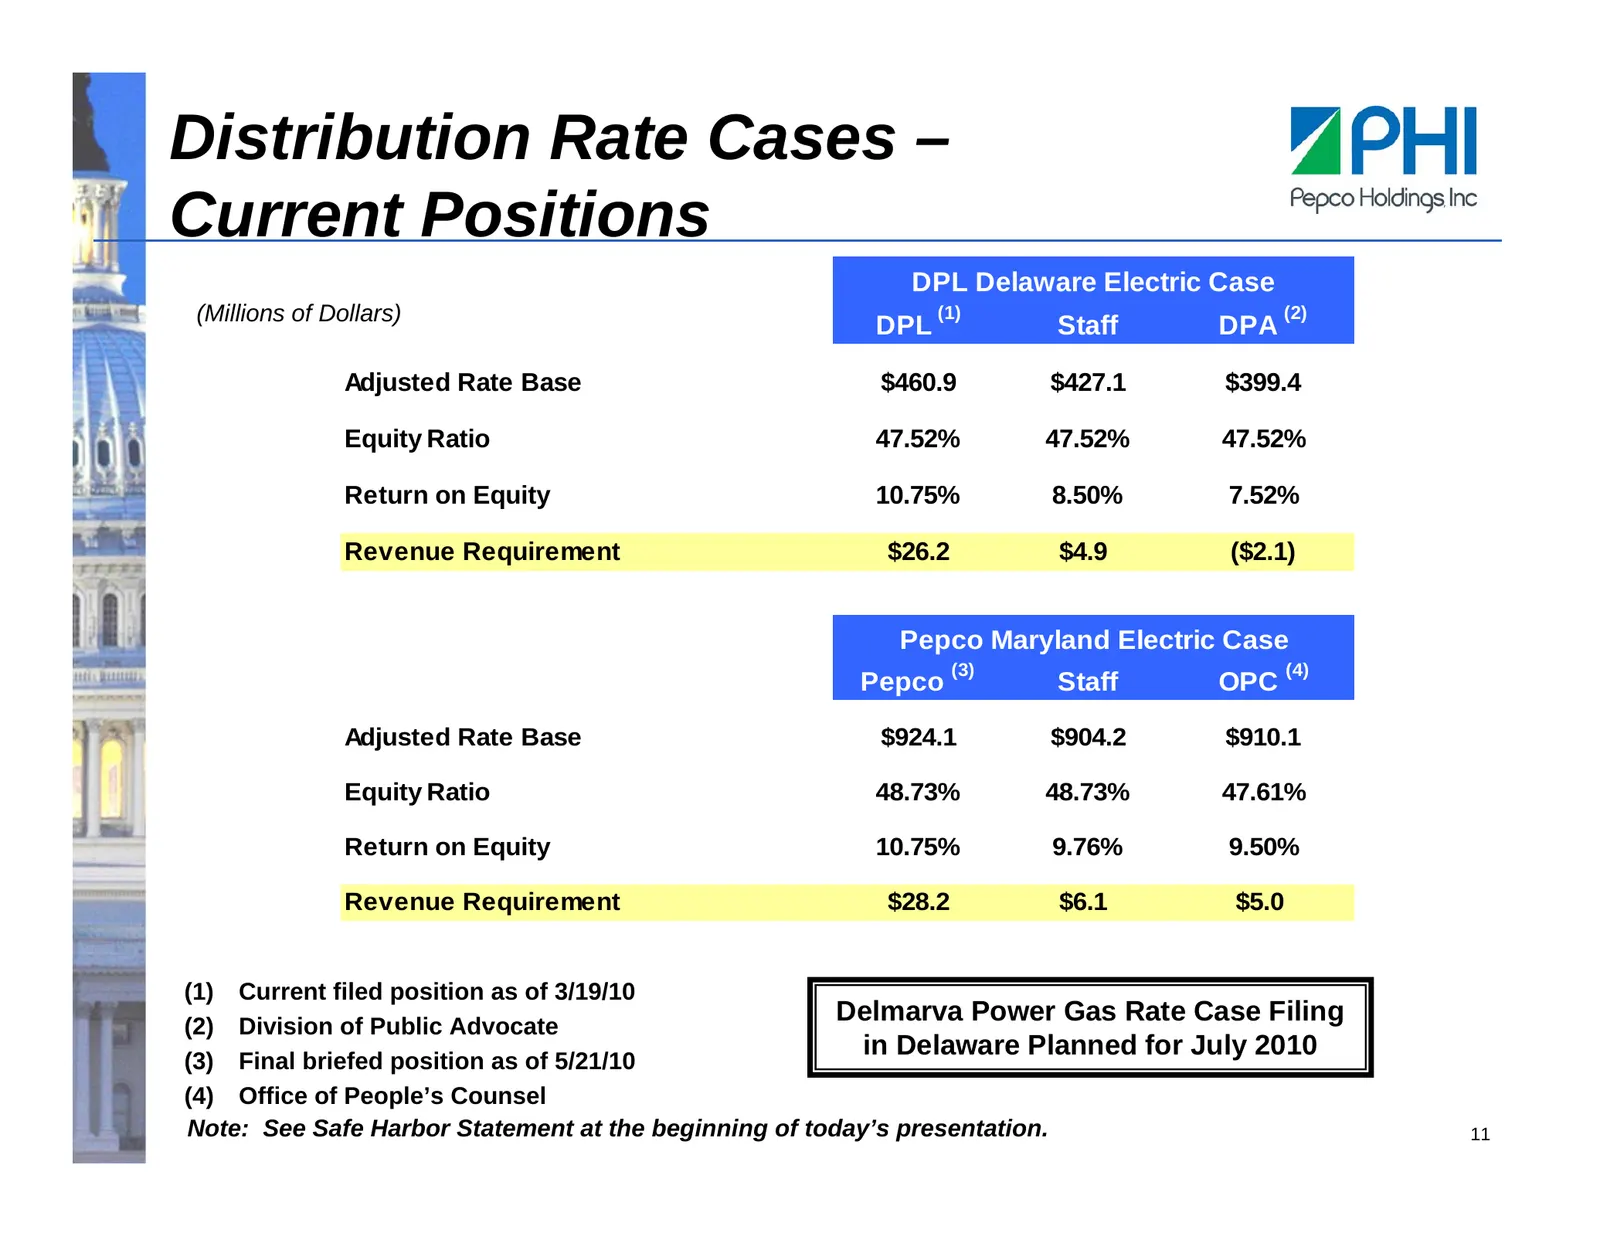
Distribution Rate Cases – Current Positions DPL Delaware Electric Case (Millions of Dollars) (1) (2) DPL Staff DPA Adjusted Rate Base $460.9 $427.1 $399.4 Equity Ratio 47.52% 47.52% 47.52% Return on Equity 10.75% 8.50% 7.52% Revenue Requirement $26.2 $4.9 ($2.1) Pepco Maryland Electric Case (3) (4)
Slide 13: PES Overview
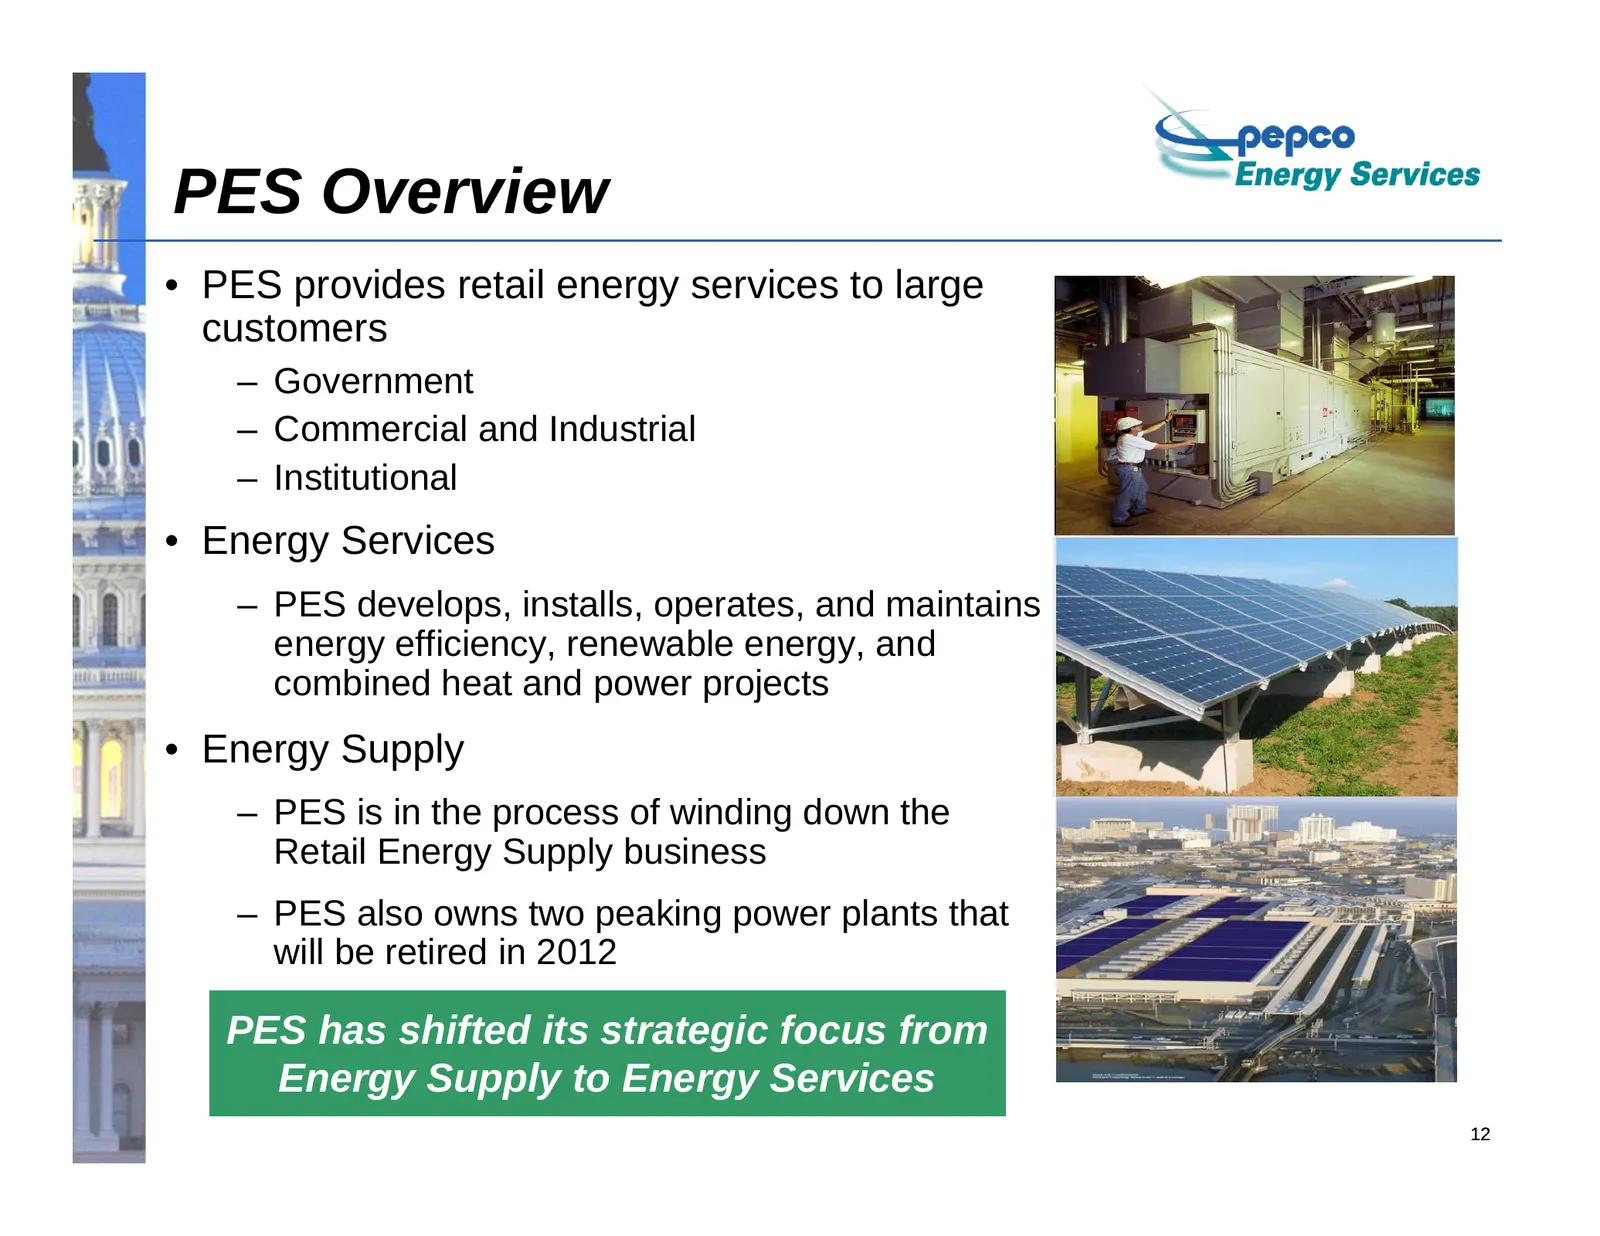
PES Overview • PES provides retail energy services to large customers – Government – Commercial and Industrial – Institutional • Energy Services – PES develops, installs, operates, and maintains energy efficiency, renewable energy, and combined heat and power projects • Energy Supply – PES is in the
Slide 14: Wind-down of Retail Electric and Natural Gas Supply and Power Plants
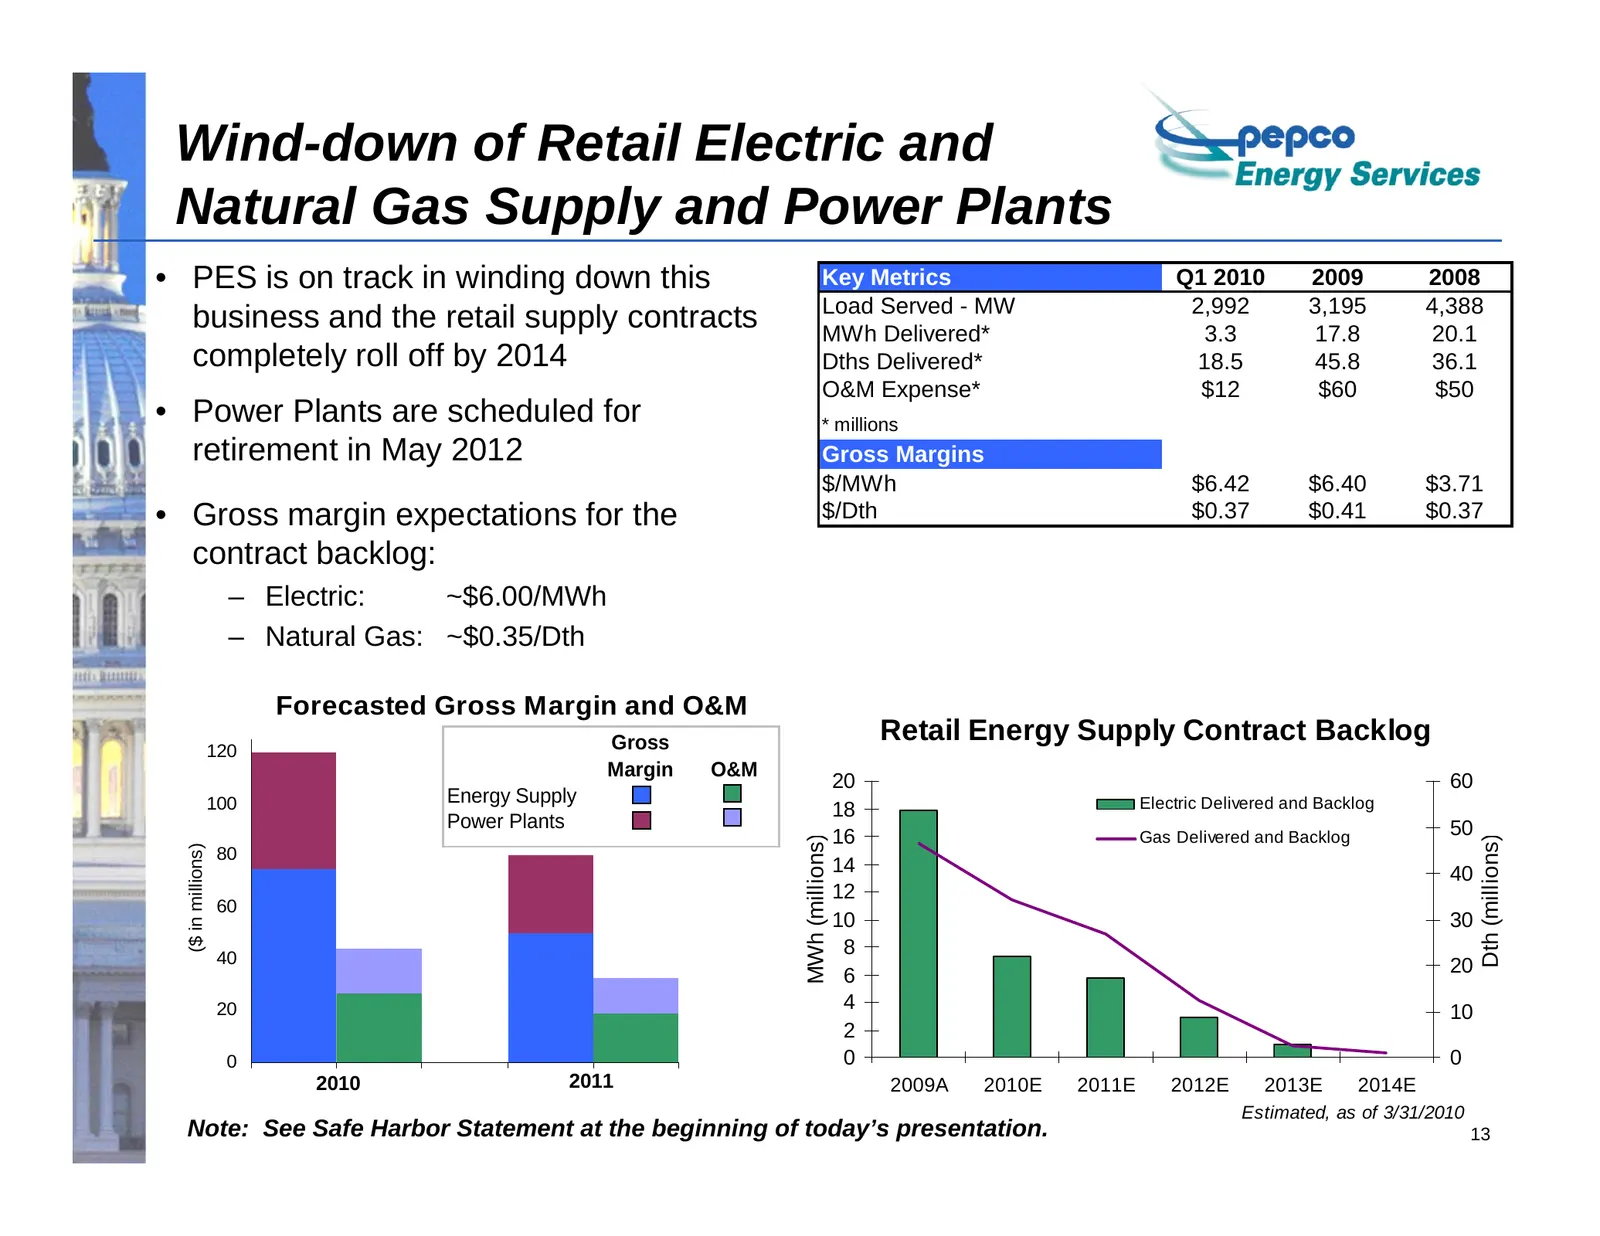
Wind-down of Retail Electric and Natural Gas Supply and Power Plants • PES is on track in winding down this Key Metrics Q1 2010 2009 2008 Load Served - MW 2,992 3,195 4,388 business and the retail supply contracts MWh Delivered* 3.3 17.8 20.1 completely roll off by 2014 Dths Delivered* 18.5 45.8 36.
Slide 15: Energy Services Overview
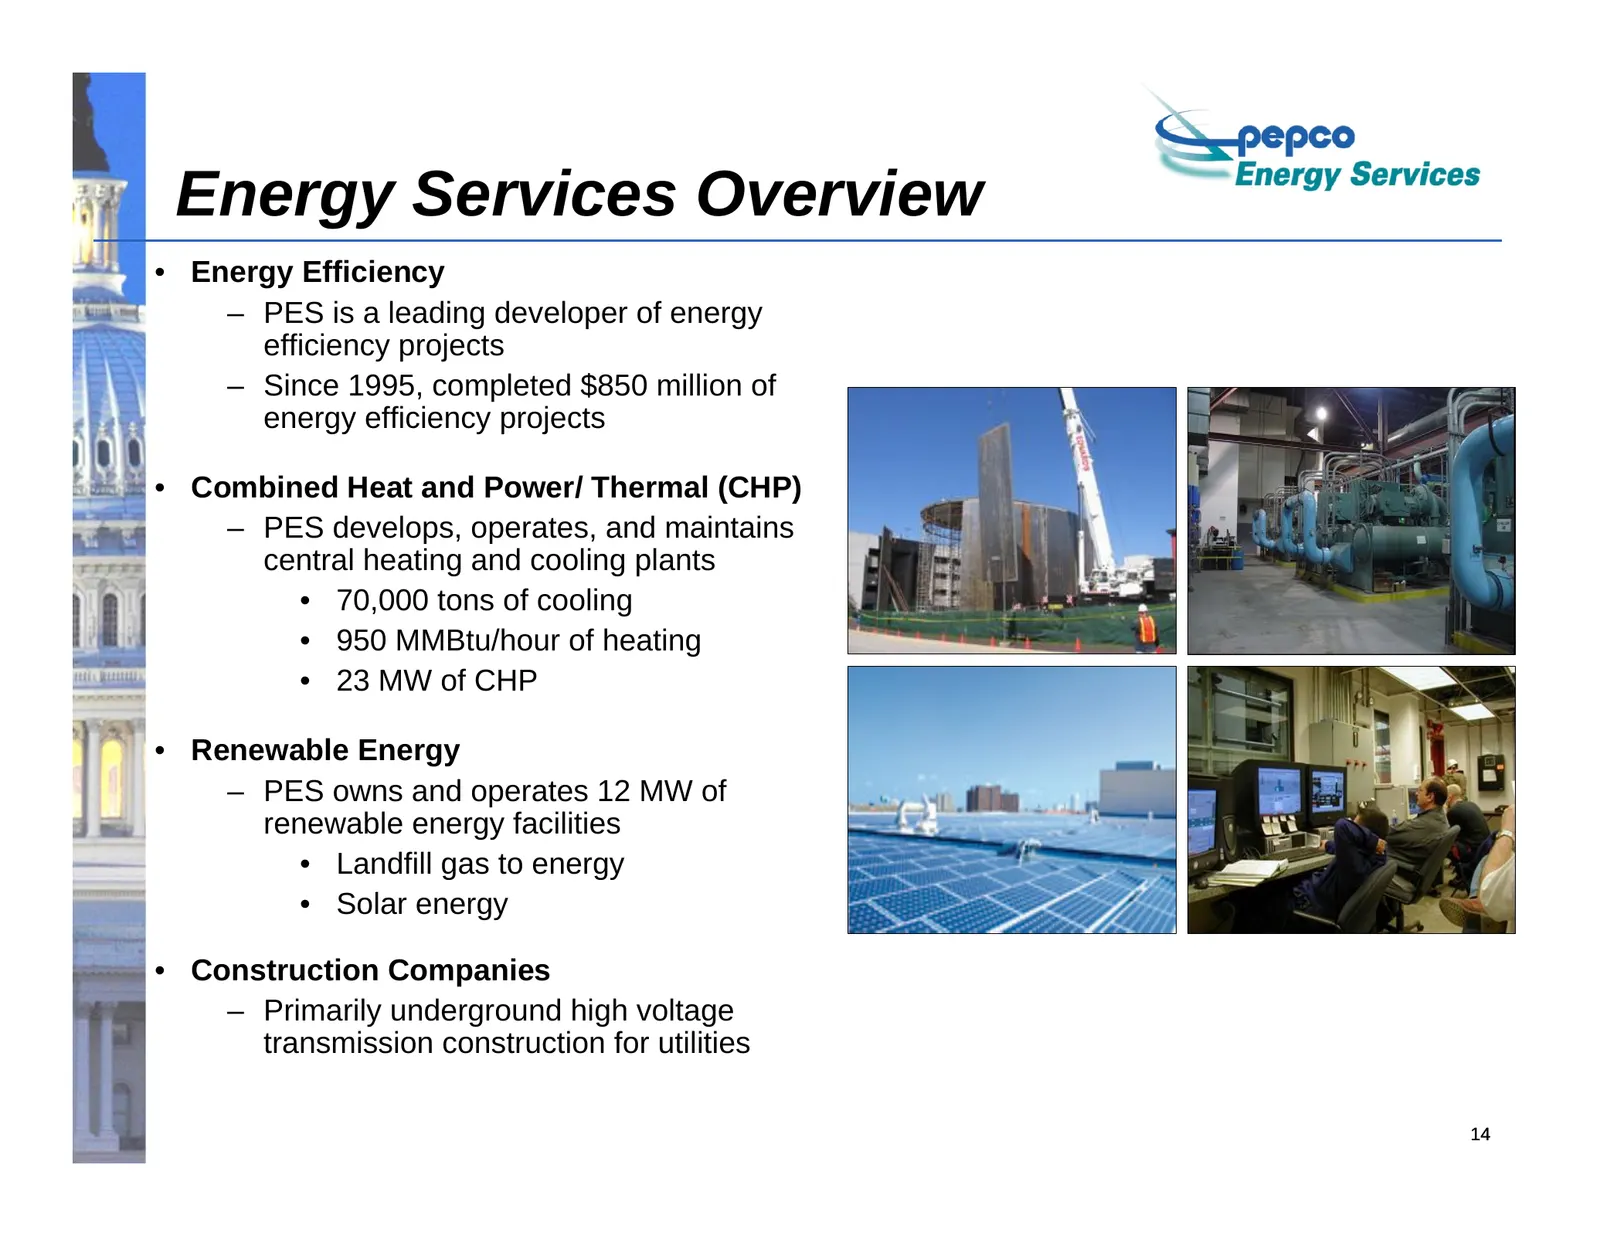
Energy Services Overview • Energy Efficiency – PES is a leading developer of energy efficiency projects – Since 1995, completed $850 million of energy efficiency projects • Combined Heat and Power/ Thermal (CHP) – PES develops, operates, and maintains central heating and cooling plants • 70,000 tons
Slide 16: Growing Energy Services
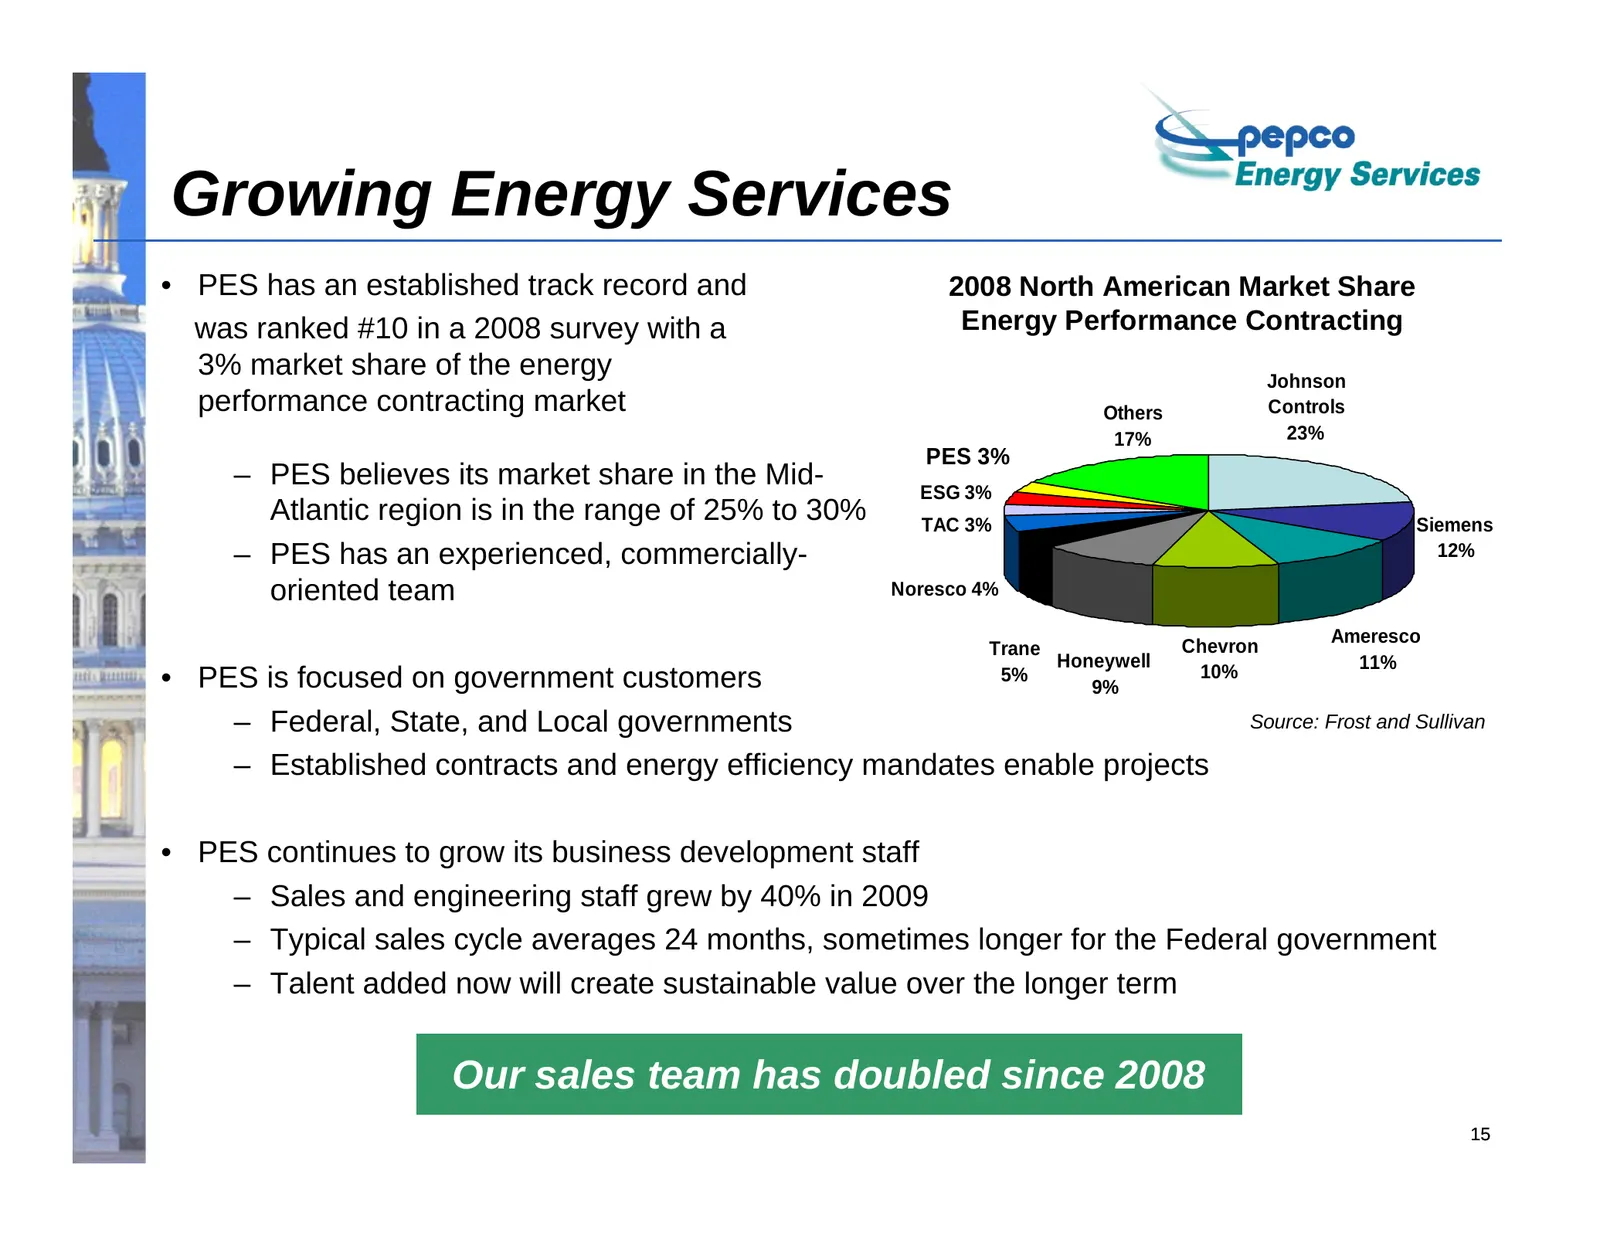
Growing Energy Services • PES has an established track record and 2008 North American Market Share was ranked #10 in a 2008 survey with a Energy Performance Contracting 3% market share of the energy Johnson performance contracting market Others Controls 17% 23% PES 3% – PES believes its market share
Slide 17: Conectiv Energy – Asset Sale/Exit of Merchant Power
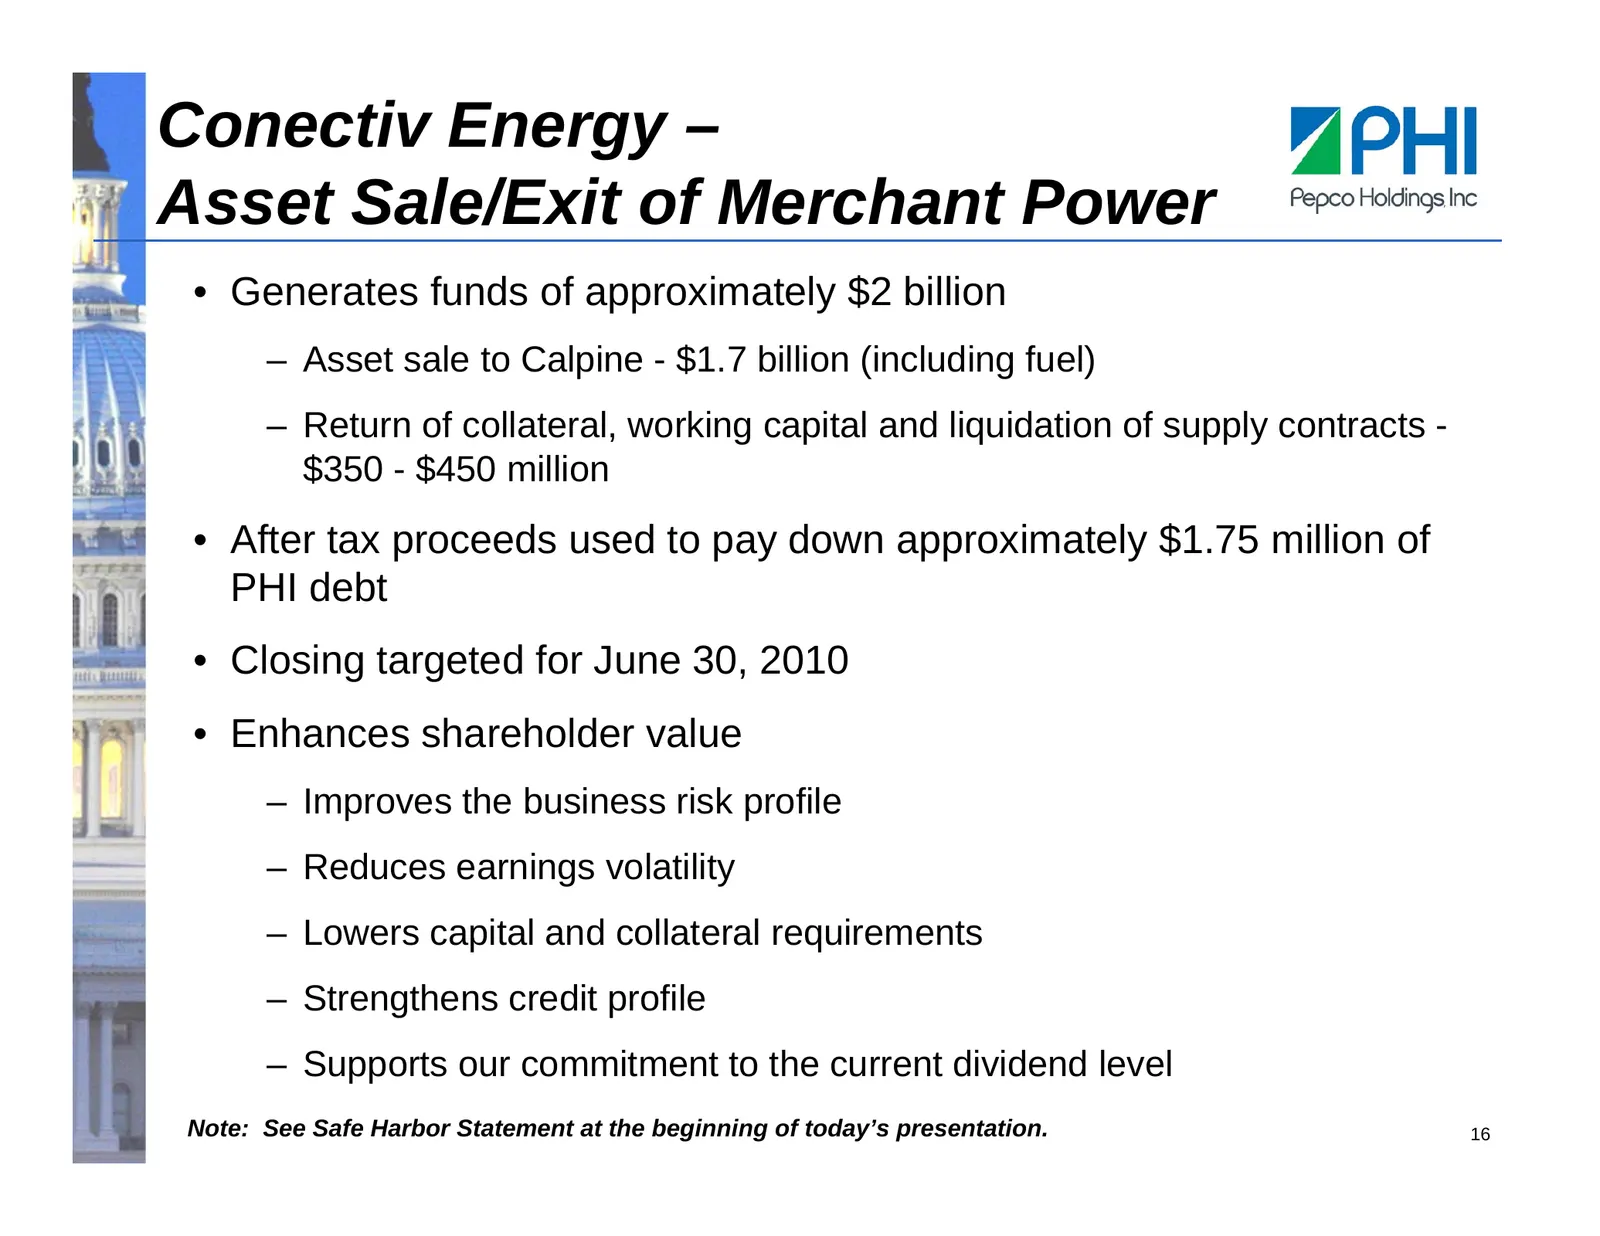
Conectiv Energy – Asset Sale/Exit of Merchant Power • Generates funds of approximately $2 billion – Asset sale to Calpine - $1.7 billion (including fuel) – Return of collateral, working capital and liquidation of supply contracts - $350 - $450 million • After tax proceeds used to pay down approximat
Slide 18: 2010 – 2011 Financing Activity
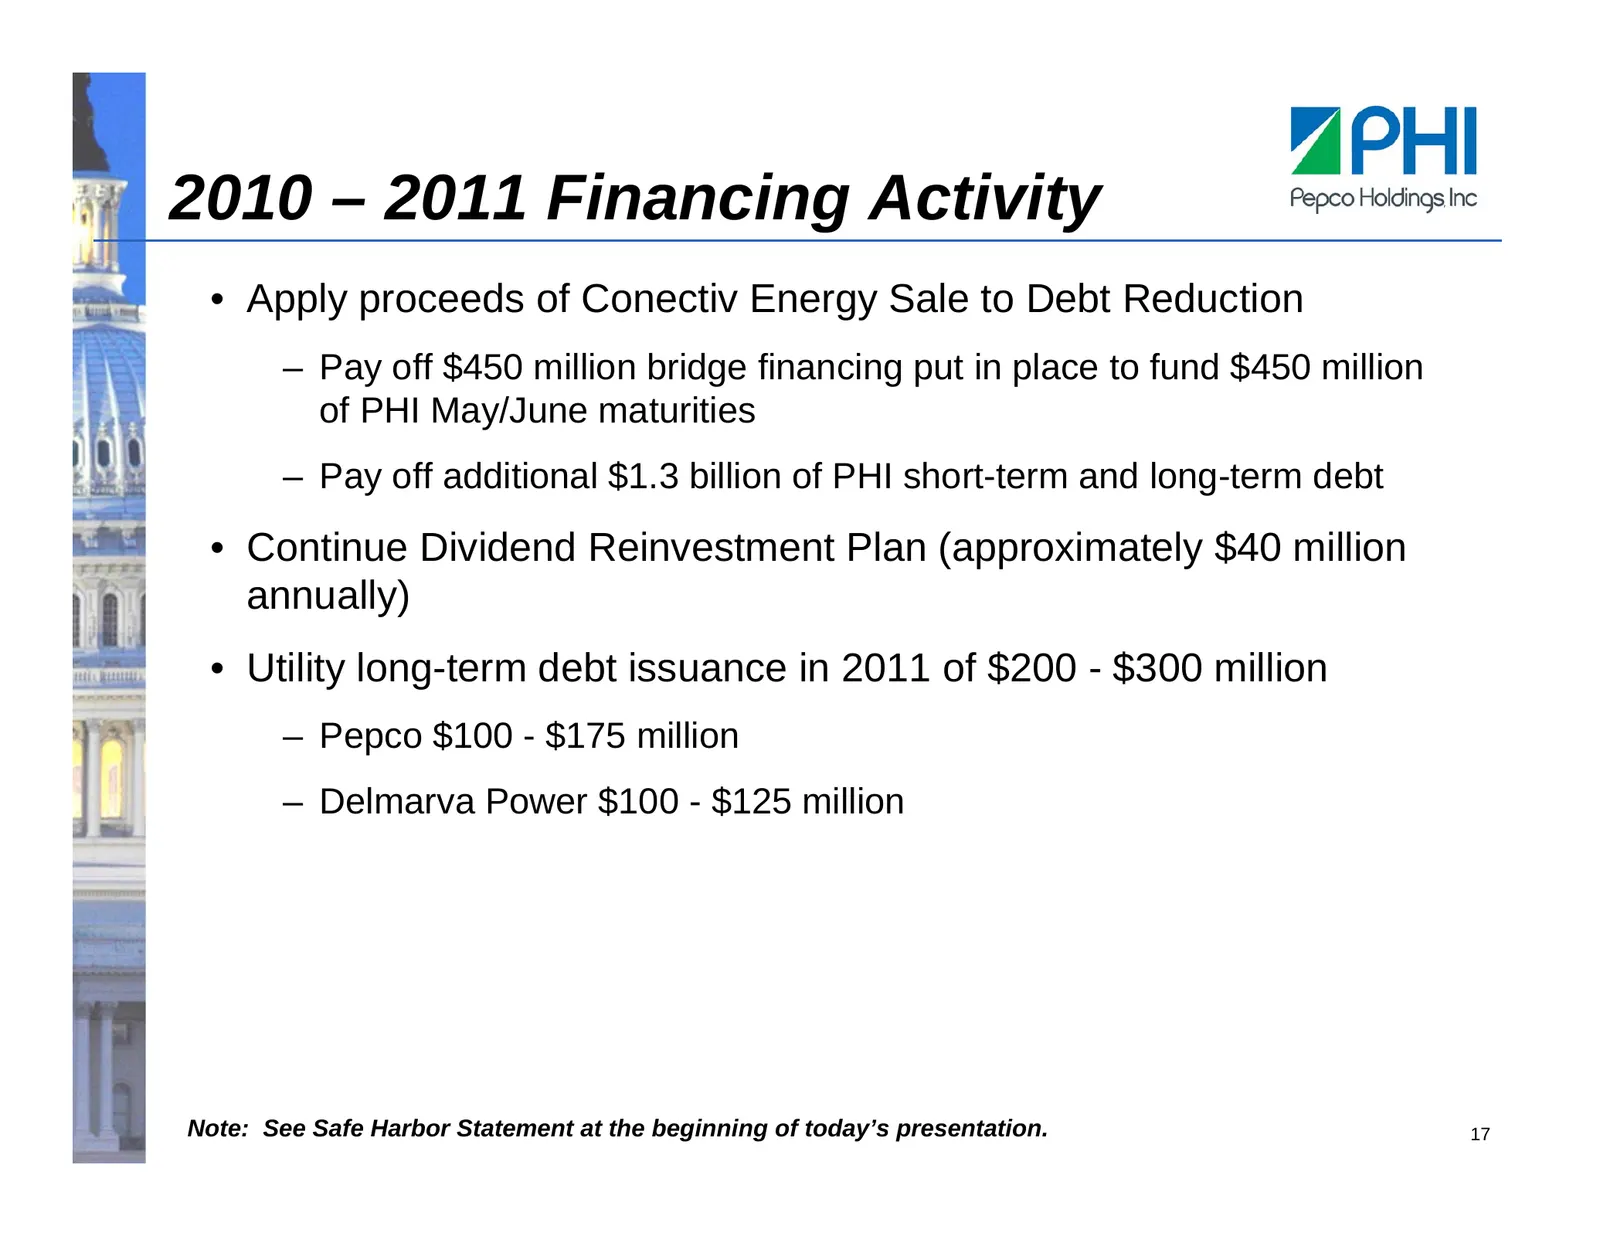
2010 – 2011 Financing Activity • Apply proceeds of Conectiv Energy Sale to Debt Reduction – Pay off $450 million bridge financing put in place to fund $450 million of PHI May/June maturities – Pay off additional $1.3 billion of PHI short-term and long-term debt • Continue Dividend Reinvestment Plan
Slide 19: Earnings Guidance
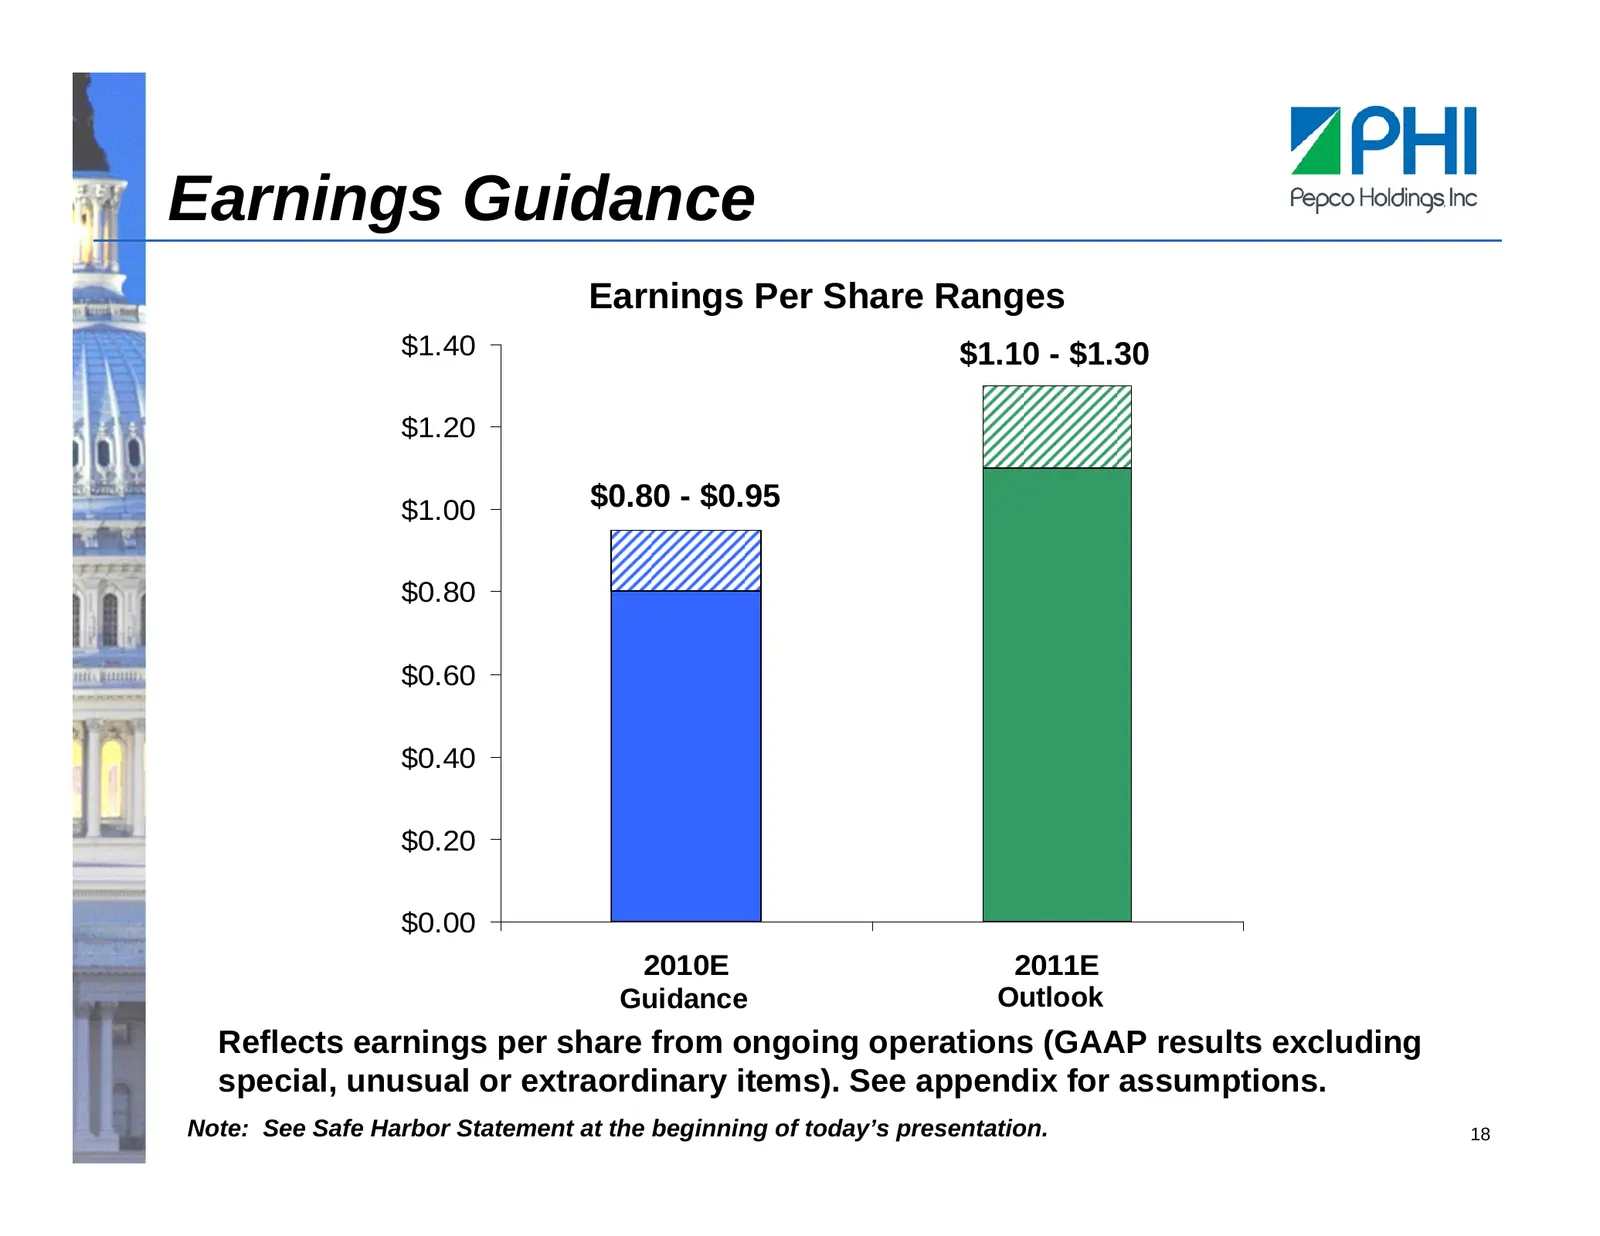
Earnings Guidance Earnings Per Share Ranges $1.40 $1.10 - $1.30 $1.20 $1.00 $0.80 - $0.95 $0.80 $0.60 $0.40 $0.20 $0.00 2010E 2011E Guidance Outlook Reflects earnings per share from ongoing operations (GAAP results excluding special, unusual or extraordinary items). See appendix for assumptions. Not
Slide 20: POM Investment Case
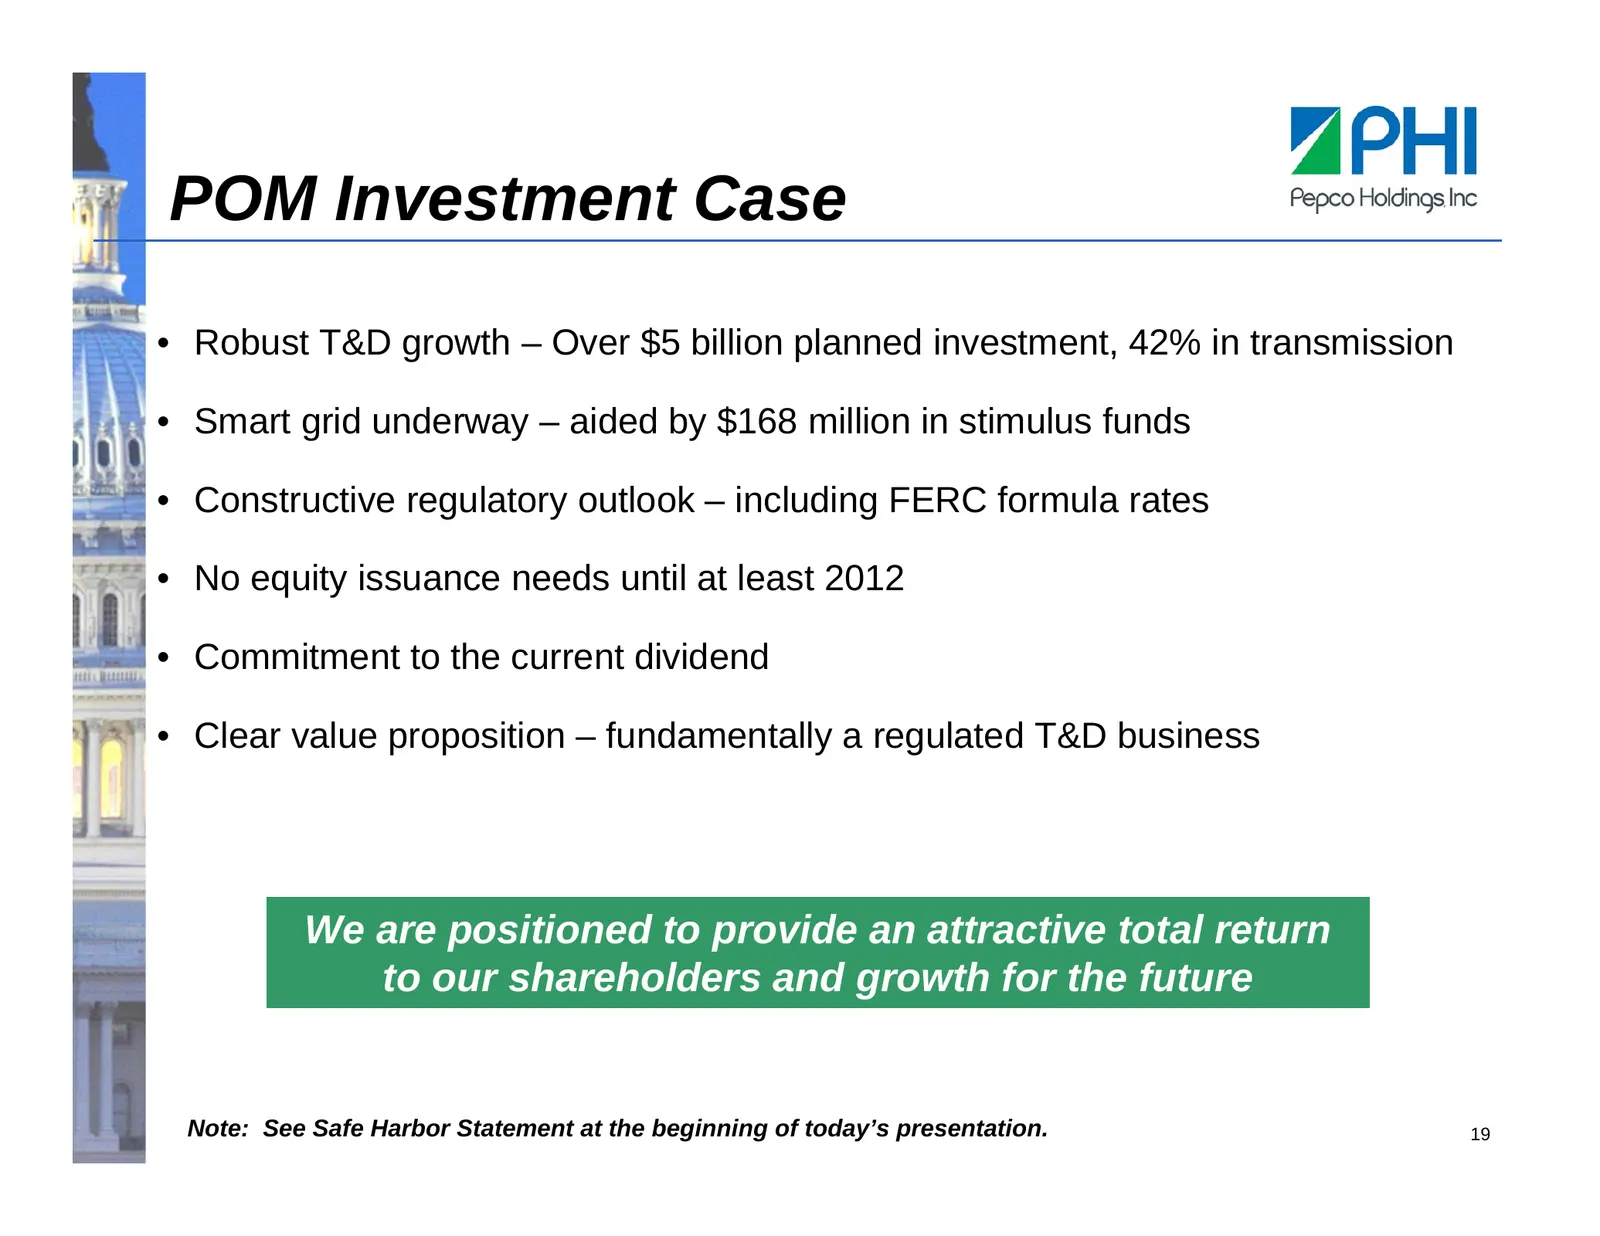
POM Investment Case • Robust T&D growth – Over $5 billion planned investment, 42% in transmission • Smart grid underway – aided by $168 million in stimulus funds • Constructive regulatory outlook – including FERC formula rates • No equity issuance needs until at least 2012 • Commitment to the curren
Slide 21: Appendix
ZPHI Pepco Holdings Inc Appendix
Slide 22: Sales and Customer Growth
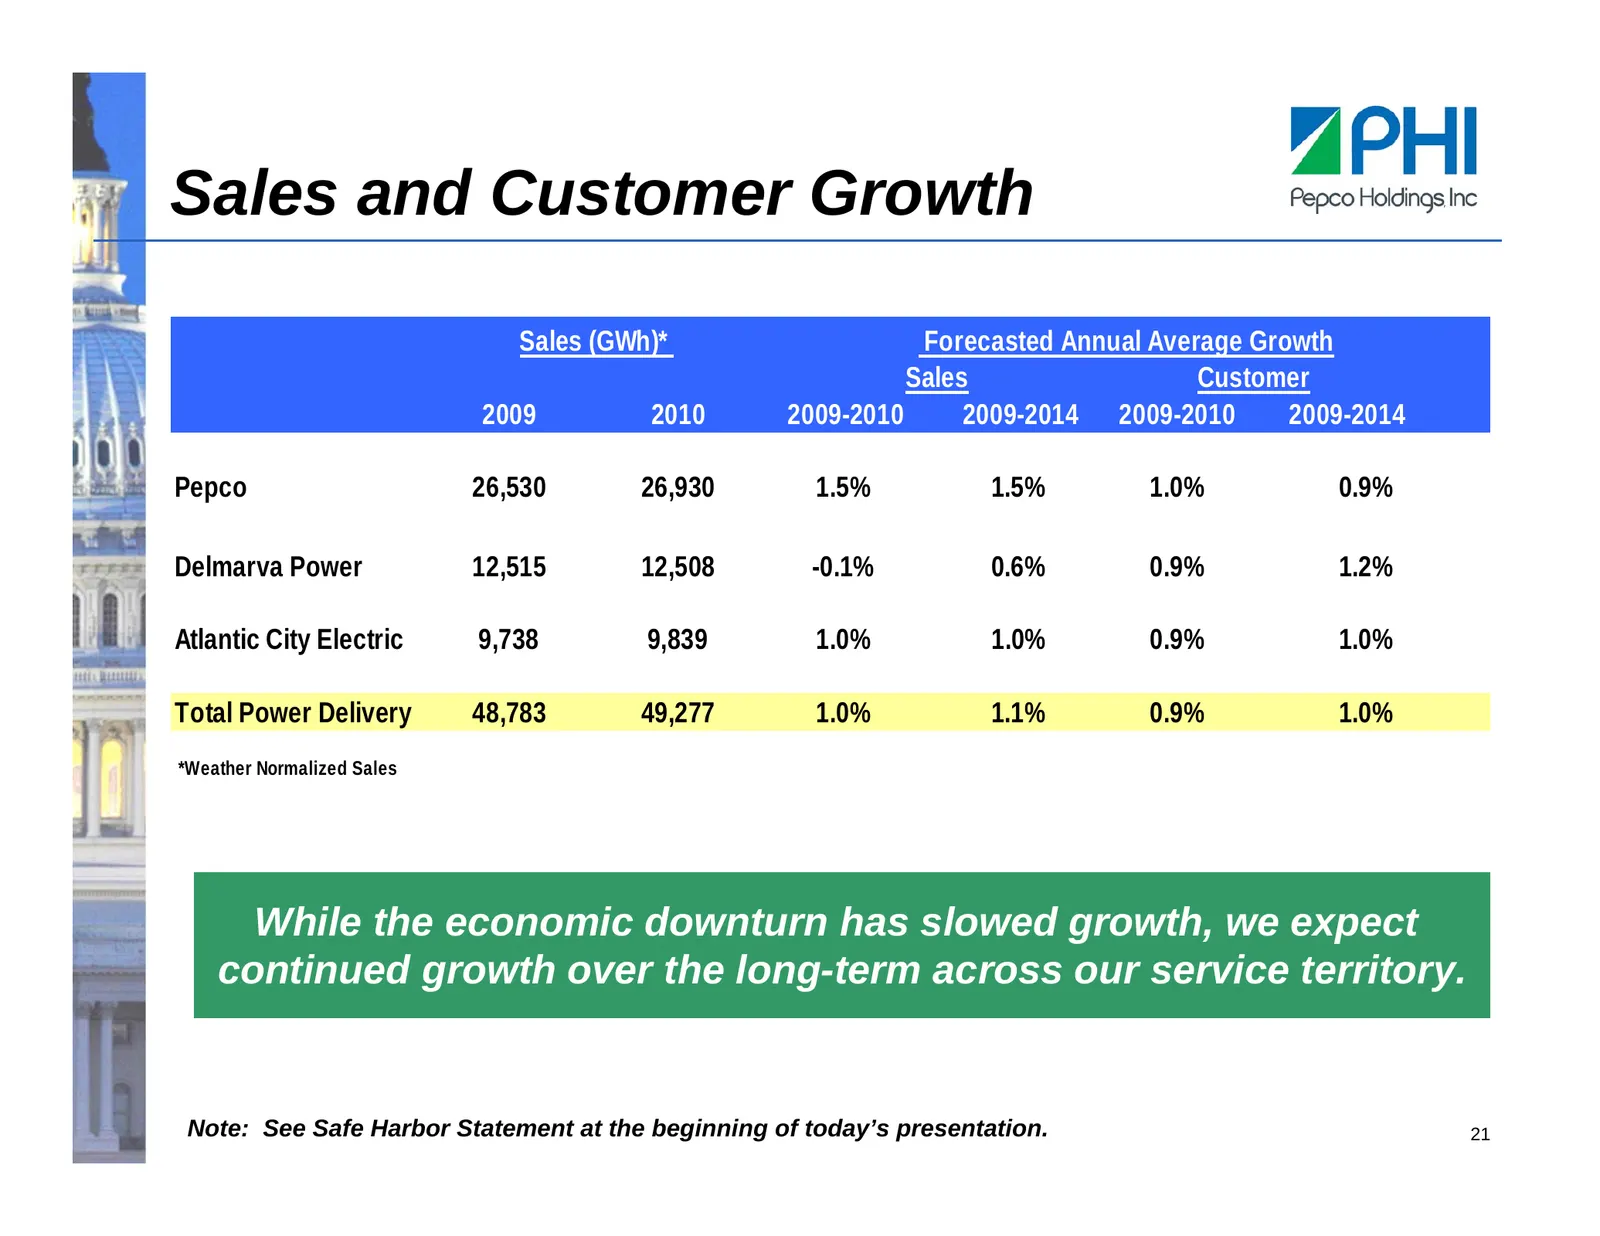
Sales and Customer Growth Sales (GWh)* Forecasted Annual Average Growth Sales Customer 2009 2010 2009-2010 2009-2014 2009-2010 2009-2014 Pepco 26,530 26,930 1.5% 1.5% 1.0% 0.9% Delmarva Power 12,515 12,508 -0.1% 0.6% 0.9% 1.2% Atlantic City Electric 9,738 9,839 1.0% 1.0% 0.9% 1.0% Total Power Delive
Slide 23: MAPP – Construction Costs
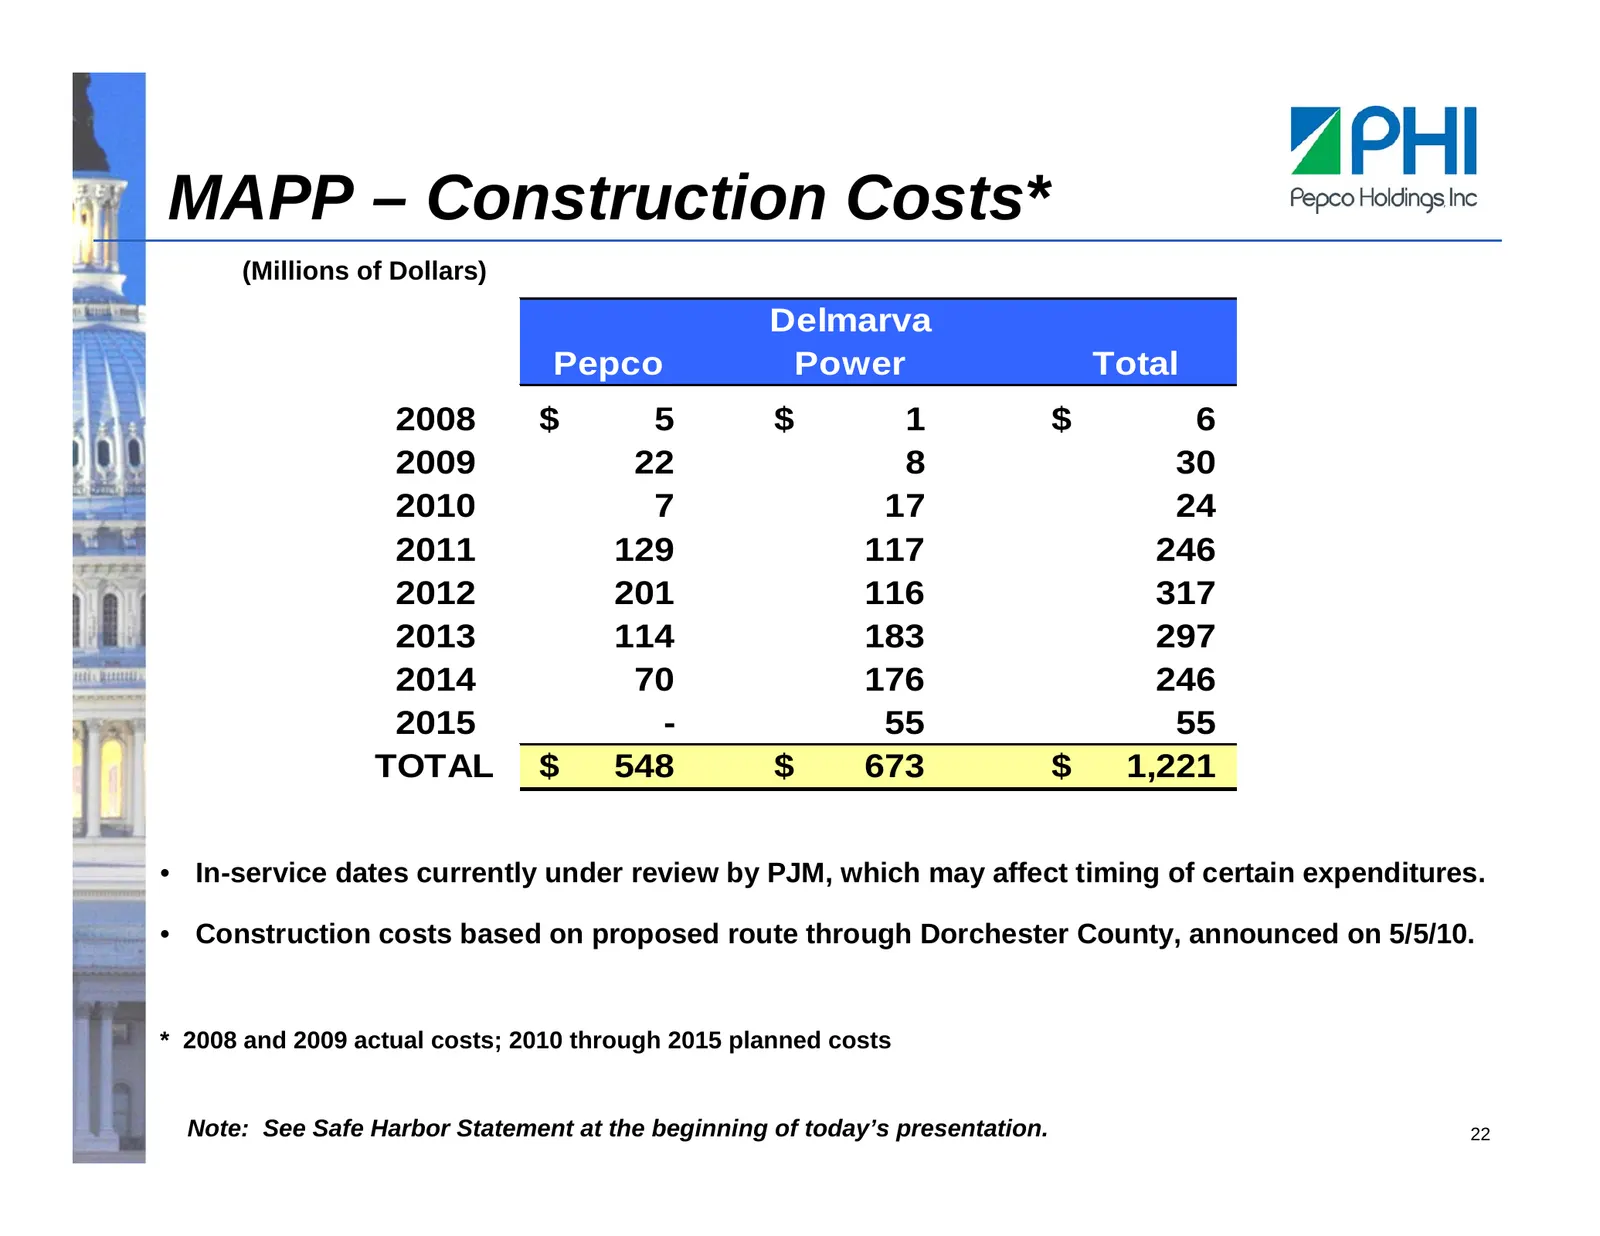
MAPP – Construction Costs* (Millions of Dollars) Delmarva Pepco Power Total 2008 $ 5 $ 1 $ 6 2009 22 8 30 2010 7 17 24 2011 129 117 246 2012 201 116 317 2013 114 183 297 2014 70 176 246 2015 - 55 55 TOTAL $ 548 $ 673 $ 1,221 • In-service dates currently under review by PJM, which may affect timing o
Slide 24: Blueprint for the Future – Updated Costs
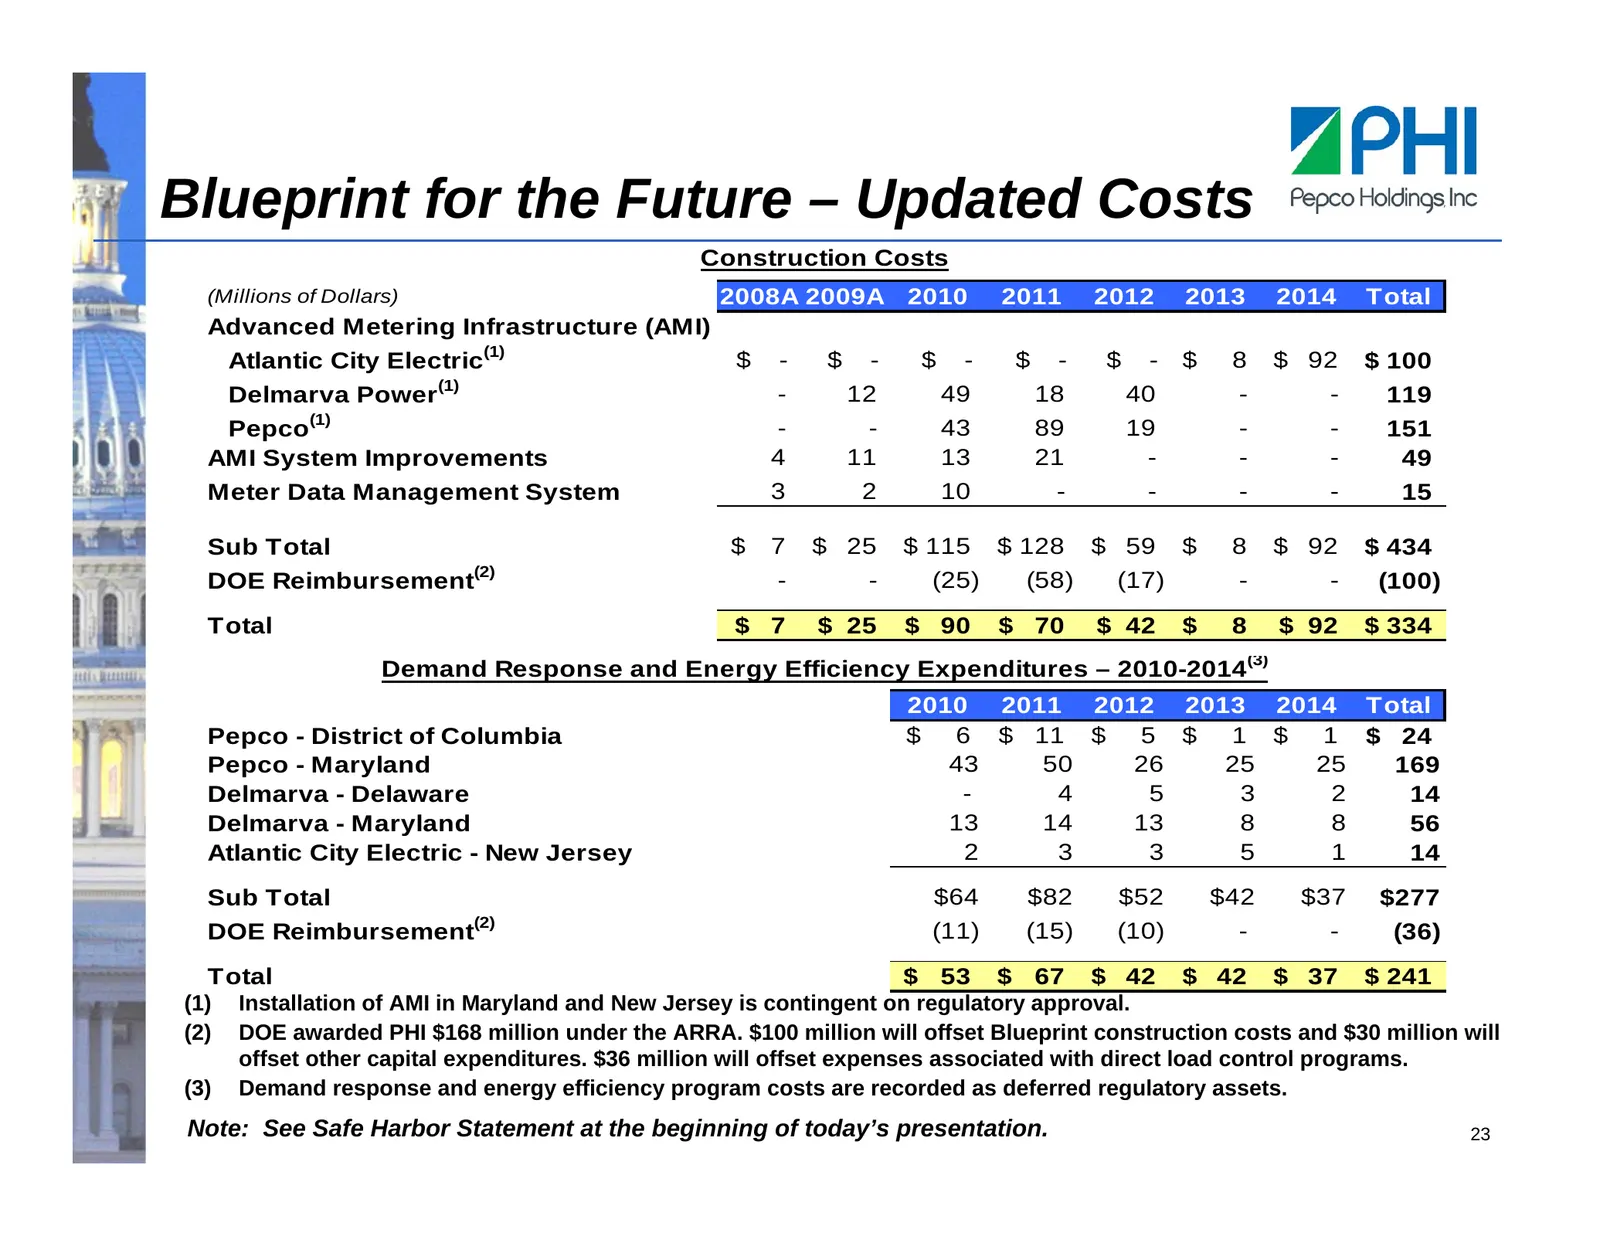
Blueprint for the Future – Updated Costs Construction Costs (Millions of Dollars) 2008A 2009A 2010 2011 2012 2013 2014 Total Advanced Metering Infrastructure (AMI) Atlantic City Electric(1) $ - $ - $ - $ - $ - $ 8 $ 92 $ 100 Delmarva Power (1) - 12 49 18 40 - - 119 Pepco(1) - - 43 89 19 - - 151 AMI
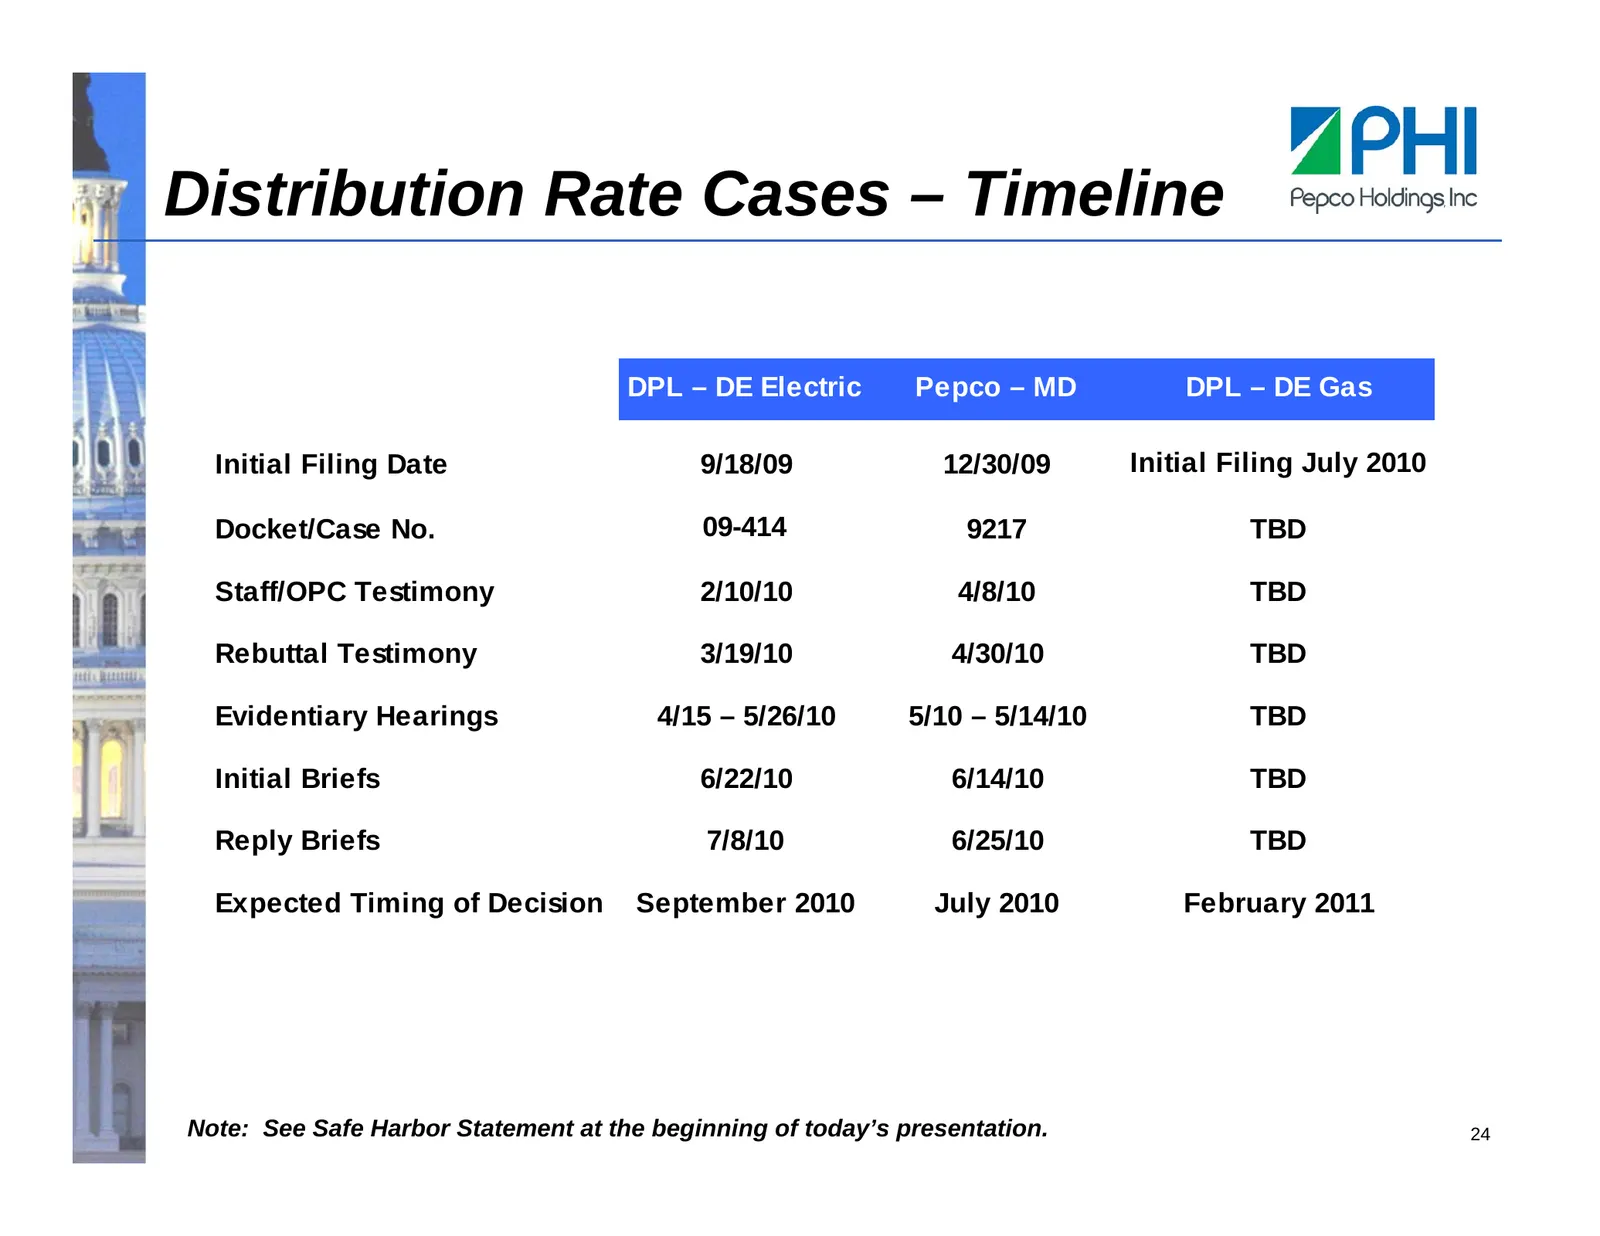
Slide 25: Distribution Rate Cases – Timeline
Distribution Rate Cases – Timeline DPL – DE Electric Pepco – MD DPL – DE Gas Initial Filing Date 9/18/09 12/30/09 Initial Filing July 2010 Docket/Case No. 09-414 9217 TBD Staff/OPC Testimony 2/10/10 4/8/10 TBD Rebuttal Testimony 3/19/10 4/30/10 TBD Evidentiary Hearings 4/15 – 5/26/10 5/10 – 5/14/10
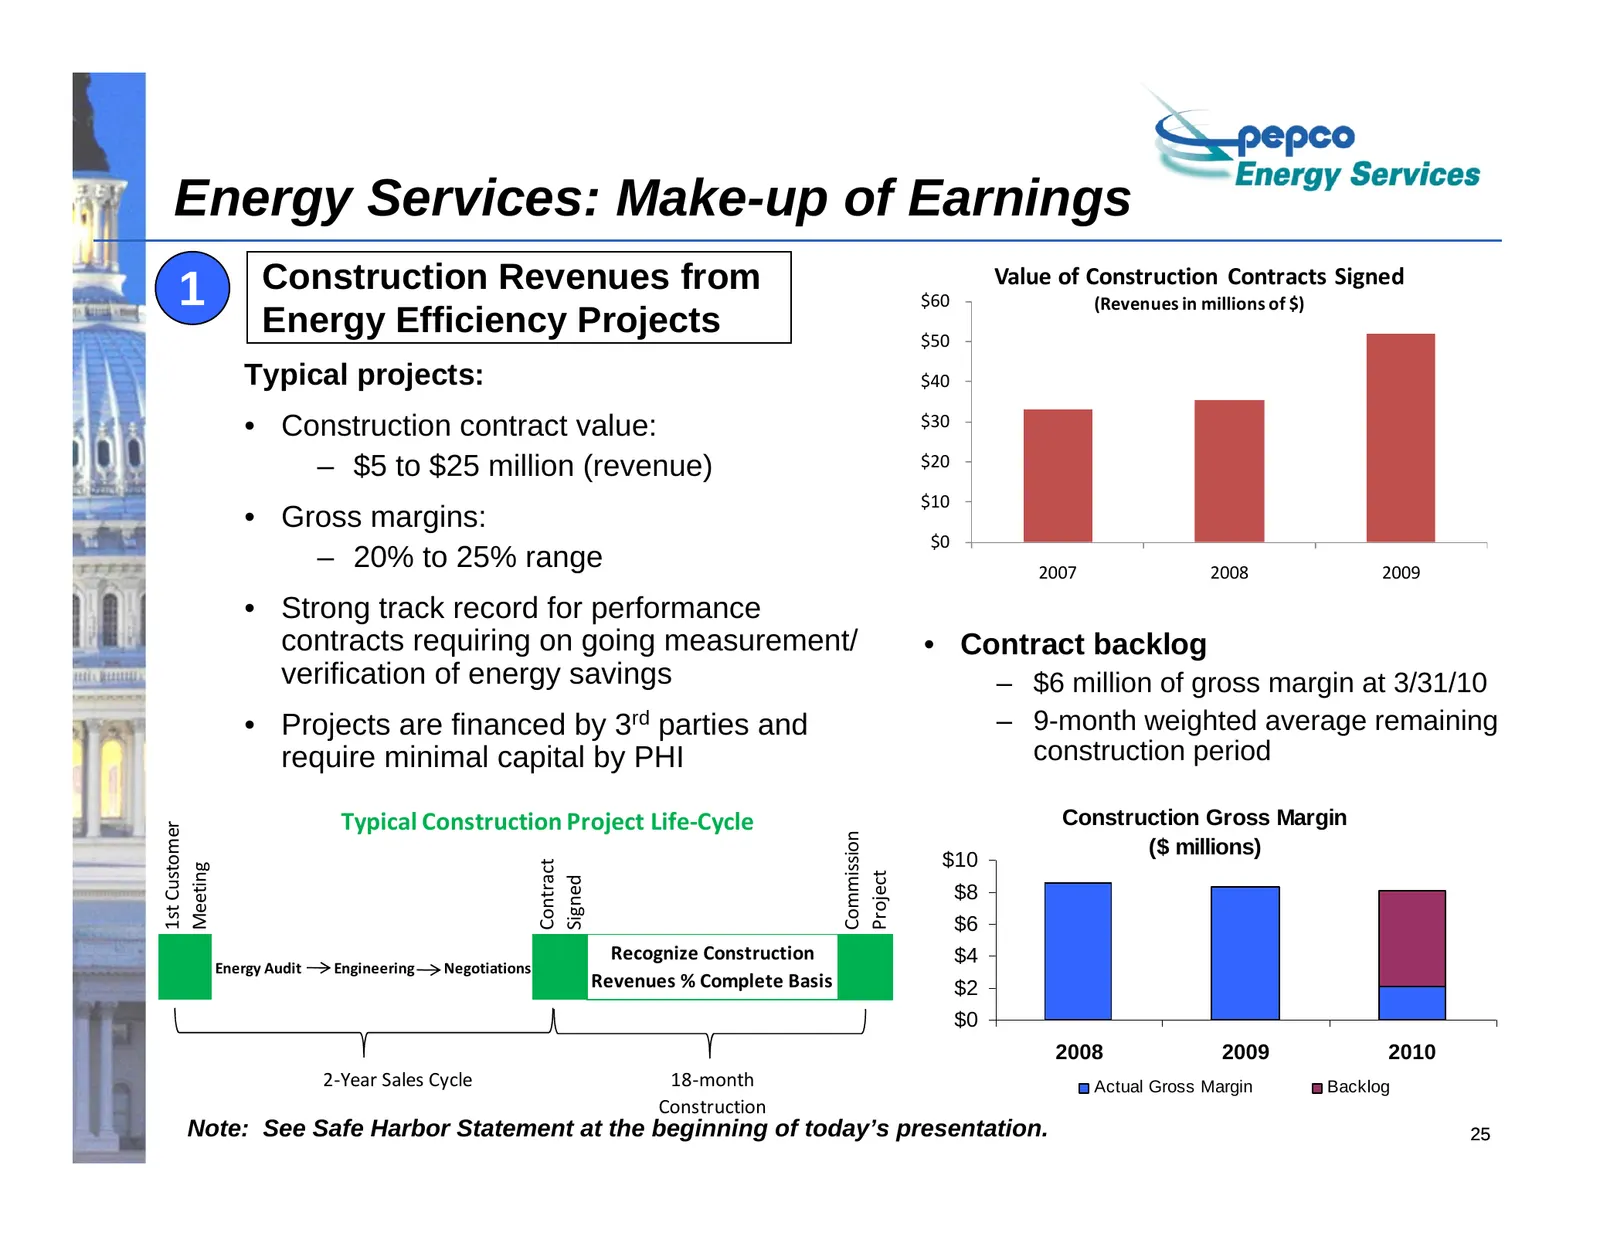
Slide 26: Energy Services: Make-up of Earnings
Energy Services: Make-up of Earnings 1 Construction Revenues from $60 Value of Construction Contracts Signed (Revenues in millions of $) Energy Efficiency Projects $50 Typical projects: $40 • Construction contract value: $30 – $5 to $25 million (revenue) $20 $10 • Gross margins: $0 – 20% to 25% rang
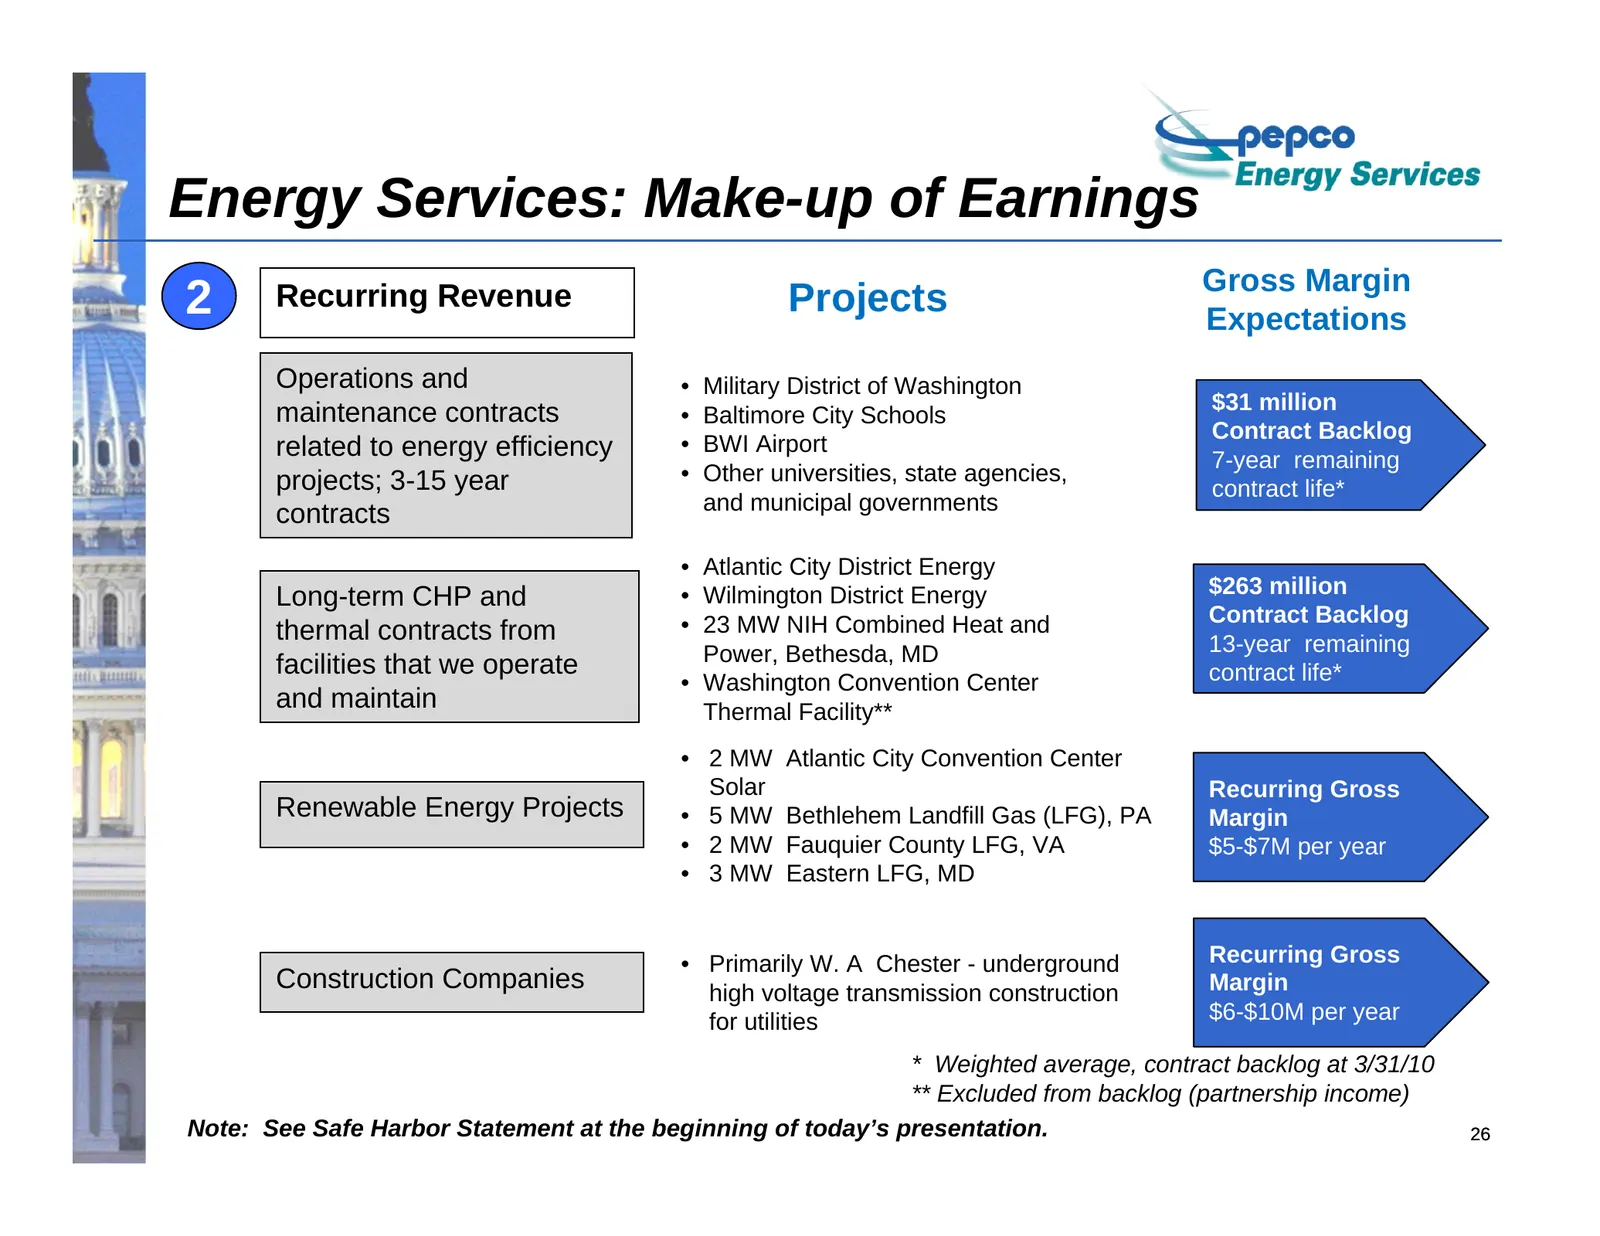
Slide 27: Energy Services: Make-up of Earnings
Energy Services: Make-up of Earnings Gross Margin 2 Recurring Revenue Projects Expectations Operations and • Military District of Washington maintenance contracts $31 million • Baltimore City Schools Contract Backlog related to energy efficiency • BWI Airport 7-year remaining projects; 3-15 year • O
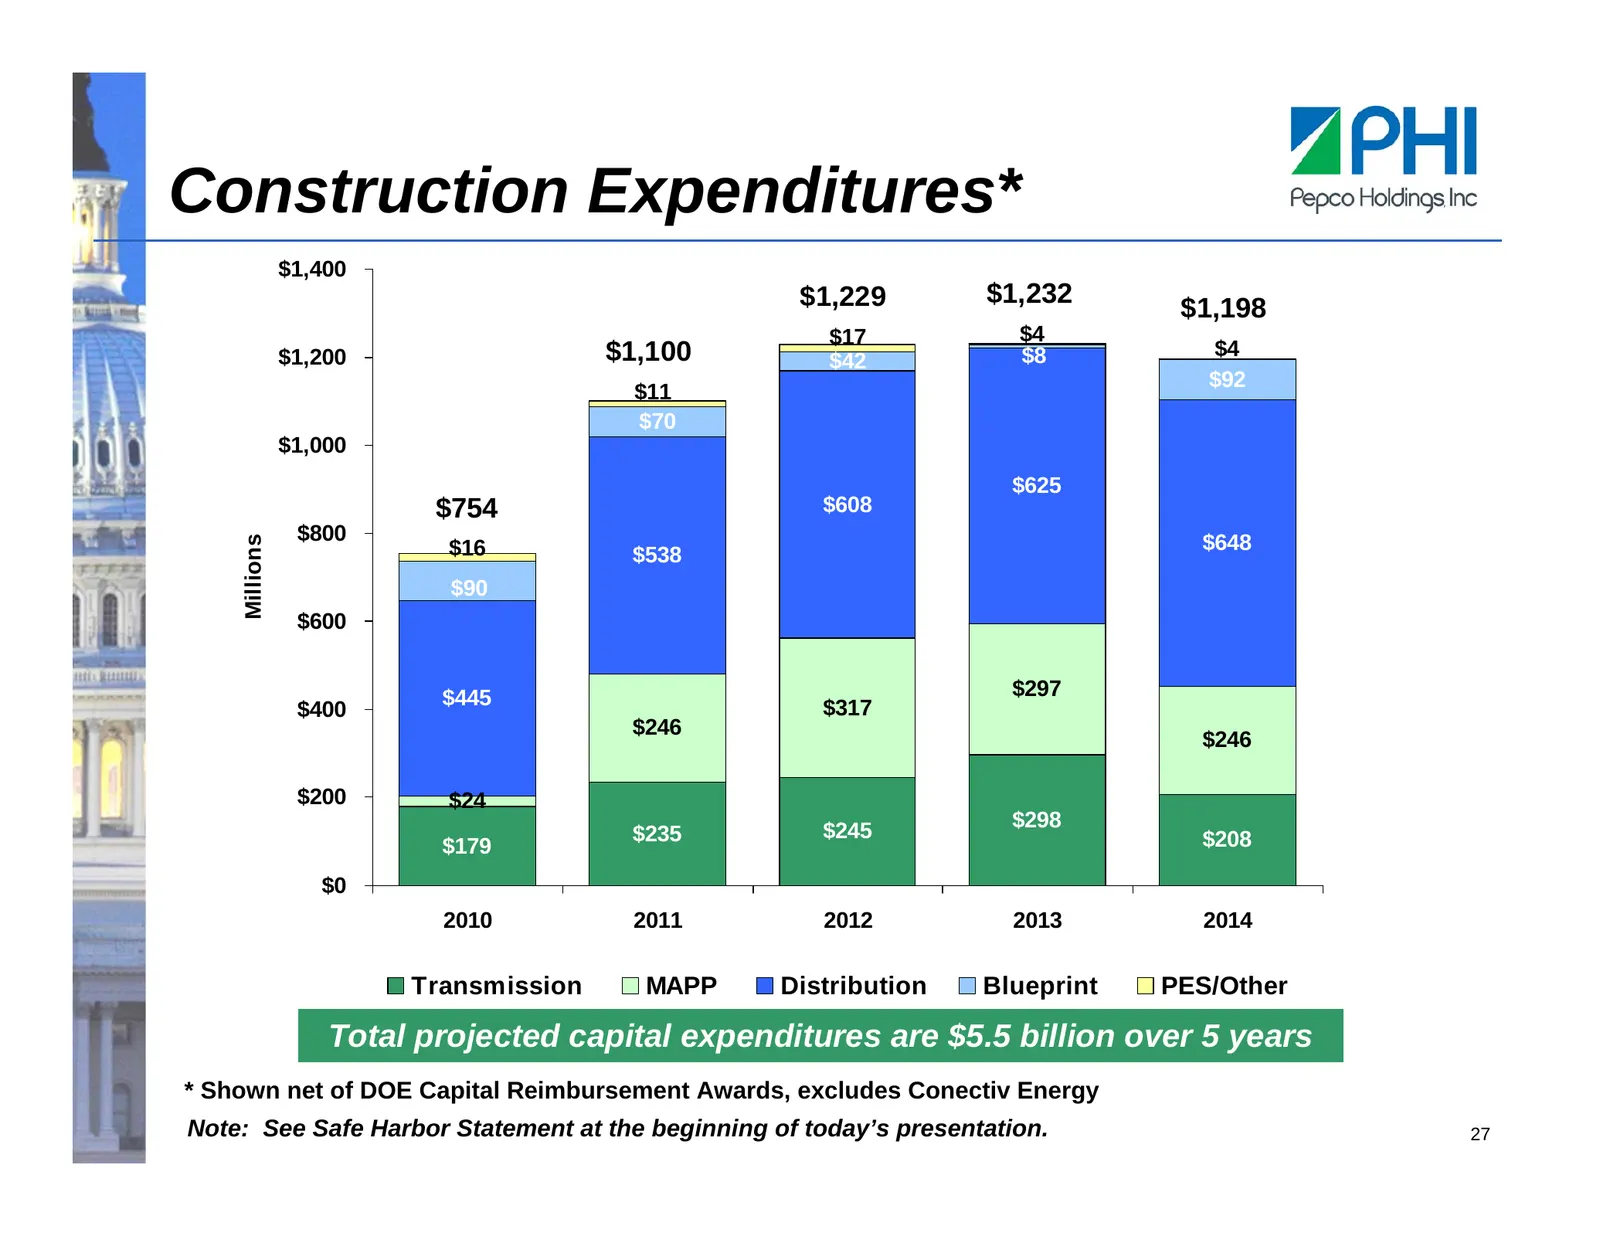
Slide 28: Construction Expenditures
Construction Expenditures* $1,400 $1,229 $1,232 $1,198 $17 $4 $1,200 $1,100 $8 $4 $42 $92 $11 $70 $1,000 $625 $754 $608 $800 Millions $16 $648 $538 $90 $600 $445 $297 $400 $317 $246 $246 $200 $24 $245 $298 $235 $208 $179 $0 2010 2011 2012 2013 2014 Transmission MAPP Distribution Blueprint PES/Other
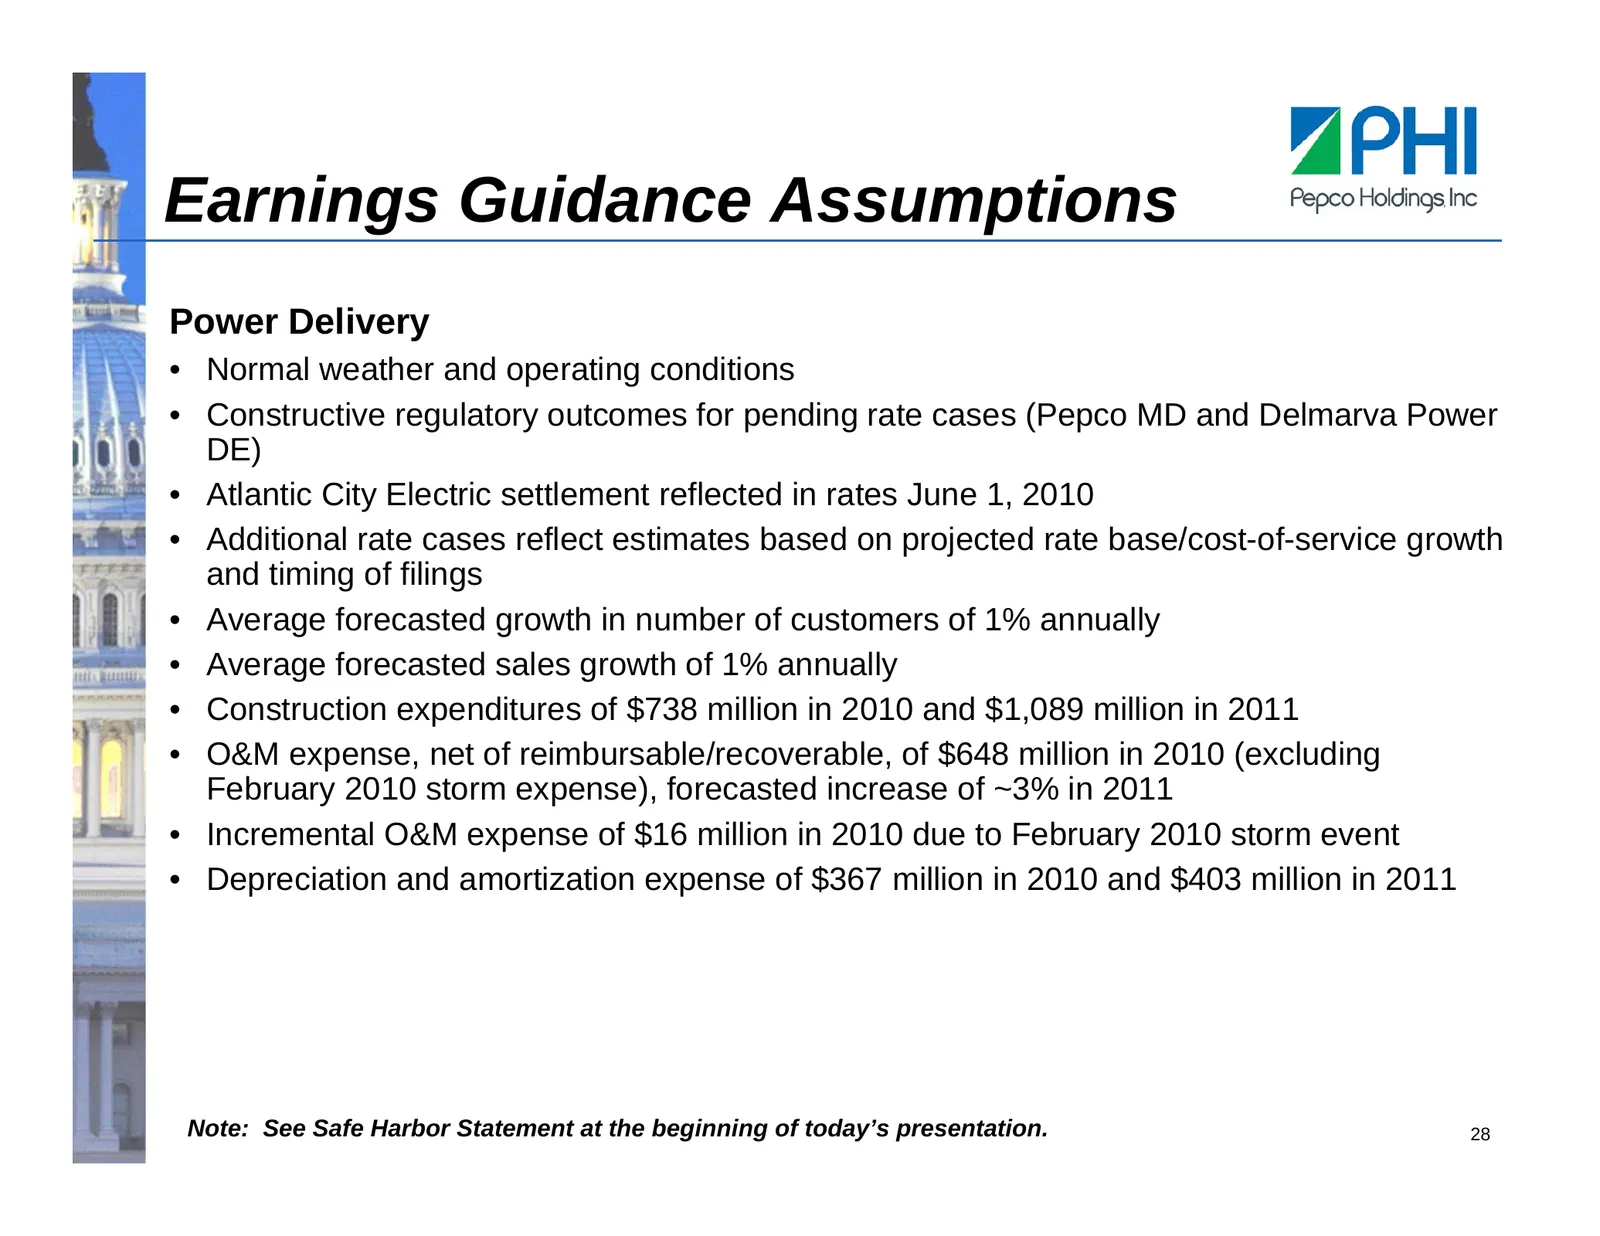
Slide 29: Earnings Guidance Assumptions
Earnings Guidance Assumptions Power Delivery • Normal weather and operating conditions • Constructive regulatory outcomes for pending rate cases (Pepco MD and Delmarva Power DE) • Atlantic City Electric settlement reflected in rates June 1, 2010 • Additional rate cases reflect estimates based on pro
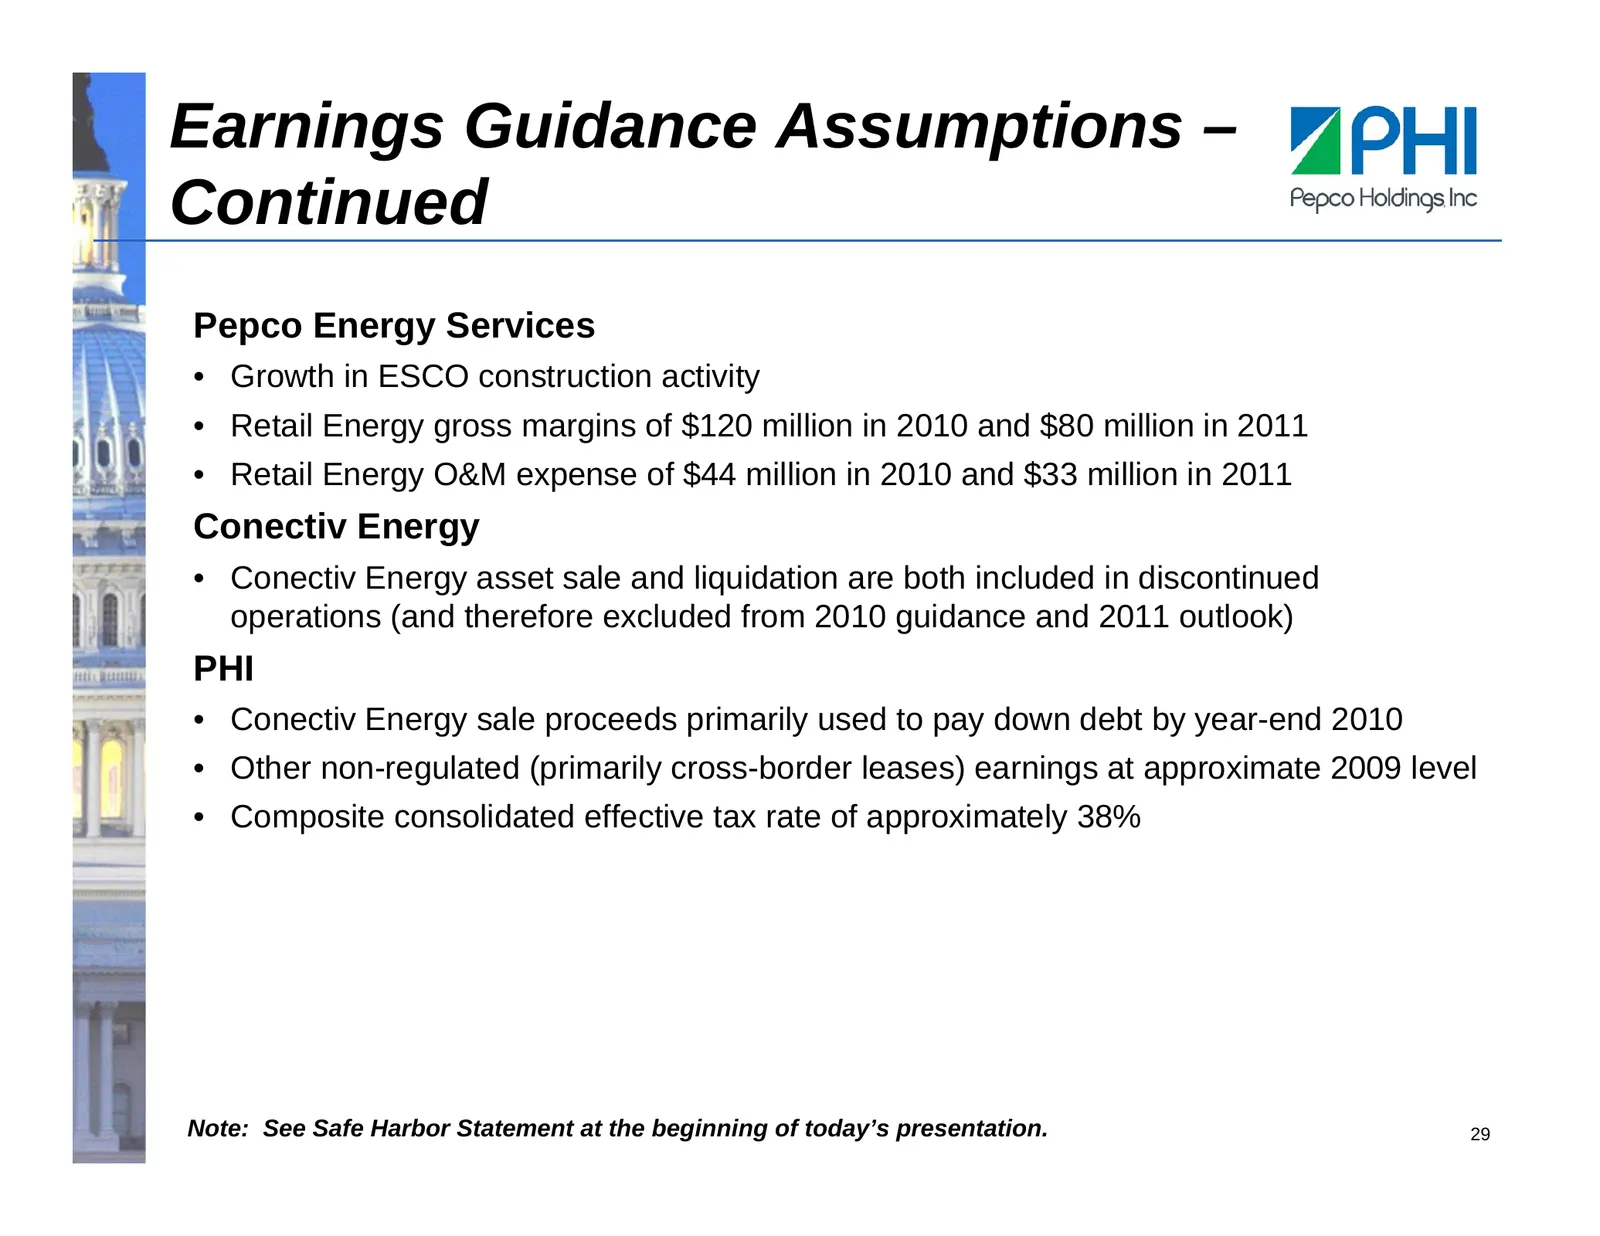
Slide 30: Earnings Guidance Assumptions – Continued
Earnings Guidance Assumptions – Continued Pepco Energy Services • Growth in ESCO construction activity • Retail Energy gross margins of $120 million in 2010 and $80 million in 2011 • Retail Energy O&M expense of $44 million in 2010 and $33 million in 2011 Conectiv Energy • Conectiv Energy asset sale
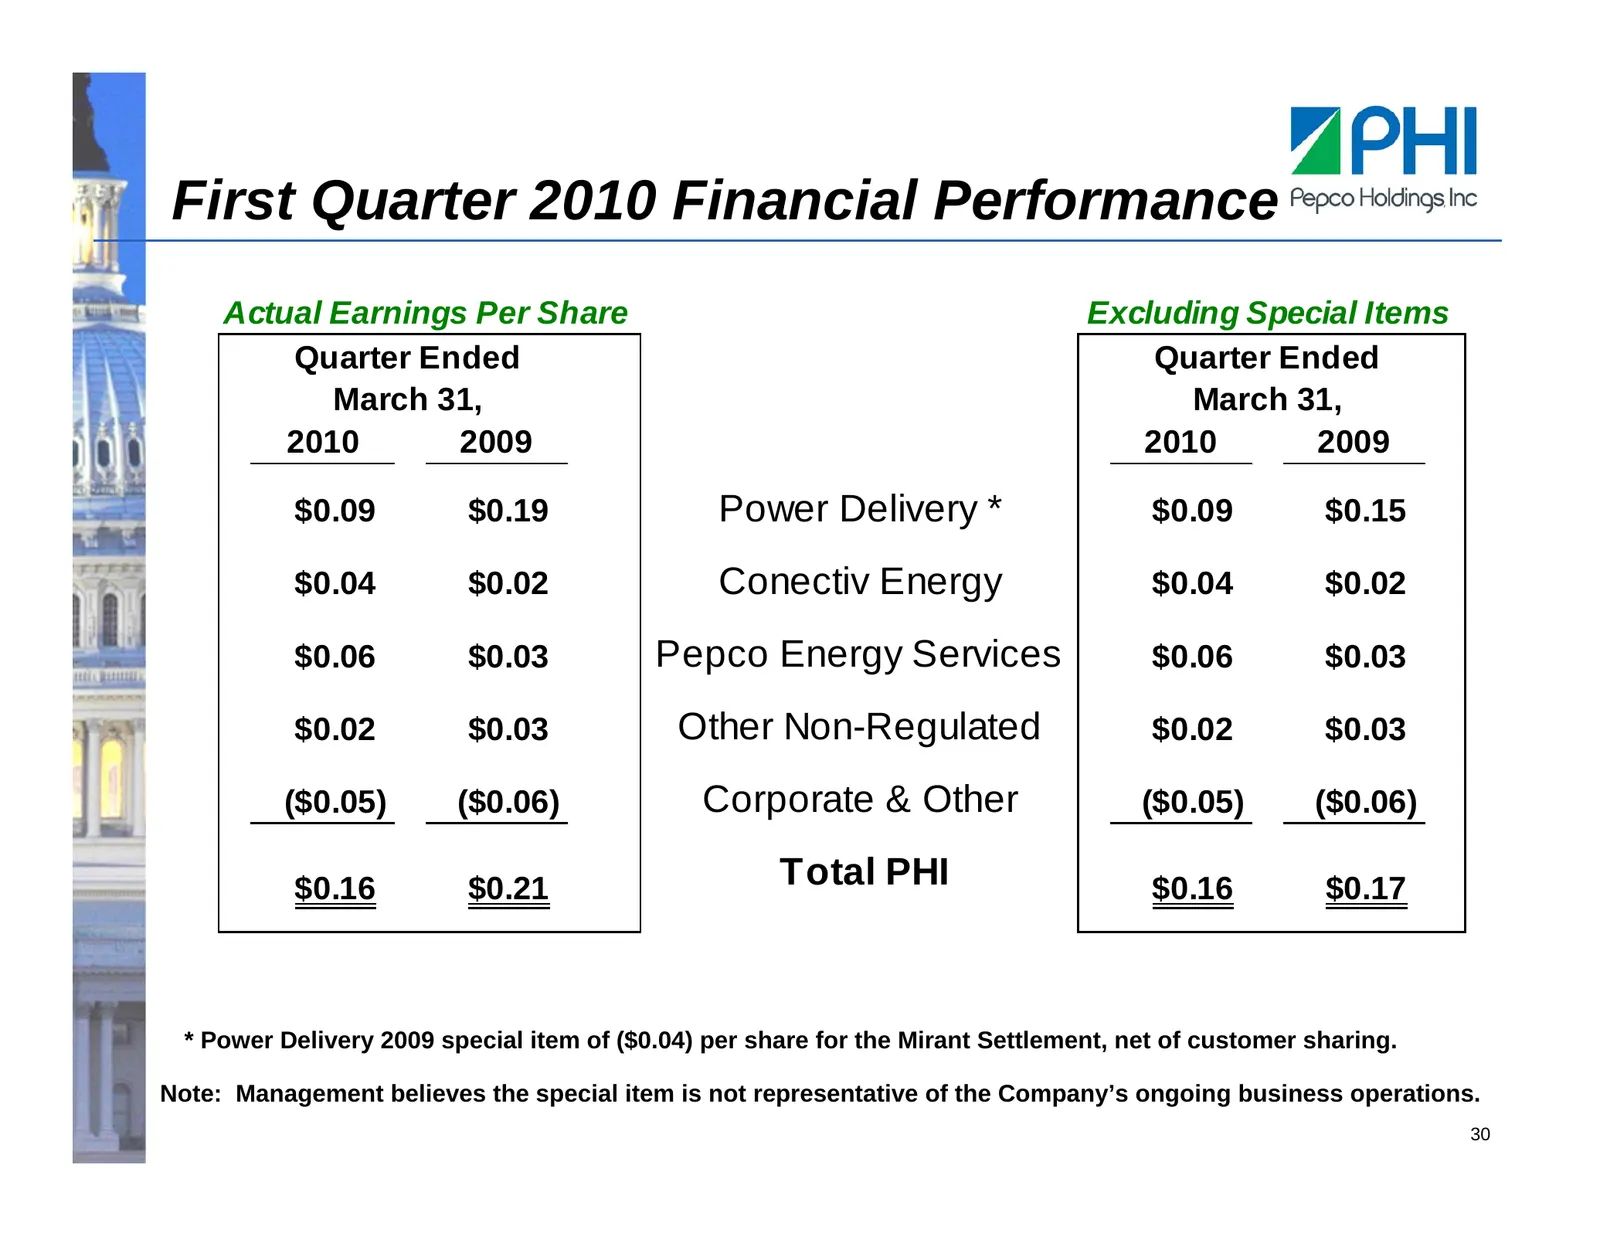
Slide 31: First Quarter 2010 Financial Performance
First Quarter 2010 Financial Performance Actual Earnings Per Share Excluding Special Items Quarter Ended Quarter Ended March 31, March 31, 2010 2009 2010 2009 $0.09 $0.19 Power Delivery * $0.09 $0.15 $0.04 $0.02 Conectiv Energy $0.04 $0.02 $0.06 $0.03 Pepco Energy Services $0.06 $0.03 $0.02 $0.03 Ot
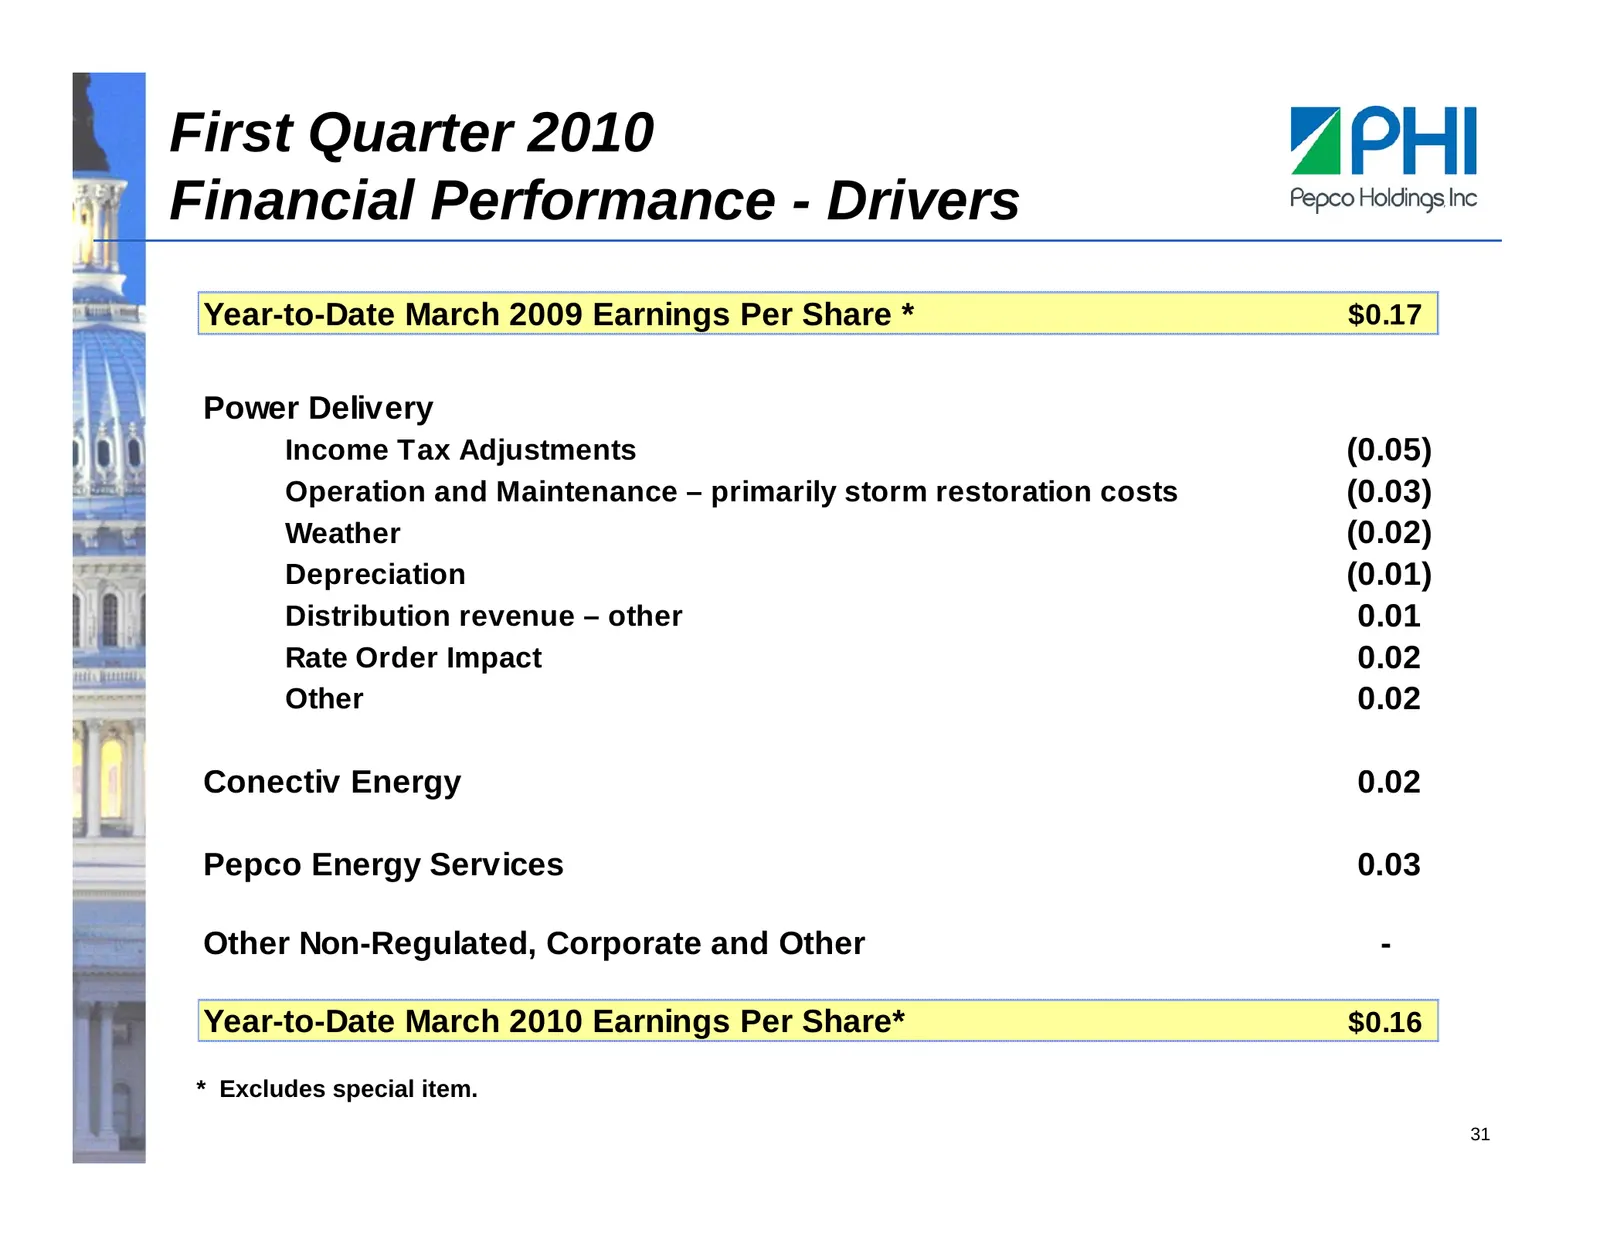
Slide 32: First Quarter 2010 Financial Performance - Drivers
First Quarter 2010 Financial Performance - Drivers Year-to-Date March 2009 Earnings Per Share * $0.17 Power Delivery Income Tax Adjustments (0.05) Operation and Maintenance – primarily storm restoration costs (0.03) Weather (0.02) Depreciation (0.01) Distribution revenue – other 0.01 Rate Order Impa
Source: SEC EDGAR · 8-K filed Jun 22, 2010
More decks from Pepco Holdings Inc
 Merger or Acquisition (August 2014)15 slides · Aug 19, 2014
 Merger or Acquisition (May 2014)44 slides · May 23, 2014
 Q1 2014 Earnings Presentation14 slides · May 7, 2014
 Williams Capital Group Midwest Utilities Seminar (April 2014)35 slides · Apr 9, 2014
 Investor Day (March 2014)109 slides · Mar 21, 2014
 Morgan Stanley Utilities Conference 201439 slides · Feb 28, 2014