CSG N.V. · EURONEXT:CSG
CSG — Q3 2026 Earnings Presentation
30 slides from CSG's earnings presentation, Nov 11, 2026
Slide 1: CSG N.V. Q3 2026 Results Presentation
CSG N.V. Q3 2026 Results Presentation
Slide 2: Disclaimer
Disclaimer This presentation is for information purposes only and is not a recommendation to engage in investment activities and the information, statements and opinions contained in this presentation do not constitute a public offer under any applicable legislation, an offer to sell or solicitation

Slide 3: Presenting Today
Presenting Today Michal Strnad Zdeněk Jurák Chairman of the Member of the Board of Directors Board of Directors CEO & Majority Shareholder Chief Financial Officer 3
Slide 4: Agenda
Agenda Strategic Progress 5 Key highlights 6-11 Business segment review 12-16 Working capital 17 Cash flow and capital structure 18-19 Guidance 20
Slide 5: Delivering on our Commitments
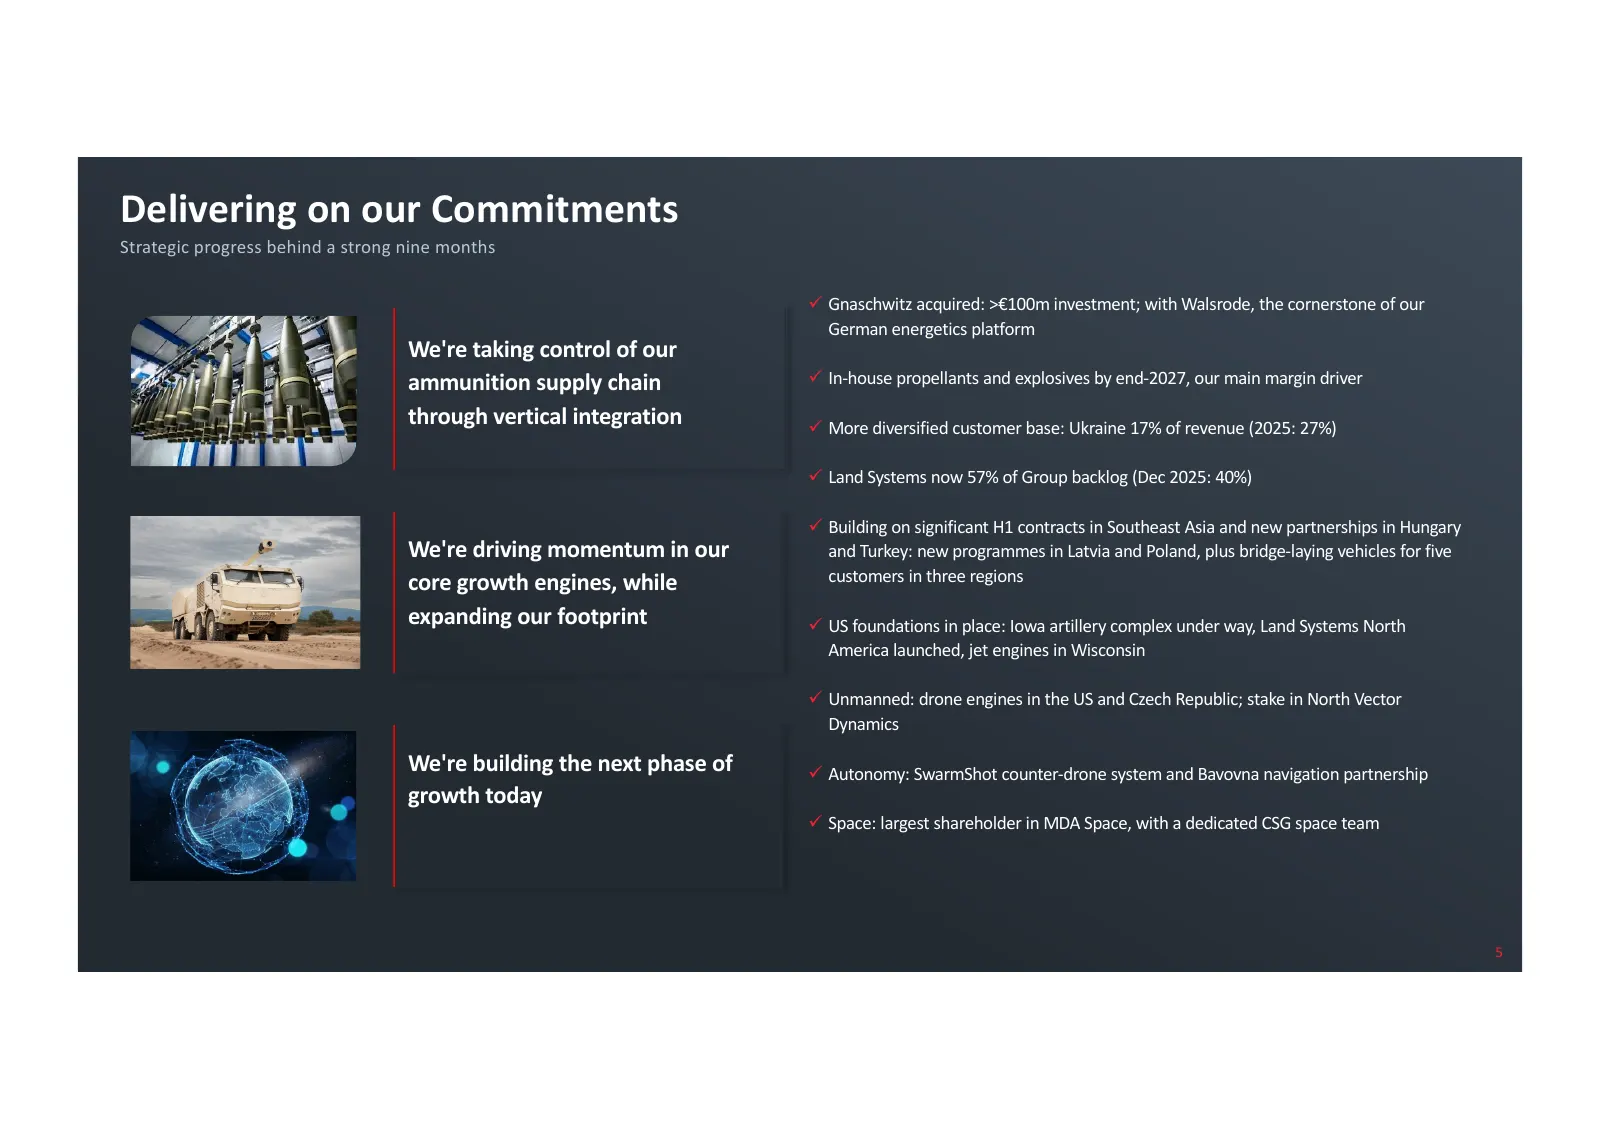
Delivering on our Commitments Strategic progress behind a strong nine months ü Gnaschwitz acquired: >€100m investment; with Walsrode, the cornerstone of our German energetics platform We're taking control of our ammunition supply chain ü In-house propellants and explosives by end-2027, our main marg
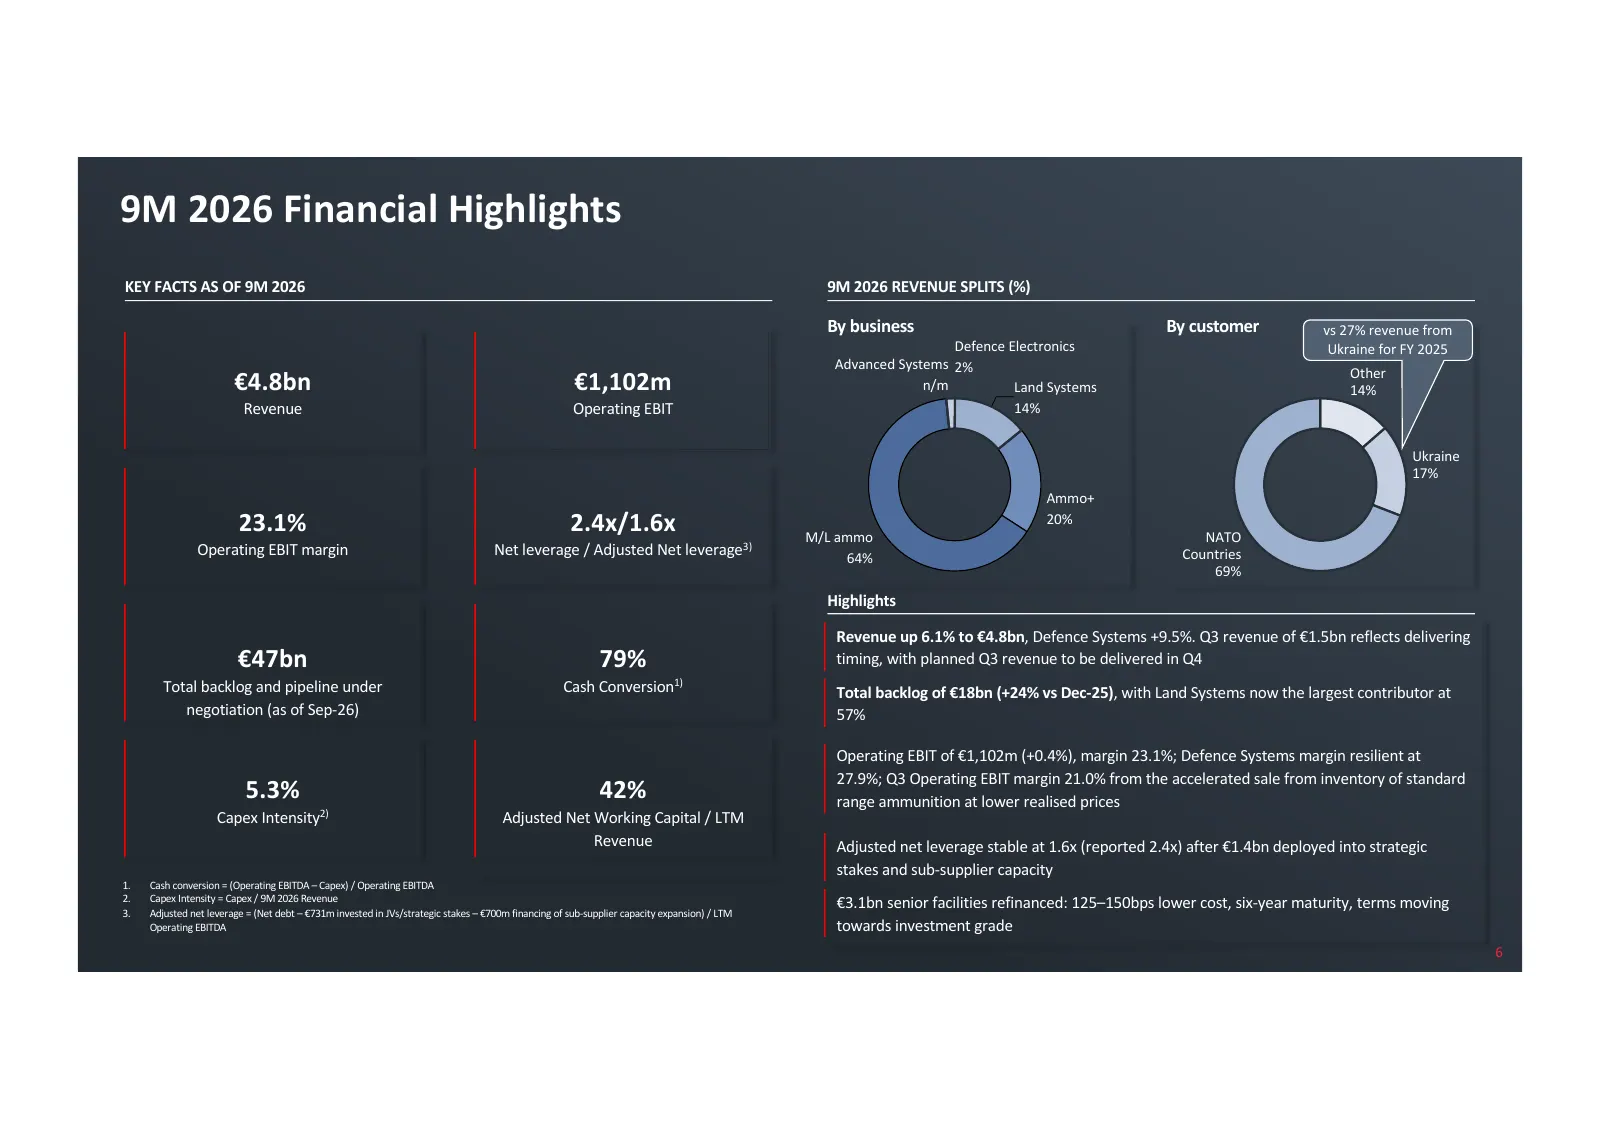
Slide 6: 9M 2026 Financial Highlights
9M 2026 Financial Highlights KEY FACTS AS OF 9M 2026 9M 2026 REVENUE SPLITS (%) By business By customer vs 27% revenue from Defence Electronics Ukraine for FY 2025 Advanced Systems 2% Other €4.8bn €1,102m n/m Land Systems 14% Revenue Operating EBIT 14% Ukraine 17% Ammo+ 23.1% 2.4x/1.6x M/L ammo 20%
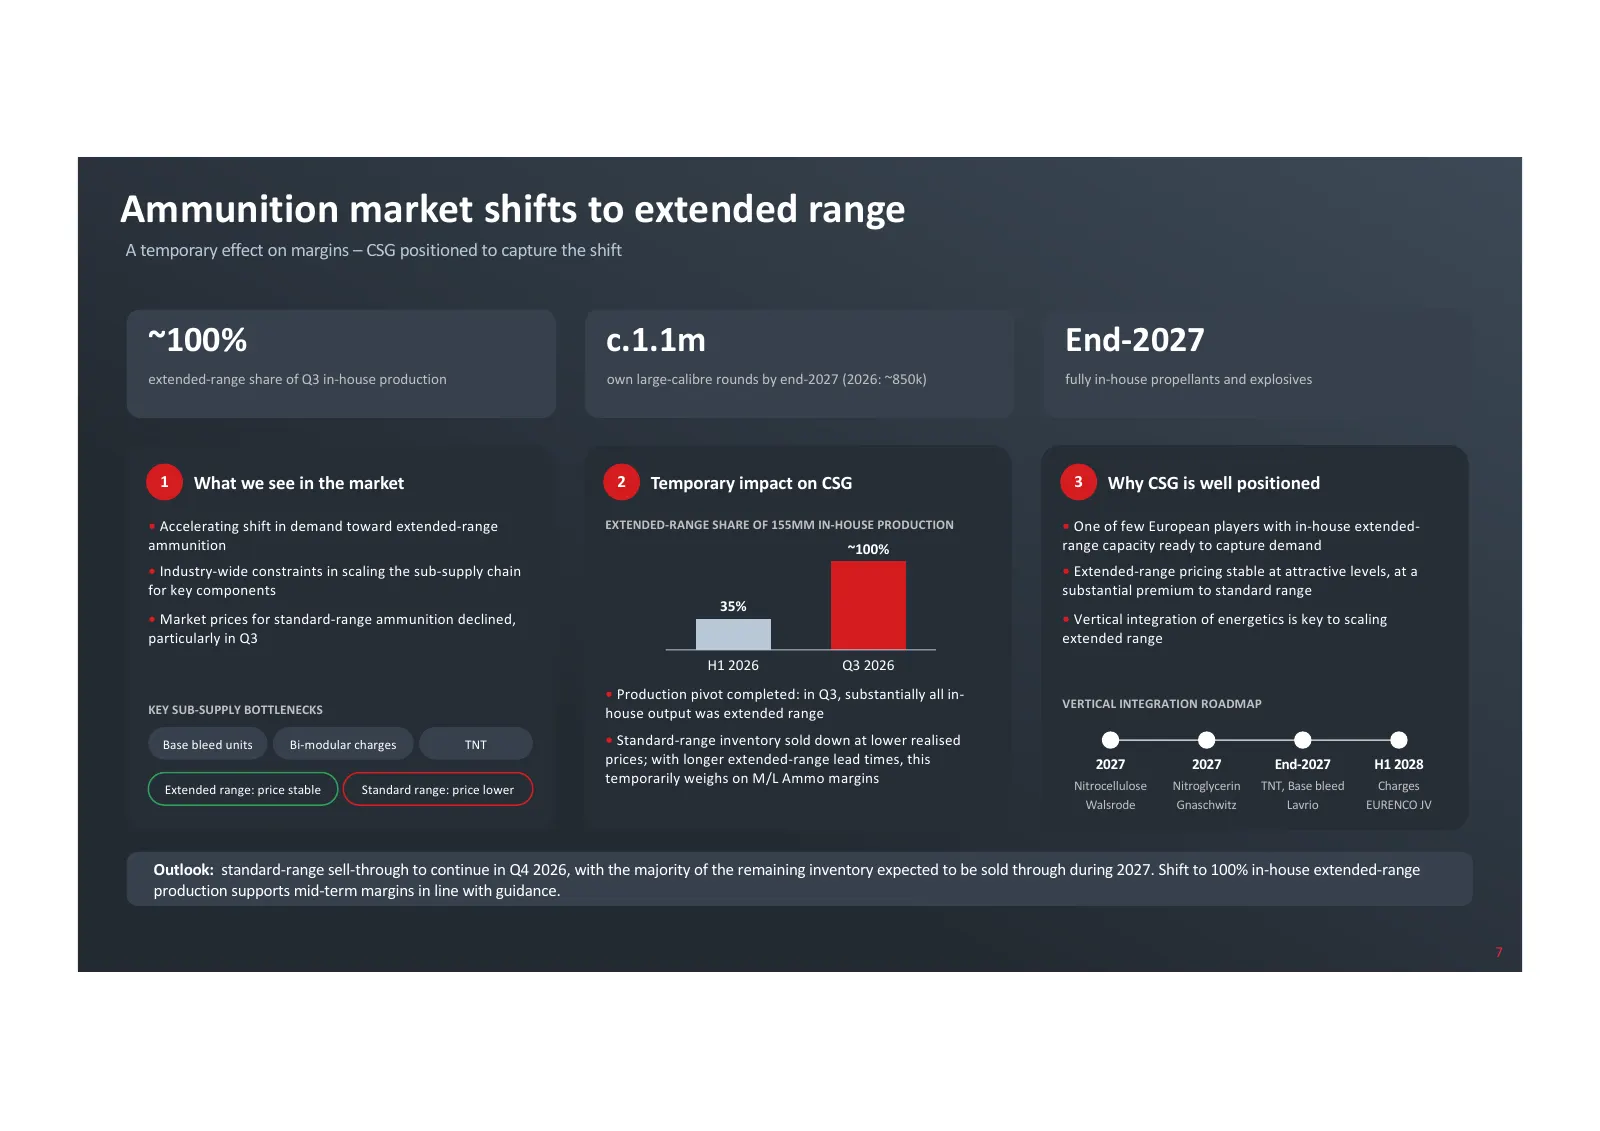
Slide 7: Ammunition market shifts to extended range
Ammunition market shifts to extended range A temporary effect on margins – CSG positioned to capture the shift ~100% c.1.1m End-2027 extended-range share of Q3 in-house production own large-calibre rounds by end-2027 (2026: ~850k) fully in-house propellants and explosives 1 What we see in the market
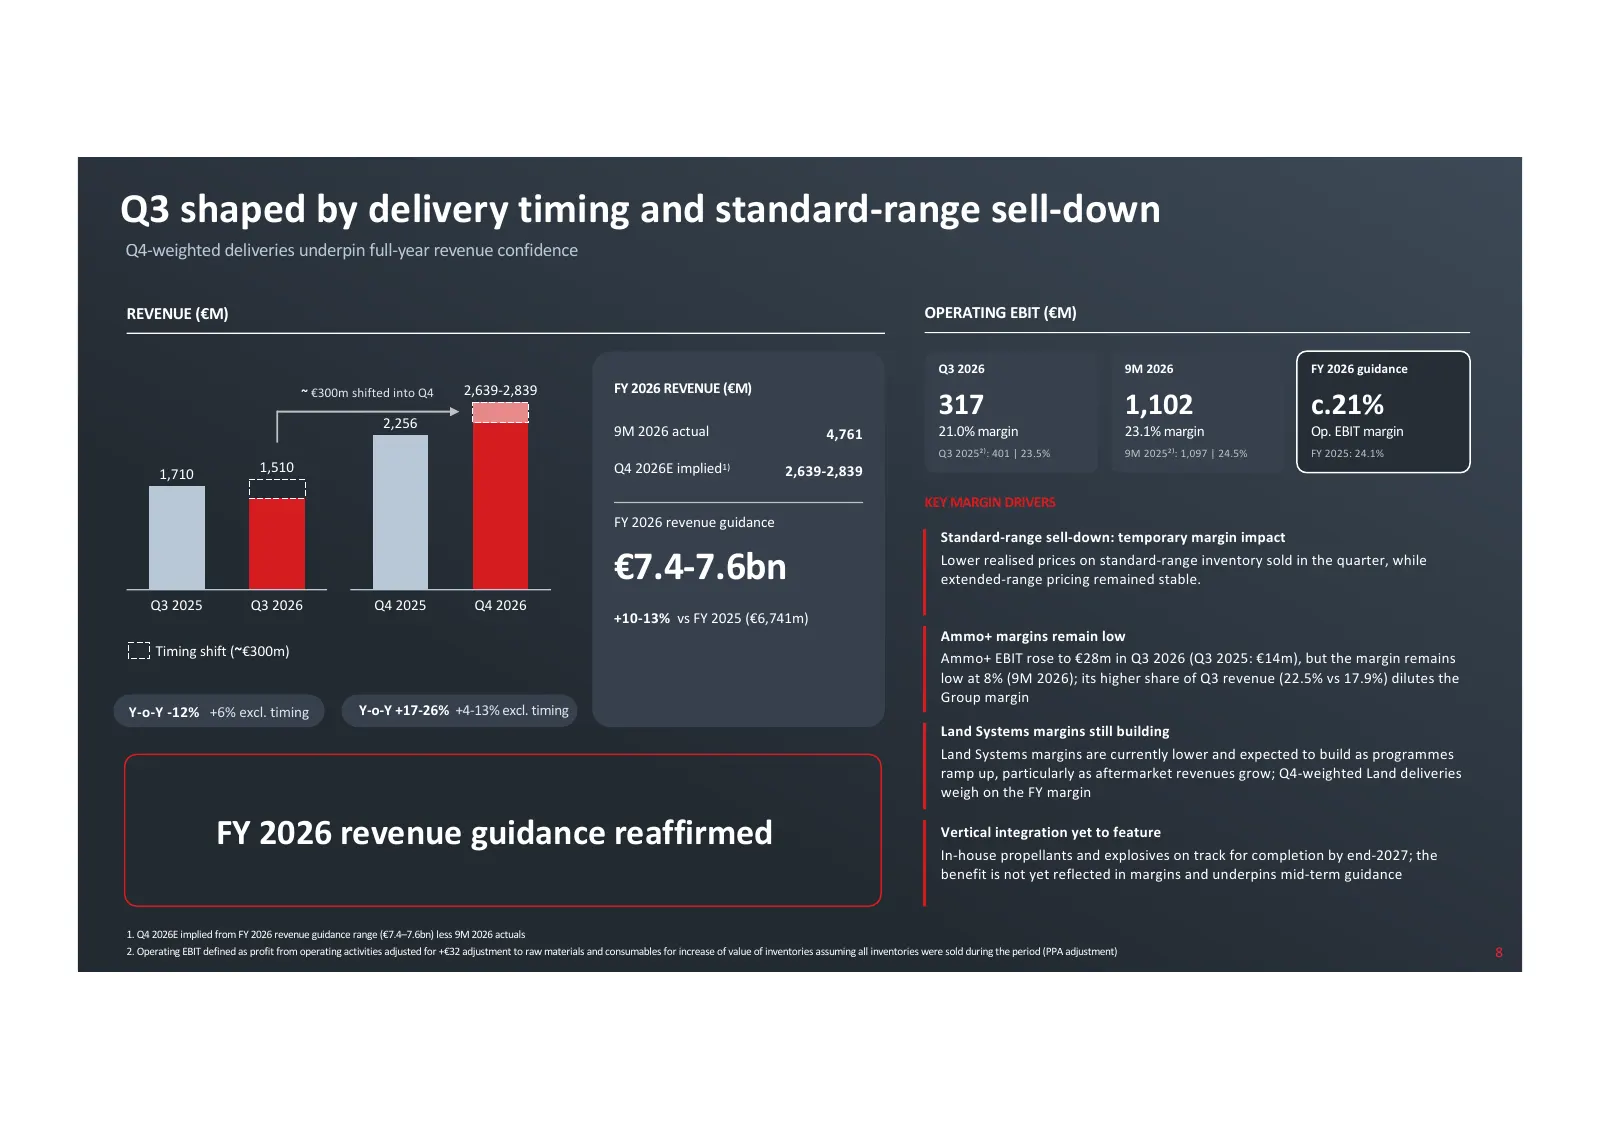
Slide 8: Q3 shaped by delivery timing and standard-range sell-down
Q3 shaped by delivery timing and standard-range sell-down Q4-weighted deliveries underpin full-year revenue confidence REVENUE (€M) OPERATING EBIT (€M) Q3 2026 9M 2026 FY 2026 guidance ~ €300m shifted into Q4 2,639-2,839 FY 2026 REVENUE (€M) 2,256 317 1,102 c.21% 9M 2026 actual 4,761 21.0% margin 23
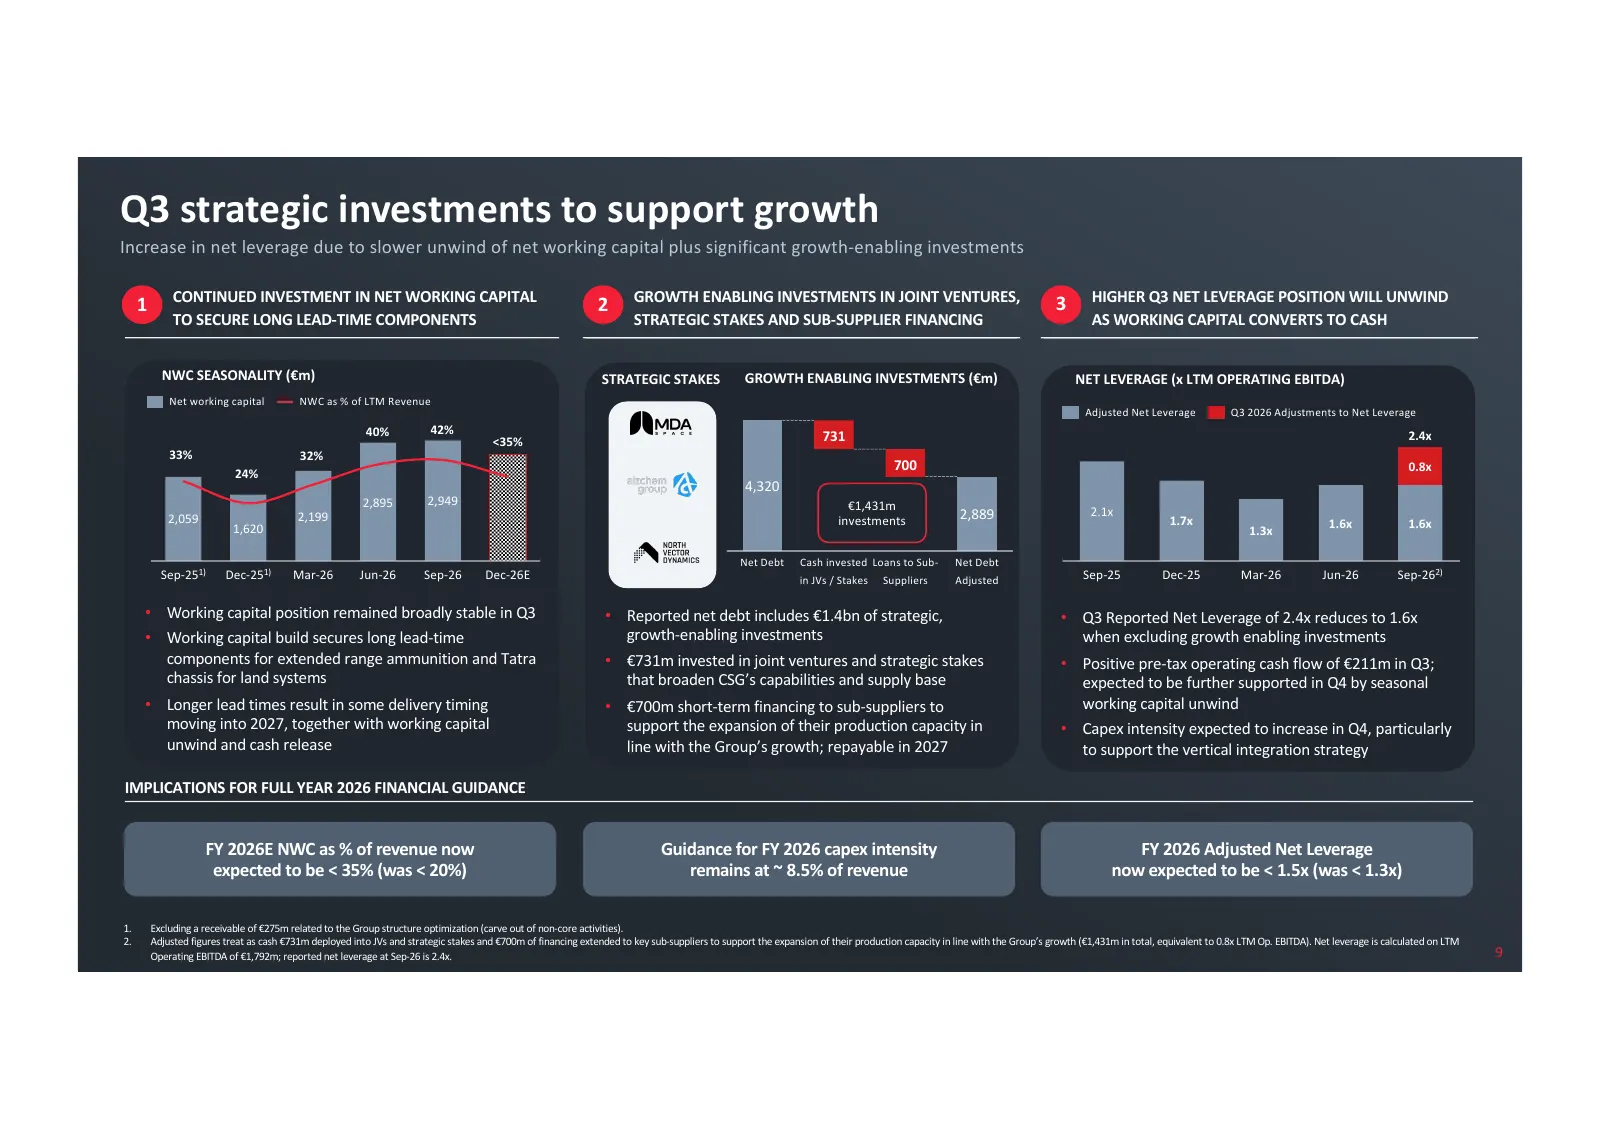
Slide 9: Q3 strategic investments to support growth
Q3 strategic investments to support growth Increase in net leverage due to slower unwind of net working capital plus significant growth-enabling investments CONTINUED INVESTMENT IN NET WORKING CAPITAL GROWTH ENABLING INVESTMENTS IN JOINT VENTURES, 3 HIGHER Q3 NET LEVERAGE POSITION WILL UNWIND 1 2 TO
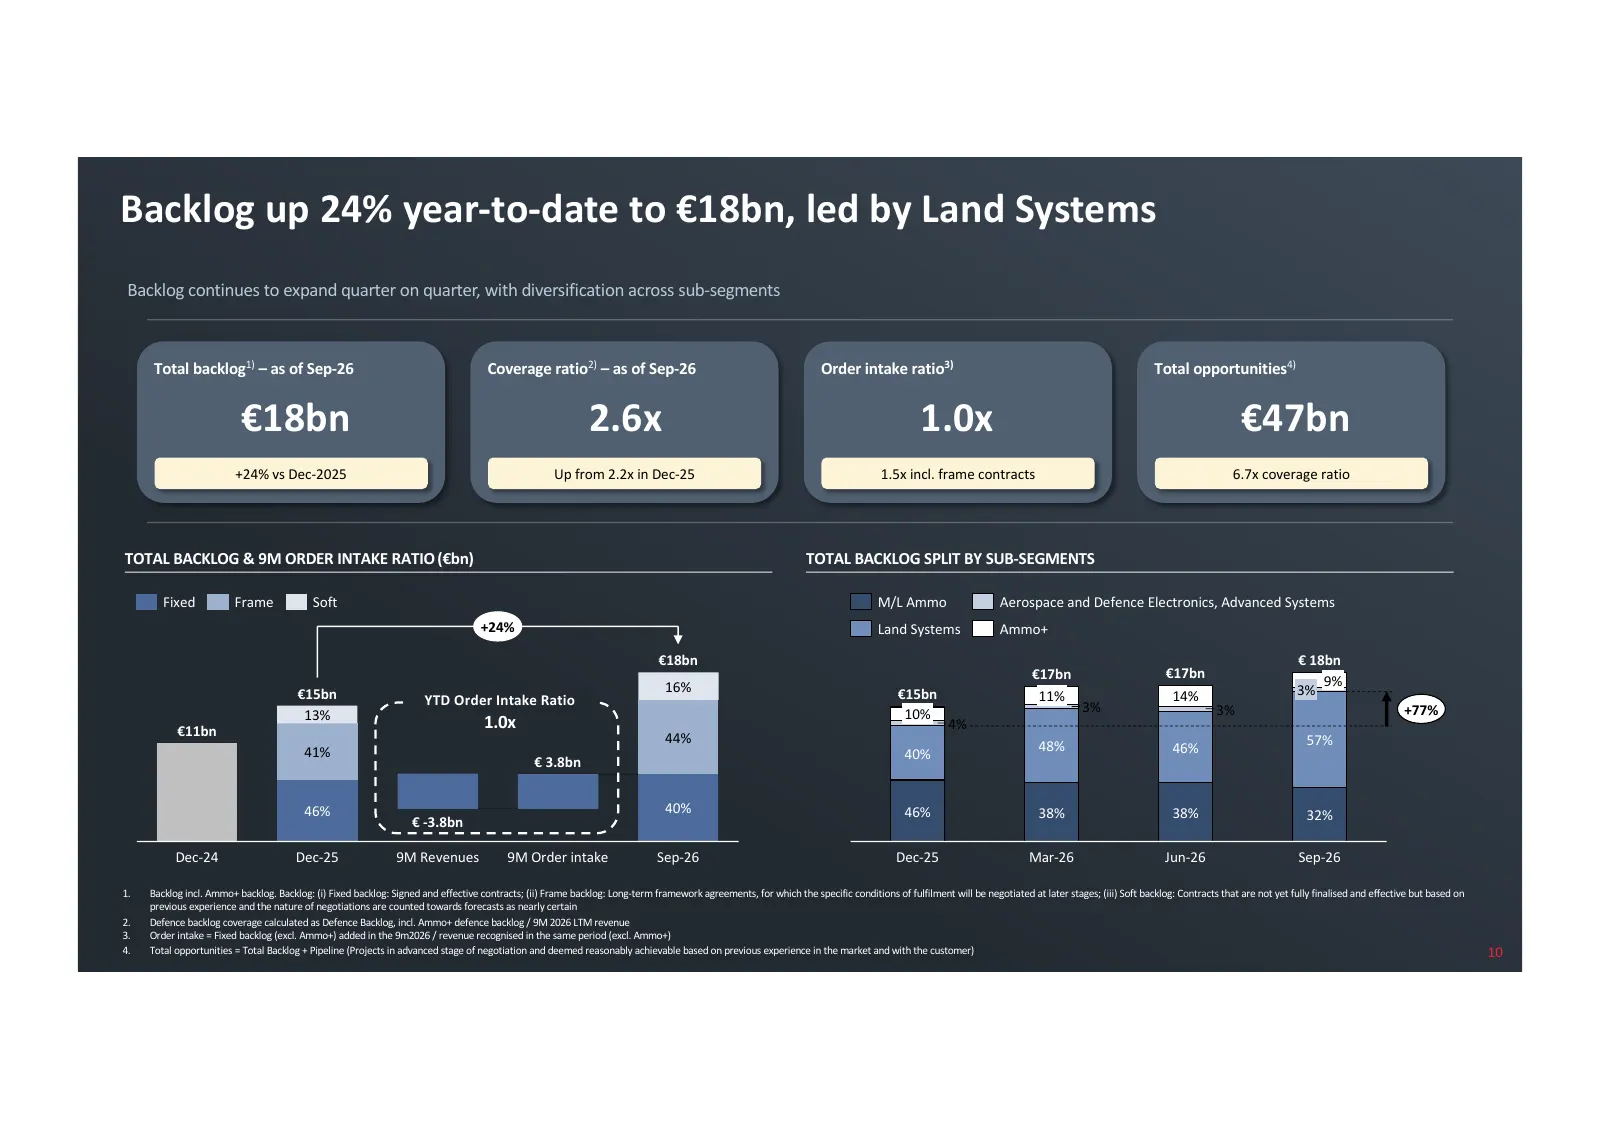
Slide 10: Backlog up 24% year-to-date to €18bn, led by Land Systems
Backlog up 24% year-to-date to €18bn, led by Land Systems Backlog continues to expand quarter on quarter, with diversification across sub-segments Total backlog1) – as of Sep-26 Coverage ratio2) – as of Sep-26 Order intake ratio3) Total opportunities4) €18bn 2.6x 1.0x €47bn +24% vs Dec-2025 Up from
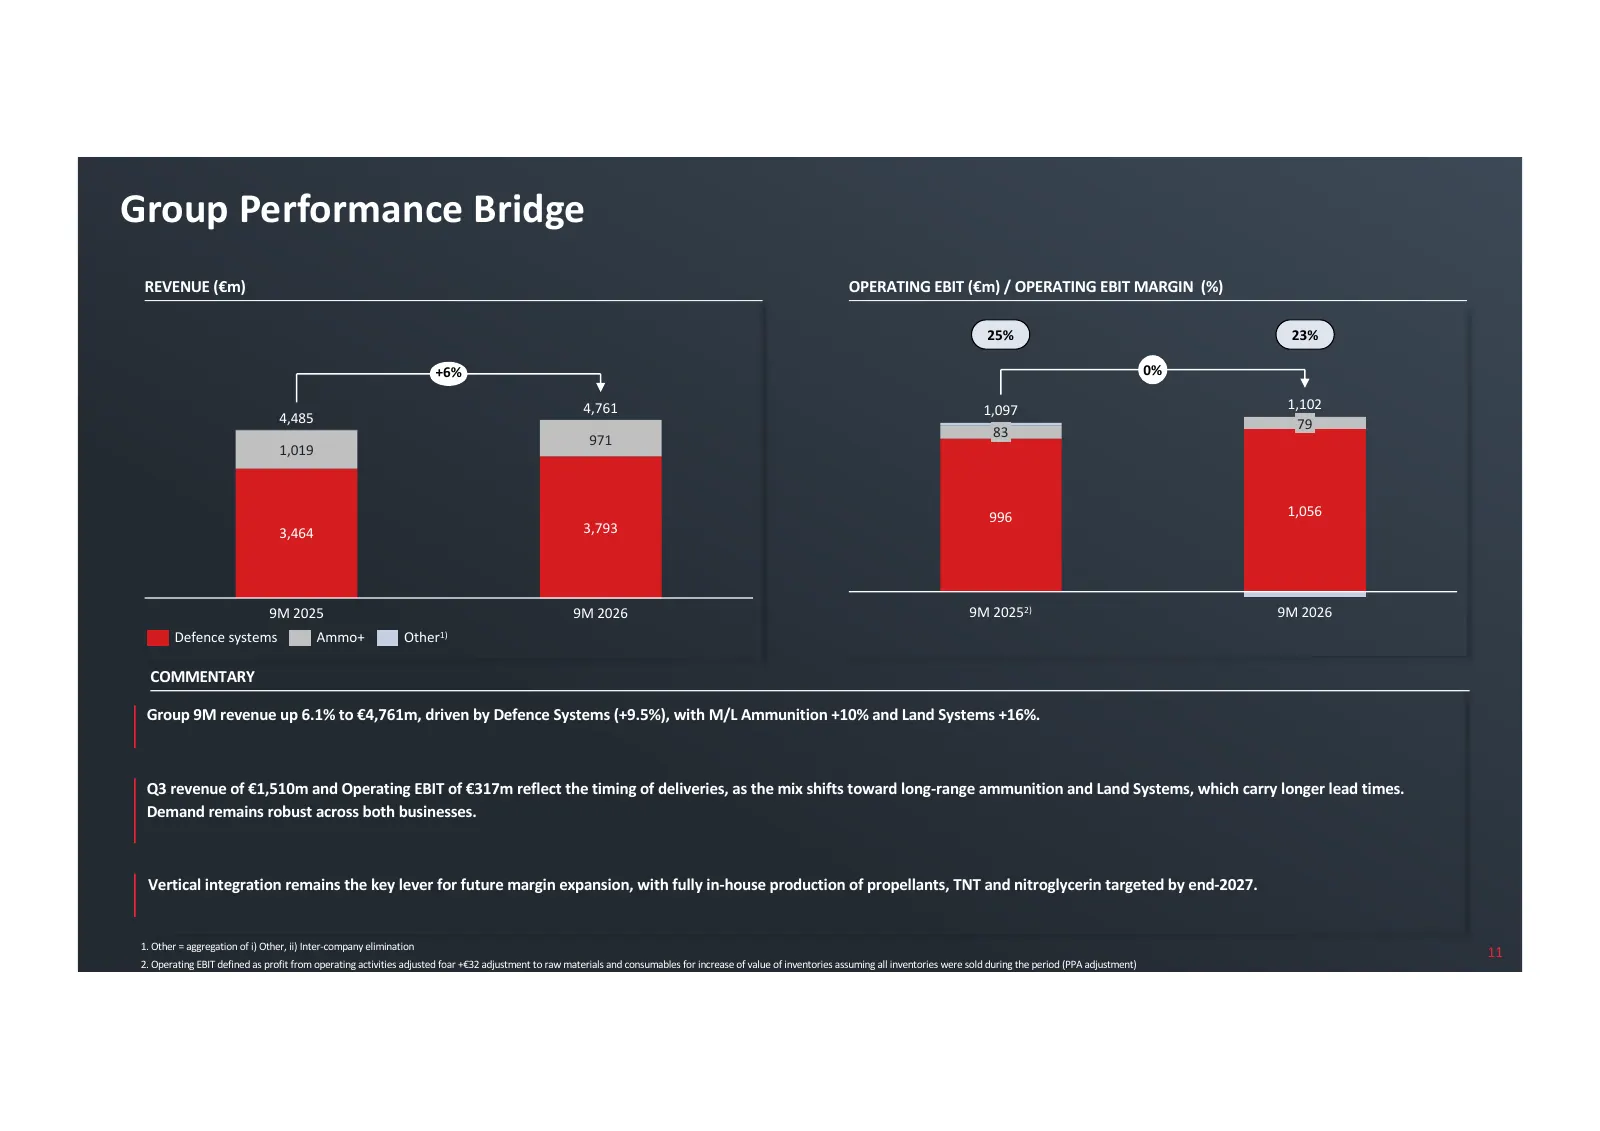
Slide 11: Group Performance Bridge
Group Performance Bridge REVENUE (€m) OPERATING EBIT (€m) / OPERATING EBIT MARGIN (%) 25% 23% +6% 0% 4,761 1,097 1,102 4,485 79 971 83 1,019 996 1,056 3,464 3,793 9M 2025 9M 2026 9M 20252) 9M 2026 Defence systems Ammo+ Other1) COMMENTARY Group 9M revenue up 6.1% to €4,761m, driven by Defence Systems
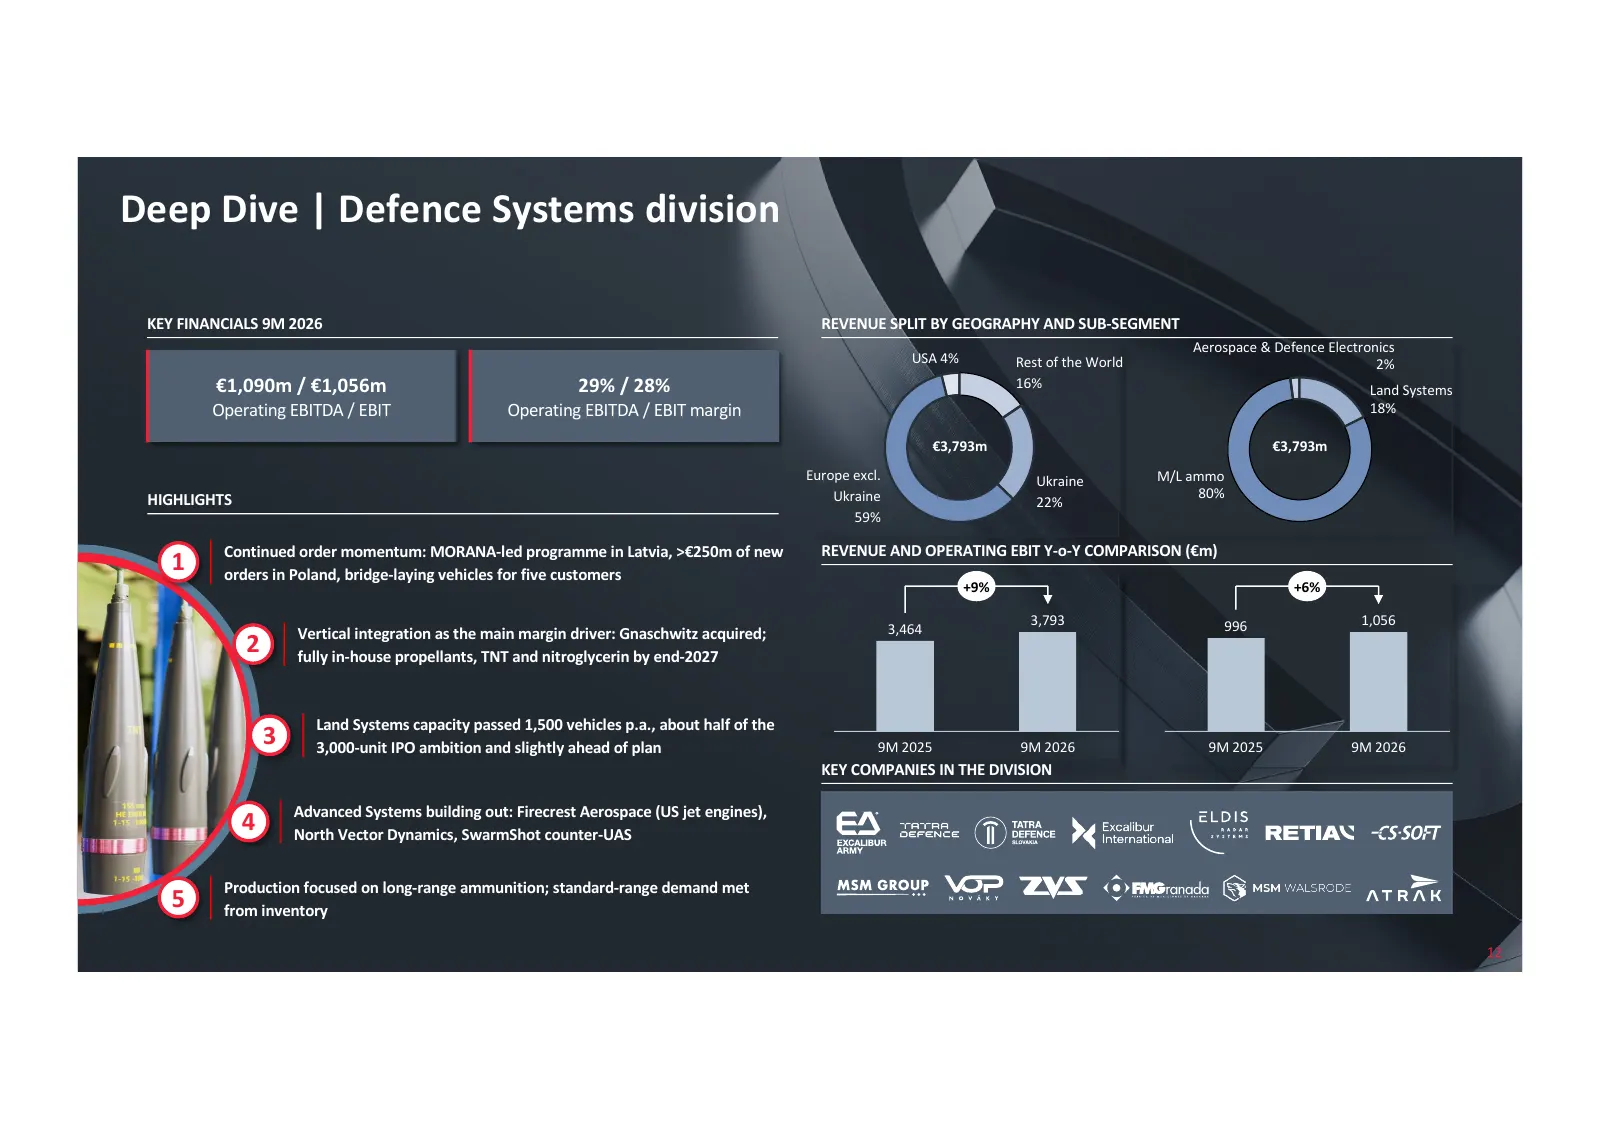
Slide 12: Deep Dive | Defence Systems division
Deep Dive | Defence Systems division KEY FINANCIALS 9M 2026 REVENUE SPLIT BY GEOGRAPHY AND SUB-SEGMENT Aerospace & Defence Electronics USA 4% Rest of the World 2% €1,090m / €1,056m 29% / 28% 16% Land Systems Operating EBITDA / EBIT Operating EBITDA / EBIT margin 18% €3,793m €3,793m Europe excl. Ukra
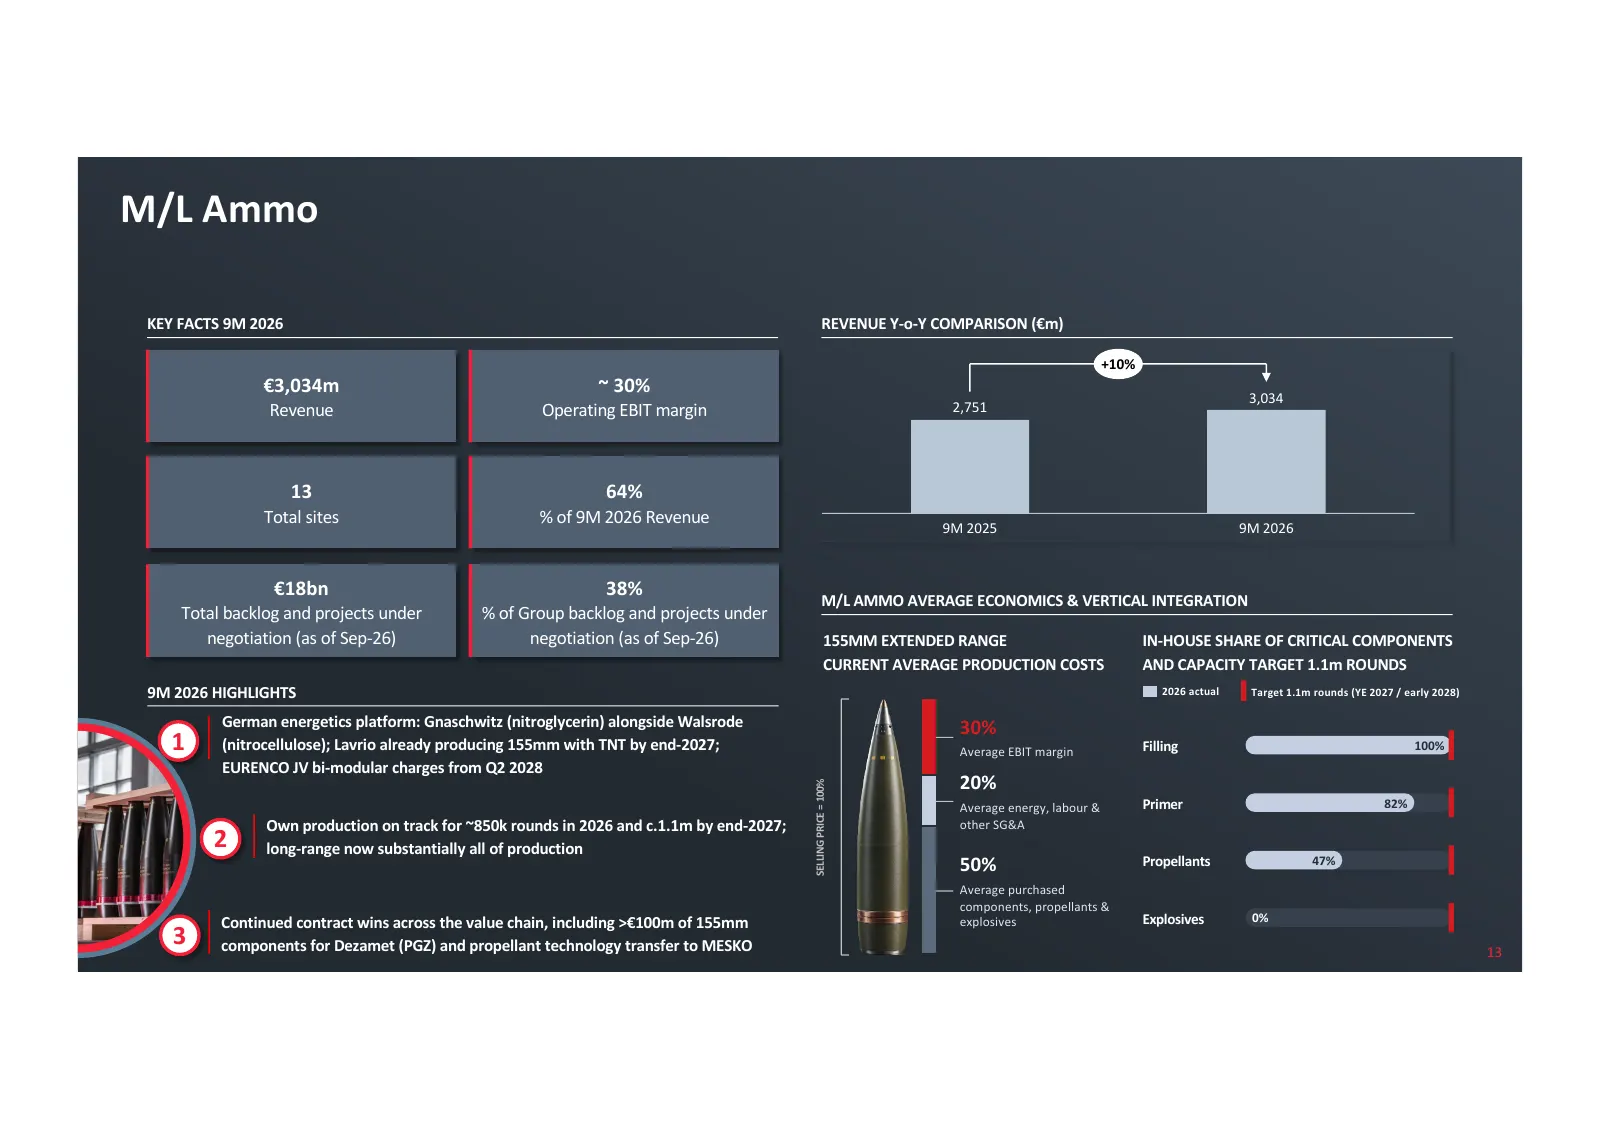
Slide 13: M/L Ammo
M/L Ammo KEY FACTS 9M 2026 REVENUE Y-o-Y COMPARISON (€m) +10% €3,034m ~ 30% 3,034 Revenue Operating EBIT margin 2,751 13 64% Total sites % of 9M 2026 Revenue 9M 2025 9M 2026 €18bn 38% M/L AMMO AVERAGE ECONOMICS & VERTICAL INTEGRATION Total backlog and projects under % of Group backlog and projects u
Slide 14: Land Systems
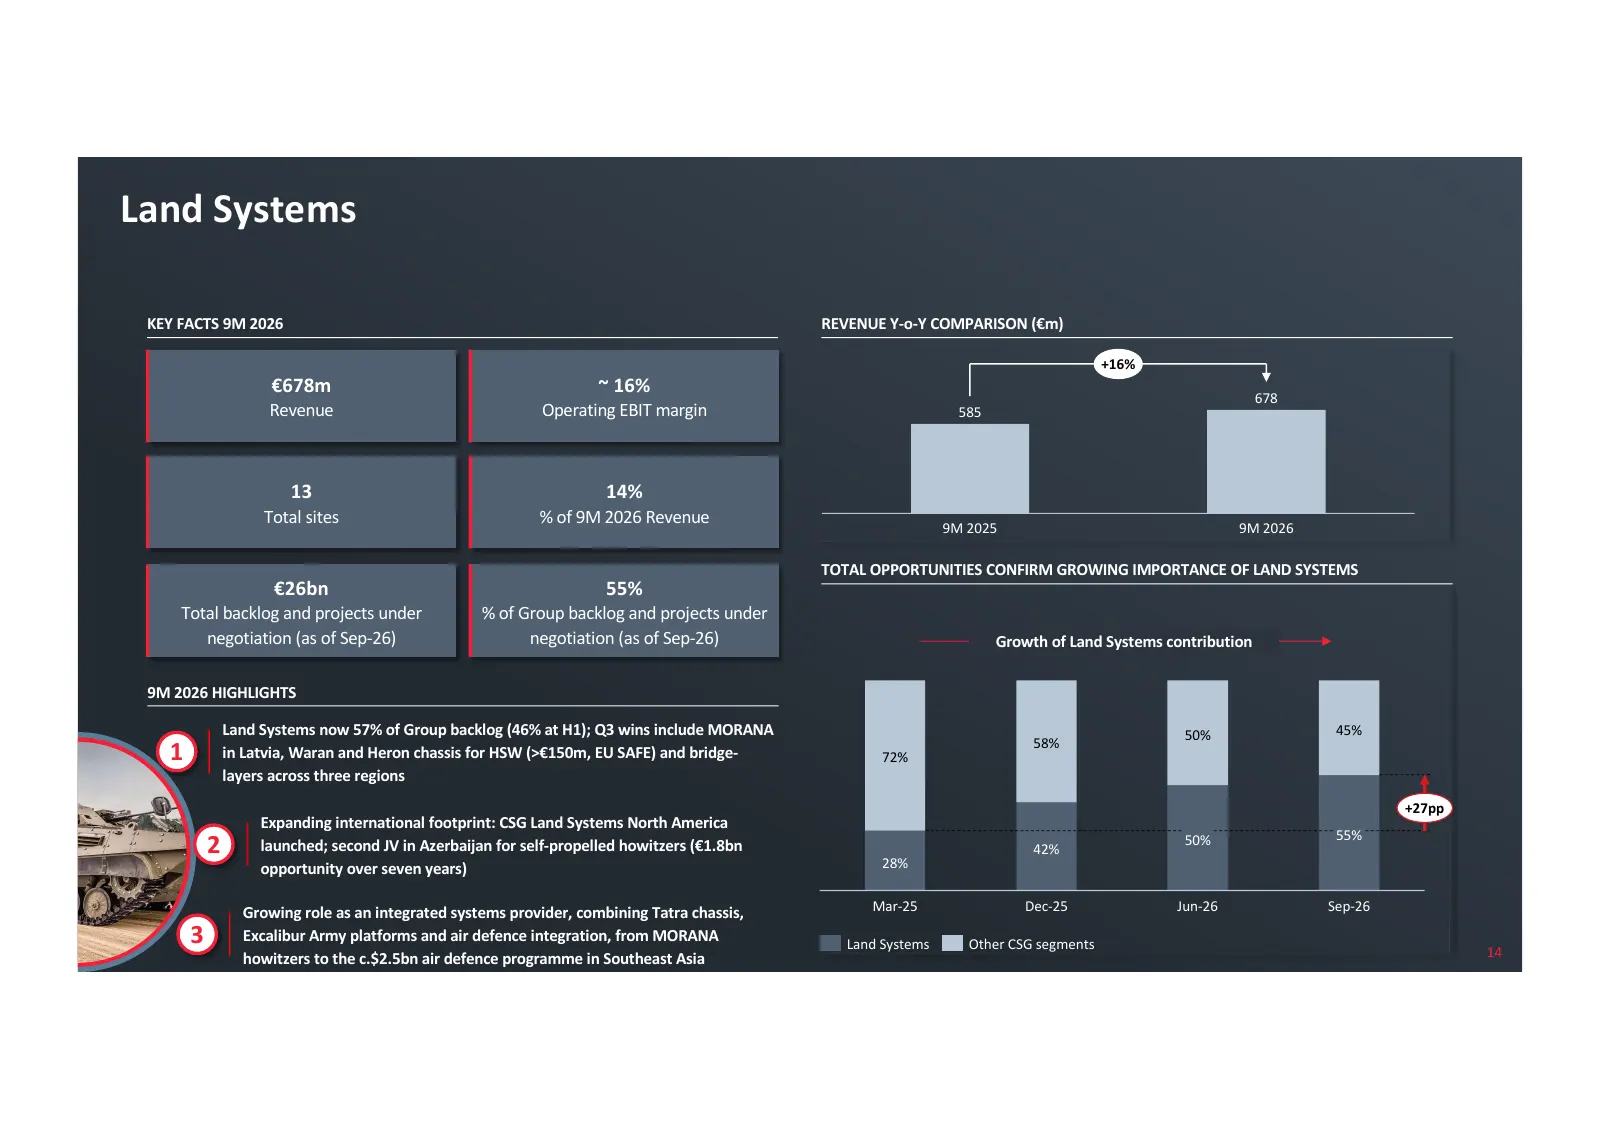
Land Systems KEY FACTS 9M 2026 REVENUE Y-o-Y COMPARISON (€m) +16% €678m ~ 16% 678 Revenue Operating EBIT margin 585 13 14% Total sites % of 9M 2026 Revenue 9M 2025 9M 2026 TOTAL OPPORTUNITIES CONFIRM GROWING IMPORTANCE OF LAND SYSTEMS €26bn 55% Total backlog and projects under % of Group backlog and
Slide 15: Aerospace & Defence Electronics / Advanced Systems
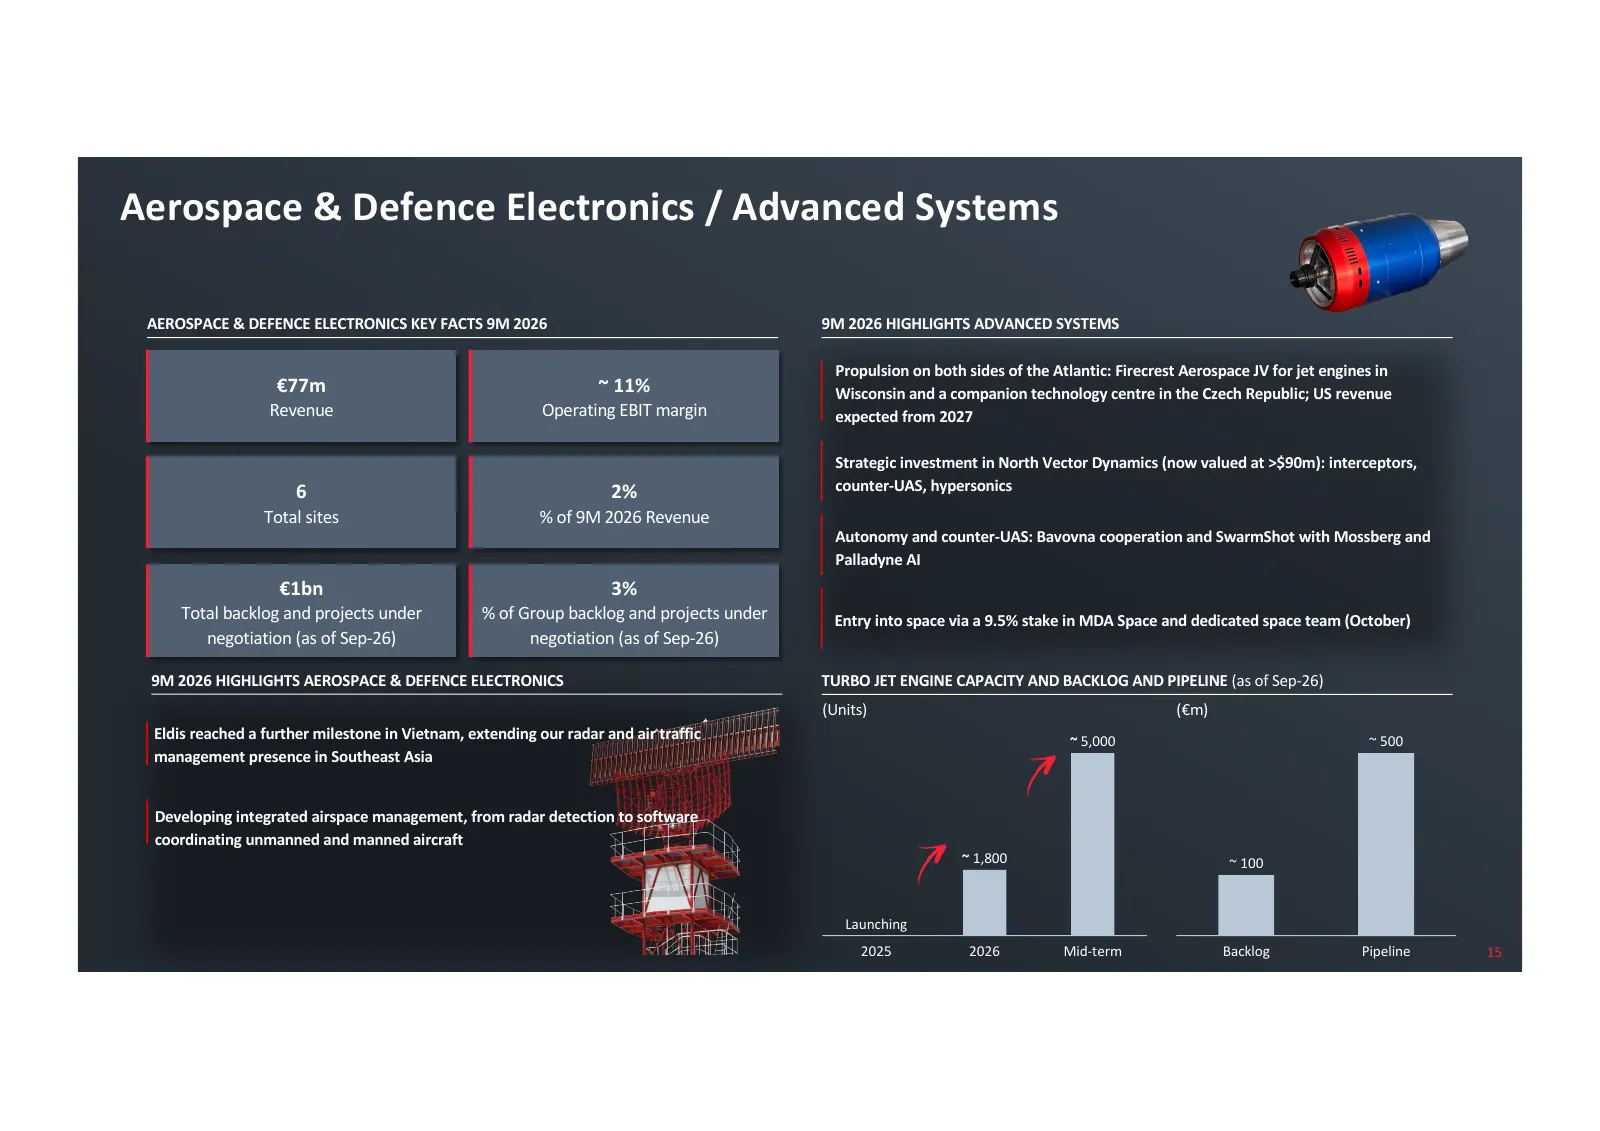
Aerospace & Defence Electronics / Advanced Systems AEROSPACE & DEFENCE ELECTRONICS KEY FACTS 9M 2026 9M 2026 HIGHLIGHTS ADVANCED SYSTEMS Propulsion on both sides of the Atlantic: Firecrest Aerospace JV for jet engines in €77m ~ 11% Wisconsin and a companion technology centre in the Czech Republic; U
Slide 16: Deep Dive | Ammo+ division
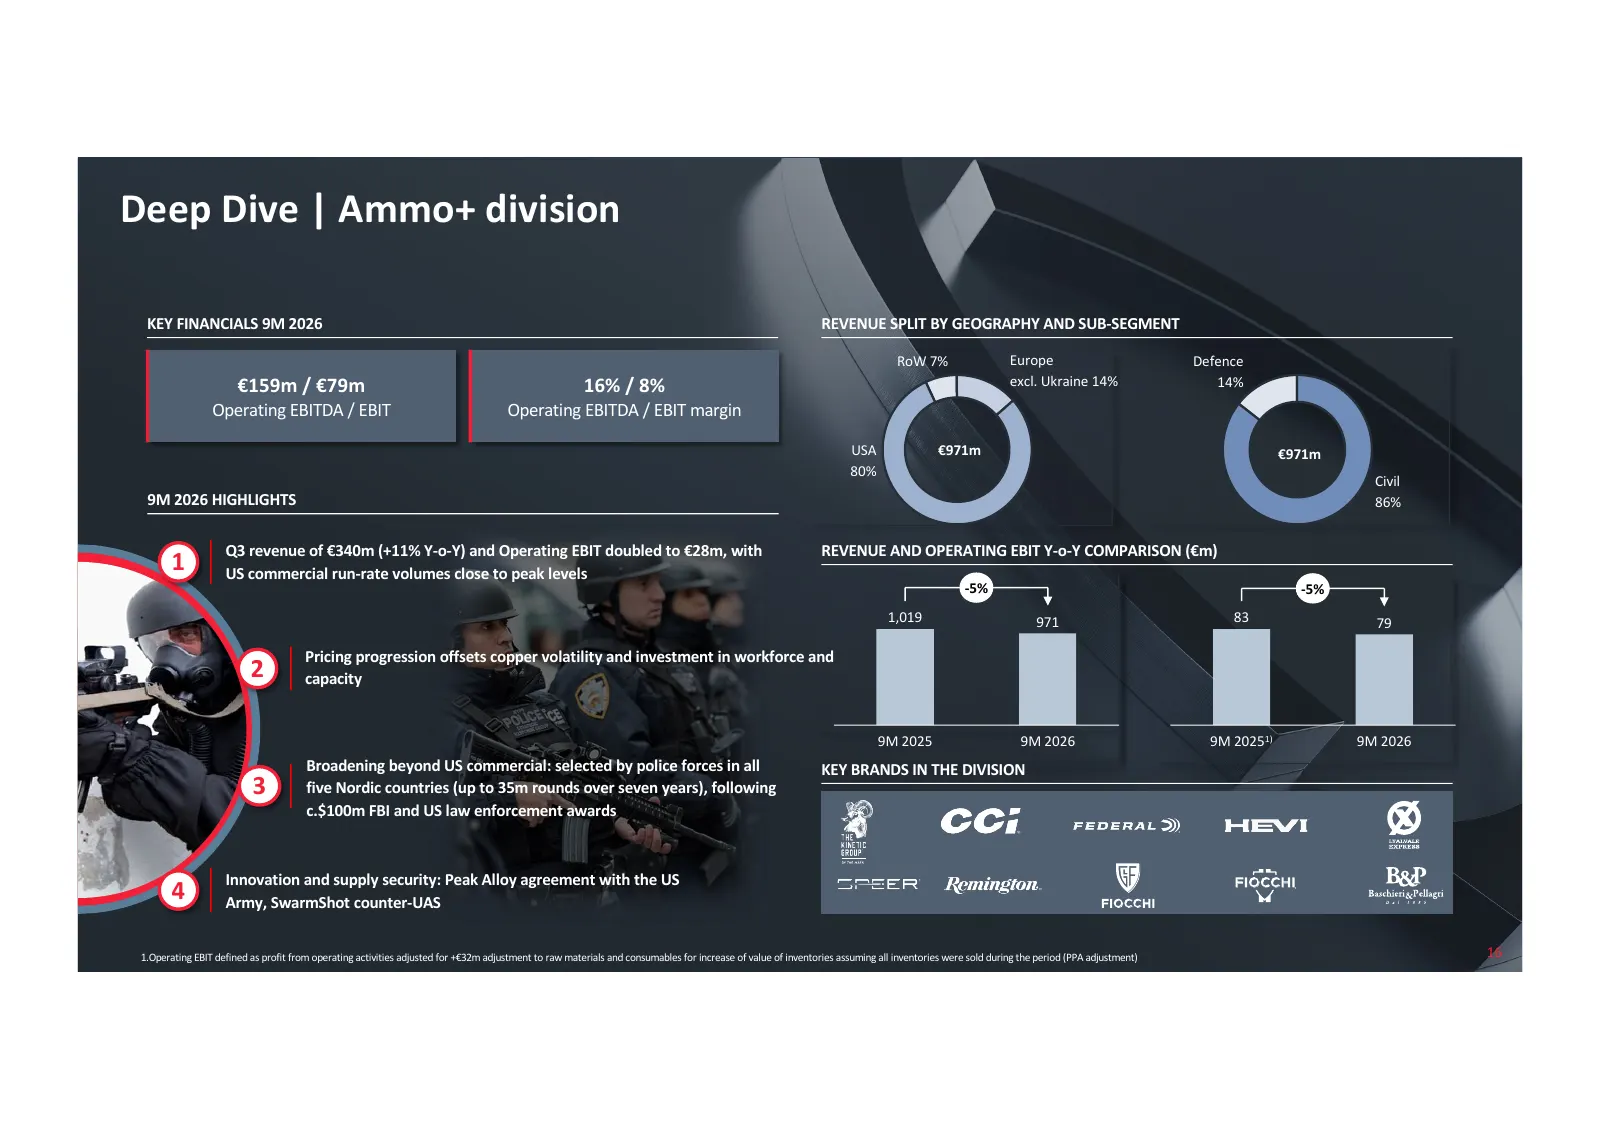
Deep Dive | Ammo+ division KEY FINANCIALS 9M 2026 REVENUE SPLIT BY GEOGRAPHY AND SUB-SEGMENT RoW 7% Europe Defence €159m / €79m 16% / 8% excl. Ukraine 14% 14% Operating EBITDA / EBIT Operating EBITDA / EBIT margin USA €971m €971m 80% Civil 9M 2026 HIGHLIGHTS 86% Q3 revenue of €340m (+11% Y-o-Y) and
Slide 17: Net Working Capital
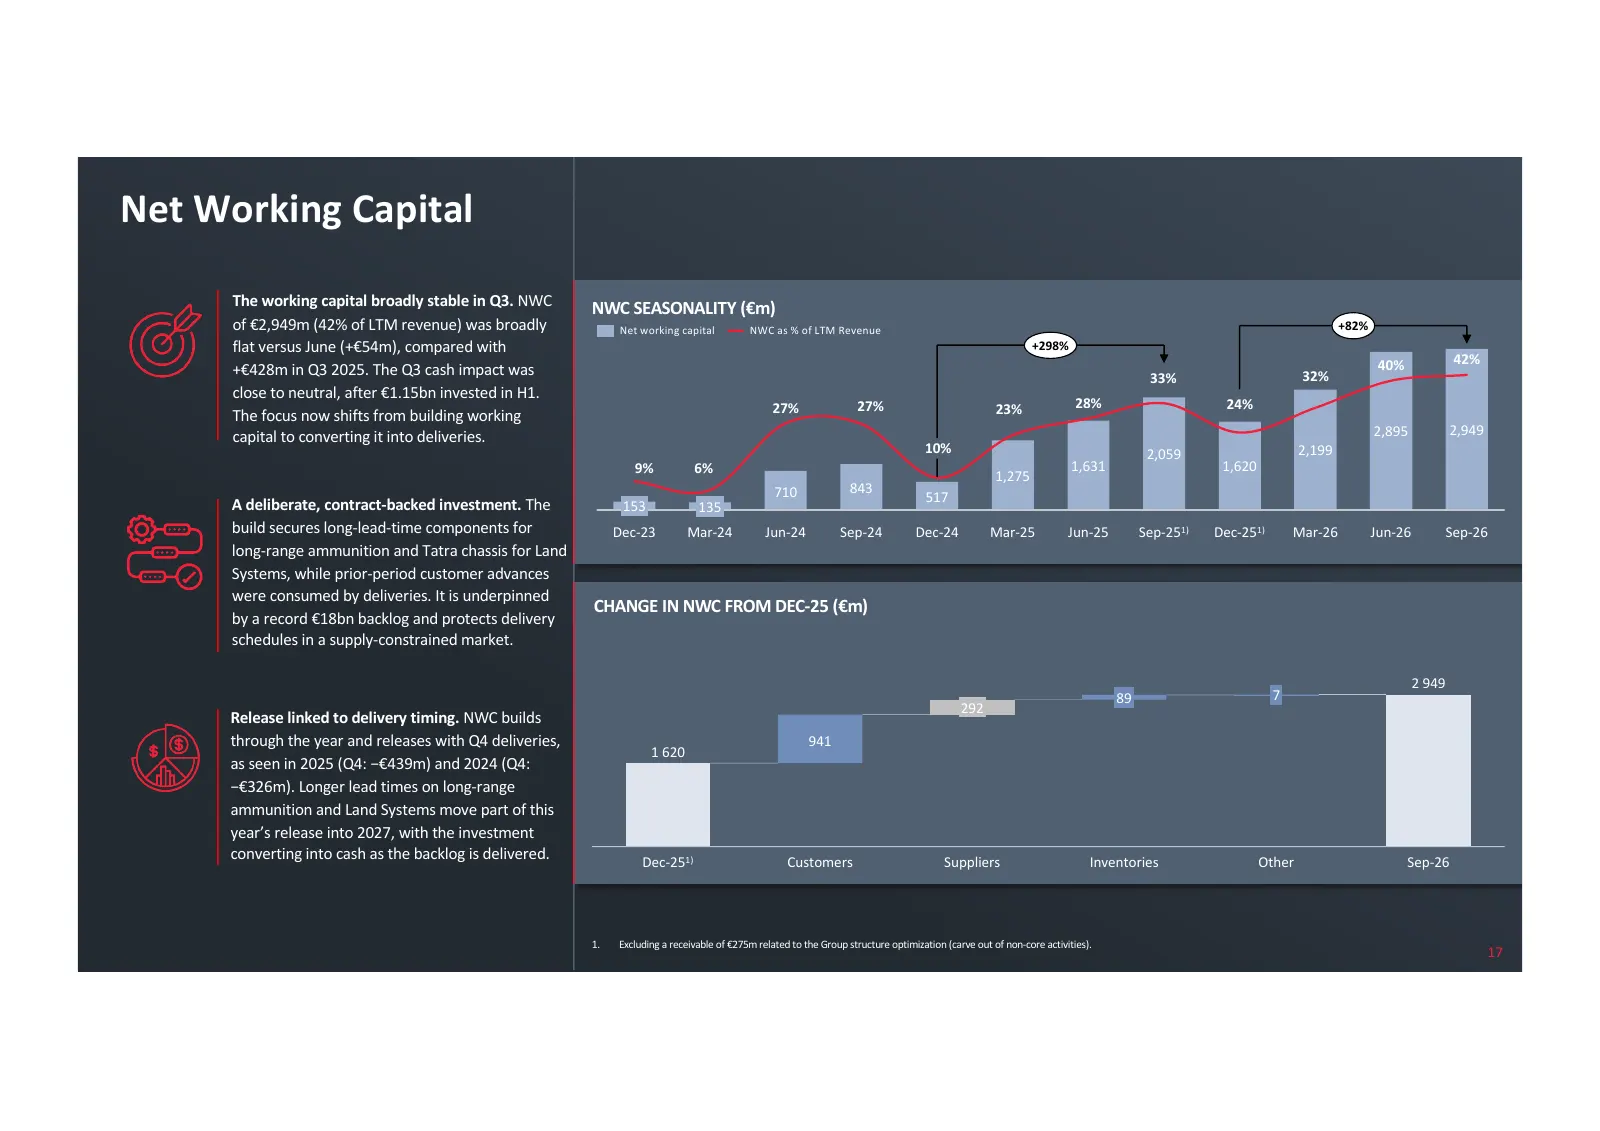
Net Working Capital The working capital broadly stable in Q3. NWC NWC SEASONALITY (€m) of €2,949m (42% of LTM revenue) was broadly Net working capital NWC as % of LTM Revenue +82% flat versus June (+€54m), compared with +298% 40% 42% +€428m in Q3 2025. The Q3 cash impact was 33% 32% close to neutral
Slide 18: Cash flow and Capex funding strategy
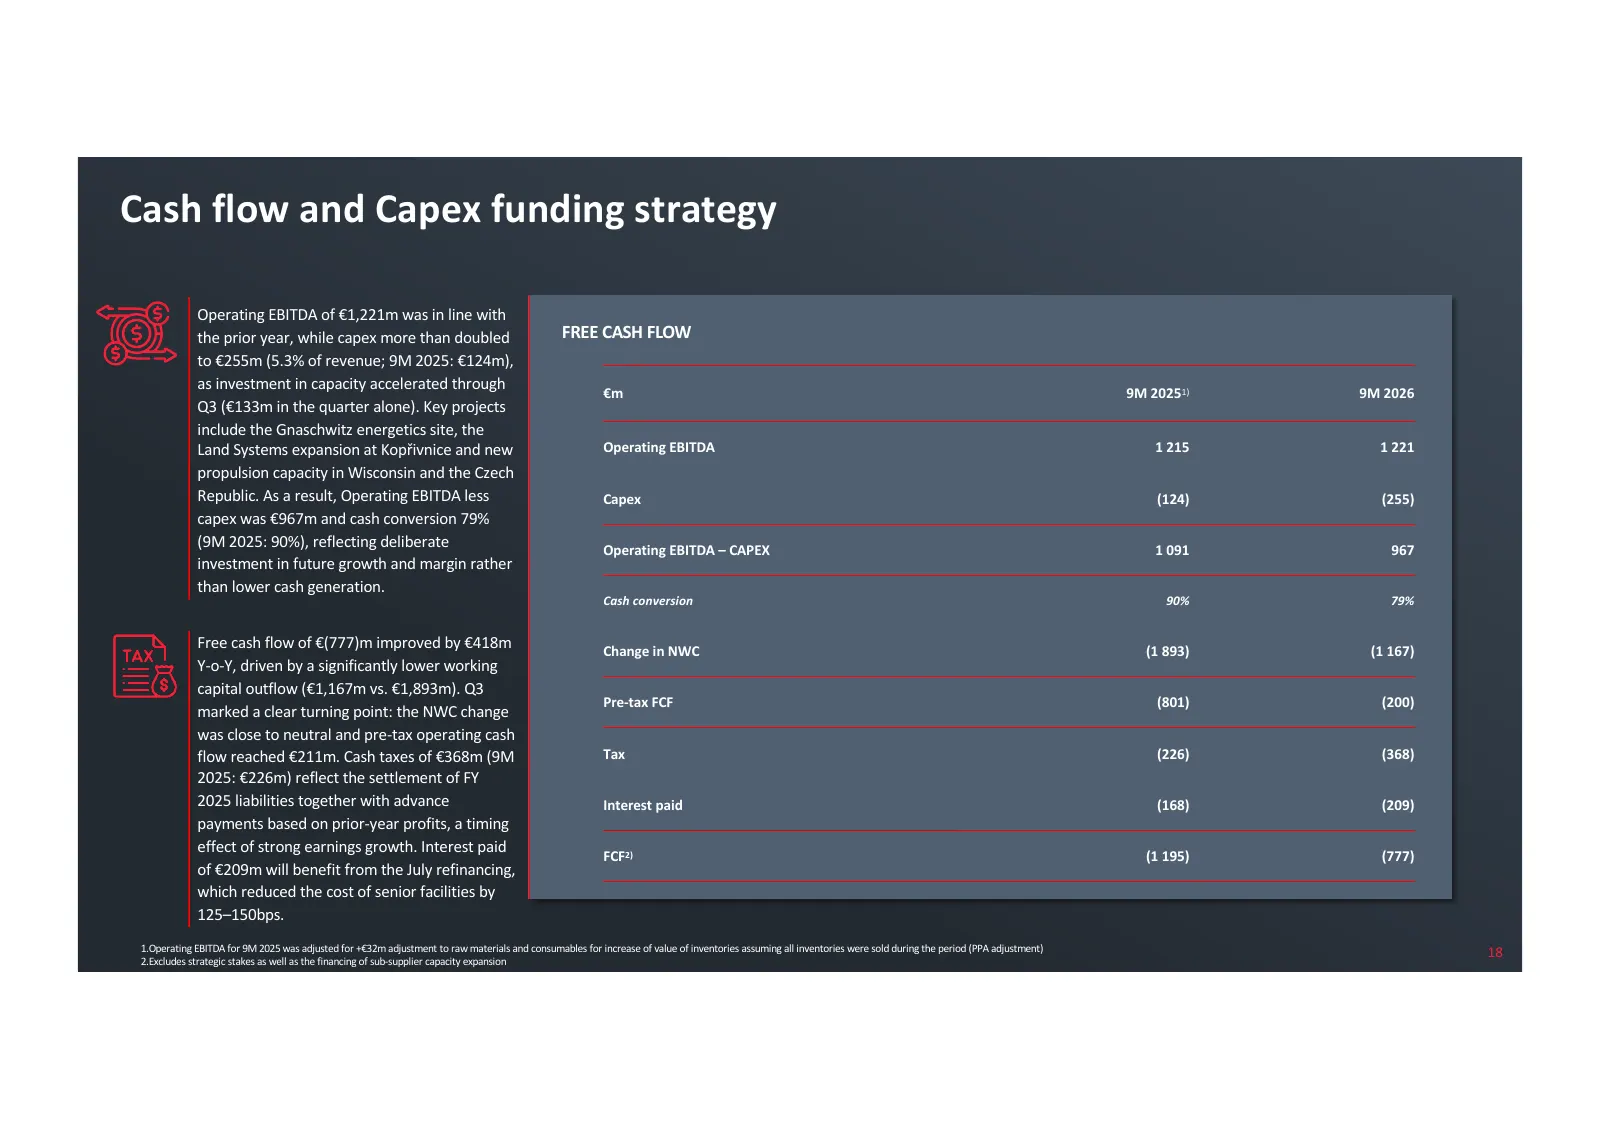
Cash flow and Capex funding strategy Operating EBITDA of €1,221m was in line with the prior year, while capex more than doubled FREE CASH FLOW to €255m (5.3% of revenue; 9M 2025: €124m), as investment in capacity accelerated through €m 9M 20251) 9M 2026 Q3 (€133m in the quarter alone). Key projects
Slide 19: Debt and Capital allocation
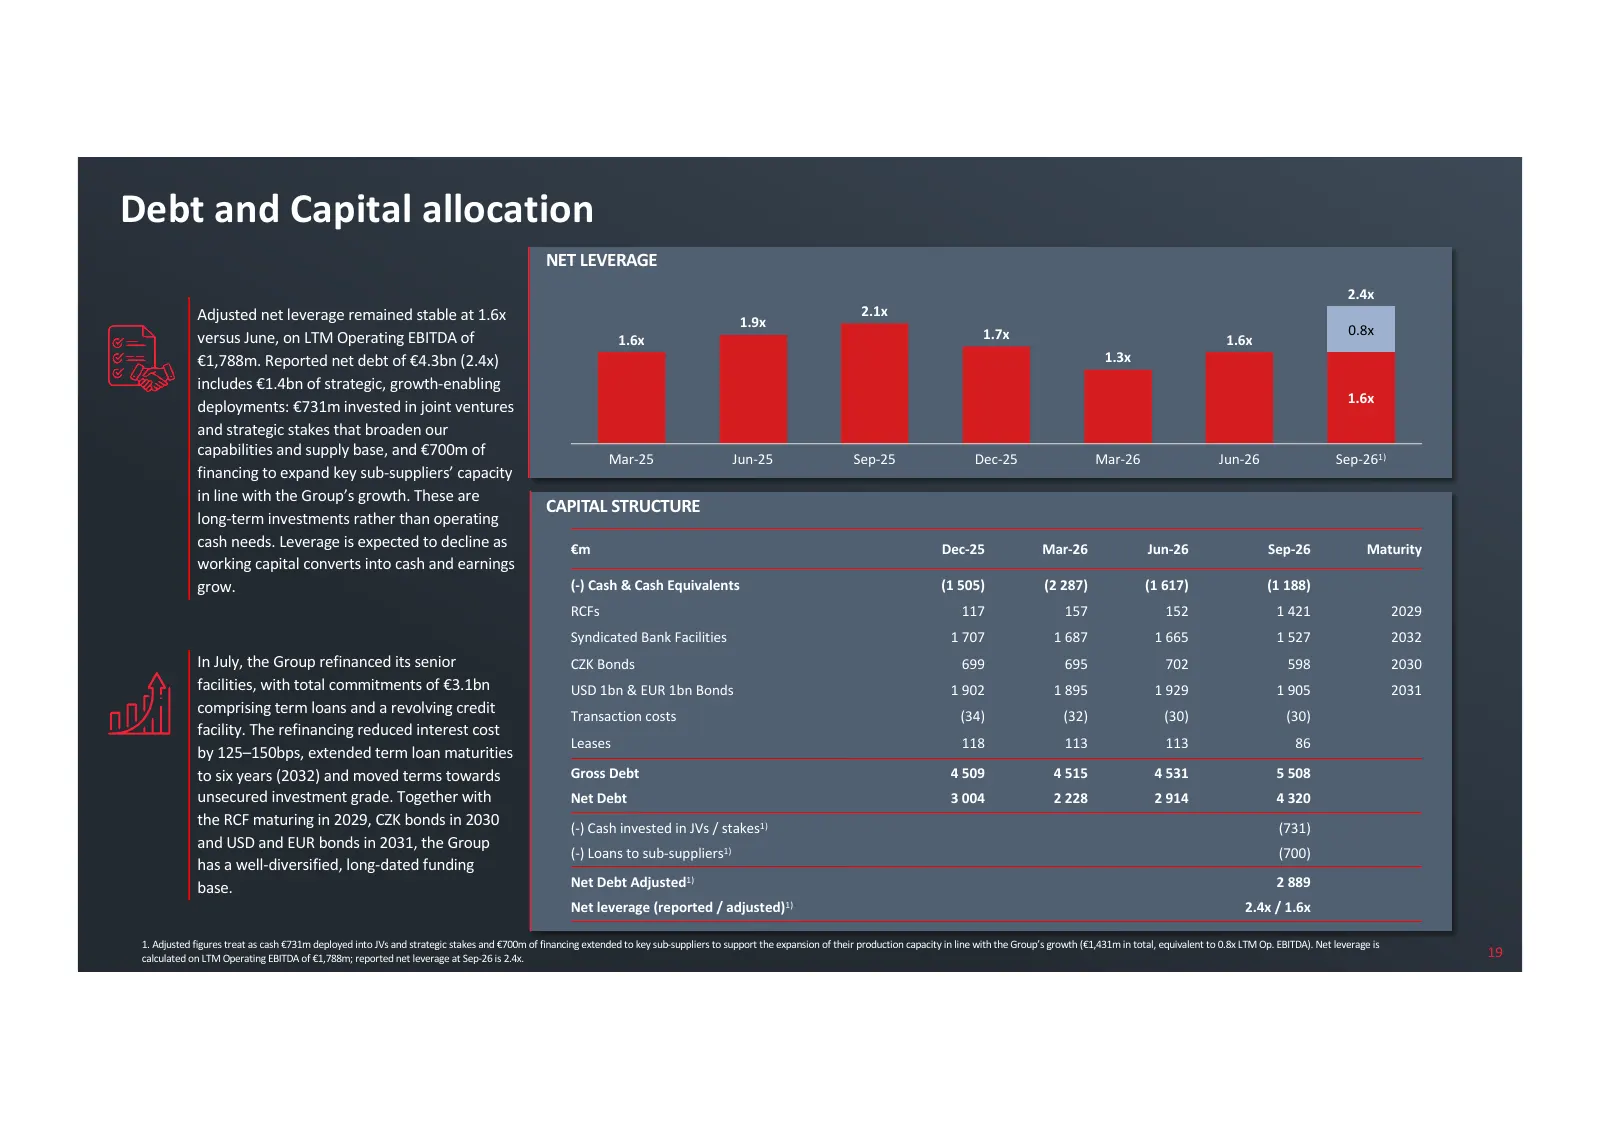
Debt and Capital allocation NET LEVERAGE 2.4x Adjusted net leverage remained stable at 1.6x 2.1x 1.9x 0.8x versus June, on LTM Operating EBITDA of 1.6x 1.7x 1.6x €1,788m. Reported net debt of €4.3bn (2.4x) 1.3x includes €1.4bn of strategic, growth-enabling 1.6x deployments: €731m invested in joint v
Slide 20: Updated Guidance 2026 and reaffirmed mid-term outlook
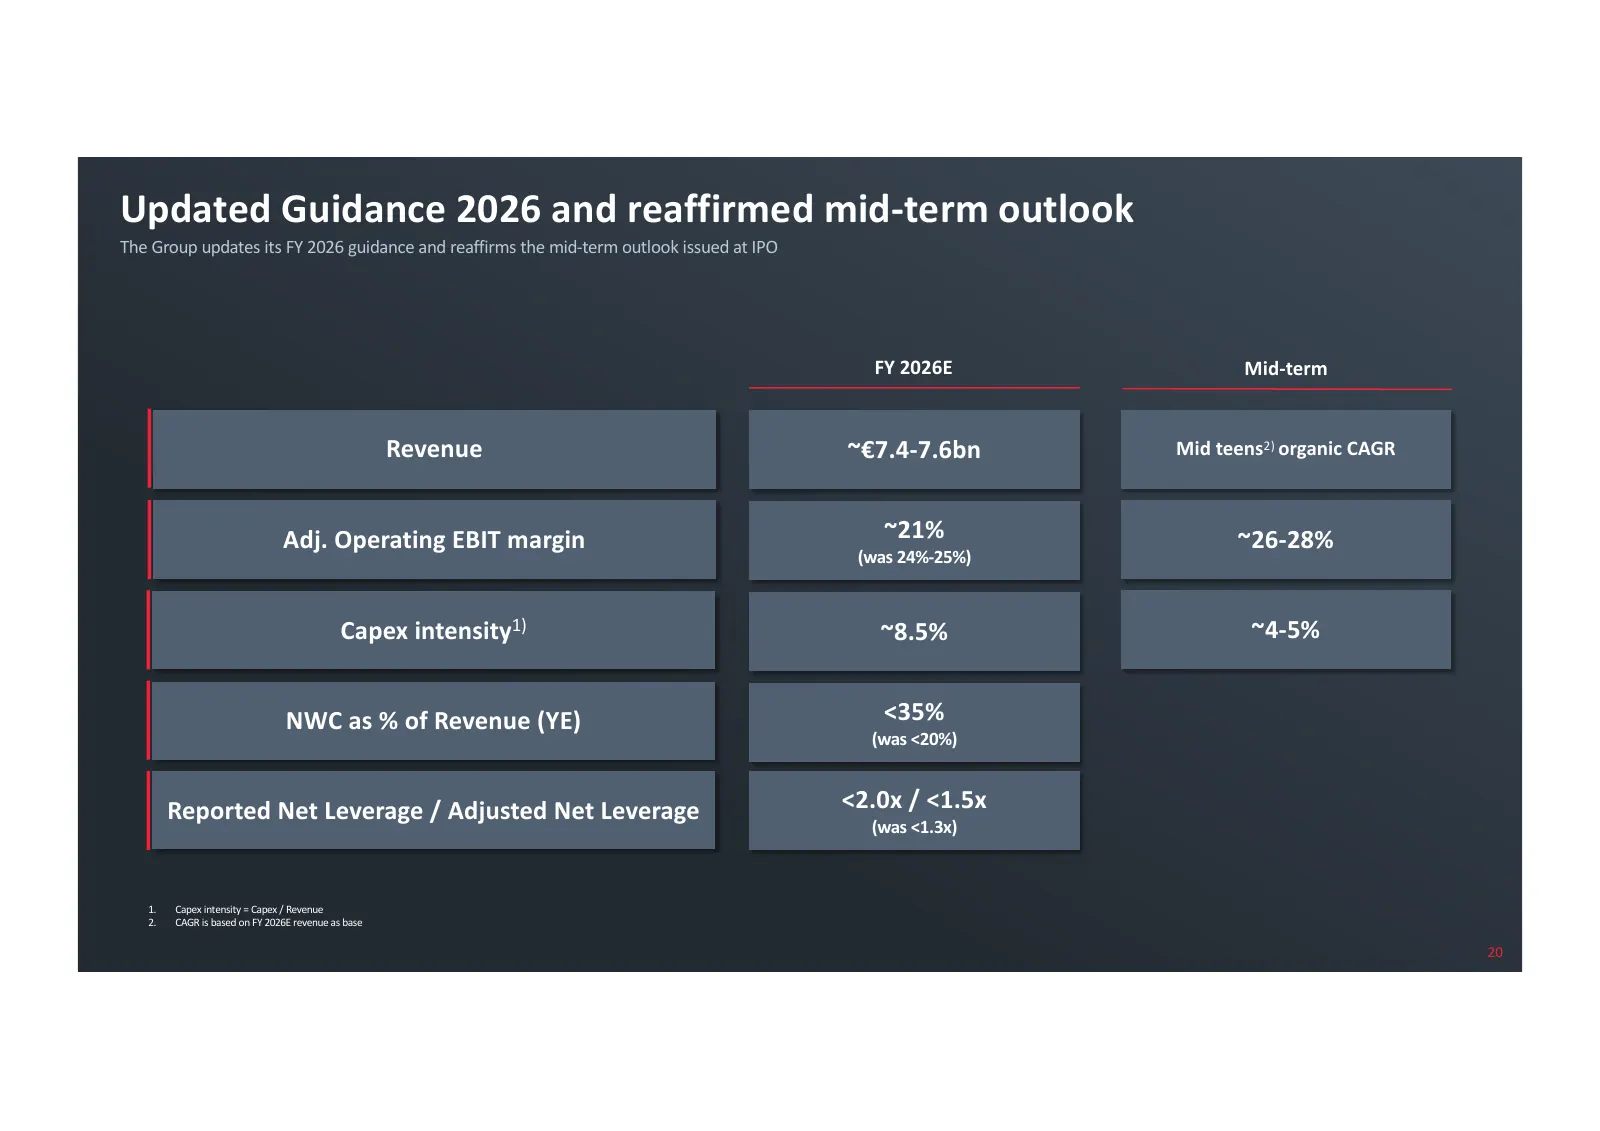
Updated Guidance 2026 and reaffirmed mid-term outlook The Group updates its FY 2026 guidance and reaffirms the mid-term outlook issued at IPO FY 2026E Mid-term Revenue ~€7.4-7.6bn Mid teens2) organic CAGR Adj. Operating EBIT margin ~21% ~26-28% (was 24%-25%) Capex intensity1) ~8.5% ~4-5% NWC as % of
Slide 21: Q&A
Q&A YOUR QUESTIONS, OUR ANSWERS

Slide 22: Appendix
Appendix
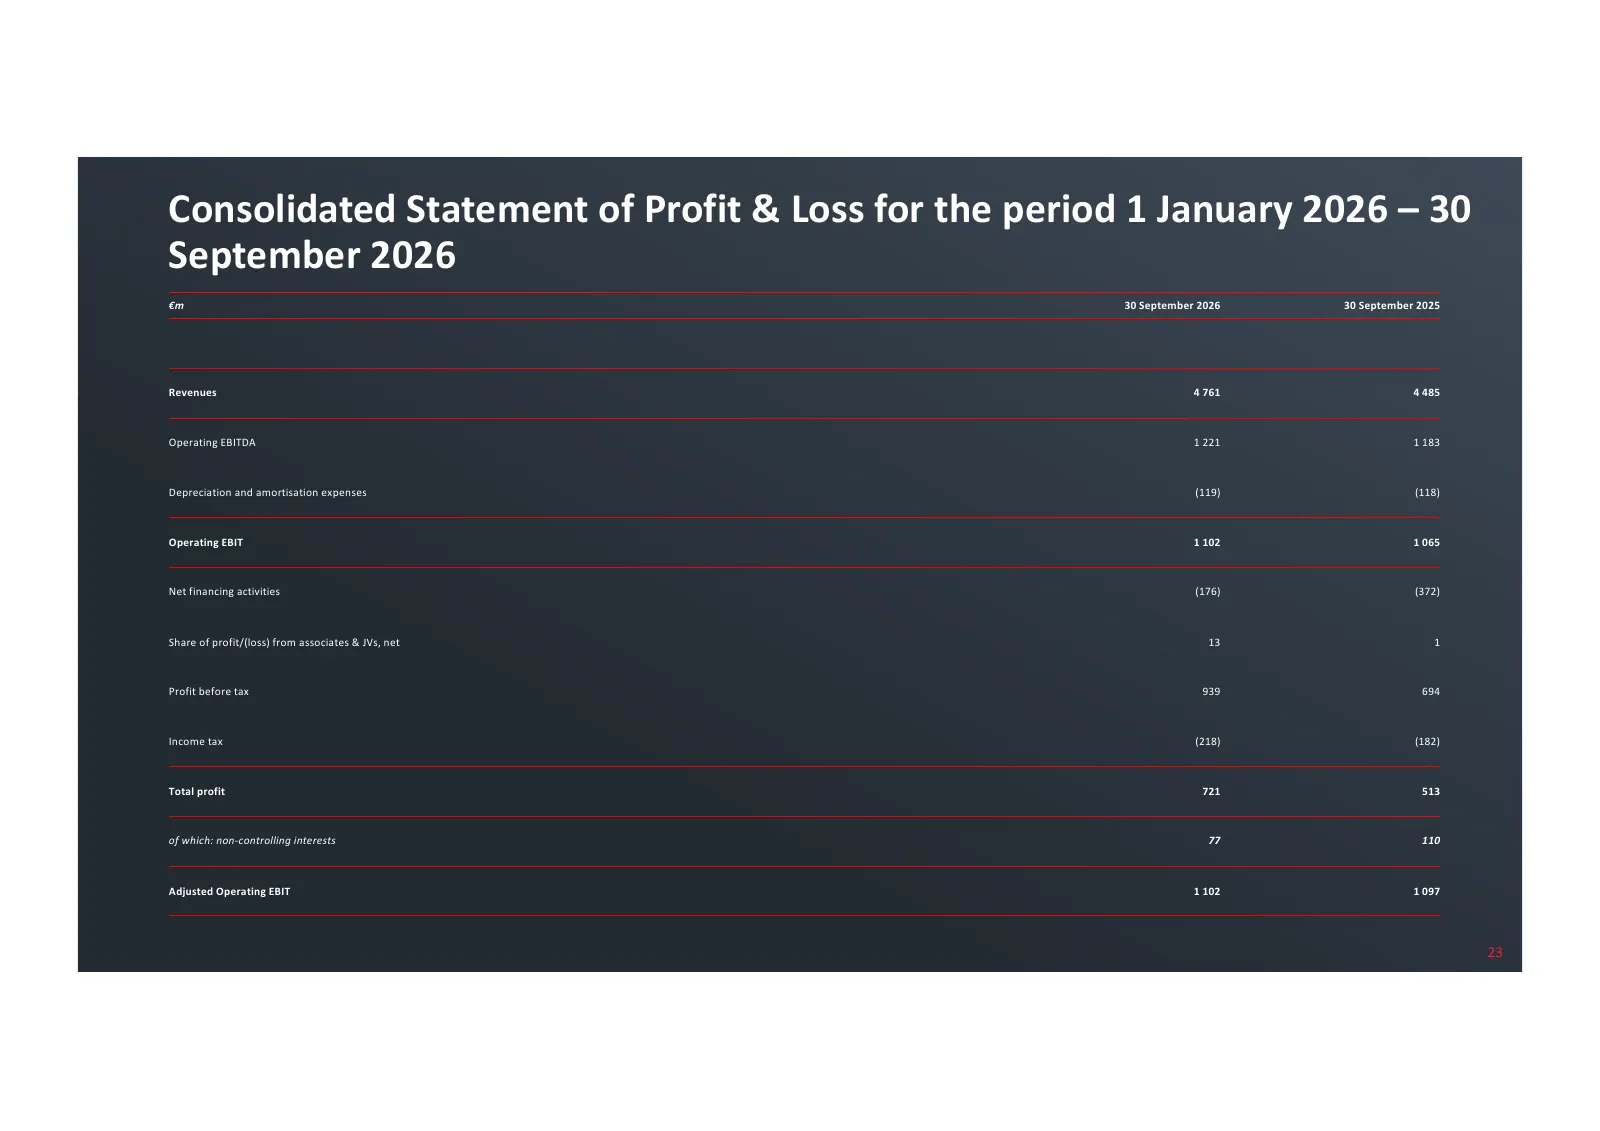
Slide 23: Consolidated Statement of Profit & Loss
Consolidated Statement of Profit & Loss for the period 1 January 2026 – 30 September 2026 €m 30 September 2026 30 September 2025 Revenues 4 761 4 485 Operating EBITDA 1 221 1 183 Depreciation and amortisation expenses (119) (118) Operating EBIT 1 102 1 065 Net financing activities (176) (372) Share
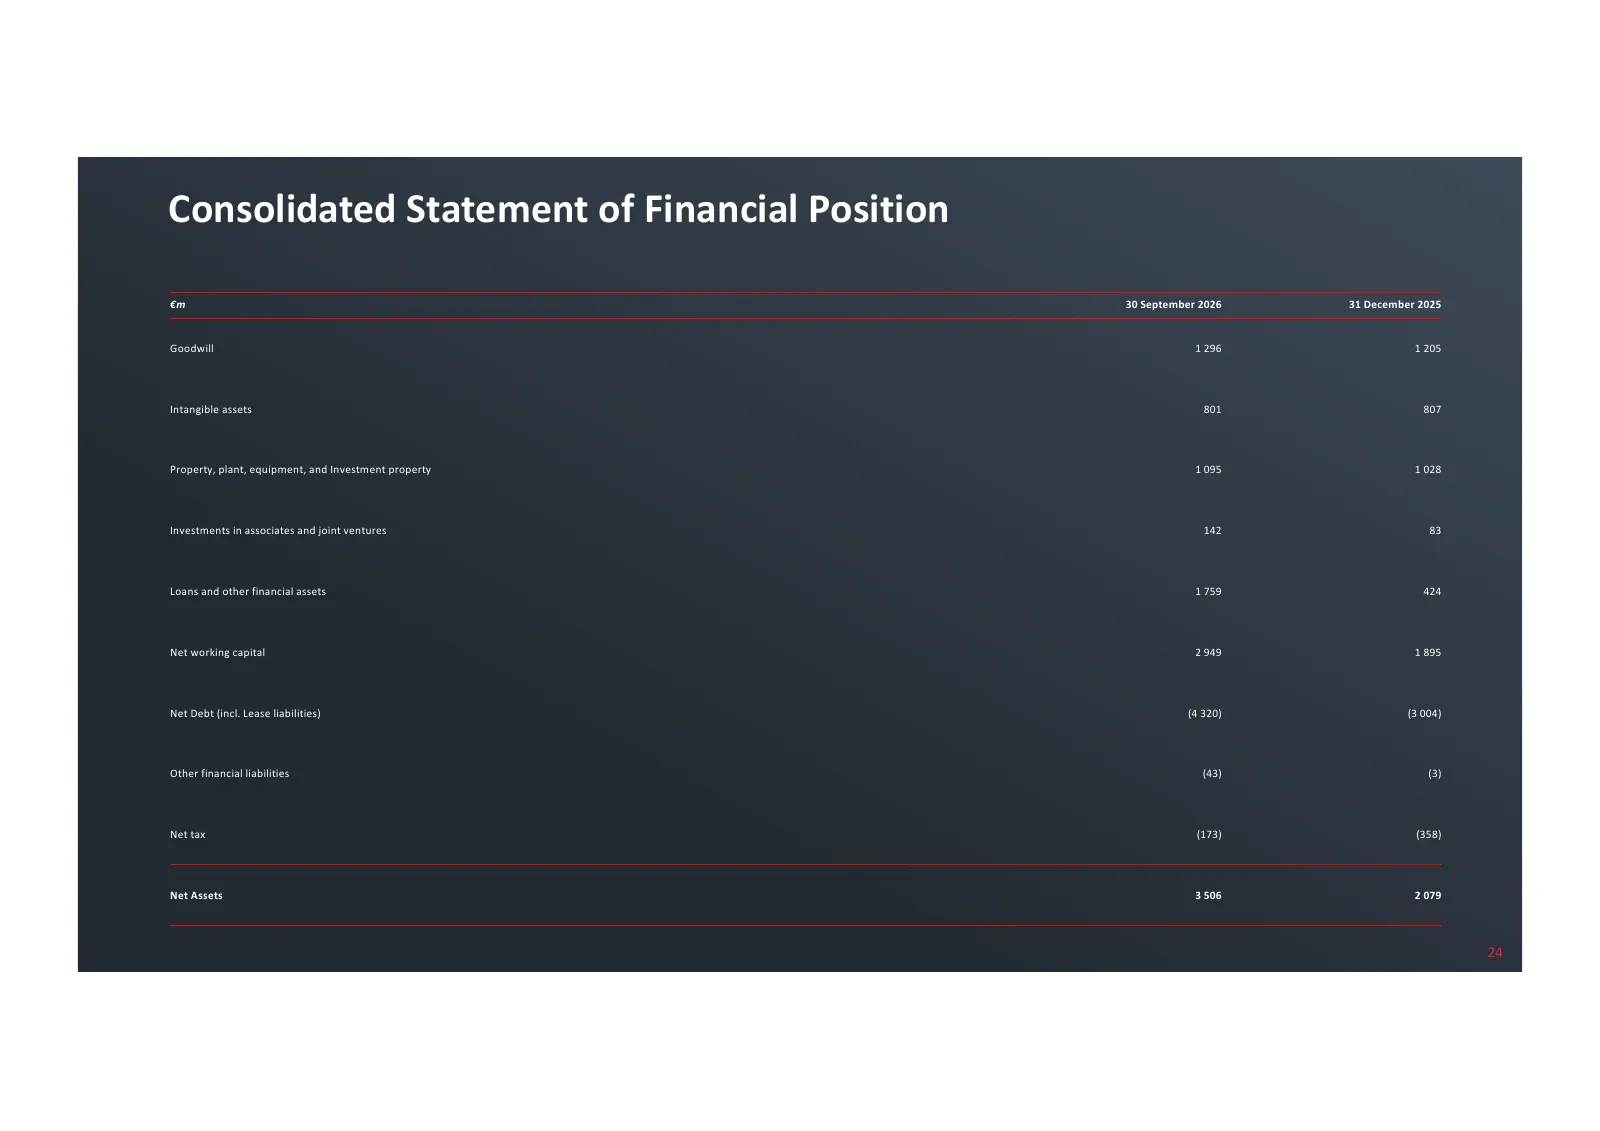
Slide 24: Consolidated Statement of Financial Position
Consolidated Statement of Financial Position €m 30 September 2026 31 December 2025 Goodwill 1 296 1 205 Intangible assets 801 807 Property, plant, equipment, and Investment property 1 095 1 028 Investments in associates and joint ventures 142 83 Loans and other financial assets 1 759 424 Net working
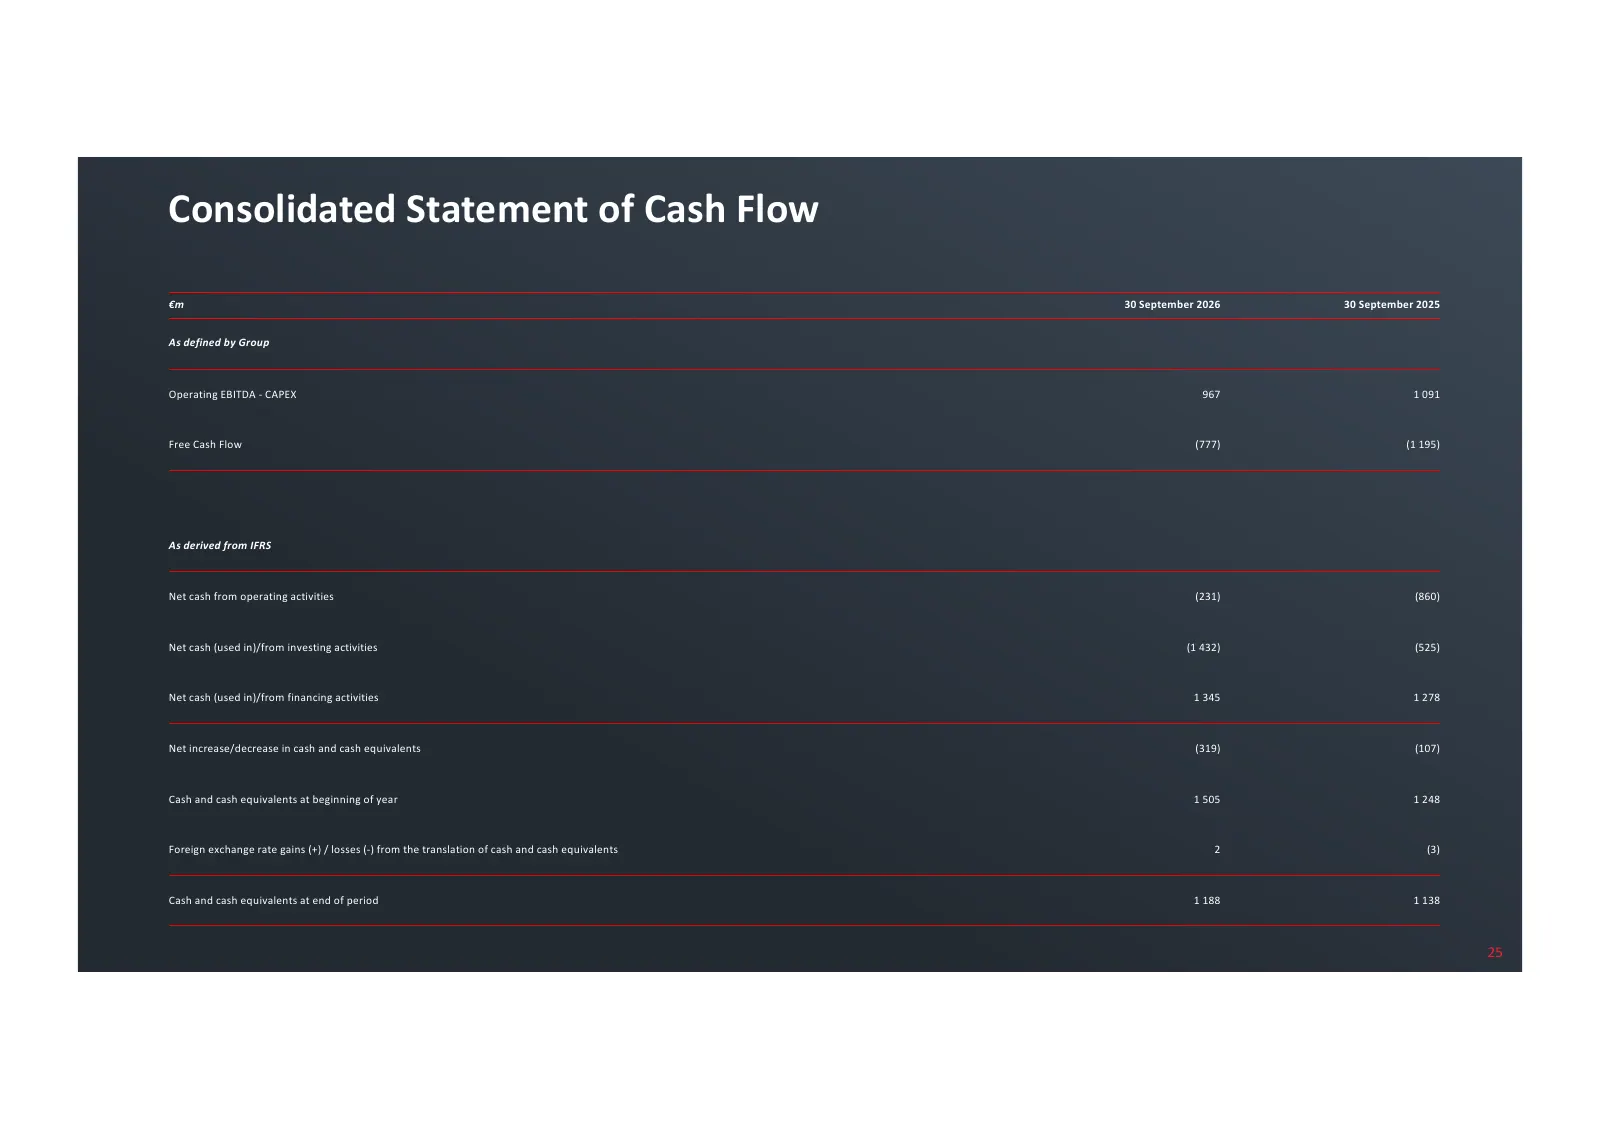
Slide 25: Consolidated Statement of Cash Flow
Consolidated Statement of Cash Flow €m 30 September 2026 30 September 2025 As defined by Group Operating EBITDA - CAPEX 967 1 091 Free Cash Flow (777) (1 195) space As derived from IFRS Net cash from operating activities (231) (860) Net cash (used in)/from investing activities (1 432) (525) Net cash
Slide 26: Alternative performance measures
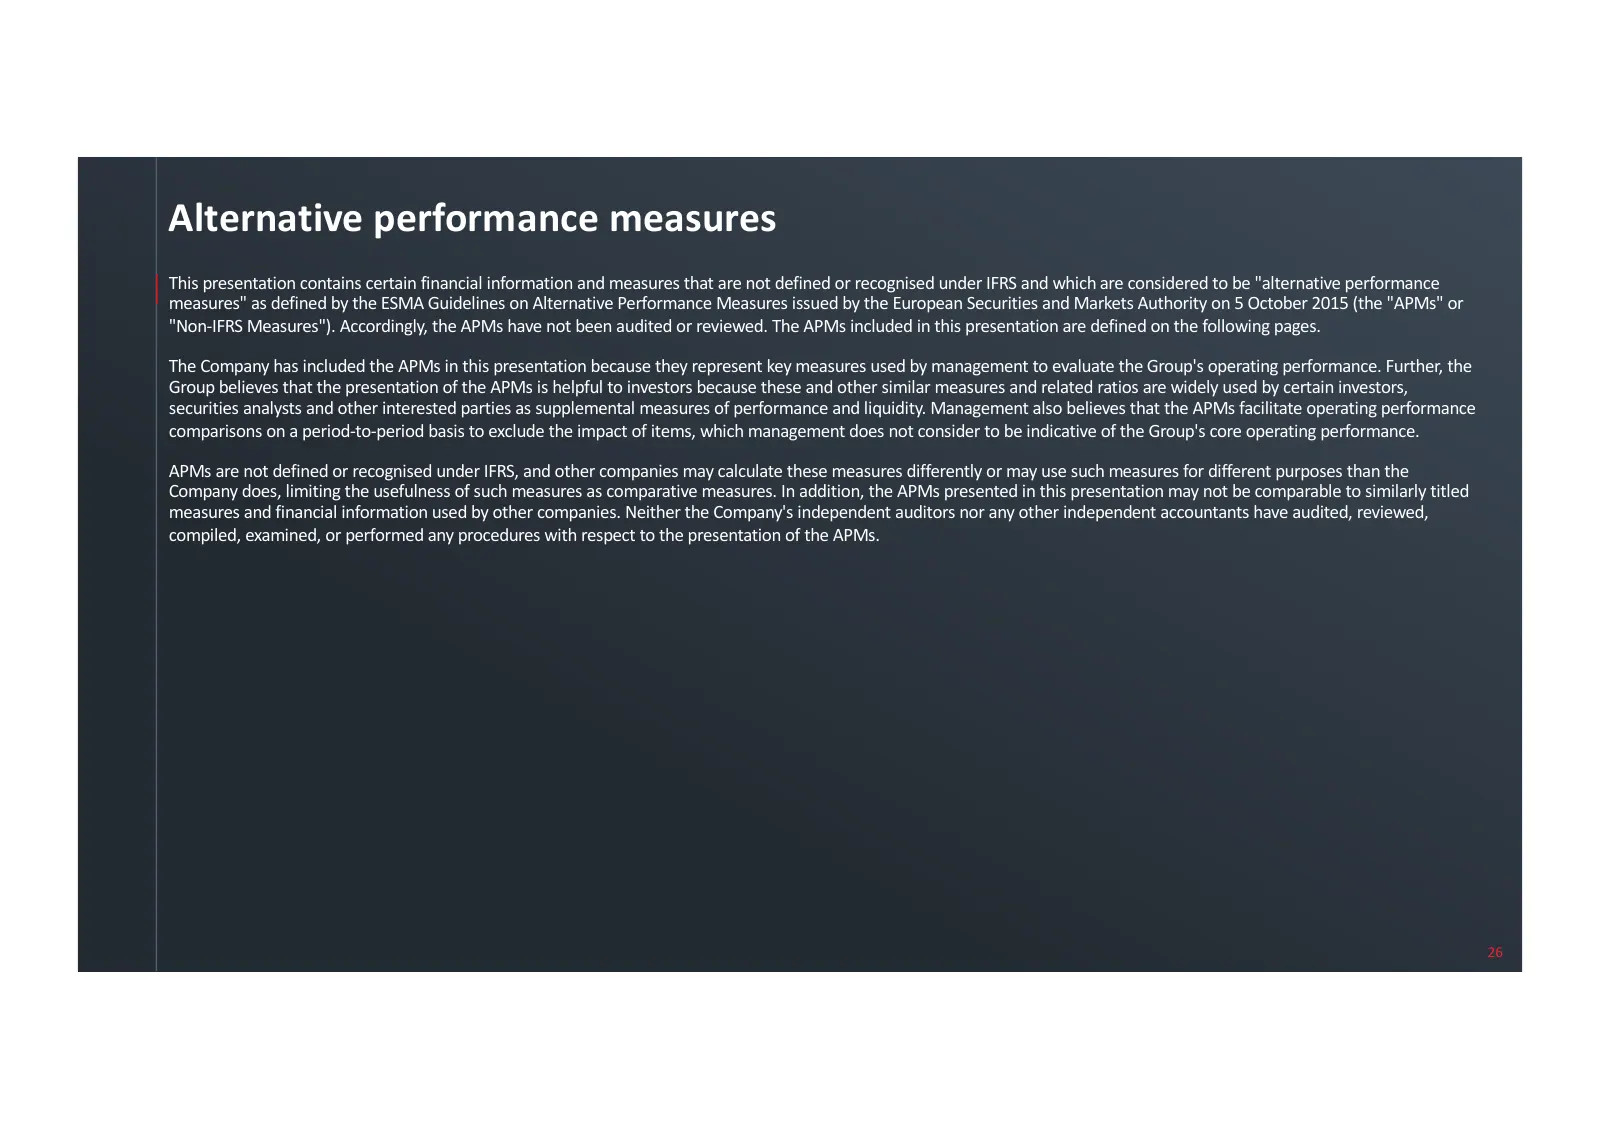
Alternative performance measures This presentation contains certain financial information and measures that are not defined or recognised under IFRS and which are considered to be "alternative performance measures" as defined by the ESMA Guidelines on Alternative Performance Measures issued by the E
Slide 27: Alternative performance measures – definitions (1/2)
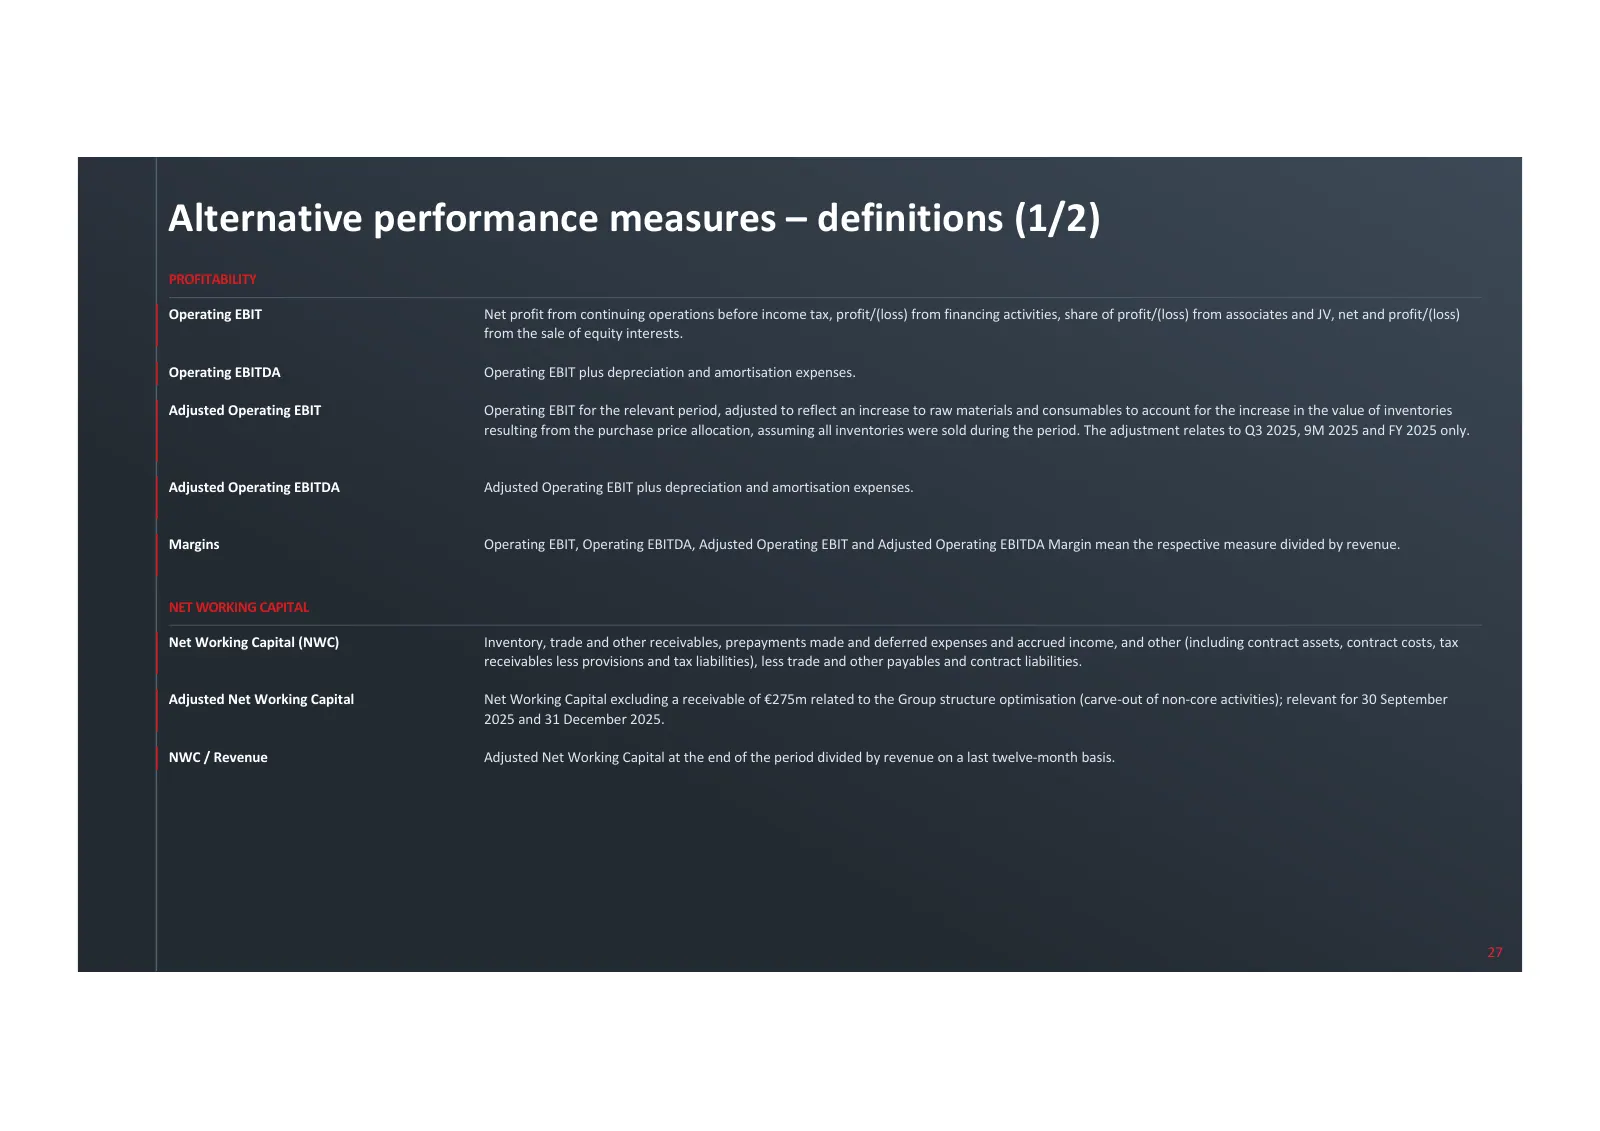
Alternative performance measures – definitions (1/2) PROFITABILITY Operating EBIT Net profit from continuing operations before income tax, profit/(loss) from financing activities, share of profit/(loss) from associates and JV, net and profit/(loss) from the sale of equity interests. Operating EBITDA
Slide 28: Alternative performance measures – definitions (2/2)
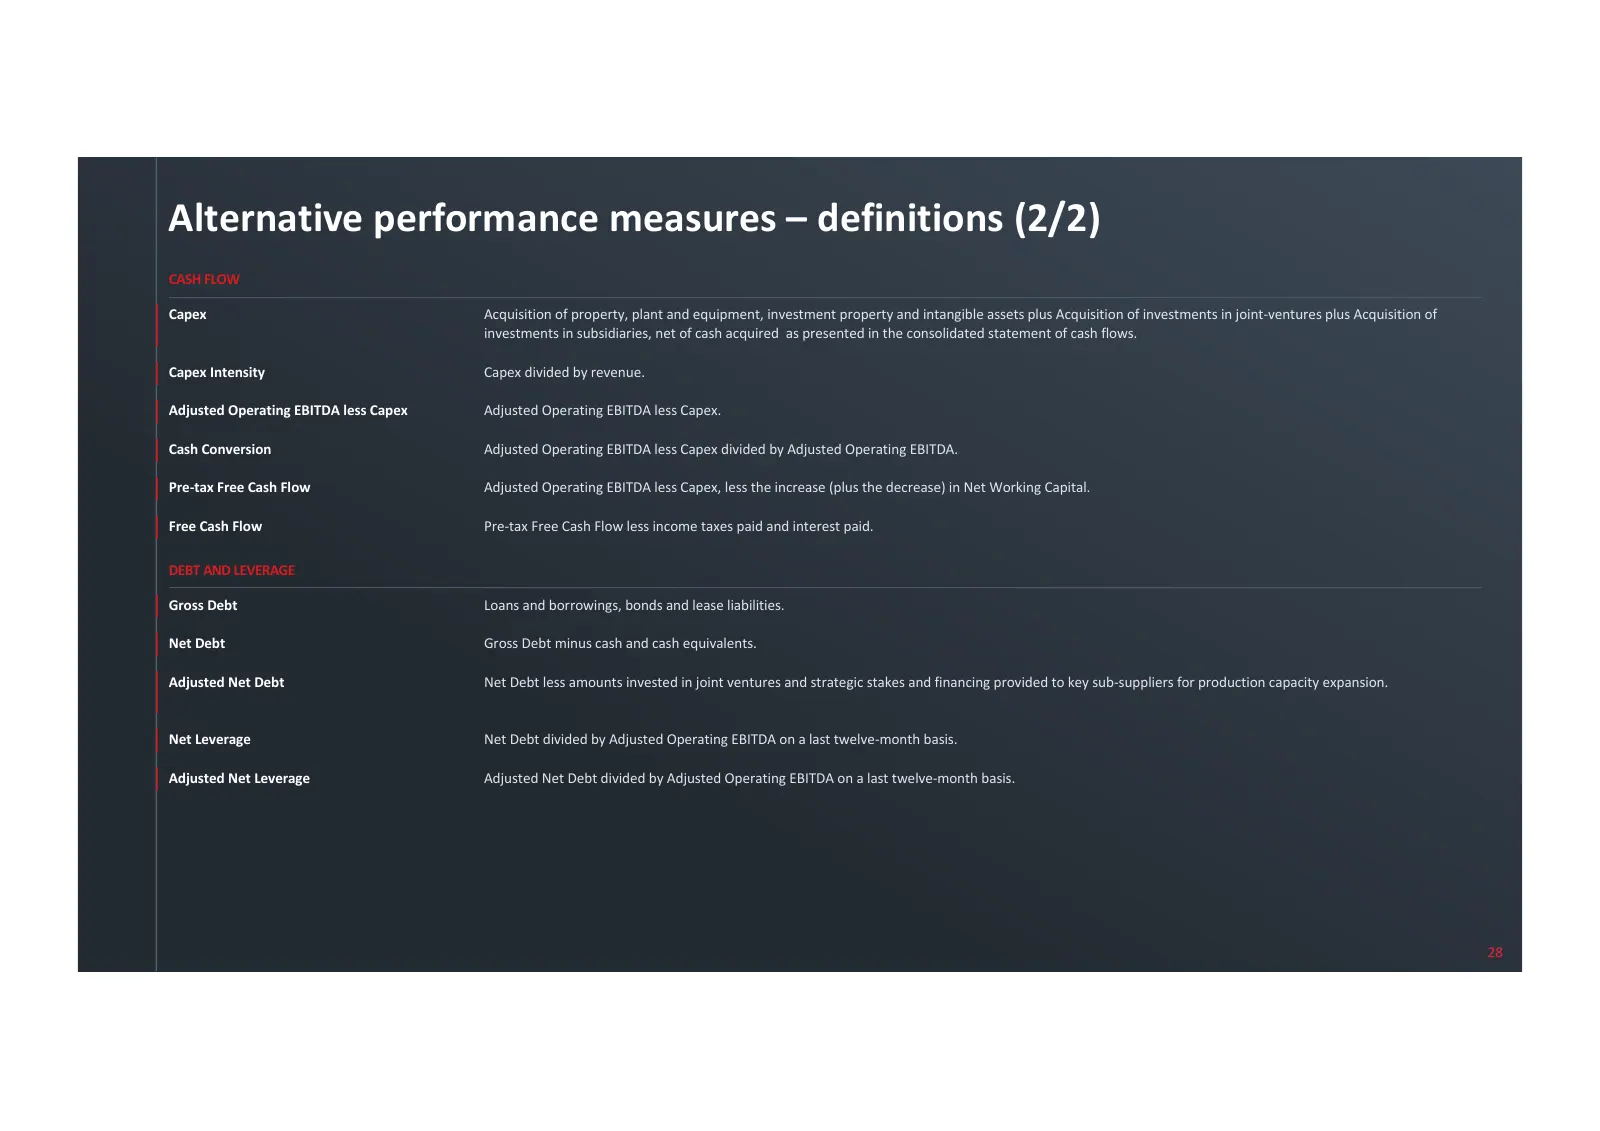
Alternative performance measures – definitions (2/2) CASH FLOW Capex Acquisition of property, plant and equipment, investment property and intangible assets plus Acquisition of investments in joint-ventures plus Acquisition of investments in subsidiaries, net of cash acquired as presented in the con
Slide 29: Alternative performance measures – reconciliations
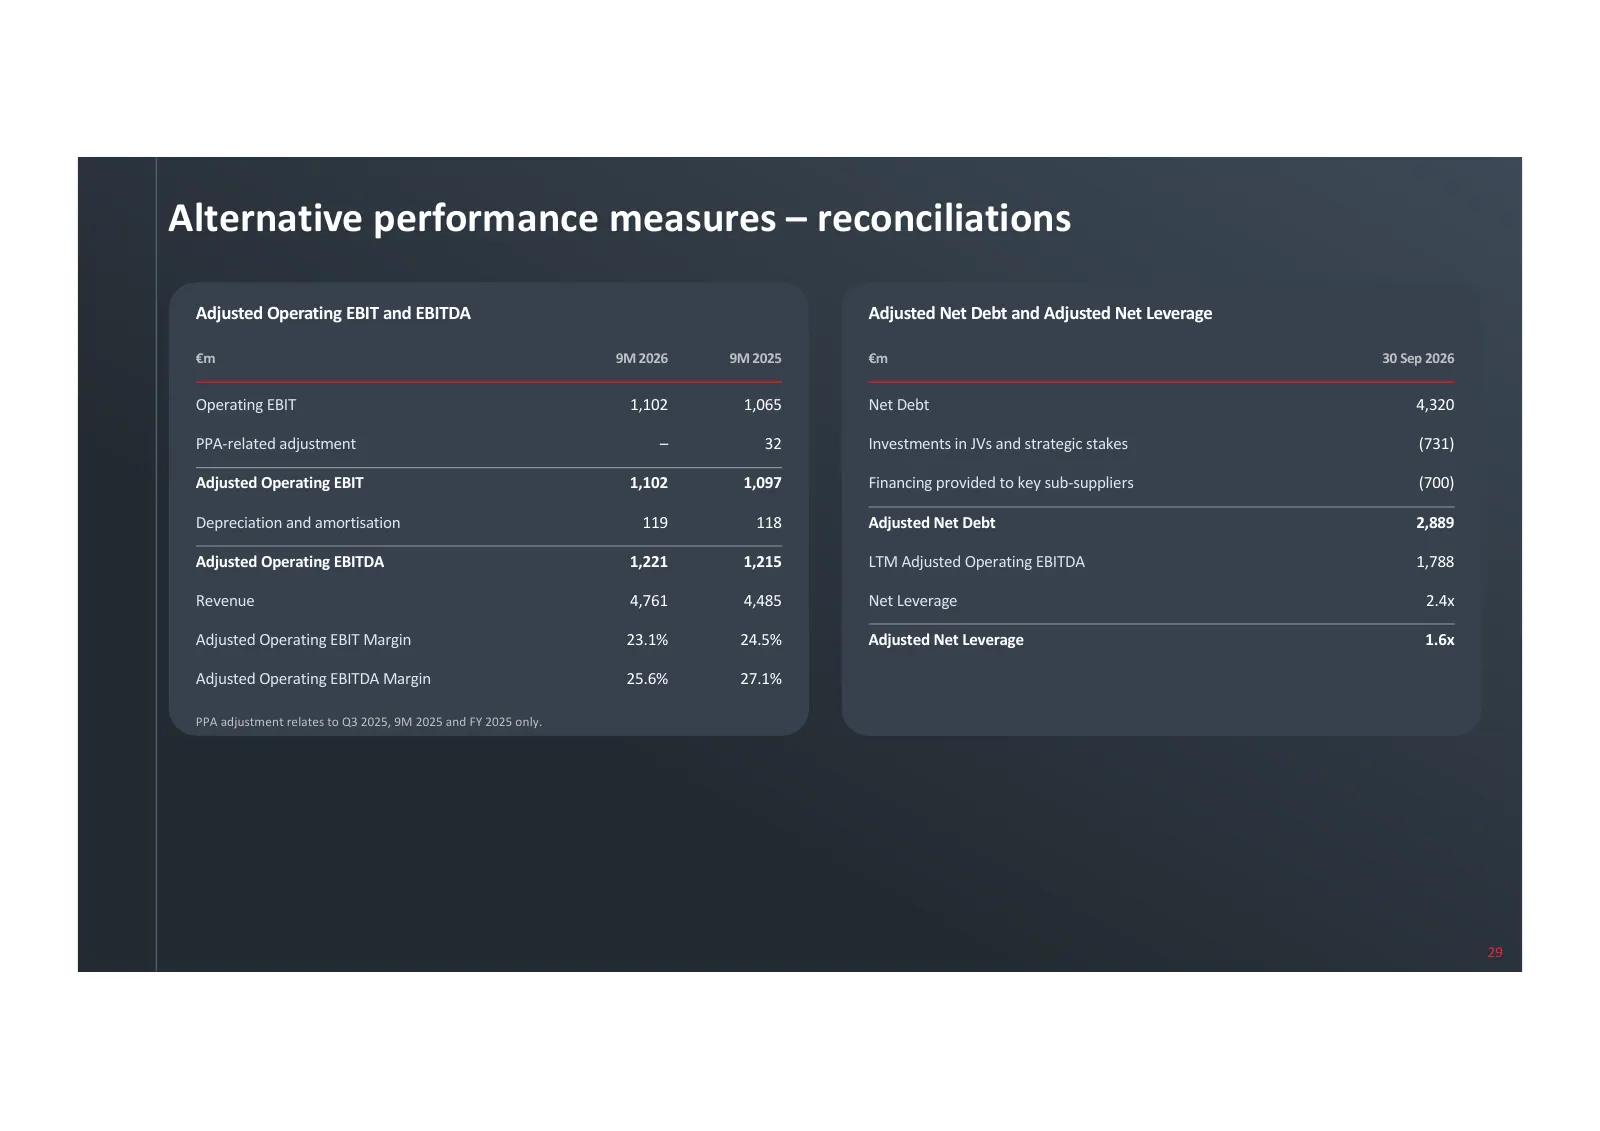
Alternative performance measures – reconciliations Adjusted Operating EBIT and EBITDA Adjusted Net Debt and Adjusted Net Leverage €m 9M 2026 9M 2025 €m 30 Sep 2026 Operating EBIT 1,102 1,065 Net Debt 4,320 PPA-related adjustment – 32 Investments in JVs and strategic stakes (731) Adjusted Operating E
Slide 30: Alternative performance measures
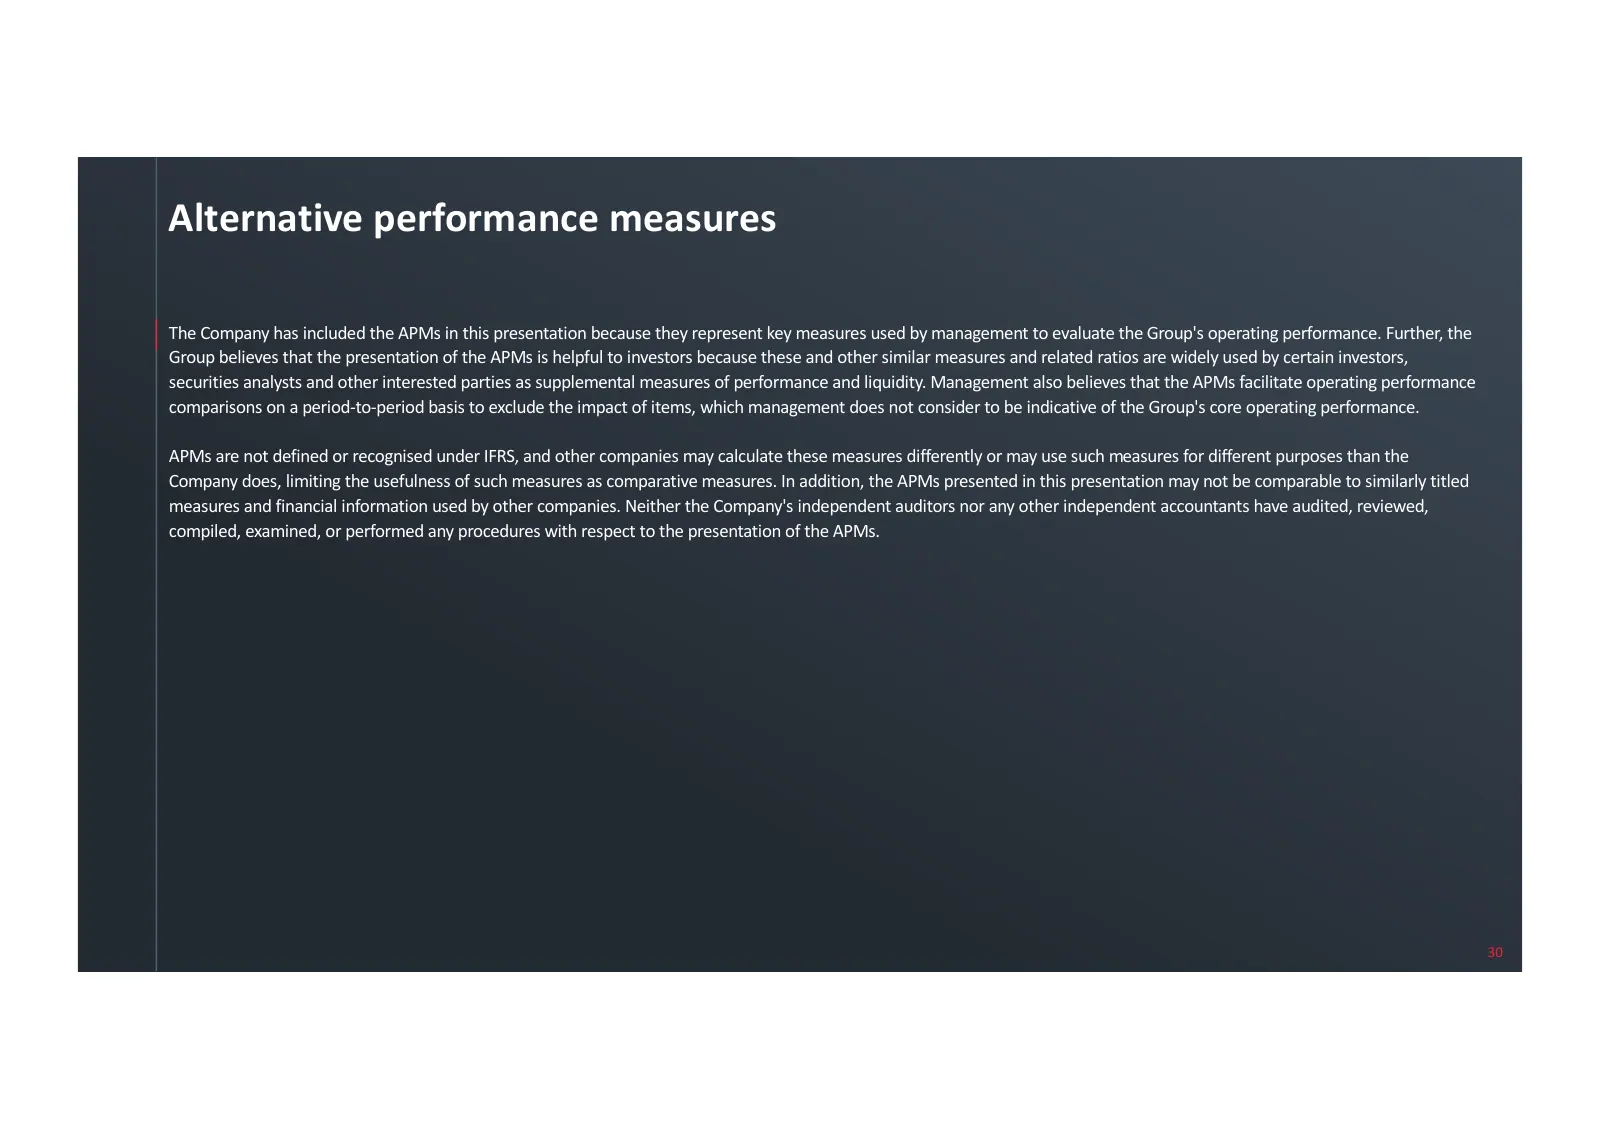
Alternative performance measures The Company has included the APMs in this presentation because they represent key measures used by management to evaluate the Group's operating performance. Further, the Group believes that the presentation of the APMs is helpful to investors because these and other
Source: company website