Flutter Entertainment plc · NYSE:FLUT
Flutter Entertainment — Paddy Power — Investor Day (October 2014)
62 slides from Flutter Entertainment's investor day presentation, Oct 24, 2014
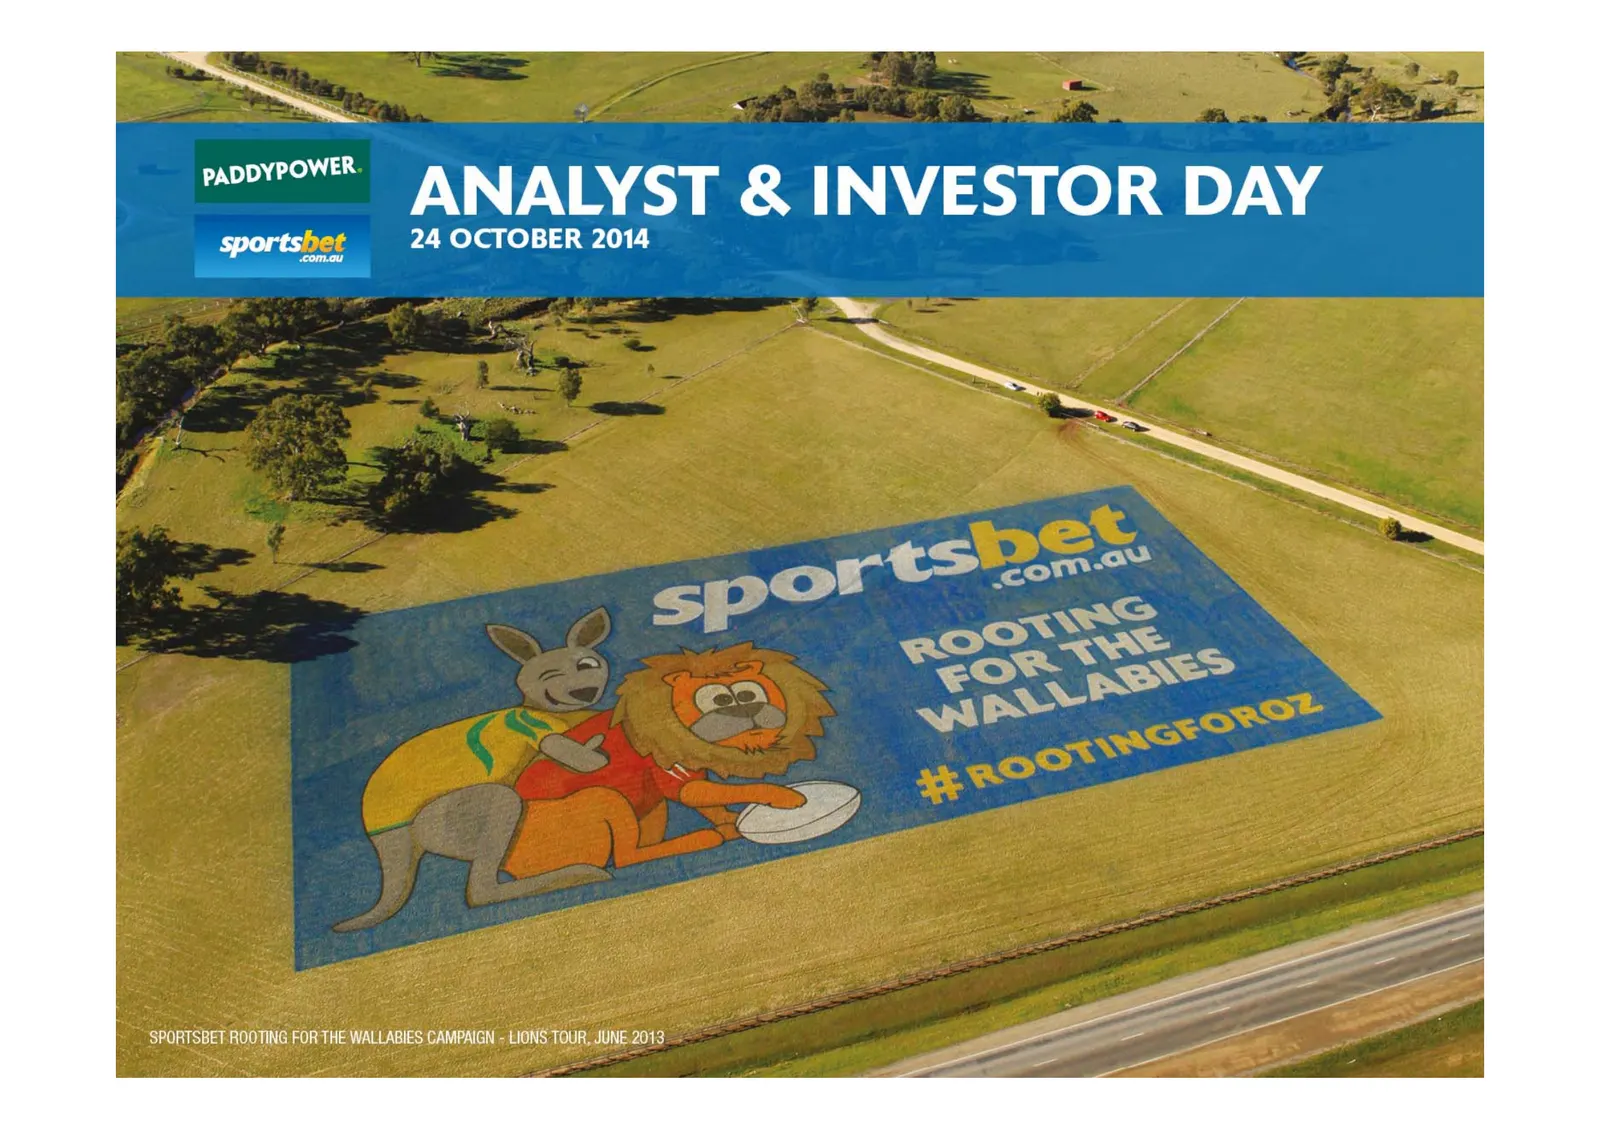
Slide 1: Analyst & Investor Day
meow ANALYST & INVESTOR DAY sportshet 24 OCTOBER 2014 : —t> > » Sh SPORTSBET ROOTING FOR THE WALLABIES CAMPAIGN - LIONS TOUR, JUNE.2013
Slide 2: Cormac Barry – CEO: Introduction
Cormac Barry – CEO Introduction 24 October 2014
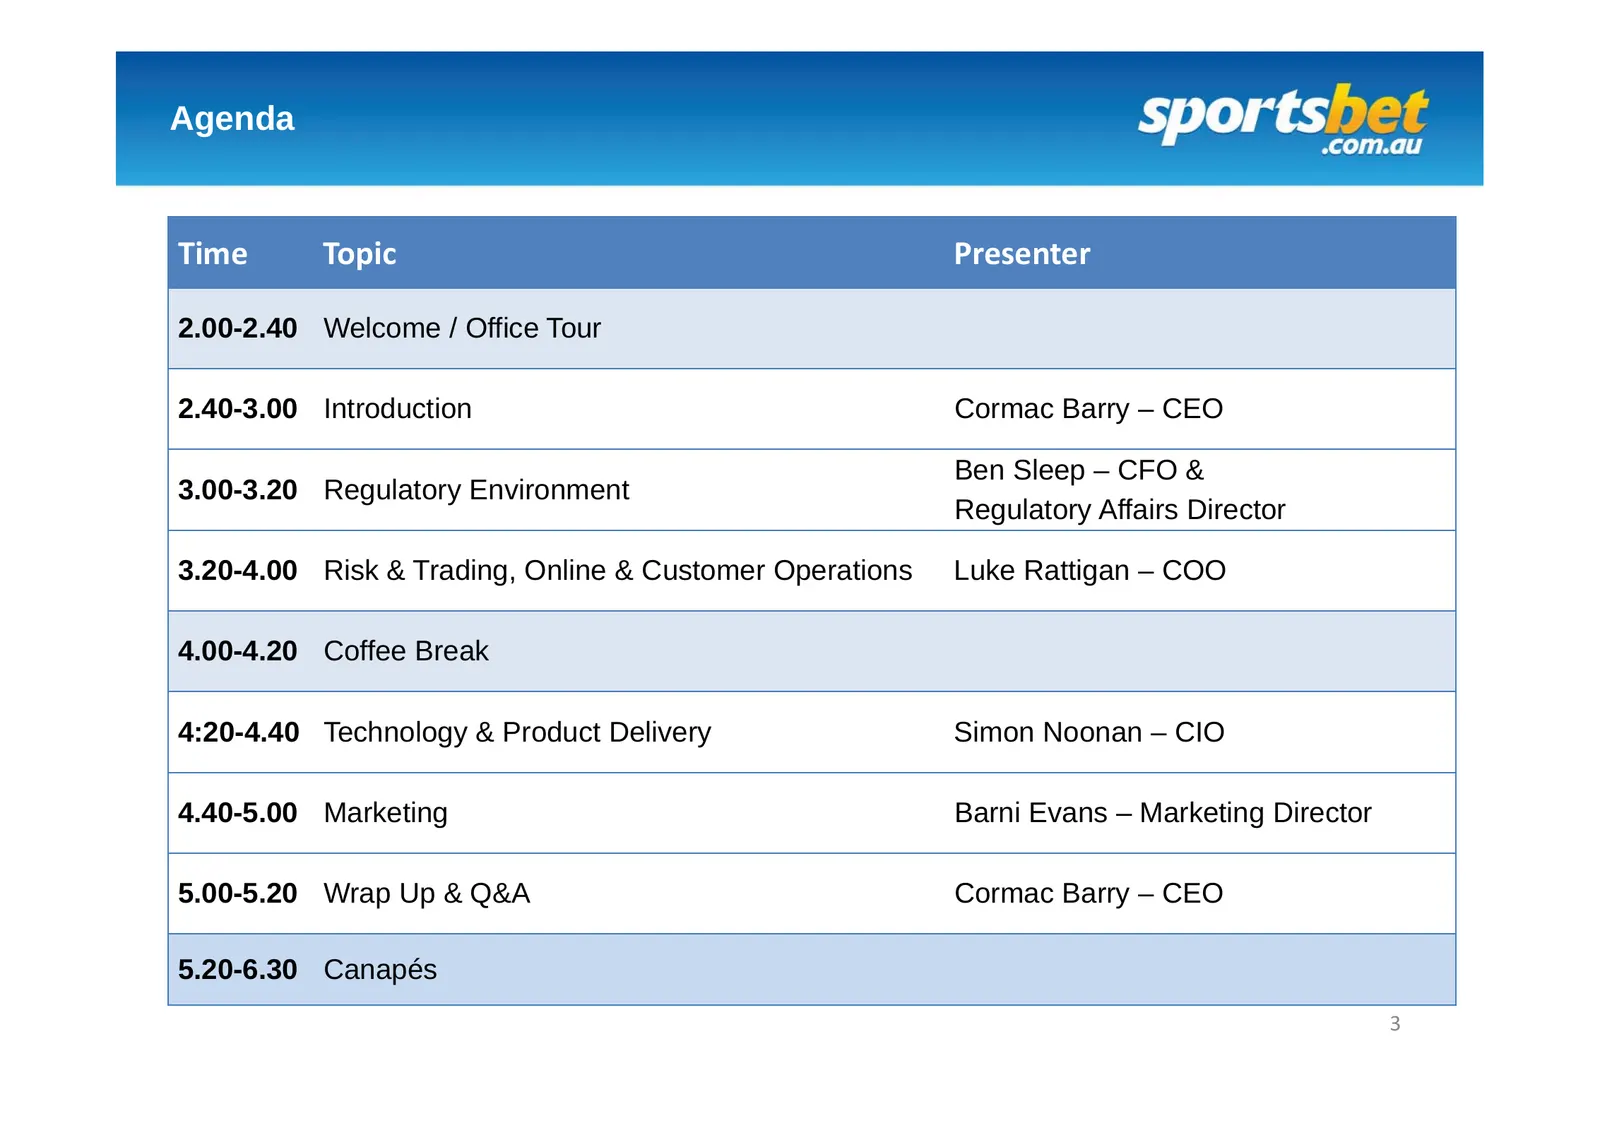
Slide 3: Agenda
Agenda Time Topic Presenter 2.00-2.40 Welcome / Office Tour 2.40-3.00 Introduction Cormac Barry – CEO Ben Sleep – CFO & 3.00-3.20 Regulatory Environment Regulatory Affairs Director 3.20-4.00 Risk & Trading, Online & Customer Operations Luke Rattigan – COO 4.00-4.20 Coffee Break 4:20-4.40 Technology
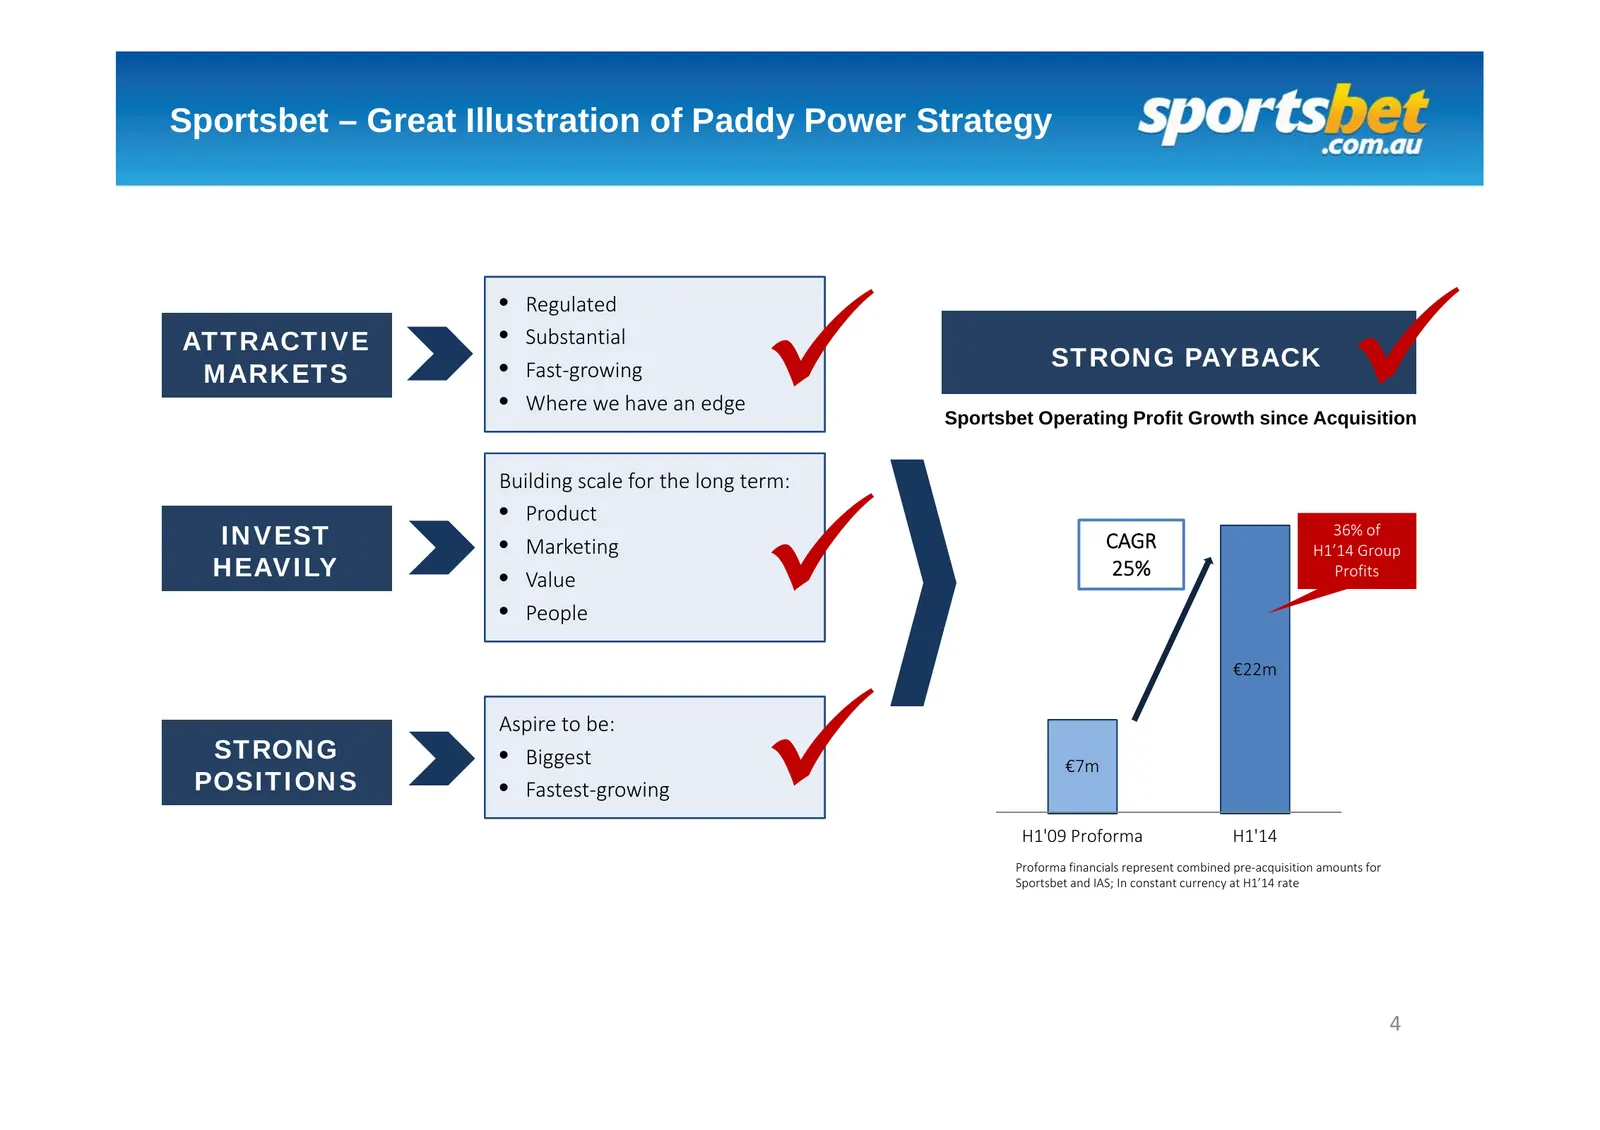
Slide 4: Sportsbet – Great Illustration of Paddy Power Strategy
Sportsbet – Great Illustration of Paddy Power Strategy • Regulated ATTRACTIVE • Substantial STRONG PAYBACK MARKETS • Fast‐growing • Where we have an edge Sportsbet Operating Profit Growth since Acquisition Building scale for the long term: • Product INVEST • Marketing CAGR 36% of H1’14 Group H
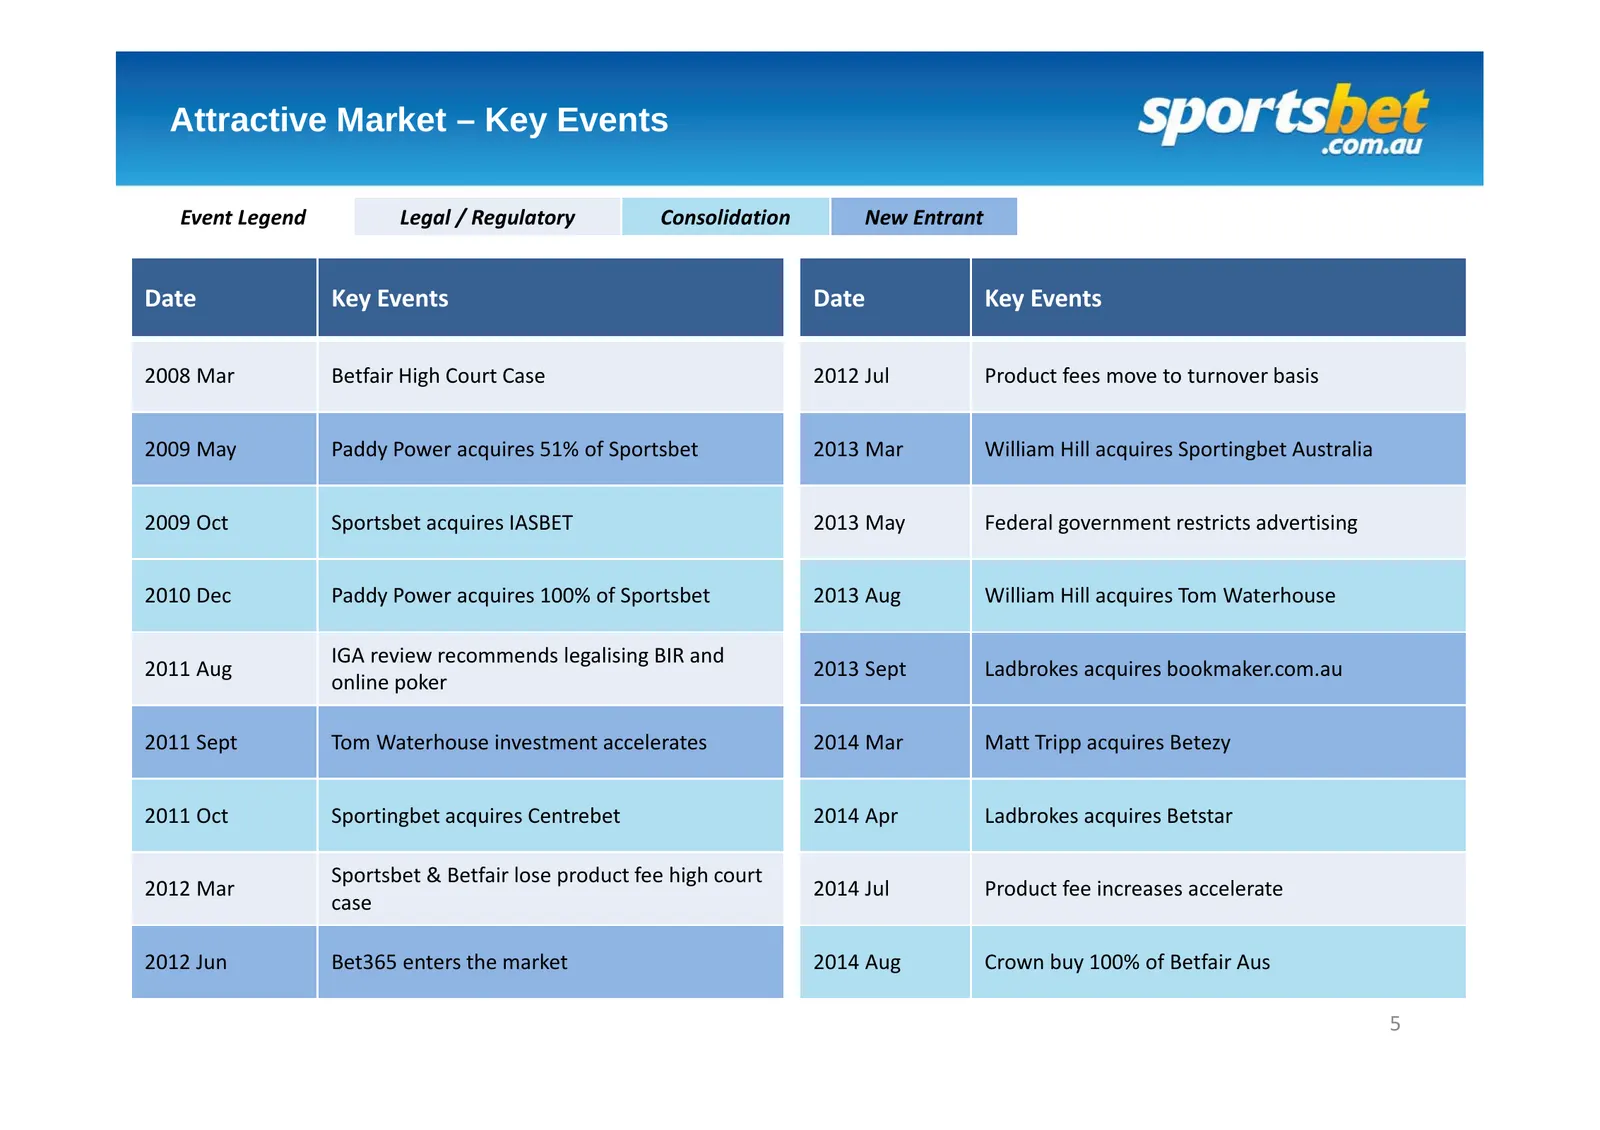
Slide 5: Attractive Market – Key Events
Attractive Market – Key Events Event Legend Legal / Regulatory Consolidation New Entrant Date Key Events Date Key Events 2008 Mar Betfair High Court Case 2012 Jul Product fees move to turnover basis 2009 May Paddy Power acquires 51% of Sportsbet 2013 Mar William Hill acquires Sportingbet Australia 2
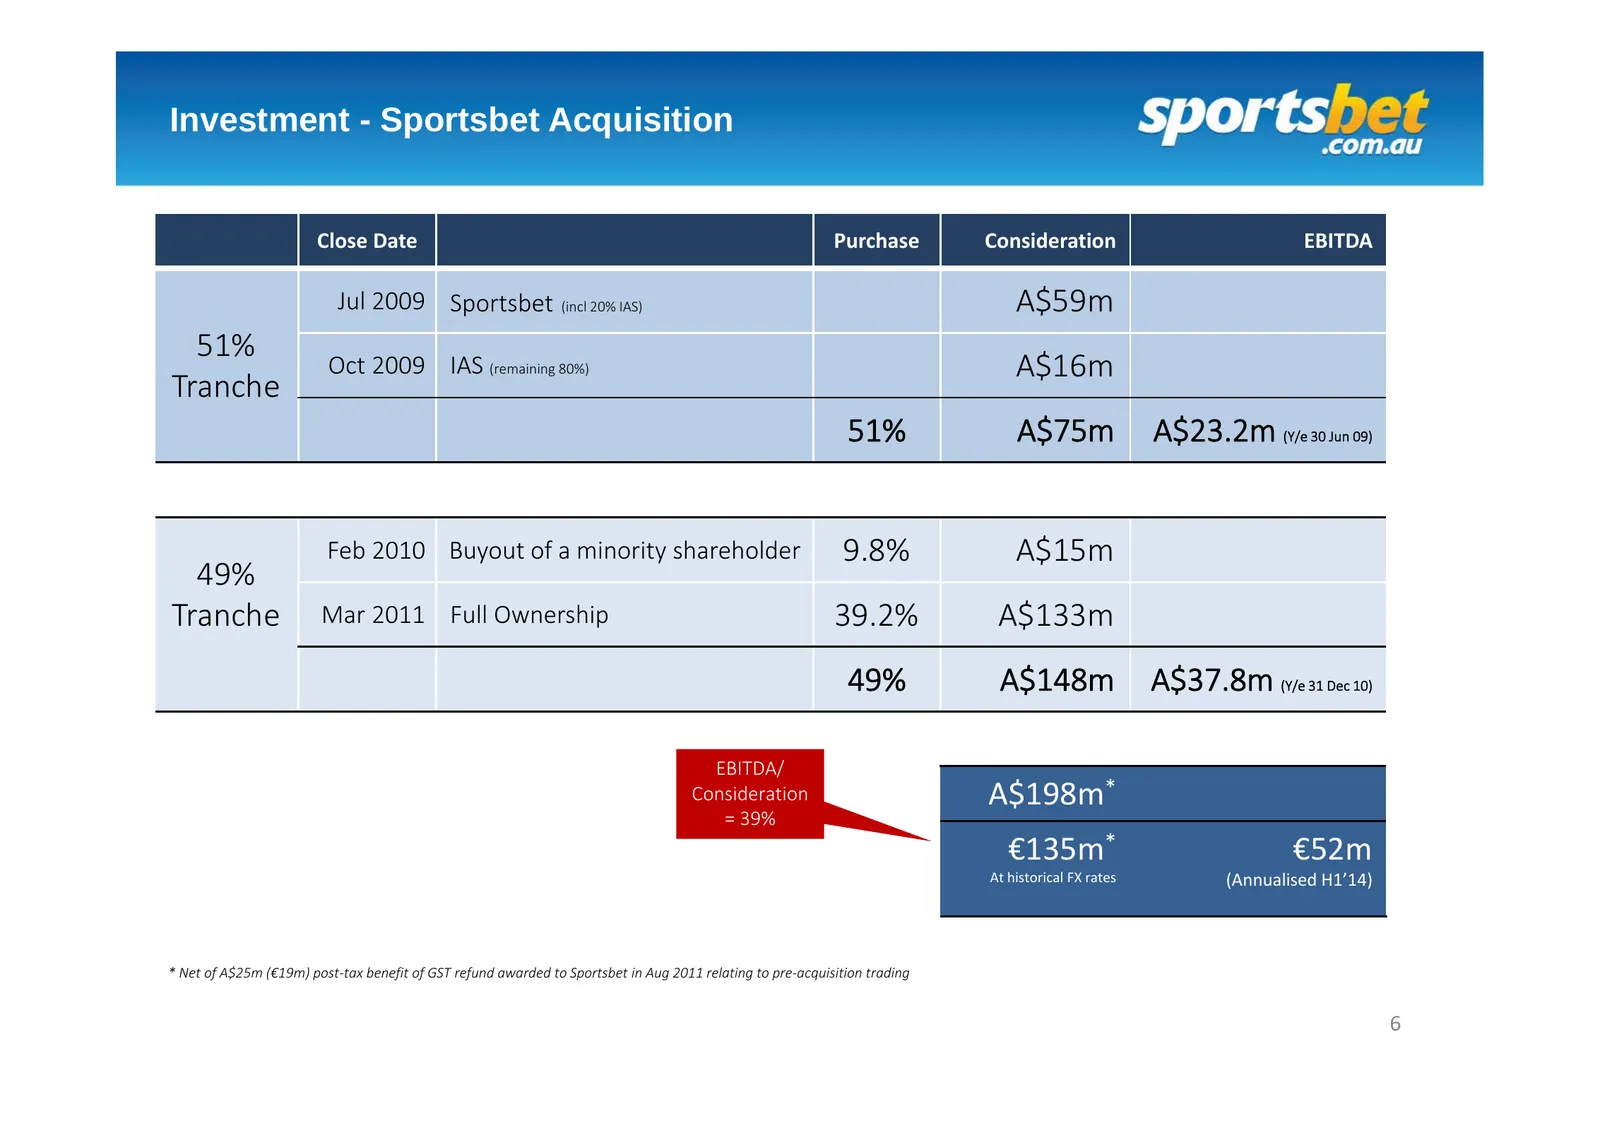
Slide 6: Investment - Sportsbet Acquisition
Investment - Sportsbet Acquisition Close Date Purchase Consideration EBITDA Jul 2009 Sportsbet (incl 20% IAS) A$59m 51% Oct 2009 IAS (remaining 80%) A$16m Tranche 51% A$75m A$23.2m (Y/e 30 Jun 09) Feb 2010 Buyout of a minority shareholder 9.8% A$15m 49% Tranche Mar 2011 Full Ownership 39.2% A$133m 4
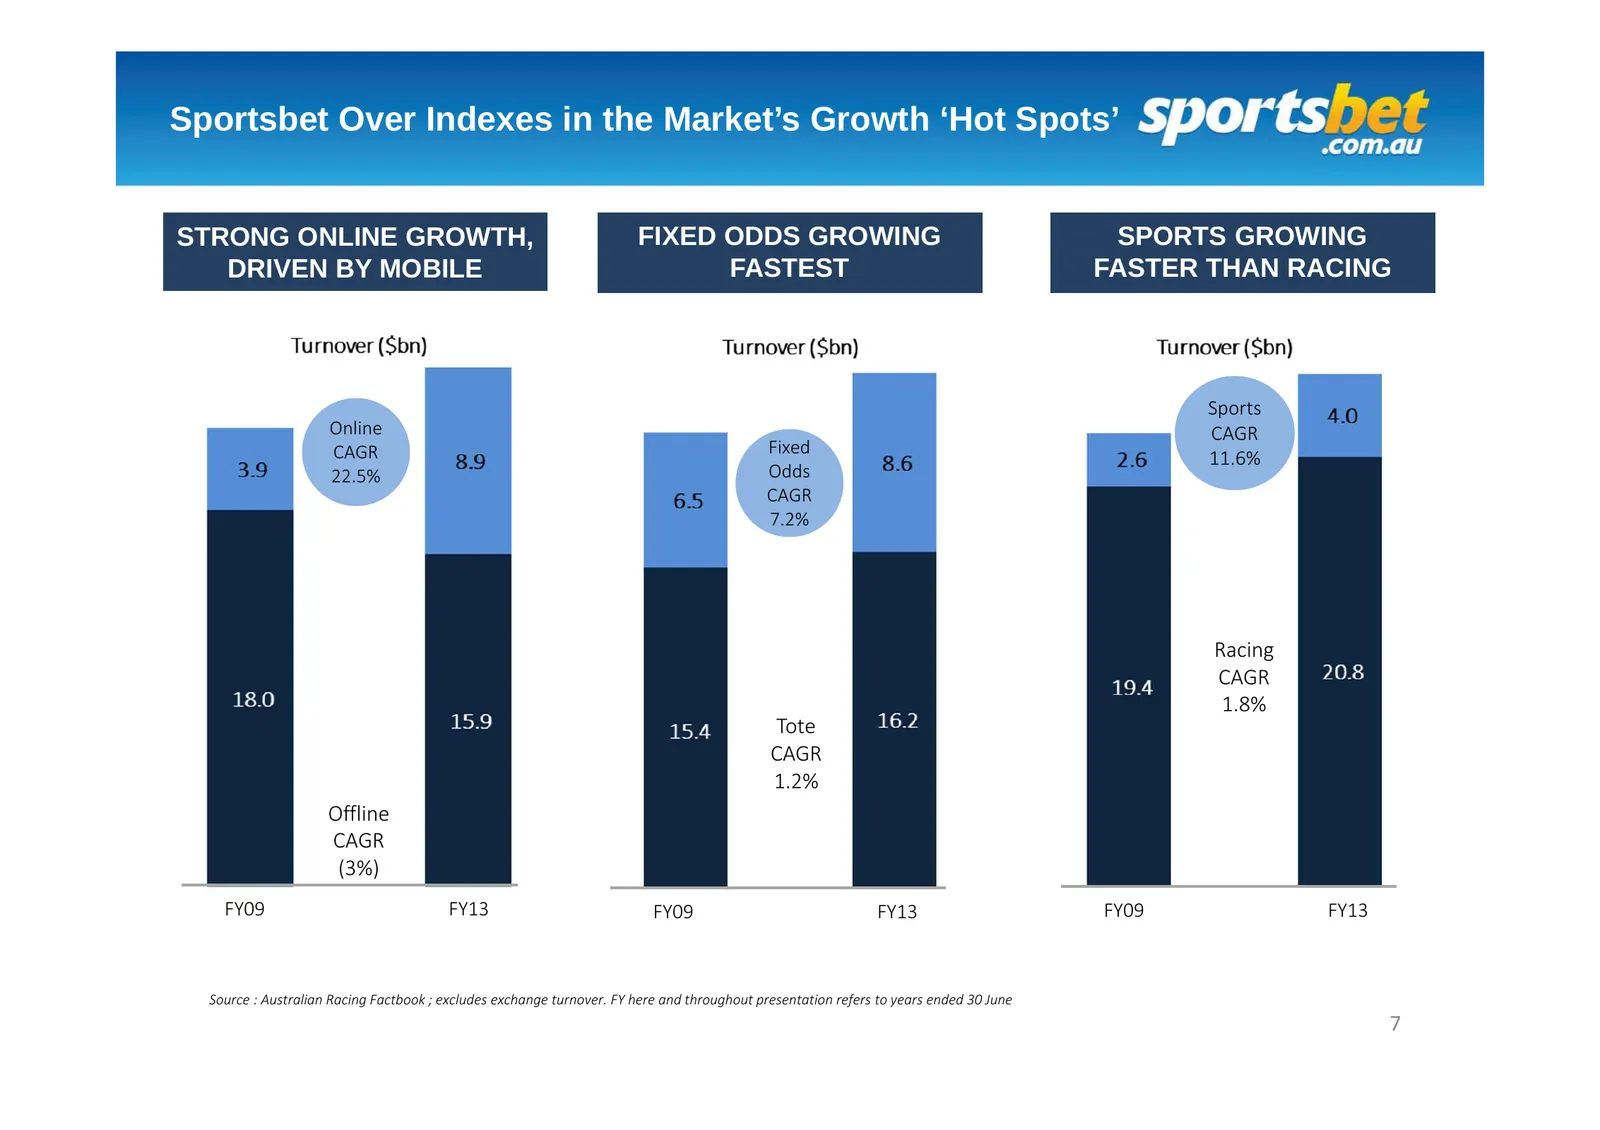
Slide 7: Sportsbet Over Indexes in the Market's Growth 'Hot Spots'
Sportsbet Over Indexes in the Market’s Growth ‘Hot Spots’ STRONG ONLINE GROWTH, FIXED ODDS GROWING SPORTS GROWING DRIVEN BY MOBILE FASTEST FASTER THAN RACING Sports Online CAGR CAGR Fixed 11.6% 22.5% Odds CAGR 7.2% Racing CAGR 1.8% Tote CAGR 1.2% Offline CAGR (3%) FY09 FY13 FY09 FY13 FY09 FY13 Sourc
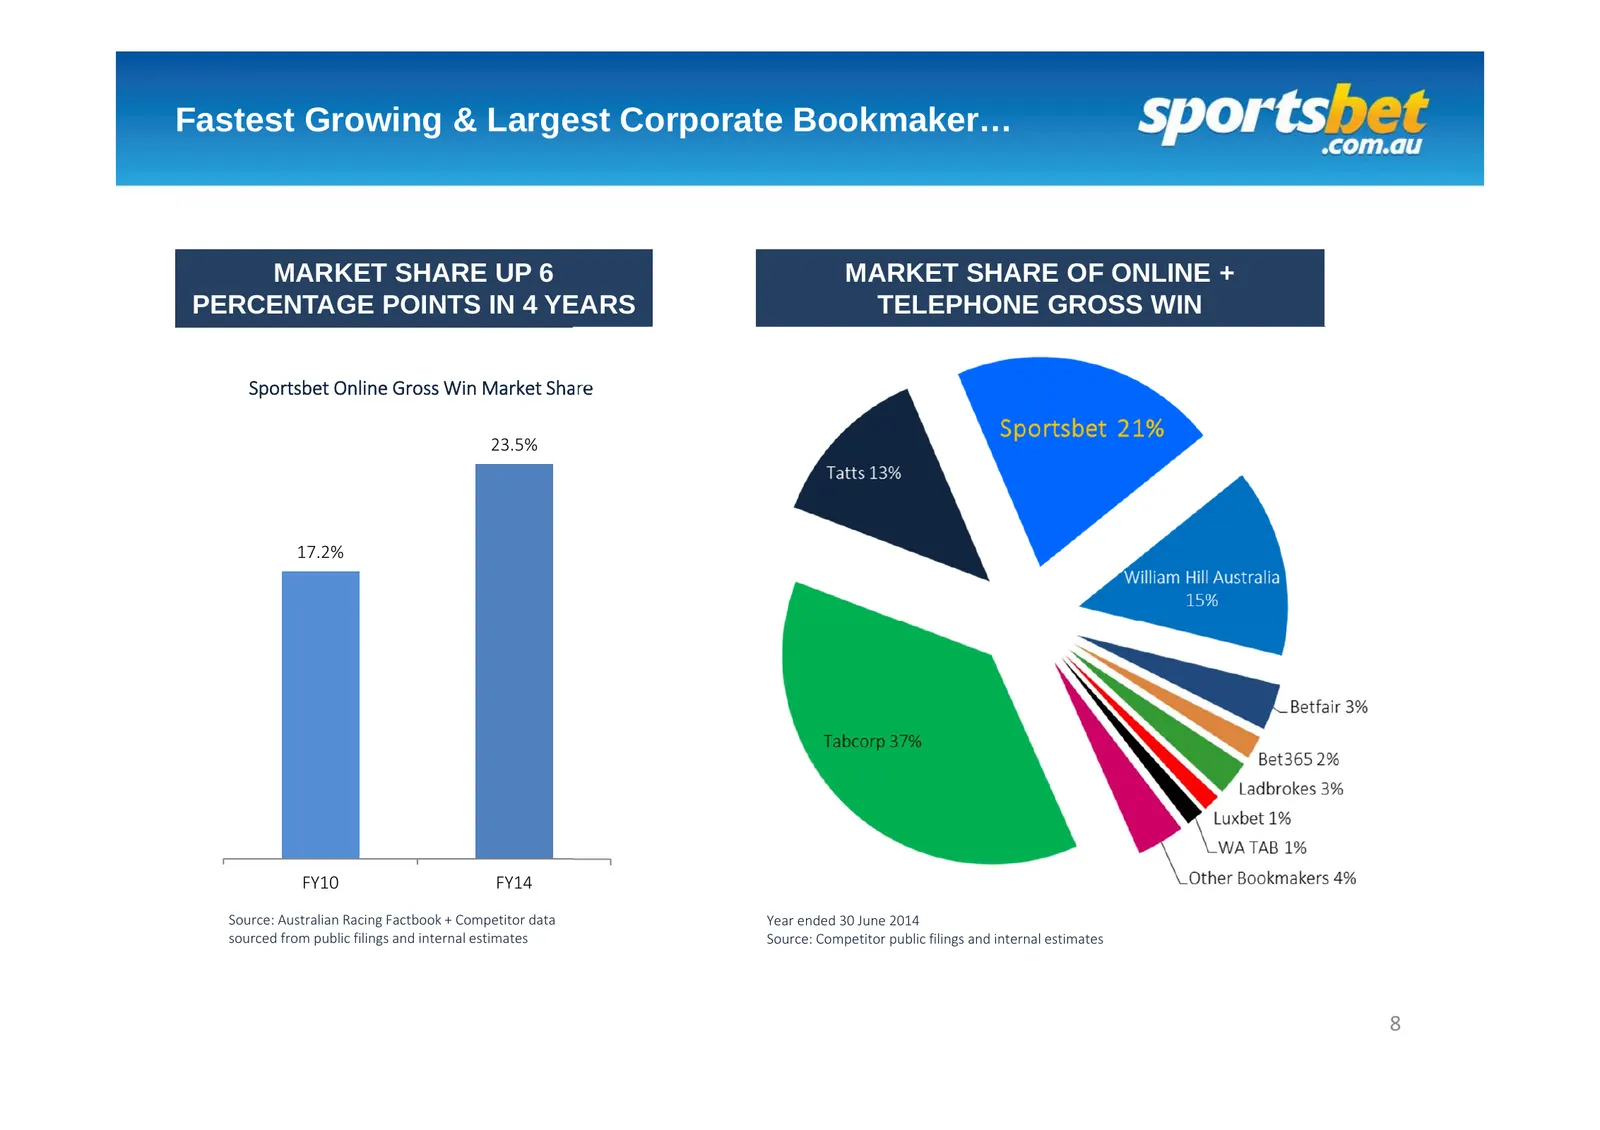
Slide 8: Fastest Growing & Largest Corporate Bookmaker…
Fastest Growing & Largest Corporate Bookmaker… MARKET SHARE UP 6 MARKET SHARE OF ONLINE + PERCENTAGE POINTS IN 4 YEARS TELEPHONE GROSS WIN Sportsbet Online Gross Win Market Share 23.5% 17.2% FY10 FY14 Source: Australian Racing Factbook + Competitor data Year ended 30 June 2014 sourced from public fi
Slide 9: …With Strong Scope for Further Growth
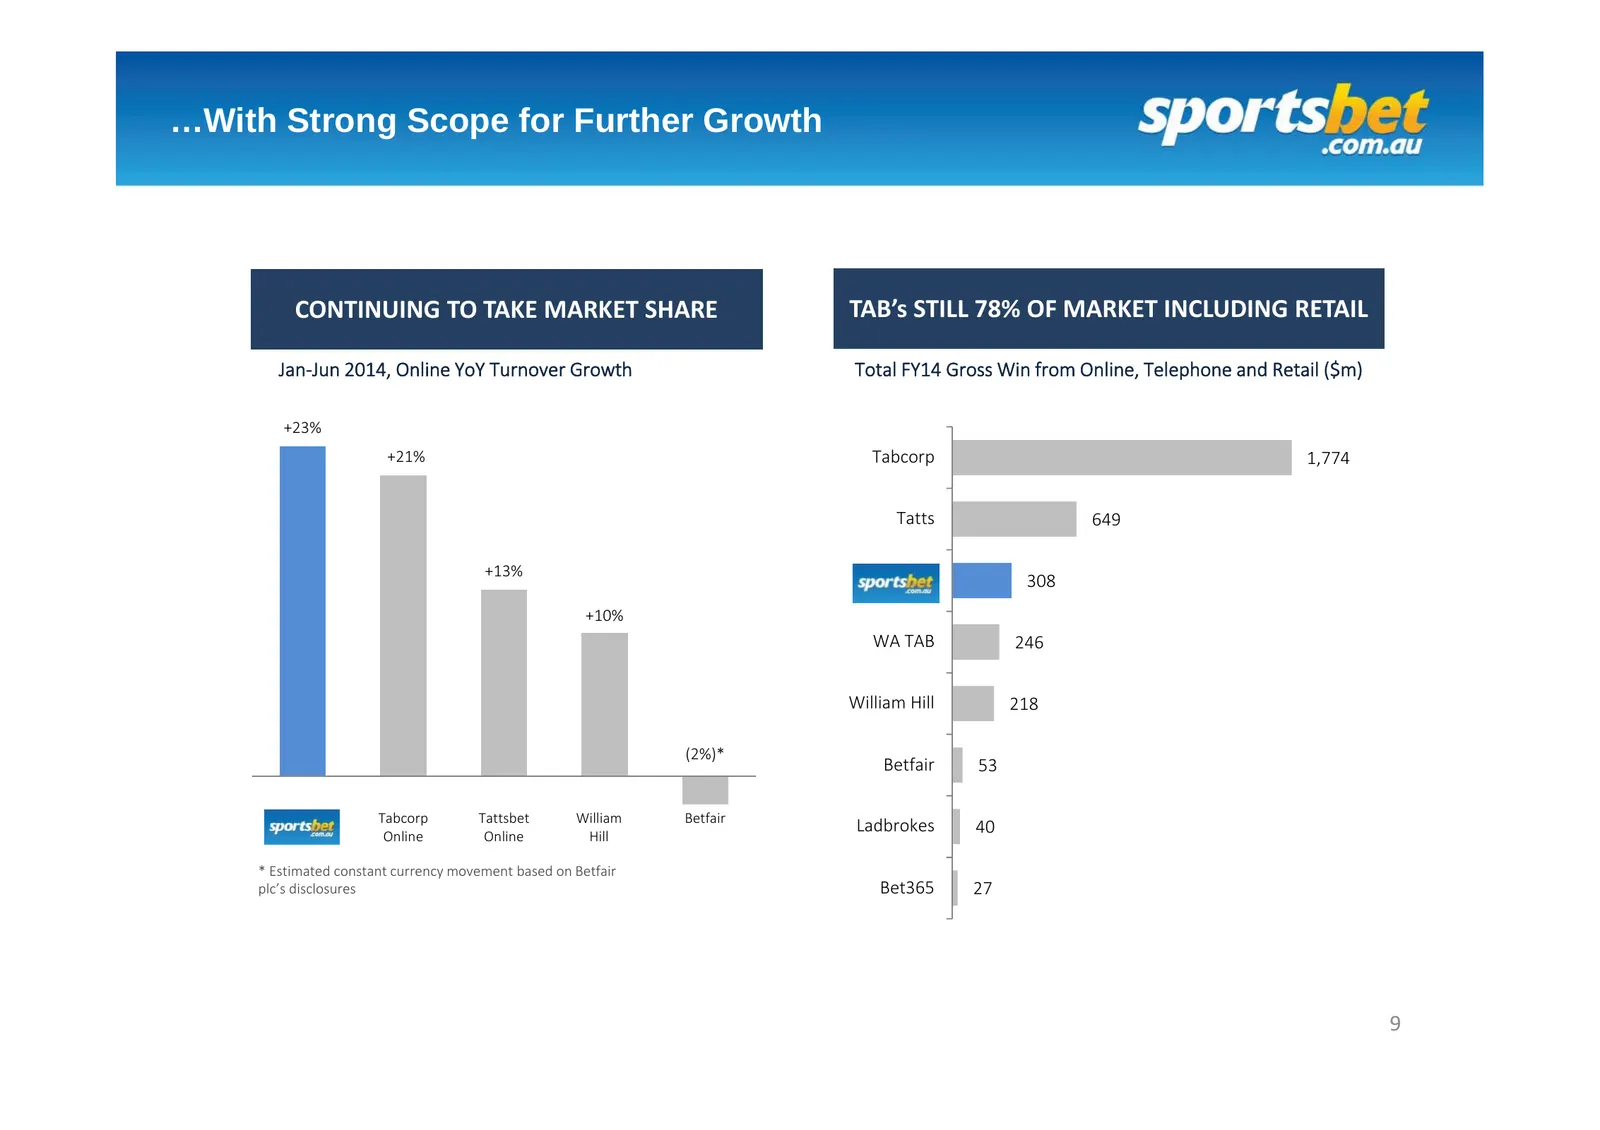
…With Strong Scope for Further Growth CONTINUING TO TAKE MARKET SHARE TAB’s STILL 78% OF MARKET INCLUDING RETAIL Jan‐Jun 2014, Online YoY Turnover Growth Total FY14 Gross Win from Online, Telephone and Retail ($m) +23% +21% Tabcorp 1,774 Tatts 649 +13% Sportsbet 308 +10% WA TAB 246 William Hill 218
Slide 10: Investment - People
Investment - People
Slide 11: Substantial and Continuous Investment in People
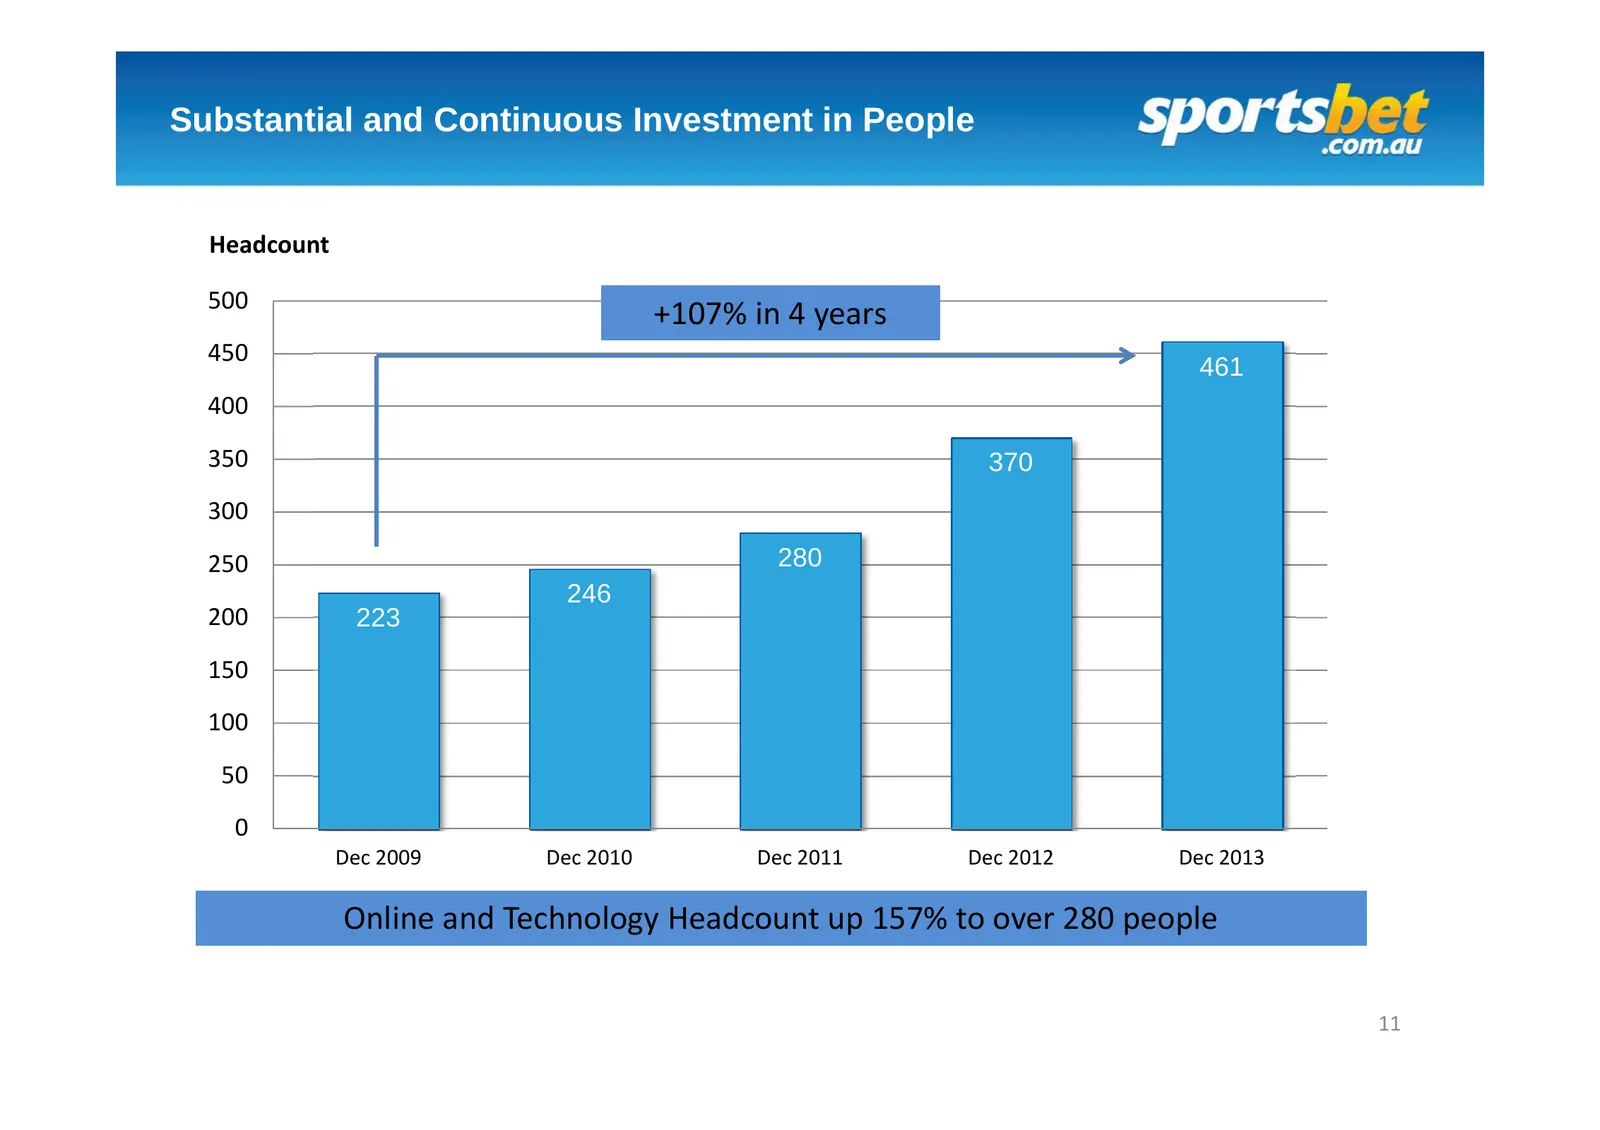
Substantial and Continuous Investment in People Headcount 500 +107% in 4 years 450 461 400 350 370 300 250 280 246 200 223 150 100 50 0 Dec 2009 Dec 2010 Dec 2011 Dec 2012 Dec 2013 Online and Technology Headcount up 157% to over 280 people 11
Slide 12: Sportsbet Management Team – Bio's
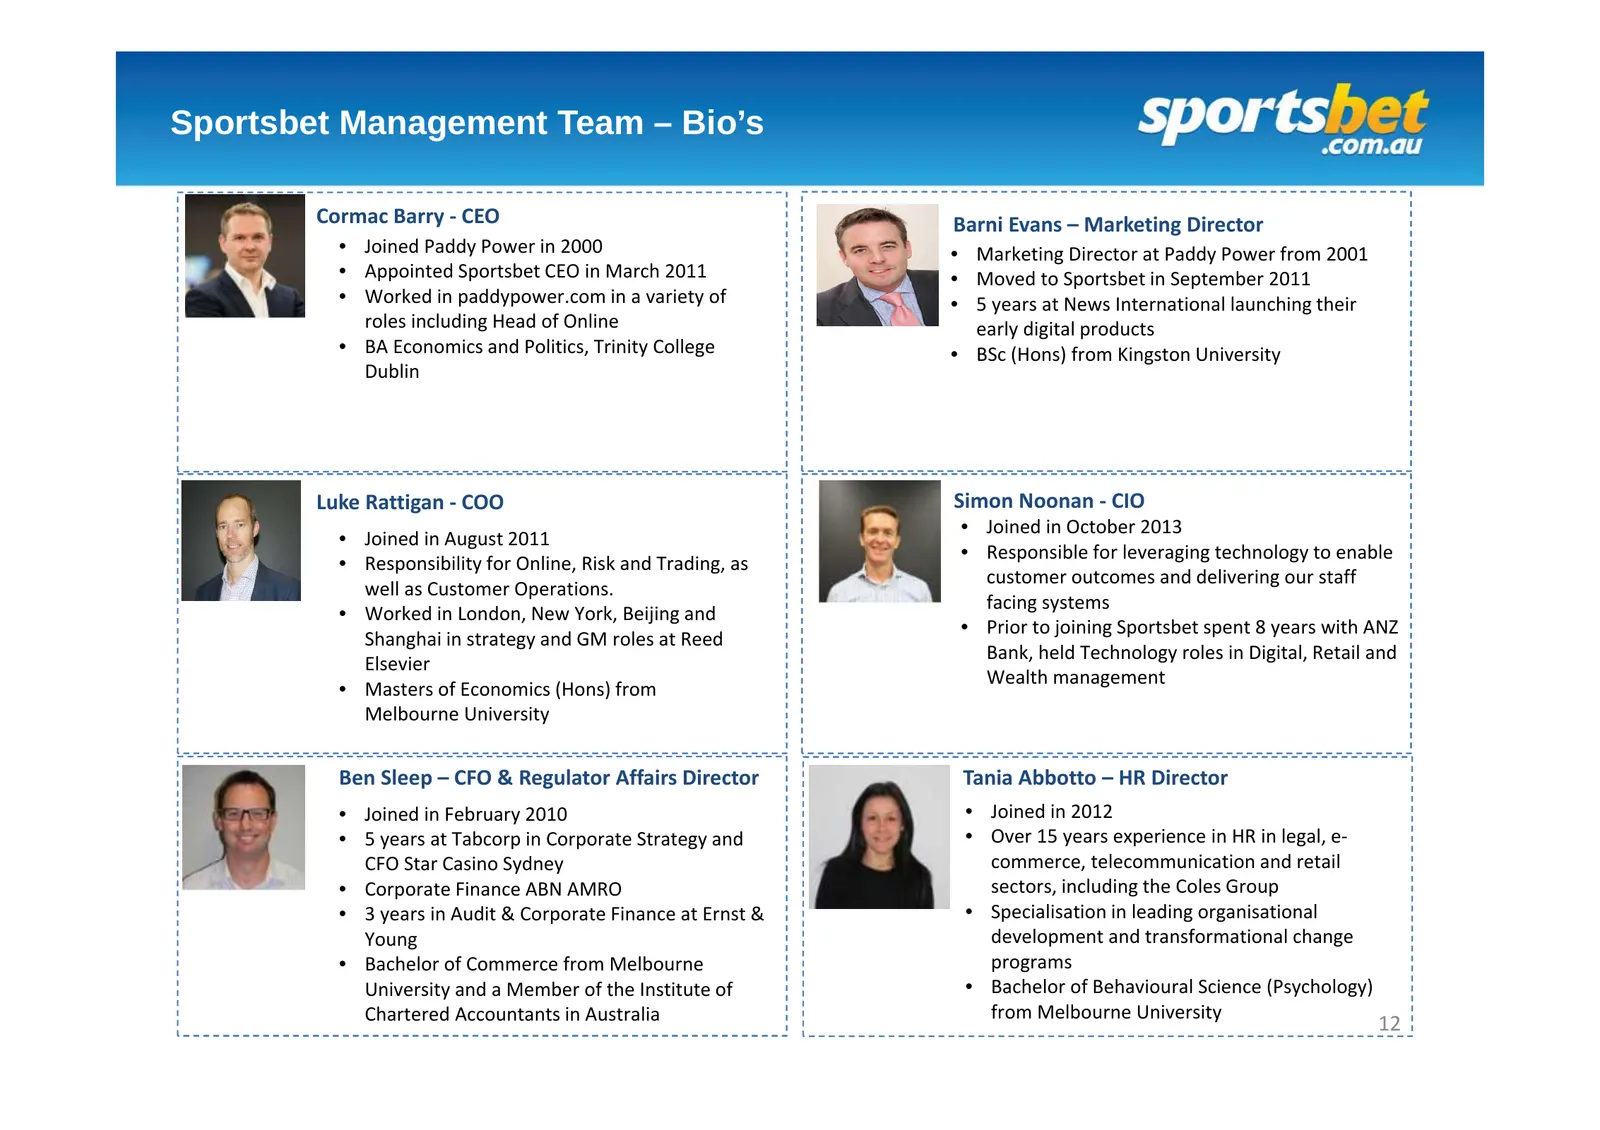
Sportsbet Management Team – Bio’s Cormac Barry ‐ CEO Barni Evans – Marketing Director • Joined Paddy Power in 2000 • Marketing Director at Paddy Power from 2001 • Appointed Sportsbet CEO in March 2011 • Moved to Sportsbet in September 2011 • Worked in paddypower.com in a variety of • 5 years at News
Slide 13: Regulatory Environment
Ben Sleep – CFO & Regulator Affairs Director Regulatory Environment 24 October 2014
Slide 14: Significant Legal/Regulatory Milestones
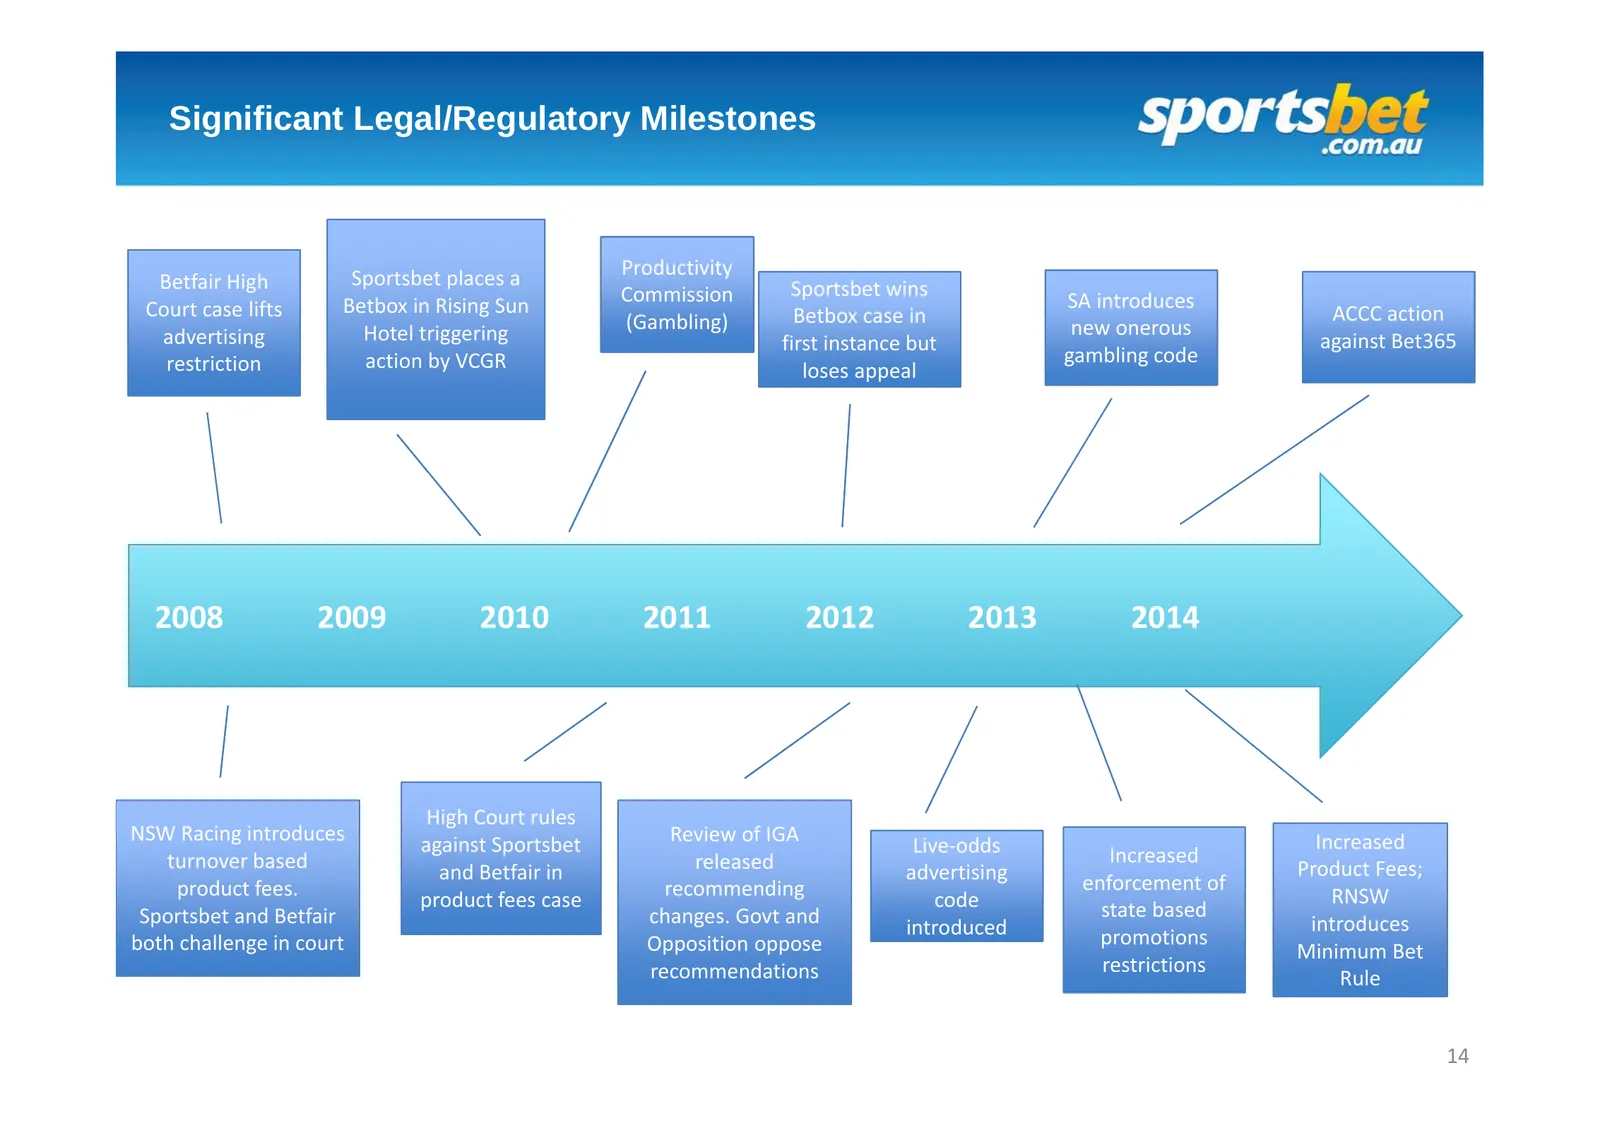
Significant Legal/Regulatory Milestones Sportsbet places a Productivity Betfair High Sportsbet wins Betbox in Rising Sun Commission SA introduces Court case lifts Betbox case in ACCC action Hotel triggering (Gambling) new onerous advertising first instance but against Bet365 restriction action by VC
Slide 15: What Does The Interactive Gambling Act (2001) Prohibit?
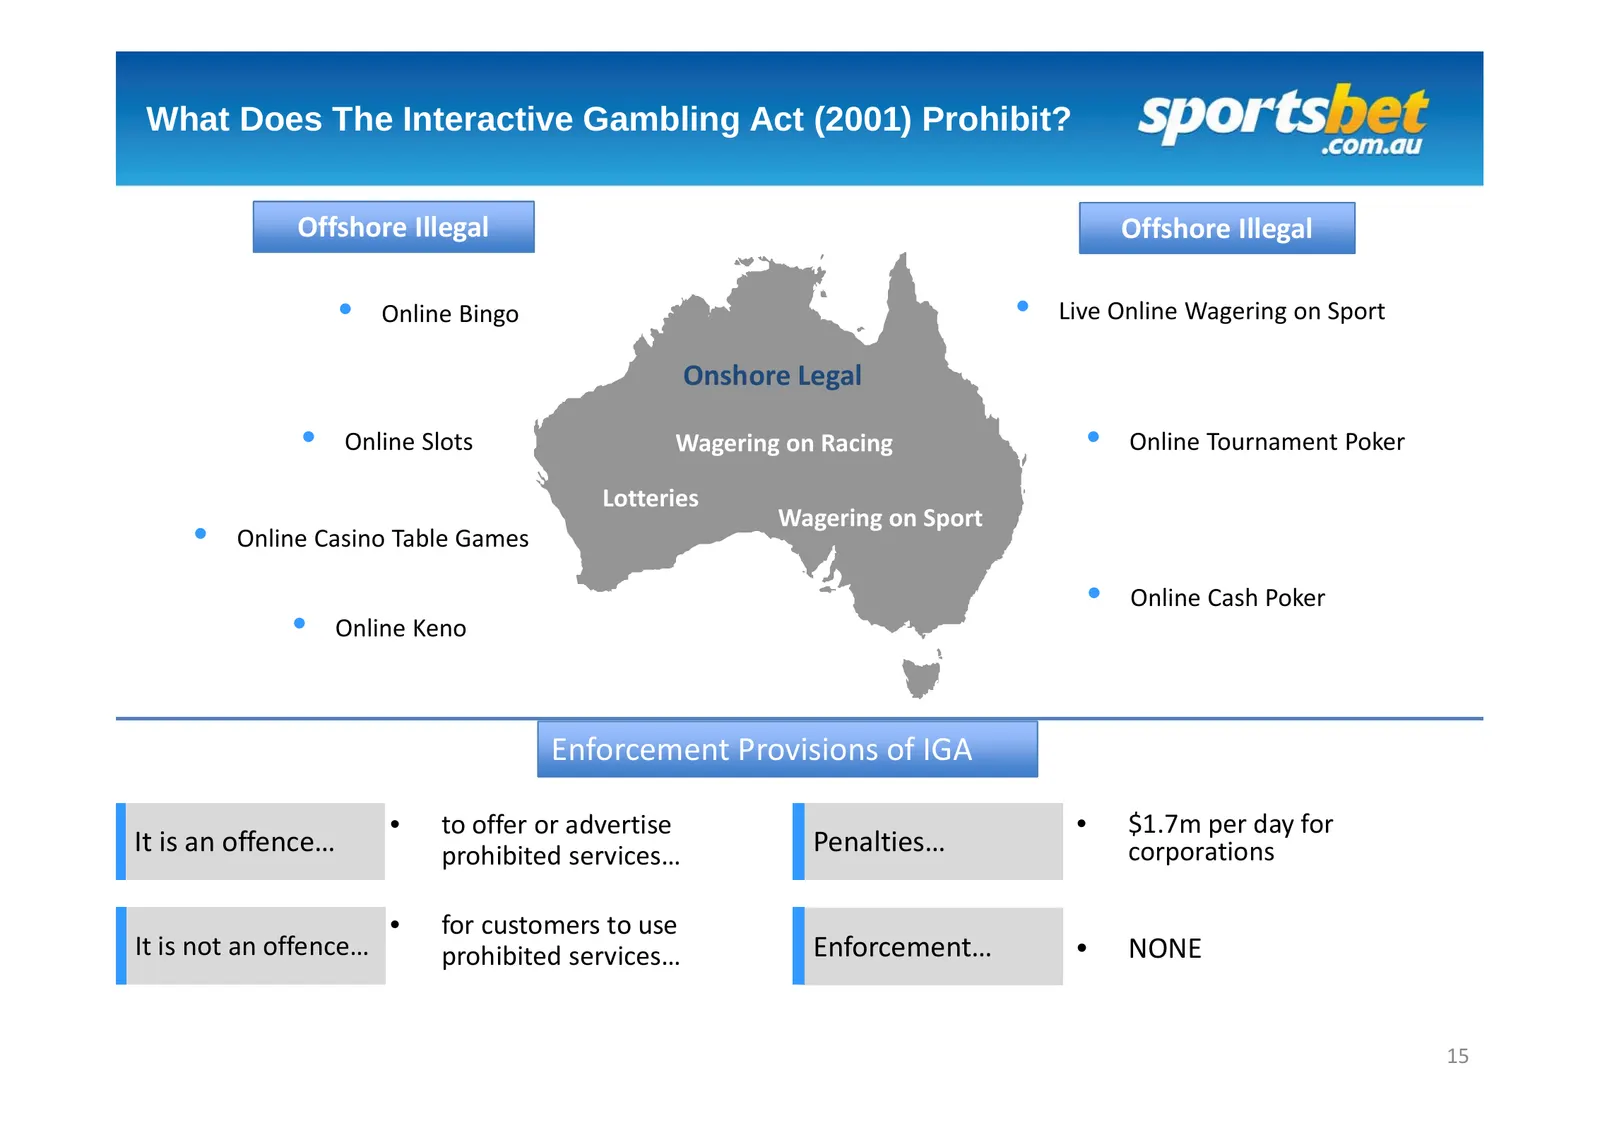
What Does The Interactive Gambling Act (2001) Prohibit? Offshore Illegal Offshore Illegal • Online Bingo • Live Online Wagering on Sport Onshore Legal • Online Slots Wagering on Racing • Online Tournament Poker Lotteries Wagering on Sport • Online Casino Table Games • Online Cash Poker • Online Keno
Slide 16: Onshore/Offshore Online Gross Win
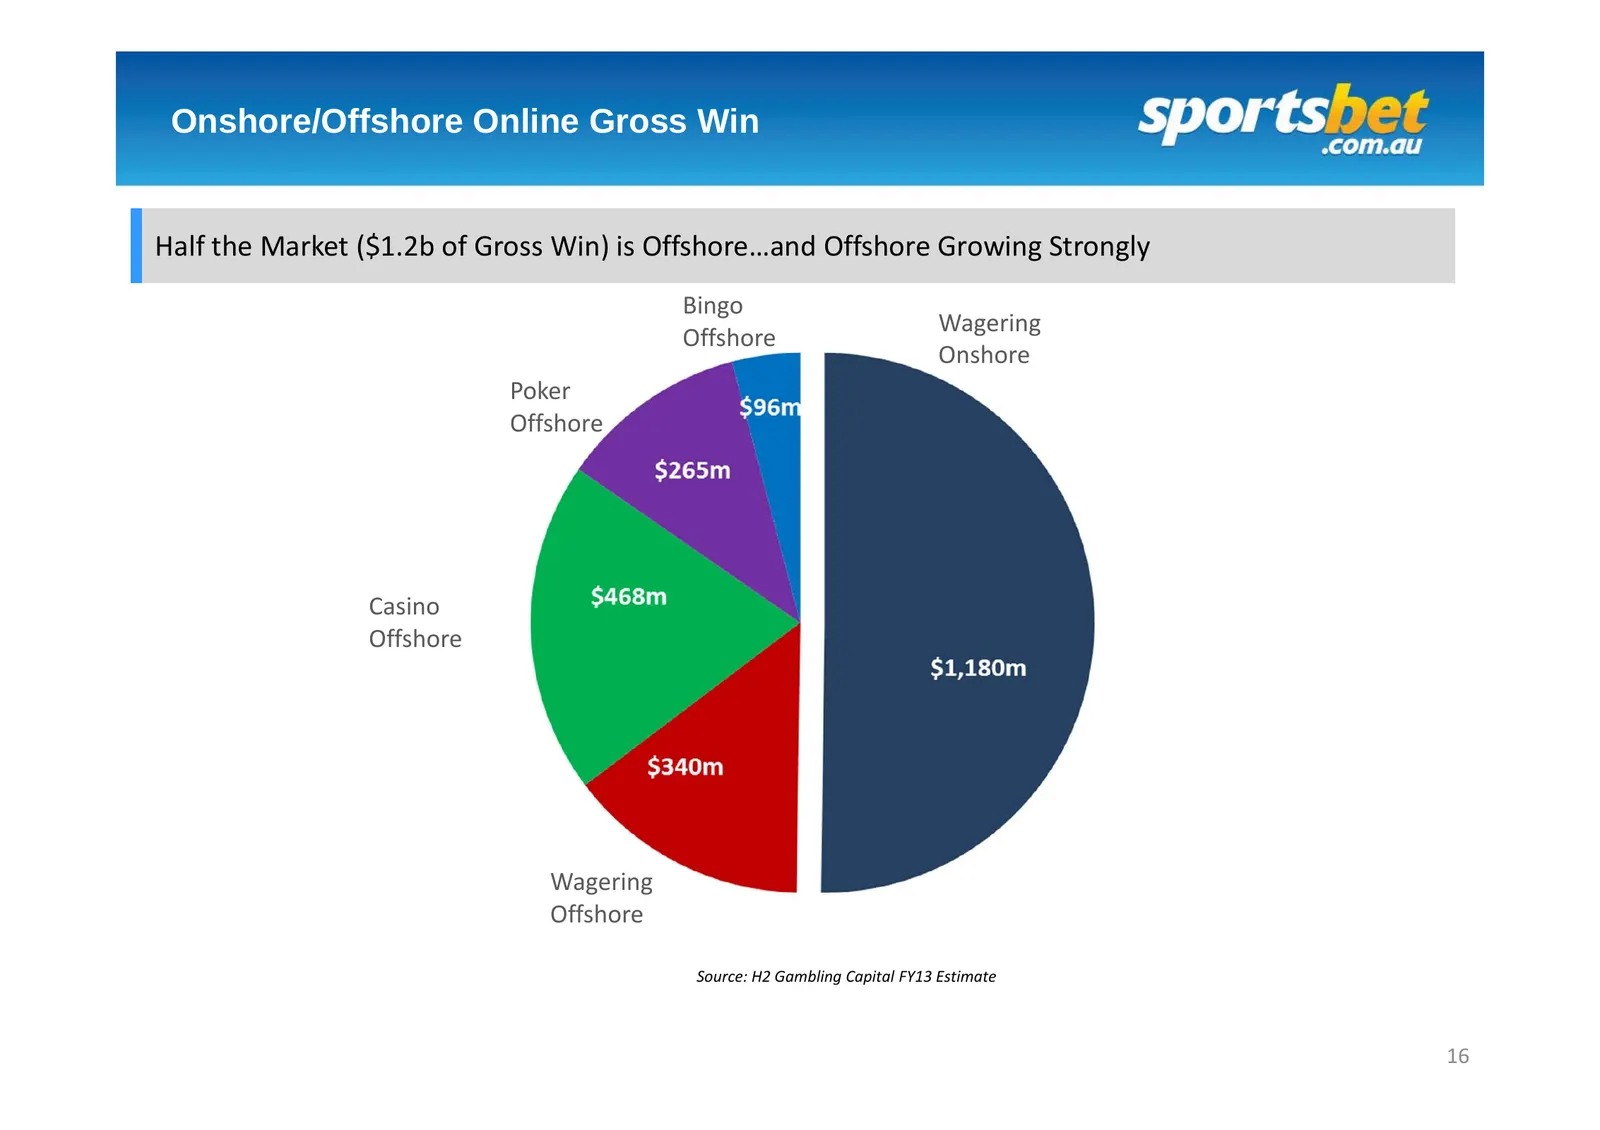
Onshore/Offshore Online Gross Win Half the Market ($1.2b of Gross Win) is Offshore…and Offshore Growing Strongly Bingo Wagering Offshore Onshore Poker Offshore Casino Offshore Wagering Offshore Source: H2 Gambling Capital FY13 Estimate 16
Slide 17: Liberal-National Coalition Government
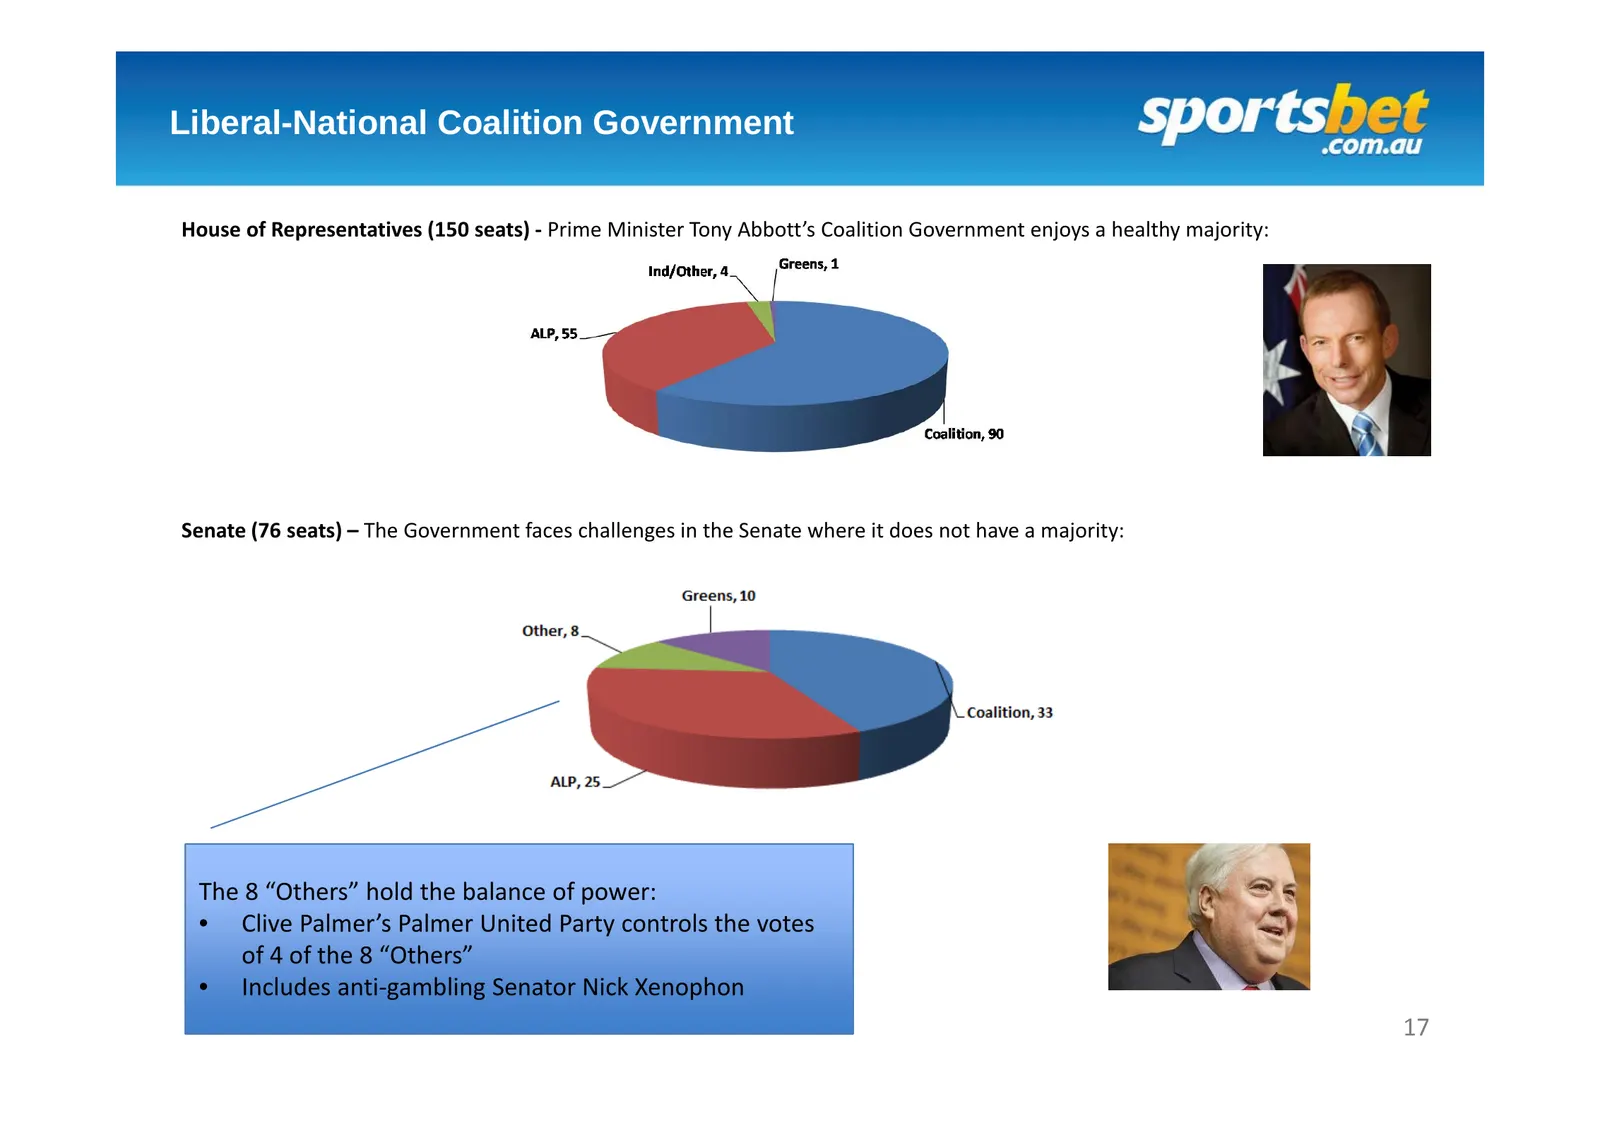
Liberal-National Coalition Government House of Representatives (150 seats) ‐ Prime Minister Tony Abbott’s Coalition Government enjoys a healthy majority: Senate (76 seats) – The Government faces challenges in the Senate where it does not have a majority: The 8 “Others” hold the balance of power: • C
Slide 18: Federal Government Gambling Policy
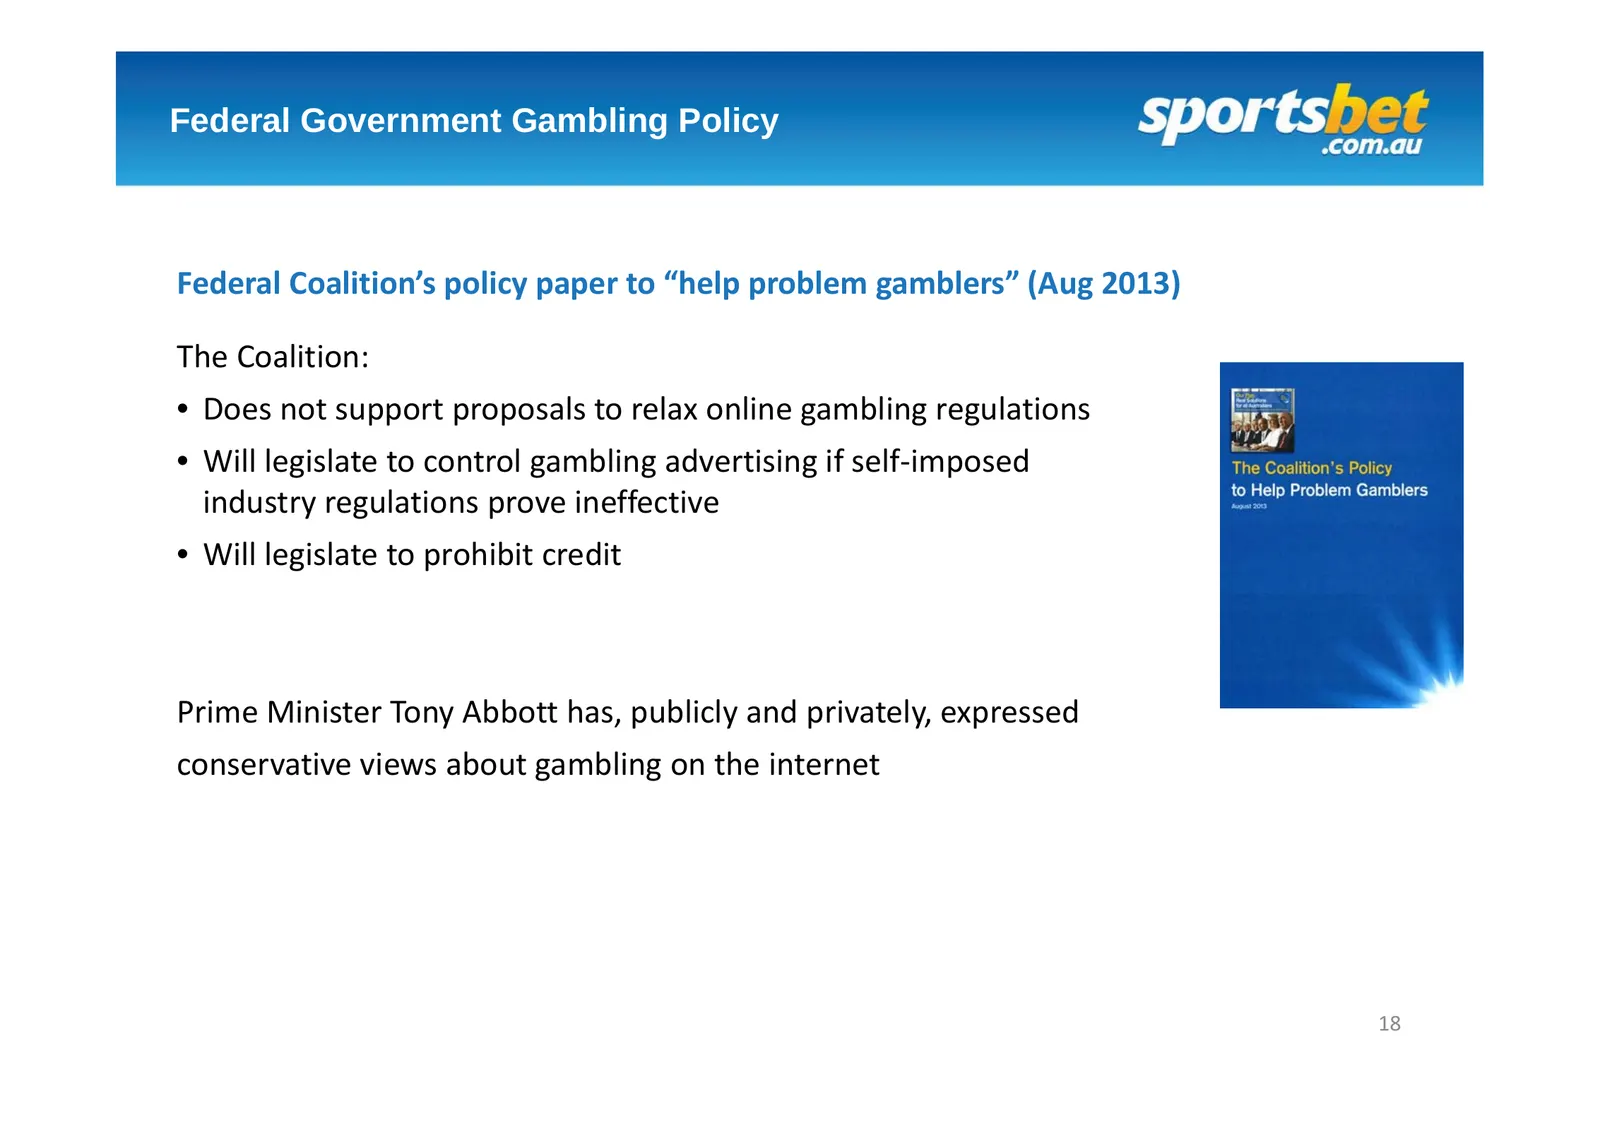
Federal Government Gambling Policy Federal Coalition’s policy paper to “help problem gamblers” (Aug 2013) The Coalition: • Does not support proposals to relax online gambling regulations • Will legislate to control gambling advertising if self‐imposed industry regulations prove ineffective • Will le
Slide 19: State & Territory Landscape
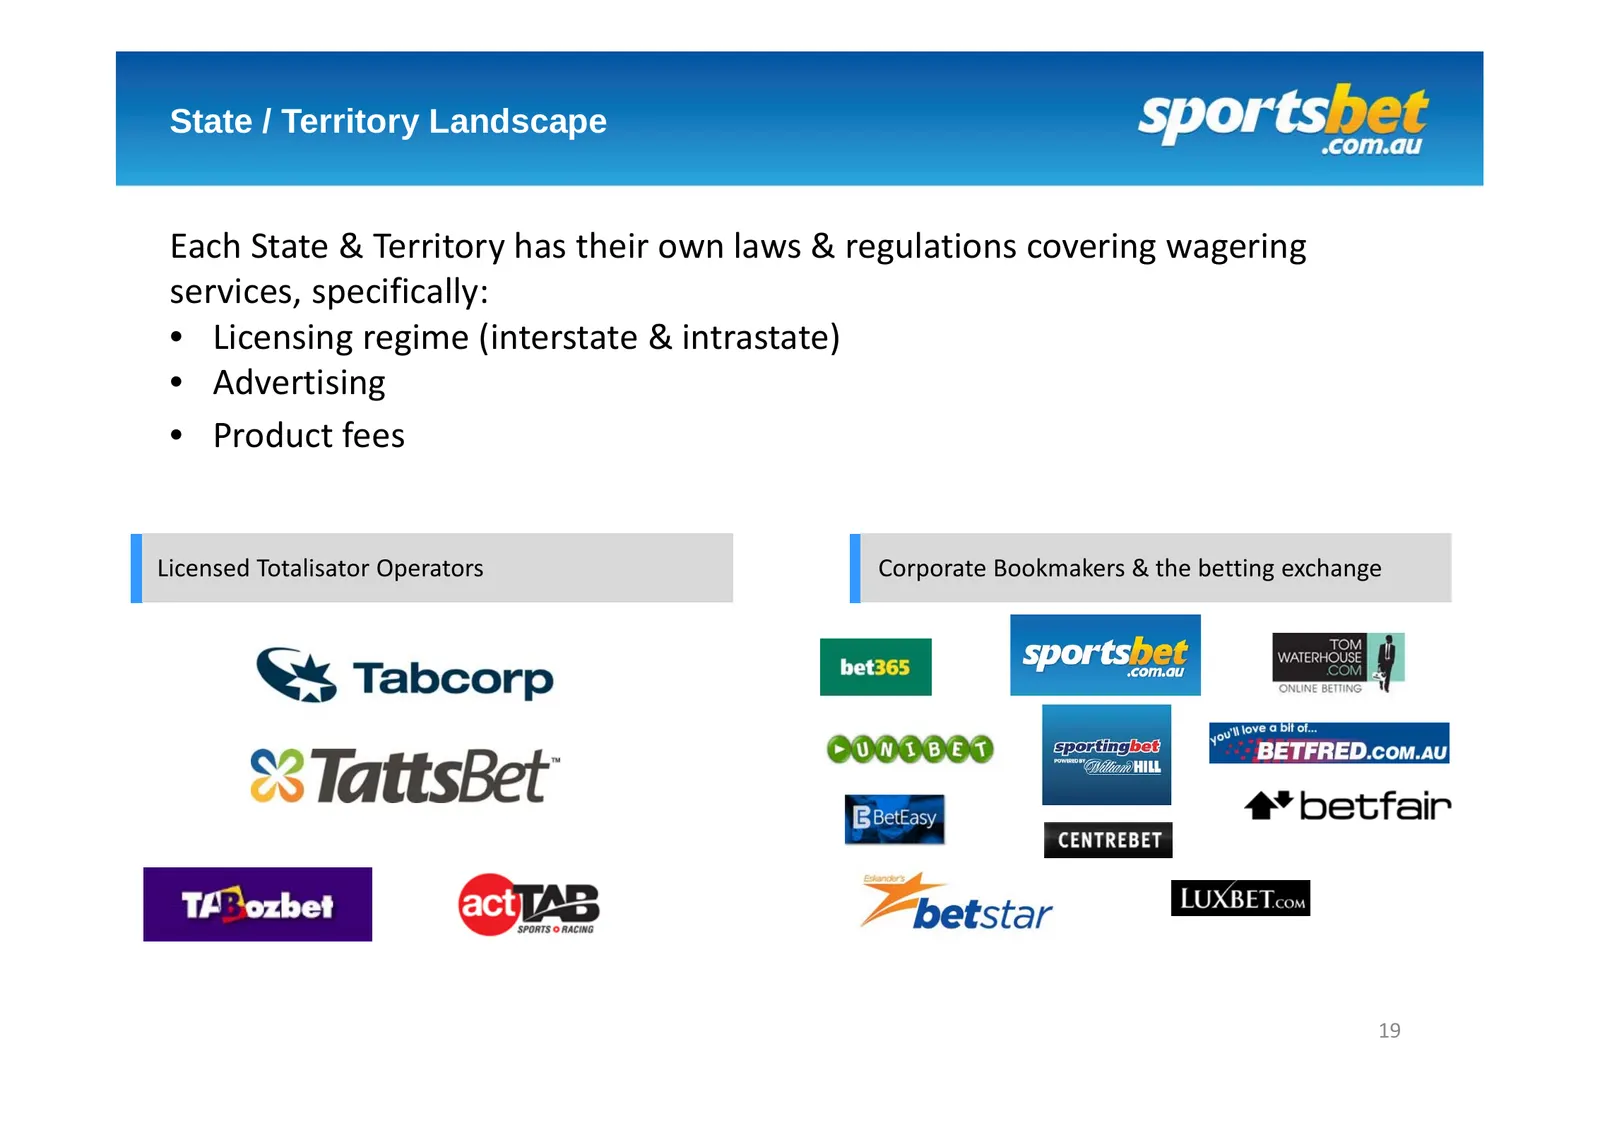
State / Territory Landscape Each State & Territory has their own laws & regulations covering wagering services, specifically: • Licensing regime (interstate & intrastate) • Advertising • Product fees Licensed Totalisator Operators Corporate Bookmakers & the betting exchange 19
Slide 20: State-Based Competition Issues
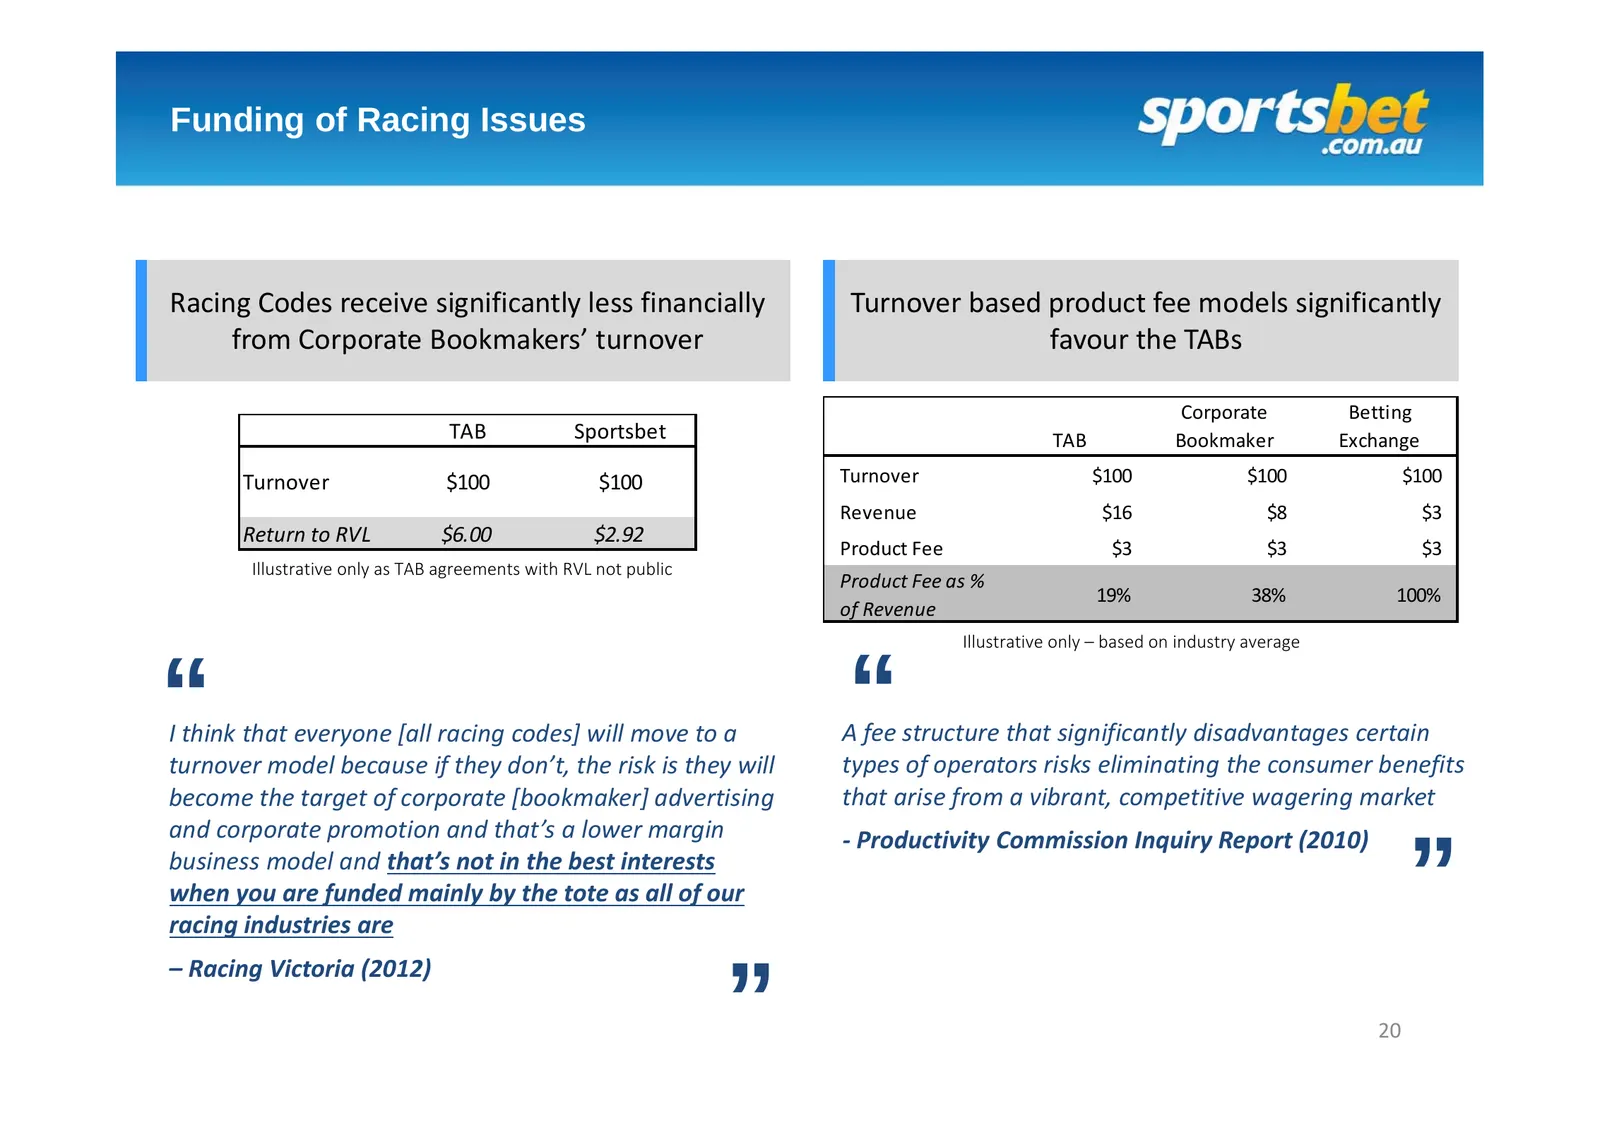
Funding of Racing Issues State‐Based Competition Issues Racing Codes receive significantly less financially Turnover based product fee models significantly from Corporate Bookmakers’ turnover favour the TABs Corporate Betting TAB Sportsbet TAB Bookmaker Exchange Turnover $100 $100 Turnover $100 $100
Slide 21: Future Direction of Regulation
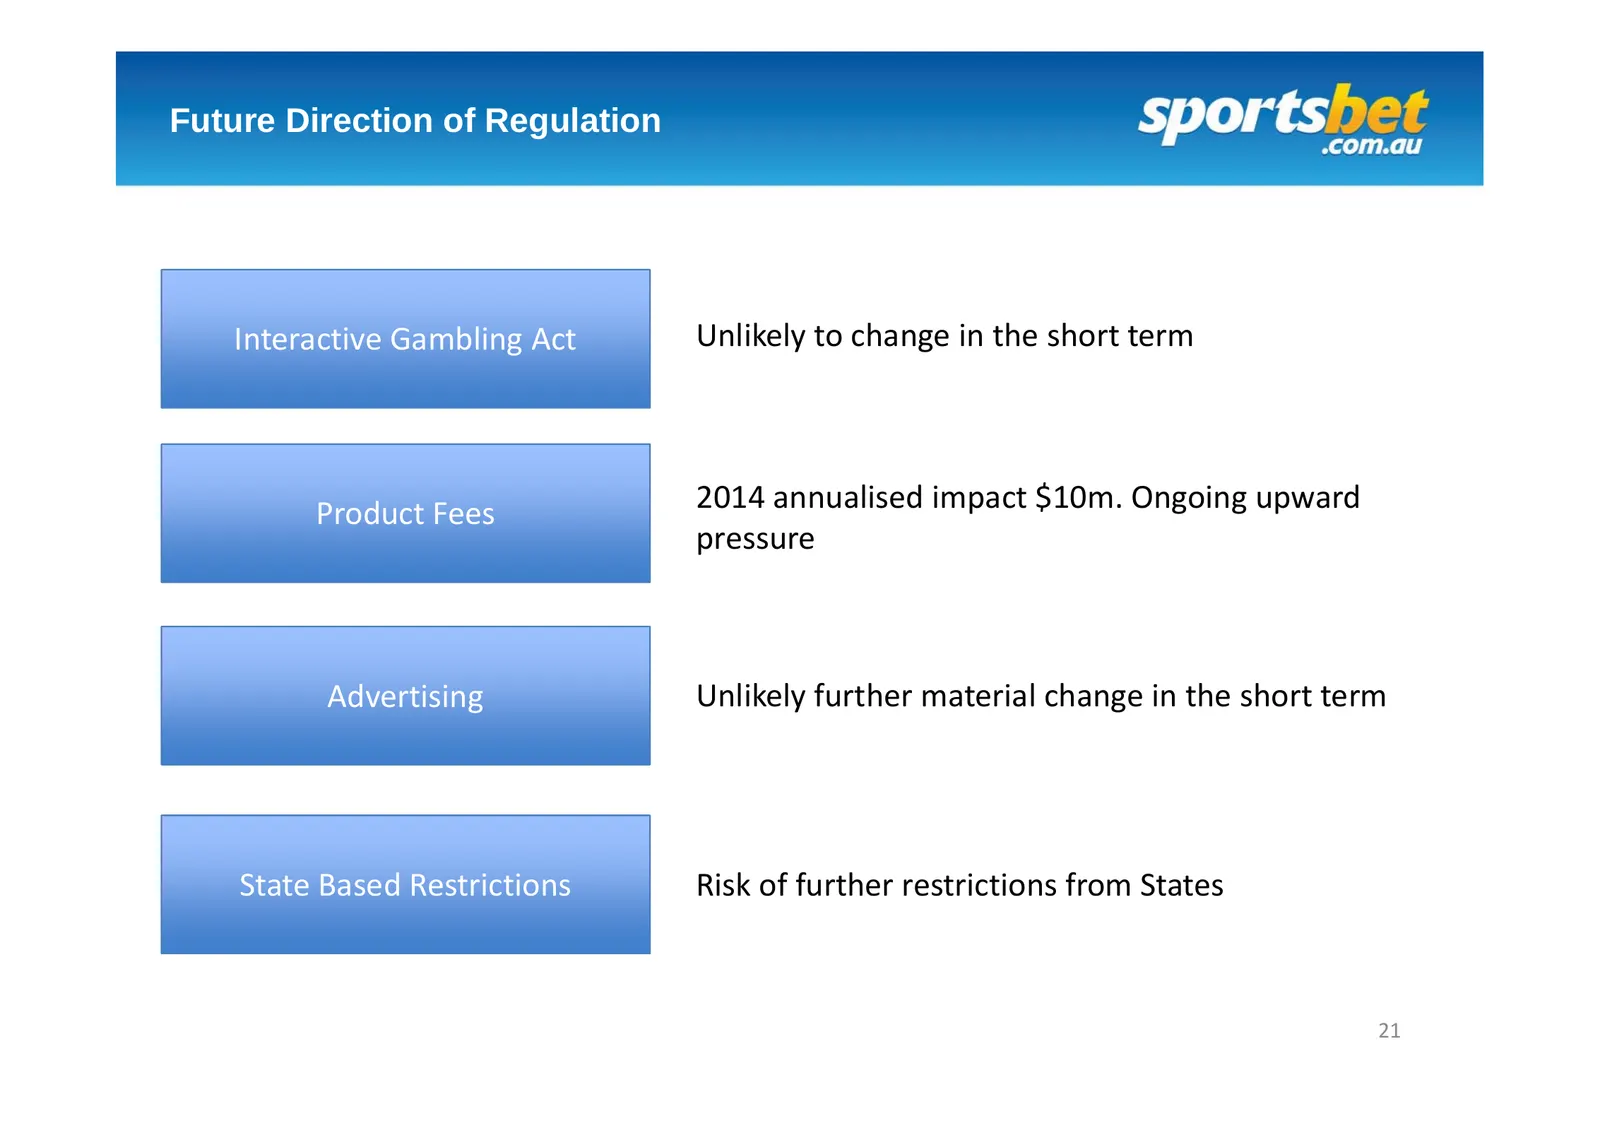
Future Direction of Regulation Interactive Gambling Act Unlikely to change in the short term Product Fees 2014 annualised impact $10m. Ongoing upward pressure Advertising Unlikely further material change in the short term State Based Restrictions Risk of further restrictions from States 21
Slide 22: Risk & Trading, Online & Customer Operations
Luke Rattigan – Chief Operating Officer Risk & Trading, Online & Customer Operations 24 October 2014
Slide 23: Risk & Trading
Risk & Trading
Slide 24: Risk & Trading Overview
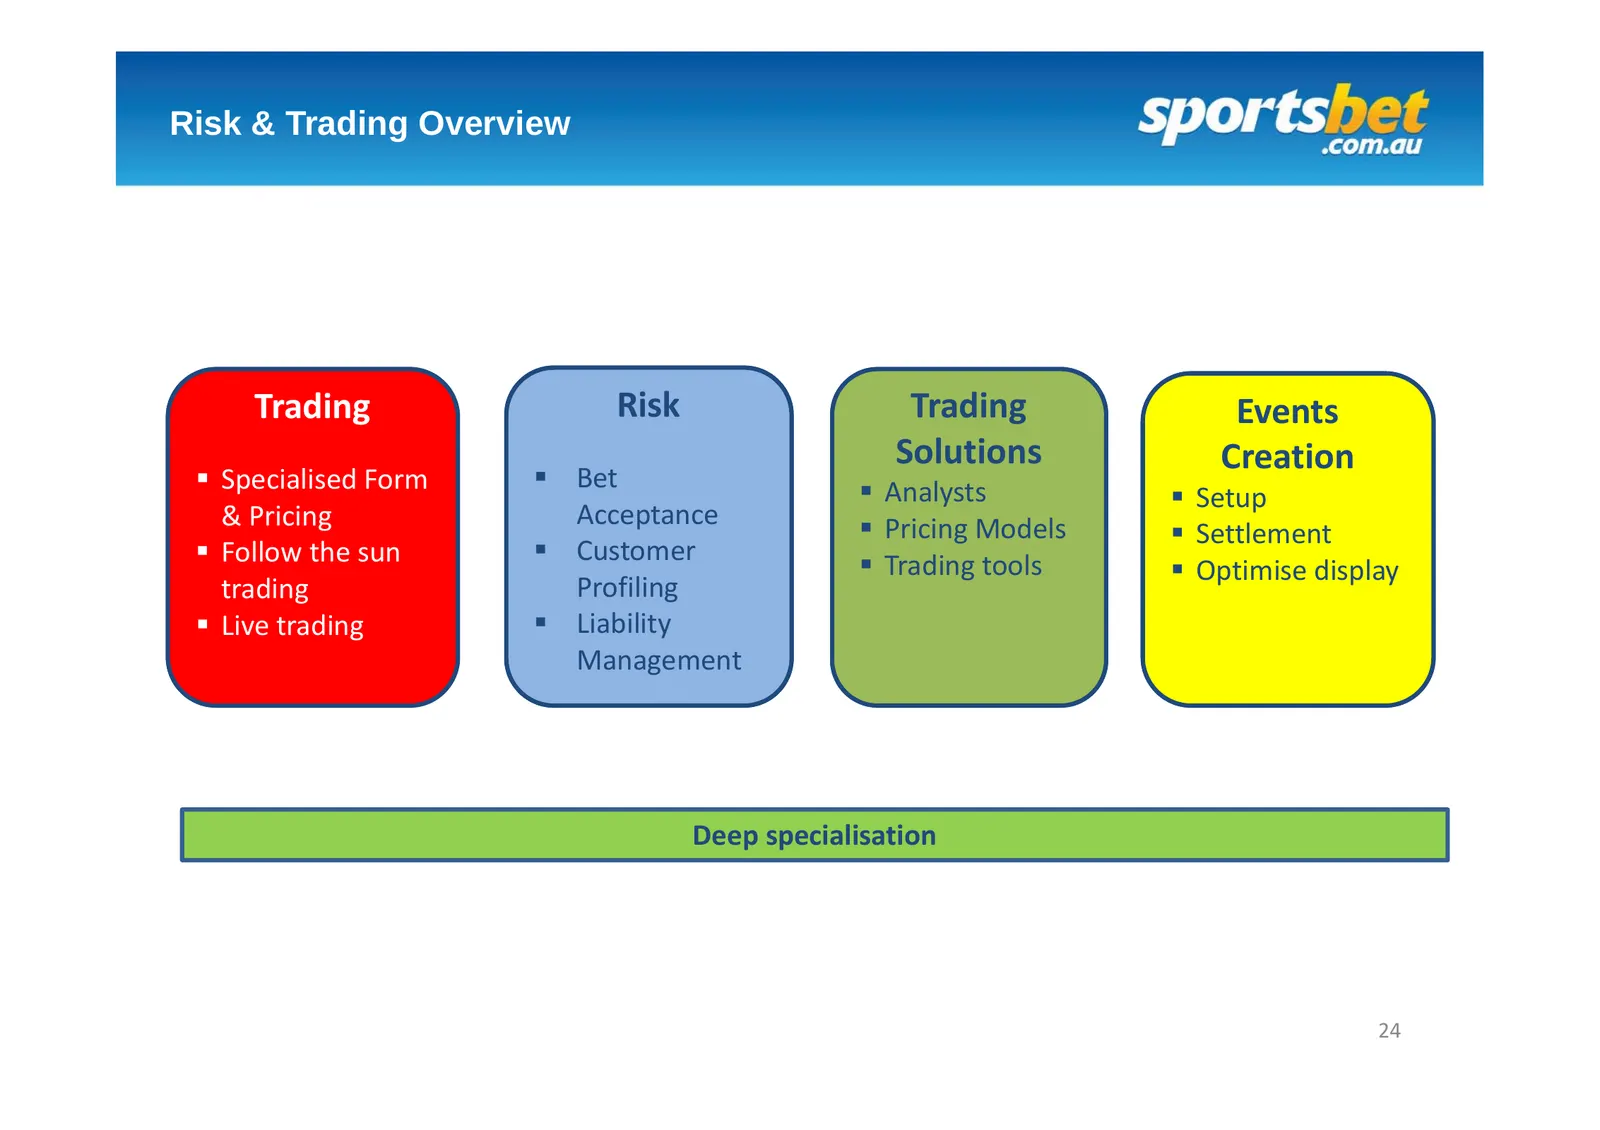
Risk & Trading Overview Trading Risk Trading Events Solutions Creation Specialised Form Bet Analysts Setup & Pricing Acceptance Pricing Models Settlement Follow the sun Customer Trading tools Optimise display trading Profiling Live trading Liability Management Deep specialisa
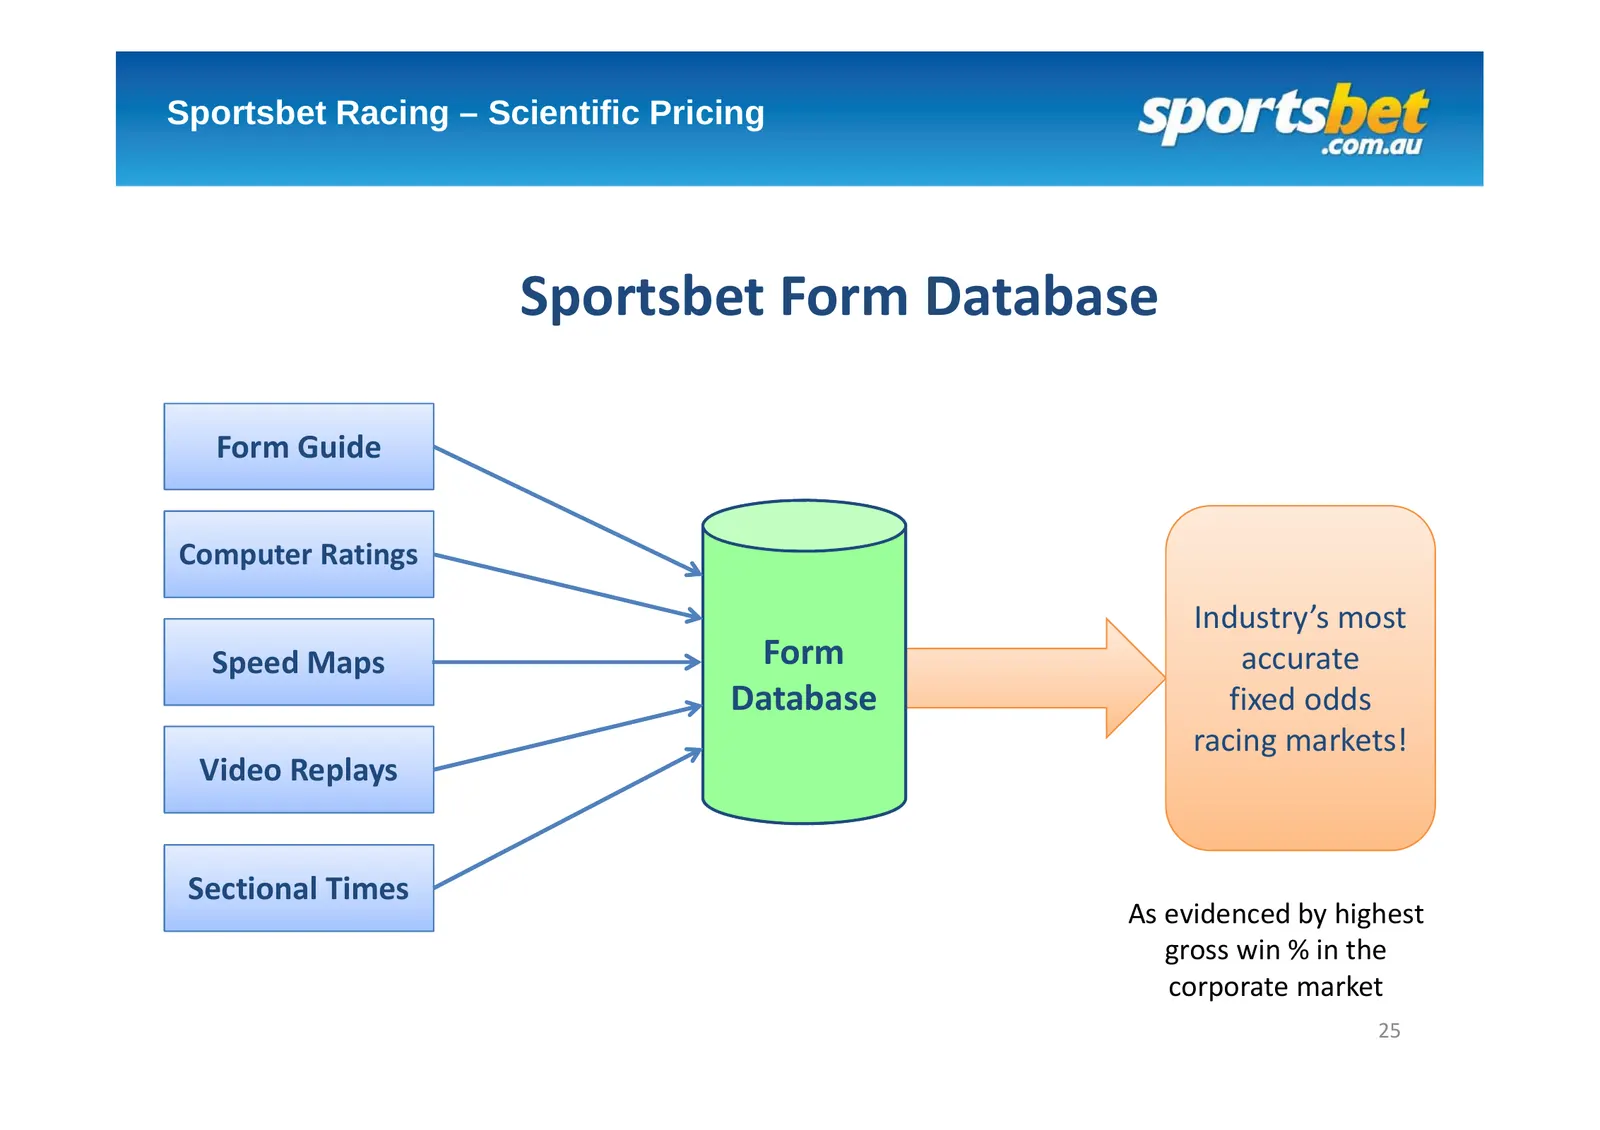
Slide 25: Sportsbet Racing – Scientific Pricing
Sportsbet Racing – Scientific Pricing Sportsbet Form Database Form Guide Computer Ratings Industry’s most Speed Maps Form accurate Database fixed odds racing markets! Video Replays Sectional Times As evidenced by highest gross win % in the corporate market 25
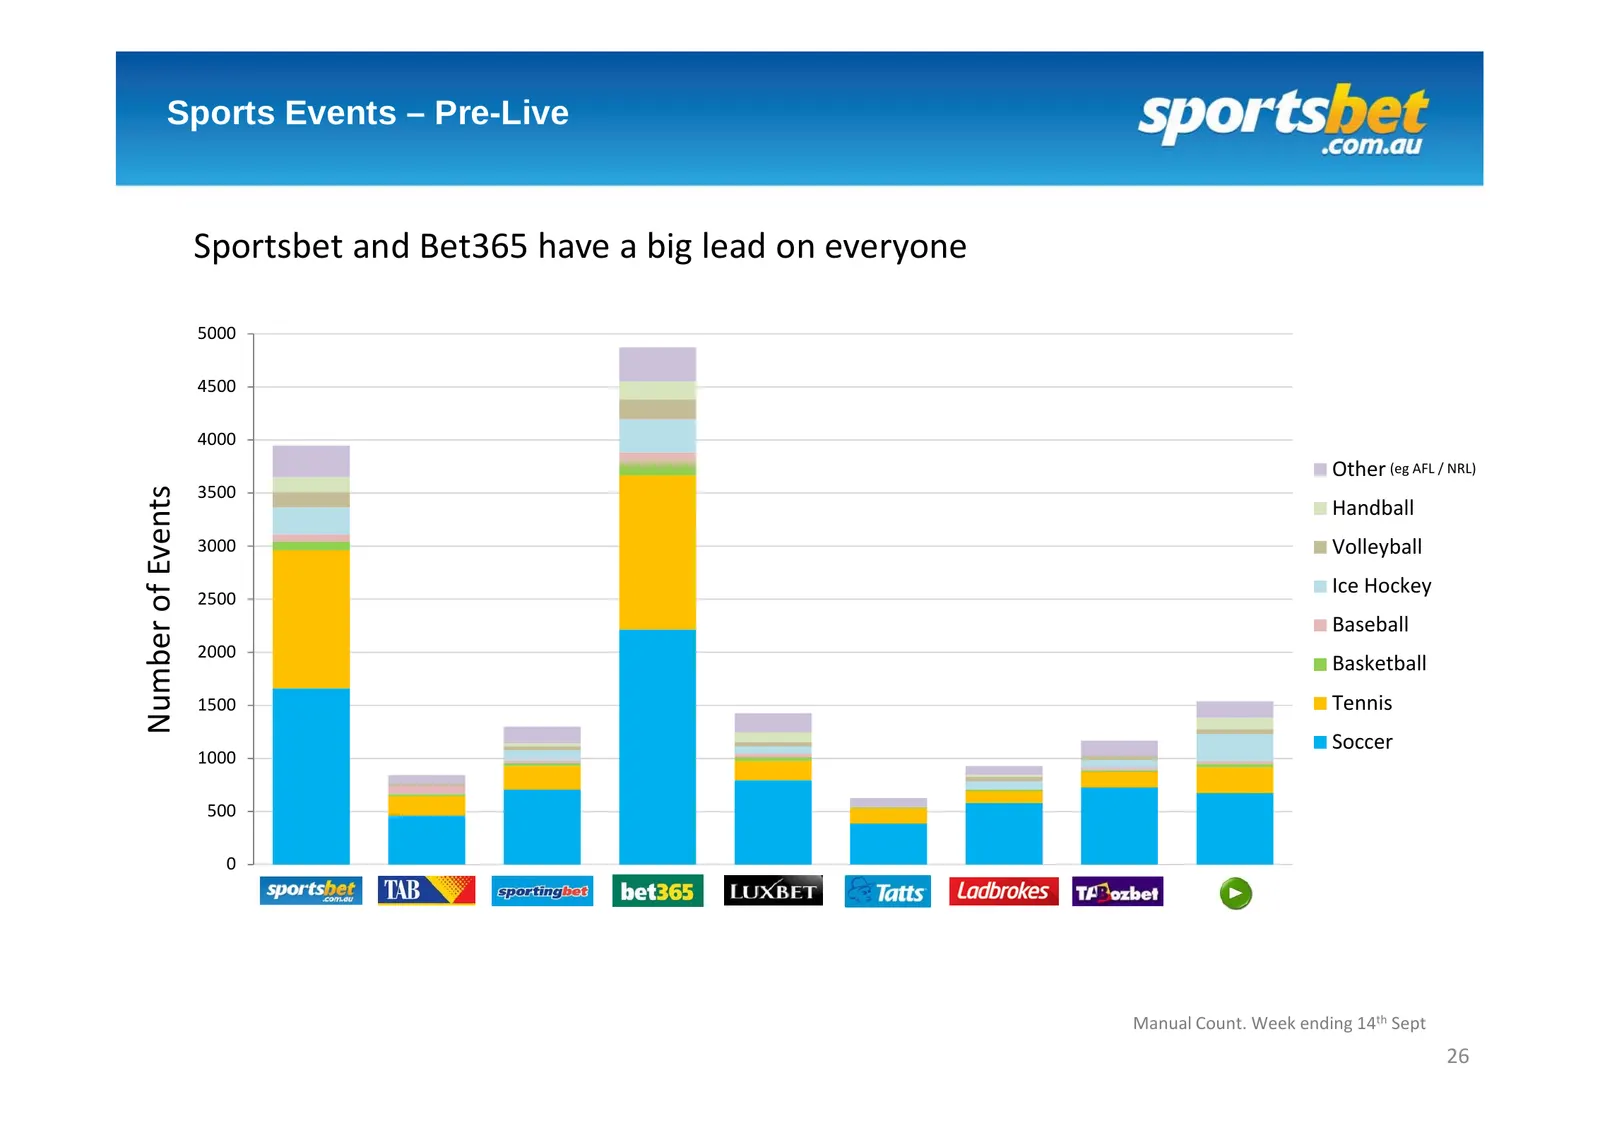
Slide 26: Sports Events – Pre-Live
Sports Events – Pre-Live Sportsbet and Bet365 have a big lead on everyone 5000 4500 4000 Other (eg AFL / NRL) 3500 Number of Events Handball 3000 Volleyball Ice Hockey 2500 Baseball 2000 Basketball 1500 Tennis Soccer 1000 500 0 Manual Count. Week ending 14th Sept 26
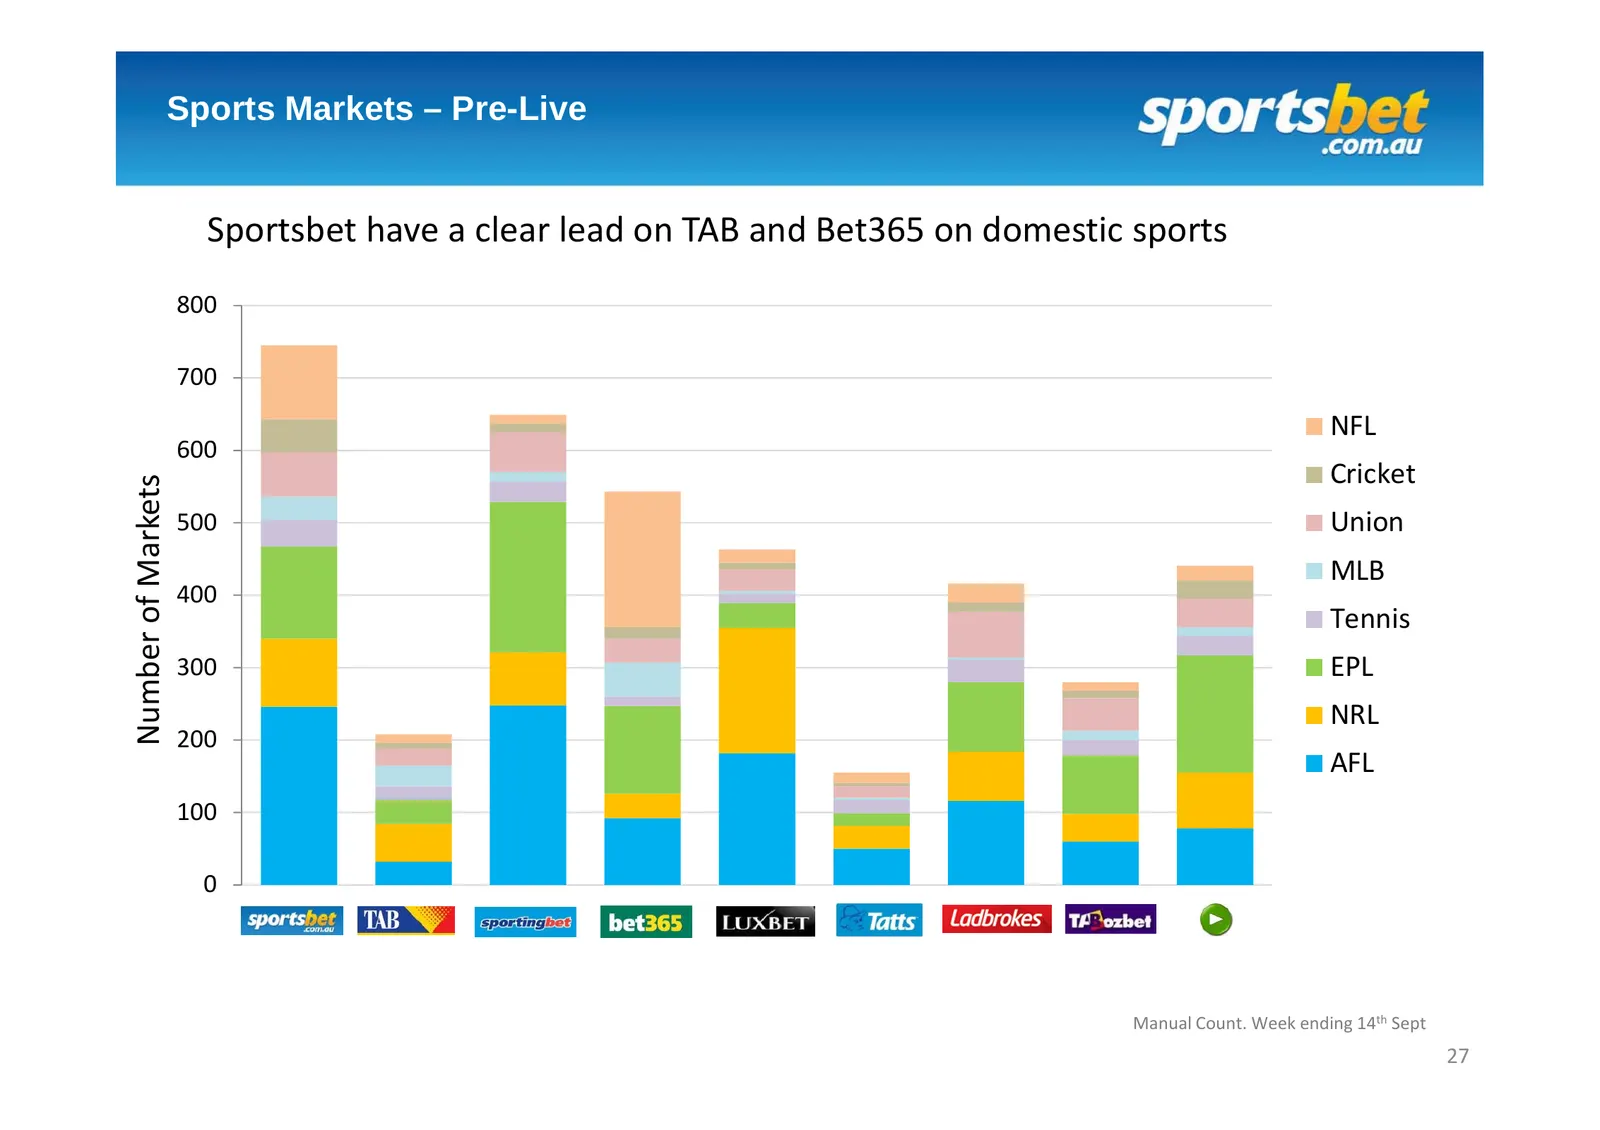
Slide 27: Sports Markets – Pre-Live
Sports Markets – Pre-Live Sportsbet have a clear lead on TAB and Bet365 on domestic sports 800 700 NFL 600 Cricket Number of Markets 500 Union MLB 400 Tennis 300 EPL NRL 200 AFL 100 0 Manual Count. Week ending 14th Sept 27
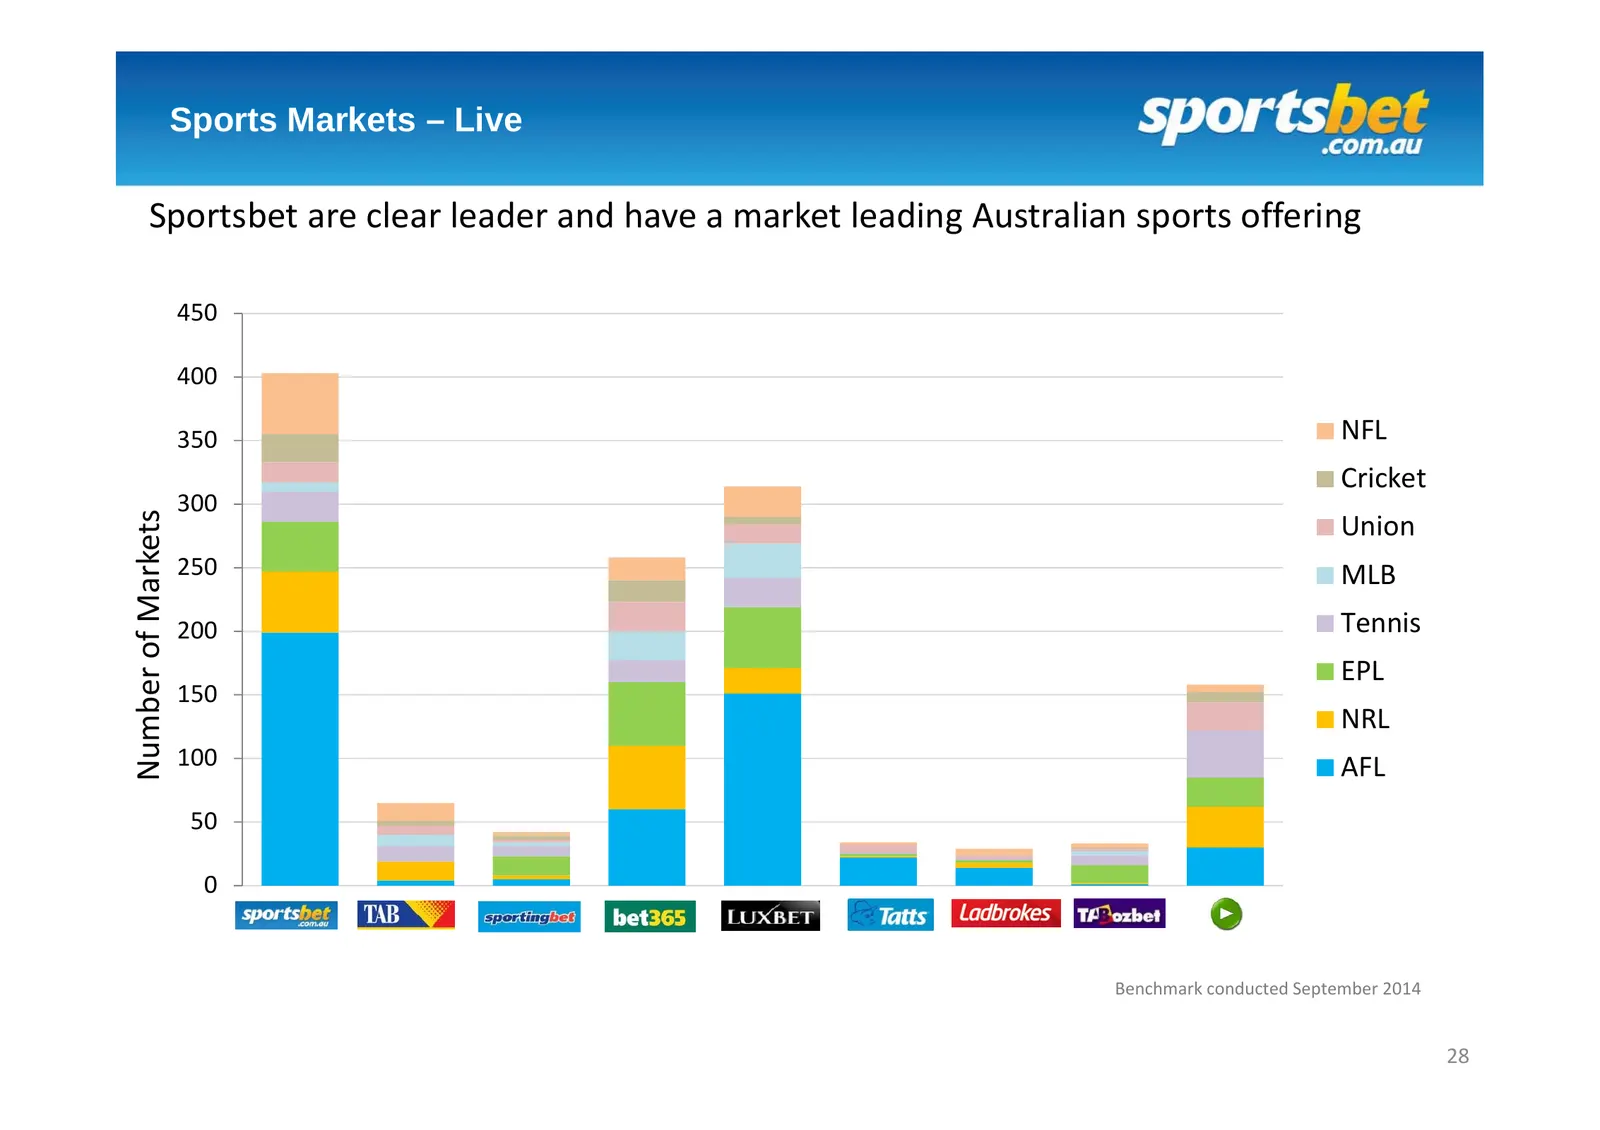
Slide 28: Sports Markets – Live
Sports Markets – Live Sportsbet are clear leader and have a market leading Australian sports offering 450 400 350 NFL Cricket 300 Number of Markets Union 250 MLB 200 Tennis EPL 150 NRL 100 AFL 50 0 Benchmark conducted September 2014 28
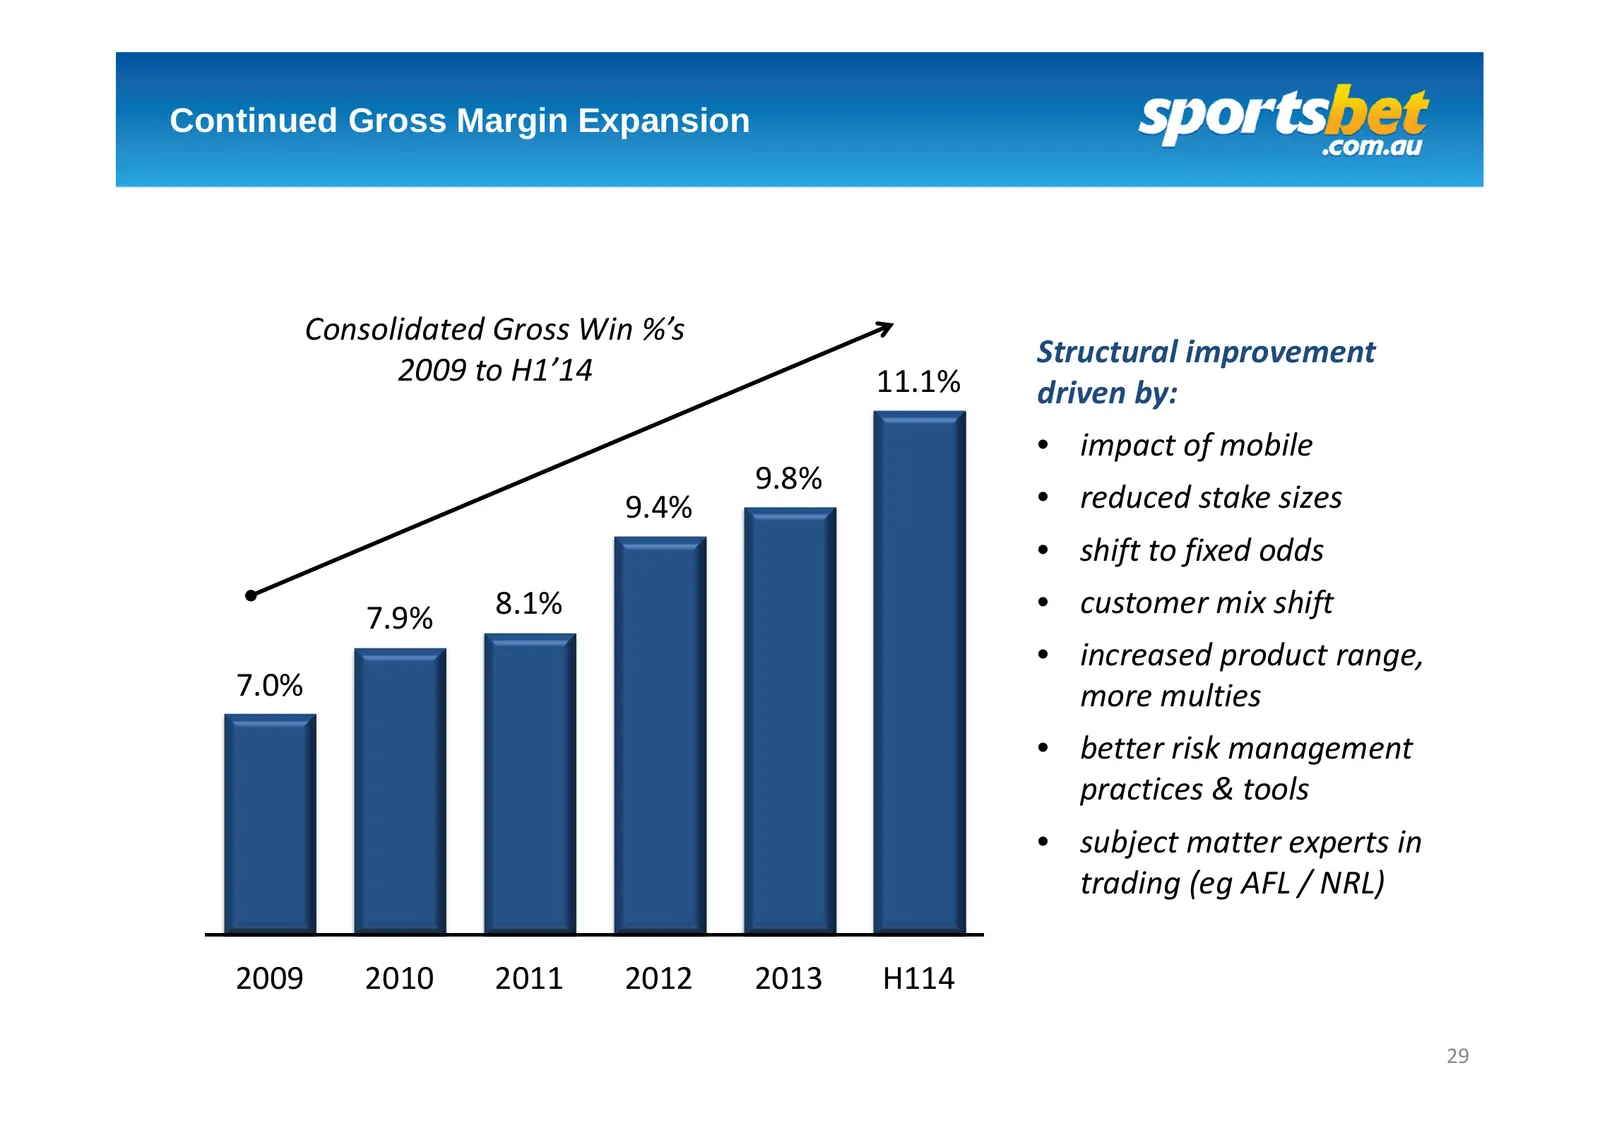
Slide 29: Continued Gross Margin Expansion
Continued Gross Margin Expansion Consolidated Gross Win %’s Structural improvement 2009 to H1’14 11.1% driven by: • impact of mobile 9.8% 9.4% • reduced stake sizes • shift to fixed odds 7.9% 8.1% • customer mix shift • increased product range, 7.0% more multies • better risk management practices &

Slide 30: Online & Customer Operations
Online & Customer Operations
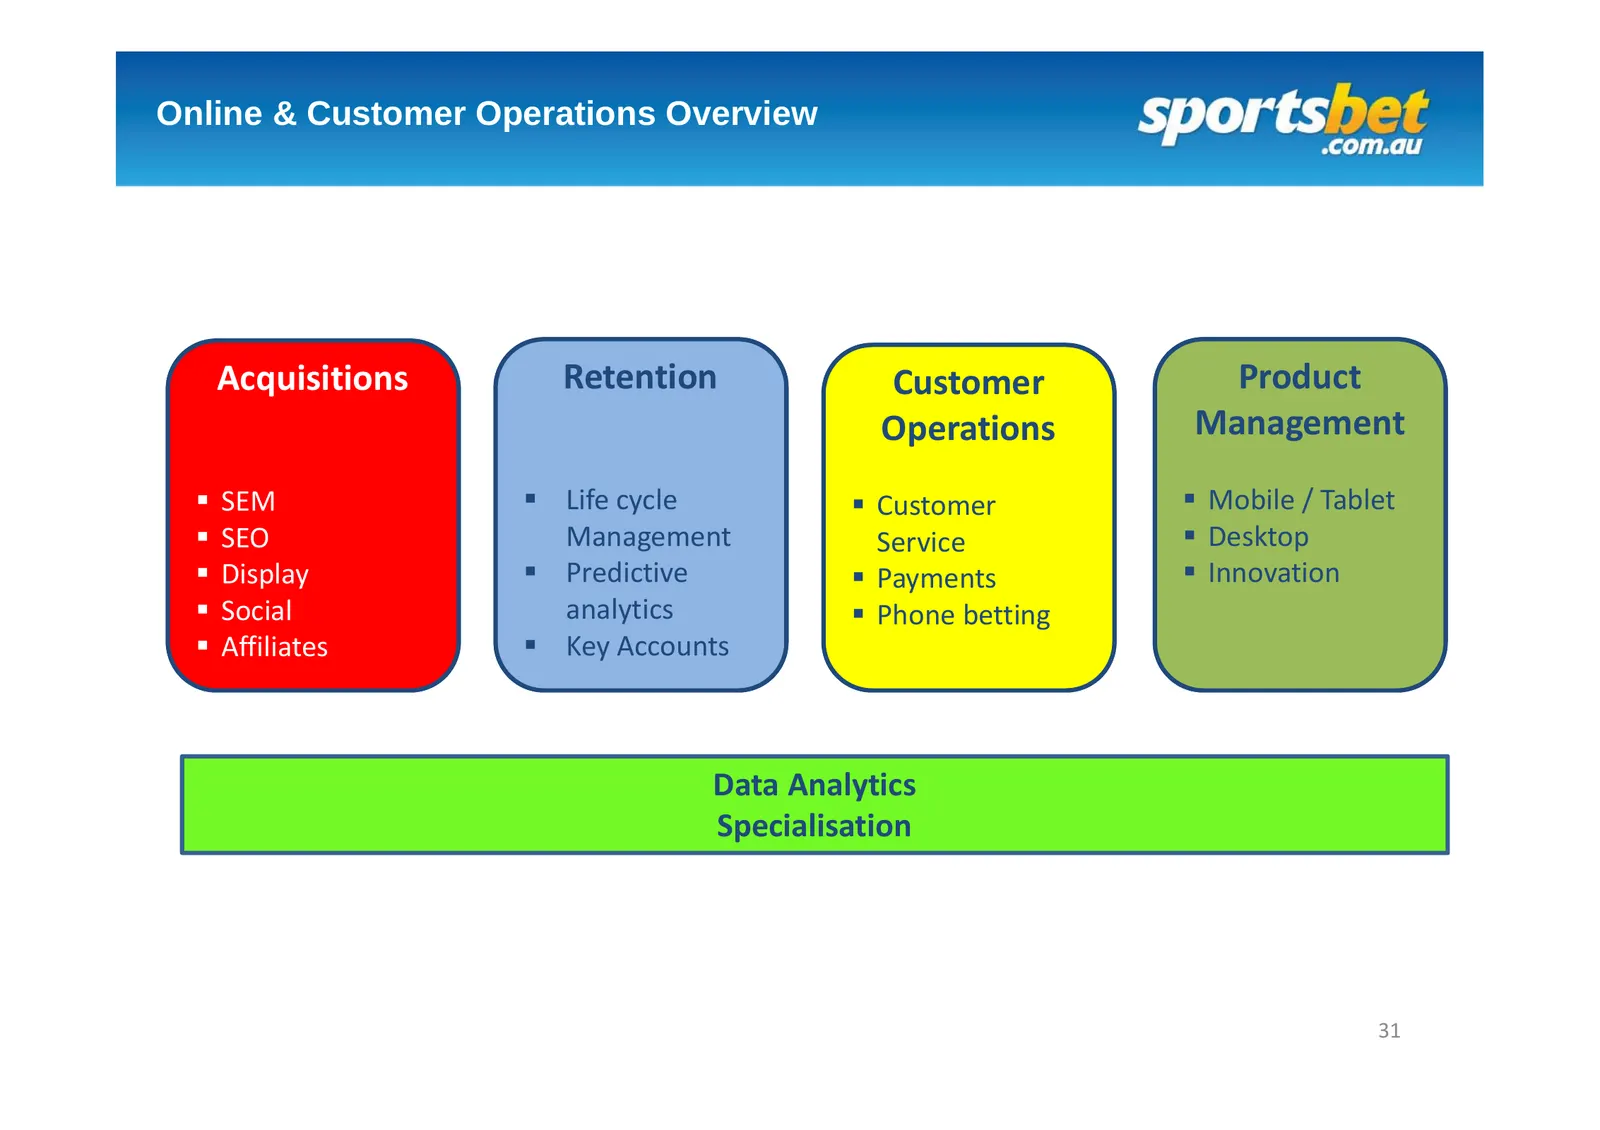
Slide 31: Online & Customer Operations Overview
Online & Customer Operations Overview Acquisitions Retention Customer Product Operations Management SEM Life cycle Customer Mobile / Tablet SEO Management Service Desktop Display Predictive Payments Innovation Social analytics Phone betting Affiliates Key Accounts Data An
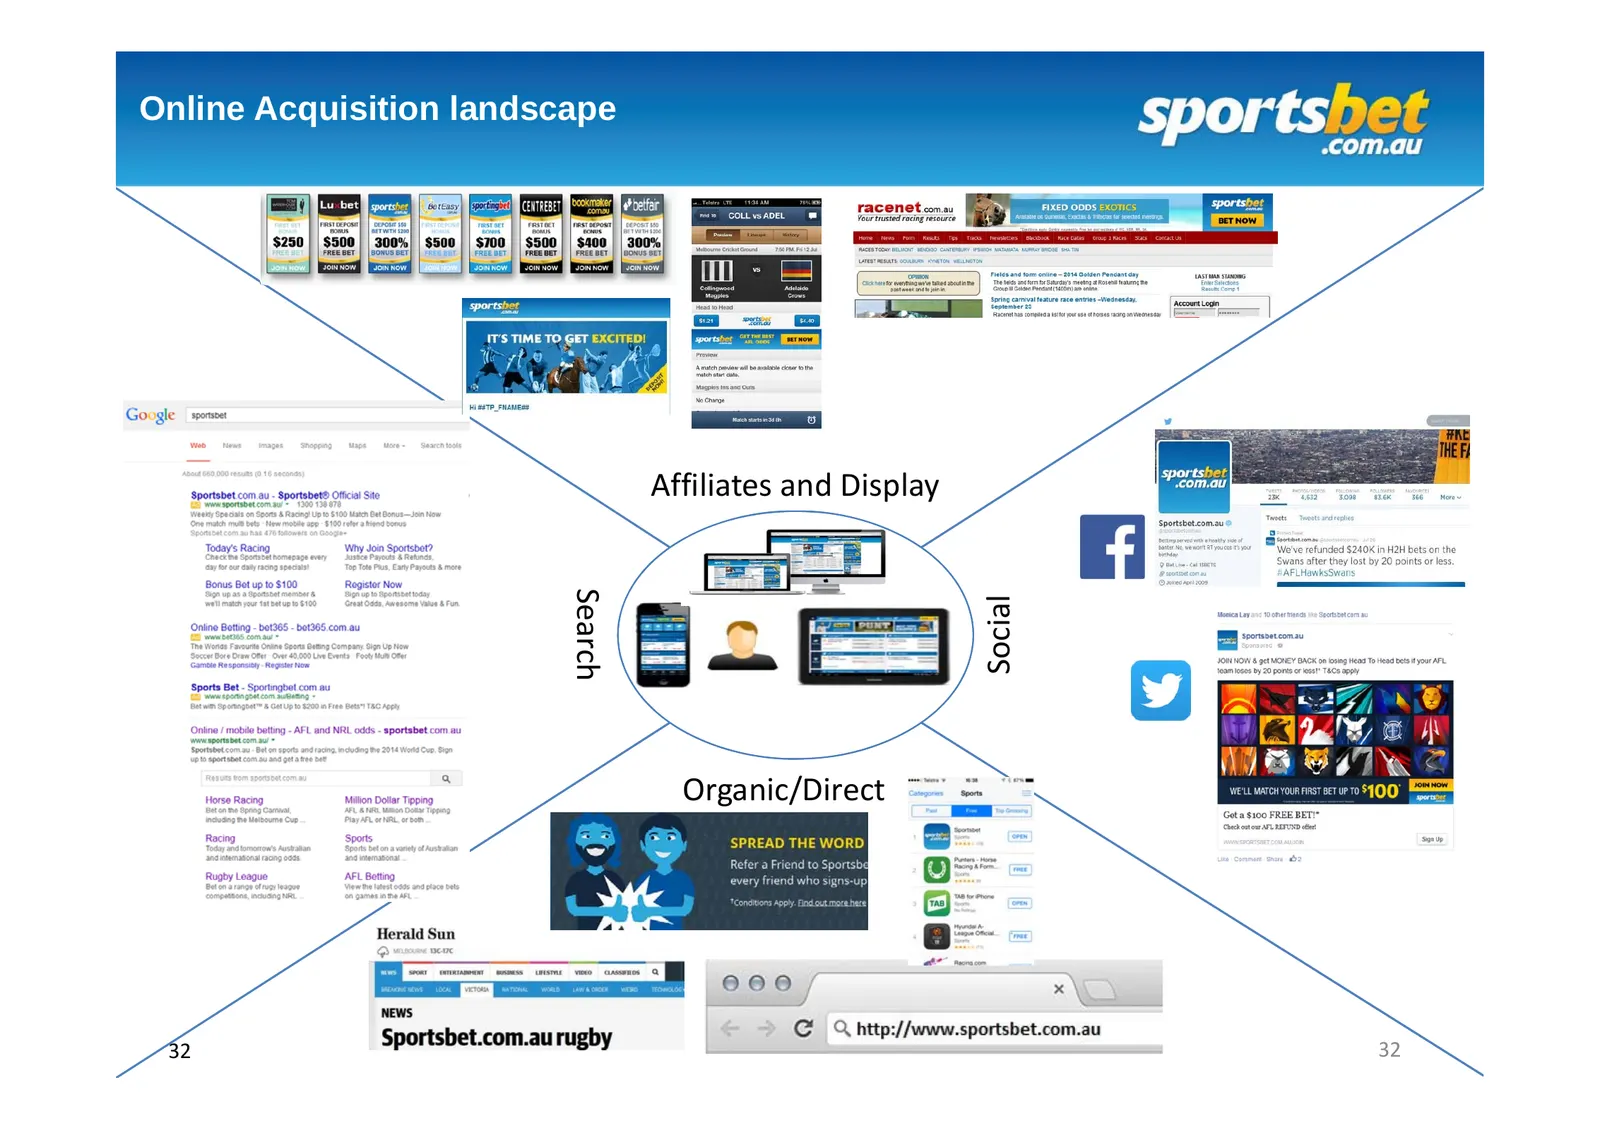
Slide 32: Online Acquisition Landscape
Online Acquisition landscape Affiliates and Display Search Social Organic/Direct 32 32
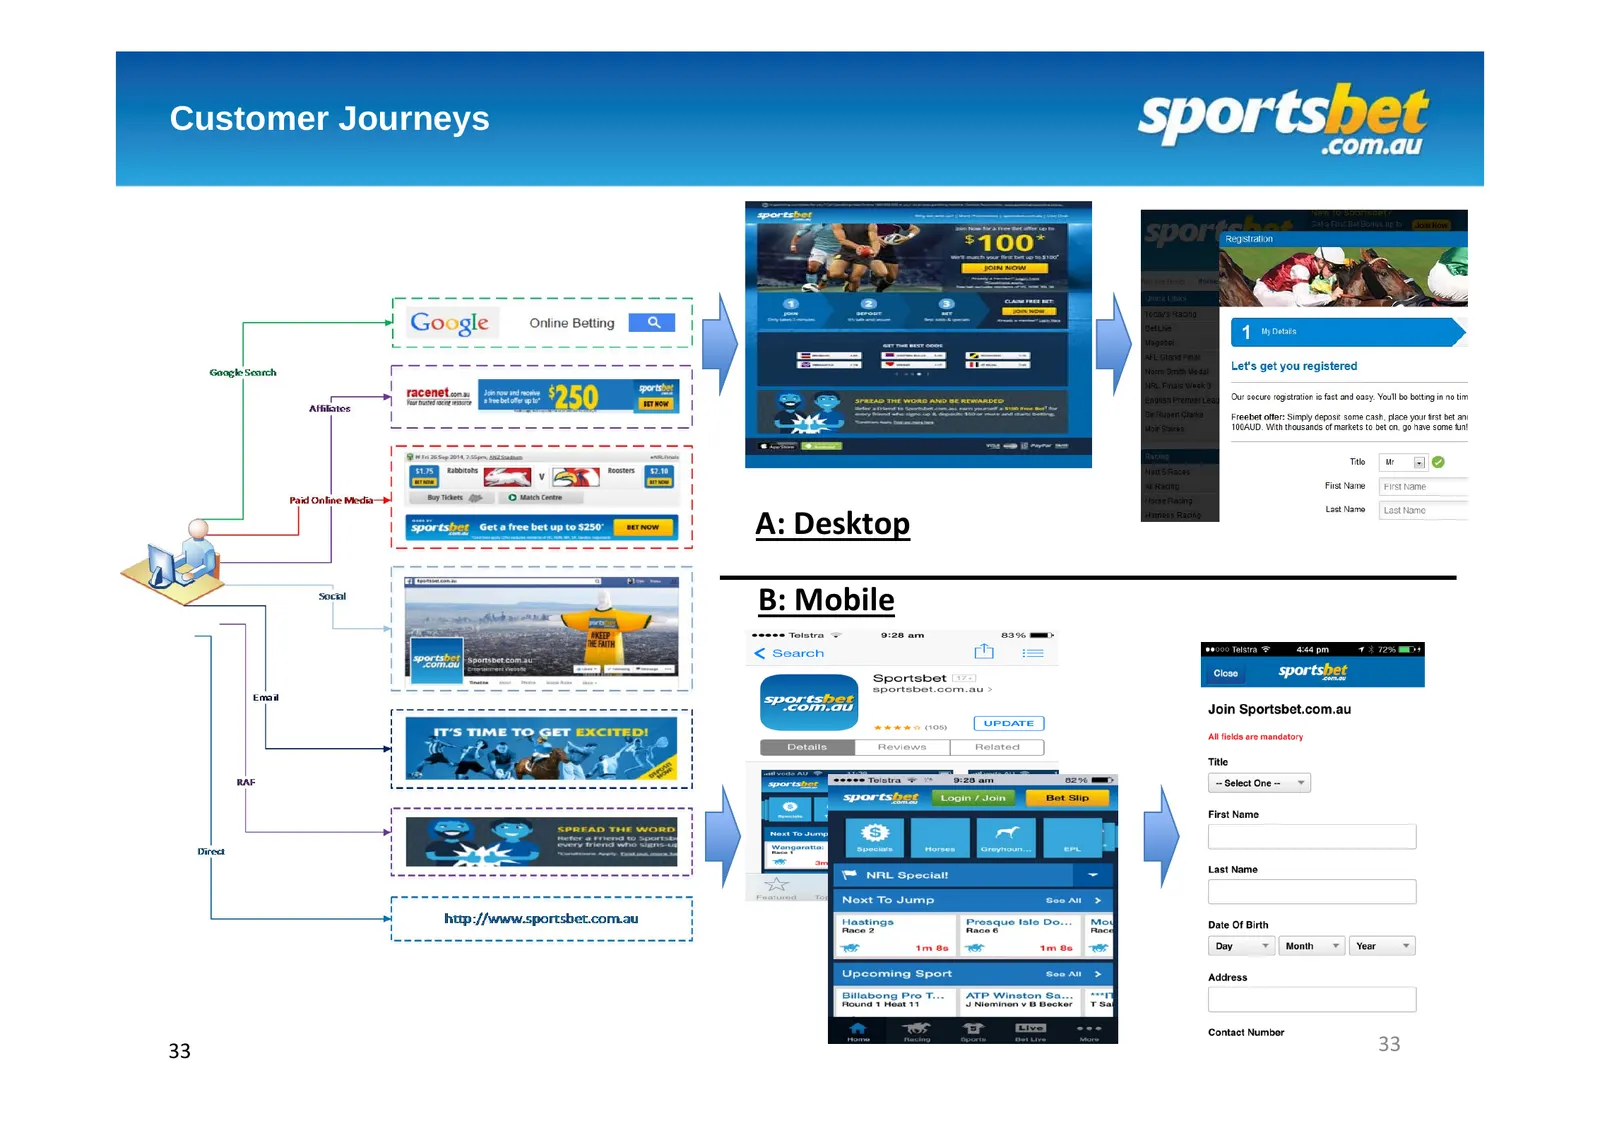
Slide 33: Customer Journeys
Customer Journeys A: Desktop B: Mobile 33 33
Slide 34: Customer Retention
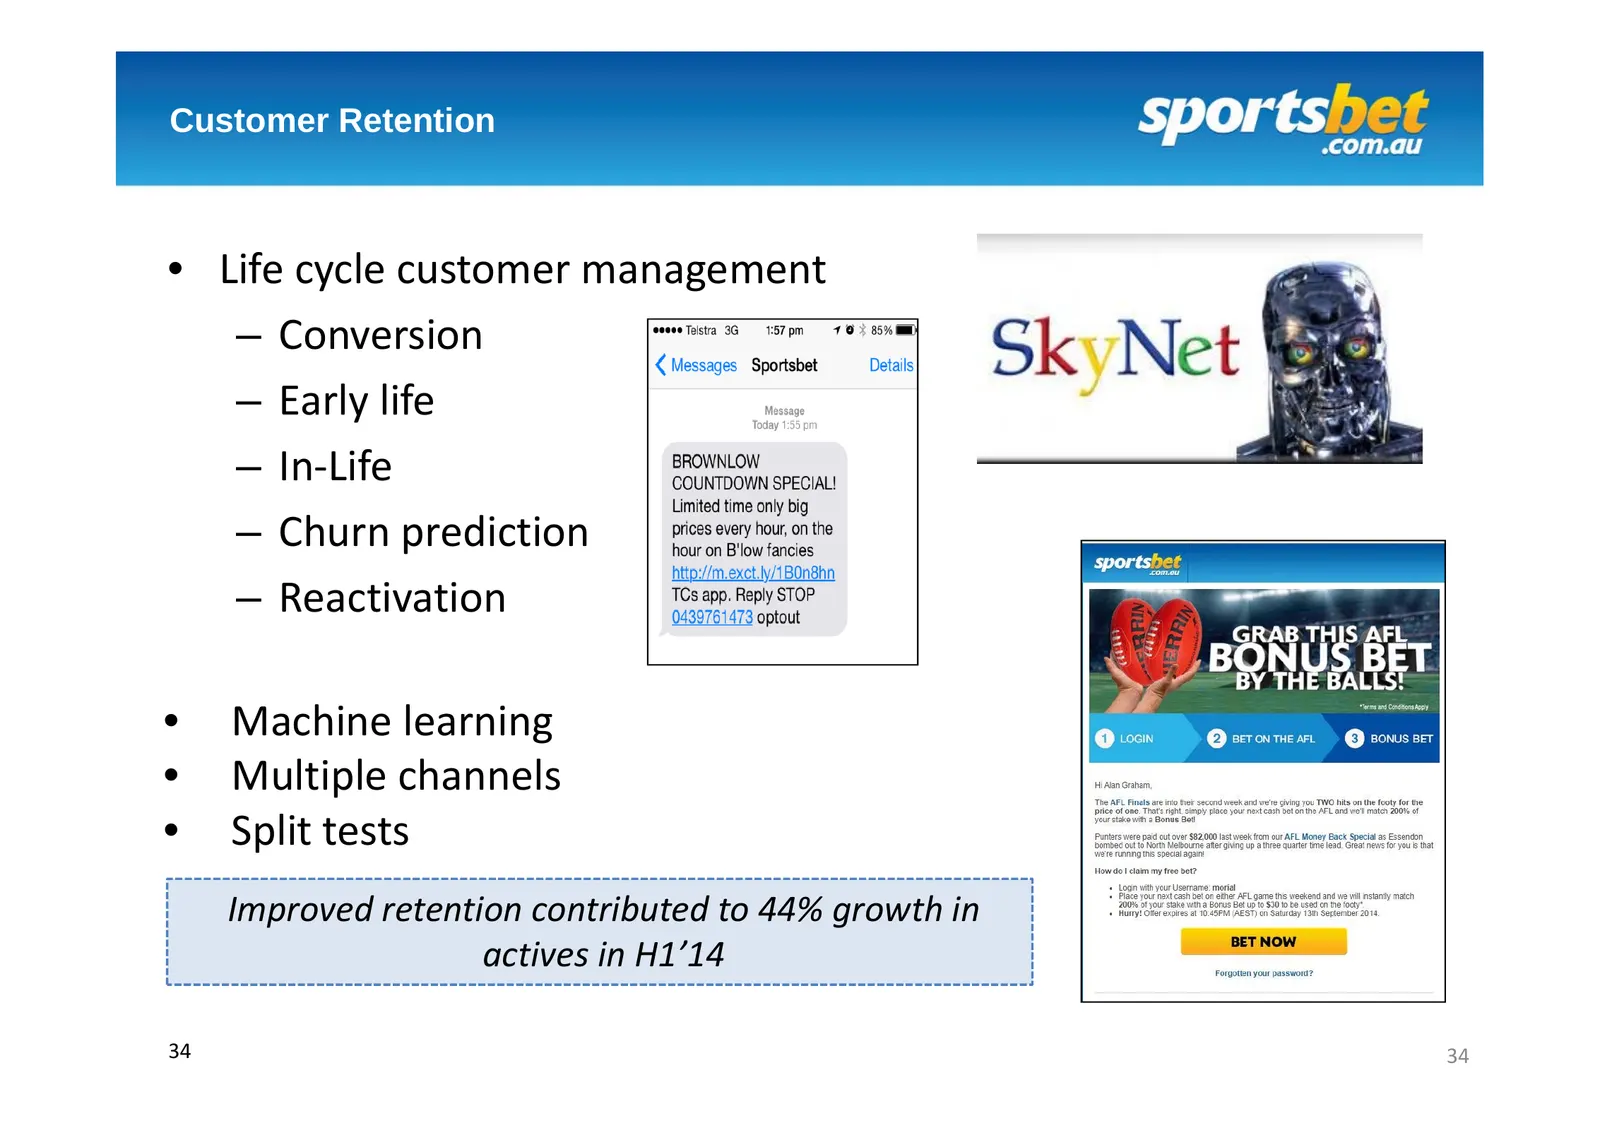
Customer Retention • Life cycle customer management – Conversion – Early life – In‐Life – Churn prediction – Reactivation • Machine learning • Multiple channels • Split tests Improved retention contributed to 44% growth in actives in H1’14 34 34
Slide 35: Customer Experience
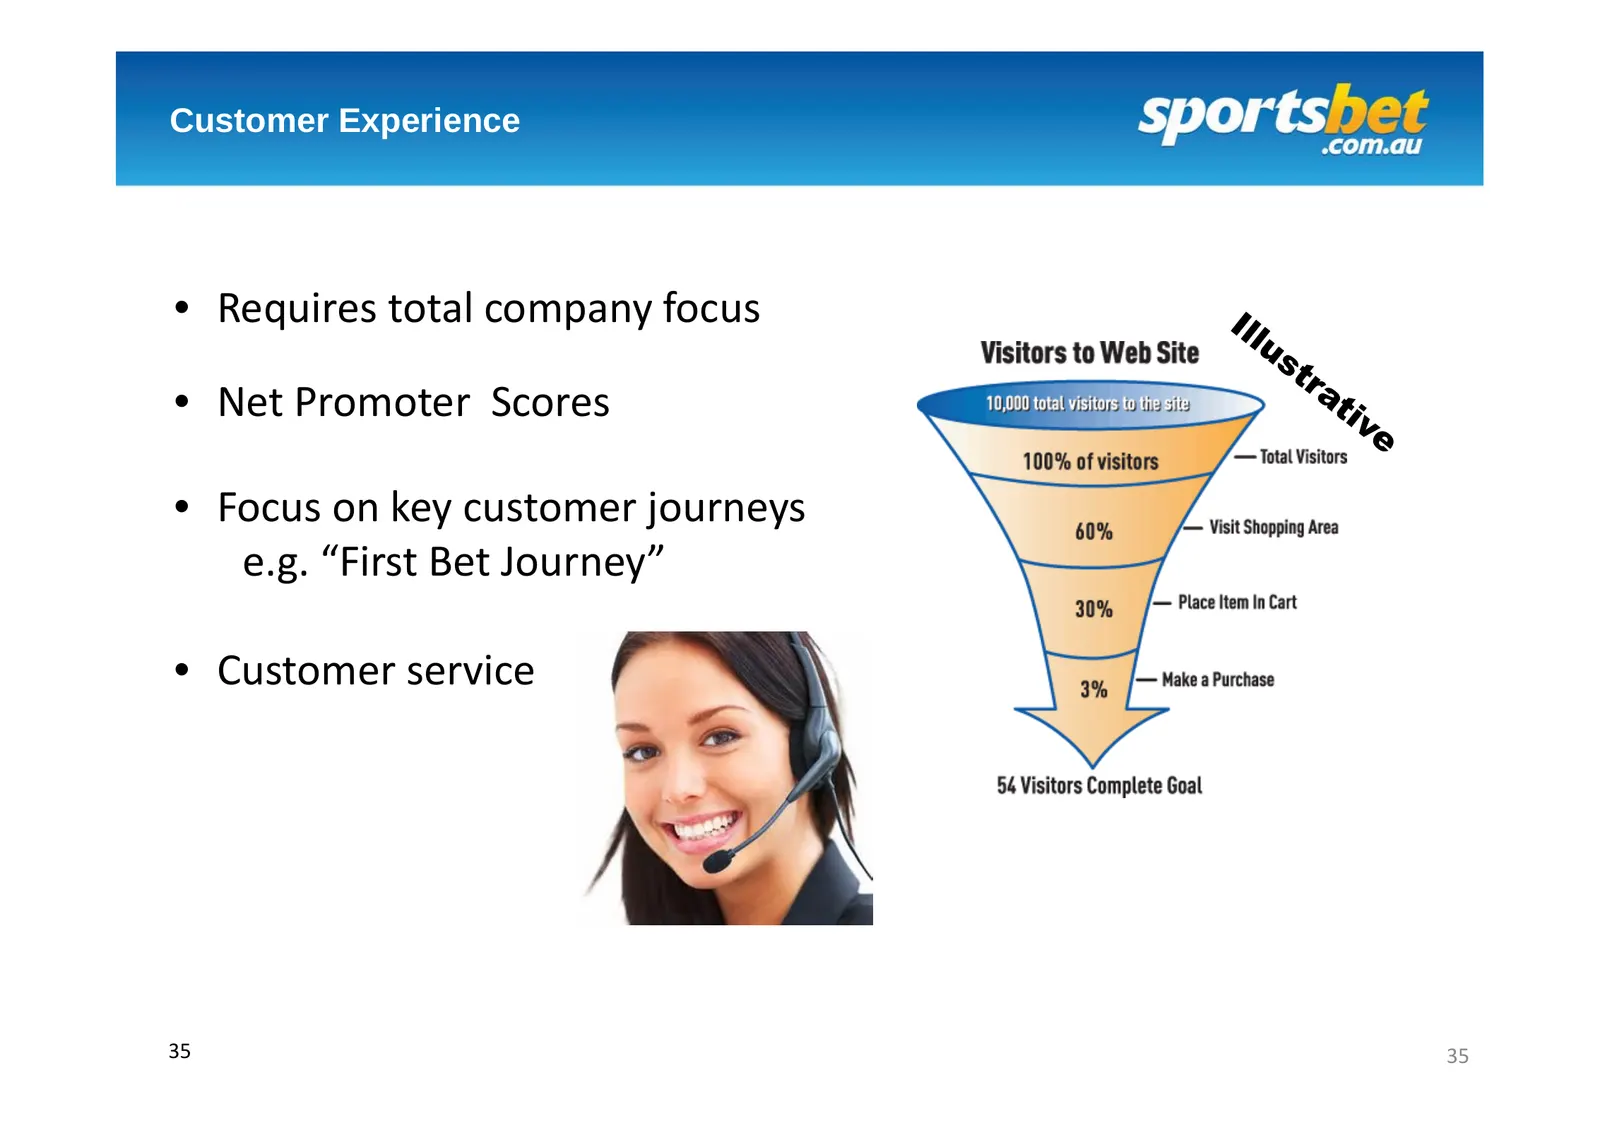
Customer Experience • Requires total company focus • Net Promoter Scores • Focus on key customer journeys e.g. “First Bet Journey” • Customer service 35 35
Slide 36: Customer Service – Demand Management
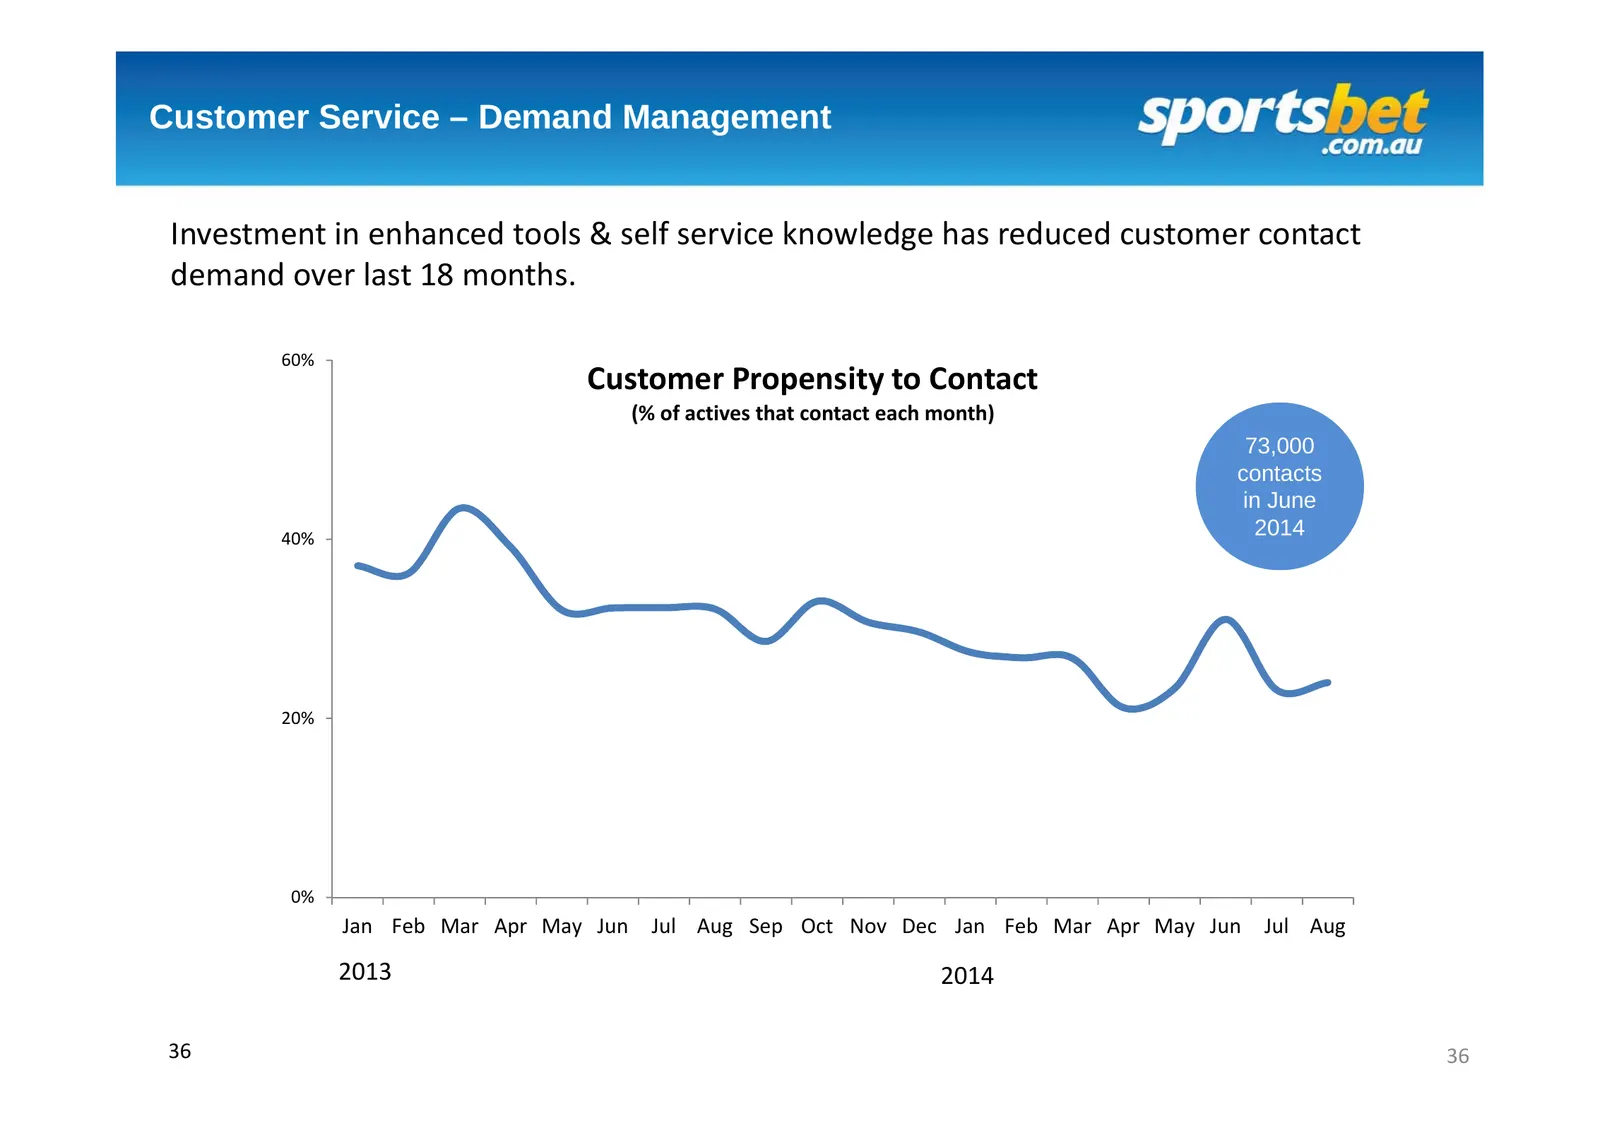
Customer Service – Demand Management Investment in enhanced tools & self service knowledge has reduced customer contact demand over last 18 months. 60% Customer Propensity to Contact (% of actives that contact each month) 73,000 contacts in June 40% 2014 20% 0% Jan Feb Mar Apr May Jun Jul Aug Sep Oc
Slide 37: Product - Mobile as a Disrupter
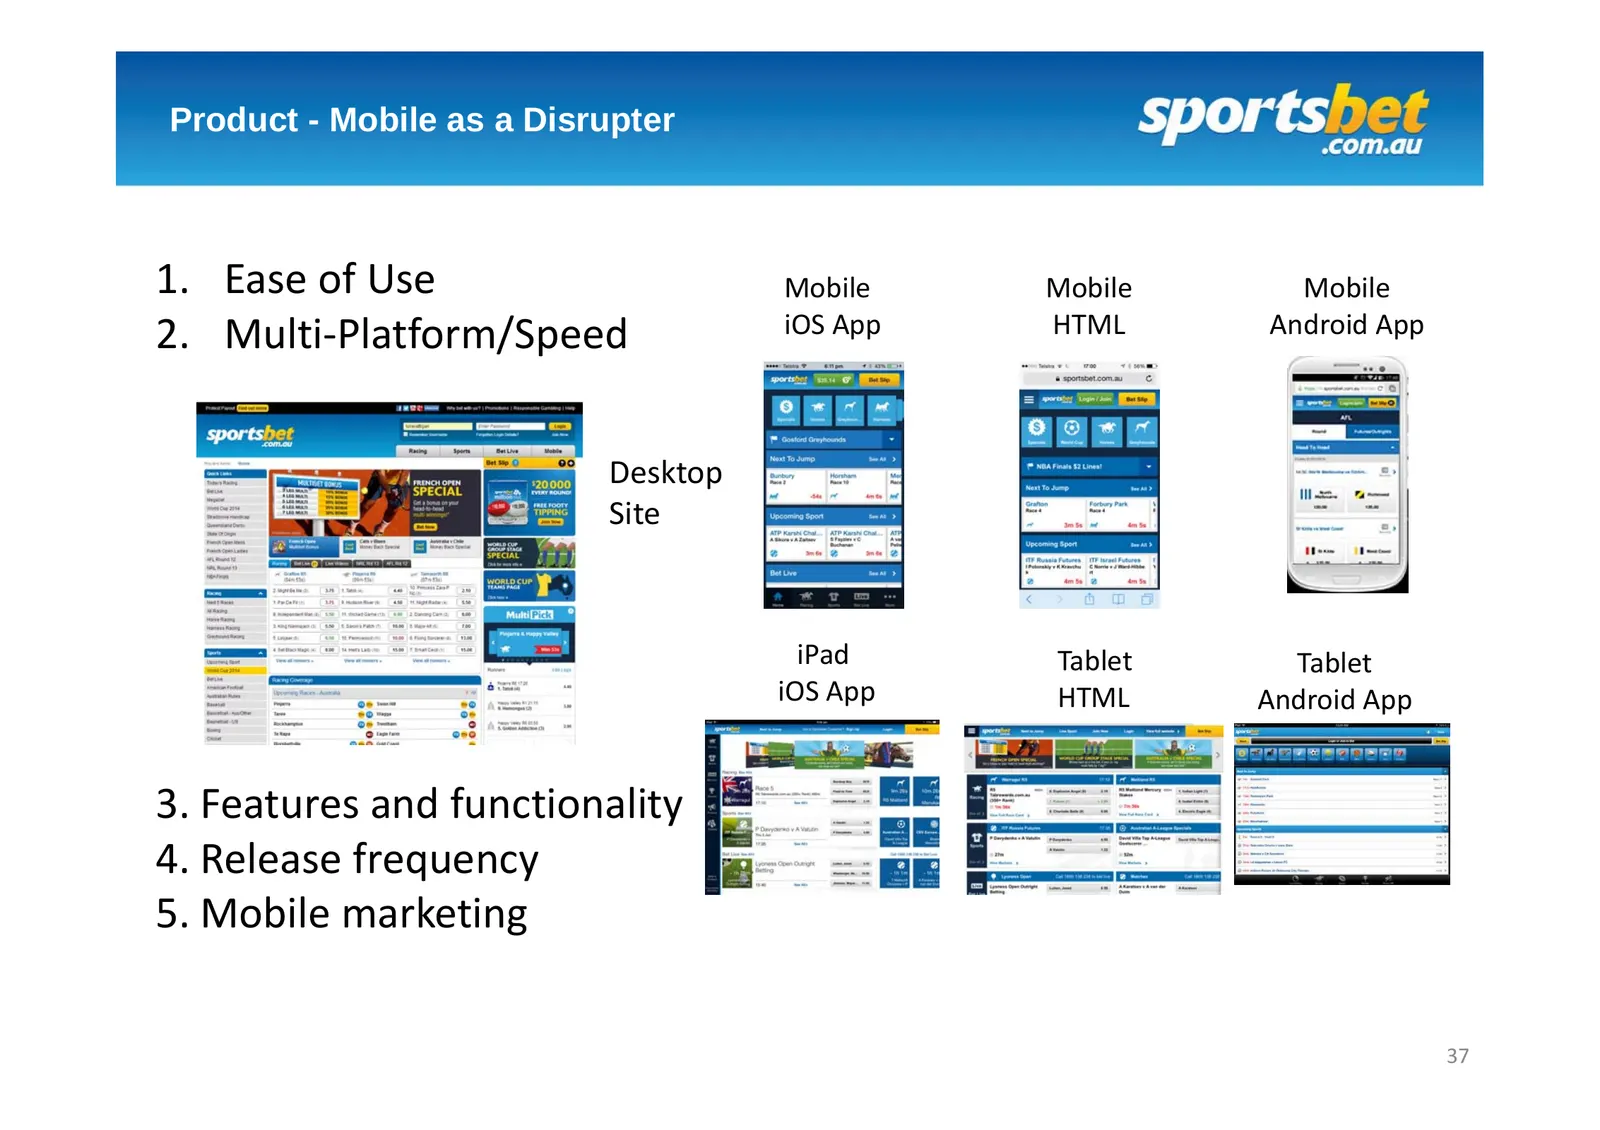
Product - Mobile as a Disrupter 1. Ease of Use Mobile Mobile Mobile 2. Multi‐Platform/Speed iOS App HTML Android App Desktop Site iPad Tablet Tablet iOS App HTML Android App 3. Features and functionality 4. Release frequency 5. Mobile marketing 37
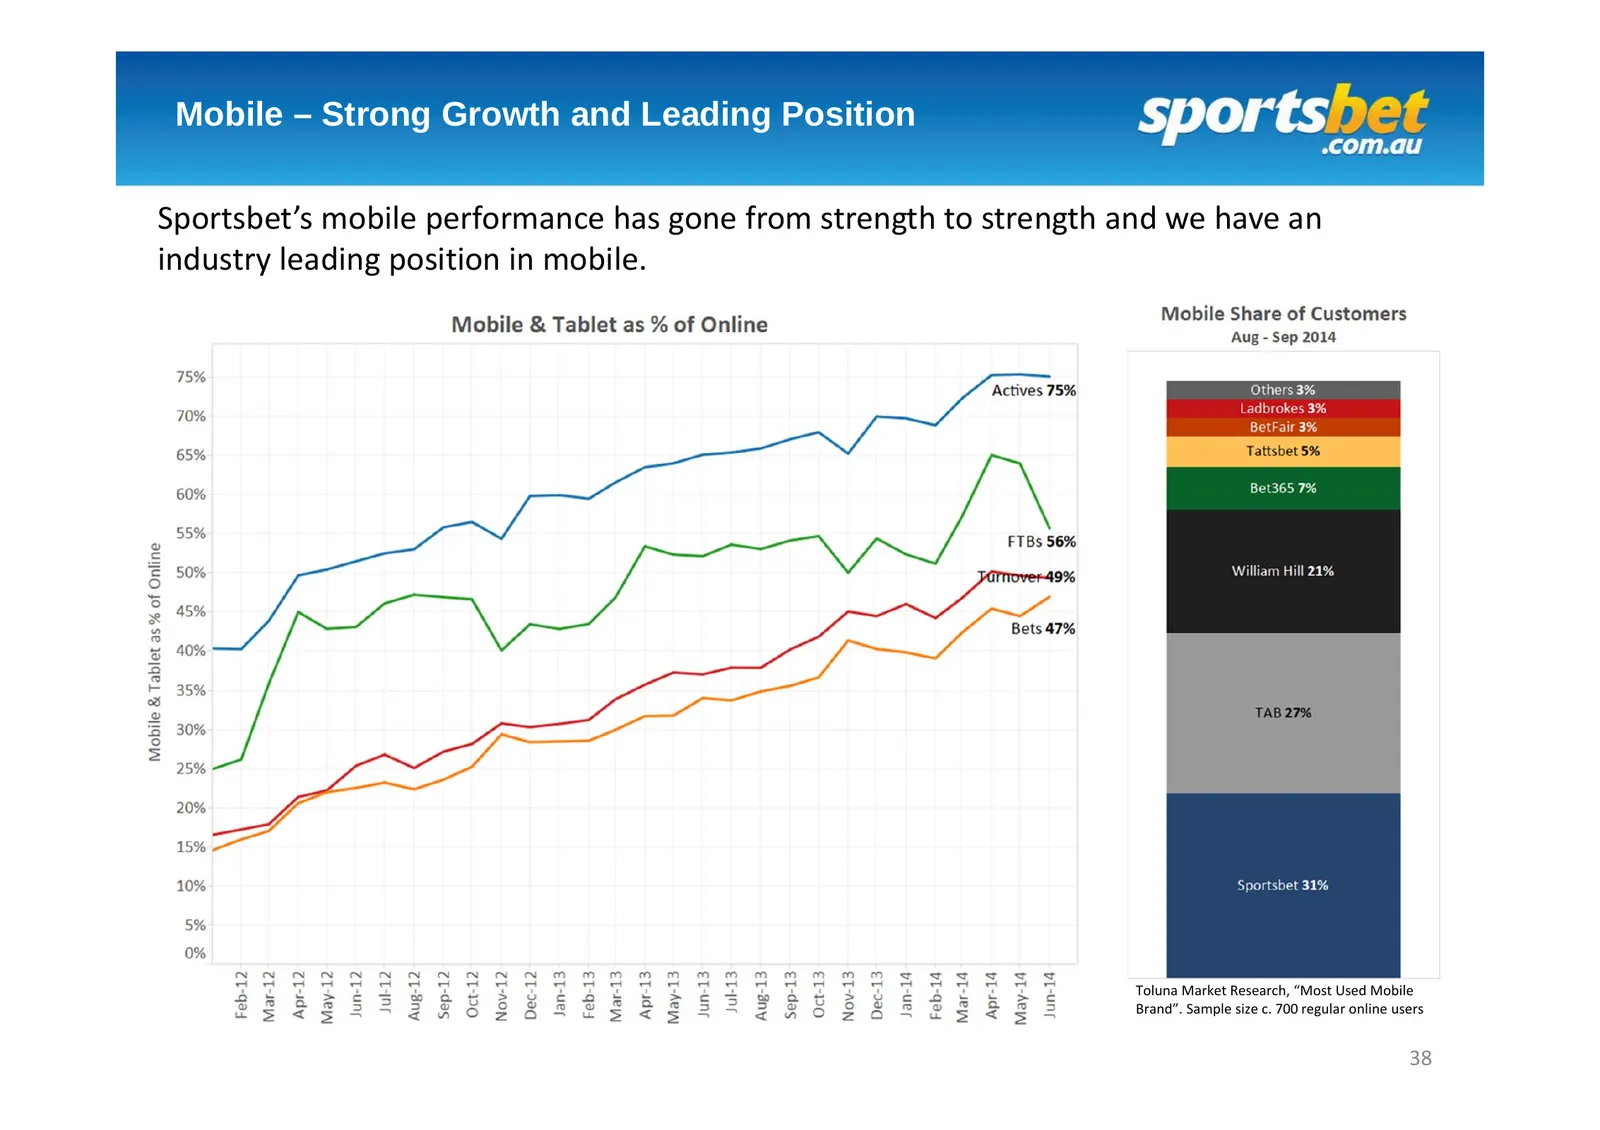
Slide 38: Mobile – Strong Growth and Leading Position
Mobile – Strong Growth and Leading Position Sportsbet’s mobile performance has gone from strength to strength and we have an industry leading position in mobile. Toluna Market Research, “Most Used Mobile Brand”. Sample size c. 700 regular online users 38
Slide 39: Technology & Product Development
Simon Noonan – Chief Information Officer Technology & Product Development 24 October 2014
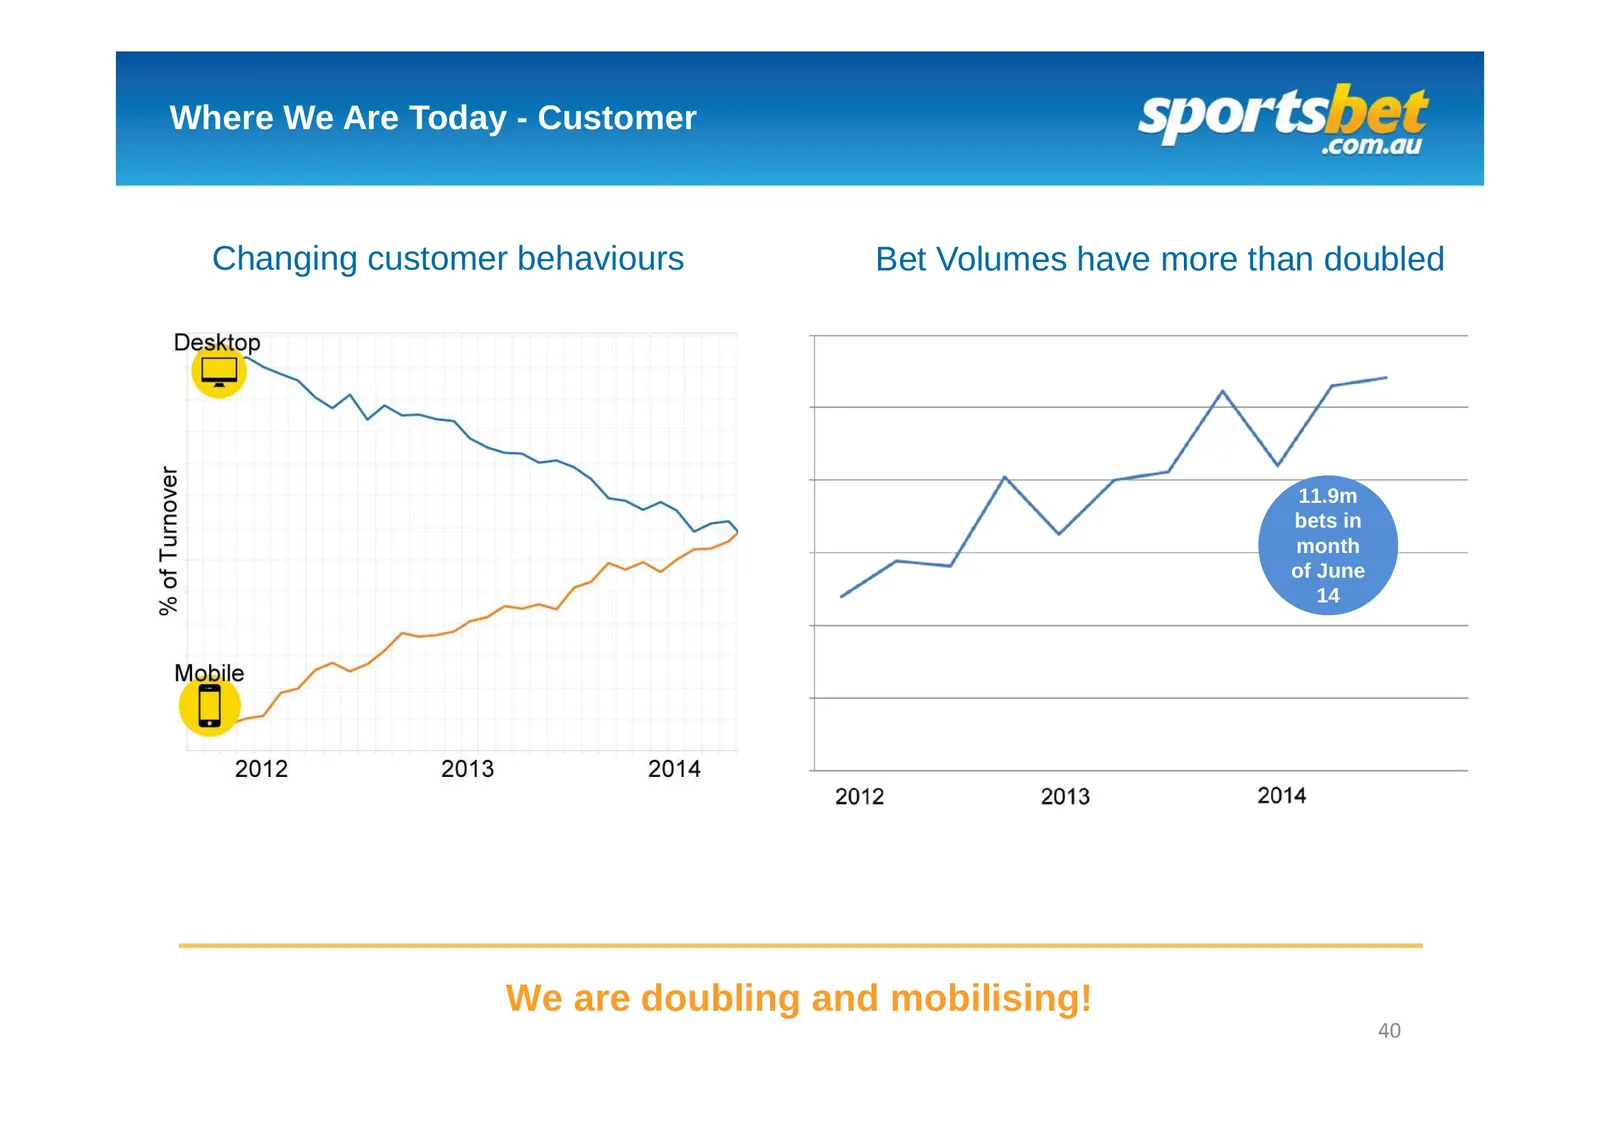
Slide 40: Where We Are Today - Customer
Where We Are Today - Customer Changing customer behaviours Bet Volumes have more than doubled 11.9m bets in month of June 14 We are doubling and mobilising! 40
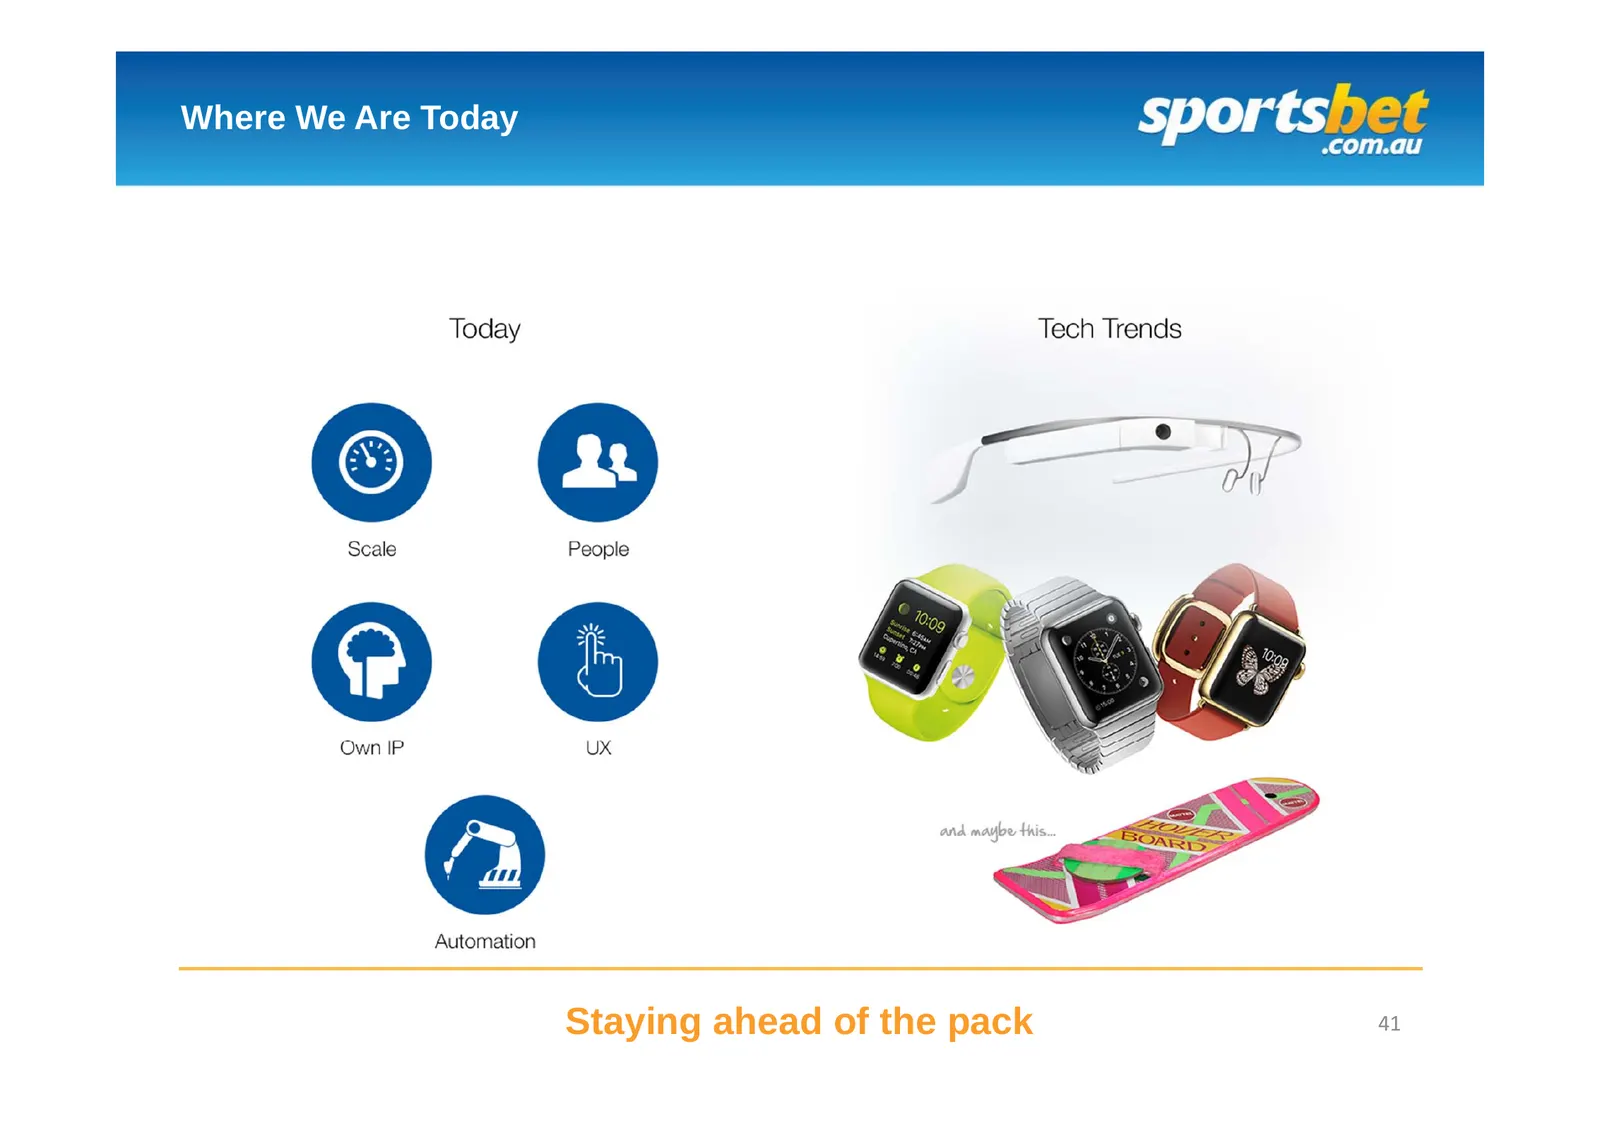
Slide 41: Where We Are Today
Where We Are Today Staying ahead of the pack 41
Slide 42: Delivering Customer Outcomes
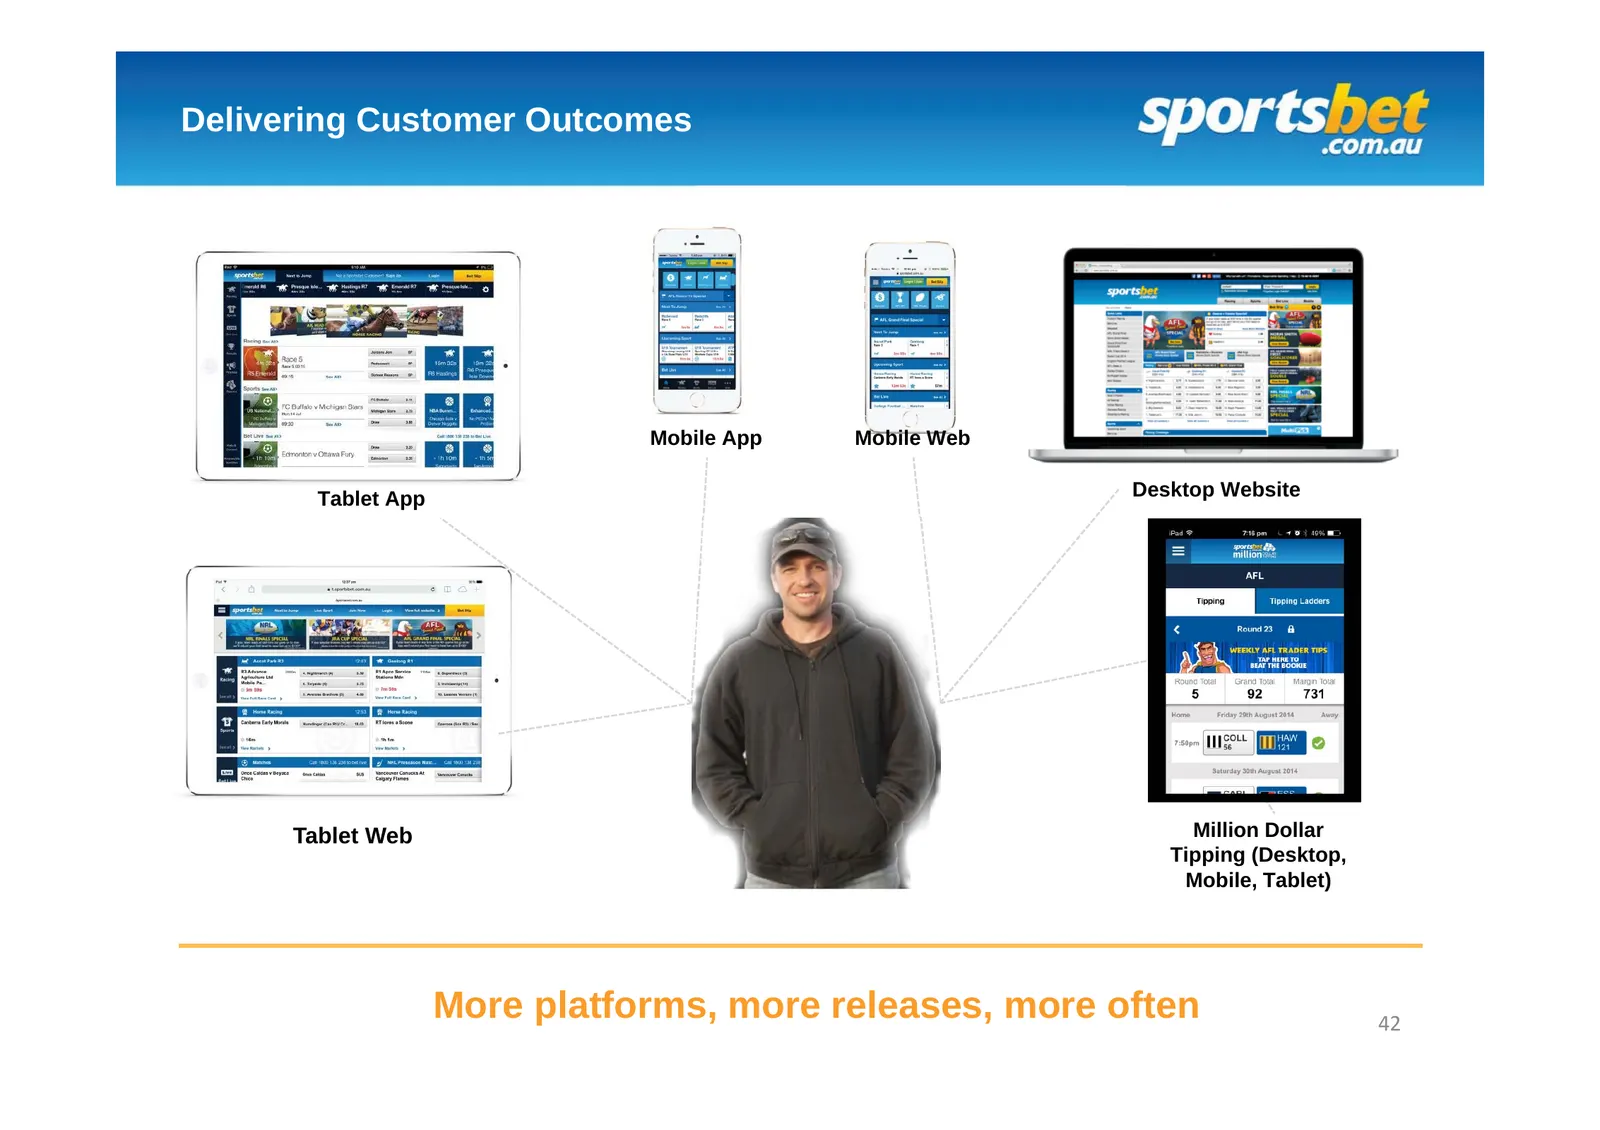
Delivering Customer Outcomes Mobile App Mobile Web Tablet App Desktop Website Tablet Web Million Dollar Tipping (Desktop, Mobile, Tablet) More platforms, more releases, more often 42
Slide 43: Our Game Plan
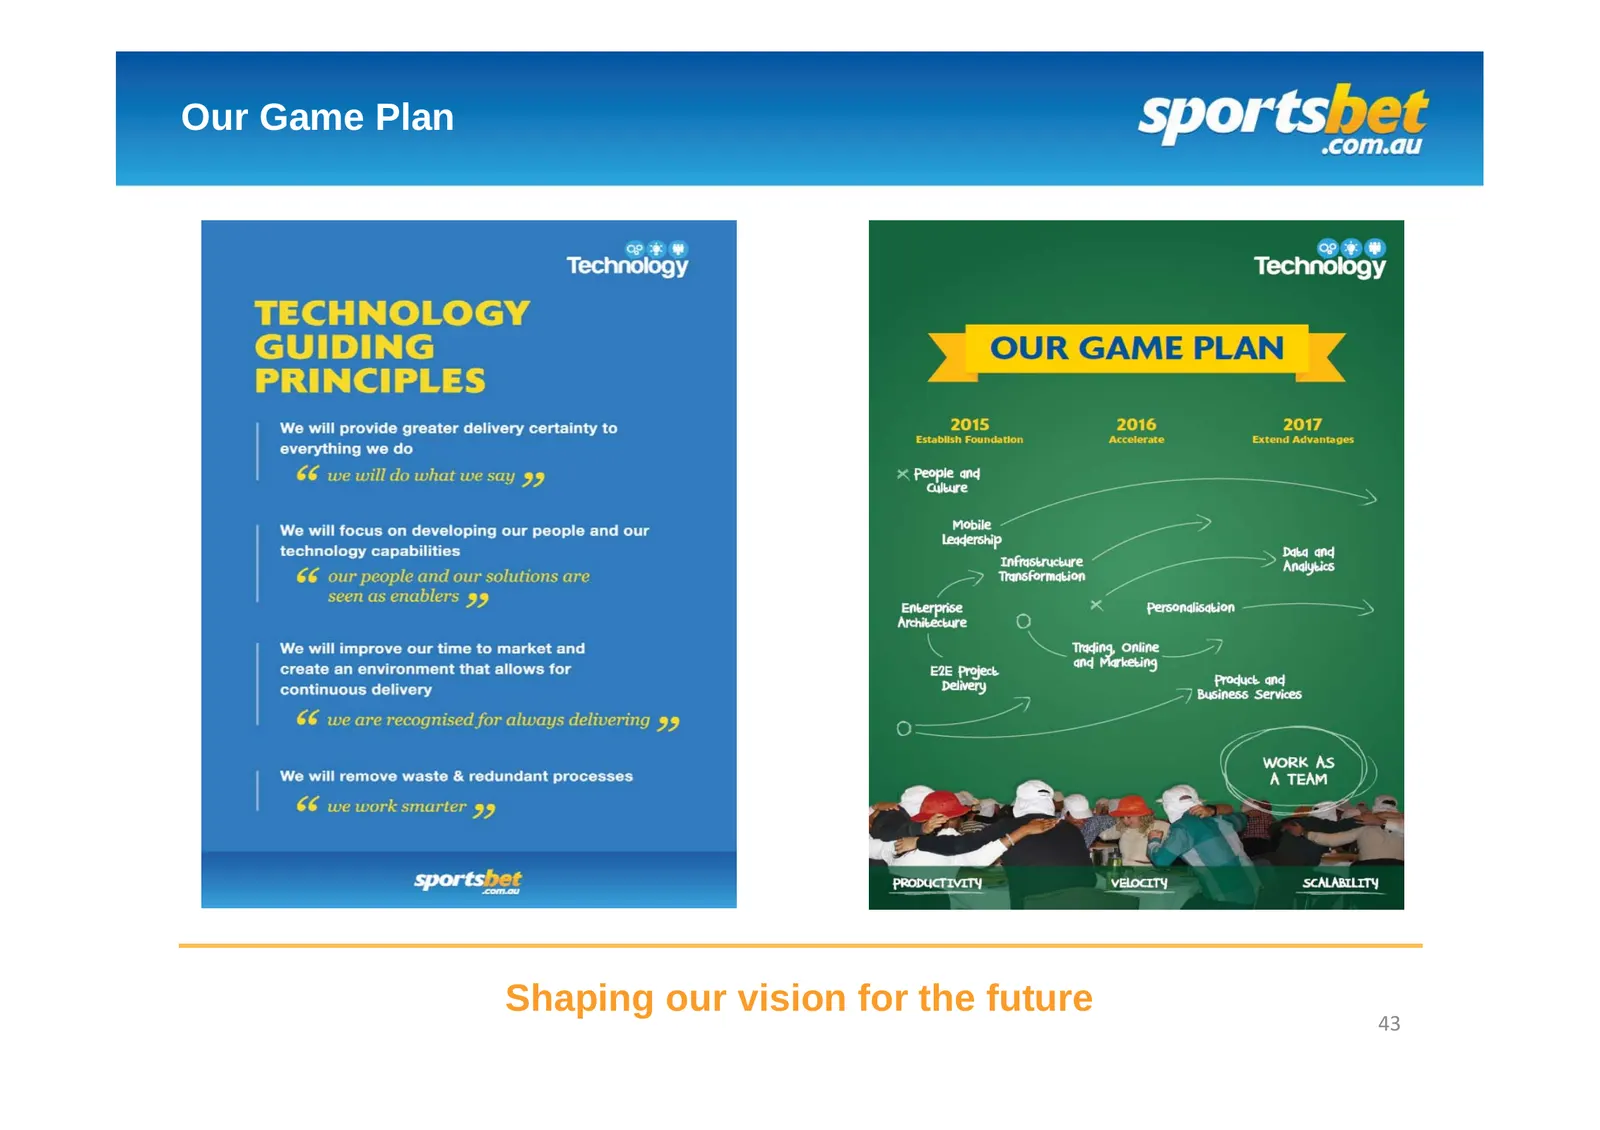
Our Game Plan Shaping our vision for the future 43
Slide 44: Our Game Plan - Customer
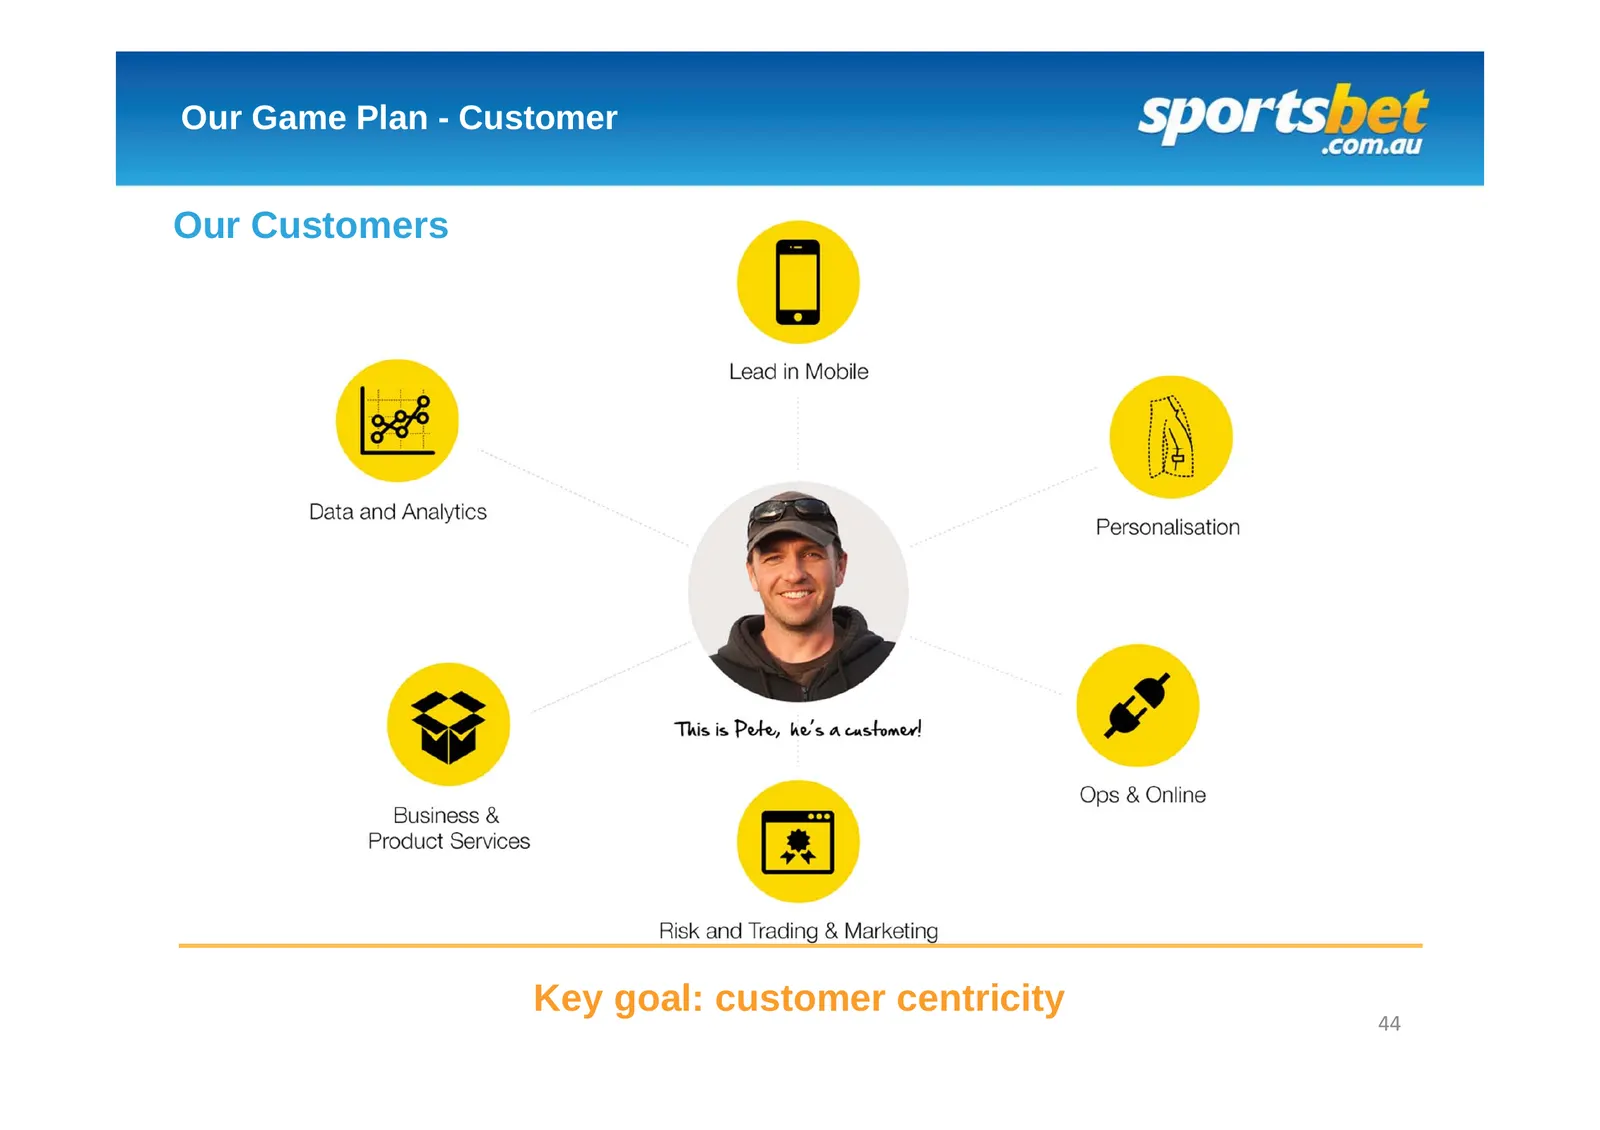
Our Game Plan - Customer Our Customers Key goal: customer centricity 44
Slide 45: Our Game Plan – Team
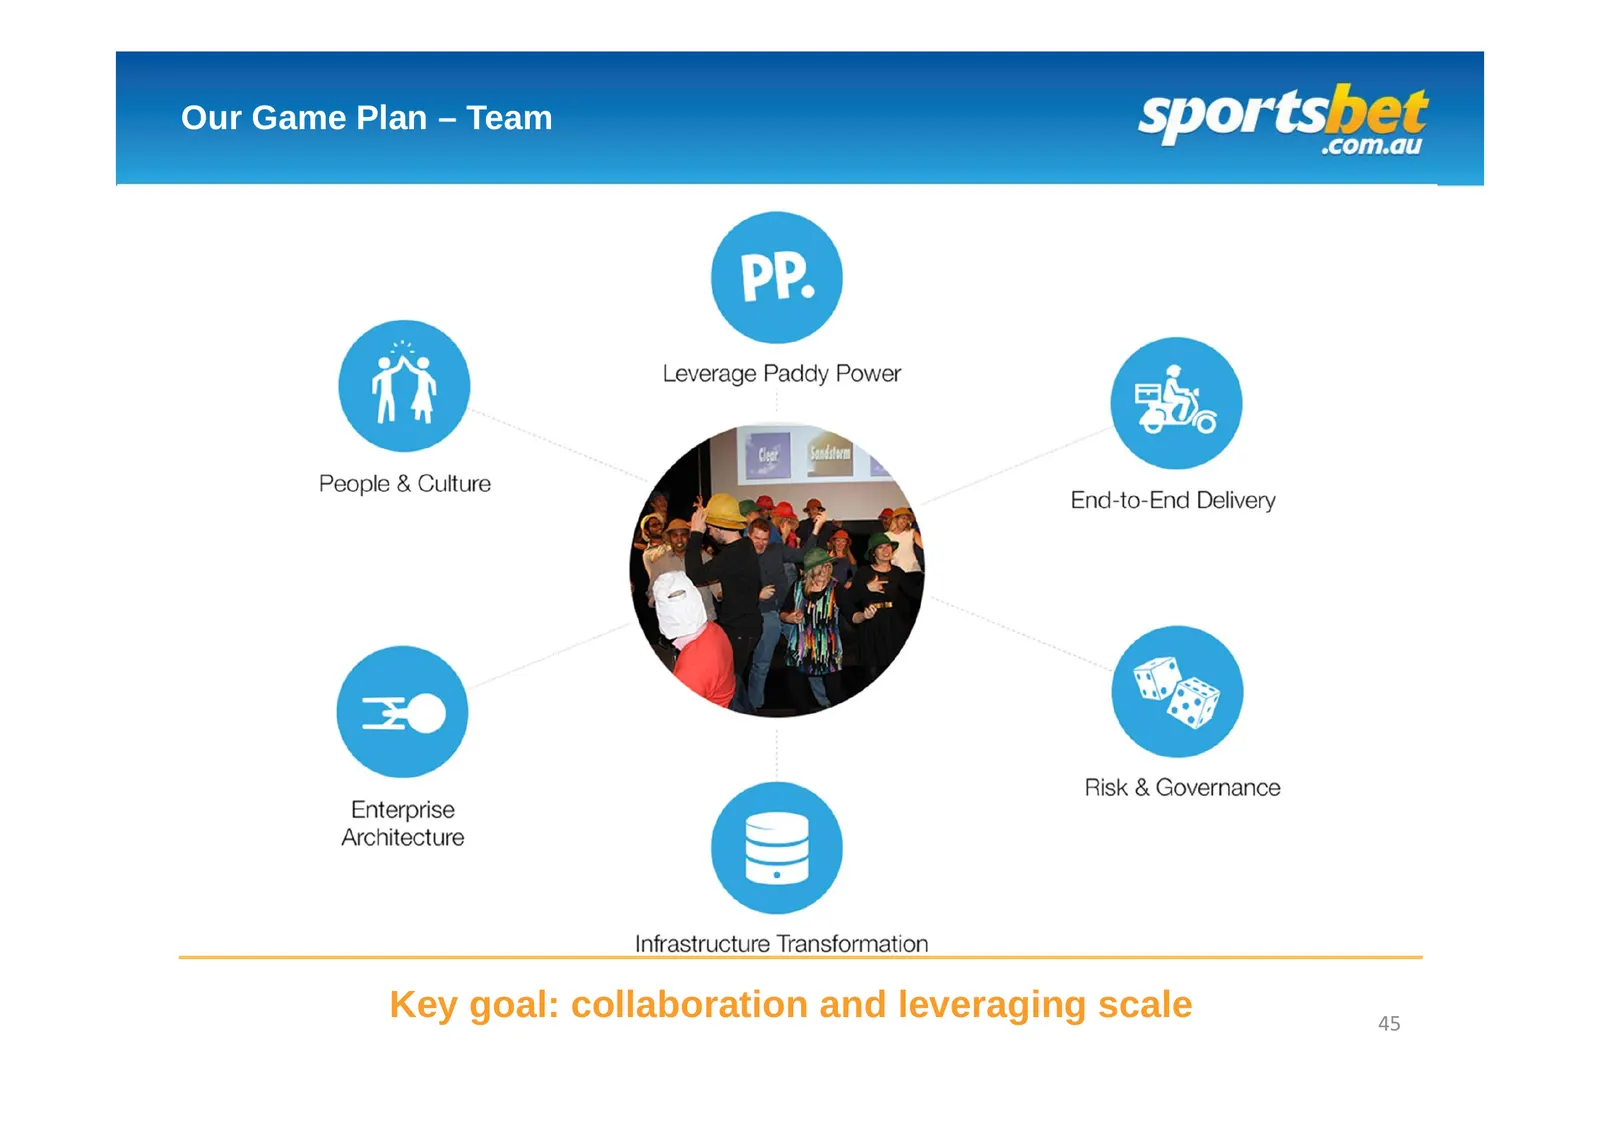
Our Game Plan – Team Key goal: collaboration and leveraging scale 45
Slide 46: Summary
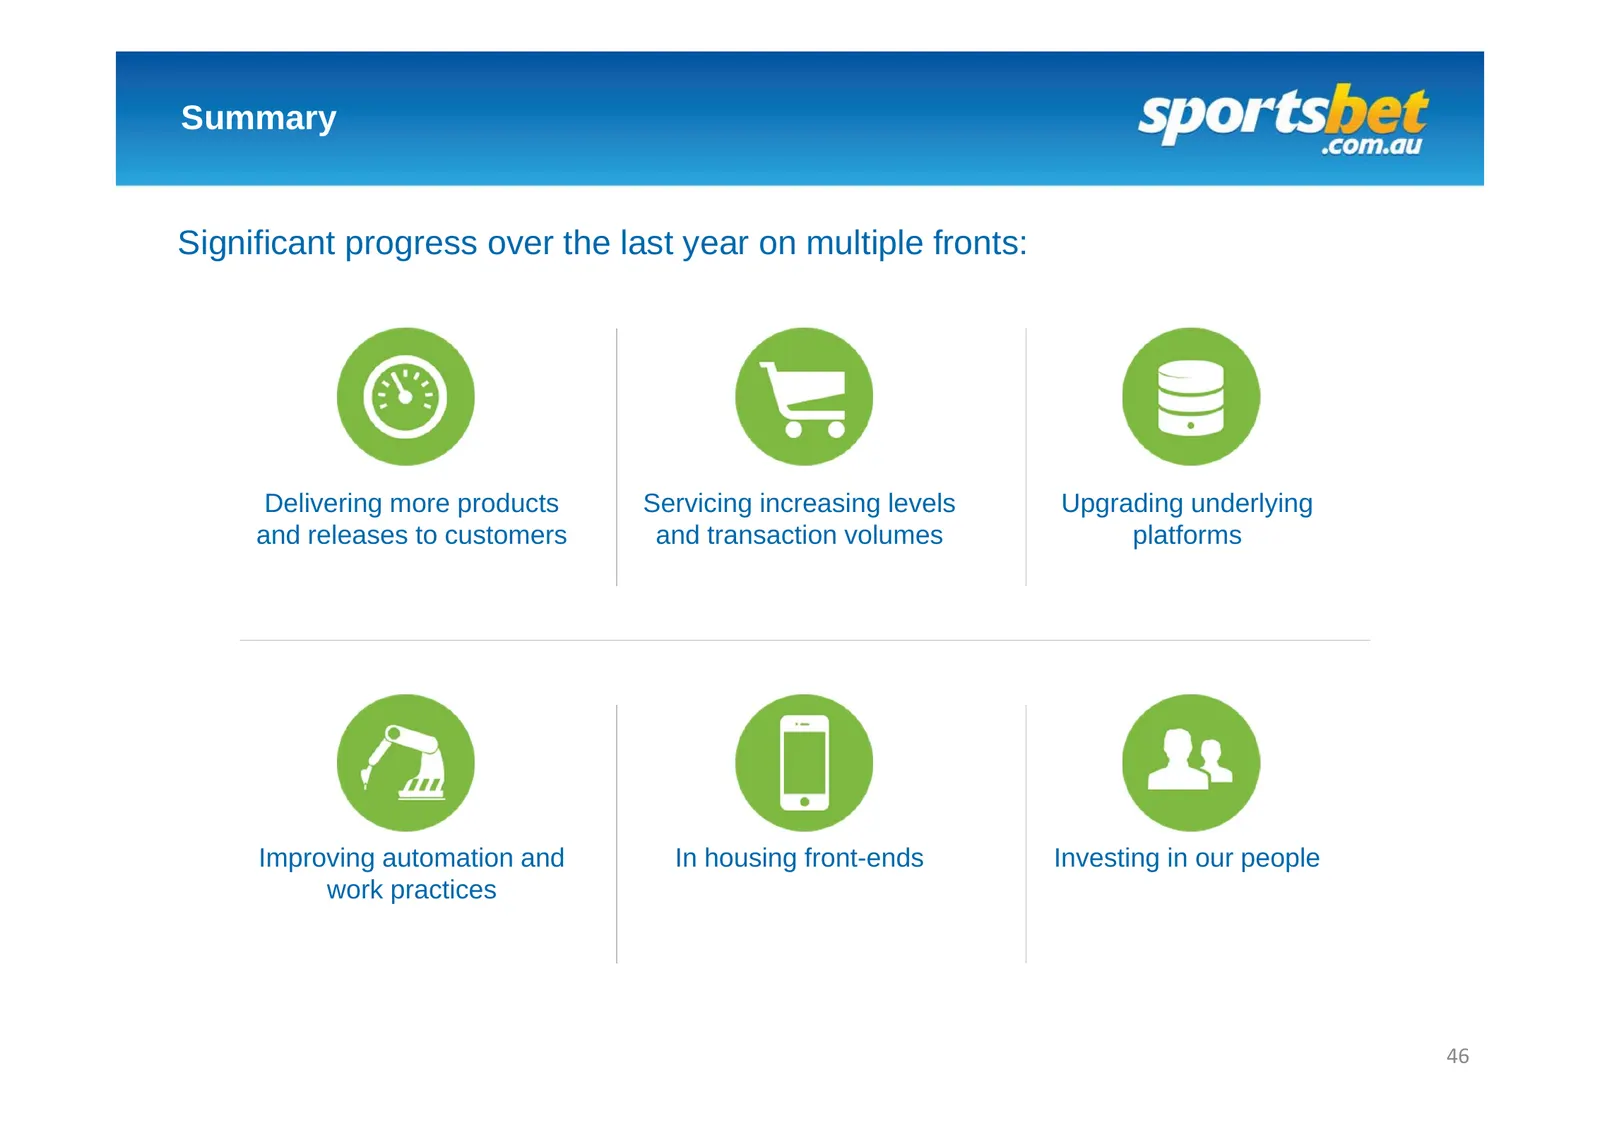
Summary Significant progress over the last year on multiple fronts: Delivering more products Servicing increasing levels Upgrading underlying and releases to customers and transaction volumes platforms Improving automation and In housing front-ends Investing in our people work practices 46
Slide 47: Marketing
Barni Evans – Marketing Director Marketing 24 October 2014
Slide 48: Sportsbet's Marketing Operating Model
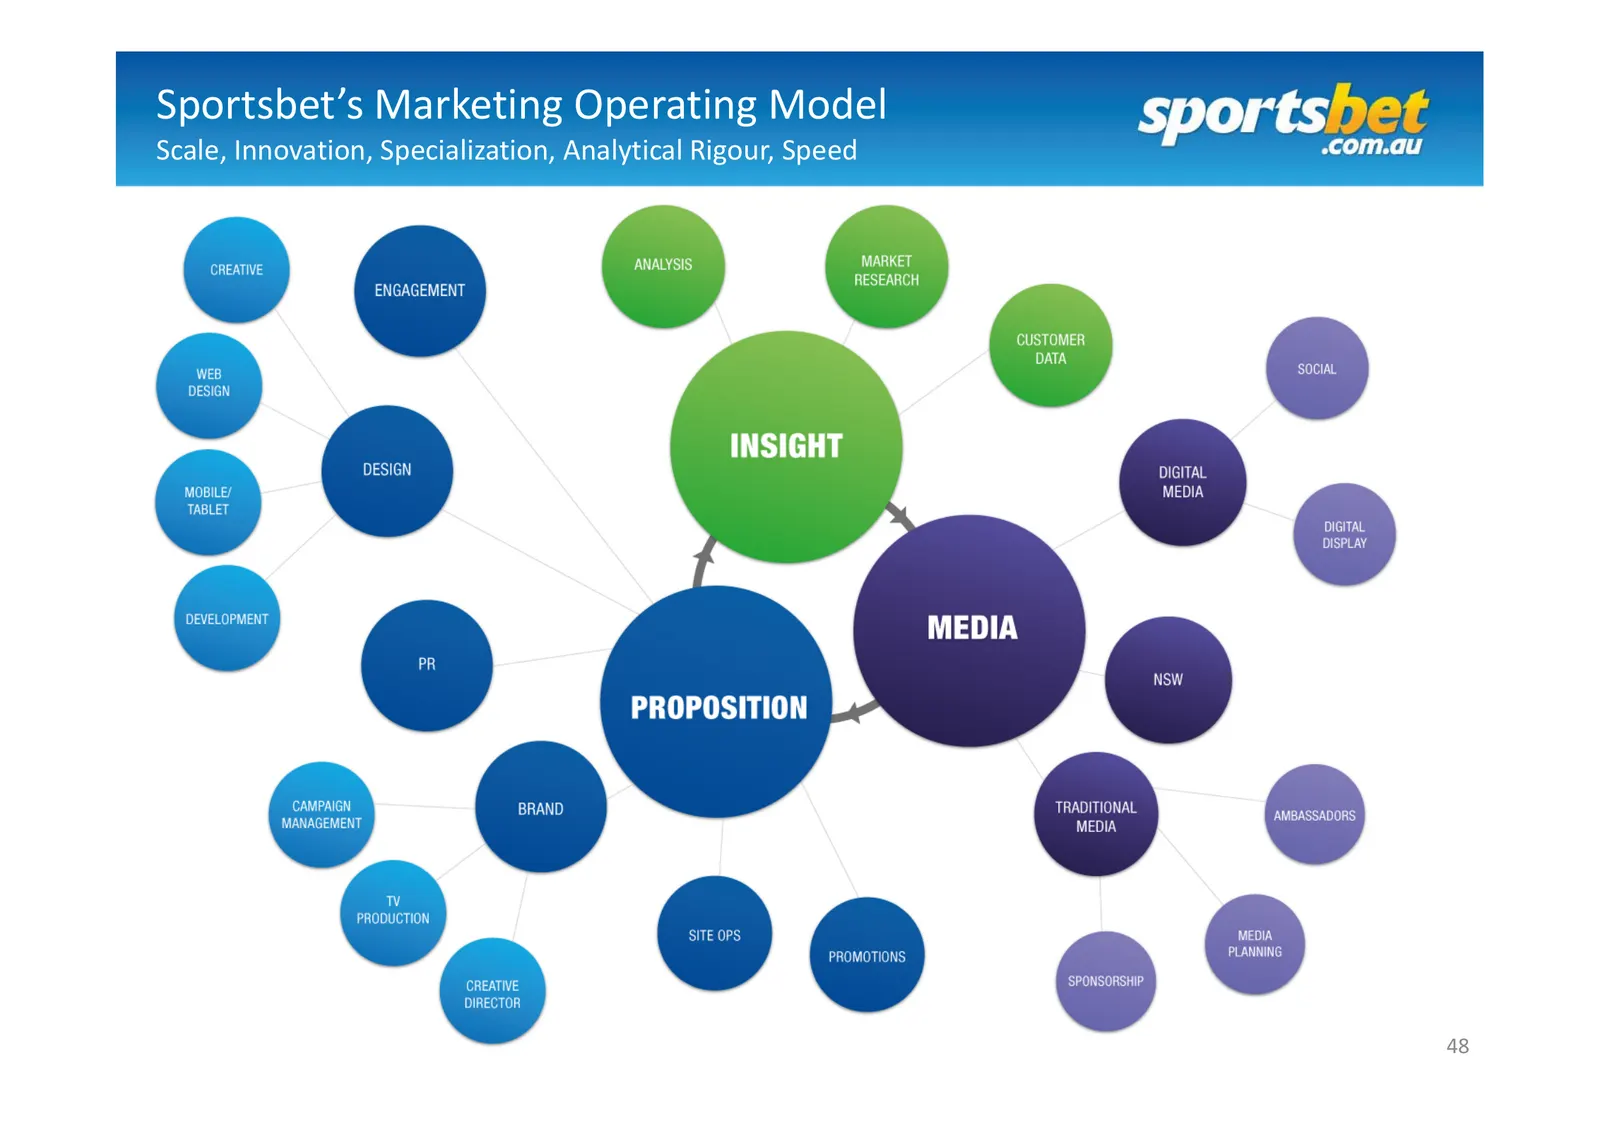
Sportsbet’s Marketing Operating Model Scale, Innovation, Specialization, Analytical Rigour, Speed 48
Slide 49: Mobile
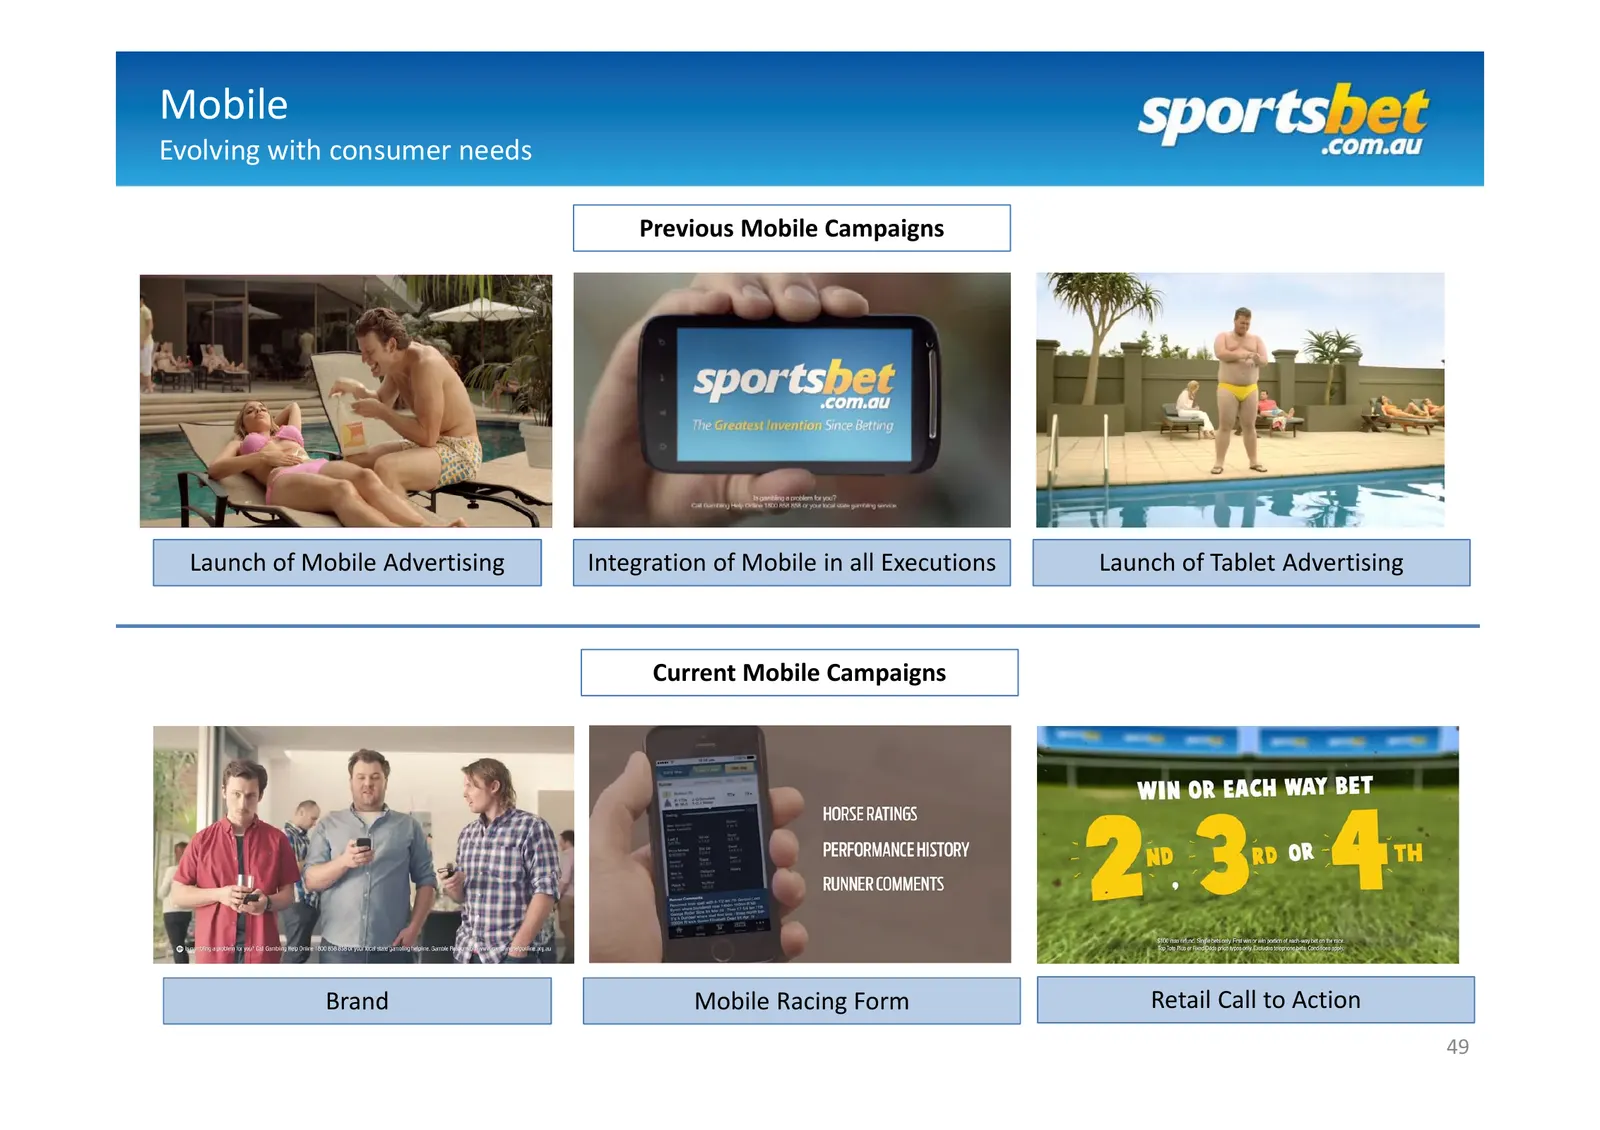
Mobile Evolving with consumer needs Previous Mobile Campaigns Launch of Mobile Advertising Integration of Mobile in all Executions Launch of Tablet Advertising Current Mobile Brand TVCs Current Mobile Campaigns Brand Mobile Racing Form Retail Call to Action 49
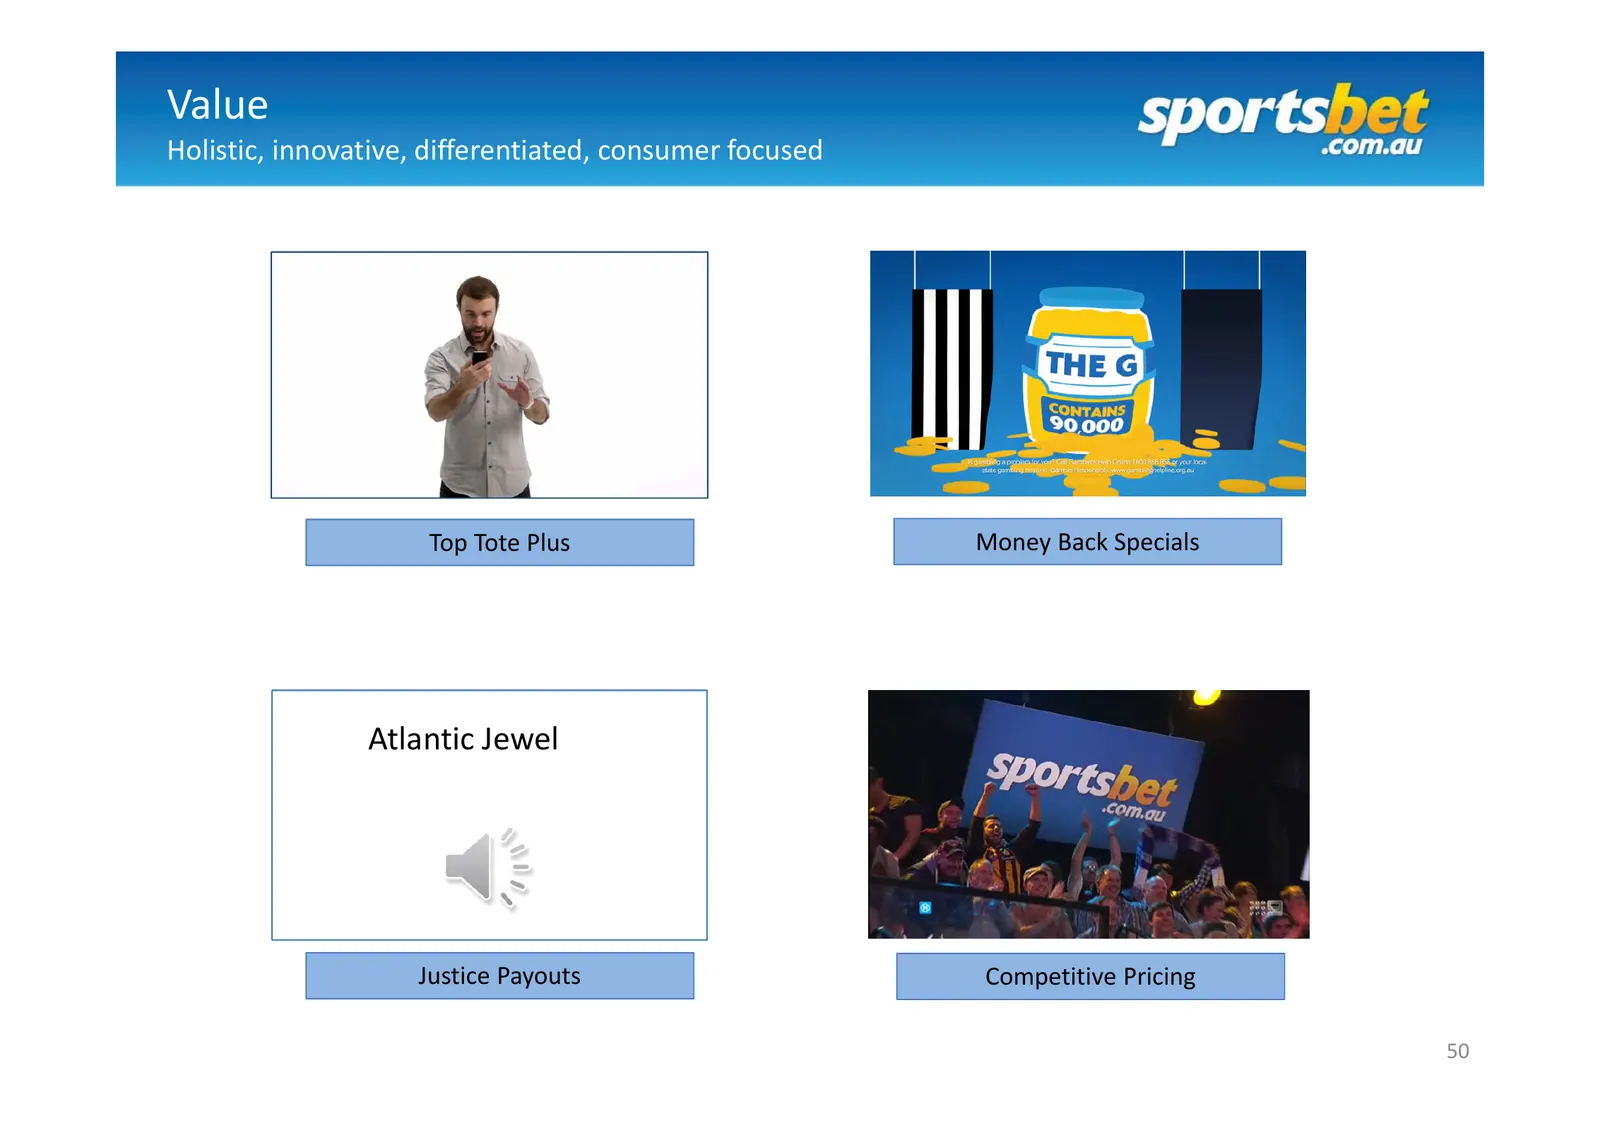
Slide 50: Value
Value Holistic, innovative, differentiated, consumer focused Top Tote Plus Money Back Specials Atlantic Jewel Justice Payouts Competitive Pricing 50
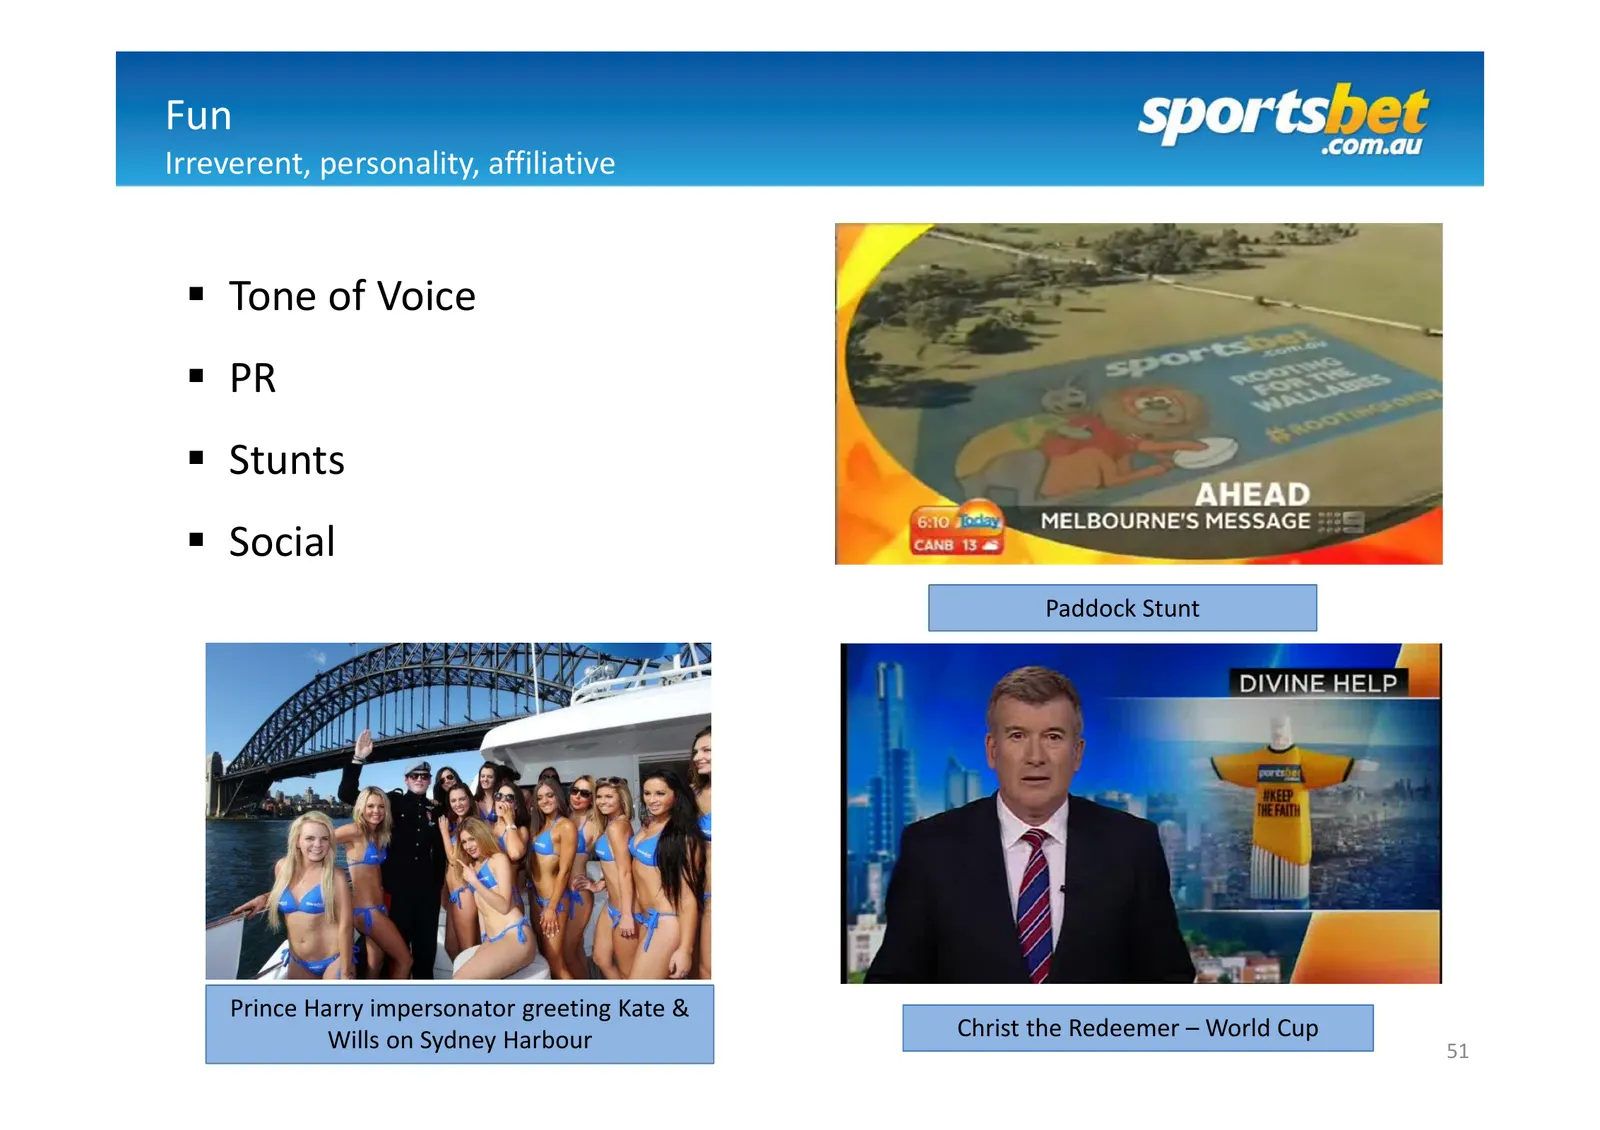
Slide 51: Fun
Fun Irreverent, personality, affiliative Tone of Voice PR Stunts Social Paddock Stunt Prince Harry impersonator greeting Kate & Wills on Sydney Harbour Christ the Redeemer – World Cup 51
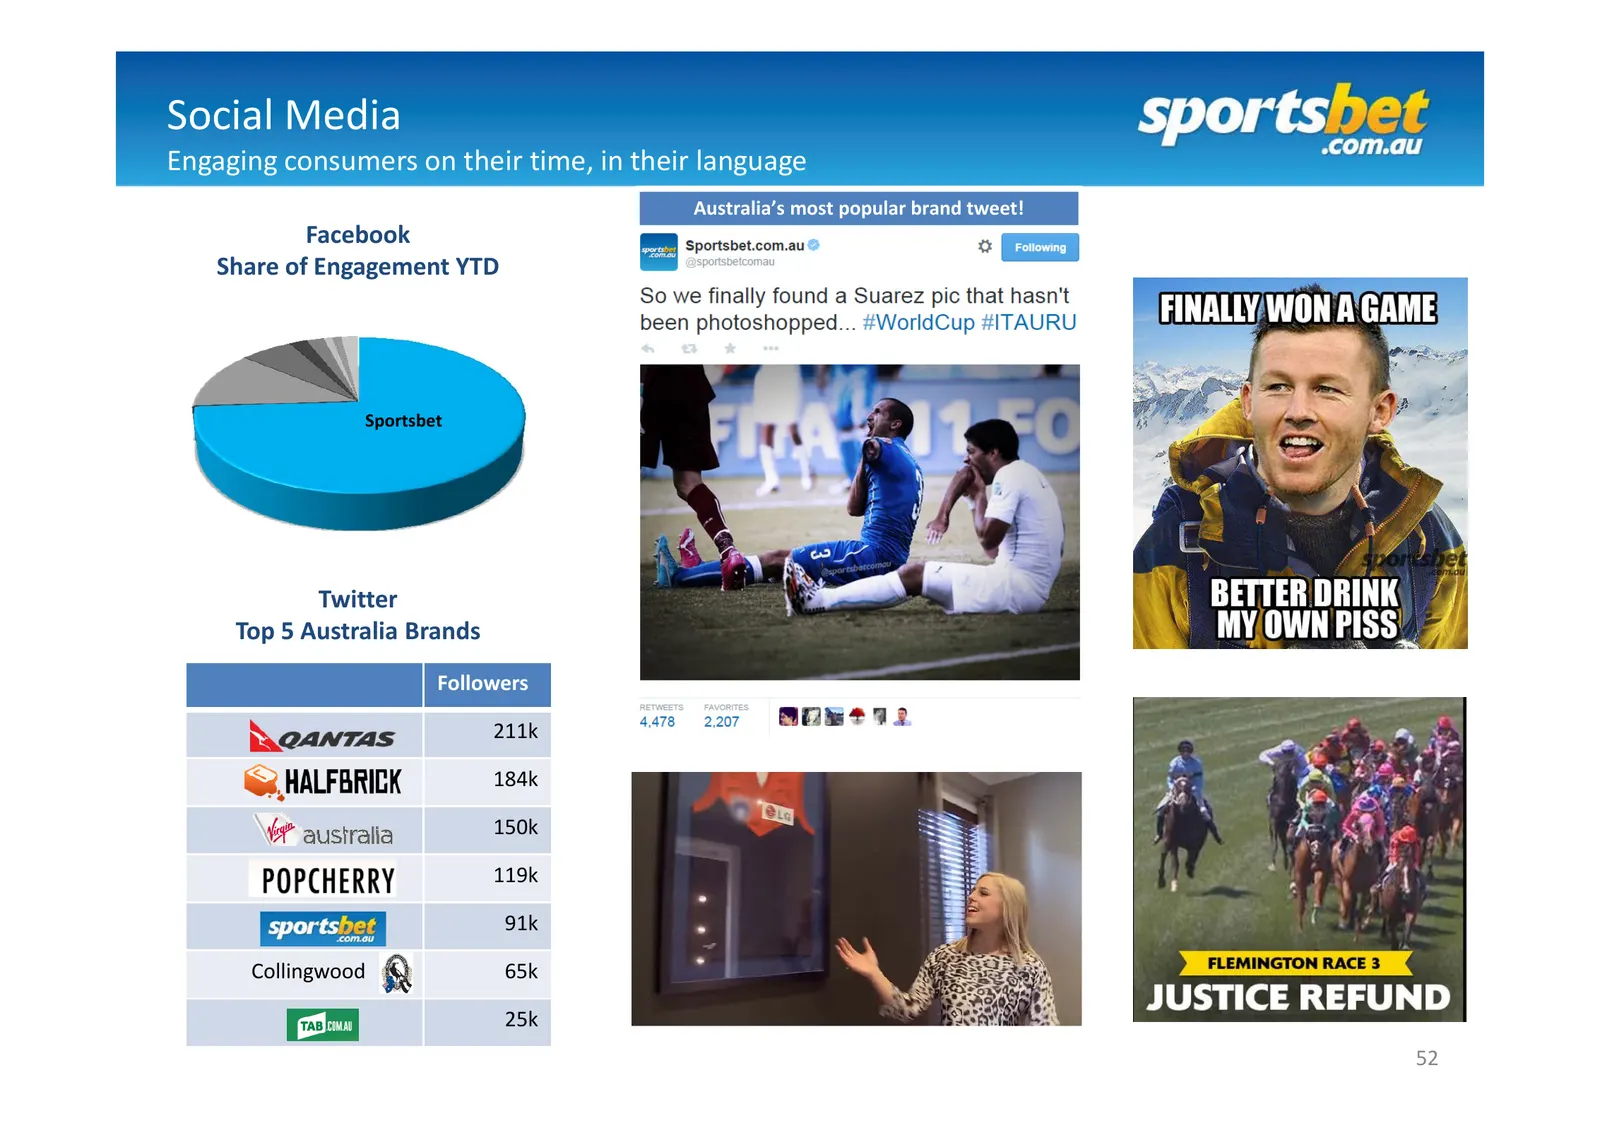
Slide 52: Social Media
Social Media Engaging consumers on their time, in their language Australia’s most popular brand tweet! Facebook Share of Engagement YTD Sportsbet Twitter Top 5 Australia Brands Followers 211k 184k 150k 119k 91k Collingwood 65k 25k 52
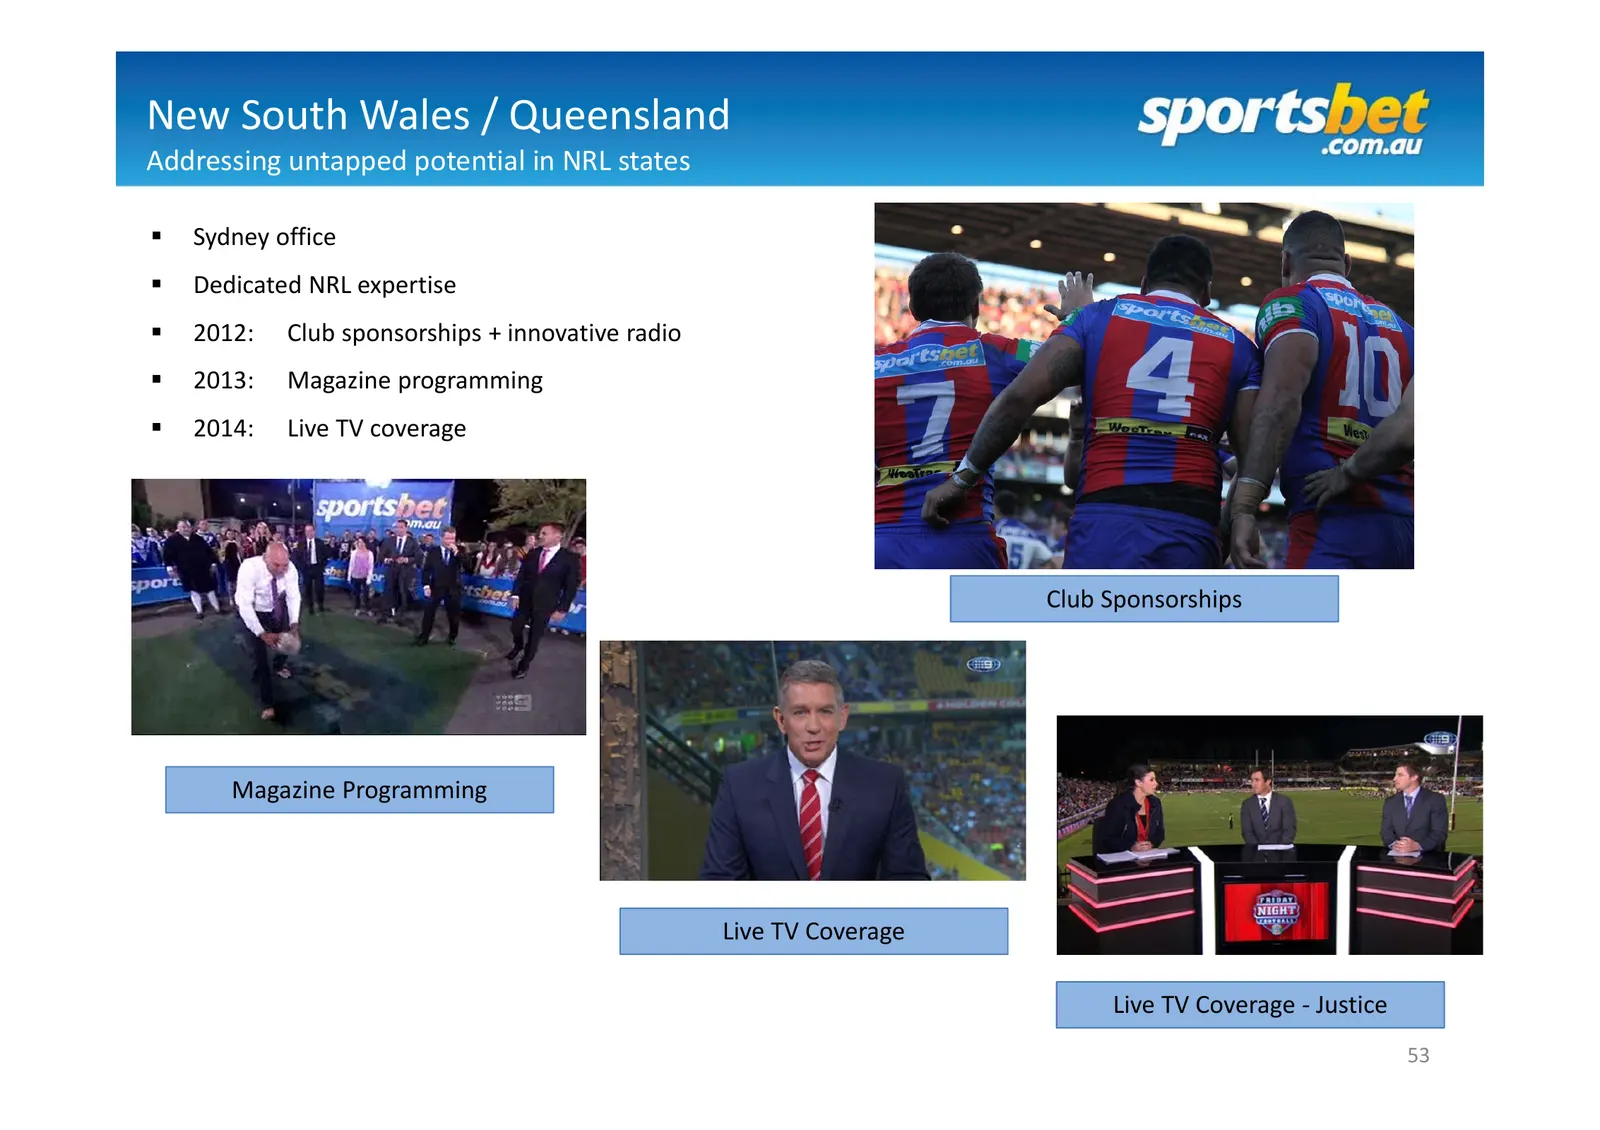
Slide 53: New South Wales / Queensland
New South Wales / Queensland Addressing untapped potential in NRL states Sydney office Dedicated NRL expertise 2012: Club sponsorships + innovative radio 2013: Magazine programming 2014: Live TV coverage Club Sponsorships Magazine Programming Live TV Coverage Live TV Coverage ‐ Justice 53
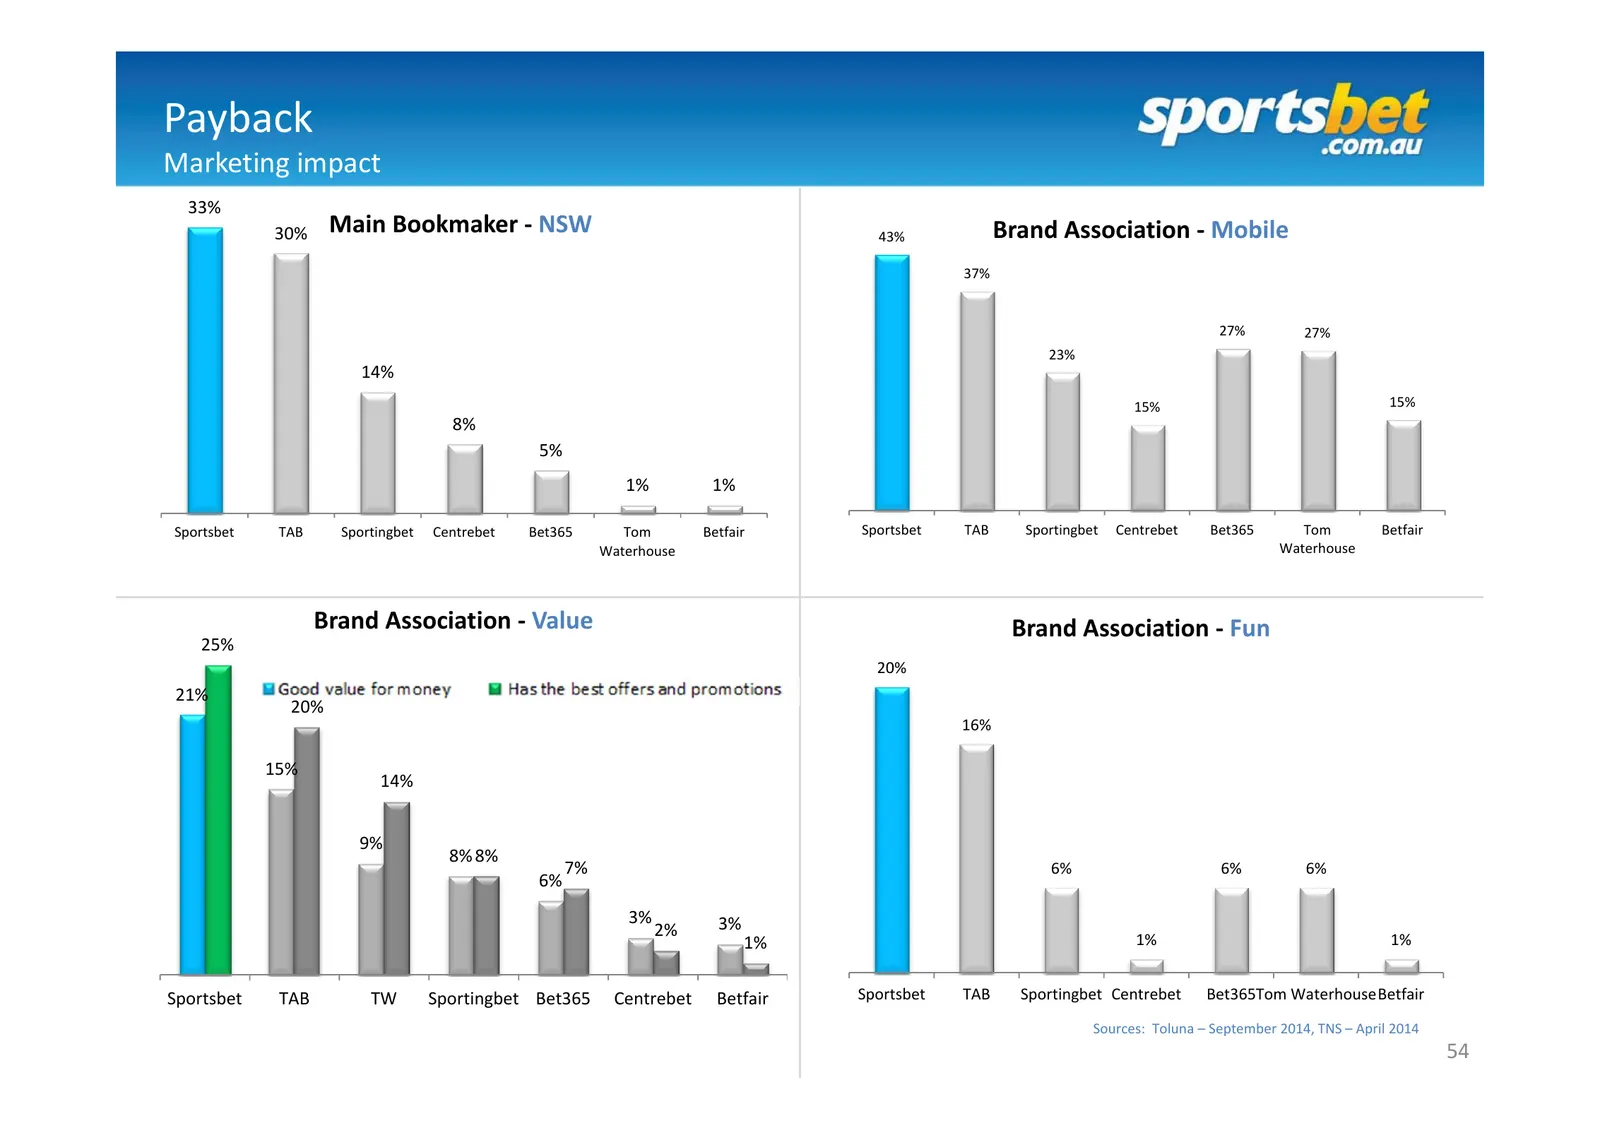
Slide 54: Payback – Marketing impact
Payback Marketing impact 33% 30% Main Bookmaker ‐ NSW 43% Brand Association ‐ Mobile 37% 27% 27% 23% 14% 15% 15% 8% 5% 1% 1% Sportsbet TAB Sportingbet Centrebet Bet365 Tom Betfair Sportsbet TAB Sportingbet Centrebet Bet365 Tom Betfair Waterhouse Waterhouse Brand Association ‐ Value Brand Association
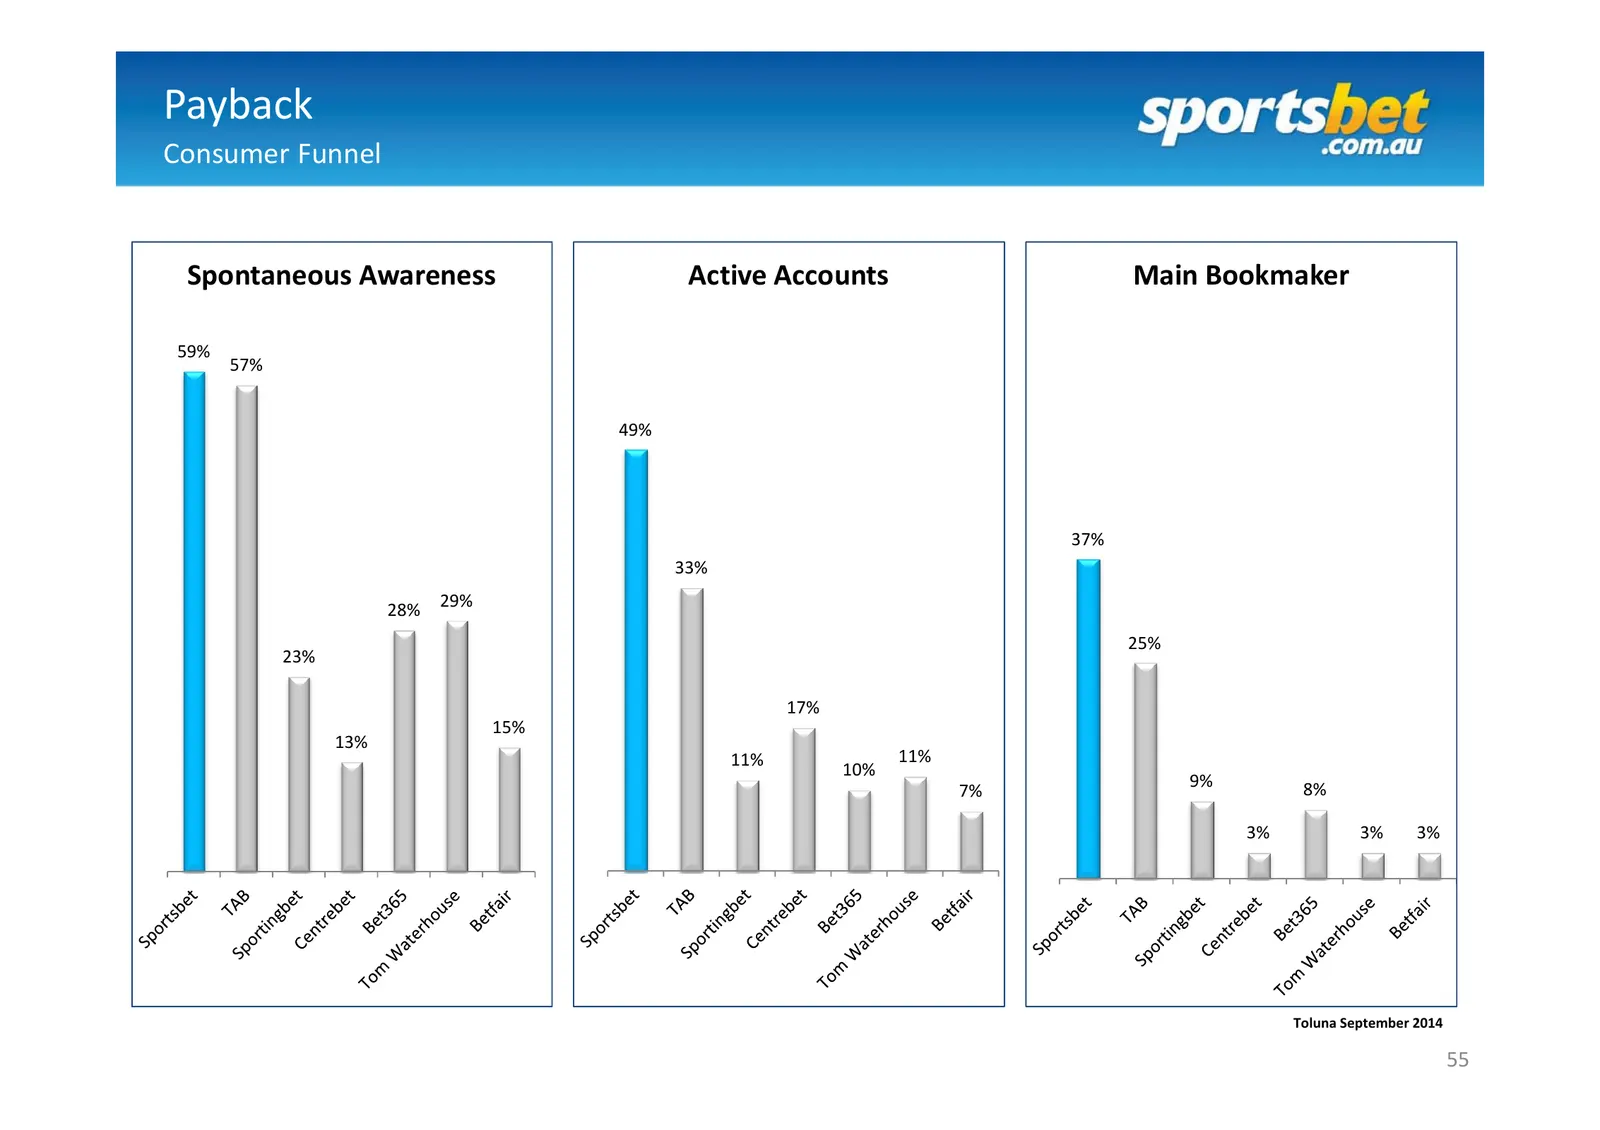
Slide 55: Payback – Consumer Funnel
Payback Consumer Funnel Spontaneous Awareness Active Accounts Main Bookmaker 59% 57% 49% 37% 33% 29% 28% 25% 23% 17% 15% 13% 11% 11% 10% 9% 8% 7% 3% 3% 3% Toluna September 2014 55

Slide 56: Wrap up
Spor tshet Wrap up -com.au
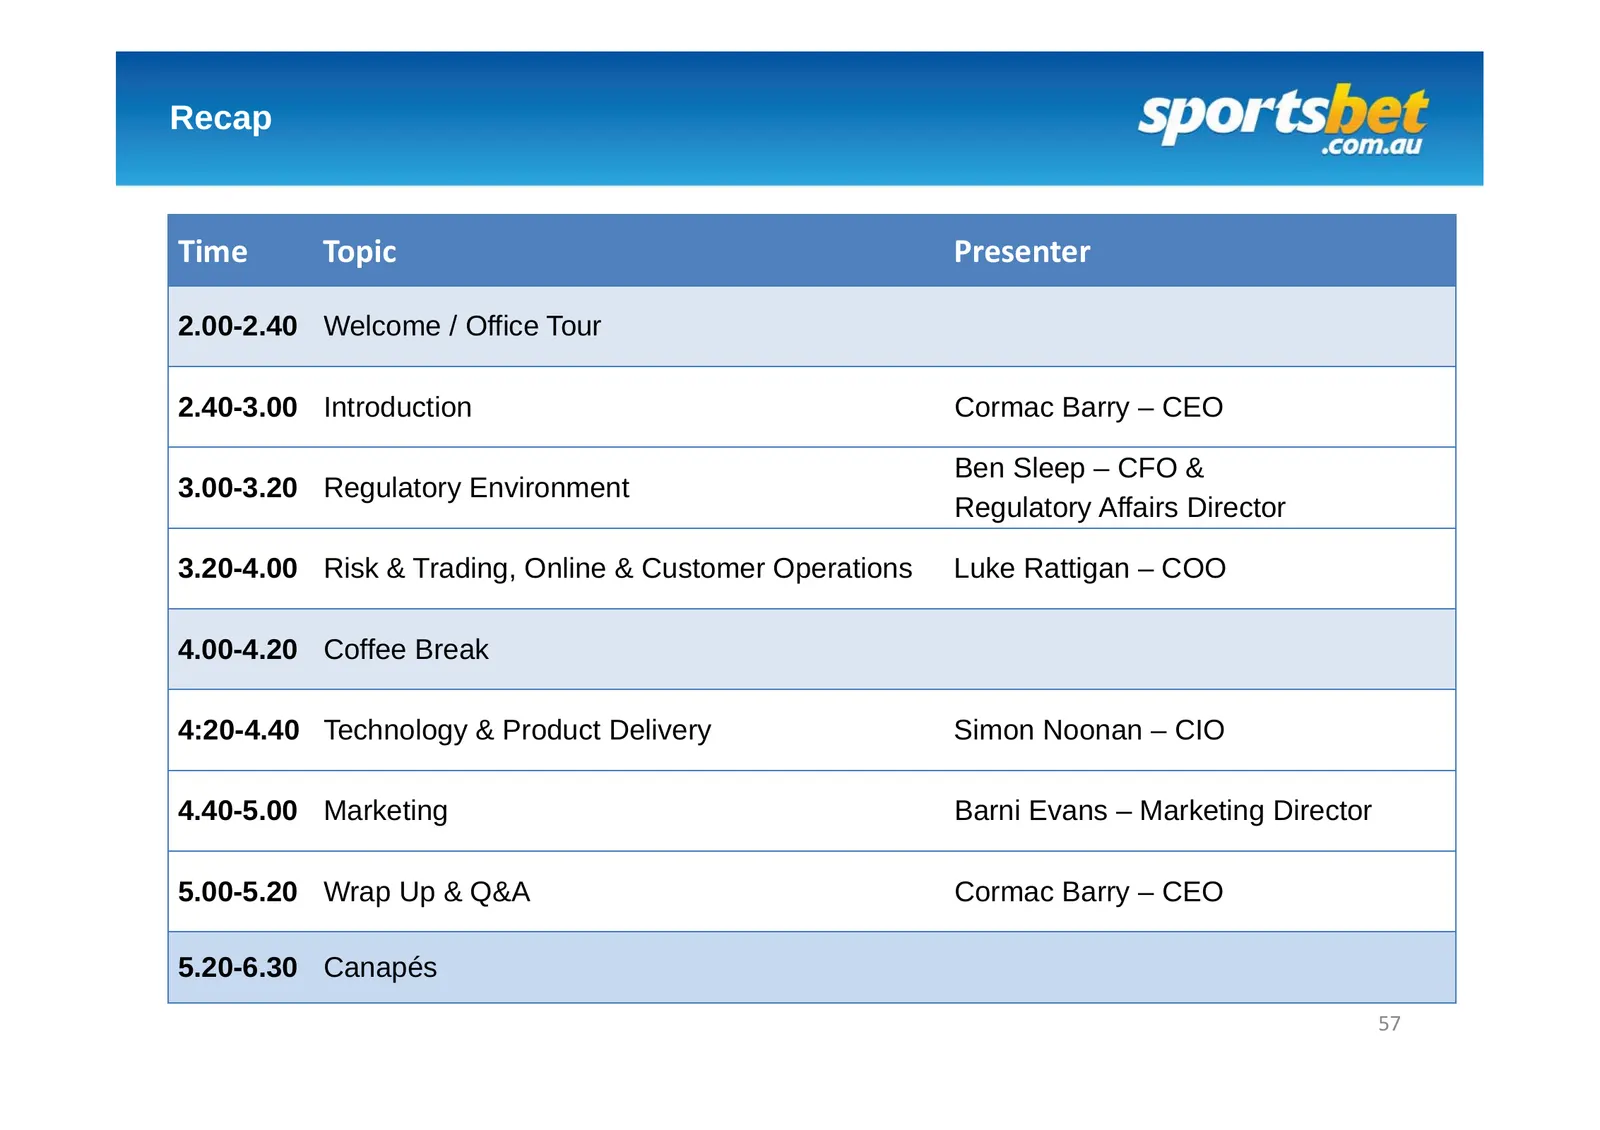
Slide 57: Recap
Recap Time Topic Presenter 2.00-2.40 Welcome / Office Tour 2.40-3.00 Introduction Cormac Barry – CEO Ben Sleep – CFO & 3.00-3.20 Regulatory Environment Regulatory Affairs Director 3.20-4.00 Risk & Trading, Online & Customer Operations Luke Rattigan – COO 4.00-4.20 Coffee Break 4:20-4.40 Technology &
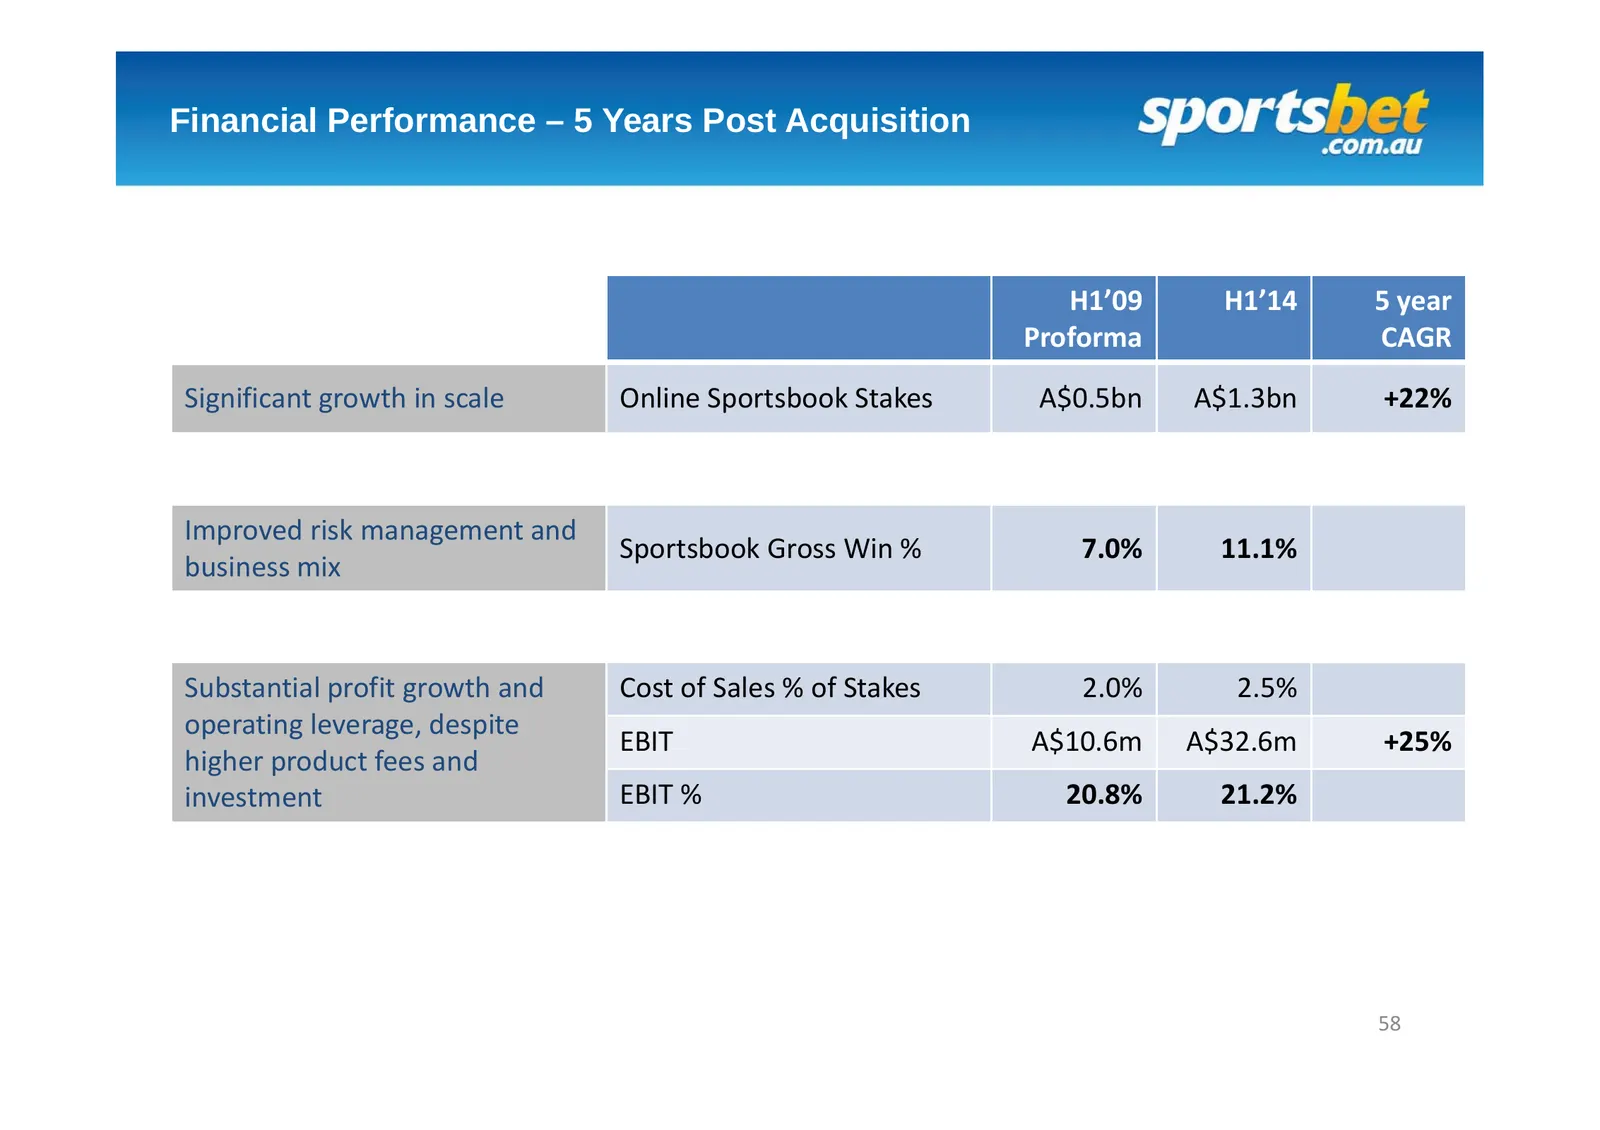
Slide 58: Financial Performance – 5 Years Post Acquisition
Financial Performance – 5 Years Post Acquisition H1’09 H1’14 5 year Proforma CAGR Significant growth in scale Online Sportsbook Stakes A$0.5bn A$1.3bn +22% Improved risk management and Sportsbook Gross Win % 7.0% 11.1% business mix Substantial profit growth and Cost of Sales % of Stakes 2.0% 2.5% op
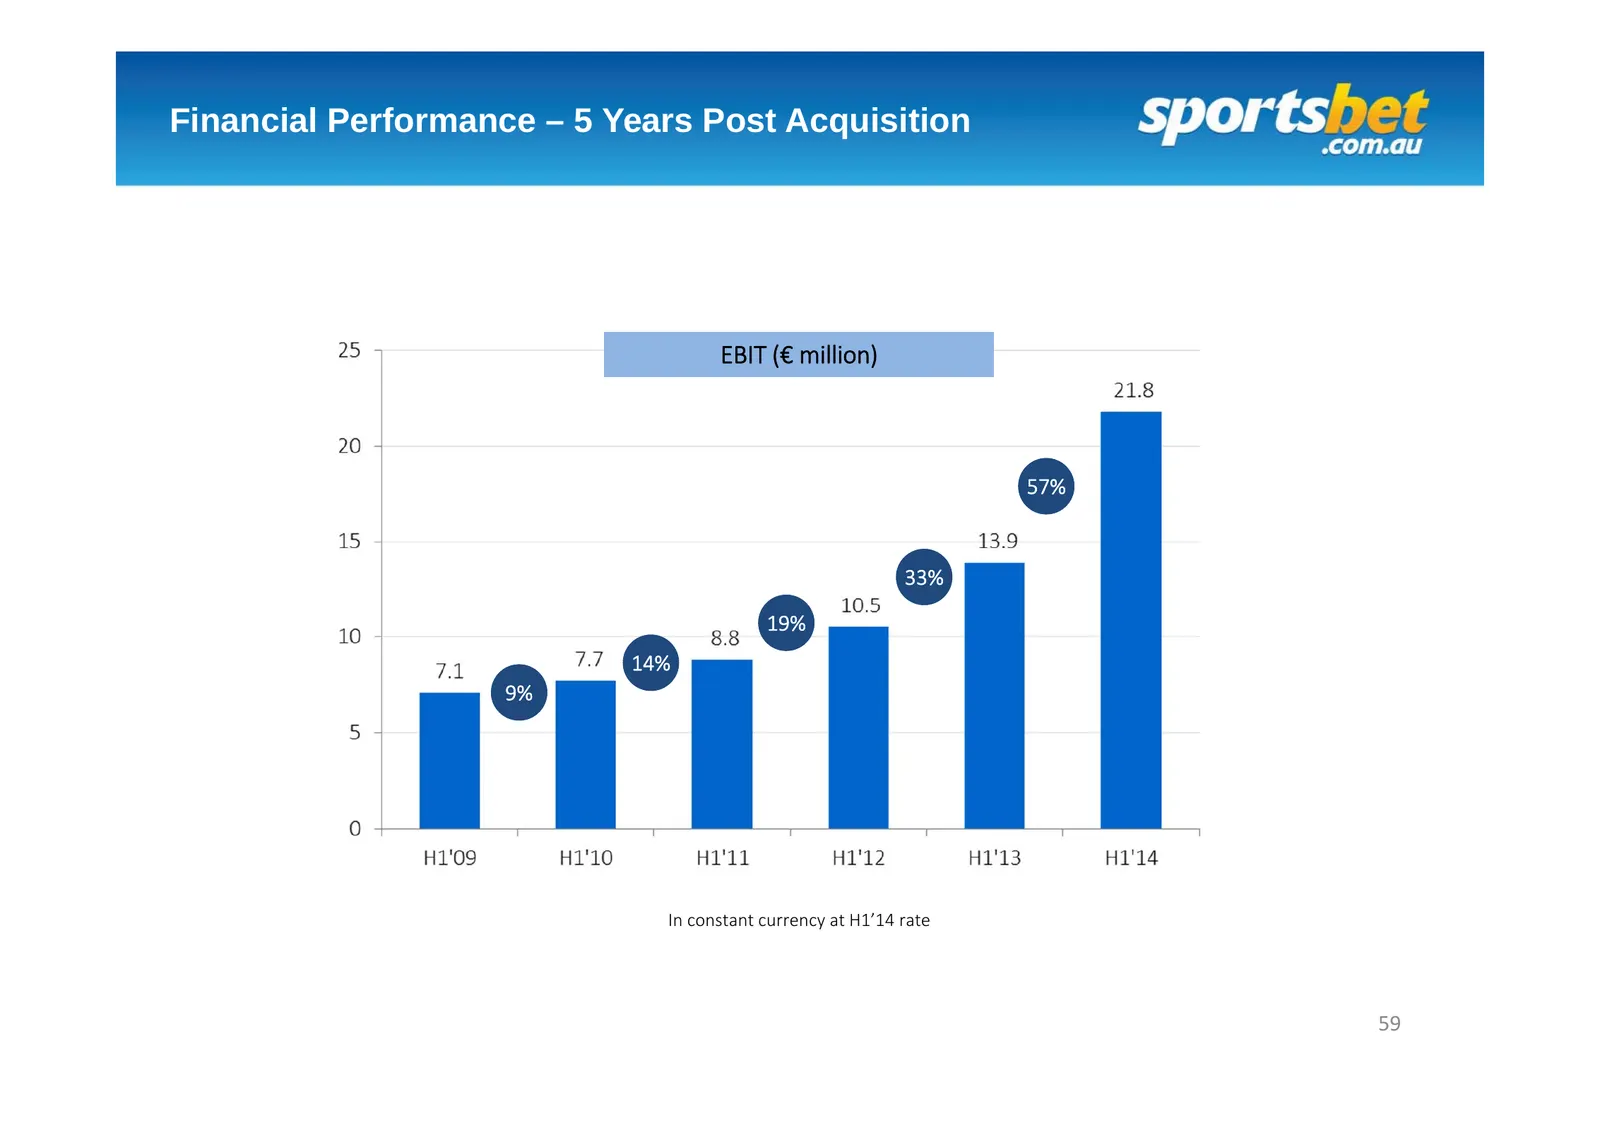
Slide 59: Financial Performance – 5 Years Post Acquisition (EBIT)
Financial Performance – 5 Years Post Acquisition EBIT (€ million) 57% 33% 19% 14% 9% In constant currency at H1’14 rate 59
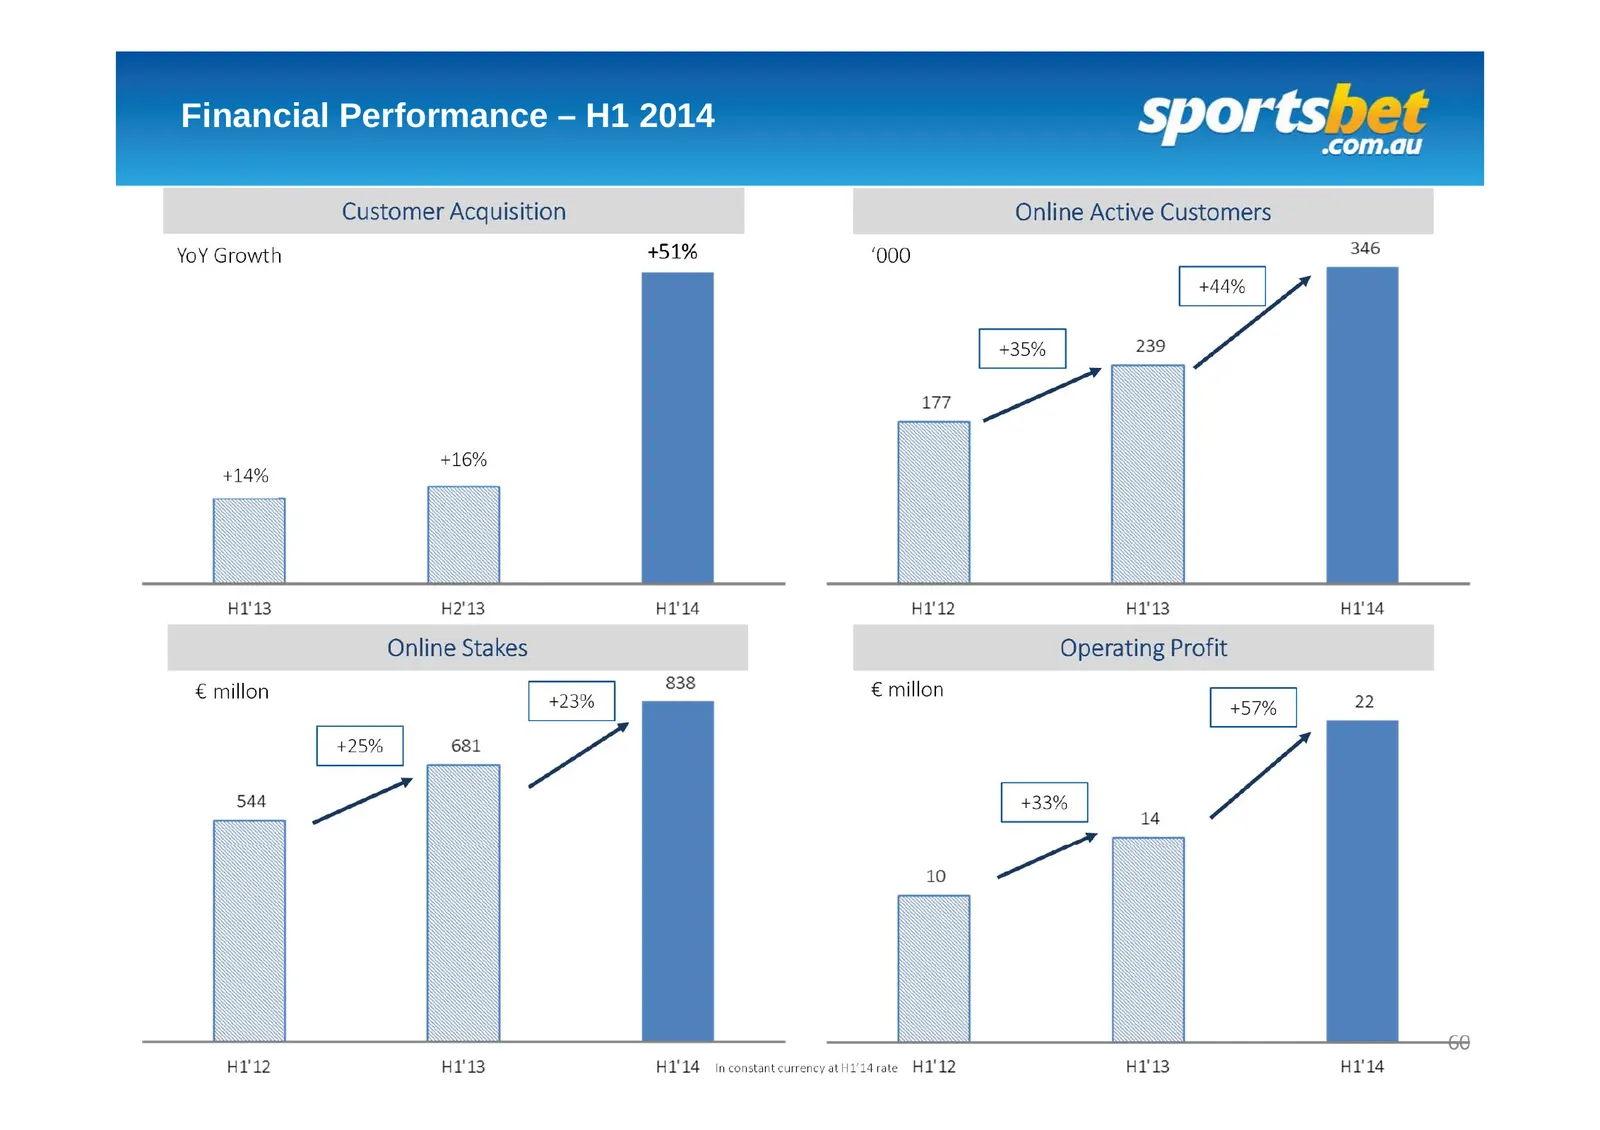
Slide 60: Financial Performance – H1 2014
Financial Performance – H1 2014 Customer Acquisition Online Active Customers YoY Growth +51% ‘000 +44% +35% +16% +14% Online Stakes Operating Profit € millon € millon +23% +57% +25% +33% 60 In constant currency at H1’14 rate
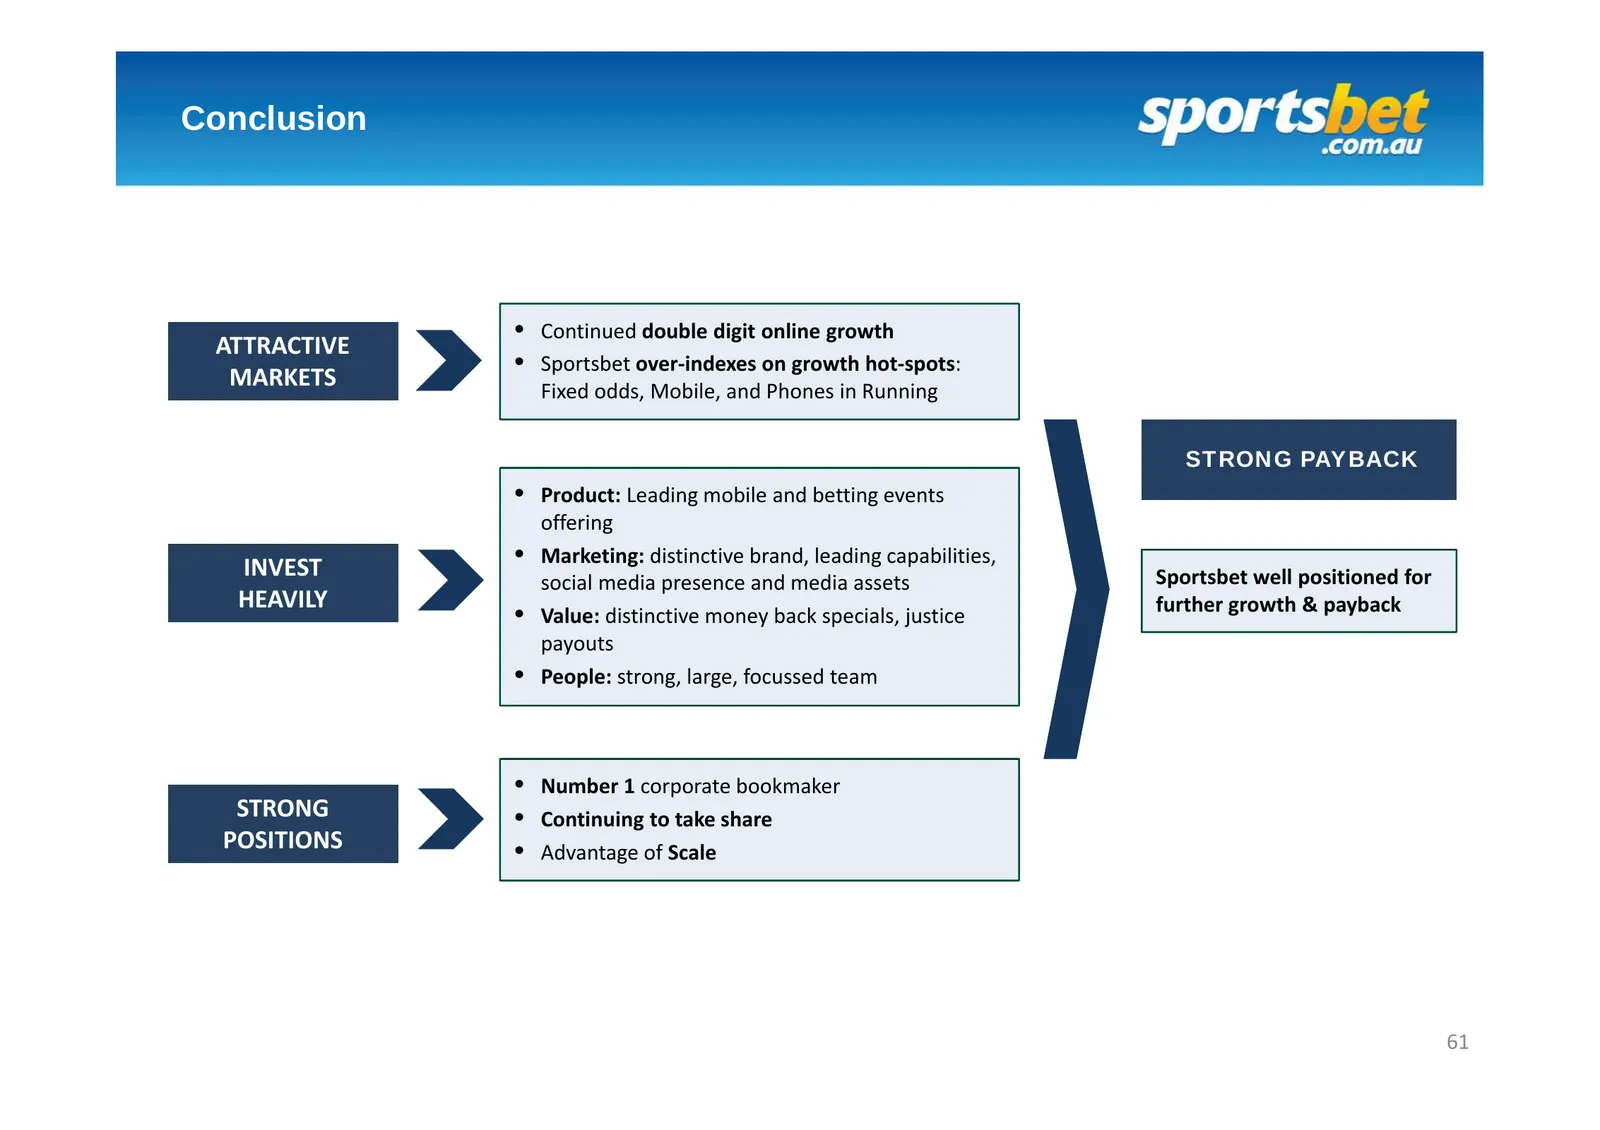
Slide 61: Conclusion
Conclusion • Continued double digit online growth ATTRACTIVE • Sportsbet over‐indexes on growth hot‐spots: MARKETS Fixed odds, Mobile, and Phones in Running STRONG PAYBACK • Product: Leading mobile and betting events offering INVEST • Marketing: distinctive brand, leading capabilities, social media
Slide 62: Q&A
Q&A
Source: Internet Archive copy of flutter.com
More decks from Flutter Entertainment plc
 Q3 2026 Earnings Presentation15 slides · Nov 4, 2026
 Q2 2026 Earnings Presentation14 slides · Aug 5, 2026
 Investor Day (September 2024)152 slides · Sep 25, 2024
 Q2 2024 Earnings Presentation20 slides · Aug 13, 2024
 Q1 2024 Earnings Presentation20 slides · May 14, 2024
 FY2023 Earnings Presentation36 slides · Mar 26, 2024