Marshalls plc · LSE:MSLH
Marshalls — H1 2008 Earnings Presentation
32 slides from Marshalls's earnings presentation, 2008

Slide 1: Transforming Britain’s Landscapes
Transforming Britain’s Landscapes Transforming Britain’s Landscapes
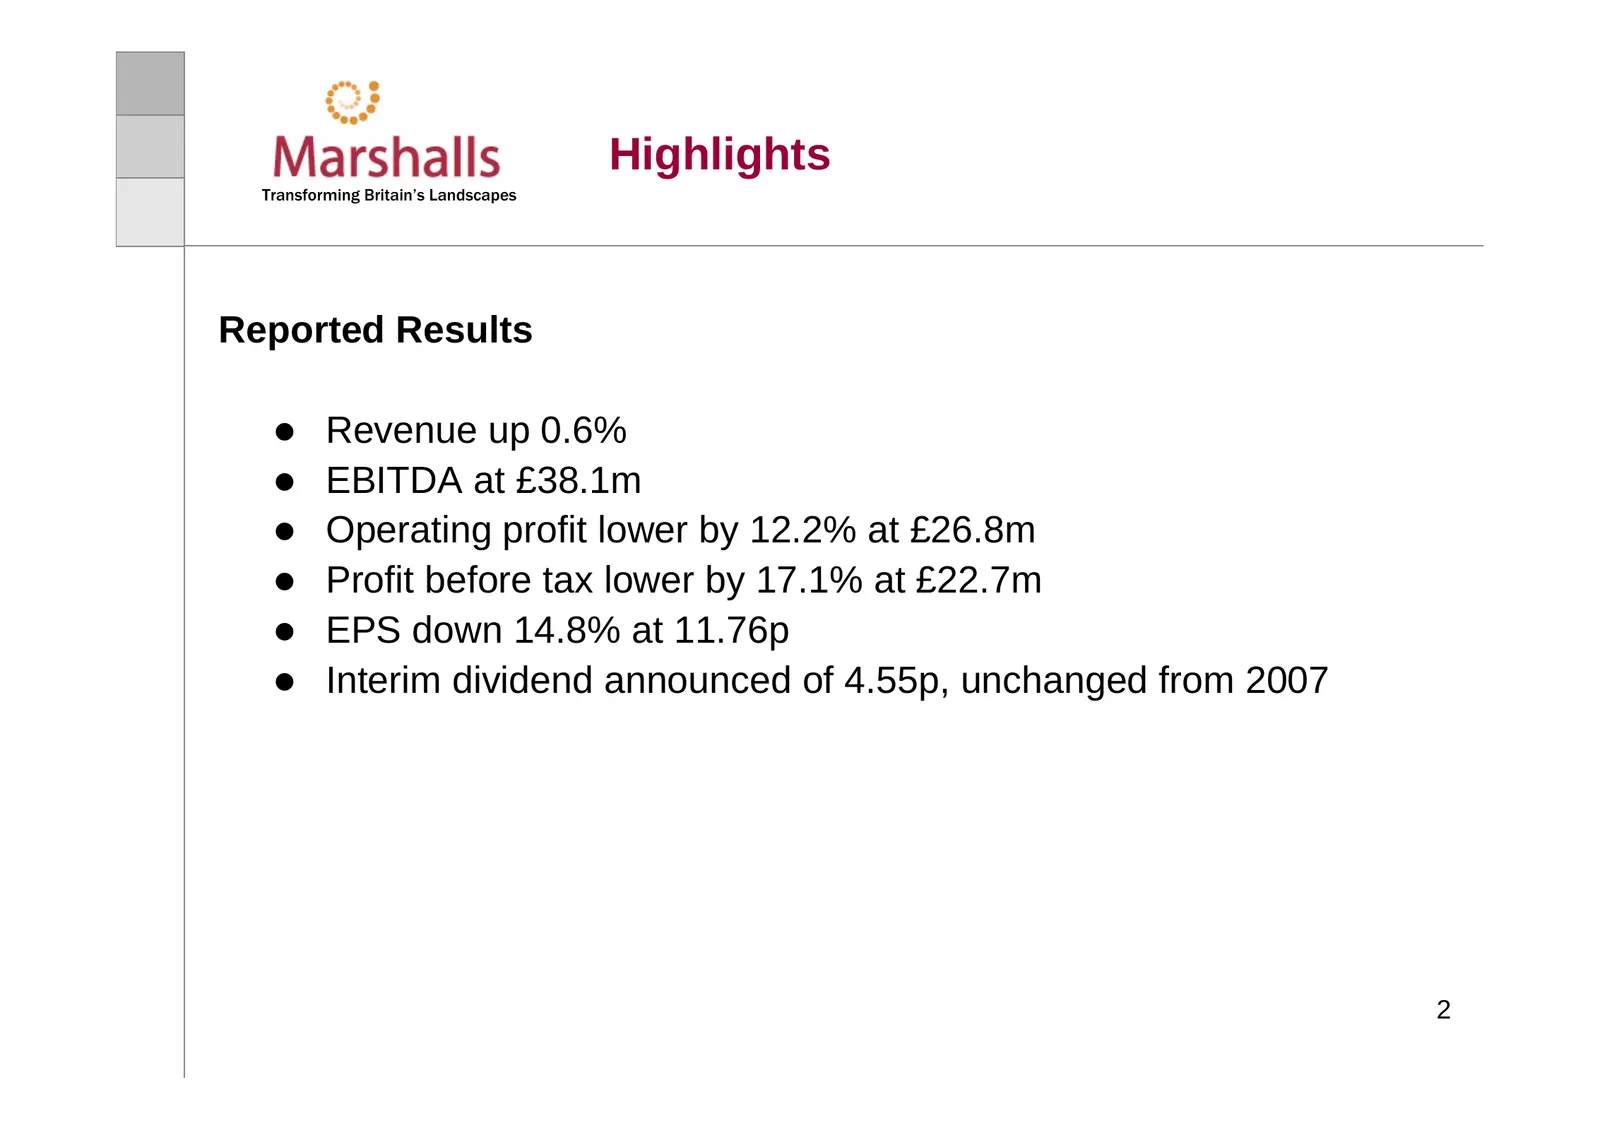
Slide 2: Highlights
Highlights Transforming Britain’s Landscapes Reported Results z Revenue up 0.6% z EBITDA at £38.1m z Operating profit lower by 12.2% at £26.8m z Profit before tax lower by 17.1% at £22.7m z EPS down 14.8% at 11.76p z Interim dividend announced of 4.55p, unchanged from 2007 2
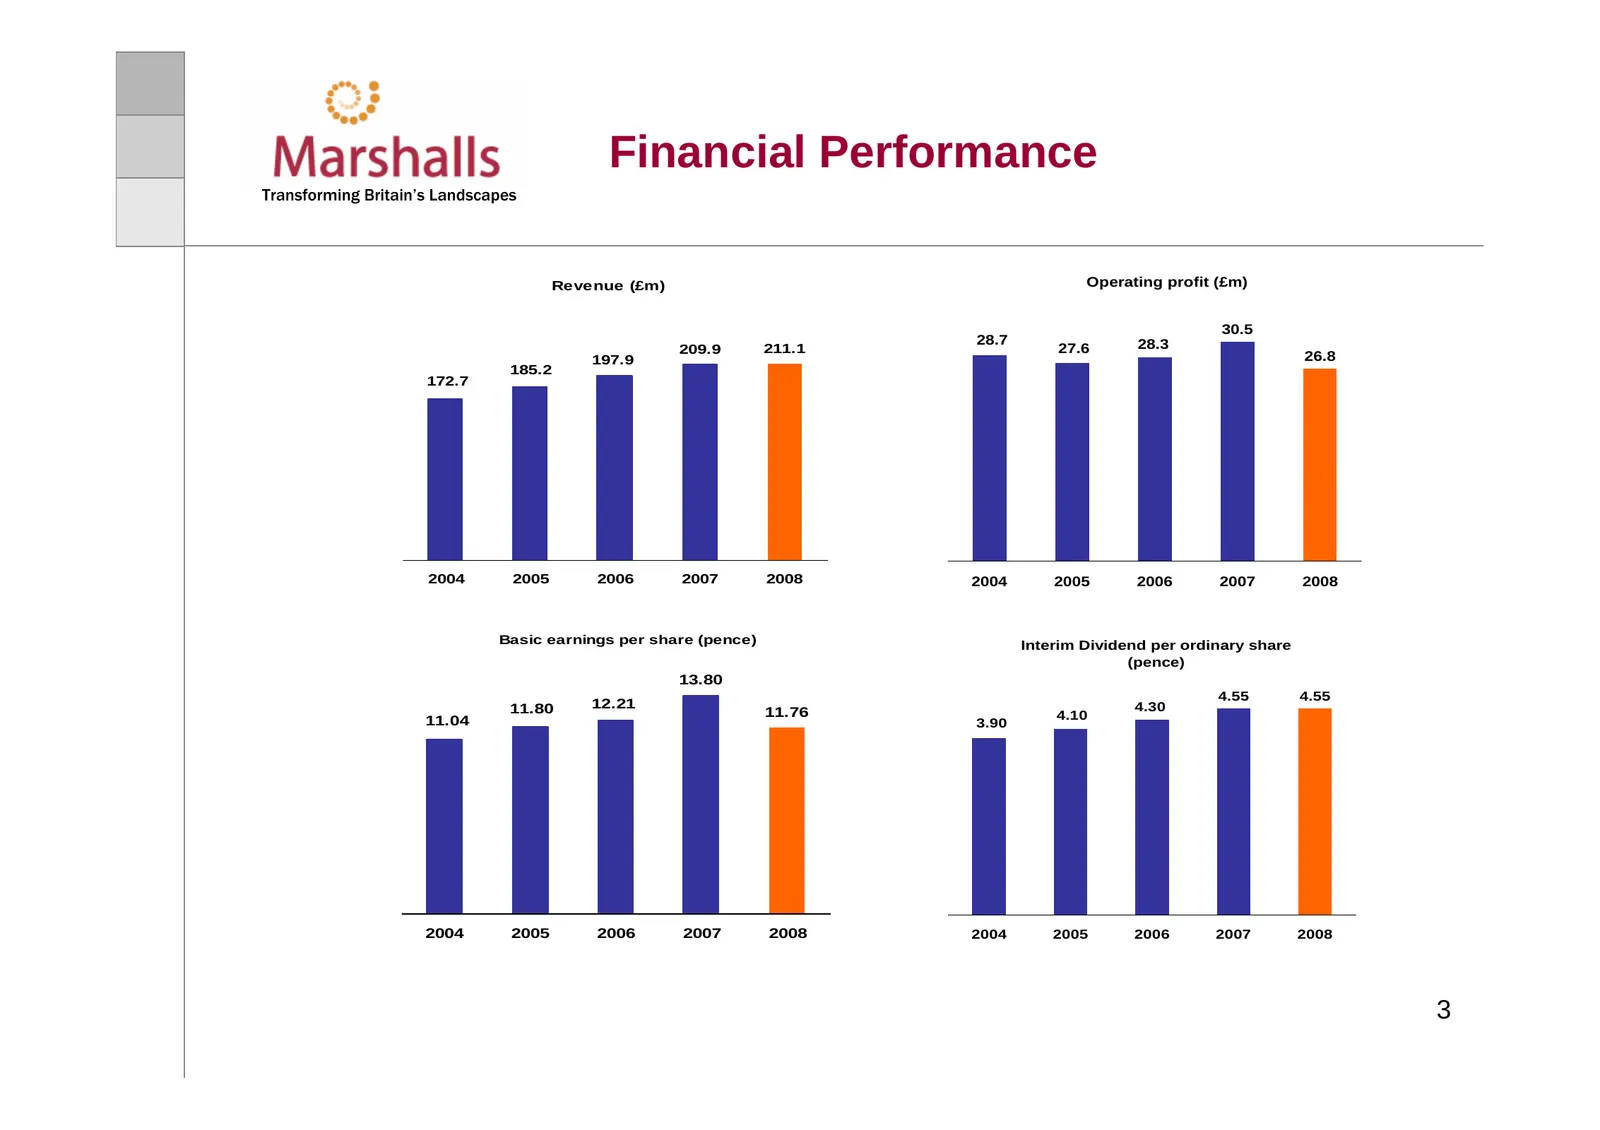
Slide 3: Financial Performance
Financial Performance Transforming Britain’s Landscapes Revenue (£m) Operating profit (£m) 30.5 28.7 28.3 209.9 211.1 27.6 197.9 26.8 185.2 172.7 2004 2005 2006 2007 2008 2004 2005 2006 2007 2008 Basic earnings per share (pence) Interim Dividend per ordinary share (pence) 13.80 4.55 4.55 11.80 12.21
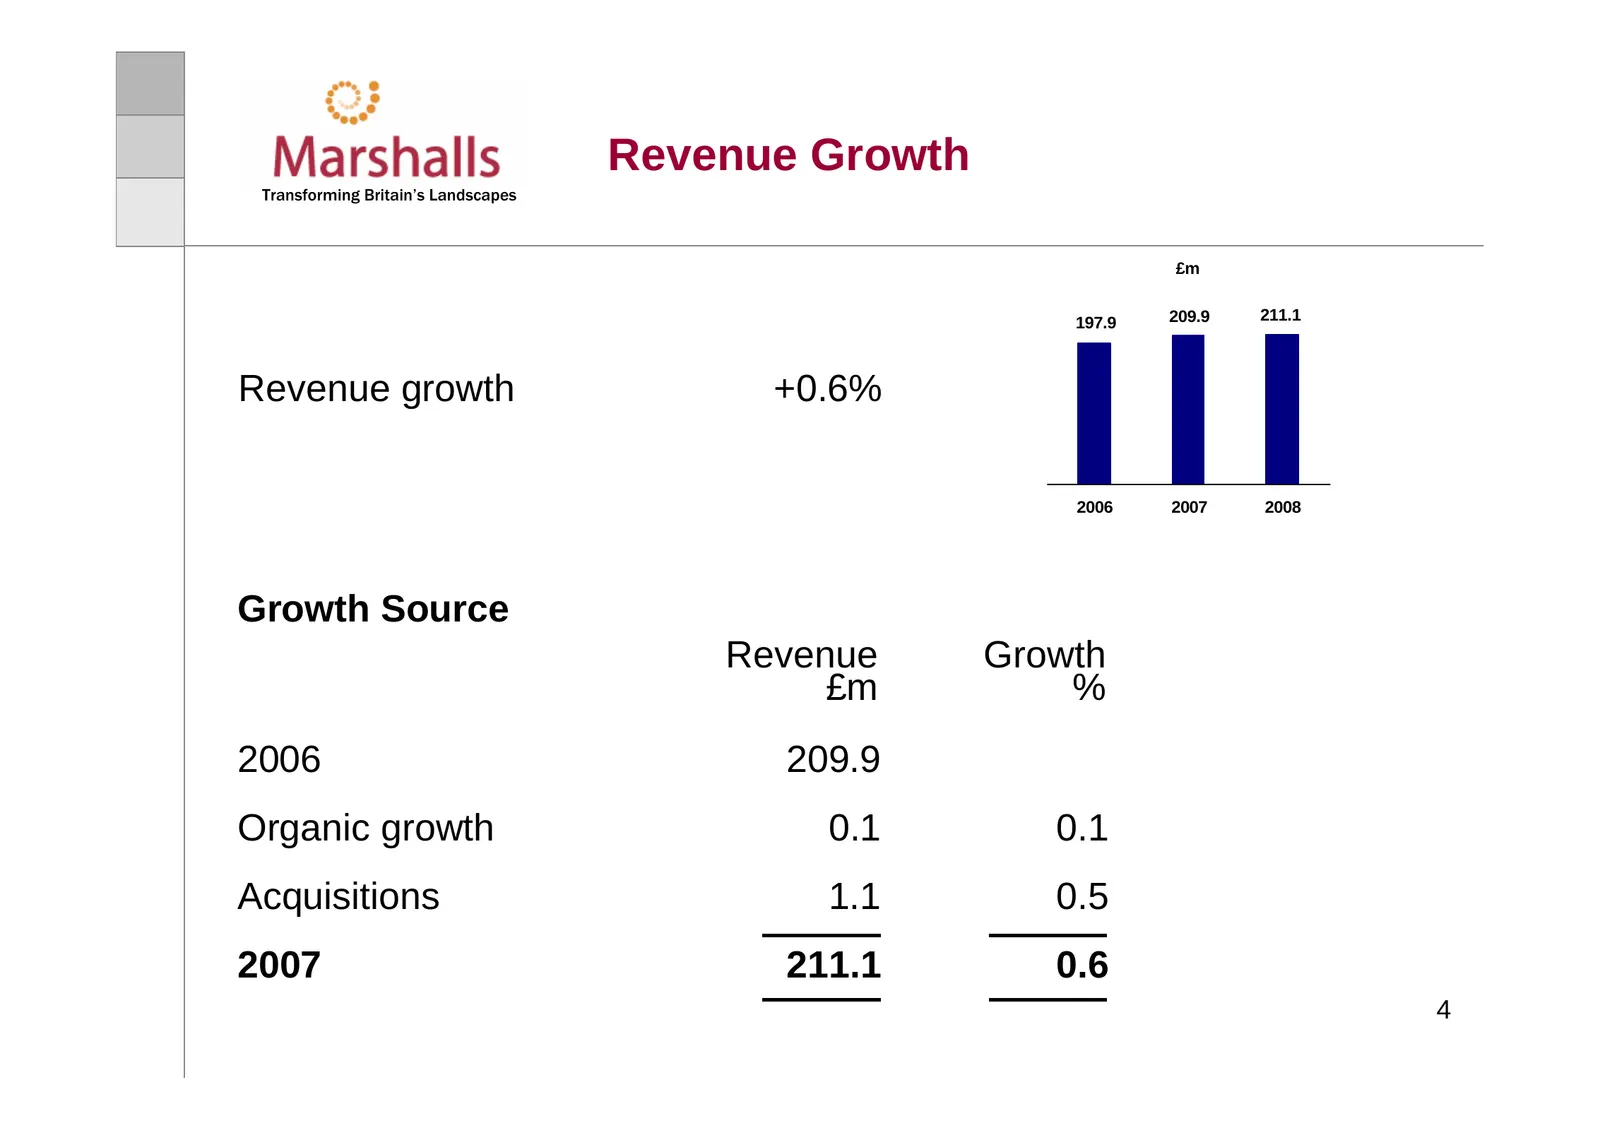
Slide 4: Revenue Growth
Revenue Growth Transforming Britain’s Landscapes £m 197.9 209.9 211.1 Revenue growth +0.6% 2006 2007 2008 Growth Source Revenue Growth £m % 2006 209.9 Organic growth 0.1 0.1 Acquisitions 1.1 0.5 2007 211.1 0.6 4
Slide 5: Revenue Analysis
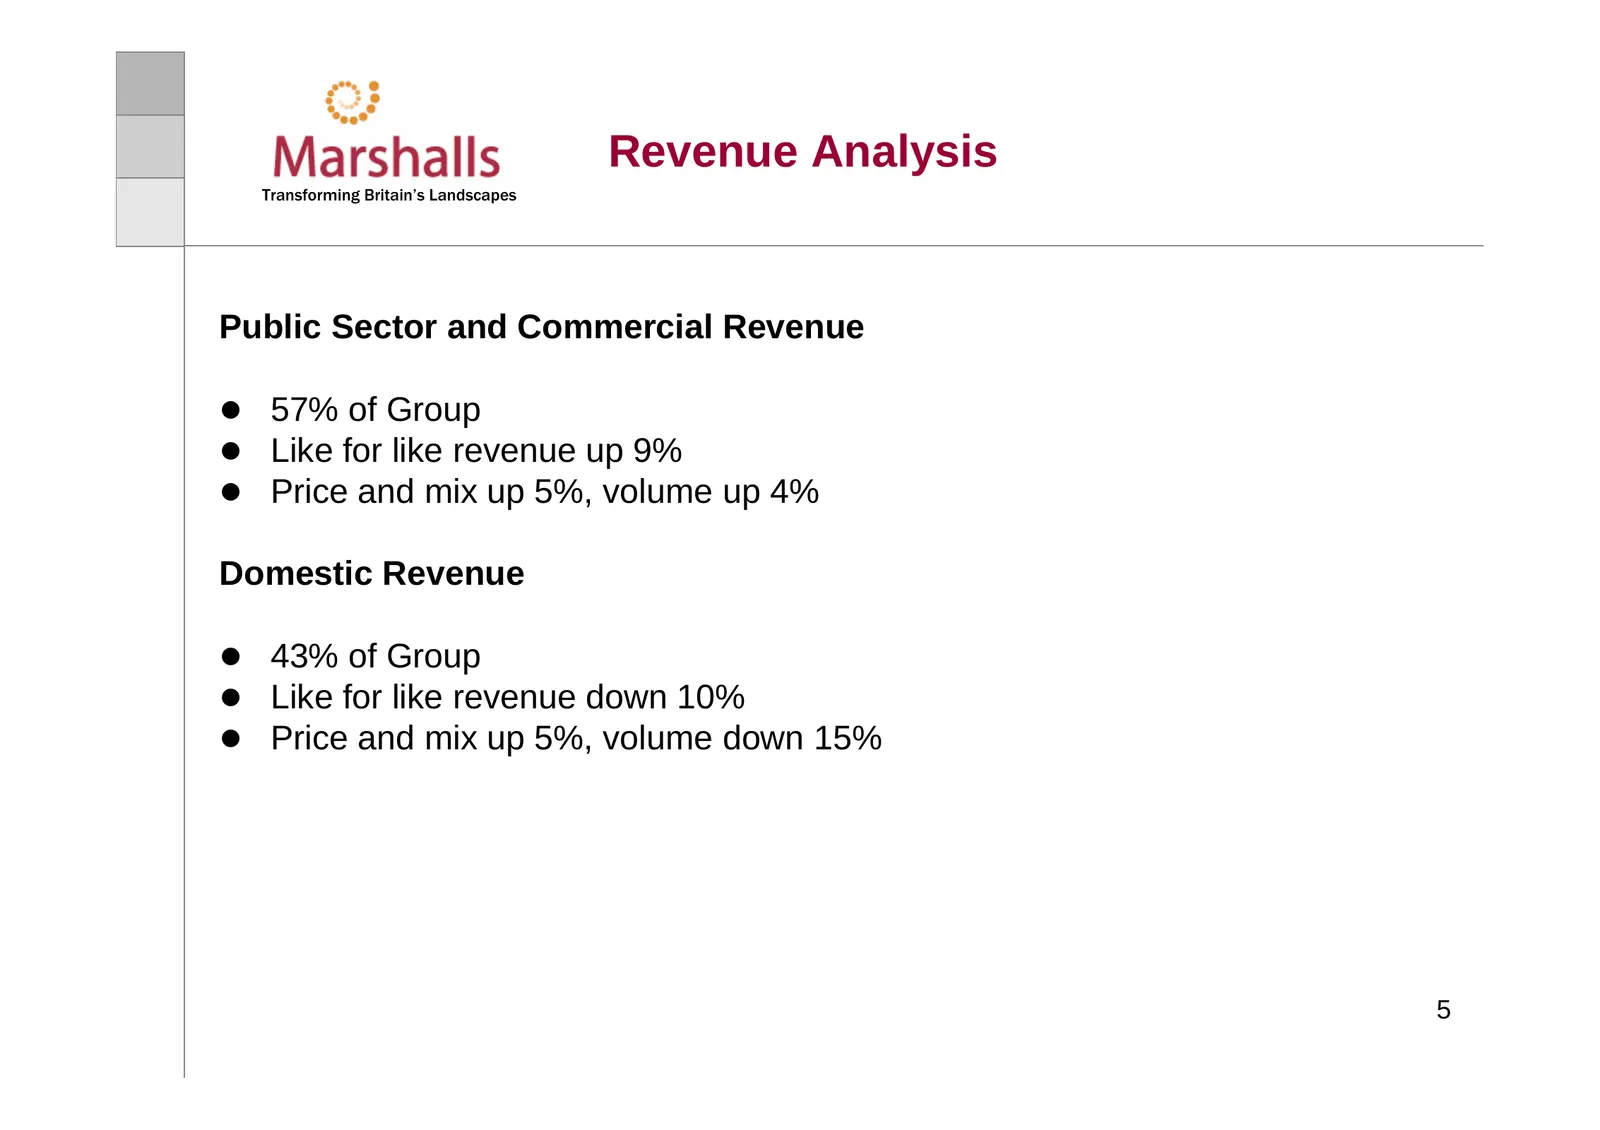
Revenue Analysis Transforming Britain’s Landscapes Public Sector and Commercial Revenue z 57% of Group z Like for like revenue up 9% z Price and mix up 5%, volume up 4% Domestic Revenue z 43% of Group z Like for like revenue down 10% z Price and mix up 5%, volume down 15% 5
Slide 6: Operating Profit
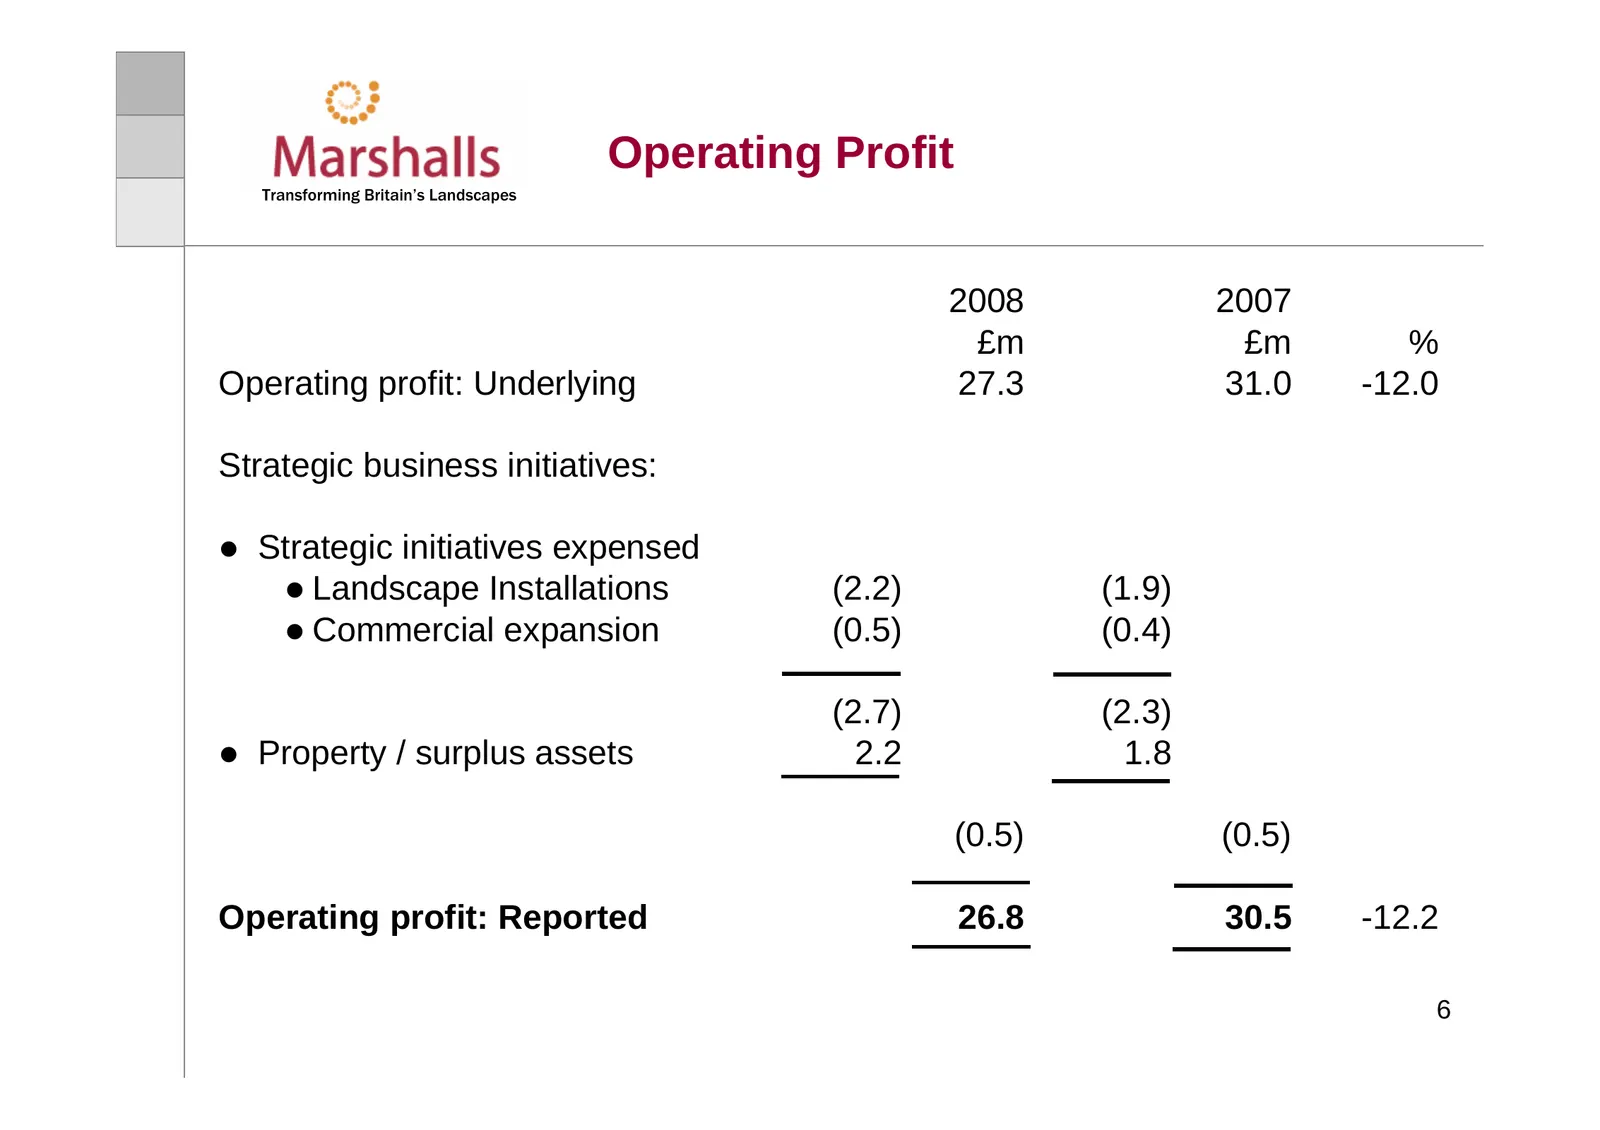
Operating Profit Transforming Britain’s Landscapes 2008 2007 £m £m % Operating profit: Underlying 27.3 31.0 -12.0 Strategic business initiatives: z Strategic initiatives expensed z Landscape Installations (2.2) (1.9) z Commercial expansion (0.5) (0.4) (2.7) (2.3) z Property / surplus assets 2.2 1.8
Slide 7: Underlying Margin Reconciliation
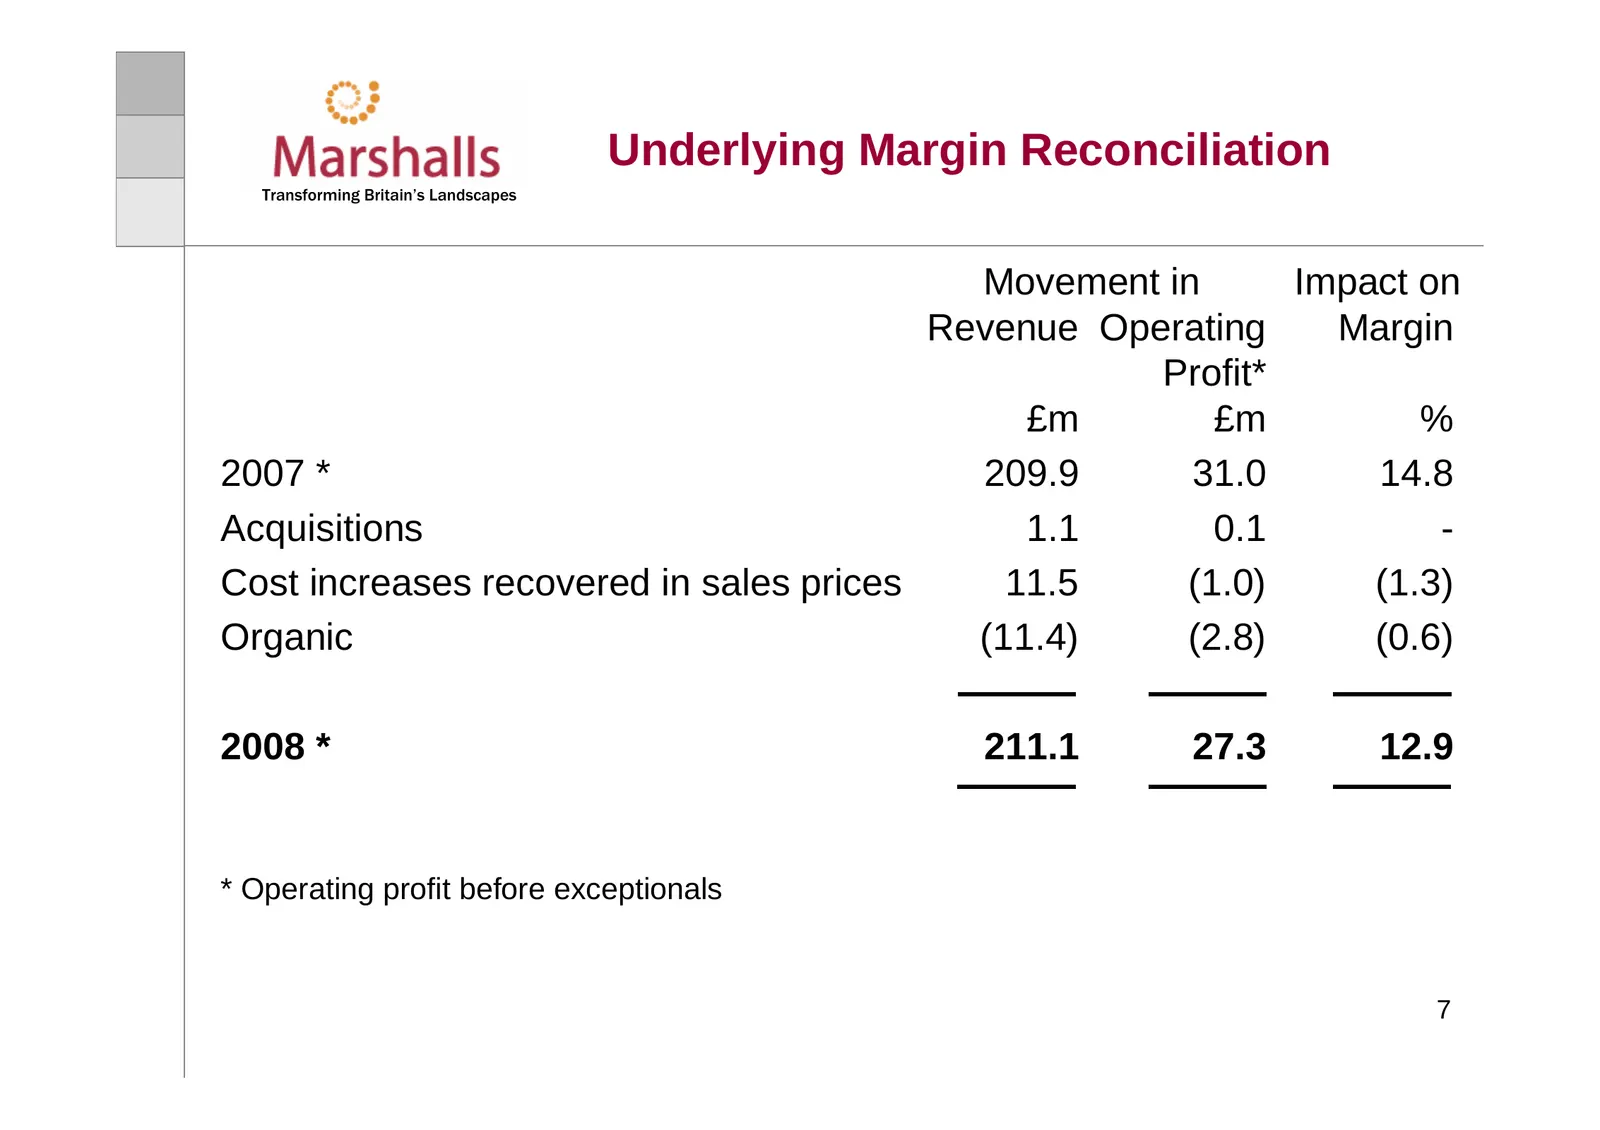
Underlying Margin Reconciliation Transforming Britain’s Landscapes Movement in Impact on Revenue Operating Margin Profit* £m £m % 2007 * 209.9 31.0 14.8 Acquisitions 1.1 0.1 - Cost increases recovered in sales prices 11.5 (1.0) (1.3) Organic (11.4) (2.8) (0.6) 2008 * 211.1 27.3 12.9 * Operating prof
Slide 8: Additional Information and Ratios
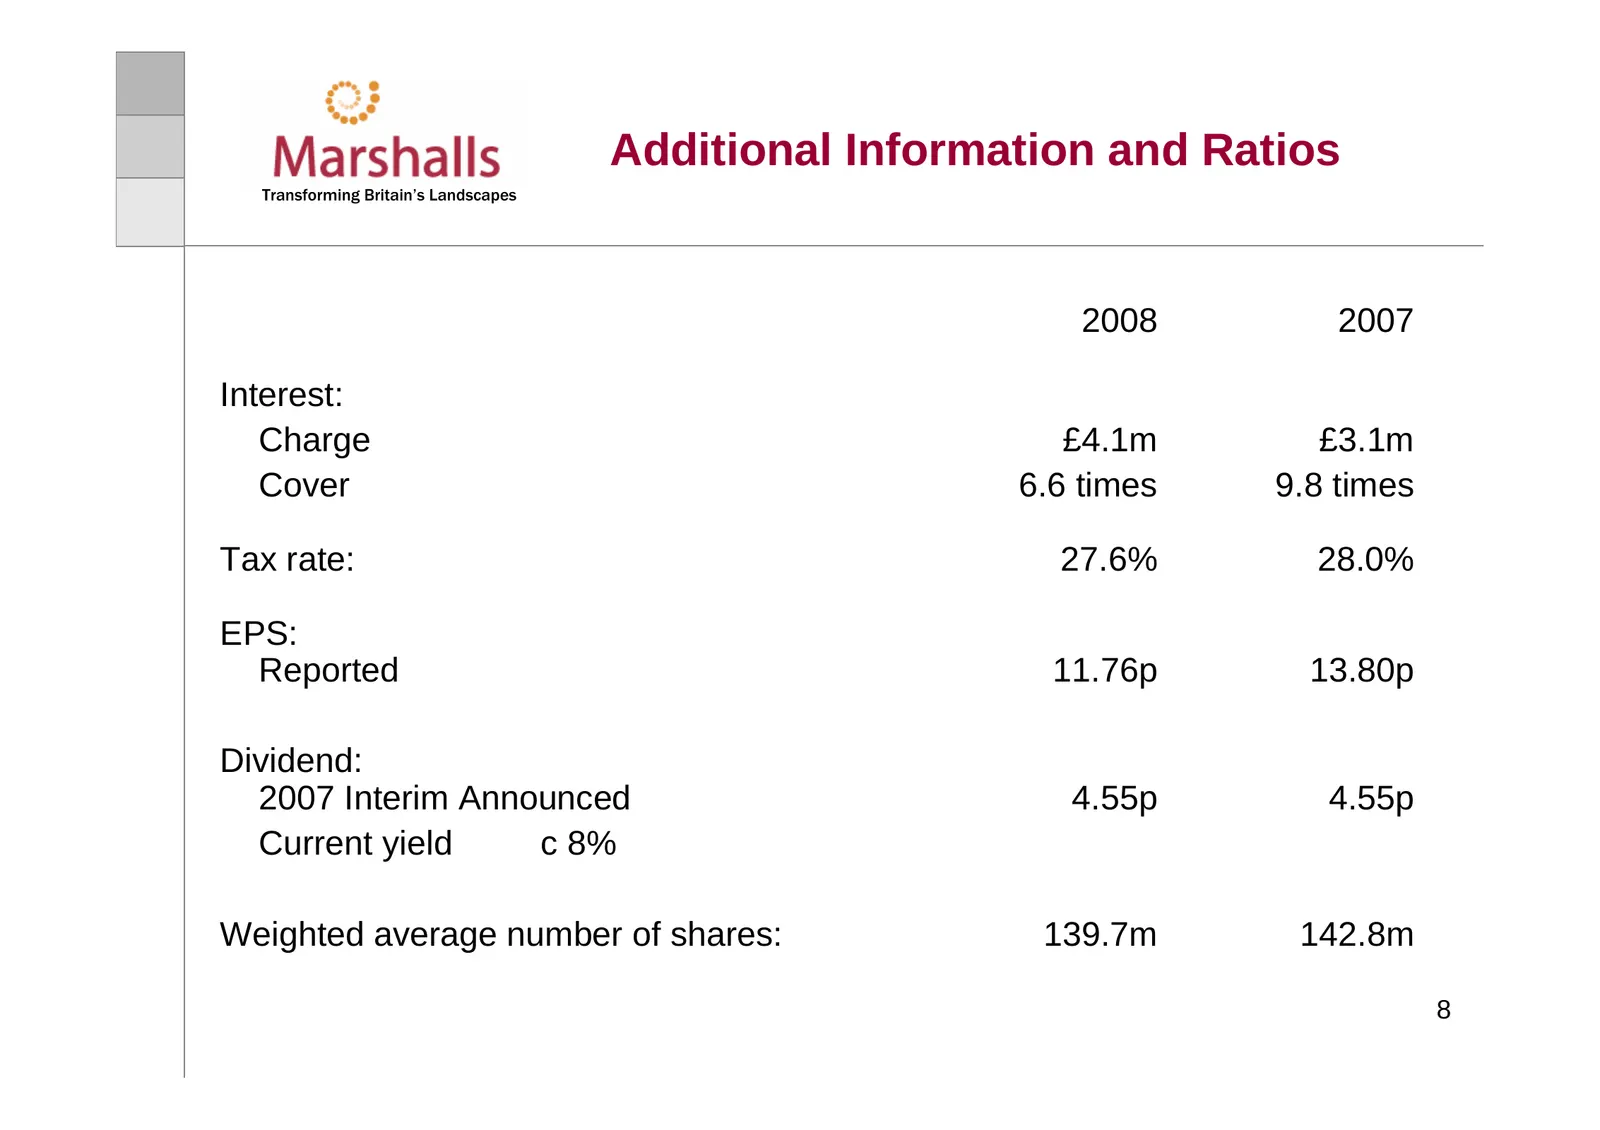
Additional Information and Ratios Transforming Britain’s Landscapes 2008 2007 Interest: Charge £4.1m £3.1m Cover 6.6 times 9.8 times Tax rate: 27.6% 28.0% EPS: Reported 11.76p 13.80p Dividend: 2007 Interim Announced 4.55p 4.55p Current yield c 8% Weighted average number of shares: 139.7m 142.8m 8
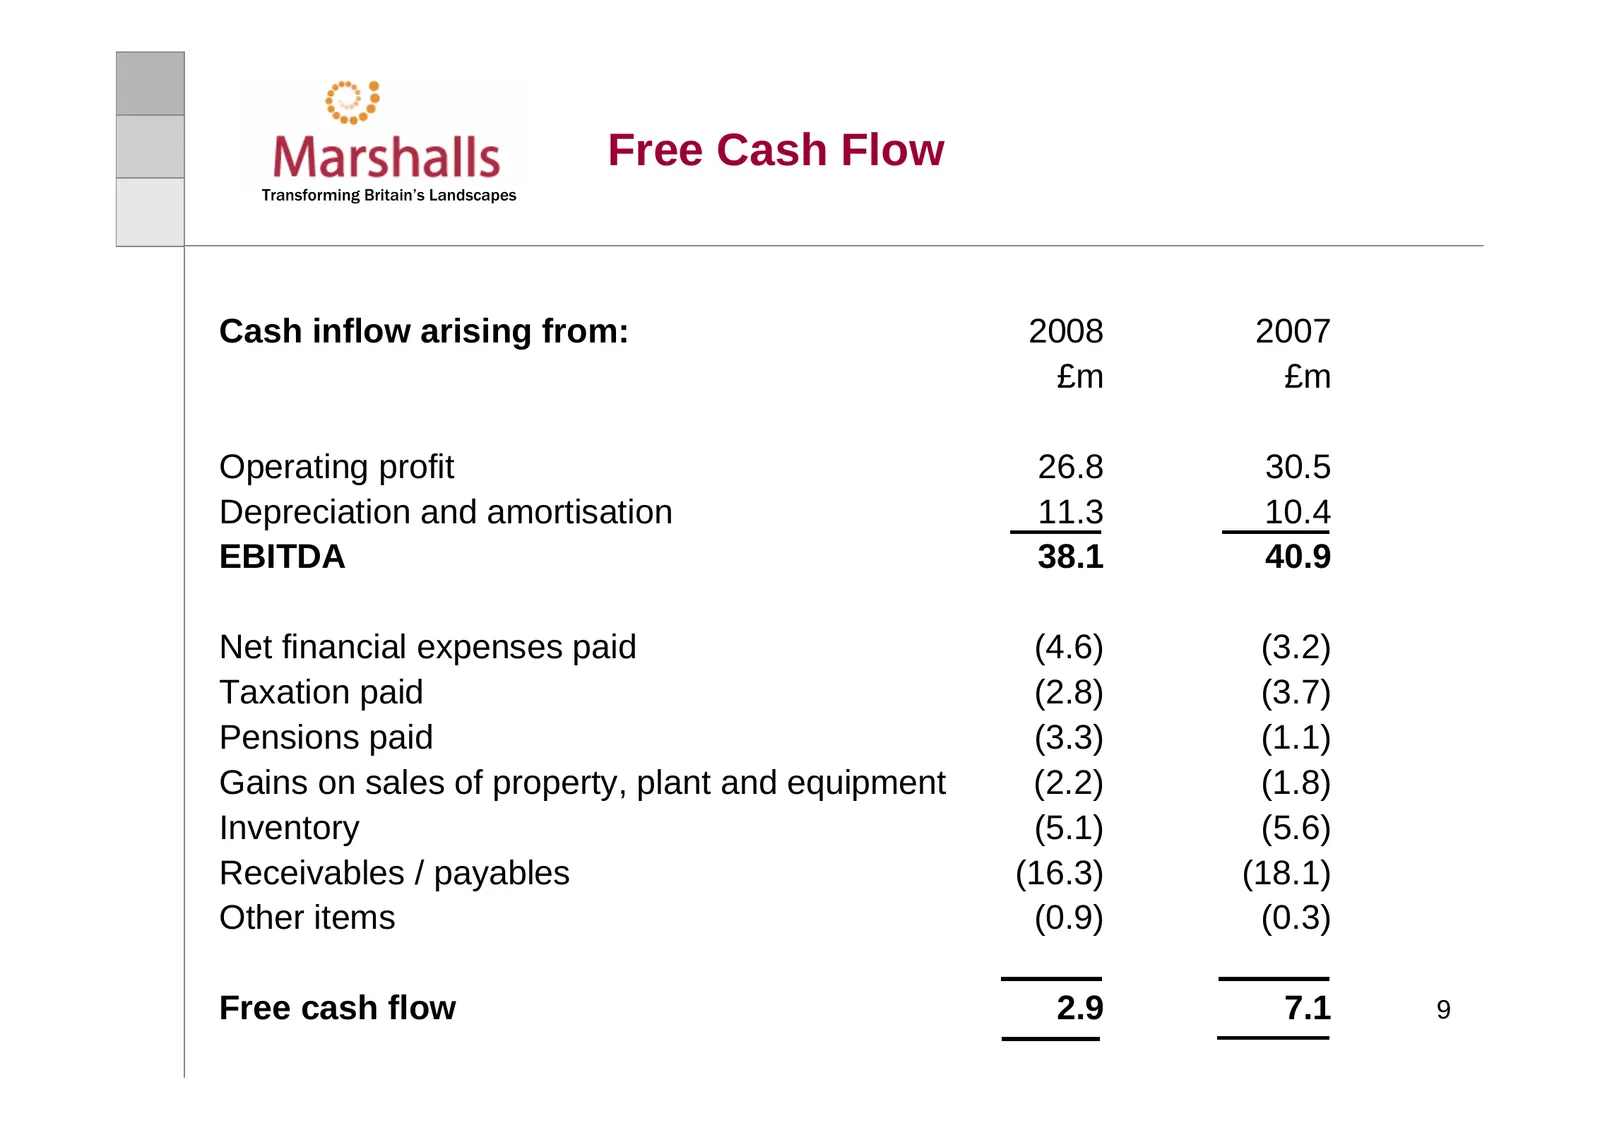
Slide 9: Free Cash Flow
Free Cash Flow Transforming Britain’s Landscapes Cash inflow arising from: 2008 2007 £m £m Operating profit 26.8 30.5 Depreciation and amortisation 11.3 10.4 EBITDA 38.1 40.9 Net financial expenses paid (4.6) (3.2) Taxation paid (2.8) (3.7) Pensions paid (3.3) (1.1) Gains on sales of property, plant
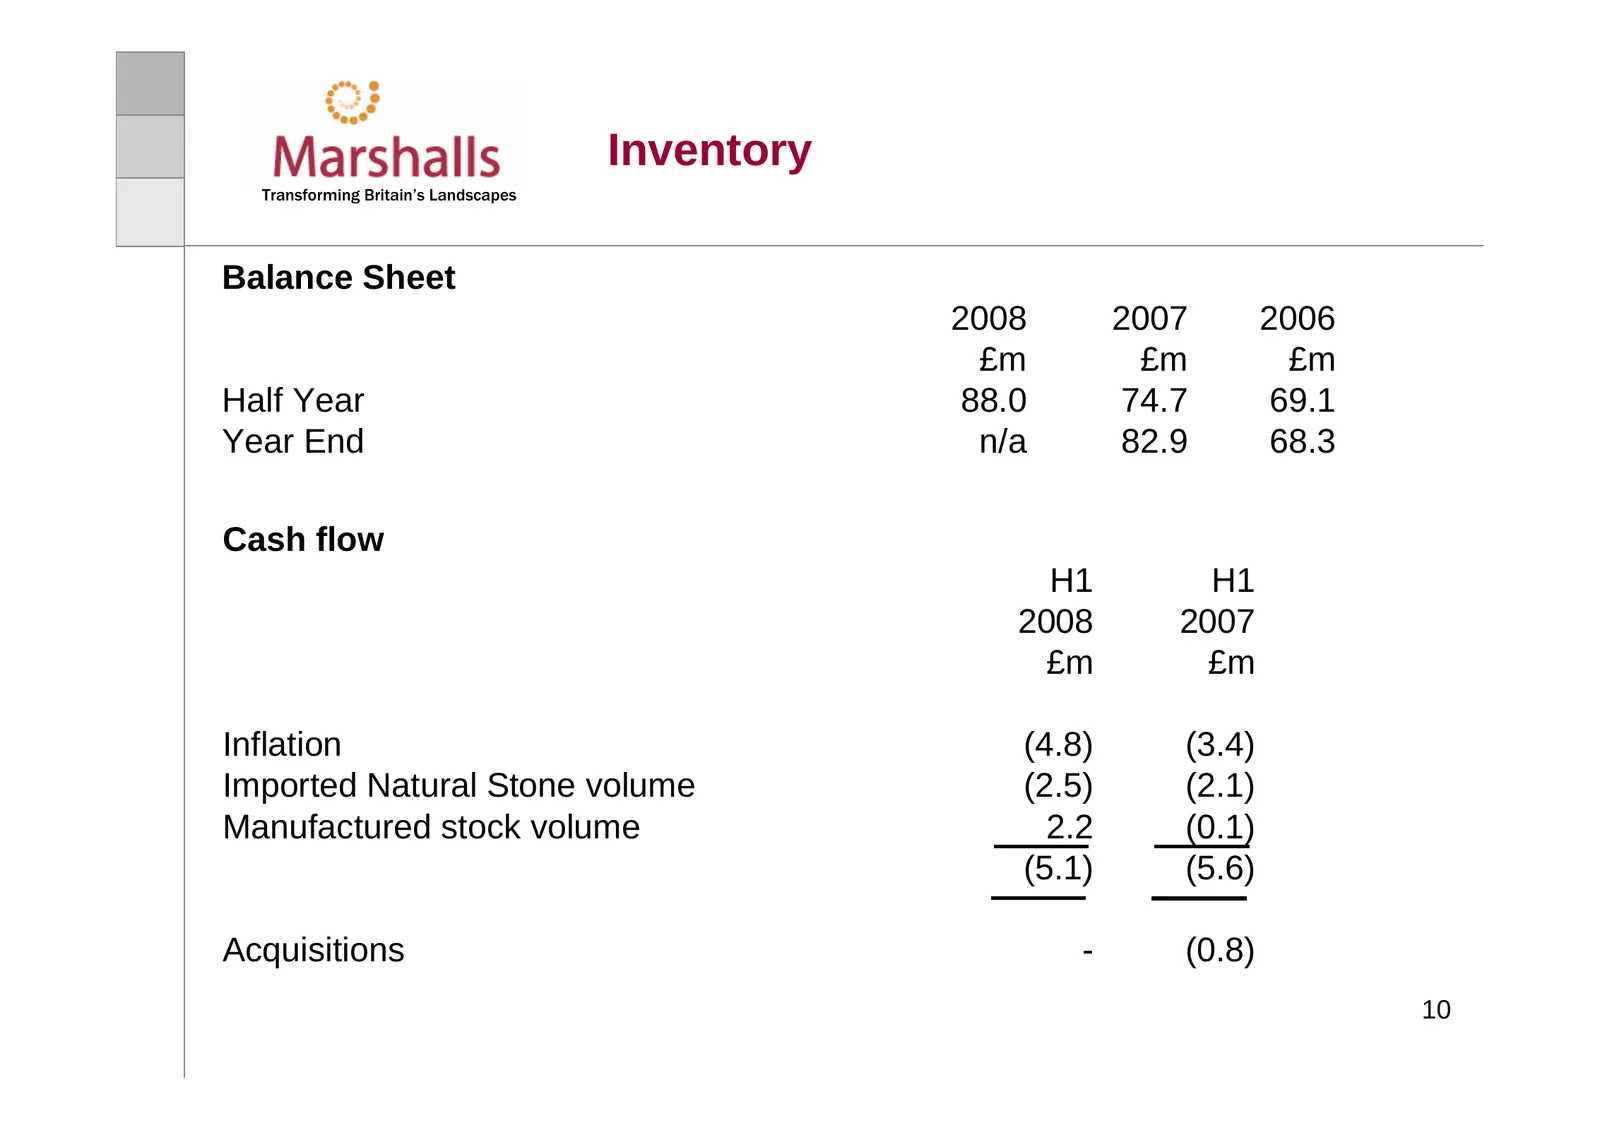
Slide 10: Inventory
Inventory Transforming Britain’s Landscapes Balance Sheet 2008 2007 2006 £m £m £m Half Year 88.0 74.7 69.1 Year End n/a 82.9 68.3 Cash flow H1 H1 2008 2007 £m £m Inflation (4.8) (3.4) Imported Natural Stone volume (2.5) (2.1) Manufactured stock volume 2.2 (0.1) (5.1) (5.6) Acquisitions - (0.8) 10
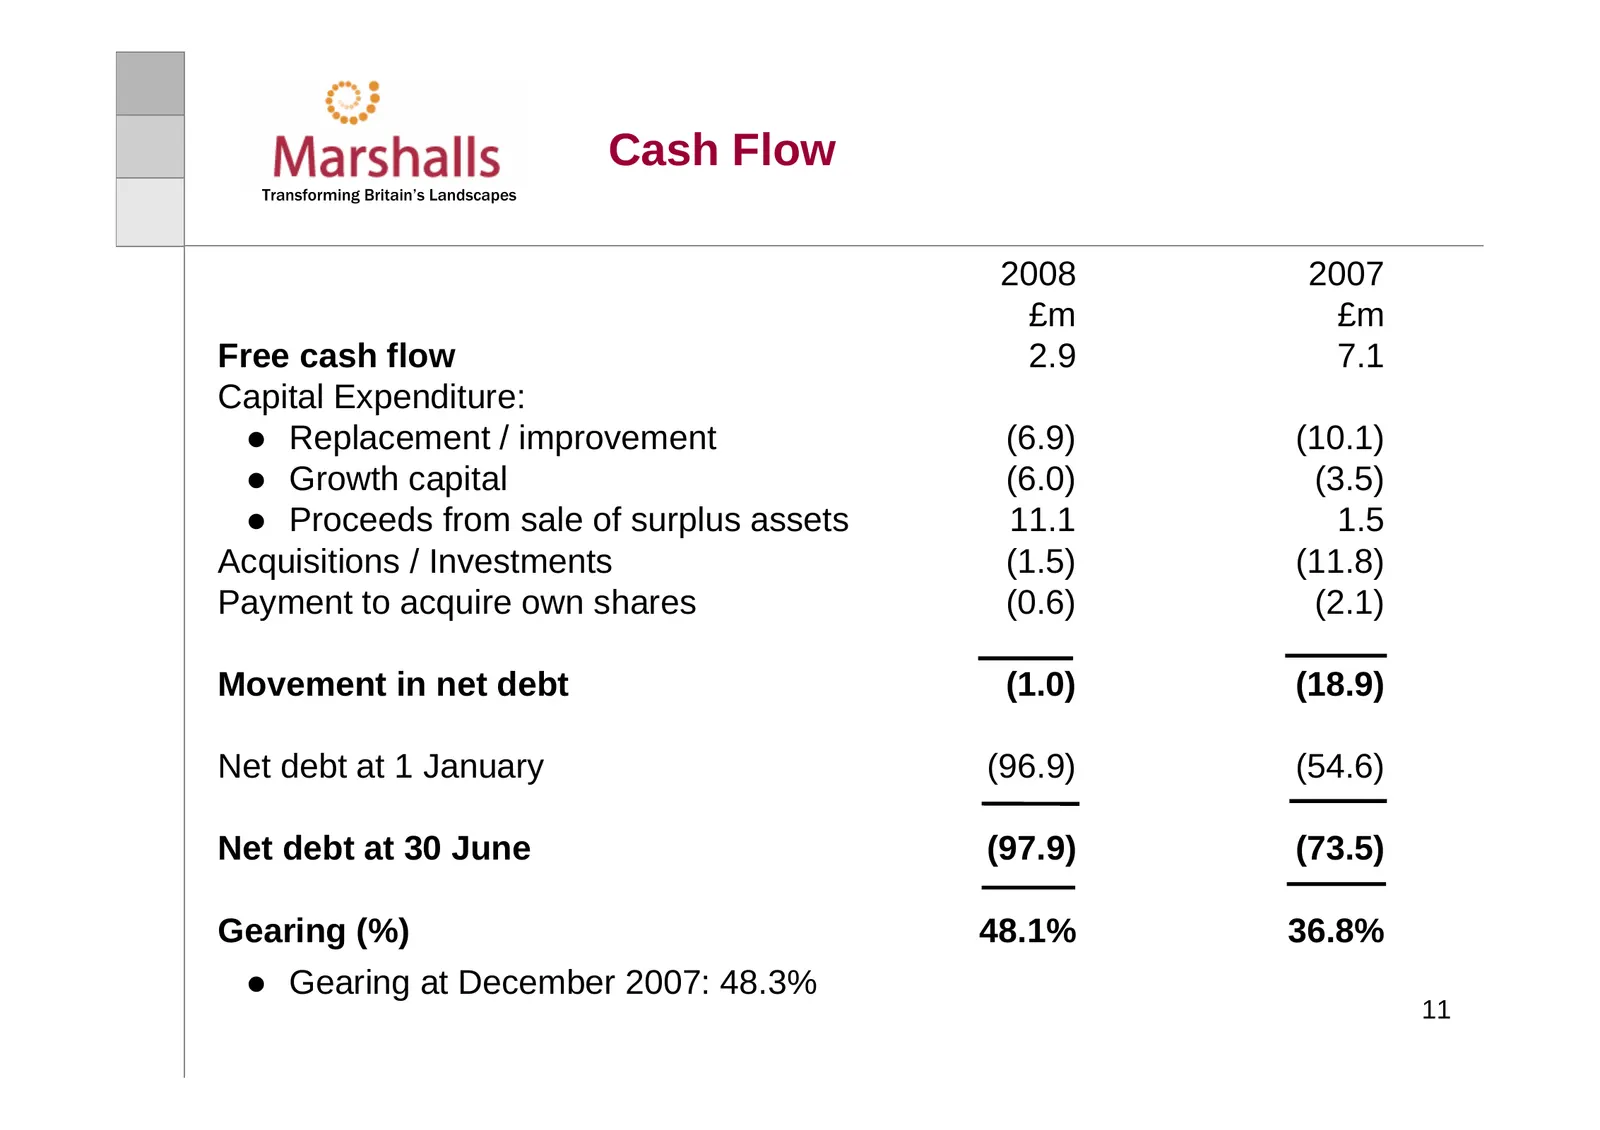
Slide 11: Cash Flow
Cash Flow Transforming Britain’s Landscapes 2008 2007 £m £m Free cash flow 2.9 7.1 Capital Expenditure: z Replacement / improvement (6.9) (10.1) z Growth capital (6.0) (3.5) z Proceeds from sale of surplus assets 11.1 1.5 Acquisitions / Investments (1.5) (11.8) Payment to acquire own shares (0.6) (2
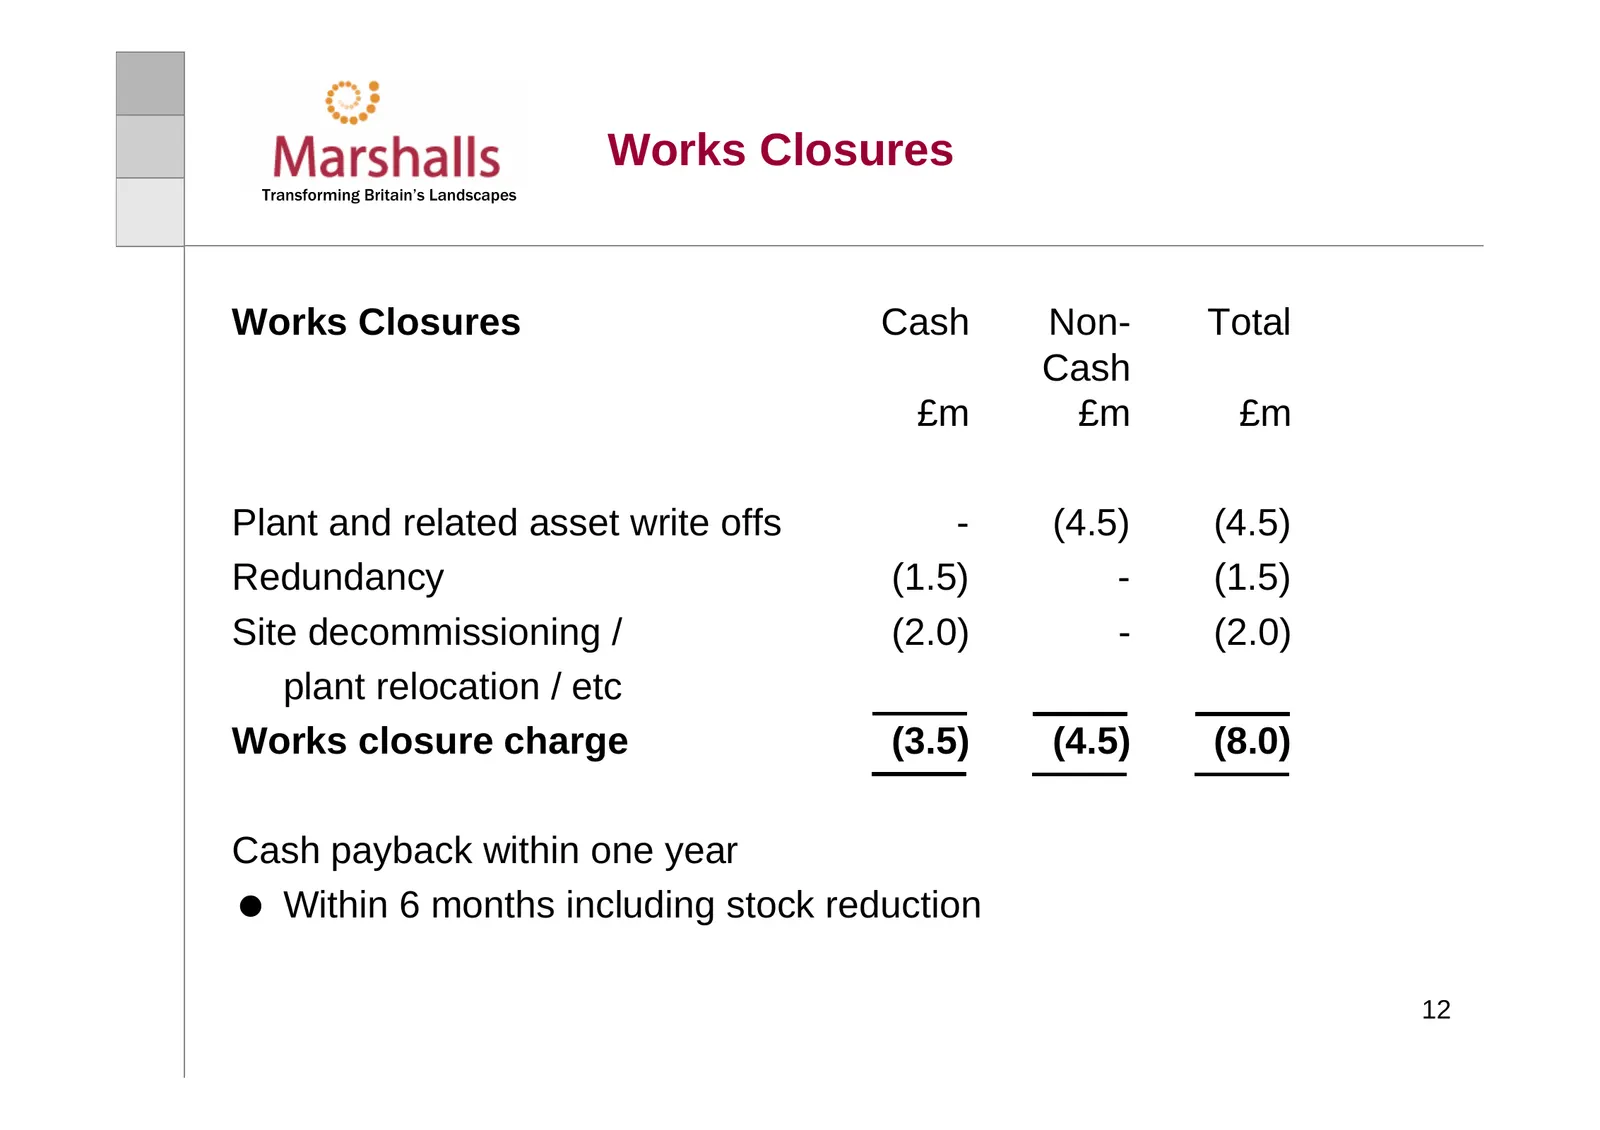
Slide 12: Works Closures
Works Closures Transforming Britain’s Landscapes Works Closures Cash Non- Total Cash £m £m £m Plant and related asset write offs - (4.5) (4.5) Redundancy (1.5) - (1.5) Site decommissioning / (2.0) - (2.0) plant relocation / etc Works closure charge (3.5) (4.5) (8.0) Cash payback within one year With
Slide 13: Market Conditions
Market Conditions Transforming Britain’s Landscapes Public Sector & Commercial c 60% of Group sales 9% sales growth 12 month visibility – positive outlook Domestic market c 40% of Group sales New build – very weak DIY – poor Easter Installed sales robust, order books 8.2 weeks Increasingly uncertain
Slide 14: Strategy
Strategy Transforming Britain’s Landscapes Strategy remains consistent, implementation adapted for the change in market conditions and outlook z Further development of the integrated product offer for the Public Sector and Commercial market z Having established a unique distribution and manufacturin
Slide 15: Short Term Action Plan
Short Term Action Plan Transforming Britain’s Landscapes Focus sales effort on market sectors and product areas where activity is robust Accelerate cost reduction Conserve cash and retain financial flexibility Reduced capital expenditure Accelerate reduction in volume of inventory Continue with inno
Slide 16: Public Sector & Commercial ABI Monthly Change in Contract Awarded Values
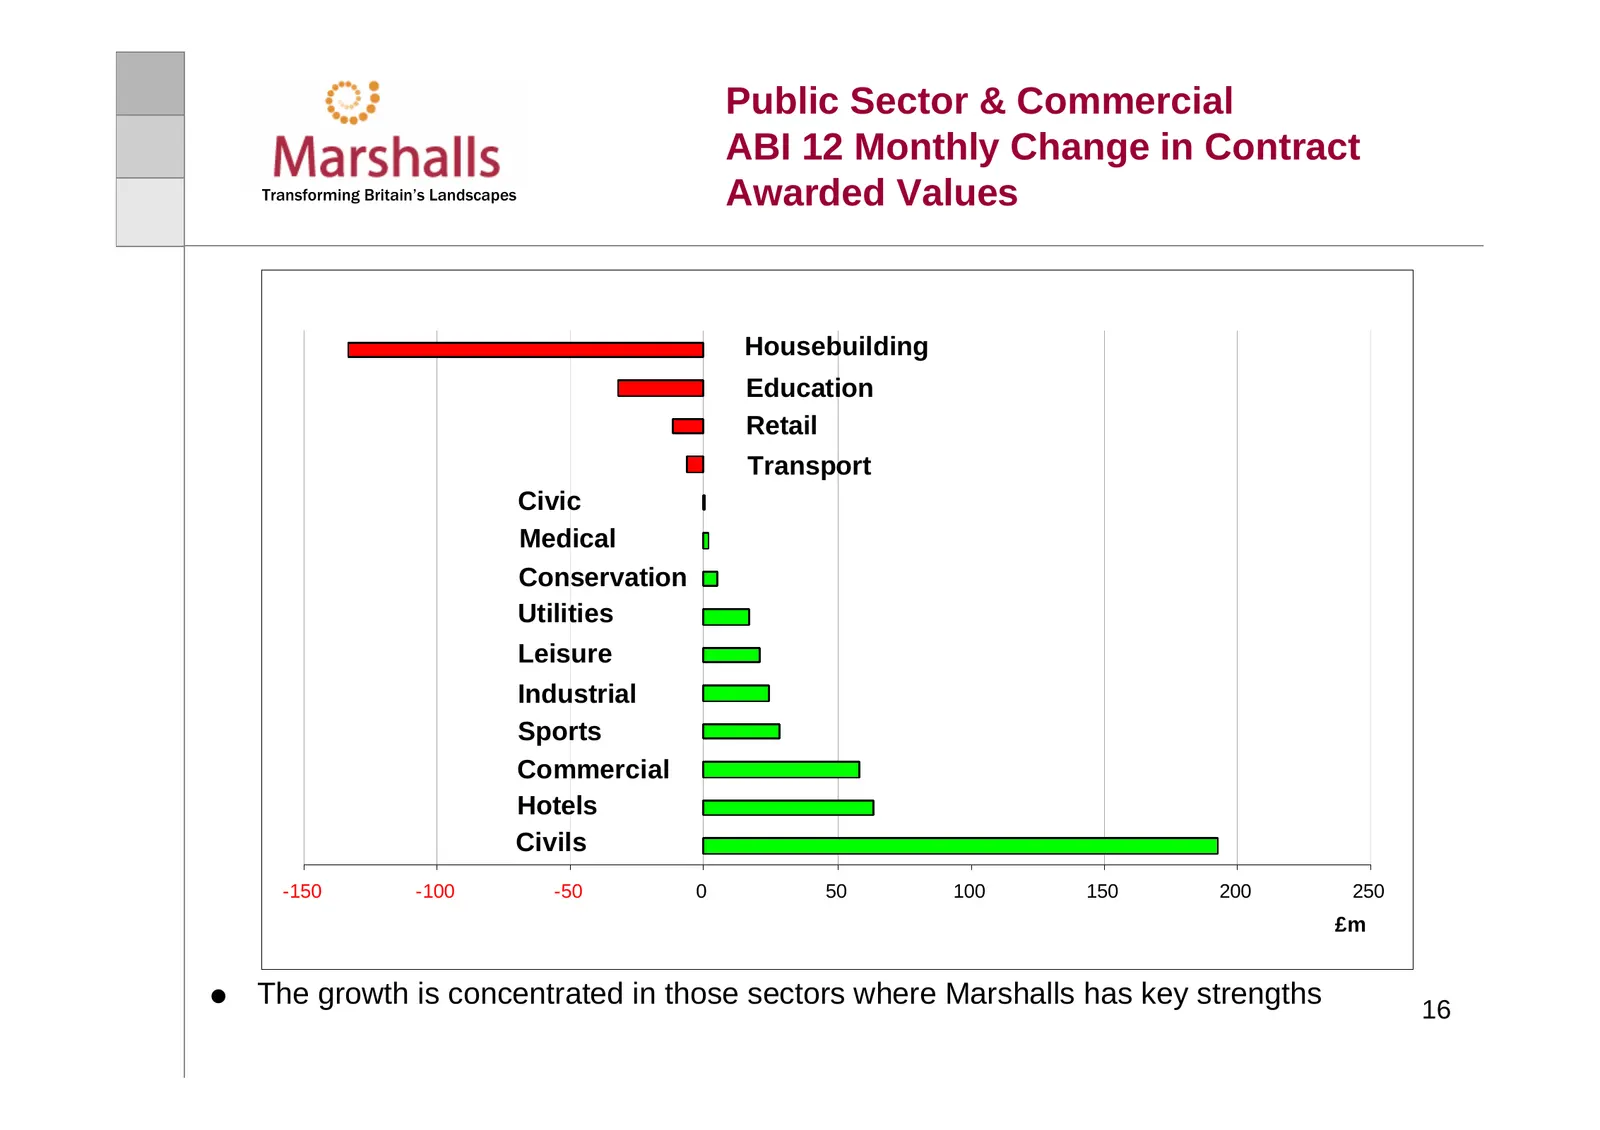
Public Sector & Commercial ABI 12 Monthly Change in Contract Transforming Britain’s Landscapes Awarded Values Housebuilding Education Retail Transport Civic Medical Conservation Utilities Leisure Industrial Sports Commercial Hotels Civils -150 -100 -50 0 50 100 150 200 250 £m The growth is concentra
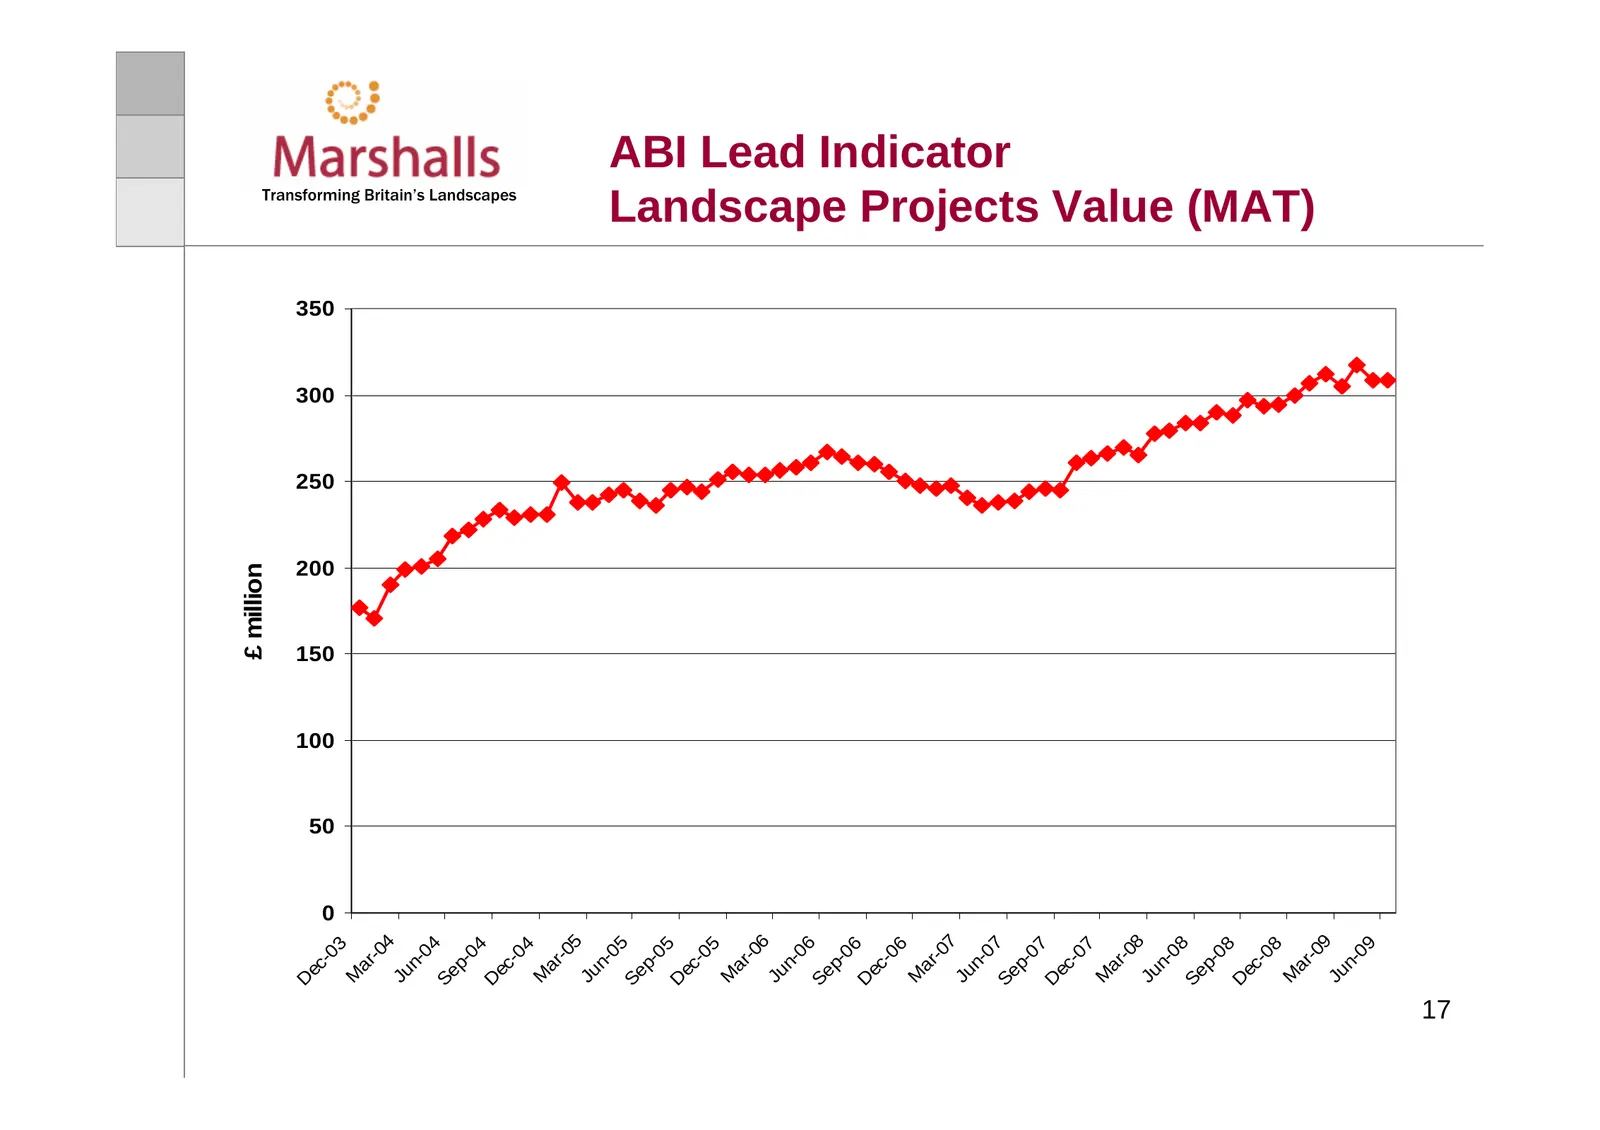
Slide 17: ABI Lead Indicator and Landscape Projects Value
£ million D ec 0 50 100 150 200 250 300 350 -0 3 M ar -0 4 Ju n- 04 Se p- 04 D ec Transforming Britain’s Landscapes -0 4 M ar -0 5 Ju n- 05 Se p- 05 D ec -0 5 M ar -0 6 Ju n- 06 Se p- 06 D ec -0 6 M ar -0 7 Ju n- 0 ABI Lead Indicator Se 7 p- 07 D ec -0 7 M ar -0 8 Ju n- 08 Se p- 08 D ec -0 8 M ar La
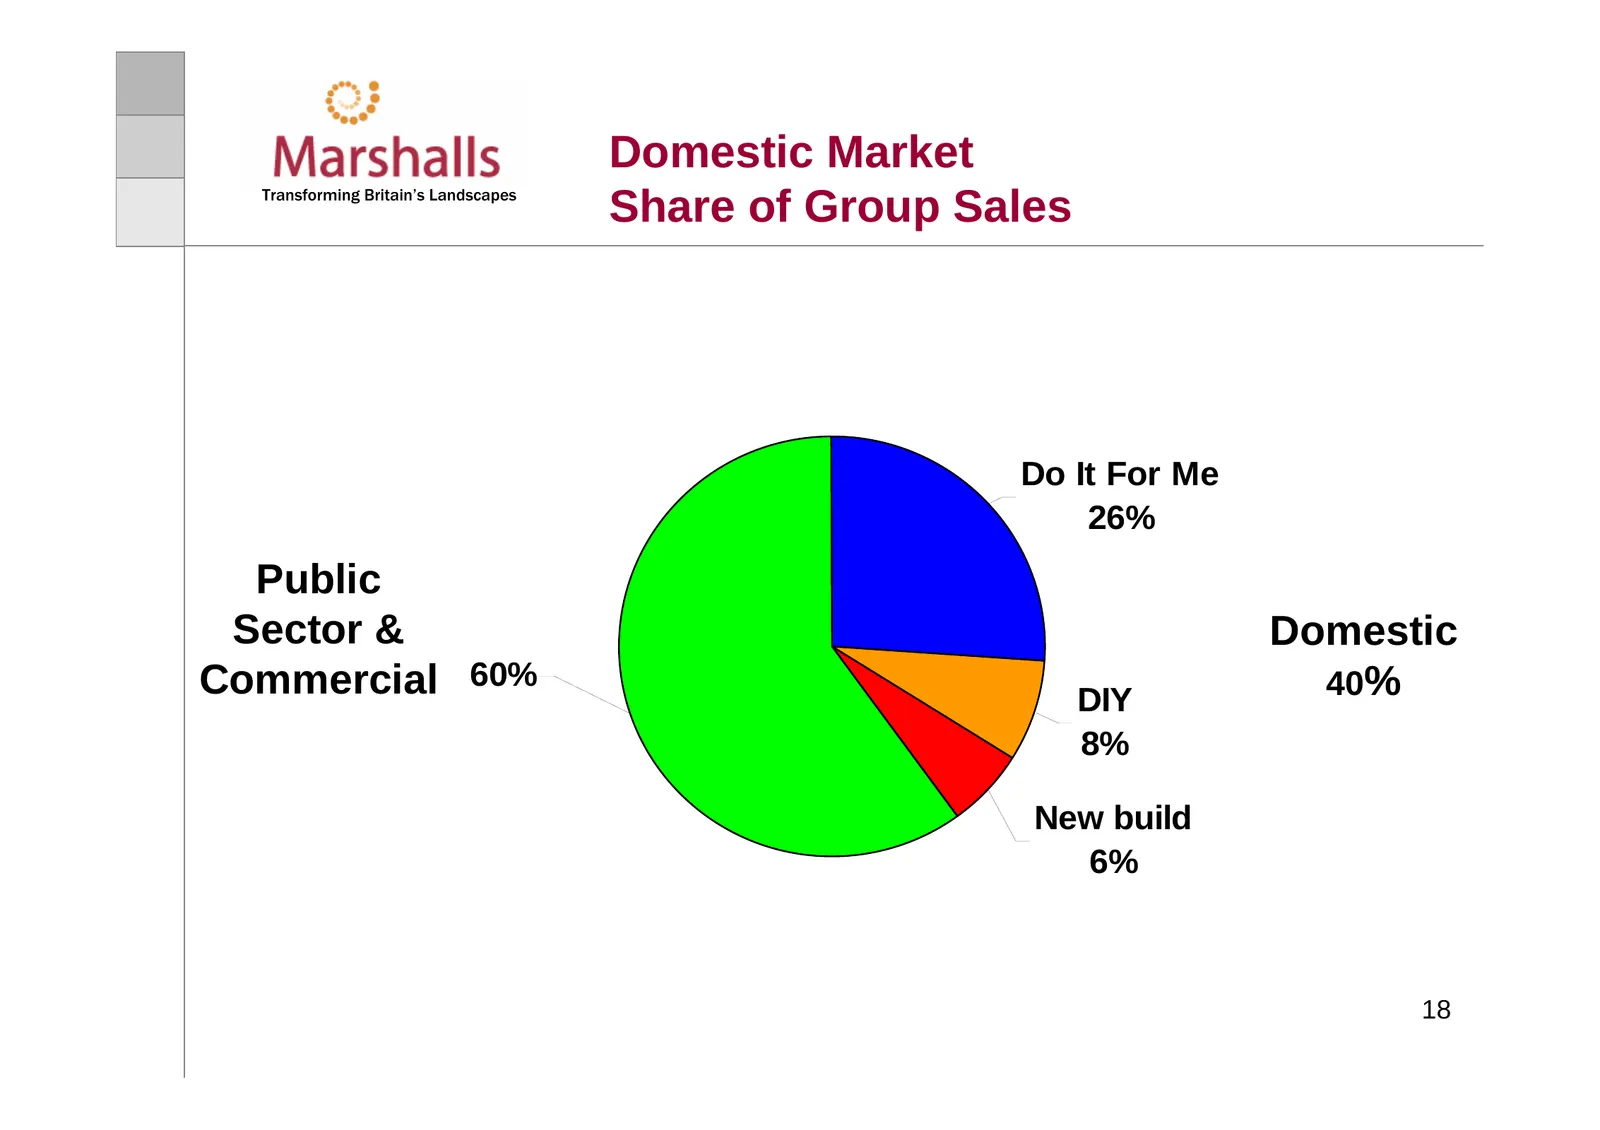
Slide 18: Domestic Market Share of Group Sales
Domestic Market Transforming Britain’s Landscapes Share of Group Sales Do It For Me 26% Public Sector & Domestic Commercial 60% DIY 40% 8% New build 6% 18
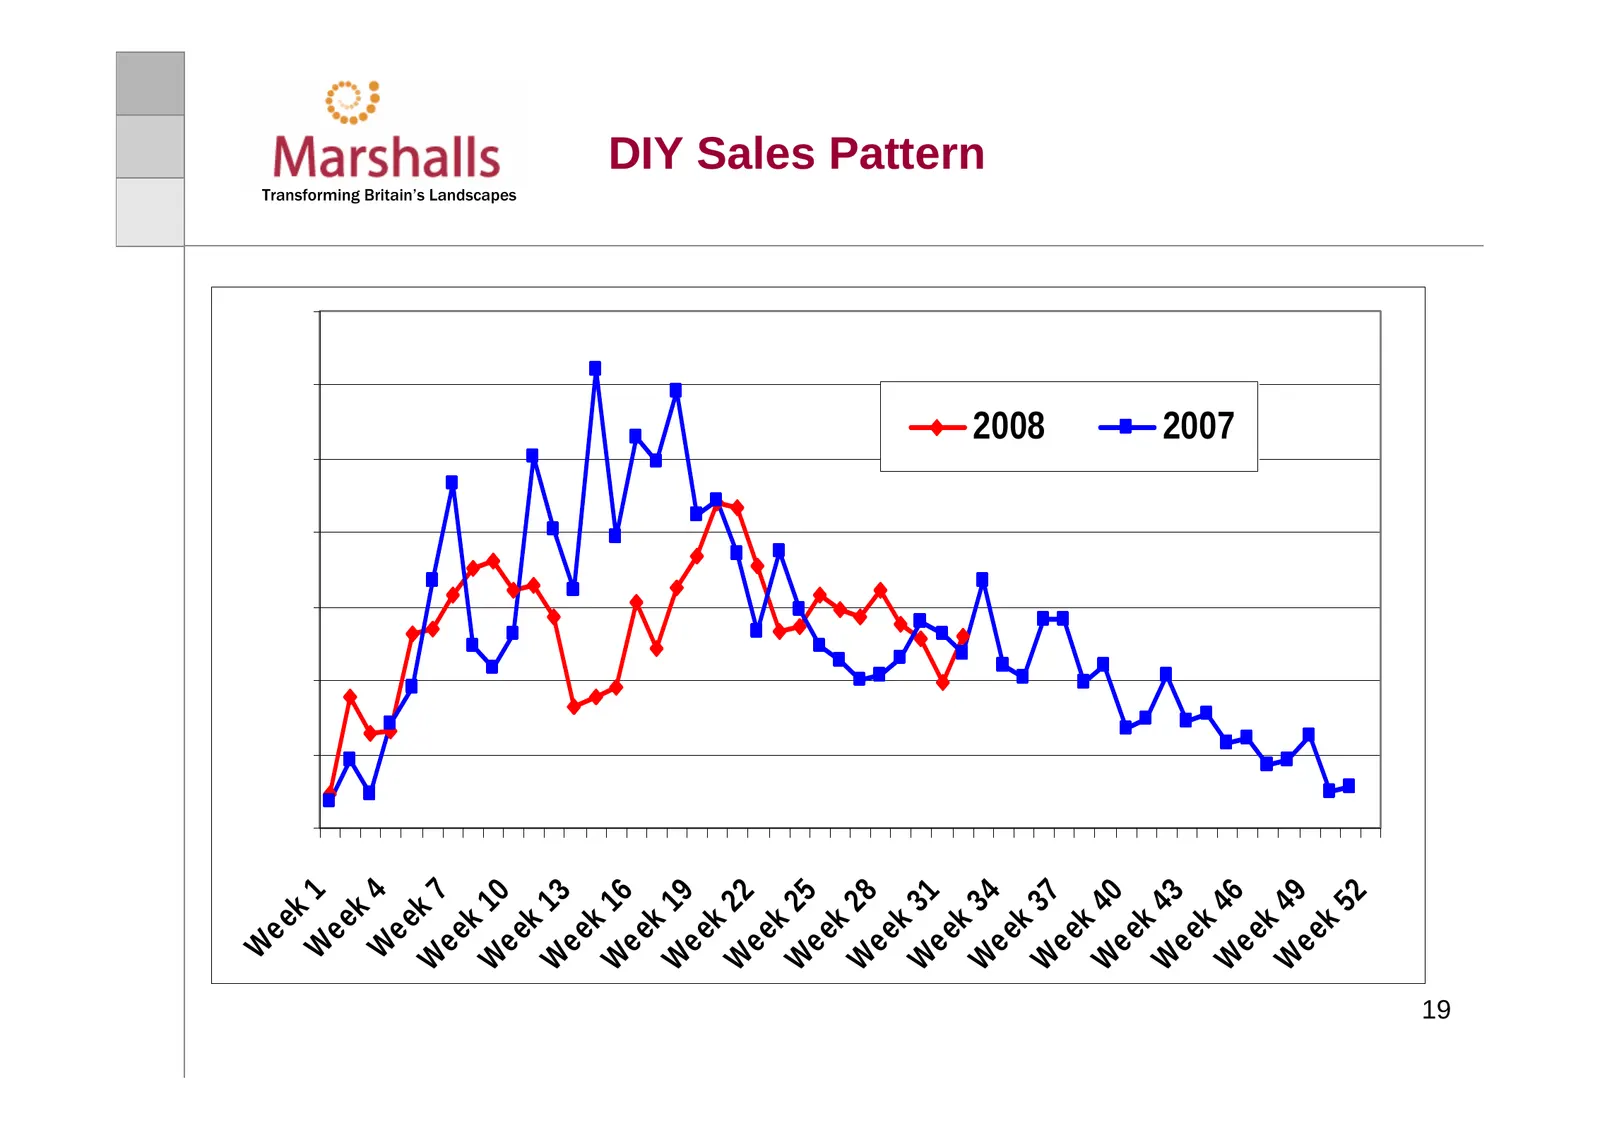
Slide 19: DIY Sales Pattern
W ee k W 1 ee k W 4 ee W k ee 7 k W 10 Transforming Britain’s Landscapes ee k W 13 ee k W 16 ee k W 19 ee k W 22 ee k W 25 ee k W 28 ee k W 31 ee k DIY Sales Pattern W 34 ee k 2008 W 37 ee k W 40 ee k W 43 ee k 2007 W 46 ee k W 49 ee k 52 19
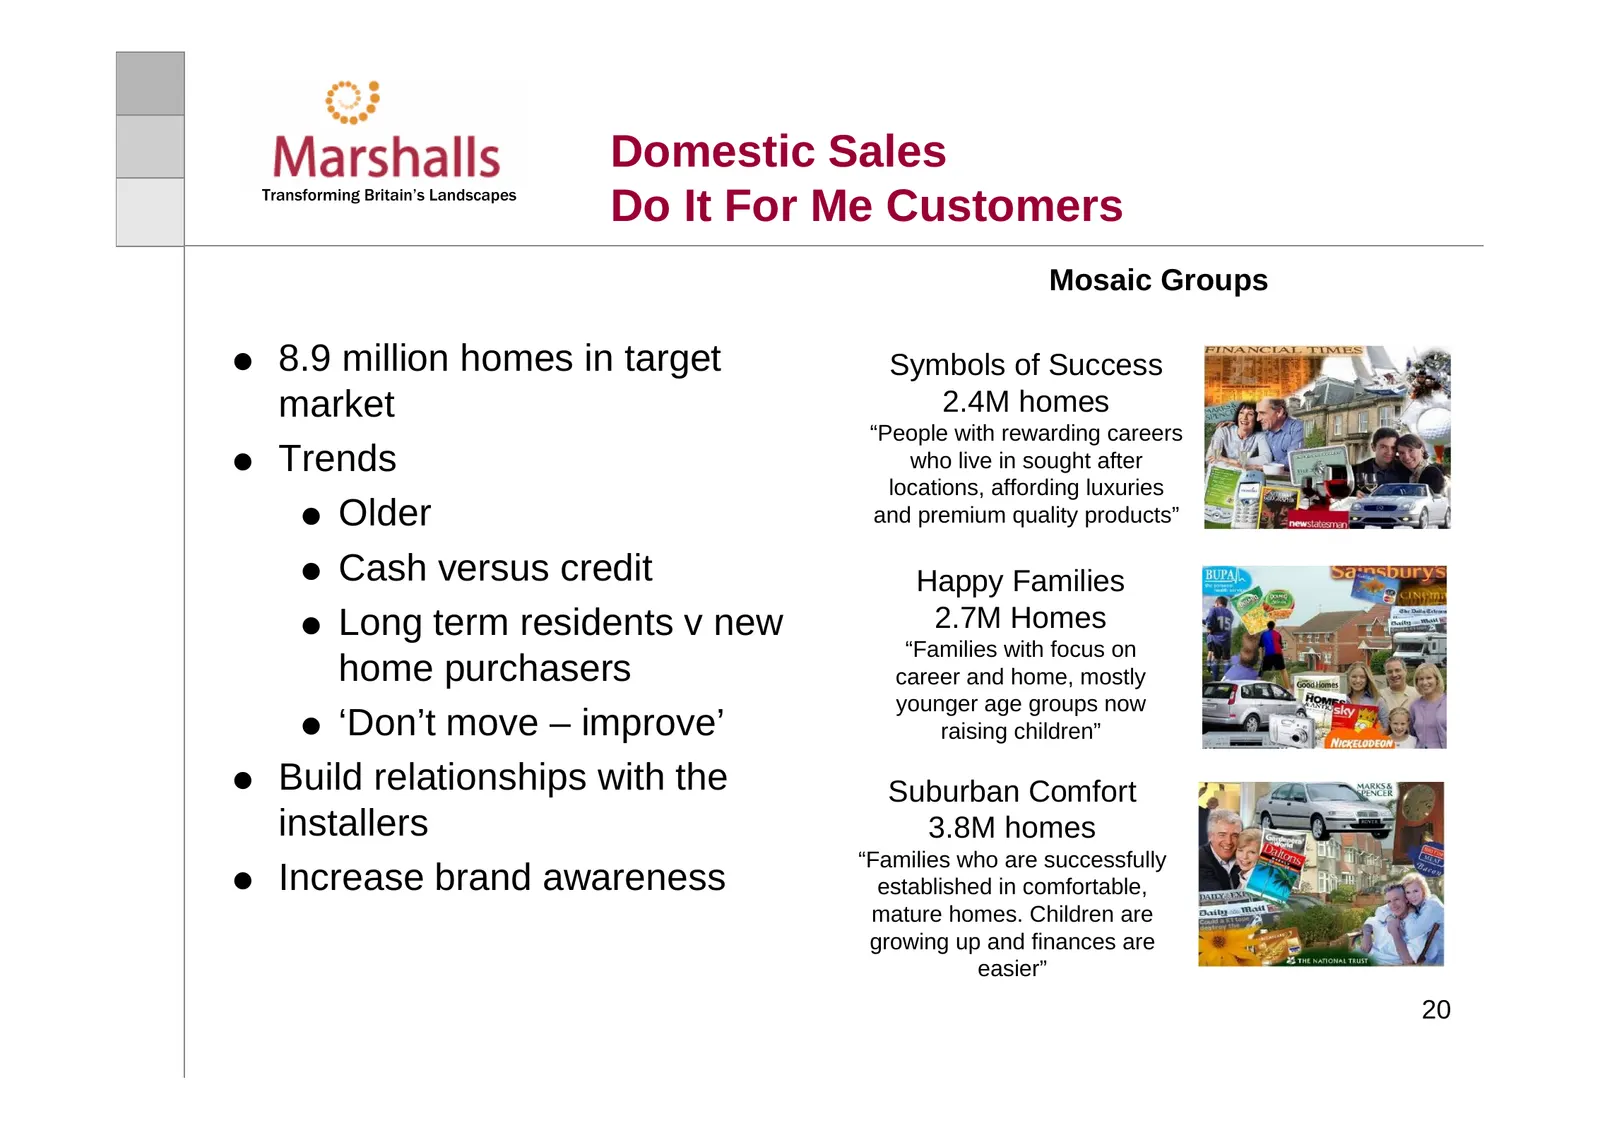
Slide 20: Domestic Sales Do It For Me Customers
Domestic Sales Transforming Britain’s Landscapes Do It For Me Customers Mosaic Groups 8.9 million homes in target Symbols of Success market 2.4M homes “People with rewarding careers Trends who live in sought after locations, affording luxuries Older and premium quality products” Cash versus credit H
Slide 21: Domestic Market Sales Focus
Domestic Market Transforming Britain’s Landscapes Sales Focus Display Centres Ninth centre opened Smaller footprint Covered by garden centre staff Supply agreements extended. All members of supply chain aligned and focussed on the customer. Continuing focus on leading the industry in customer servic
Slide 22: Cost reduction and cash management
Cost reduction and cash management Transforming Britain’s Landscapes Works Closure Accelerate cost reduction plans Cease manufacturing at two sites Reduce fixed cost base Reduce stock volume and release cash Realise productivity improvement from recent investment Sites available for resale Consolida
Slide 23: Inventory Volumes ('000 Tonnes)
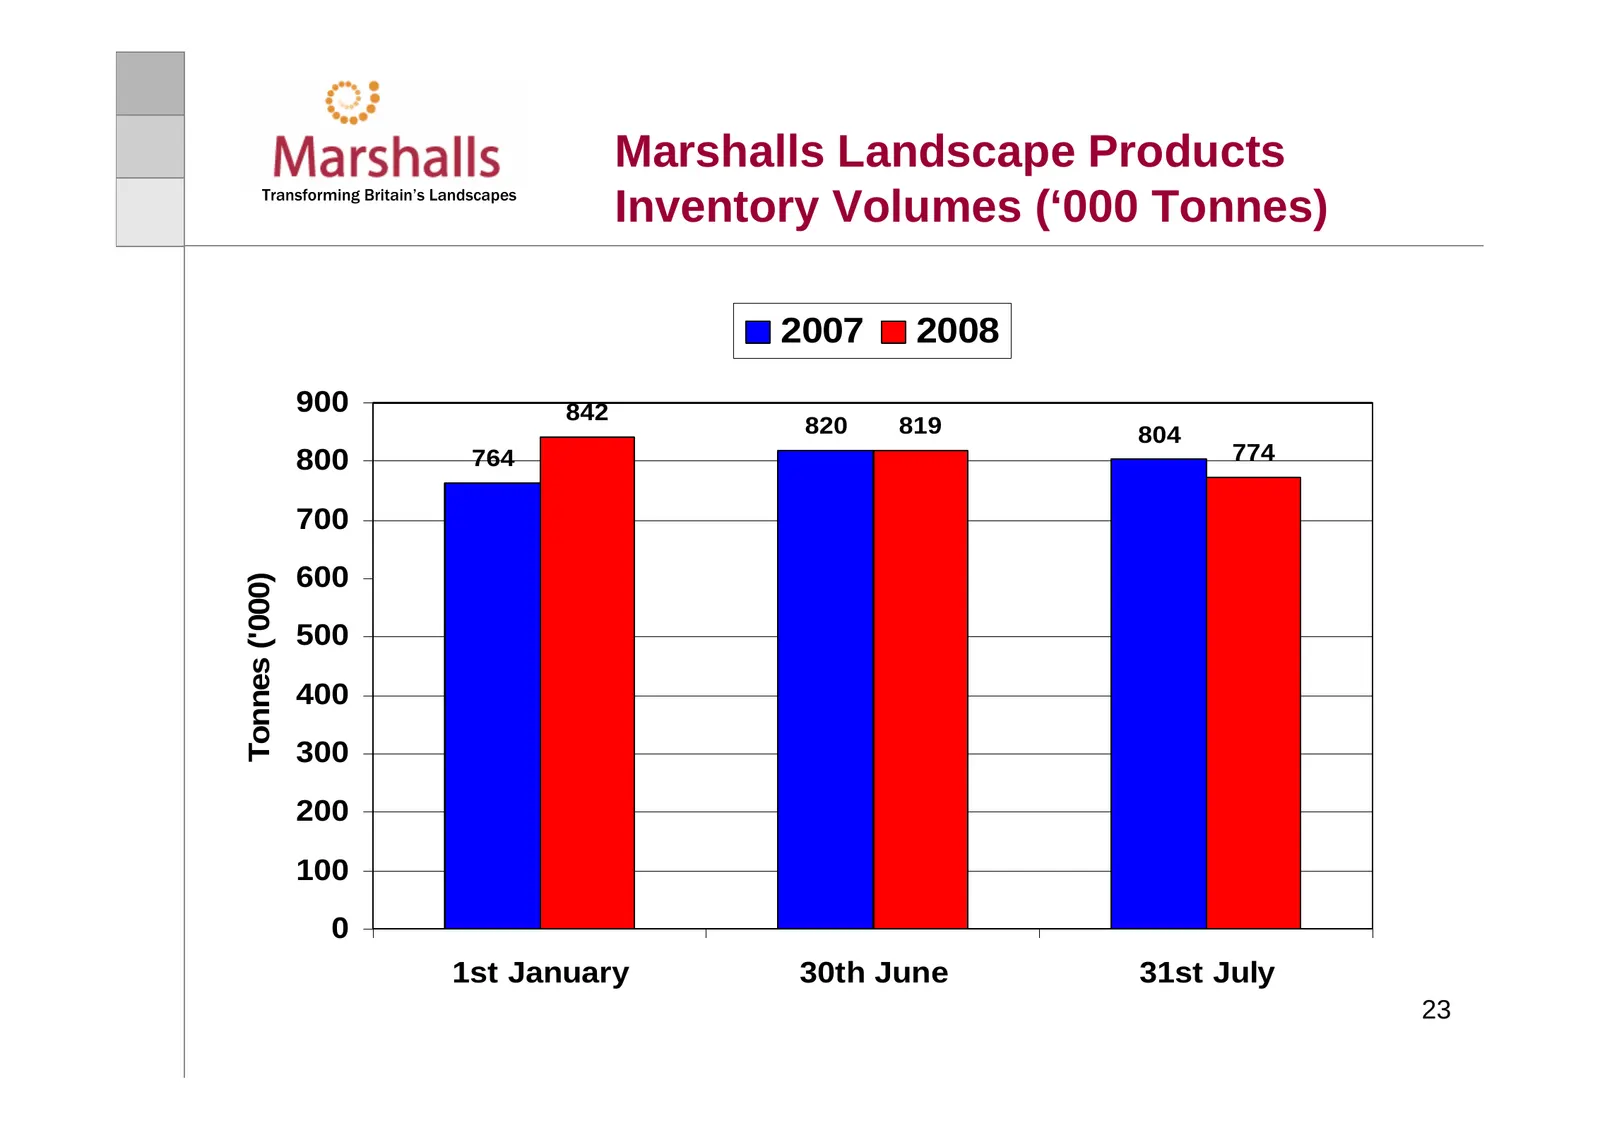
Marshalls Landscape Products Transforming Britain’s Landscapes Inventory Volumes (‘000 Tonnes) 2007 2008 900 842 820 819 804 800 764 774 700 600 Tonnes ('000) 500 400 300 200 100 0 1st January 30th June 31st July 23
Slide 24: Cost reduction and cash management
Cost reduction and cash management Transforming Britain’s Landscapes Works Closure Accelerate cost reduction plans Cease manufacturing at two sites Reduce fixed cost base Reduce stock volume and release cash Realise productivity improvement from recent investment Sites available for resale Consolida
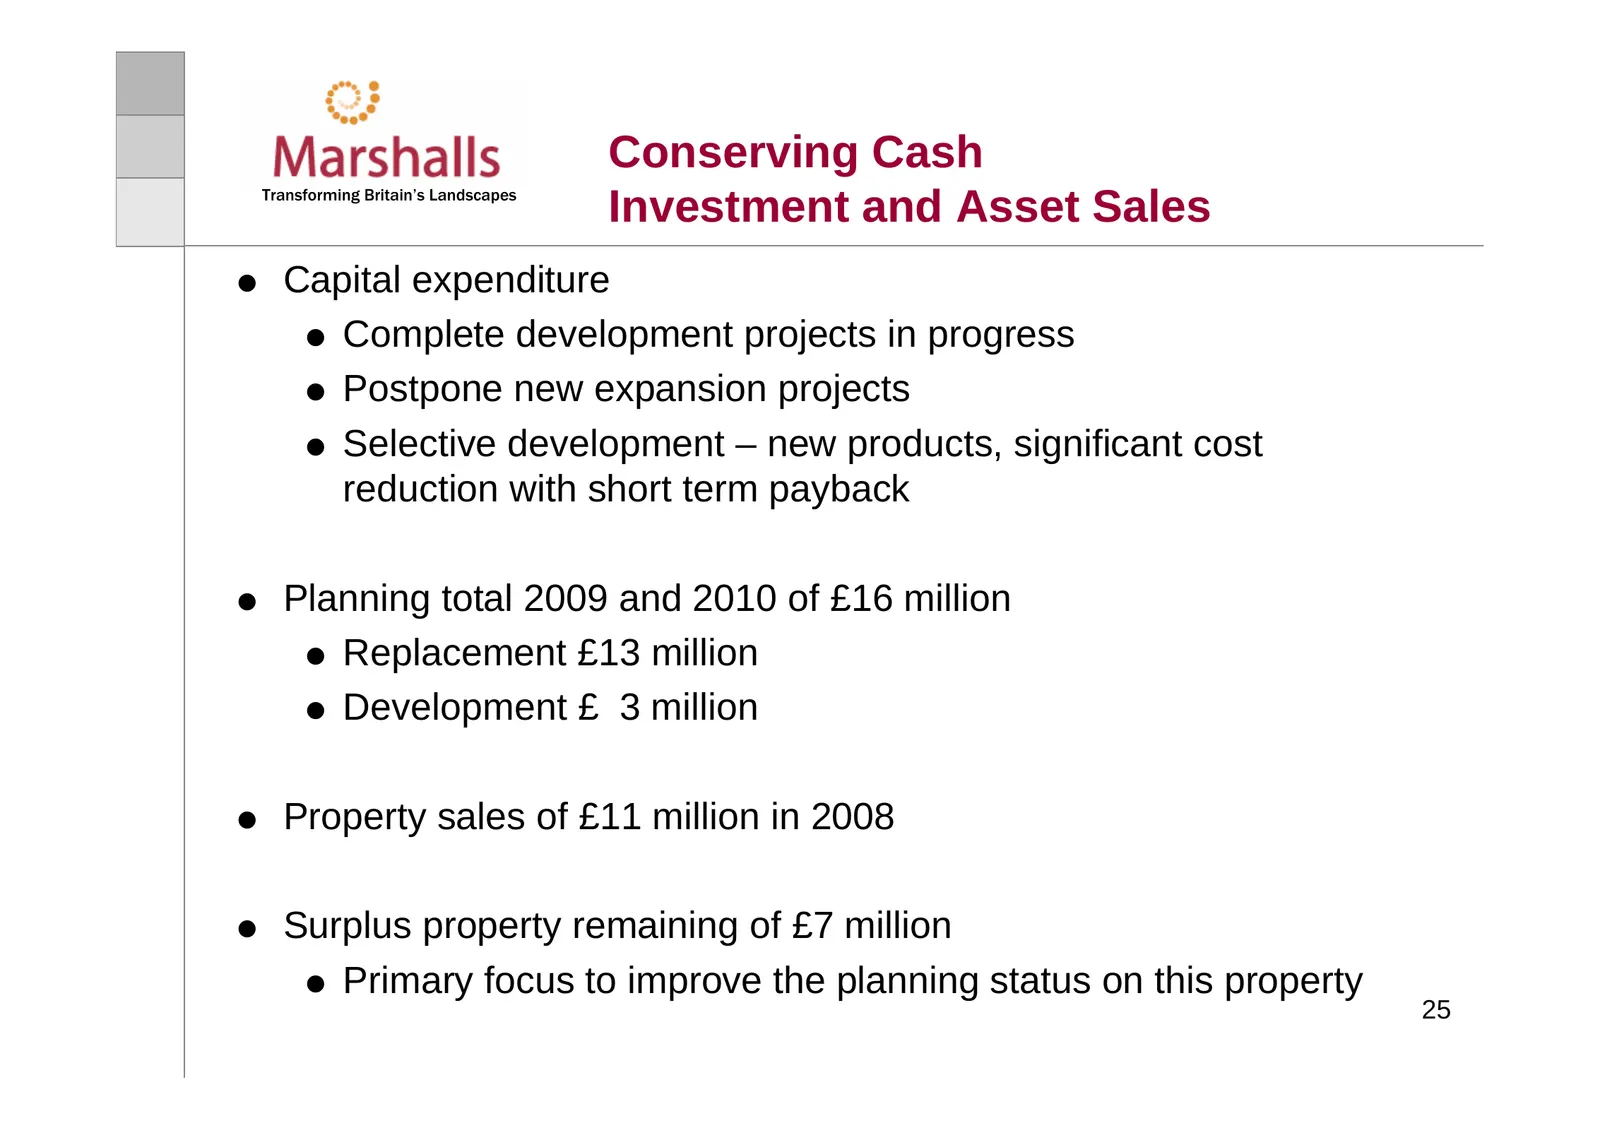
Slide 25: Conserving Cash: Investment and Asset Sales
Conserving Cash Transforming Britain’s Landscapes Investment and Asset Sales Capital expenditure Complete development projects in progress Postpone new expansion projects Selective development – new products, significant cost reduction with short term payback Planning total 2009 and 2010 of £16 mill
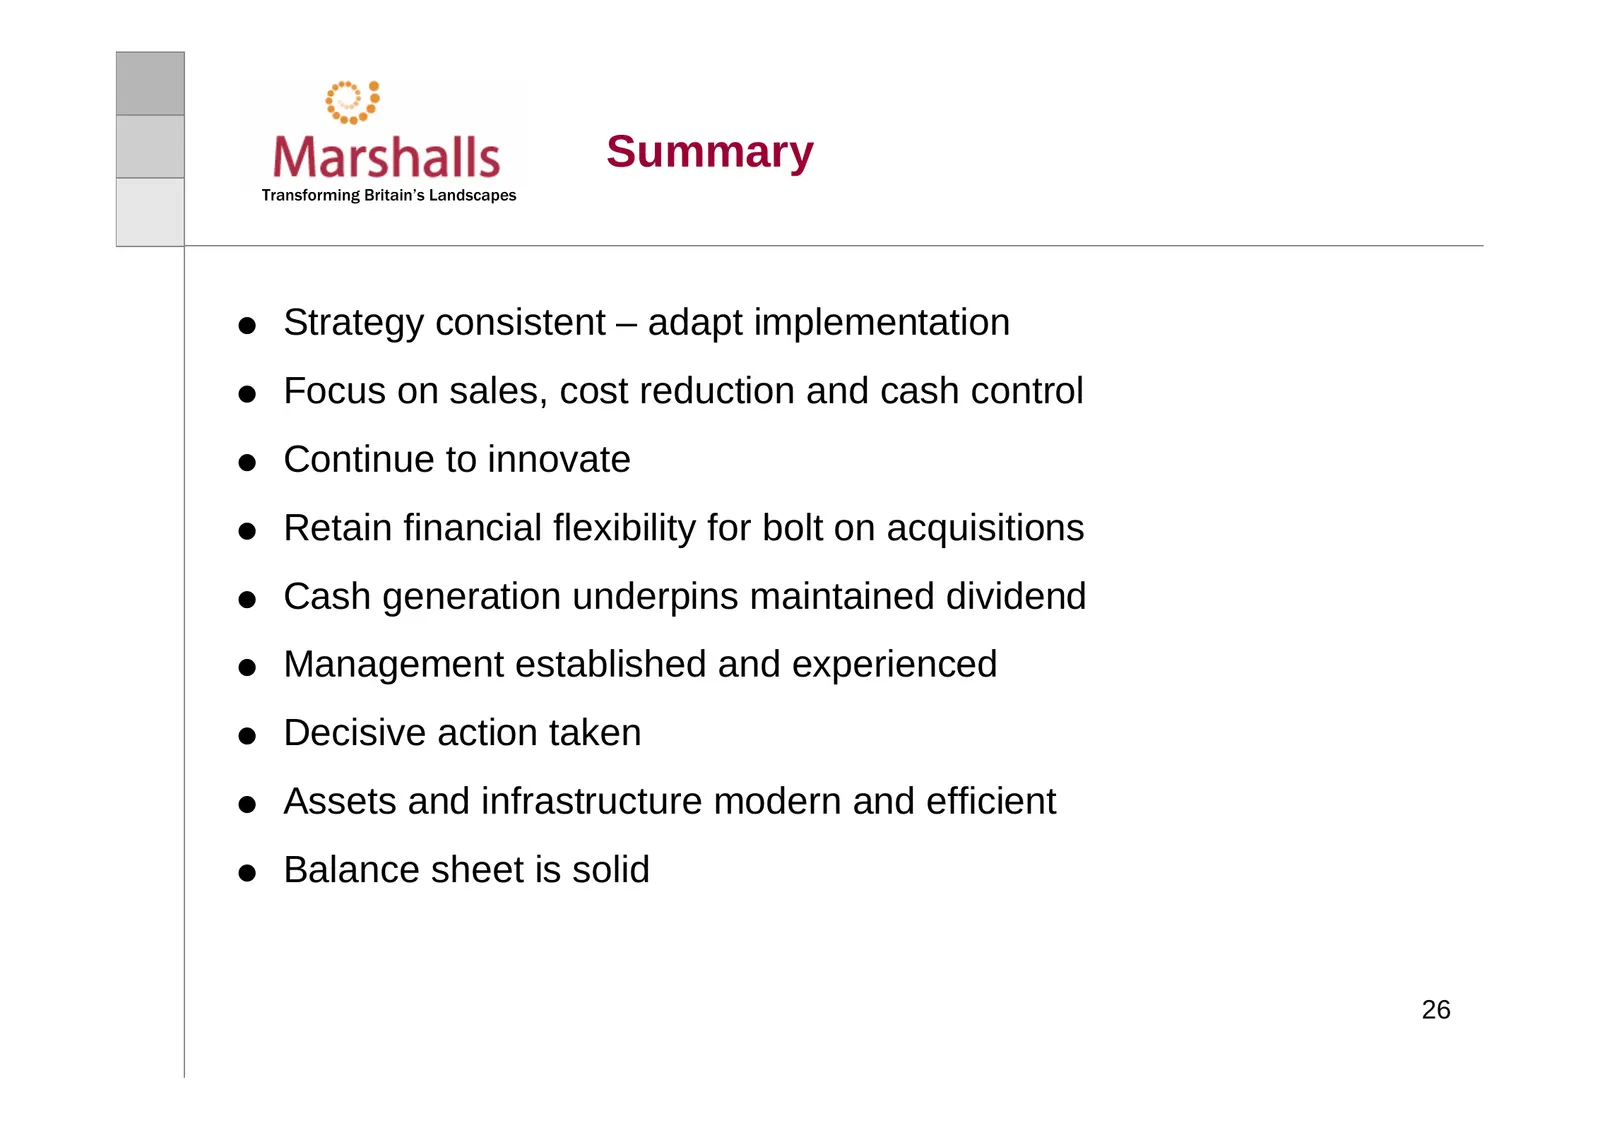
Slide 26: Summary
Summary Transforming Britain’s Landscapes Strategy consistent – adapt implementation Focus on sales, cost reduction and cash control Continue to innovate Retain financial flexibility for bolt on acquisitions Cash generation underpins maintained dividend Management established and experienced Decisiv

Slide 27: Appendices
Transforming Britain’s Landscapes Appendices
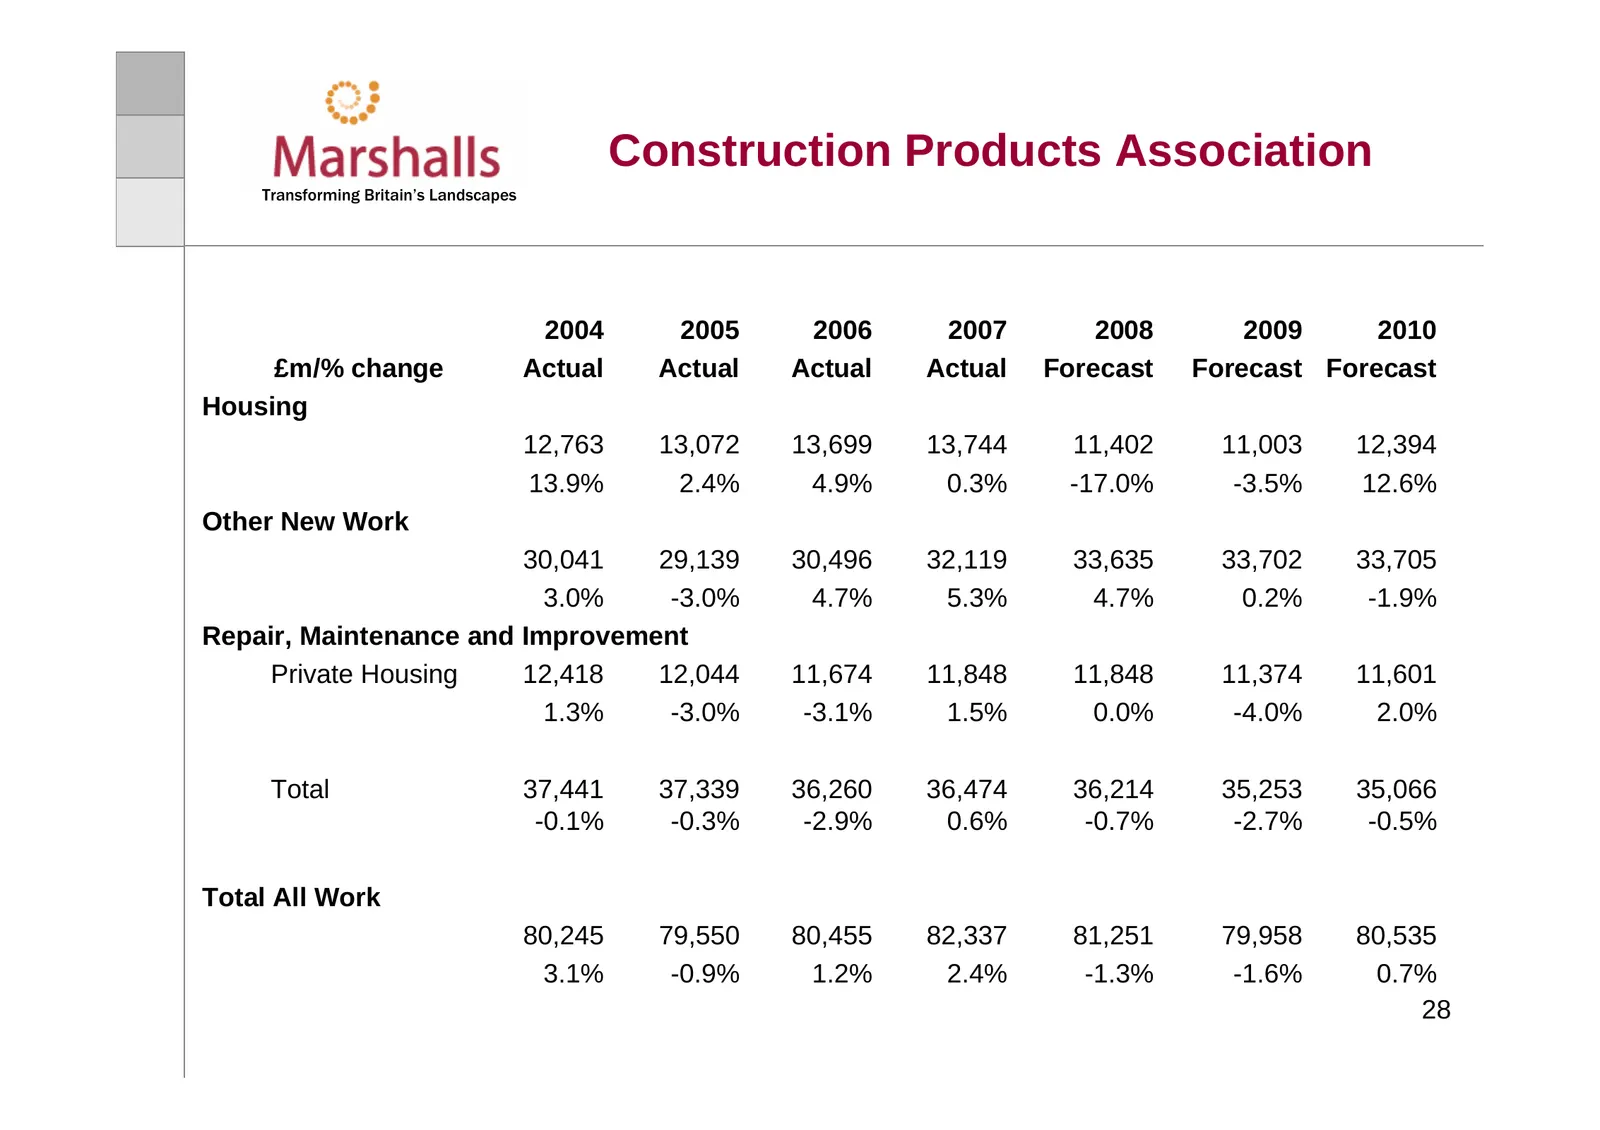
Slide 28: Construction Products Association
Construction Products Association Transforming Britain’s Landscapes 2004 2005 2006 2007 2008 2009 2010 £m/% change Actual Actual Actual Actual Forecast Forecast Forecast Housing 12,763 13,072 13,699 13,744 11,402 11,003 12,394 13.9% 2.4% 4.9% 0.3% -17.0% -3.5% 12.6% Other New Work 30,041 29,139 30,4
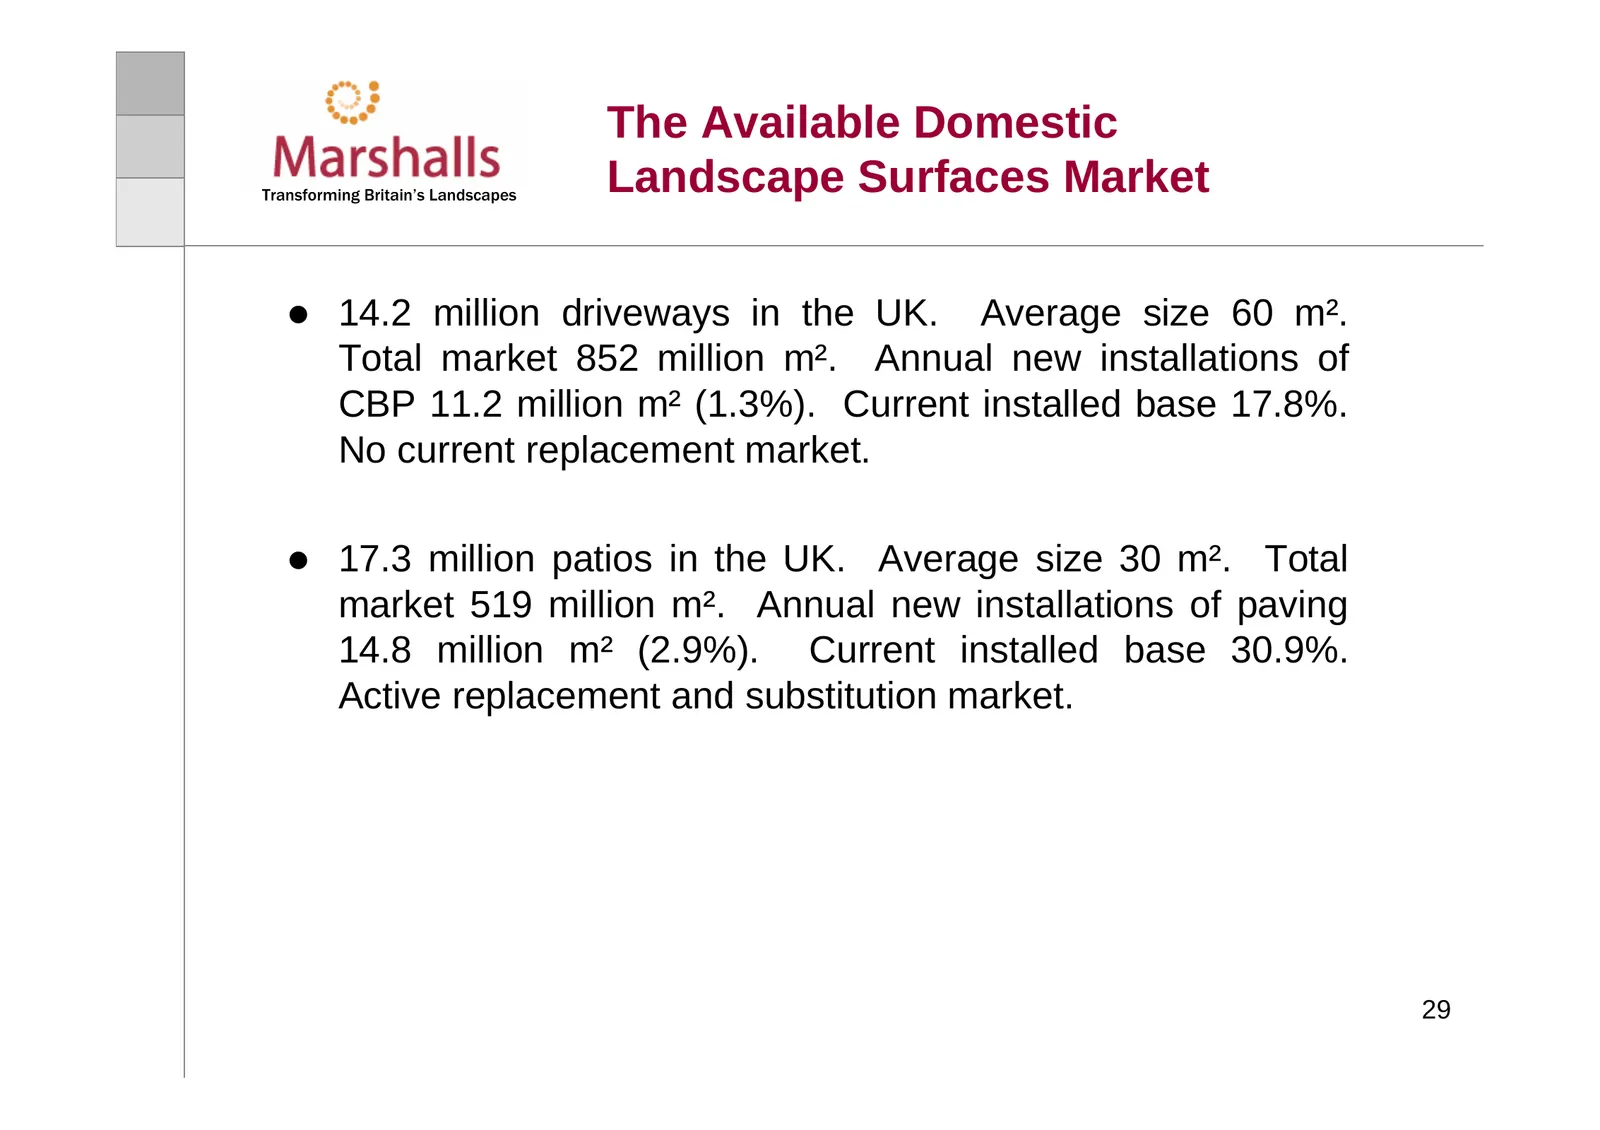
Slide 29: The Available Domestic Landscape Surfaces Market
The Available Domestic Transforming Britain’s Landscapes Landscape Surfaces Market z 14.2 million driveways in the UK. Average size 60 m². Total market 852 million m². Annual new installations of CBP 11.2 million m² (1.3%). Current installed base 17.8%. No current replacement market. z 17.3 million
Slide 30: Net Assets
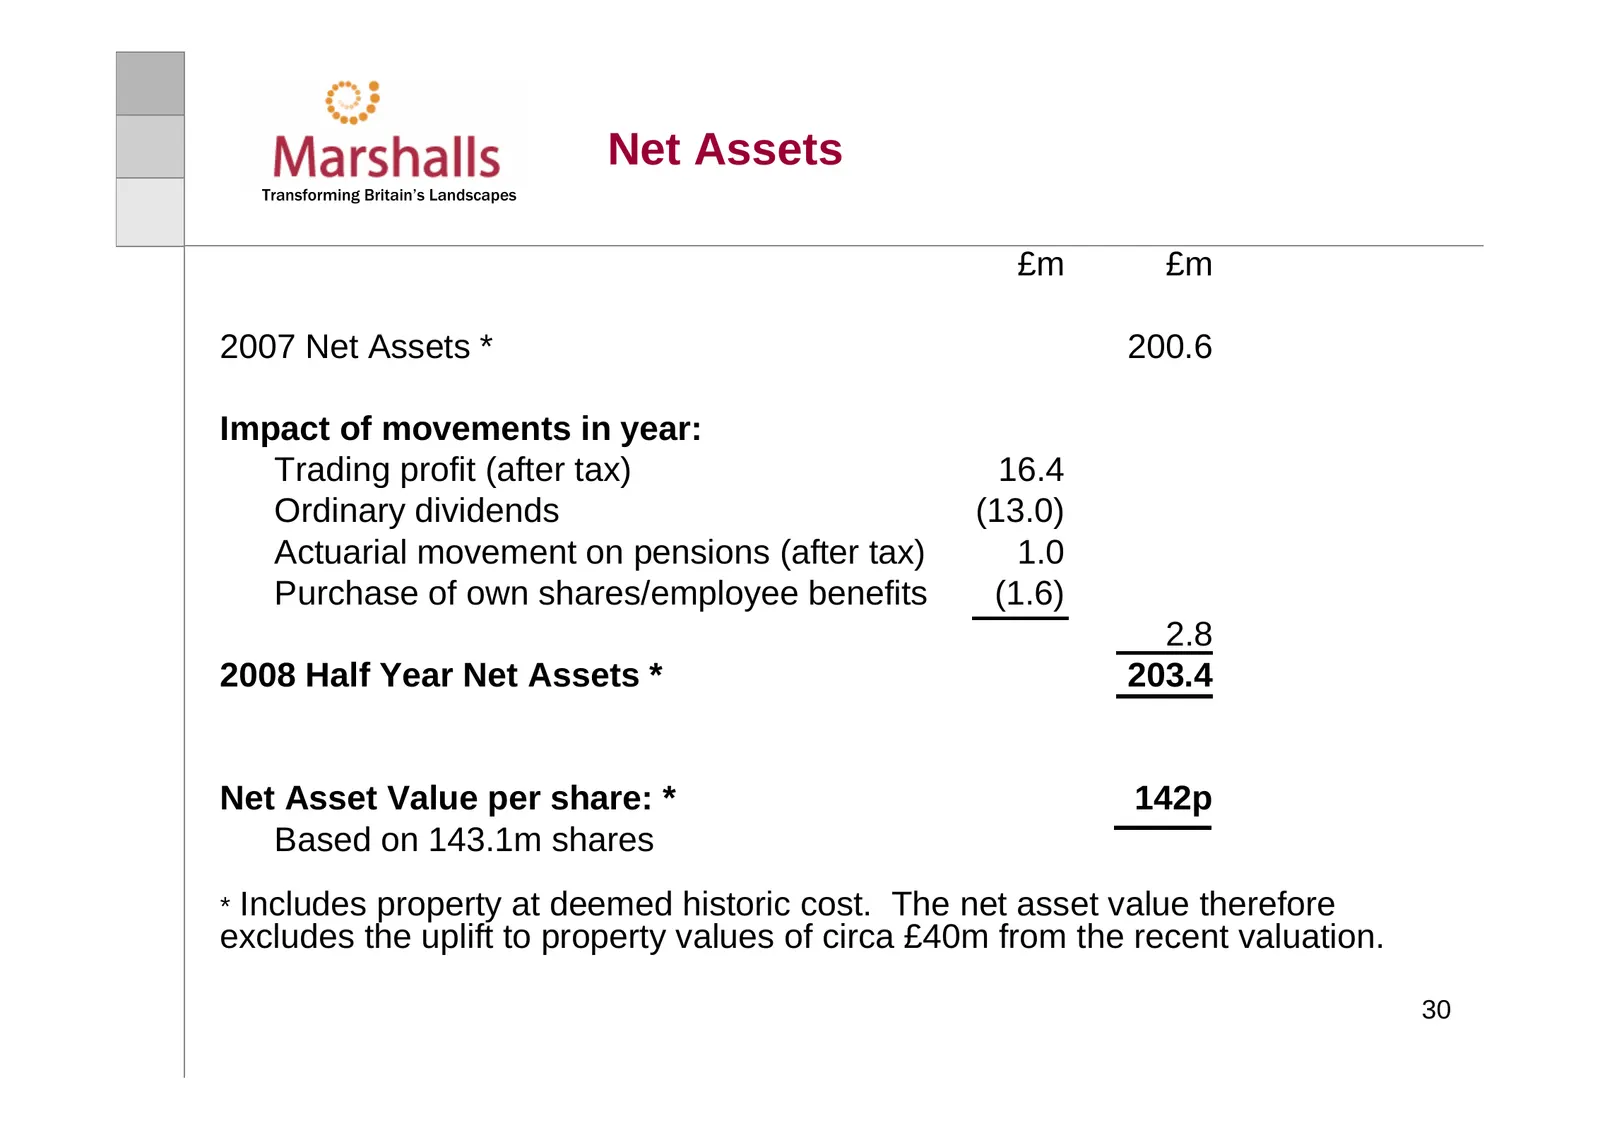
Net Assets Transforming Britain’s Landscapes £m £m 2007 Net Assets * 200.6 Impact of movements in year: Trading profit (after tax) 16.4 Ordinary dividends (13.0) Actuarial movement on pensions (after tax) 1.0 Purchase of own shares/employee benefits (1.6) 2.8 2008 Half Year Net Assets * 203.4 Net As
Slide 31: Disclaimer
Disclaimer Transforming Britain’s Landscapes • This presentation, which is personal to the recipient and has been issued by Marshalls plc (“Marshalls”), comprises slides for a presentation in relation to Marshalls interim results, and is solely for use at such presentation. • This presentation and t

Slide 32: Transforming Britain’s Landscapes
Transforming Britain’s Landscapes
Source: Internet Archive copy of marshalls.co.uk