Ellaktor SA · ATHEX:ELLAKTOR
Ellaktor SA — 9M 2020 Earnings Presentation
23 slides from Ellaktor SA's earnings presentation, 2020

Slide 1: 9M 2020 Restricted Group Results
9M 2020 Restricted Group Results
Slide 2: Disclaimer
Disclaimer This presentation has been prepared by ELLAKTOR S.A. (the “Company”). The information contained in this presentation has not been independently verified and no representation or warranty, express or implied, is made as to, and no reliance should be placed on, the fairness, accuracy, compl
Slide 3: Content pages
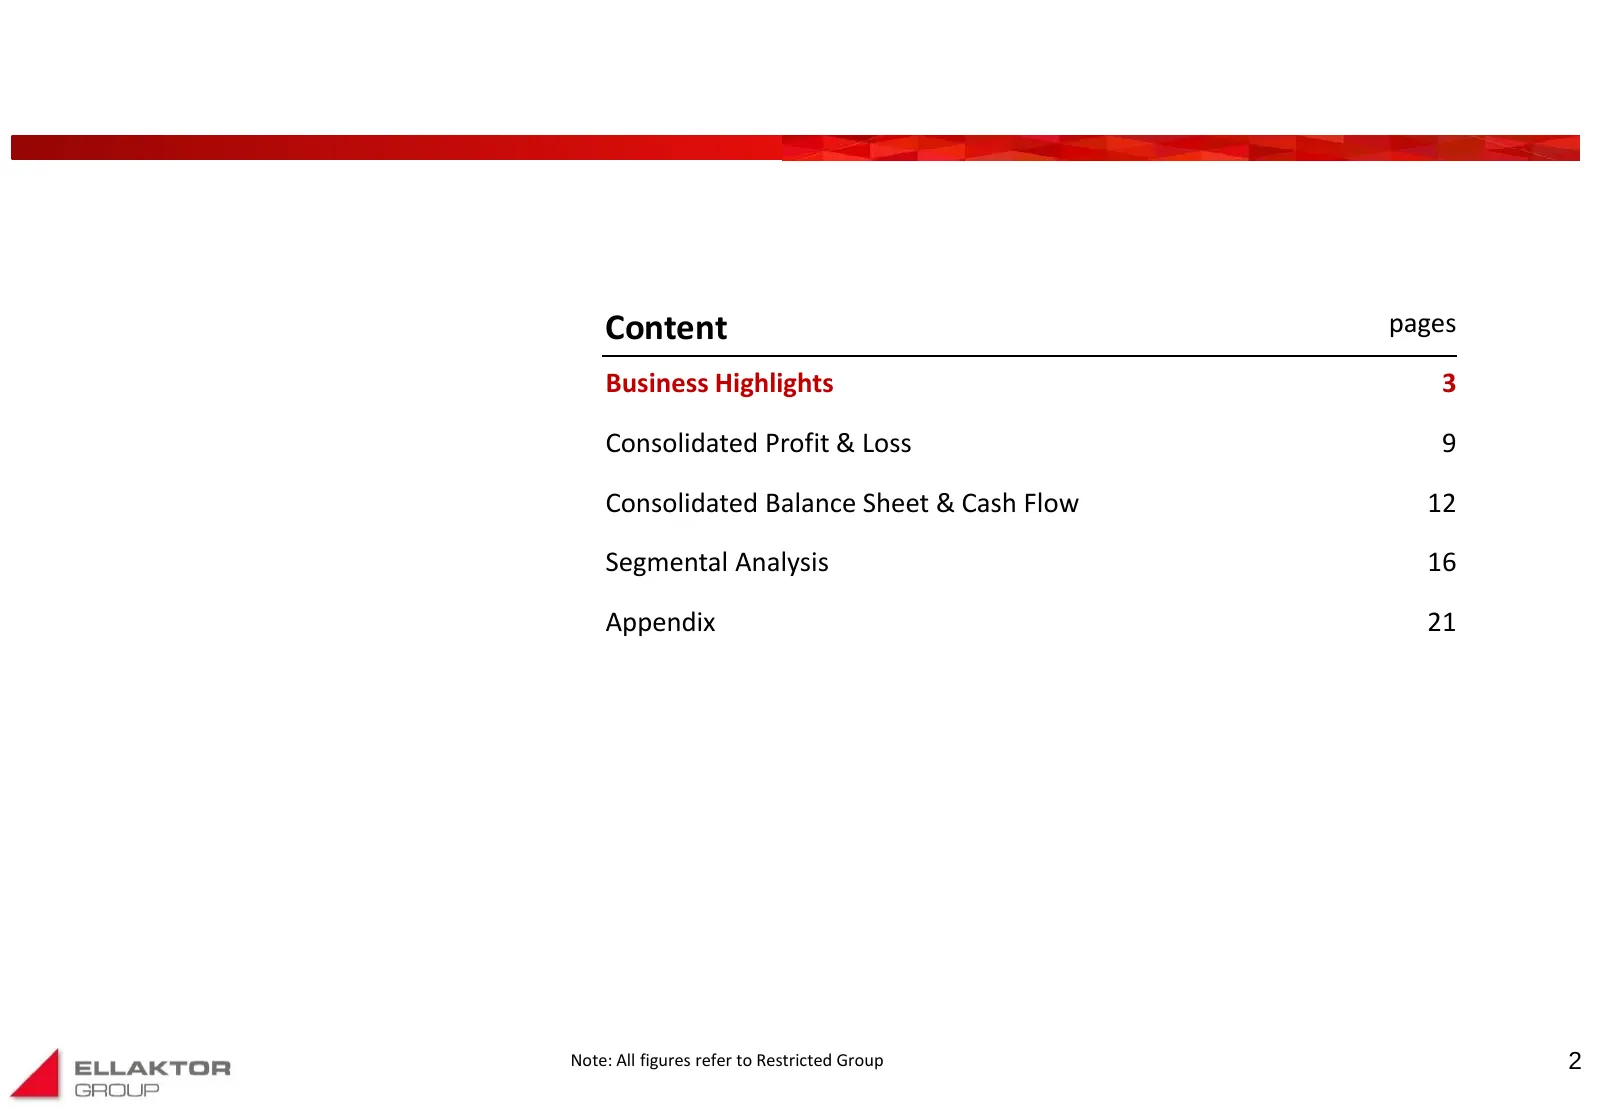
Content pages Business Highlights 3 Consolidated Profit & Loss 9 Consolidated Balance Sheet & Cash Flow 12 Segmental Analysis 16 Appendix 21 Note: All figures refer to Restricted Group 2
Slide 4: Executive Summary
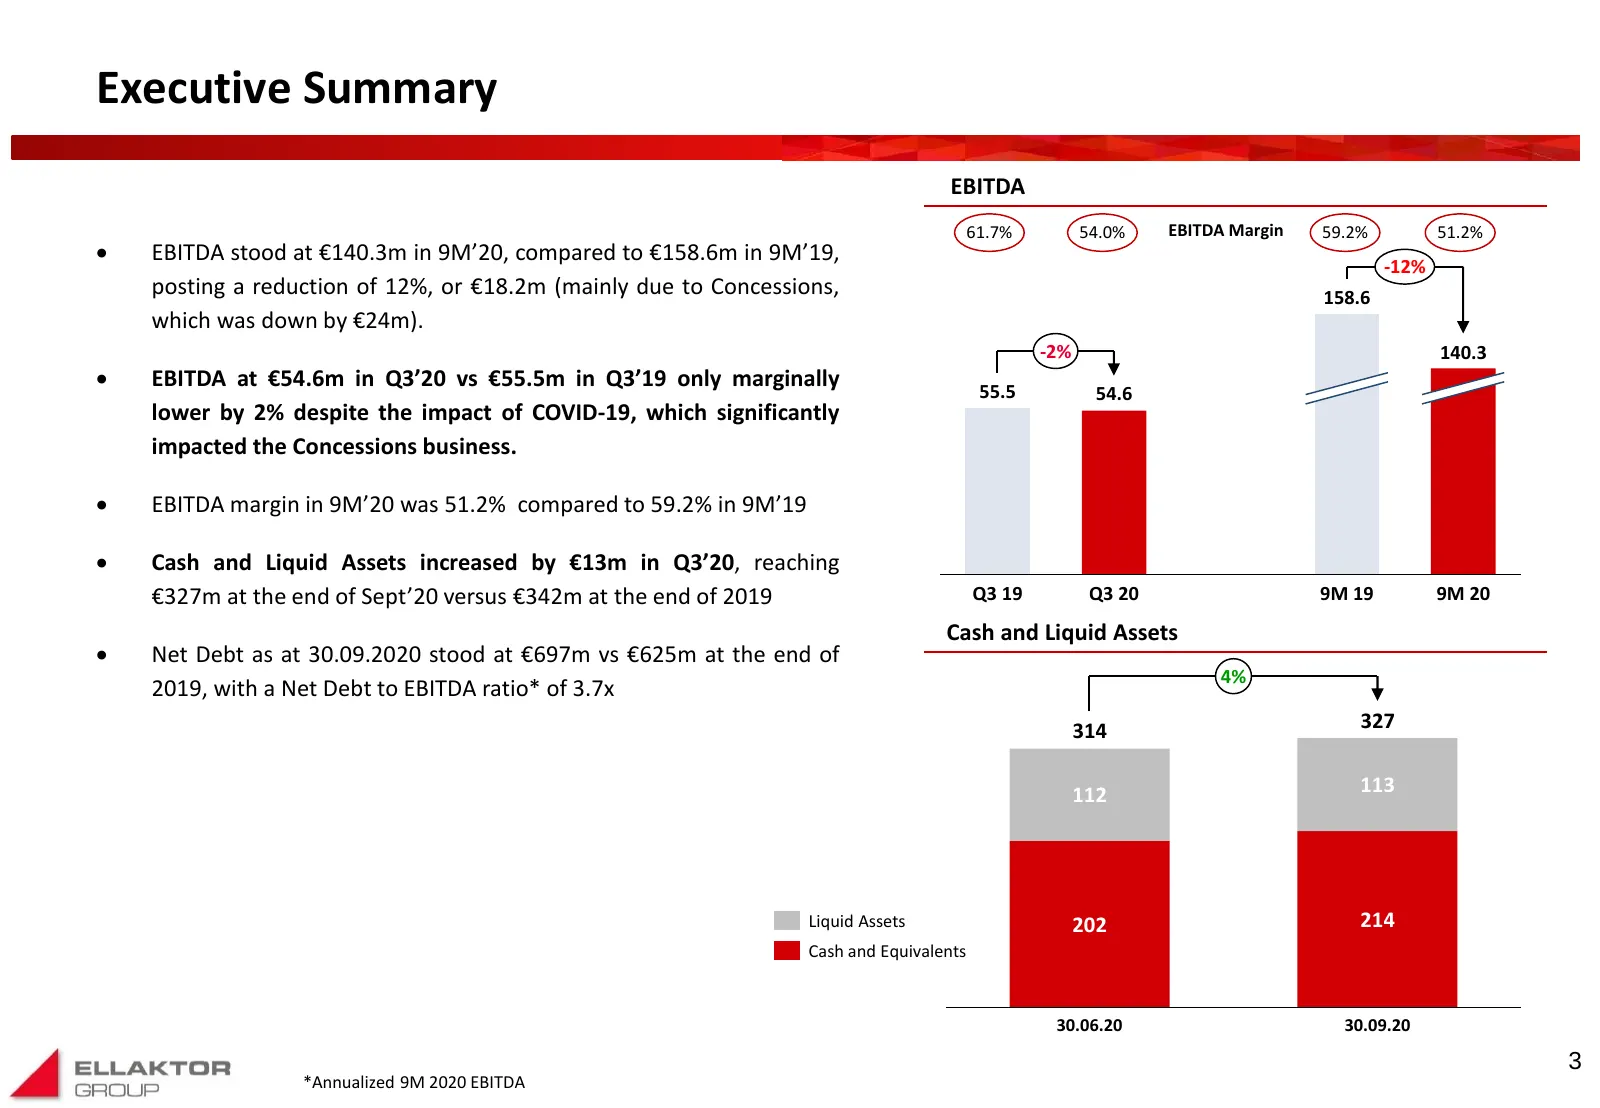
Executive Summary EBITDA 61.7% 54.0% EBITDA Margin 59.2% 51.2% EBITDA stood at €140.3m in 9M’20, compared to €158.6m in 9M’19, -12% posting a reduction of 12%, or €18.2m (mainly due to Concessions, 158.6 160 140 which was down by €24m). 150 120 -2% 140.3 EBITDA at €54.6m in Q3’20 vs €55.5m in Q3
Slide 5: Business Update by Restricted Group segment
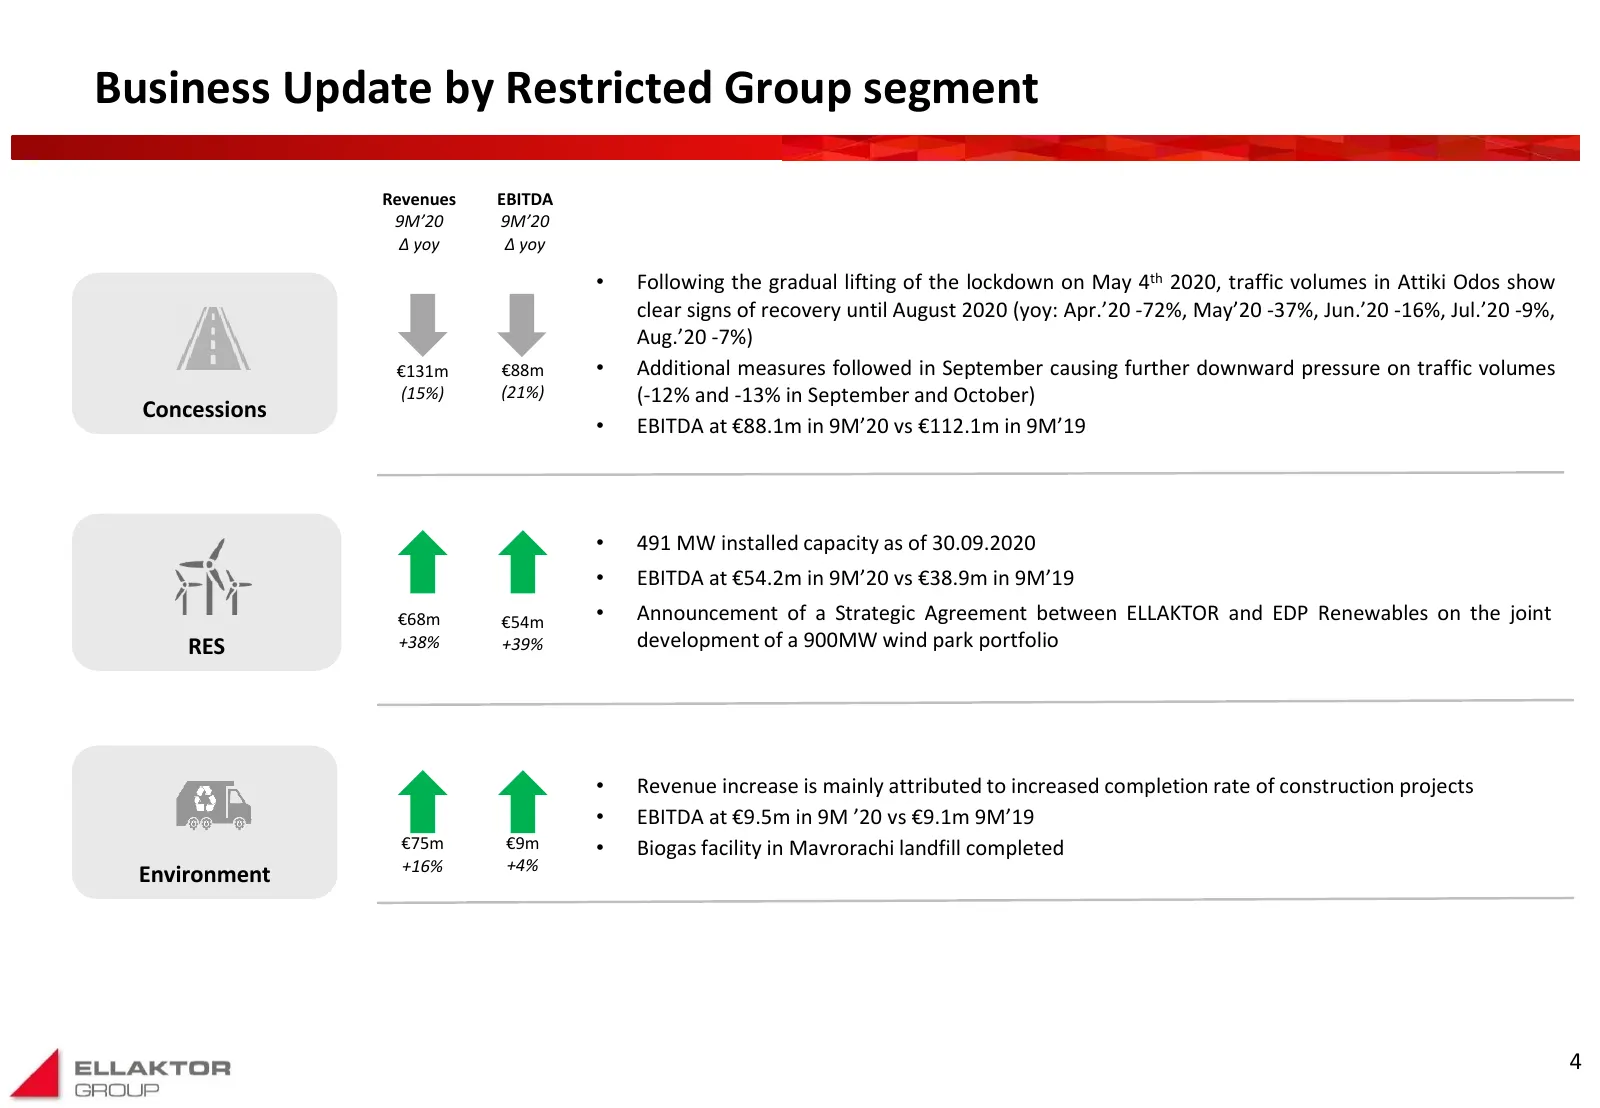
Business Update by Restricted Group segment Revenues EBITDA 9M’20 9M’20 Δ yoy Δ yoy • Following the gradual lifting of the lockdown on May 4th 2020, traffic volumes in Attiki Odos show clear signs of recovery until August 2020 (yoy: Apr.’20 -72%, May’20 -37%, Jun.’20 -16%, Jul.’20 -9%, Aug.’20 -7%)
Slide 6: Evolution of Restricted Group P&L Items (€m)
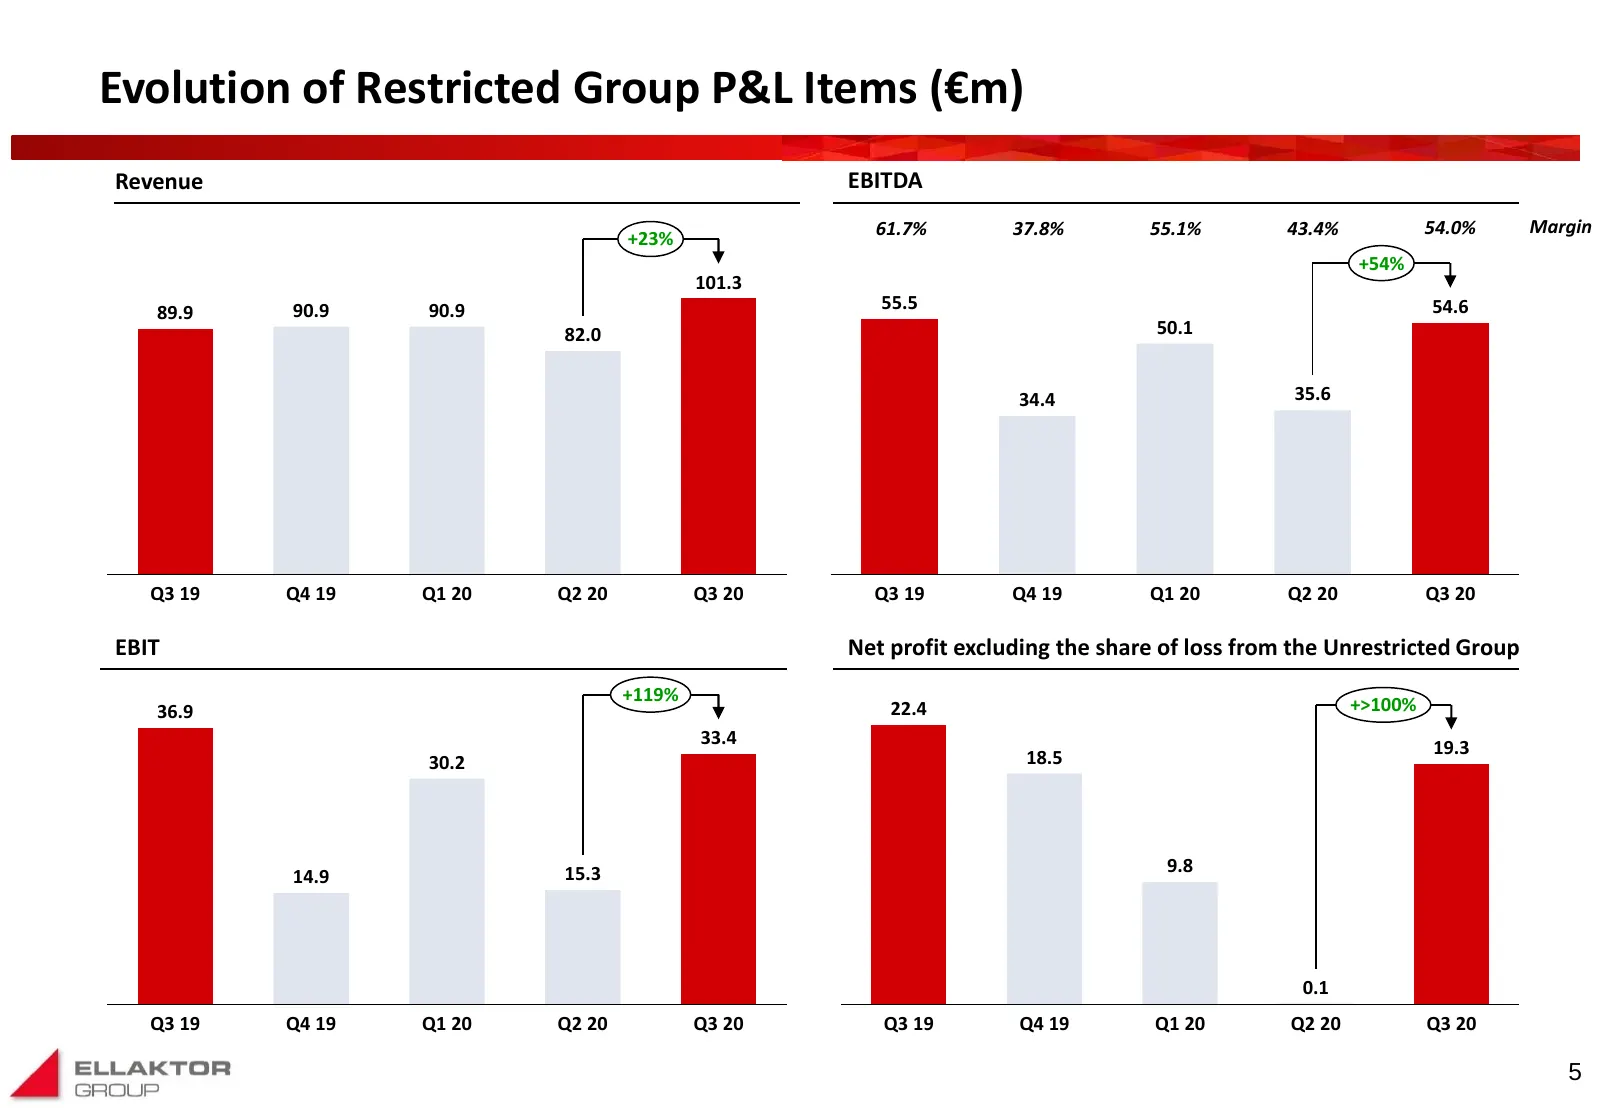
Evolution of Restricted Group P&L Items (€m) Revenue EBITDA 61.7% 37.8% 55.1% 43.4% 54.0% Margin +23% 110 140 +54% 101.3 100 60 55.5 140 89.9 90.9 90.9 120 54.6 90 82.0 50.1 120 50 80 100 70 100 40 35.6 60 80 34.4 80 50 30 60 60 40 20 40 30 40 20 10 20 20 10 0 00 0 Q3 19 Q4 19 Q1 20 Q2 20 Q3 20 Q3 1
Slide 7: Restricted Group Net Debt to EBITDA and EBITDA Margin (€m)
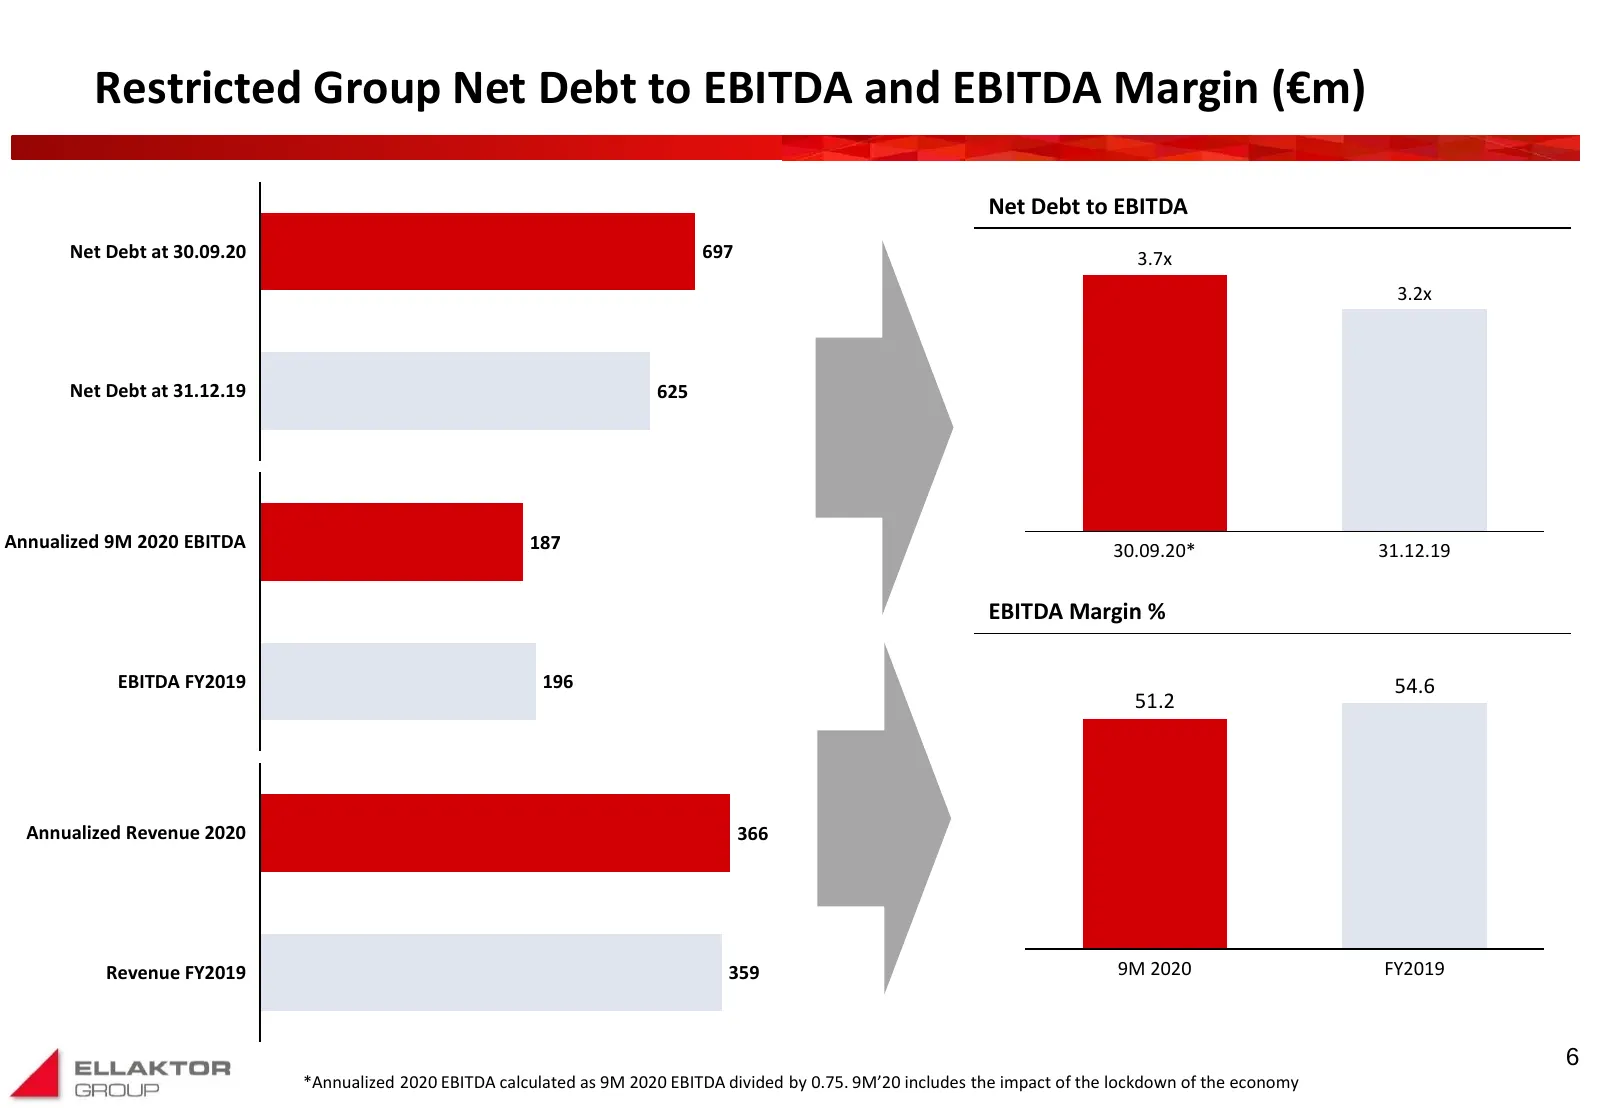
Restricted Group Net Debt to EBITDA and EBITDA Margin (€m) Net Debt to EBITDA Net Debt at 30.09.20 697 3.7x 3.2x Net Debt at 31.12.19 625 Annualized 9M 2020 EBITDA 187 30.09.20* 31.12.19 EBITDA Margin % EBITDA FY2019 196 54.6 51.2 Annualized Revenue 2020 366 Revenue FY2019 359 9M 2020 FY2019 6 *Annu
Slide 8: Content pages
Content pages Business Highlights 3 Consolidated Profit & Loss 9 Consolidated Balance Sheet & Cash Flow 12 Segmental Analysis 16 Appendix 21 Note: All figures refer to Restricted Group 7
Slide 9: Restricted Group Consolidated P&L
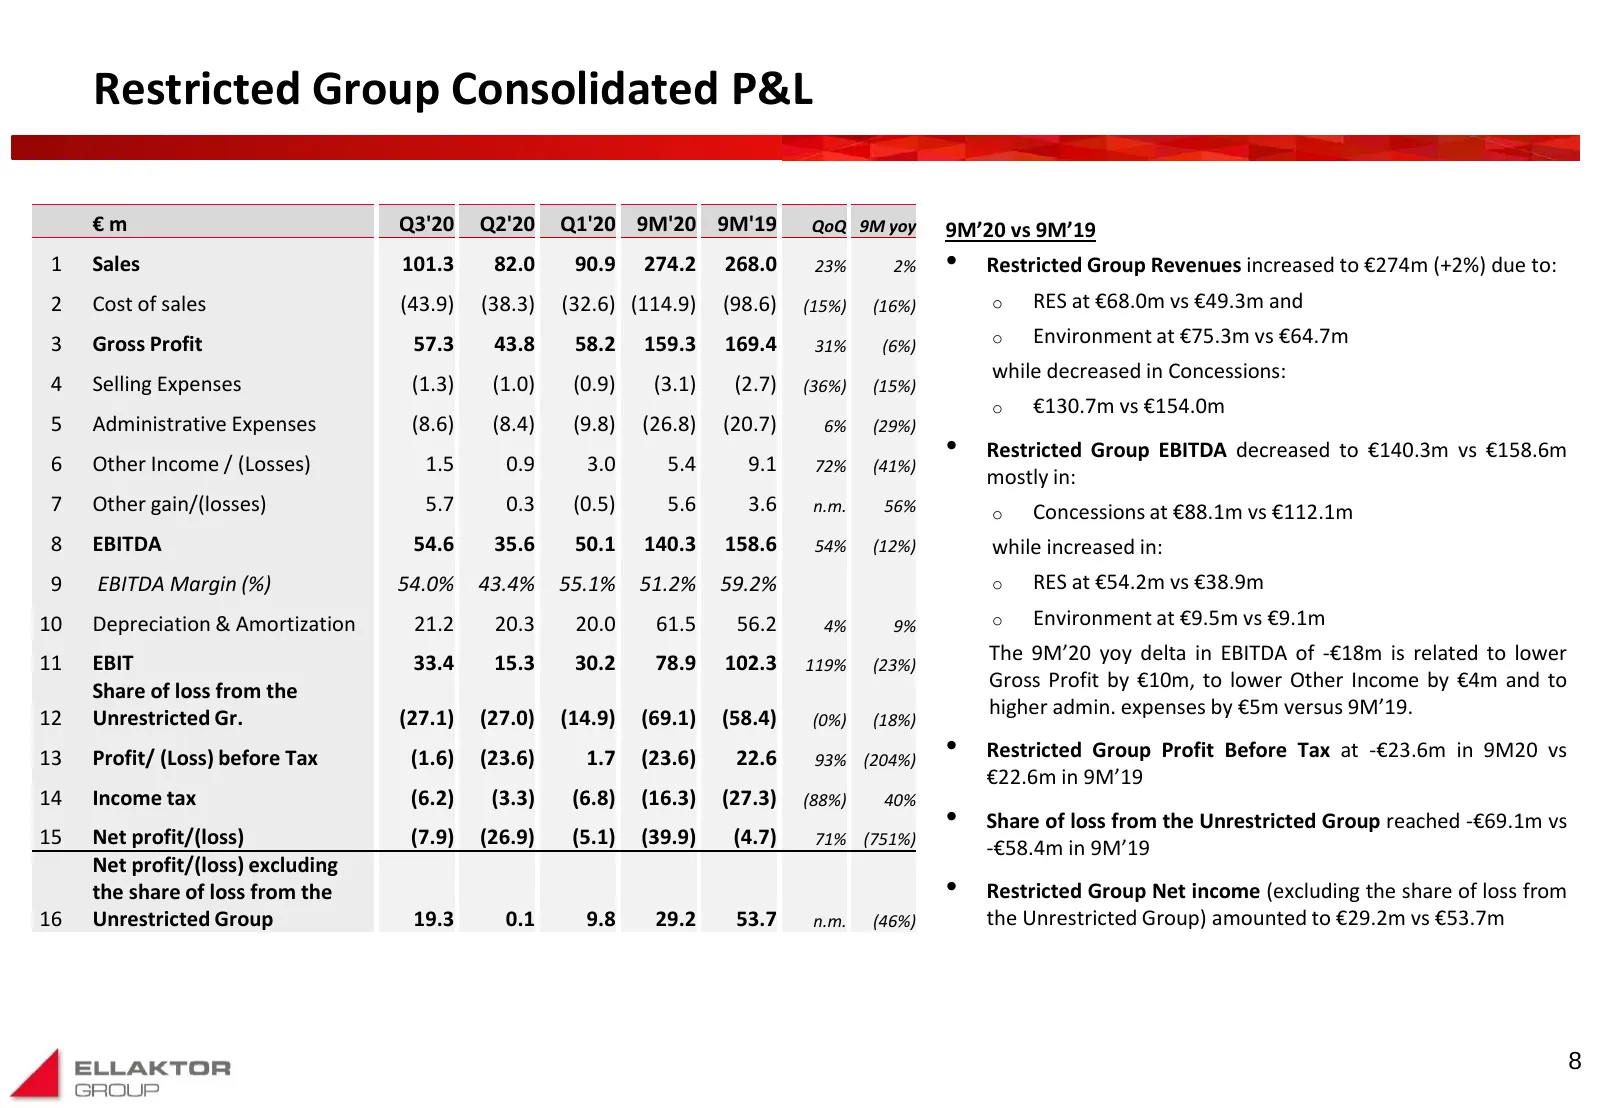
Restricted Group Consolidated P&L €m Q3'20 Q2'20 Q1'20 9M'20 9M'19 QoQ 9M yoy 9M’20 vs 9M’19 1 Sales 101.3 82.0 90.9 274.2 268.0 23% 2% • Restricted Group Revenues increased to €274m (+2%) due to: 2 Cost of sales (43.9) (38.3) (32.6) (114.9) (98.6) (15%) (16%) o RES at €68.0m vs €49.3m and 3 Gross P
Slide 10: Sales and EBITDA (€m)
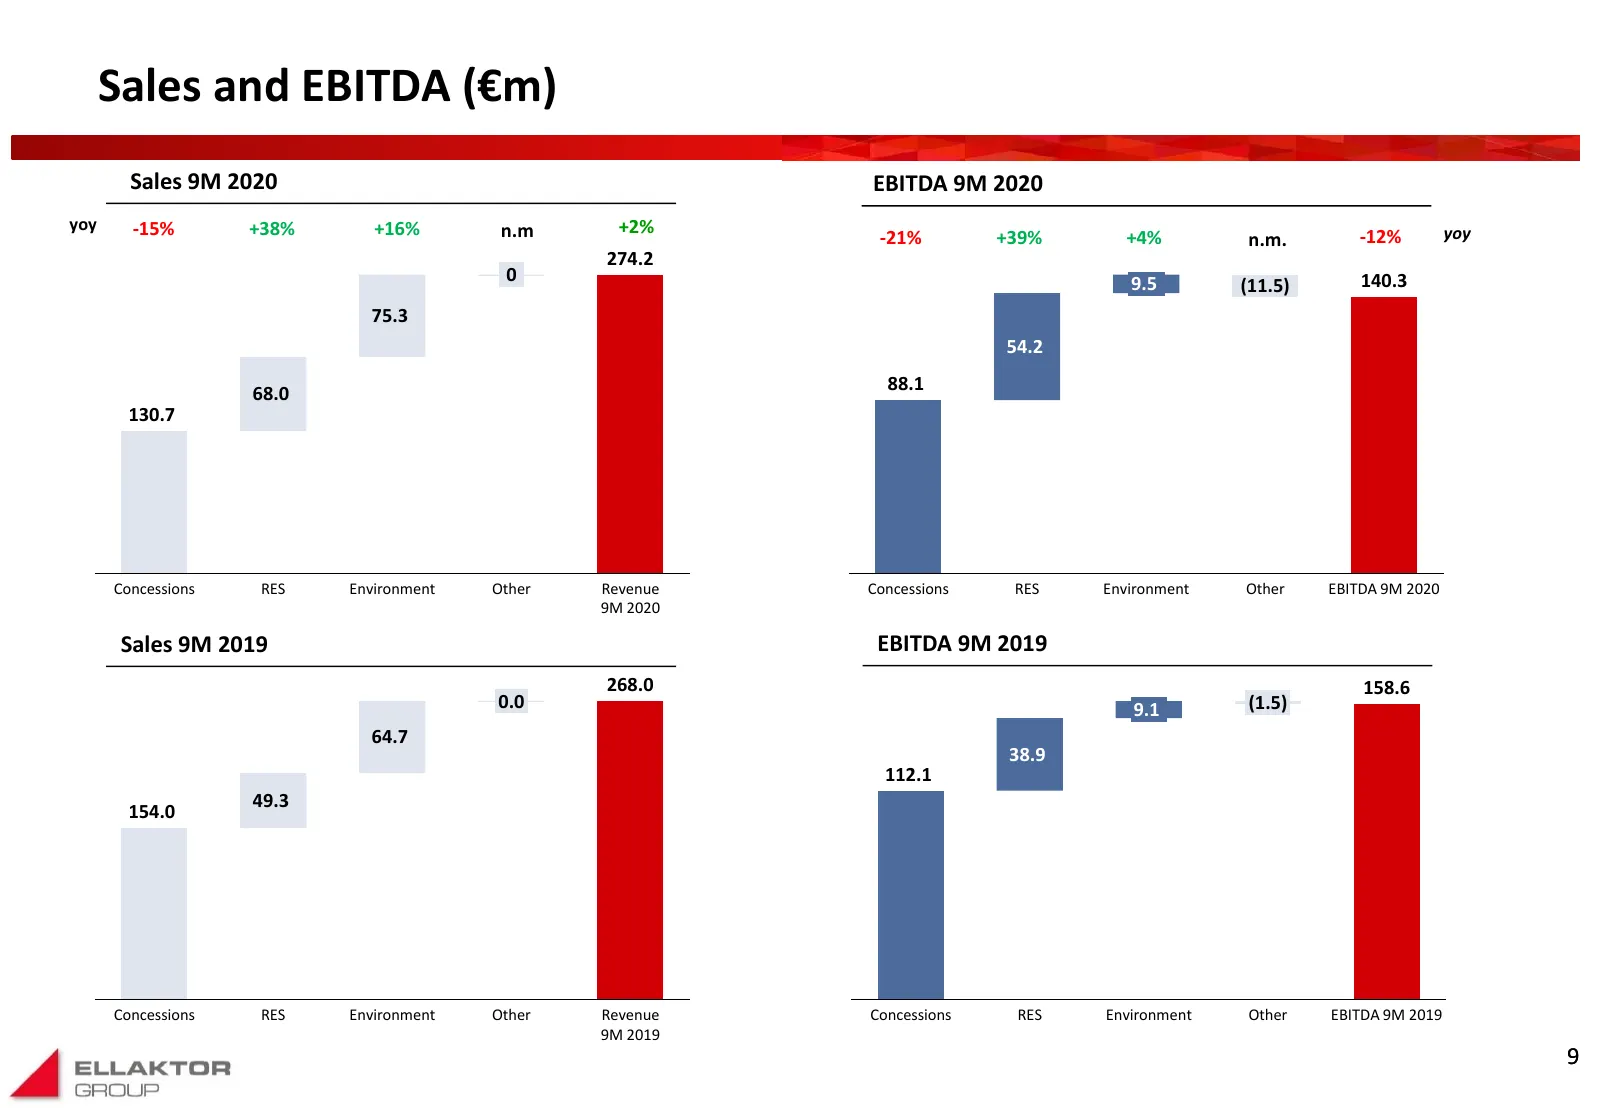
Sales and EBITDA (€m) Sales 9M 2020 EBITDA 9M 2020 yoy -15% +38% +16% n.m +2% yoy -21% +39% +4% n.m. -12% 274.2 0 9.5 140.3 (11.5) 75.3 54.2 88.1 68.0 130.7 Concessions RES Environment Other Revenue Concessions RES Environment Other EBITDA 9M 2020 9M 2020 Sales 9M 2019 EBITDA 9M 2019 268.0 158.6 0.0
Slide 11: Content pages
Content pages Business Highlights 3 Consolidated Profit & Loss 9 Consolidated Balance Sheet & Cash Flow 12 Segmental Analysis 16 Appendix 21 Note: All figures refer to Restricted Group 10
Slide 12: Restricted Group Consolidated Balance Sheet
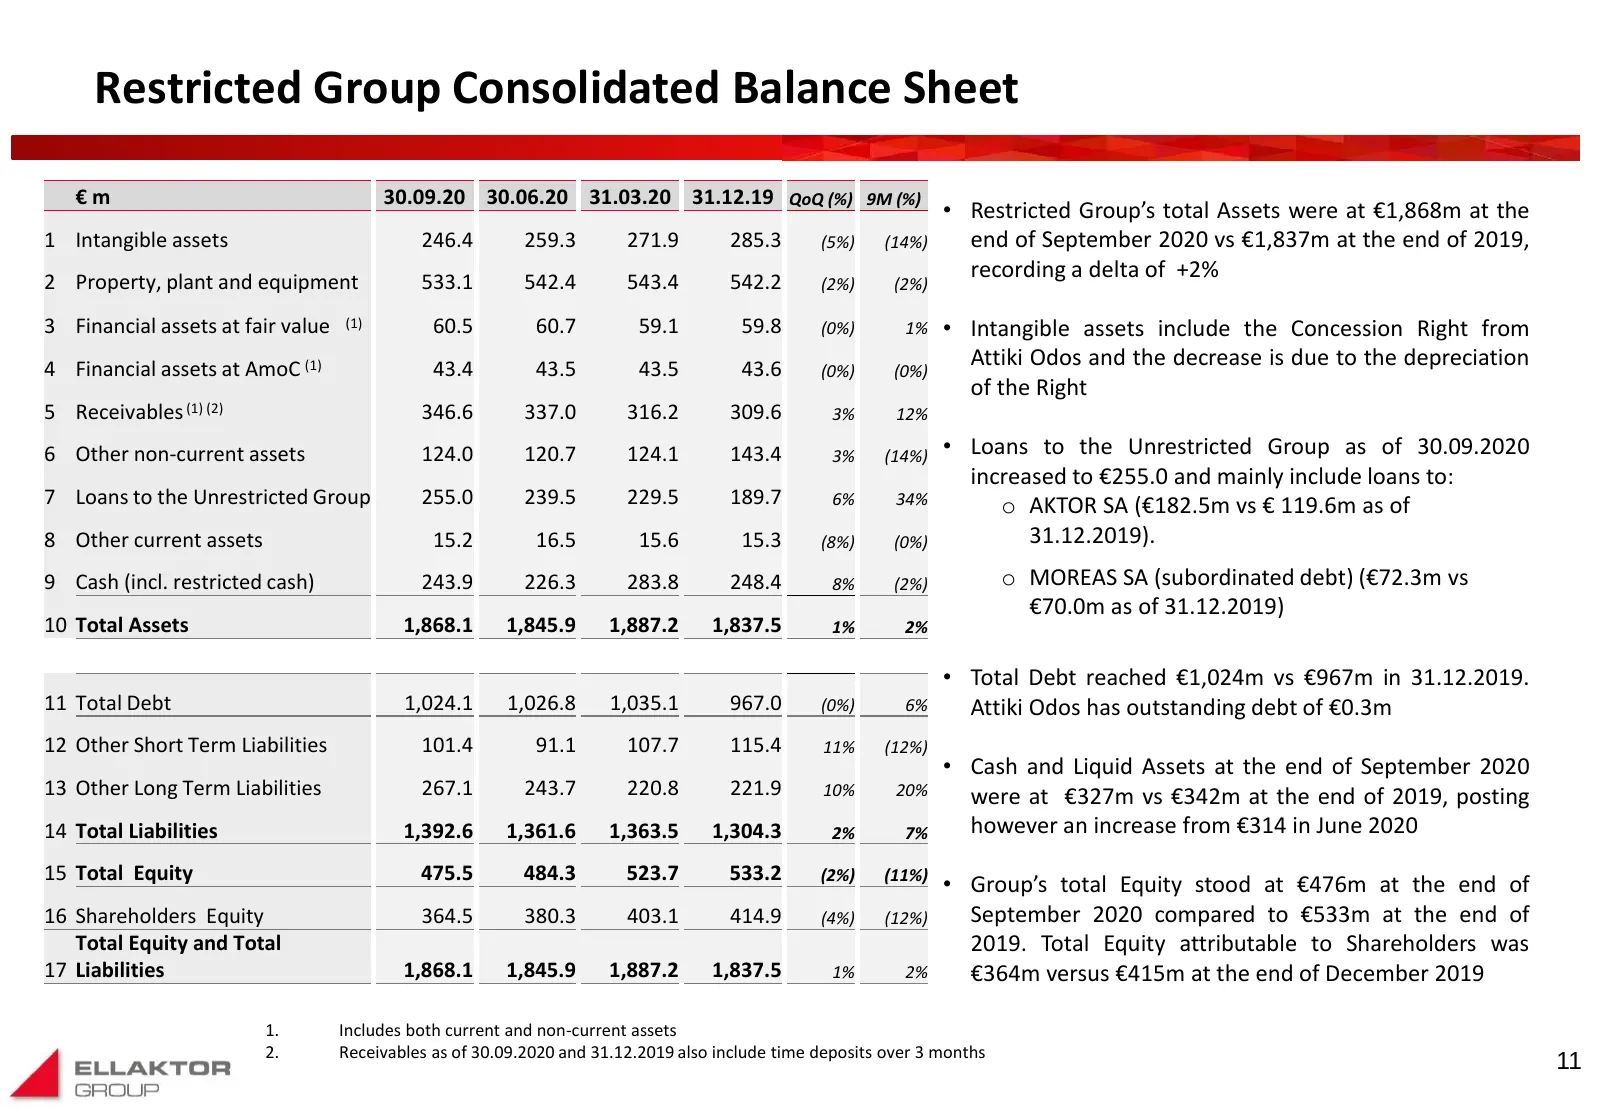
Restricted Group Consolidated Balance Sheet €m 30.09.20 30.06.20 31.03.20 31.12.19 QoQ (%) 9M (%) • Restricted Group’s total Assets were at €1,868m at the 1 Intangible assets 246.4 259.3 271.9 285.3 (5%) (14%) end of September 2020 vs €1,837m at the end of 2019, recording a delta of +2% 2 Property,
Slide 13: Net Debt by sector
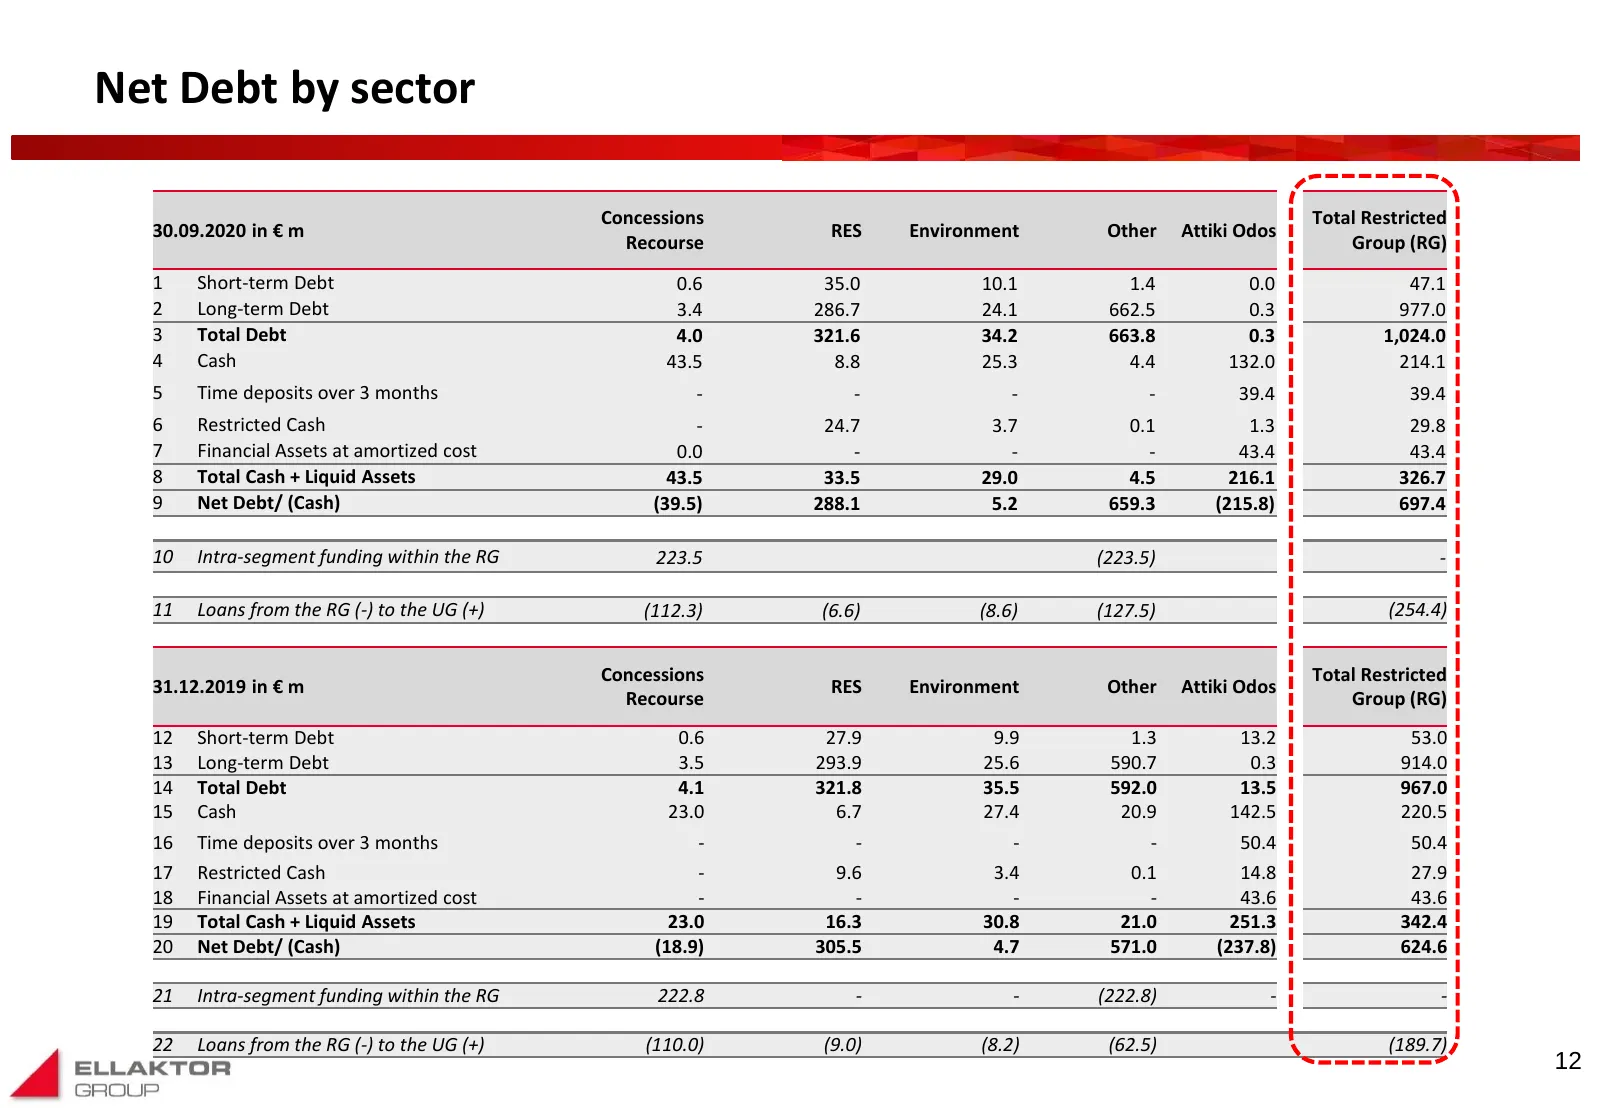
Net Debt by sector Concessions Total Restricted 30.09.2020 in € m RES Environment Other Attiki Odos Recourse Group (RG) 1 Short-term Debt 0.6 35.0 10.1 1.4 0.0 47.1 2 Long-term Debt 3.4 286.7 24.1 662.5 0.3 977.0 3 Total Debt 4.0 321.6 34.2 663.8 0.3 1,024.0 4 Cash 43.5 8.8 25.3 4.4 132.0 214.1 5 Ti
Slide 14: Restricted Group Consolidated Cash Flows
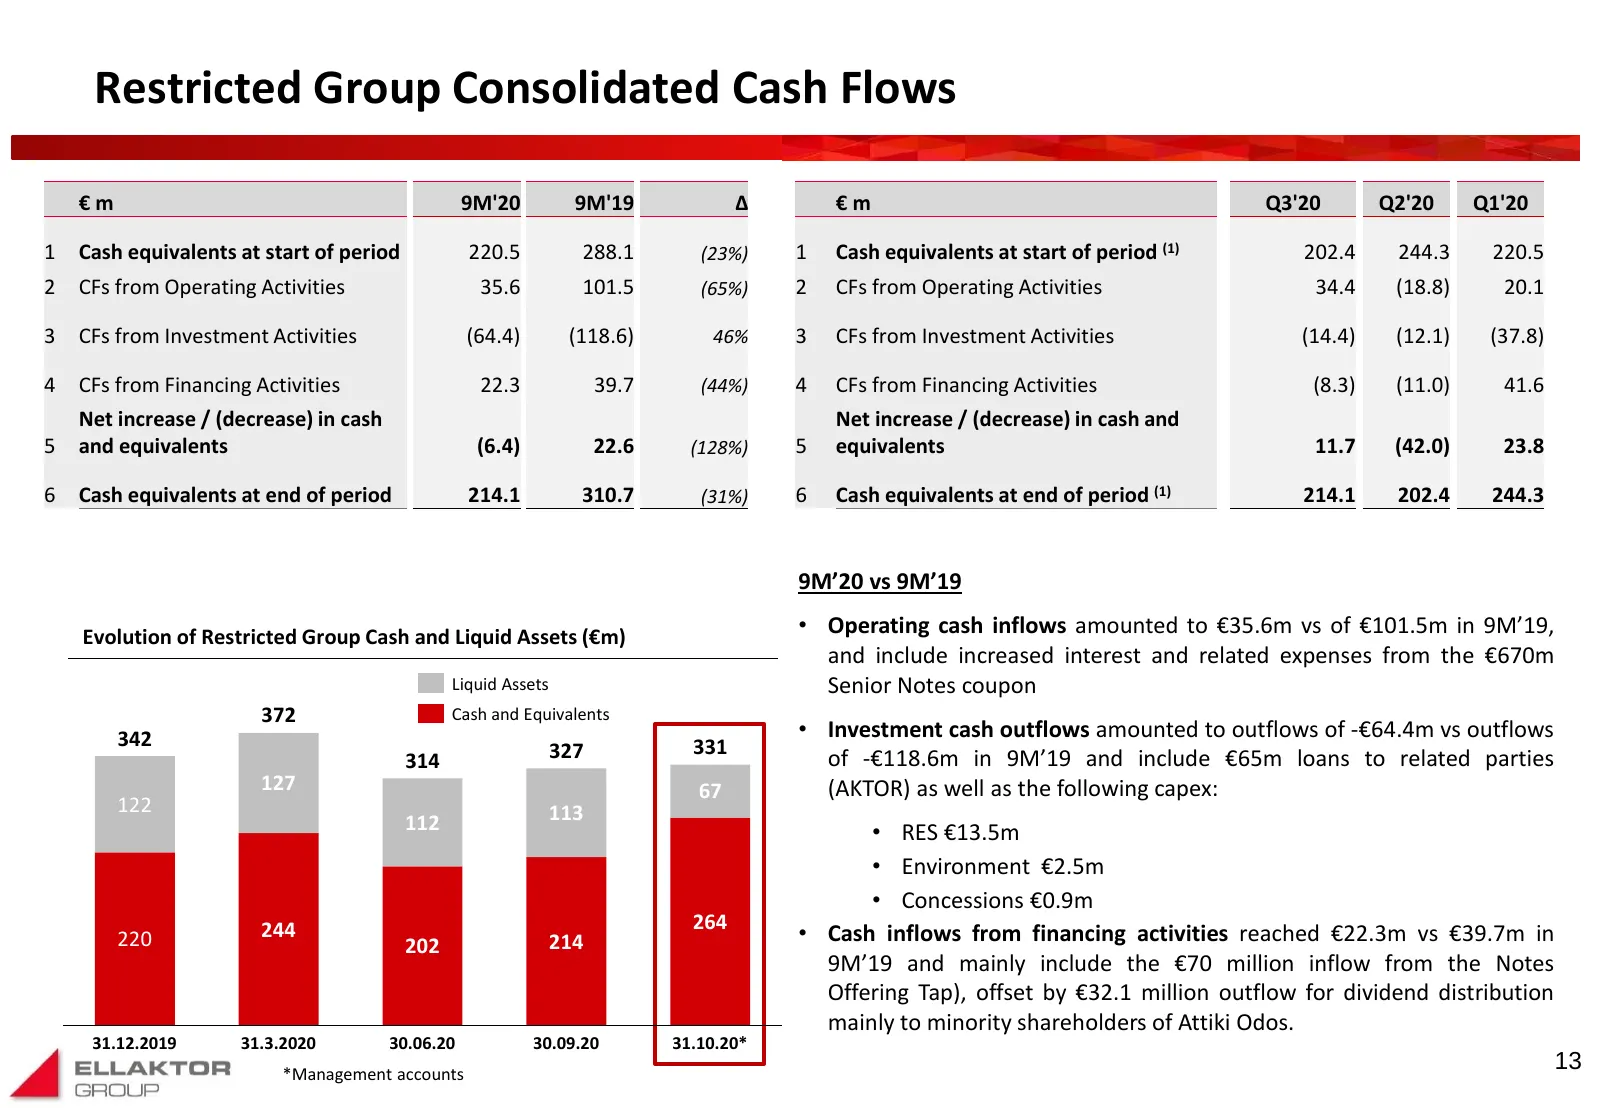
Restricted Group Consolidated Cash Flows €m 9M'20 9M'19 Δ €m Q3'20 Q2'20 Q1'20 1 Cash equivalents at start of period 220.5 288.1 (23%) 1 Cash equivalents at start of period (1) 202.4 244.3 220.5 2 CFs from Operating Activities 35.6 101.5 (65%) 2 CFs from Operating Activities 34.4 (18.8) 20.1 3 CFs f
Slide 15: Content pages
Content pages Business Highlights 3 Consolidated Profit & Loss 9 Consolidated Balance Sheet & Cash Flow 12 Segmental Analysis 16 Appendix 21 Note: All figures refer to Restricted Group 14
Slide 16: Restricted Group Segmental analysis of 9M’20 vs 9M’19 results (€m)
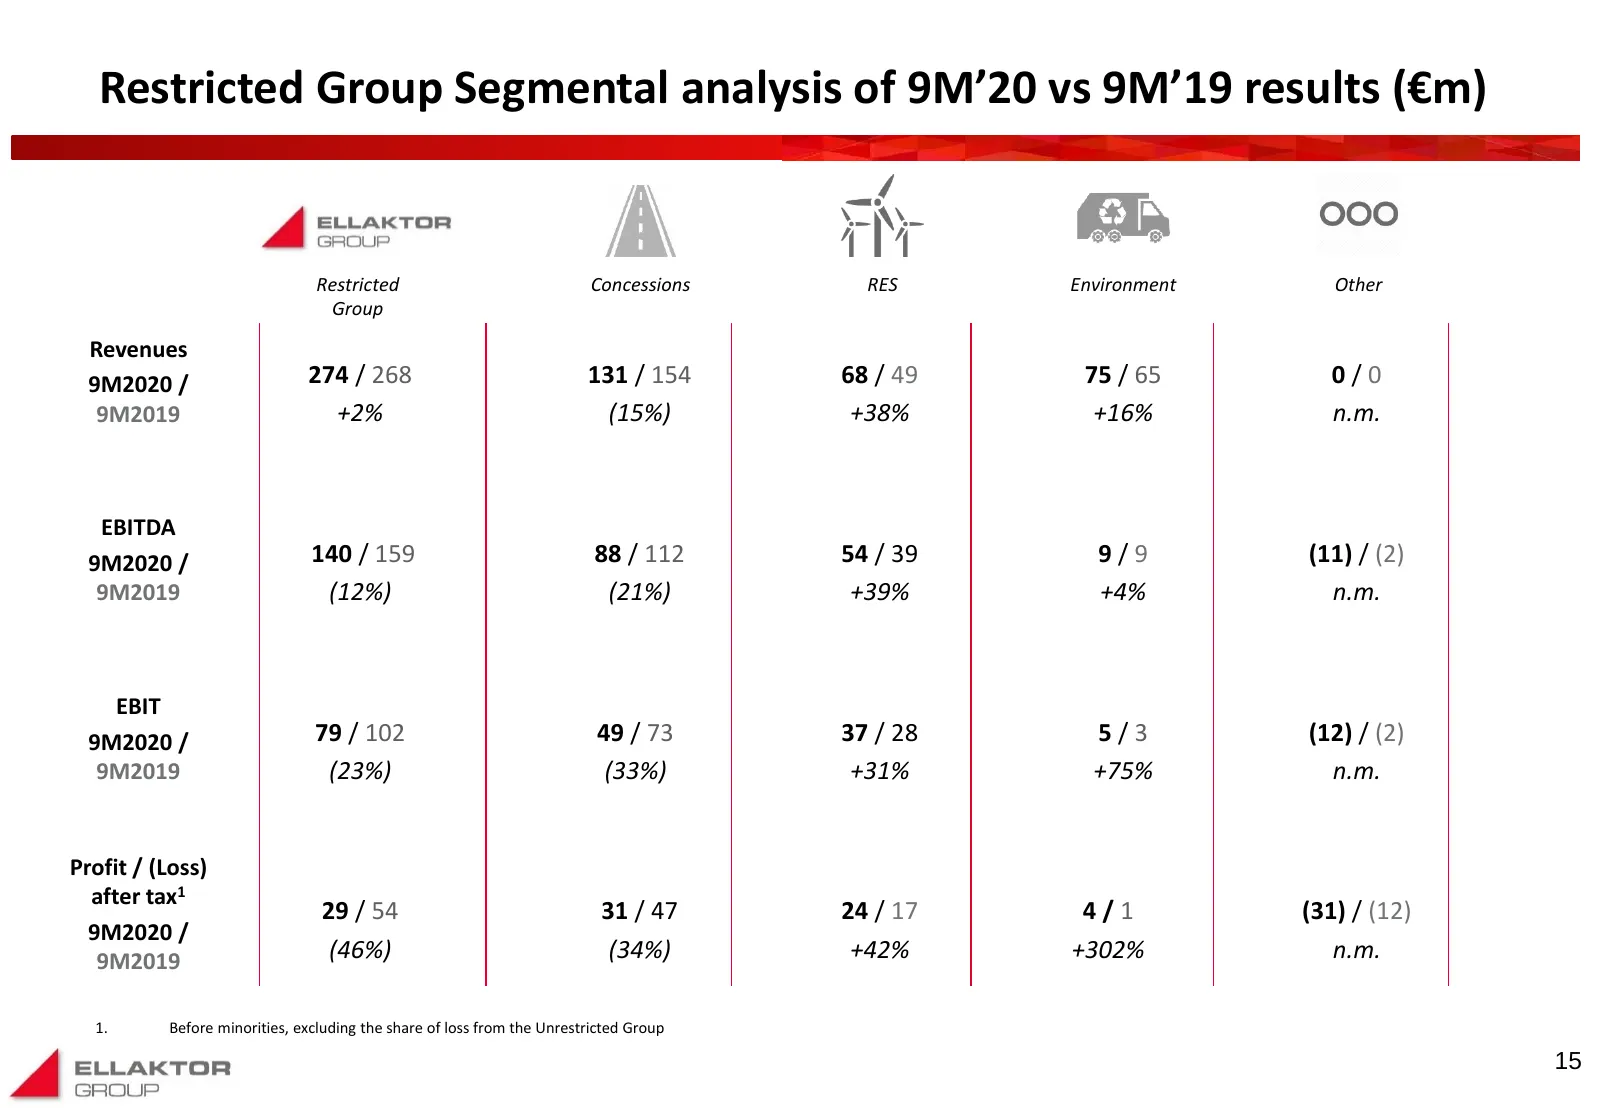
Restricted Group Segmental analysis of 9M’20 vs 9M’19 results (€m) Restricted Concessions RES Environment Other Group Revenues 9M2020 / 274 / 268 131 / 154 68 / 49 75 / 65 0/0 9M2019 +2% (15%) +38% +16% n.m. EBITDA 9M2020 / 140 / 159 88 / 112 54 / 39 9/9 (11) / (2) 9M2019 (12%) (21%) +39% +4% n.m. E
Slide 17: Concessions Highlights
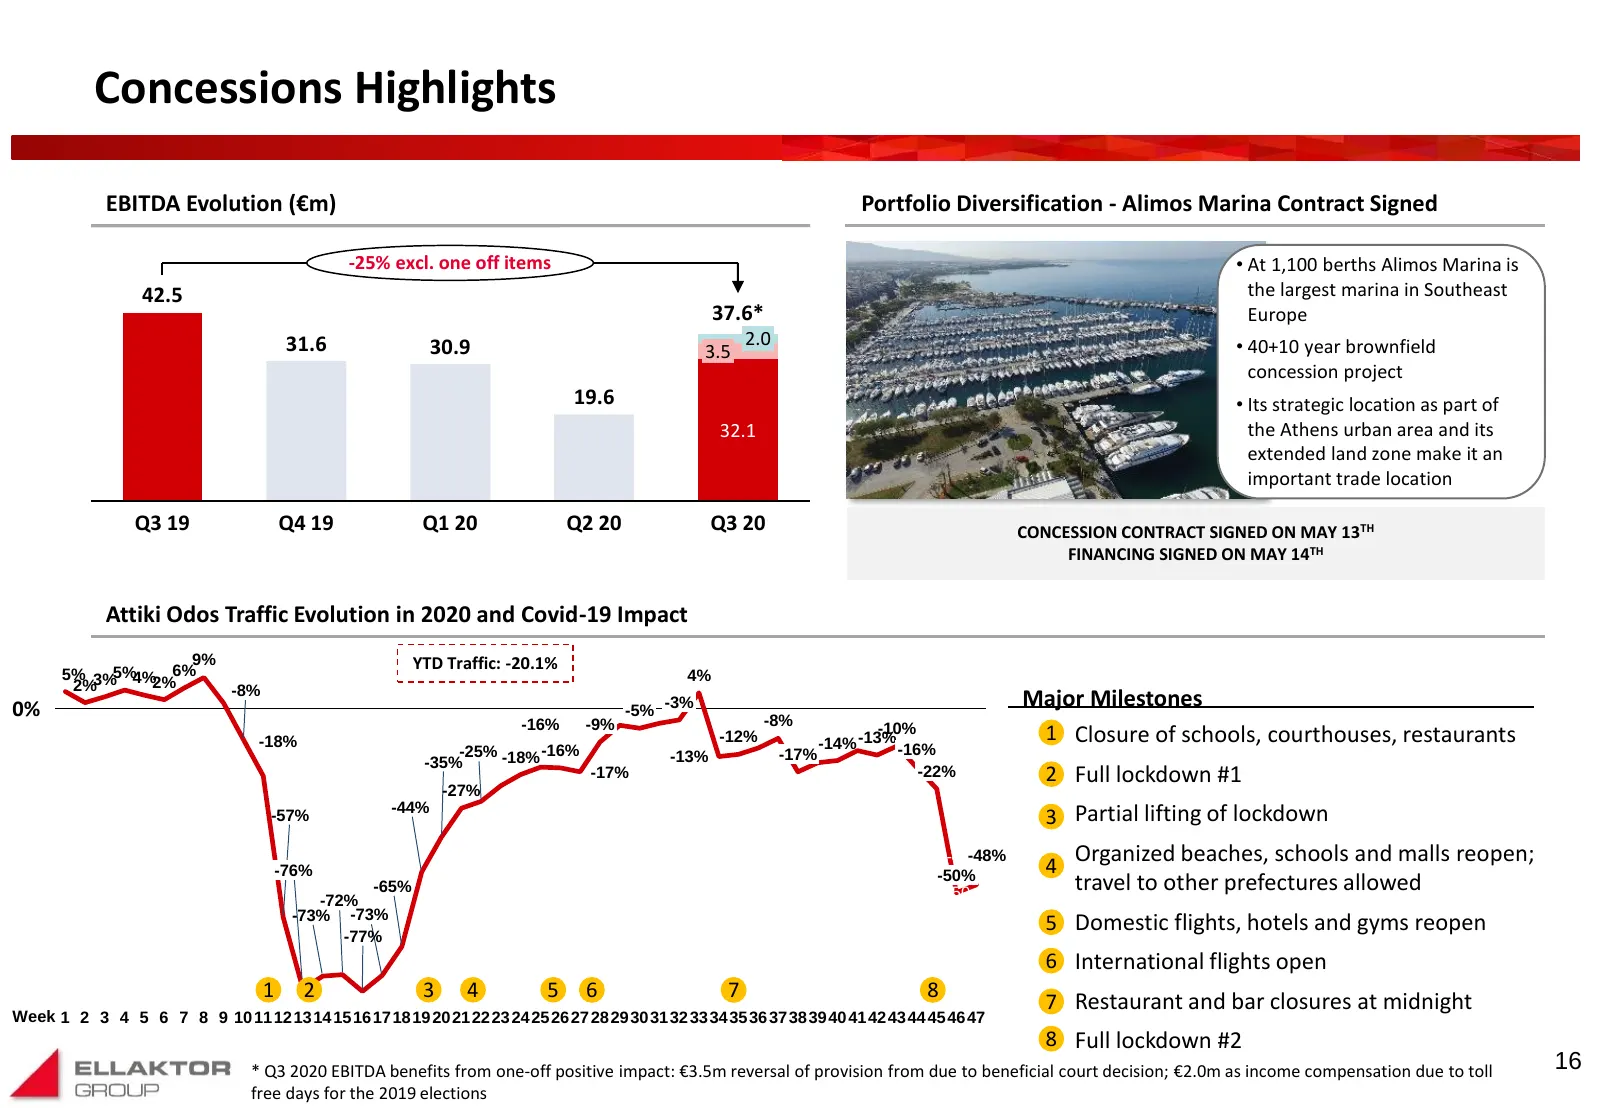
Concessions Highlights EBITDA Evolution (€m) Portfolio Diversification - Alimos Marina Contract Signed -25% excl. one off items • At 1,100 berths Alimos Marina is 42.5 the largest marina in Southeast 37.6* Europe 31.6 30.9 2.0 • 40+10 year brownfield 3.5 concession project 19.6 • Its strategic locat
Slide 18: Renewable Energy Sources highlights
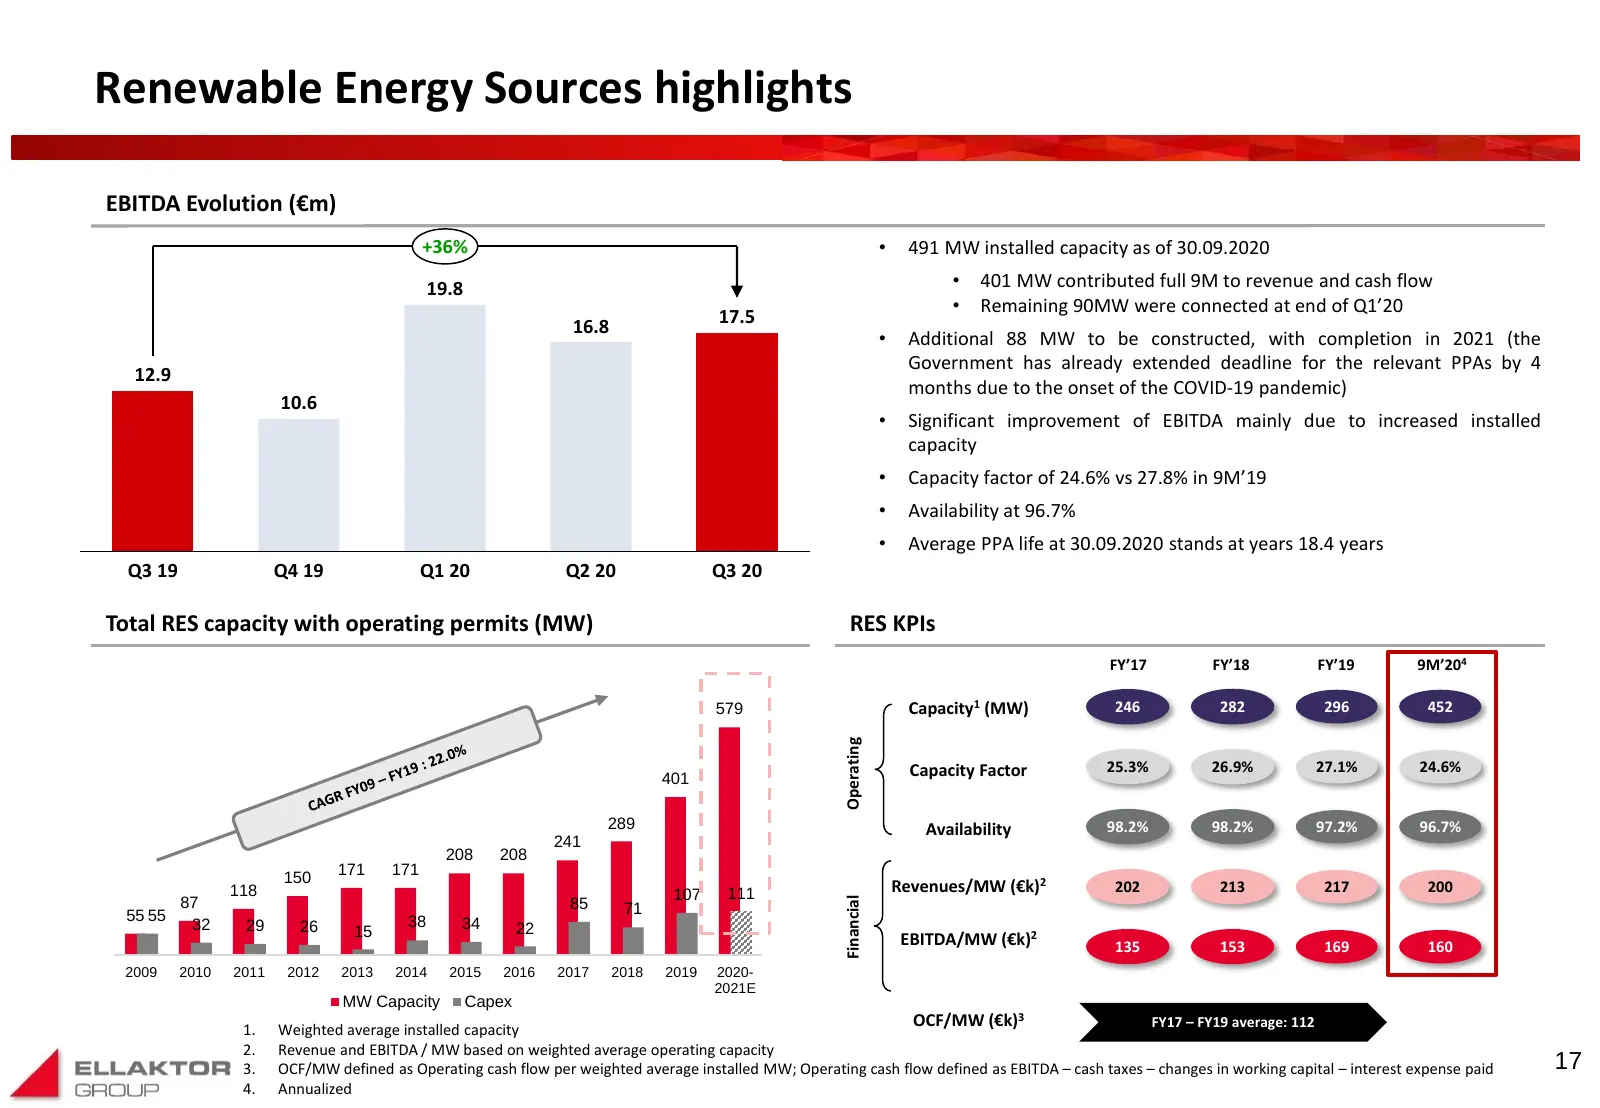
Renewable Energy Sources highlights EBITDA Evolution (€m) +36% • 491 MW installed capacity as of 30.09.2020 19.8 • 401 MW contributed full 9M to revenue and cash flow • Remaining 90MW were connected at end of Q1’20 16.8 17.5 • Additional 88 MW to be constructed, with completion in 2021 (the Governme
Slide 19: Environment Highlights
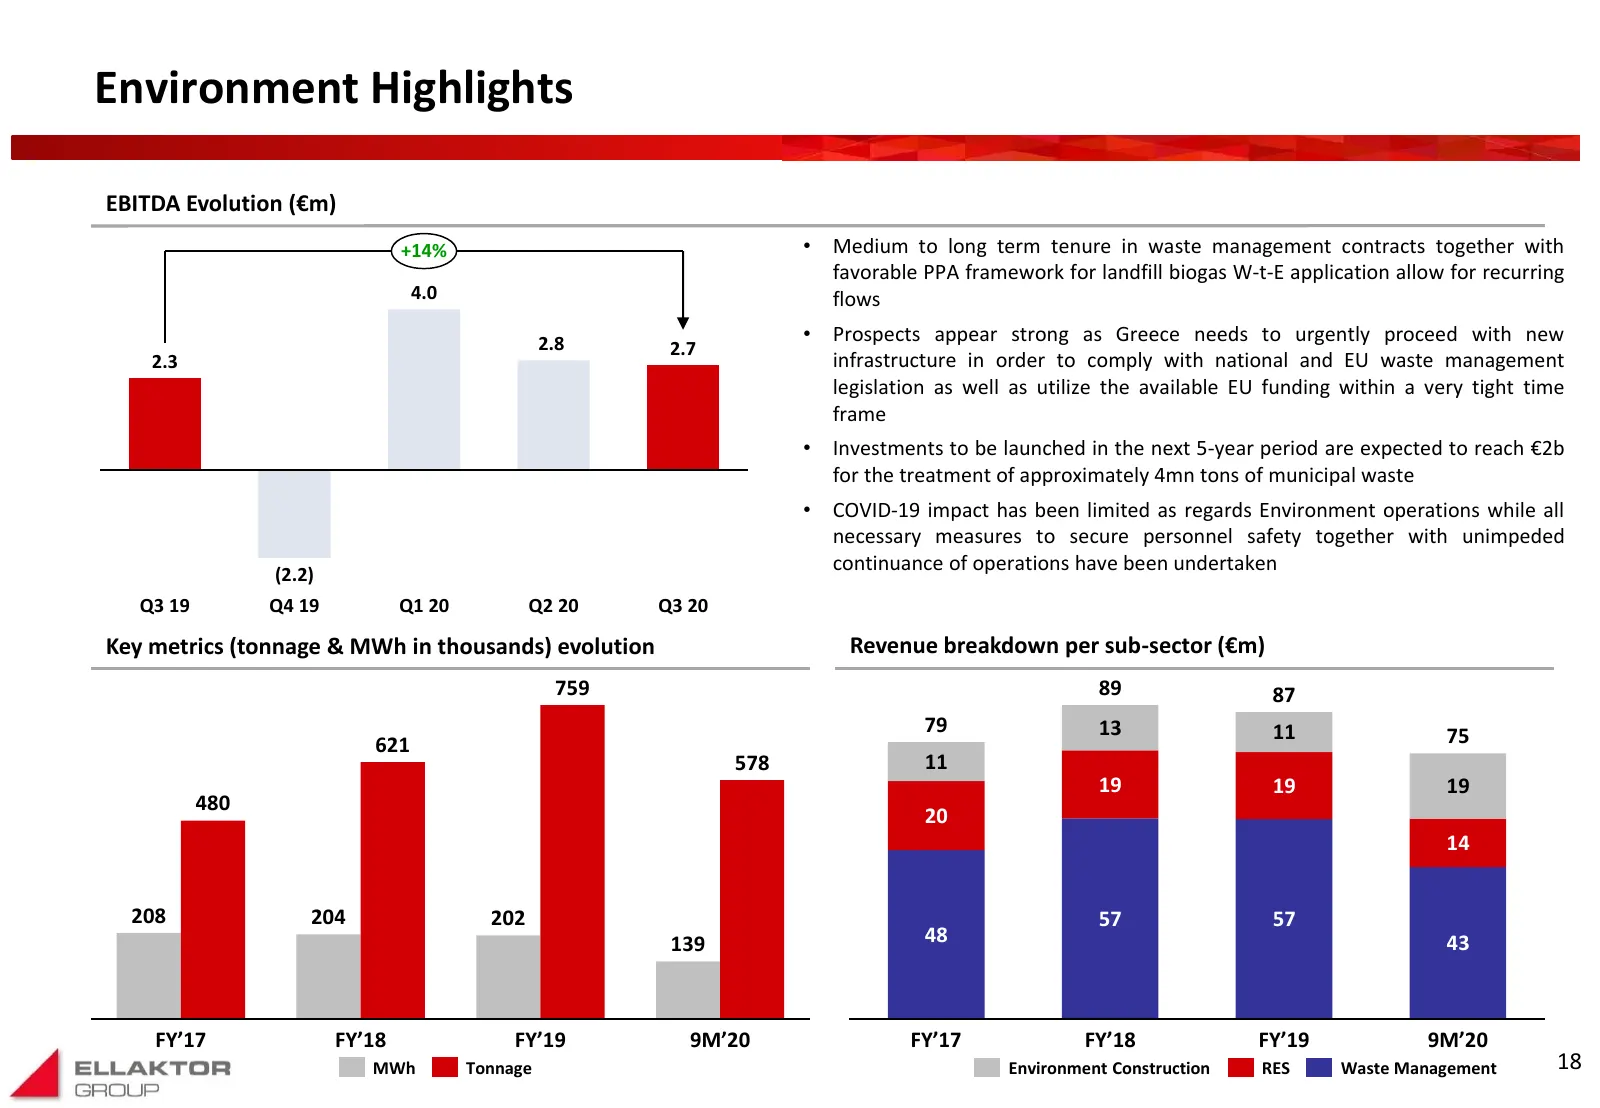
Environment Highlights EBITDA Evolution (€m) +14% • Medium to long term tenure in waste management contracts together with favorable PPA framework for landfill biogas W-t-E application allow for recurring 4.0 flows 2.8 • Prospects appear strong as Greece needs to urgently proceed with new 2.7 2.3 in
Slide 20: Content pages
Content pages Business Highlights 3 Consolidated Profit & Loss 9 Consolidated Balance Sheet & Cash Flow 12 Segmental Analysis 16 Appendix 21 Note: All figures refer to Restricted Group 19
Slide 21: Restricted Group P&L by segment
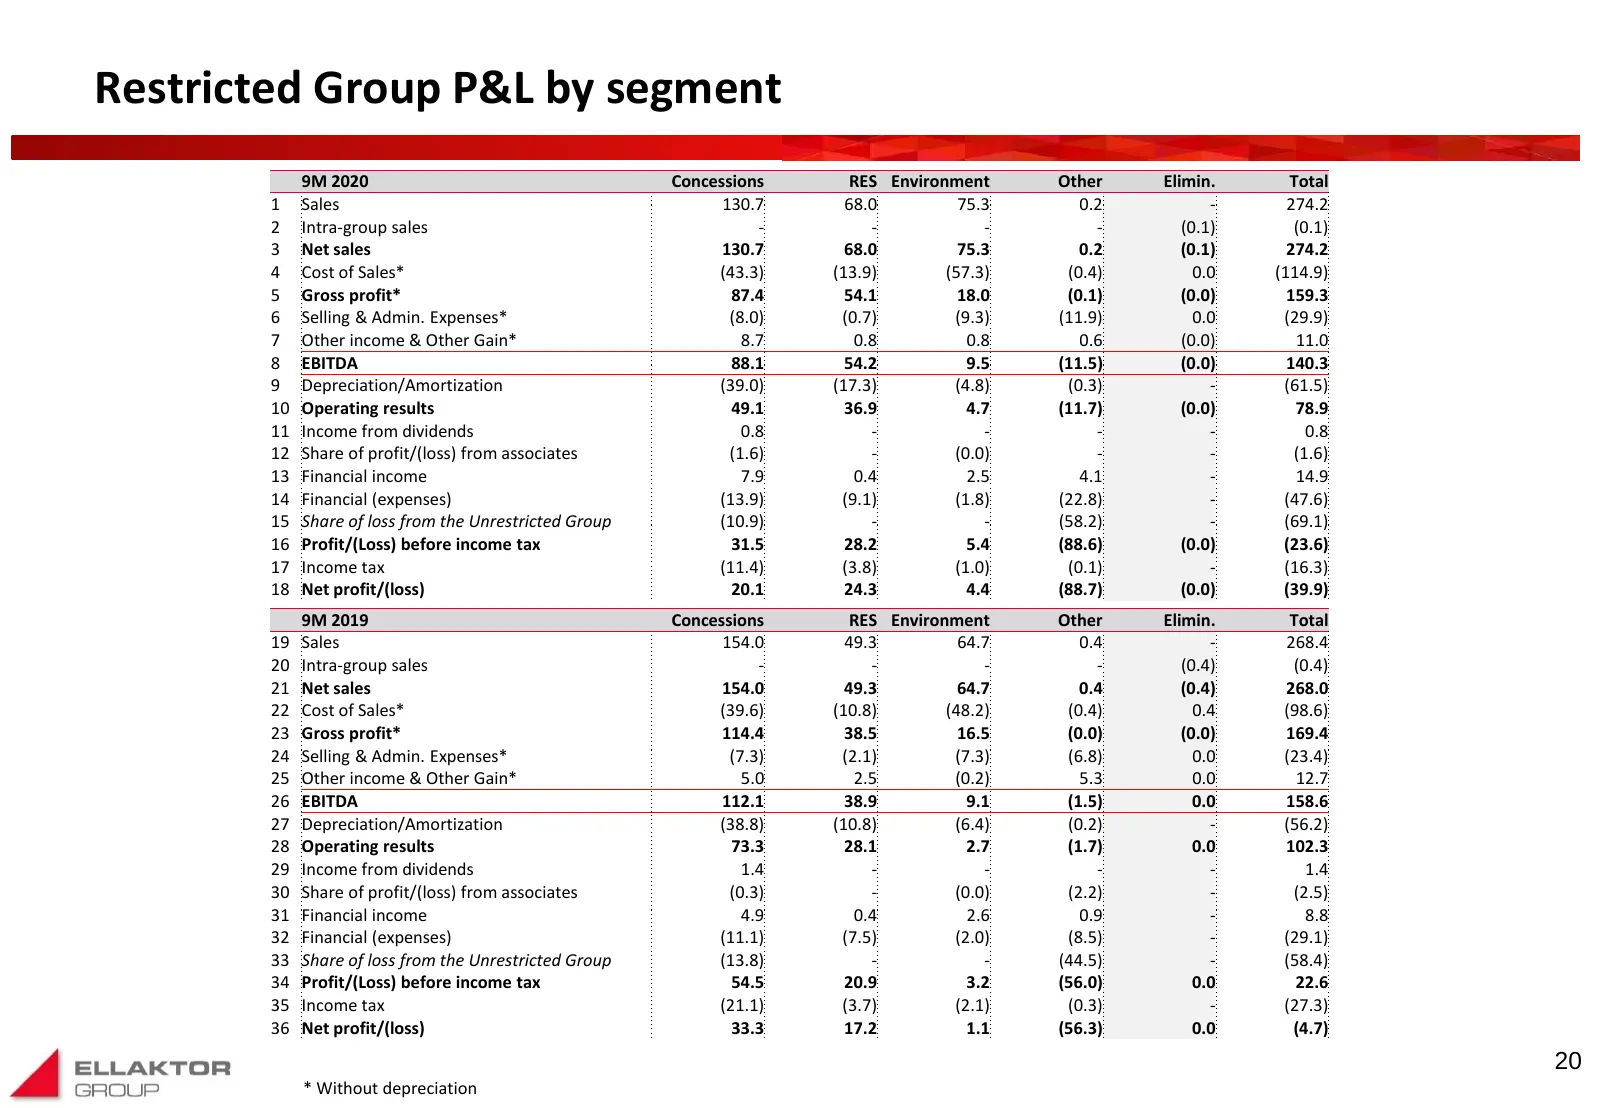
Restricted Group P&L by segment 9M 2020 Concessions RES Environment Other Elimin. Total 1 Sales 130.7 68.0 75.3 0.2 - 274.2 2 Intra-group sales - - - - (0.1) (0.1) 3 Net sales 130.7 68.0 75.3 0.2 (0.1) 274.2 4 Cost of Sales* (43.3) (13.9) (57.3) (0.4) 0.0 (114.9) 5 Gross profit* 87.4 54.1 18.0 (0.1)
Slide 22: Glossary / Alternative Performance Measures
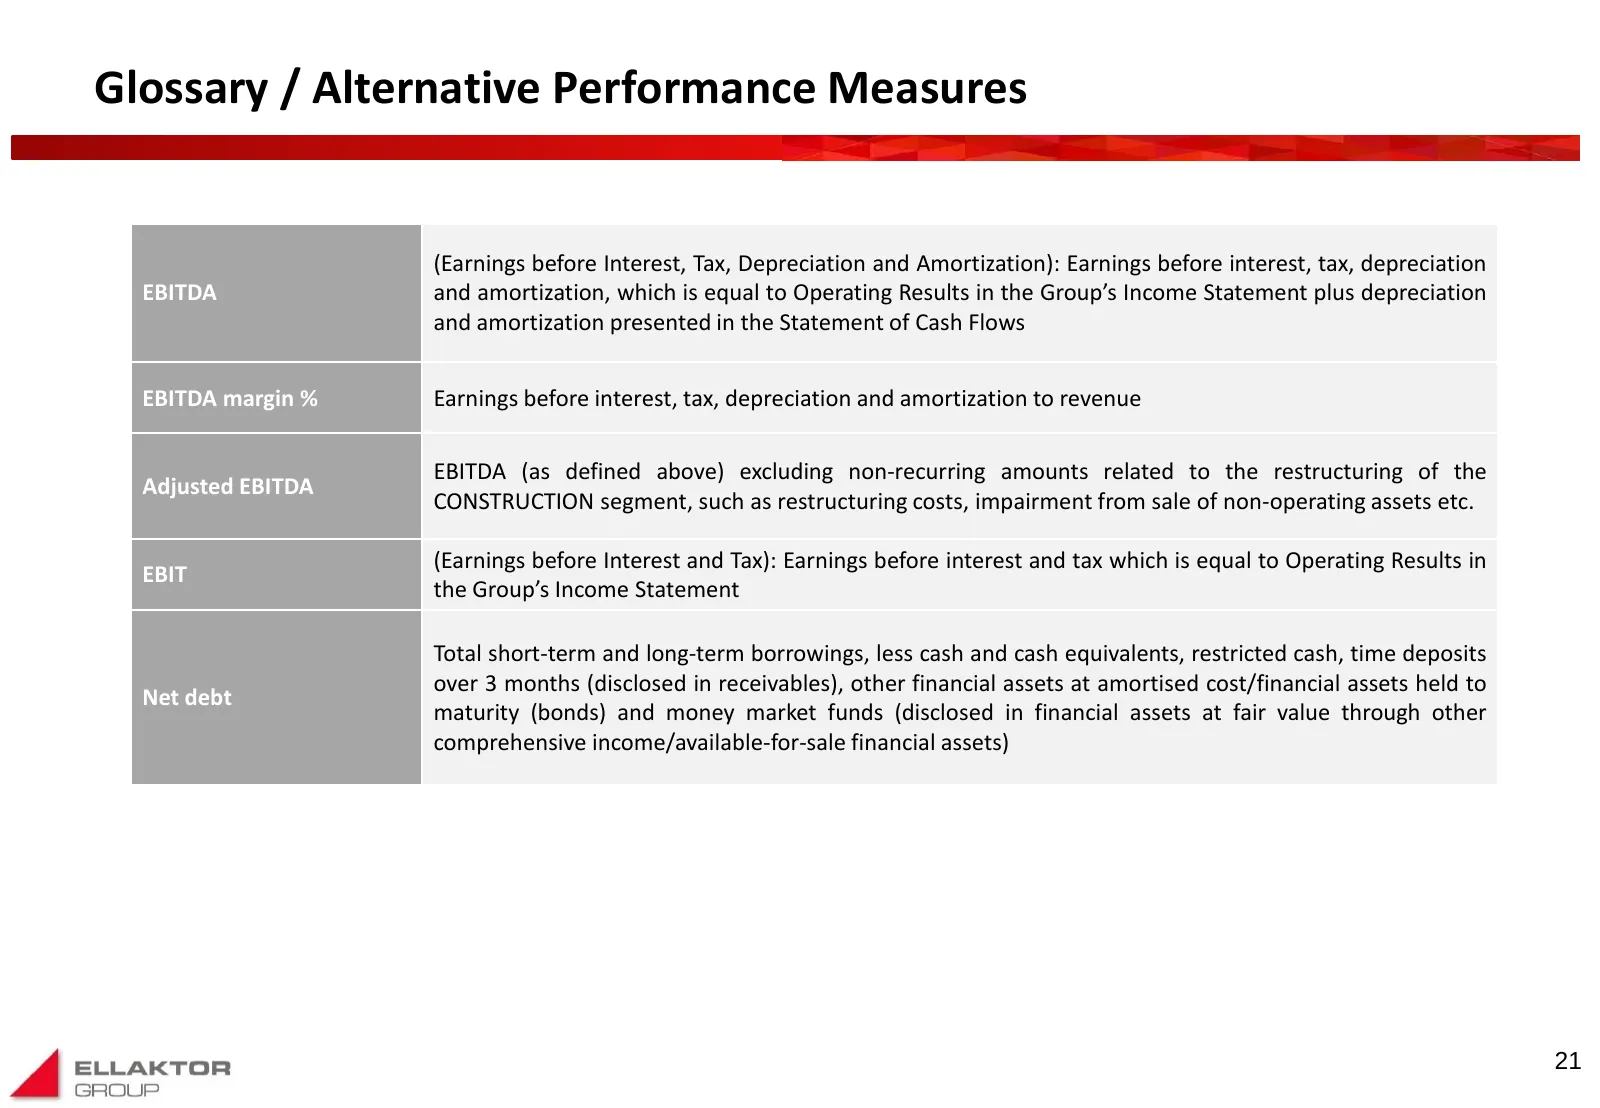
Glossary / Alternative Performance Measures (Earnings before Interest, Tax, Depreciation and Amortization): Earnings before interest, tax, depreciation EBITDA and amortization, which is equal to Operating Results in the Group’s Income Statement plus depreciation and amortization presented in the Sta
Slide 23: Contact details
Contact details George Poulopoulos Group CFO e-mail: gpoulopoulos@ellaktor.com Dimitrios Koutsoukos Director, Business Planning and Investor Relations e-mail: dkoutsoukos@ellaktor.com Investor Relations Desk e-mail: ir@ellaktor.com ELLAKTOR S.A. 25, Ermou St., 145 64 Nea Kifissia, Athens, Greece Tel
Source: Internet Archive copy of ellaktor.com
More decks from Ellaktor SA
 FY2025 Earnings Presentation23 slides · Apr 17, 2026
 FY2024 Earnings Presentation30 slides · Apr 24, 2025
 H1 2024 Earnings Presentation30 slides · Sep 12, 2024
 FY2023 Earnings Presentation32 slides · Apr 18, 2024
 9M 2023 Earnings Presentation31 slides · Nov 23, 2023
 9M 2023 Earnings Presentation48 slides · November 2023