Rehabcare — Q1 2009 Earnings Presentation
20 slides from Rehabcare's earnings presentation, May 12, 2009

Slide 1: Investor Presentation First Quarter 2009
Exhibit 99 Investor Presentation First Quarter 2009
Slide 2: RehabCare at a glance: Operating divisions
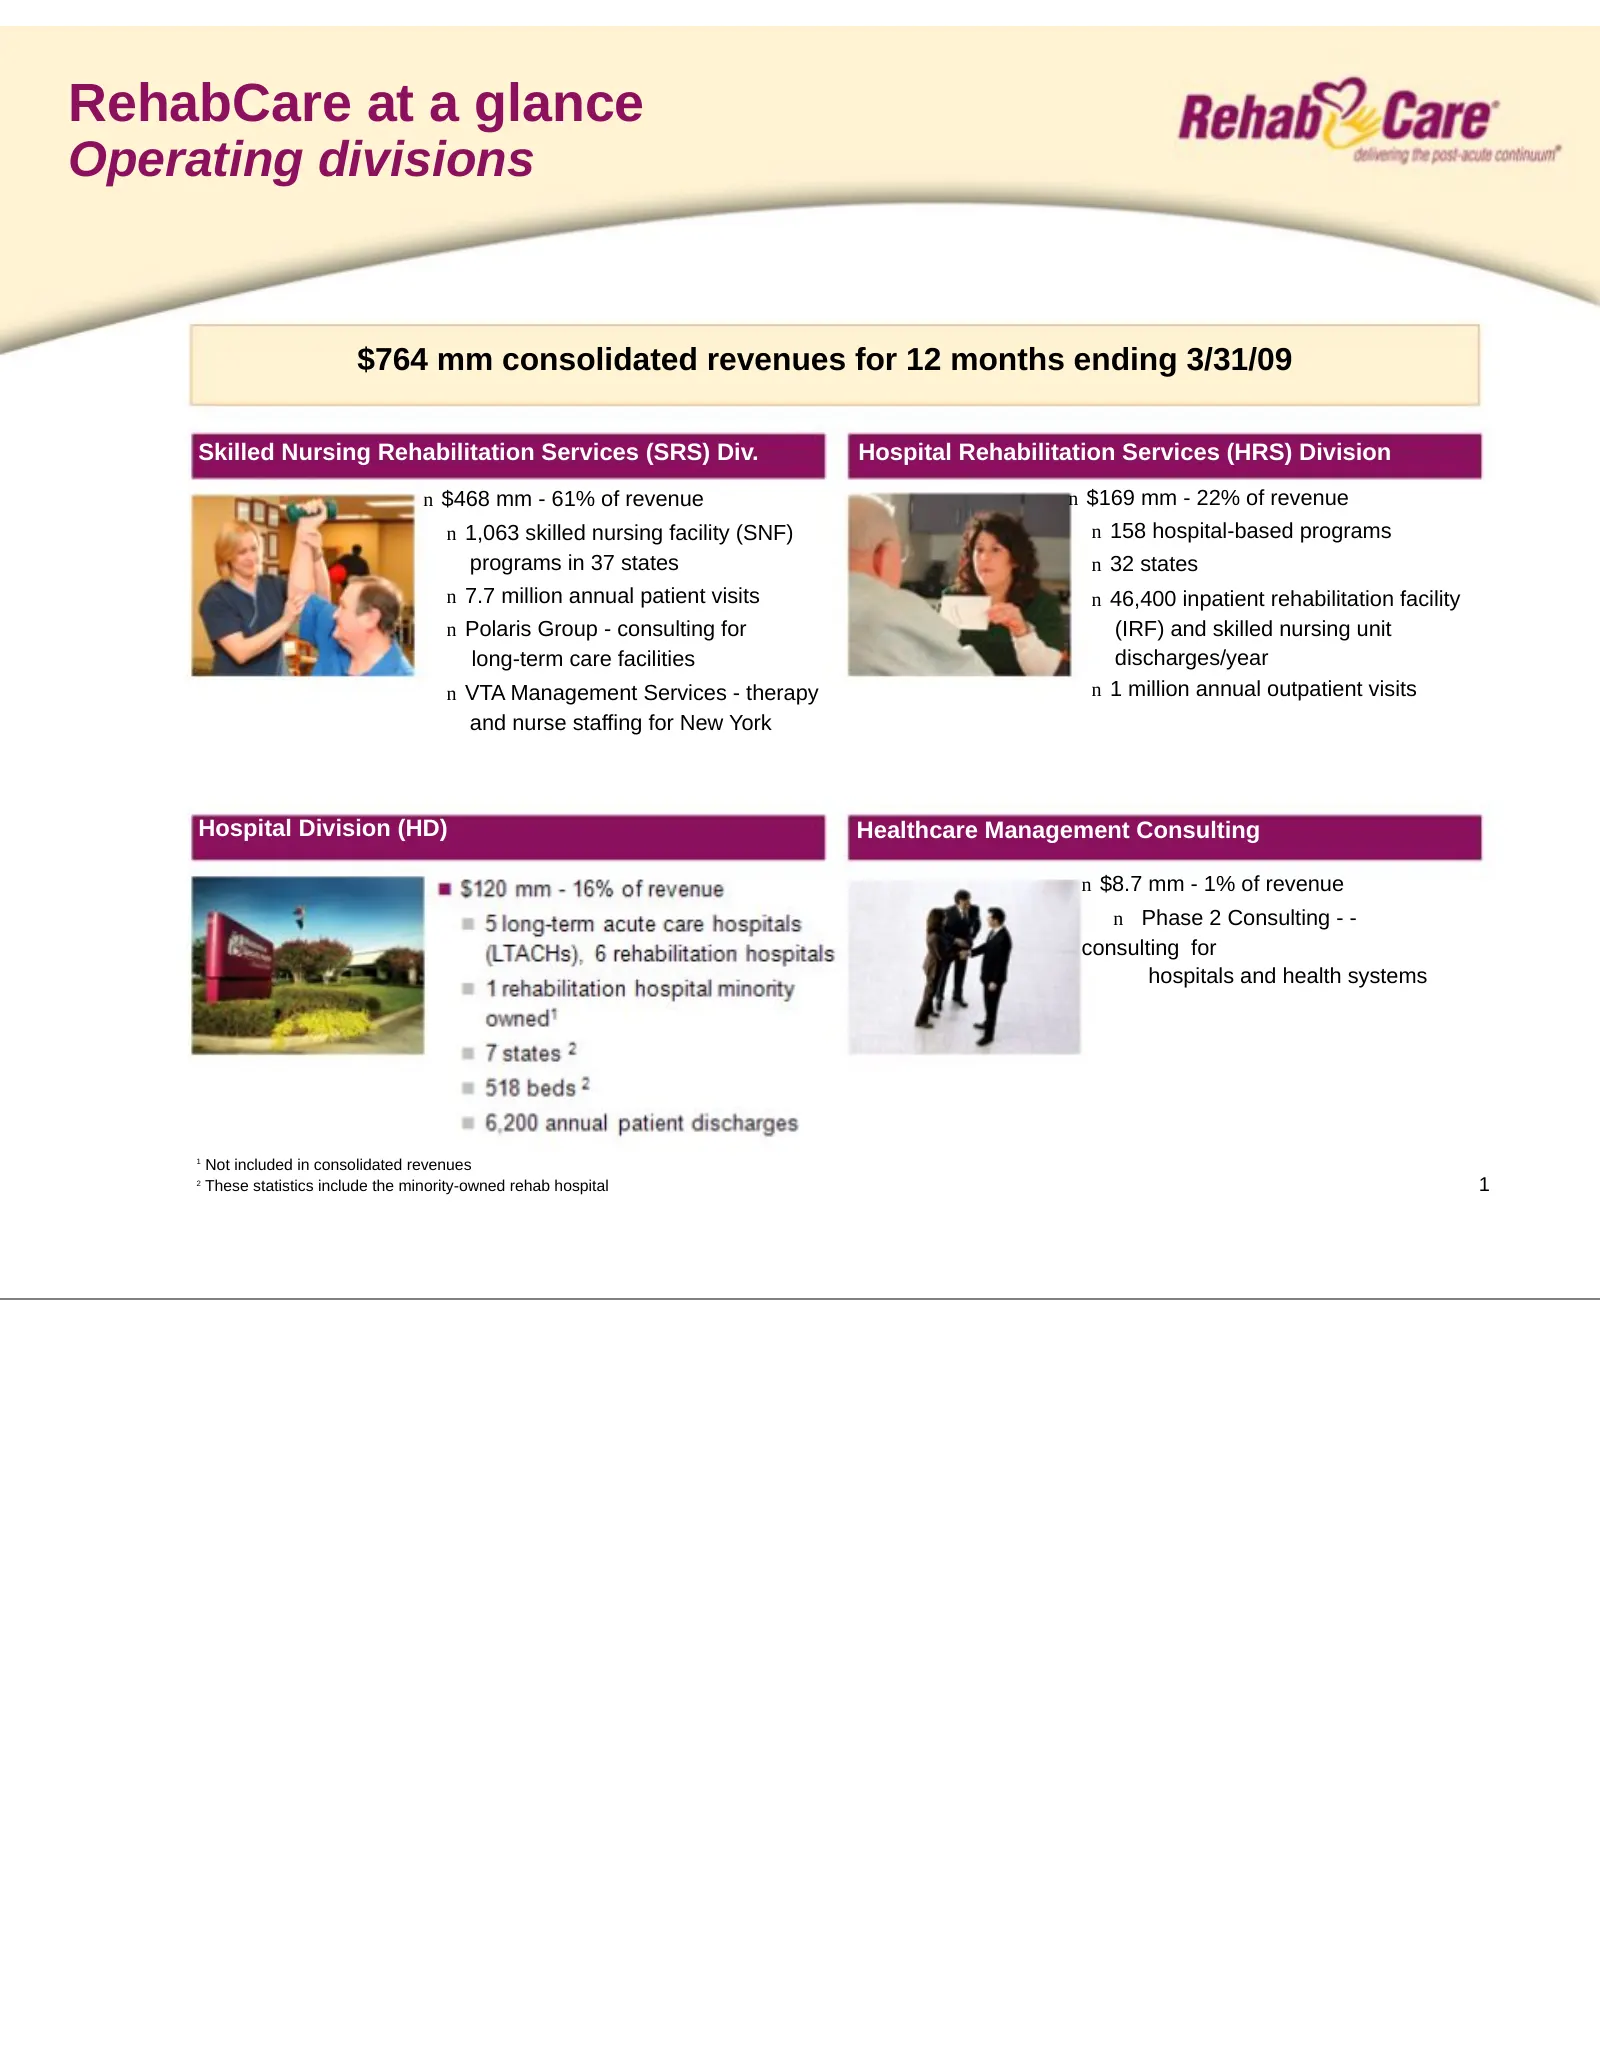
RehabCare at a glance Operating divisions $764 mm consolidated revenues for 12 months ending 3/31/09 Skilled Nursing Rehabilitation Services (SRS) Div. Hospital Rehabilitation Services (HRS) Division n $468 mm - 61% of revenue n $169 mm - 22% of revenue n 1,063 skilled nursing facility (SNF) n 158 h
Slide 3: RehabCare at a glance: The back door to acute care providers
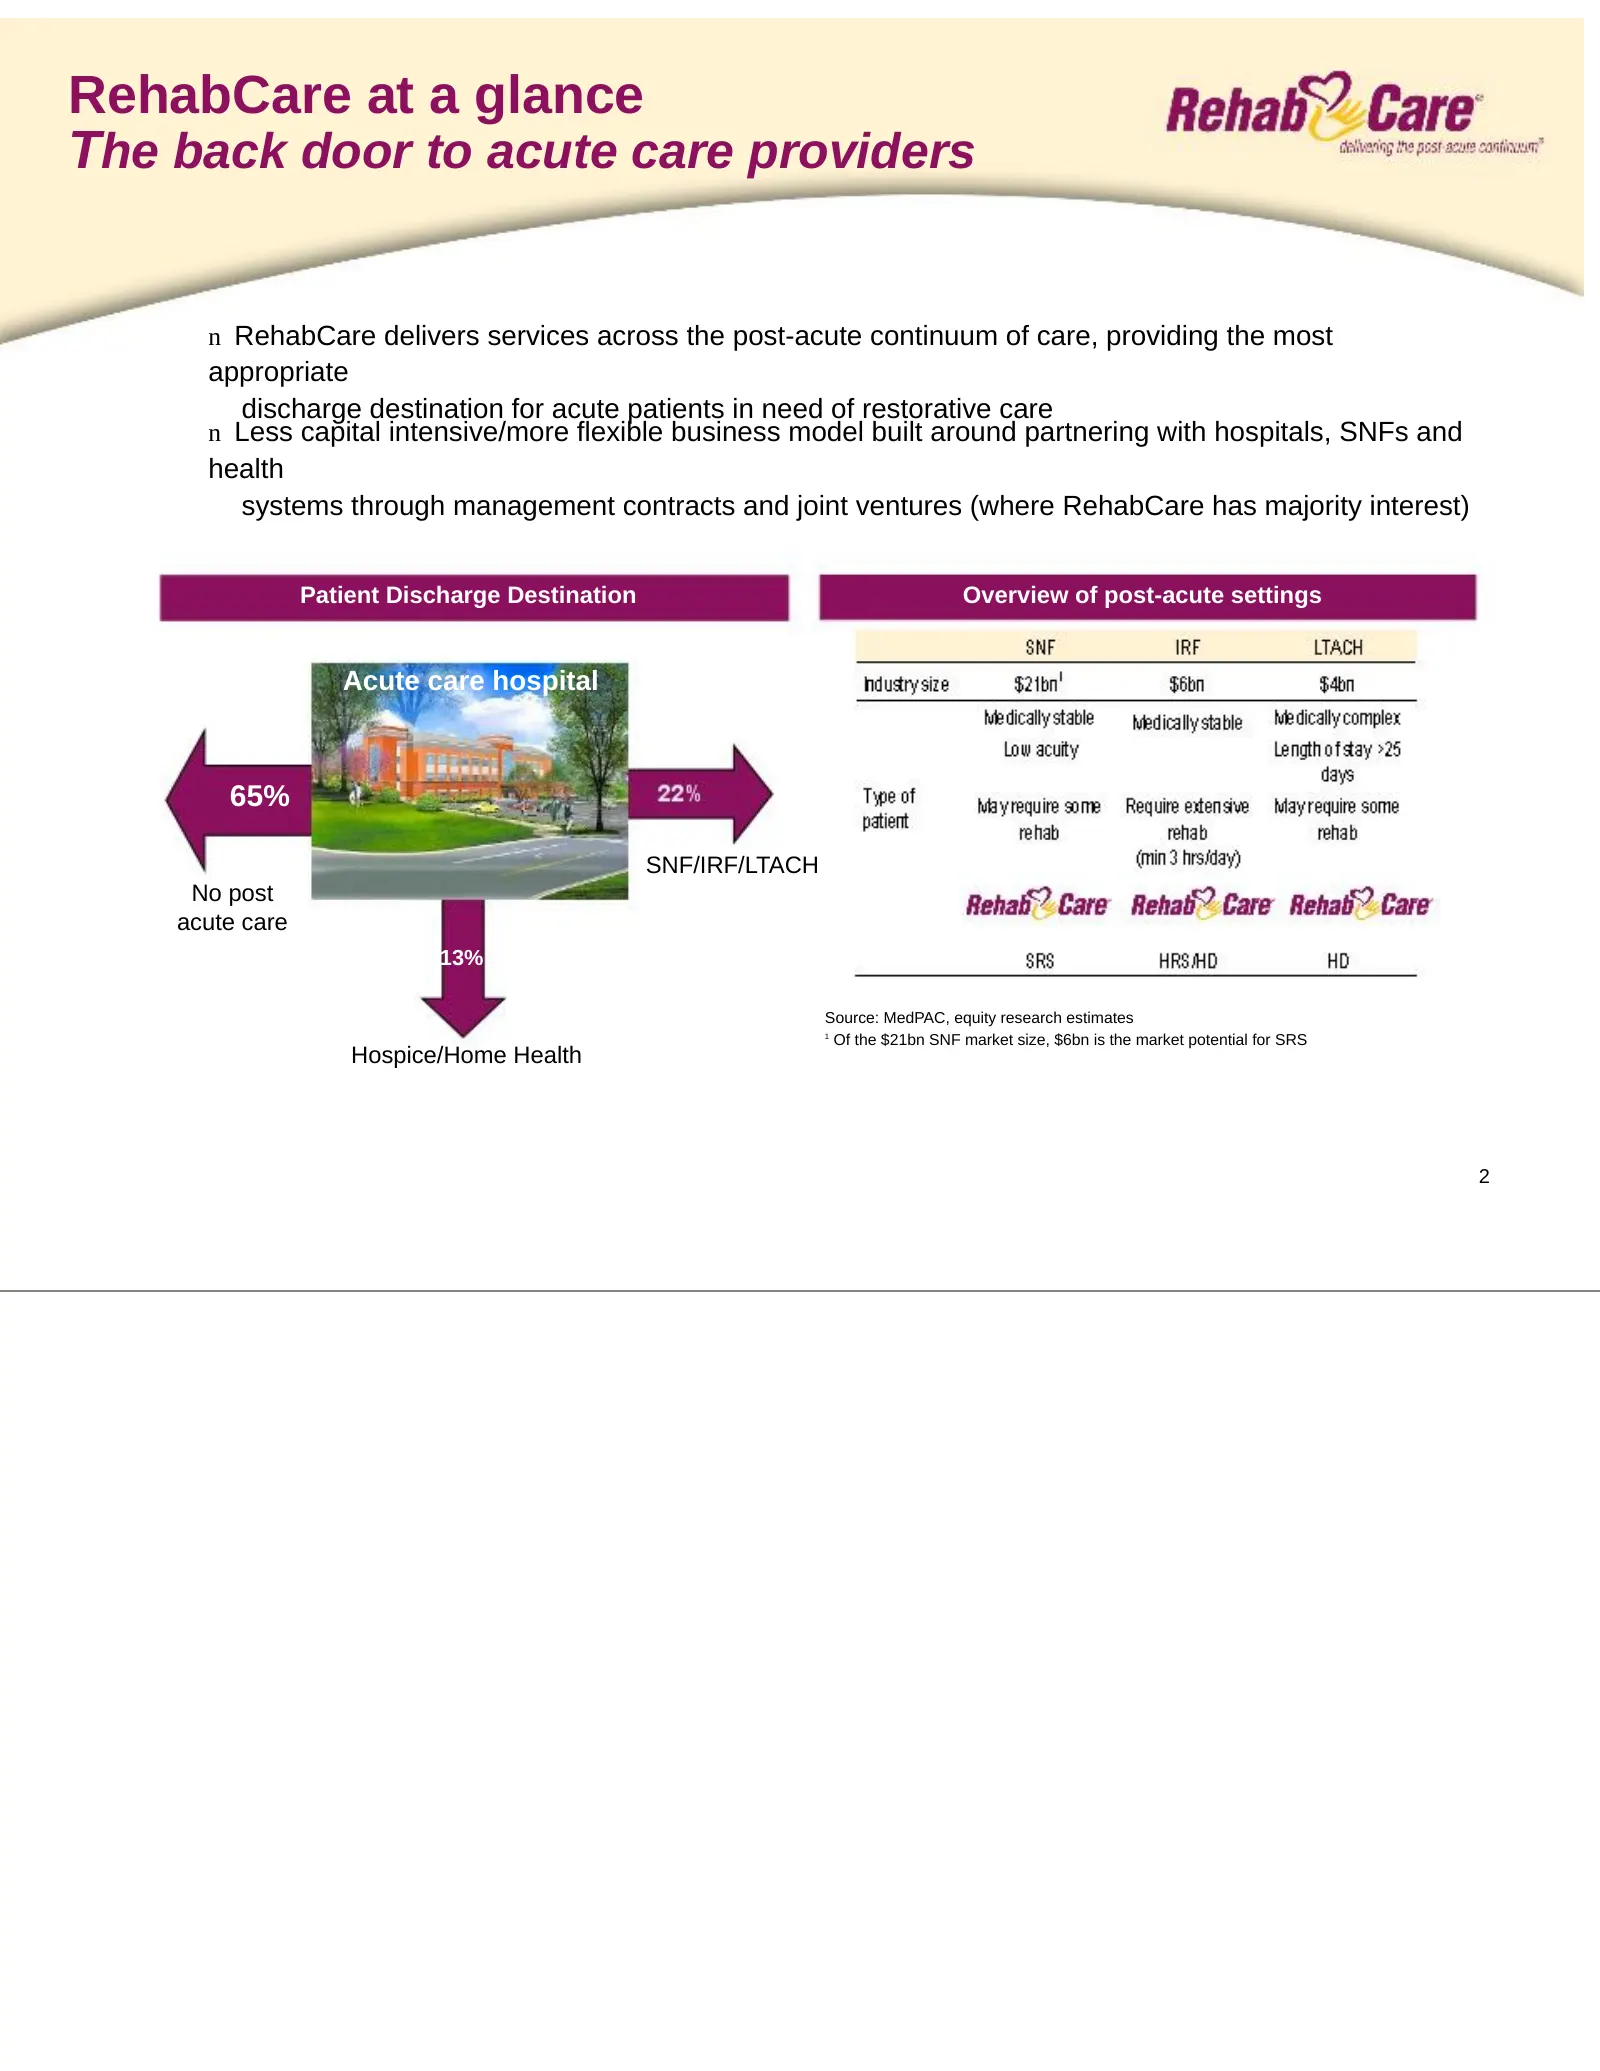
RehabCare at a glance The back door to acute care providers n RehabCare delivers services across the post-acute continuum of care, providing the most appropriate discharge destination for acute patients in need of restorative care n Less capital intensive/more flexible business model built around pa
Slide 4: Skilled Nursing Rehabilitation Services Division overview
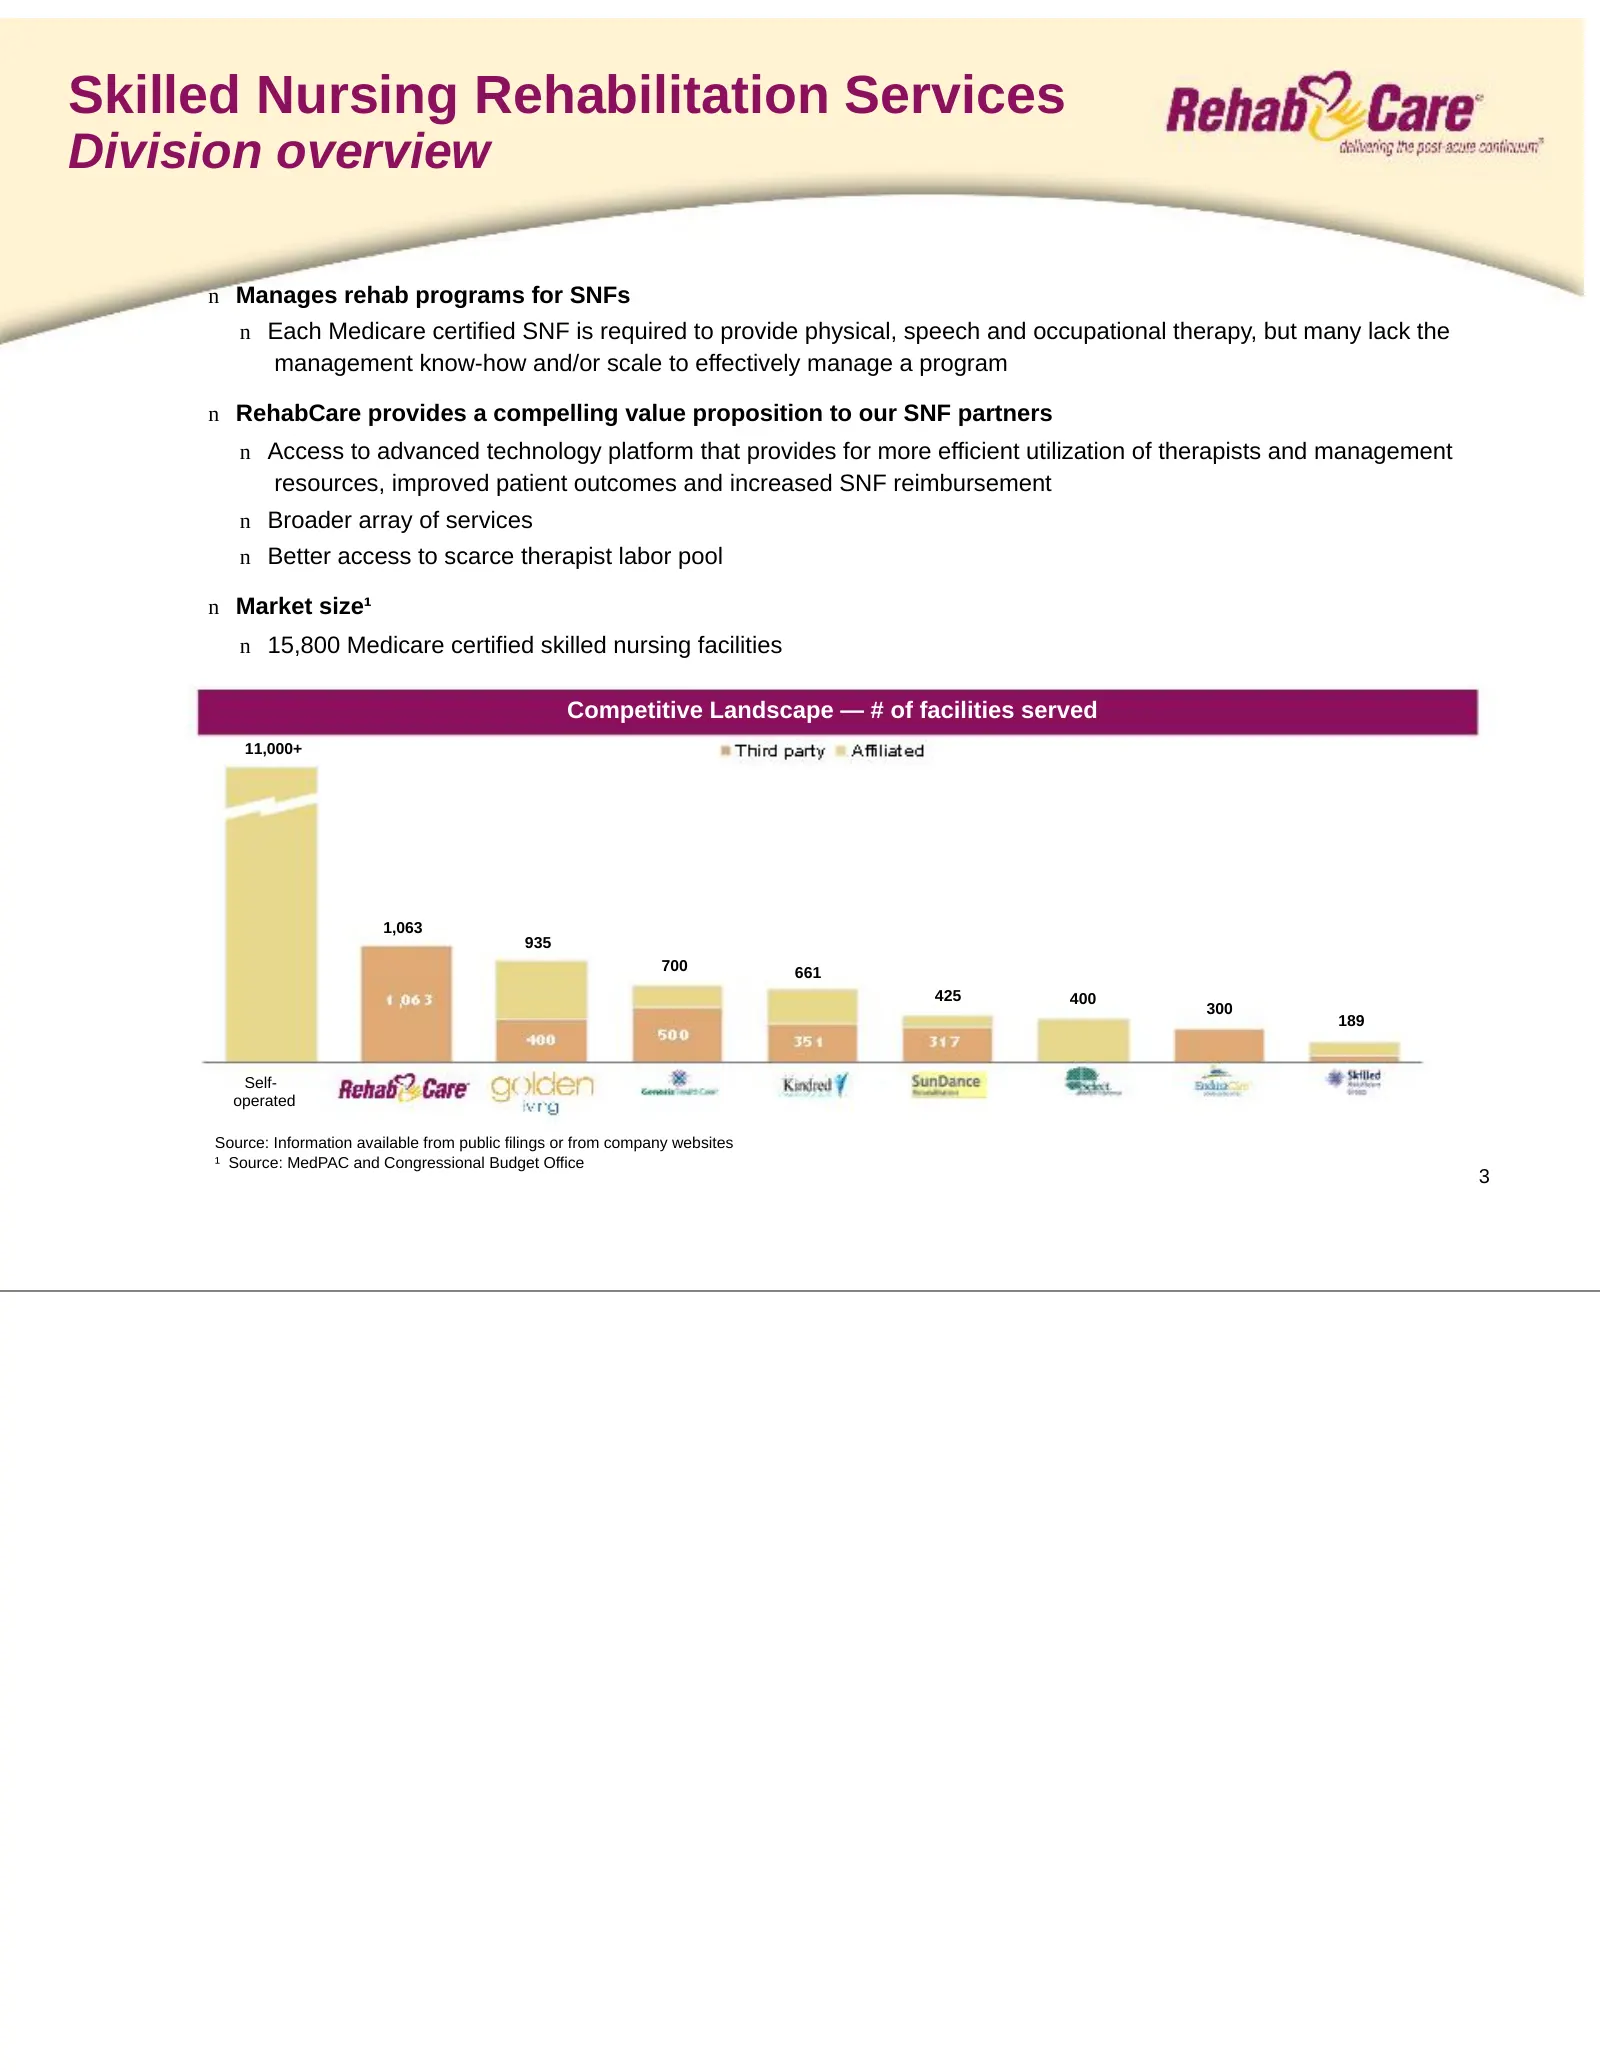
Skilled Nursing Rehabilitation Services Division overview n Manages rehab programs for SNFs n Each Medicare certified SNF is required to provide physical, speech and occupational therapy, but many lack the management know-how and/or scale to effectively manage a program n RehabCare provides a compel
Slide 5: Skilled Nursing Rehabilitation Services Performance
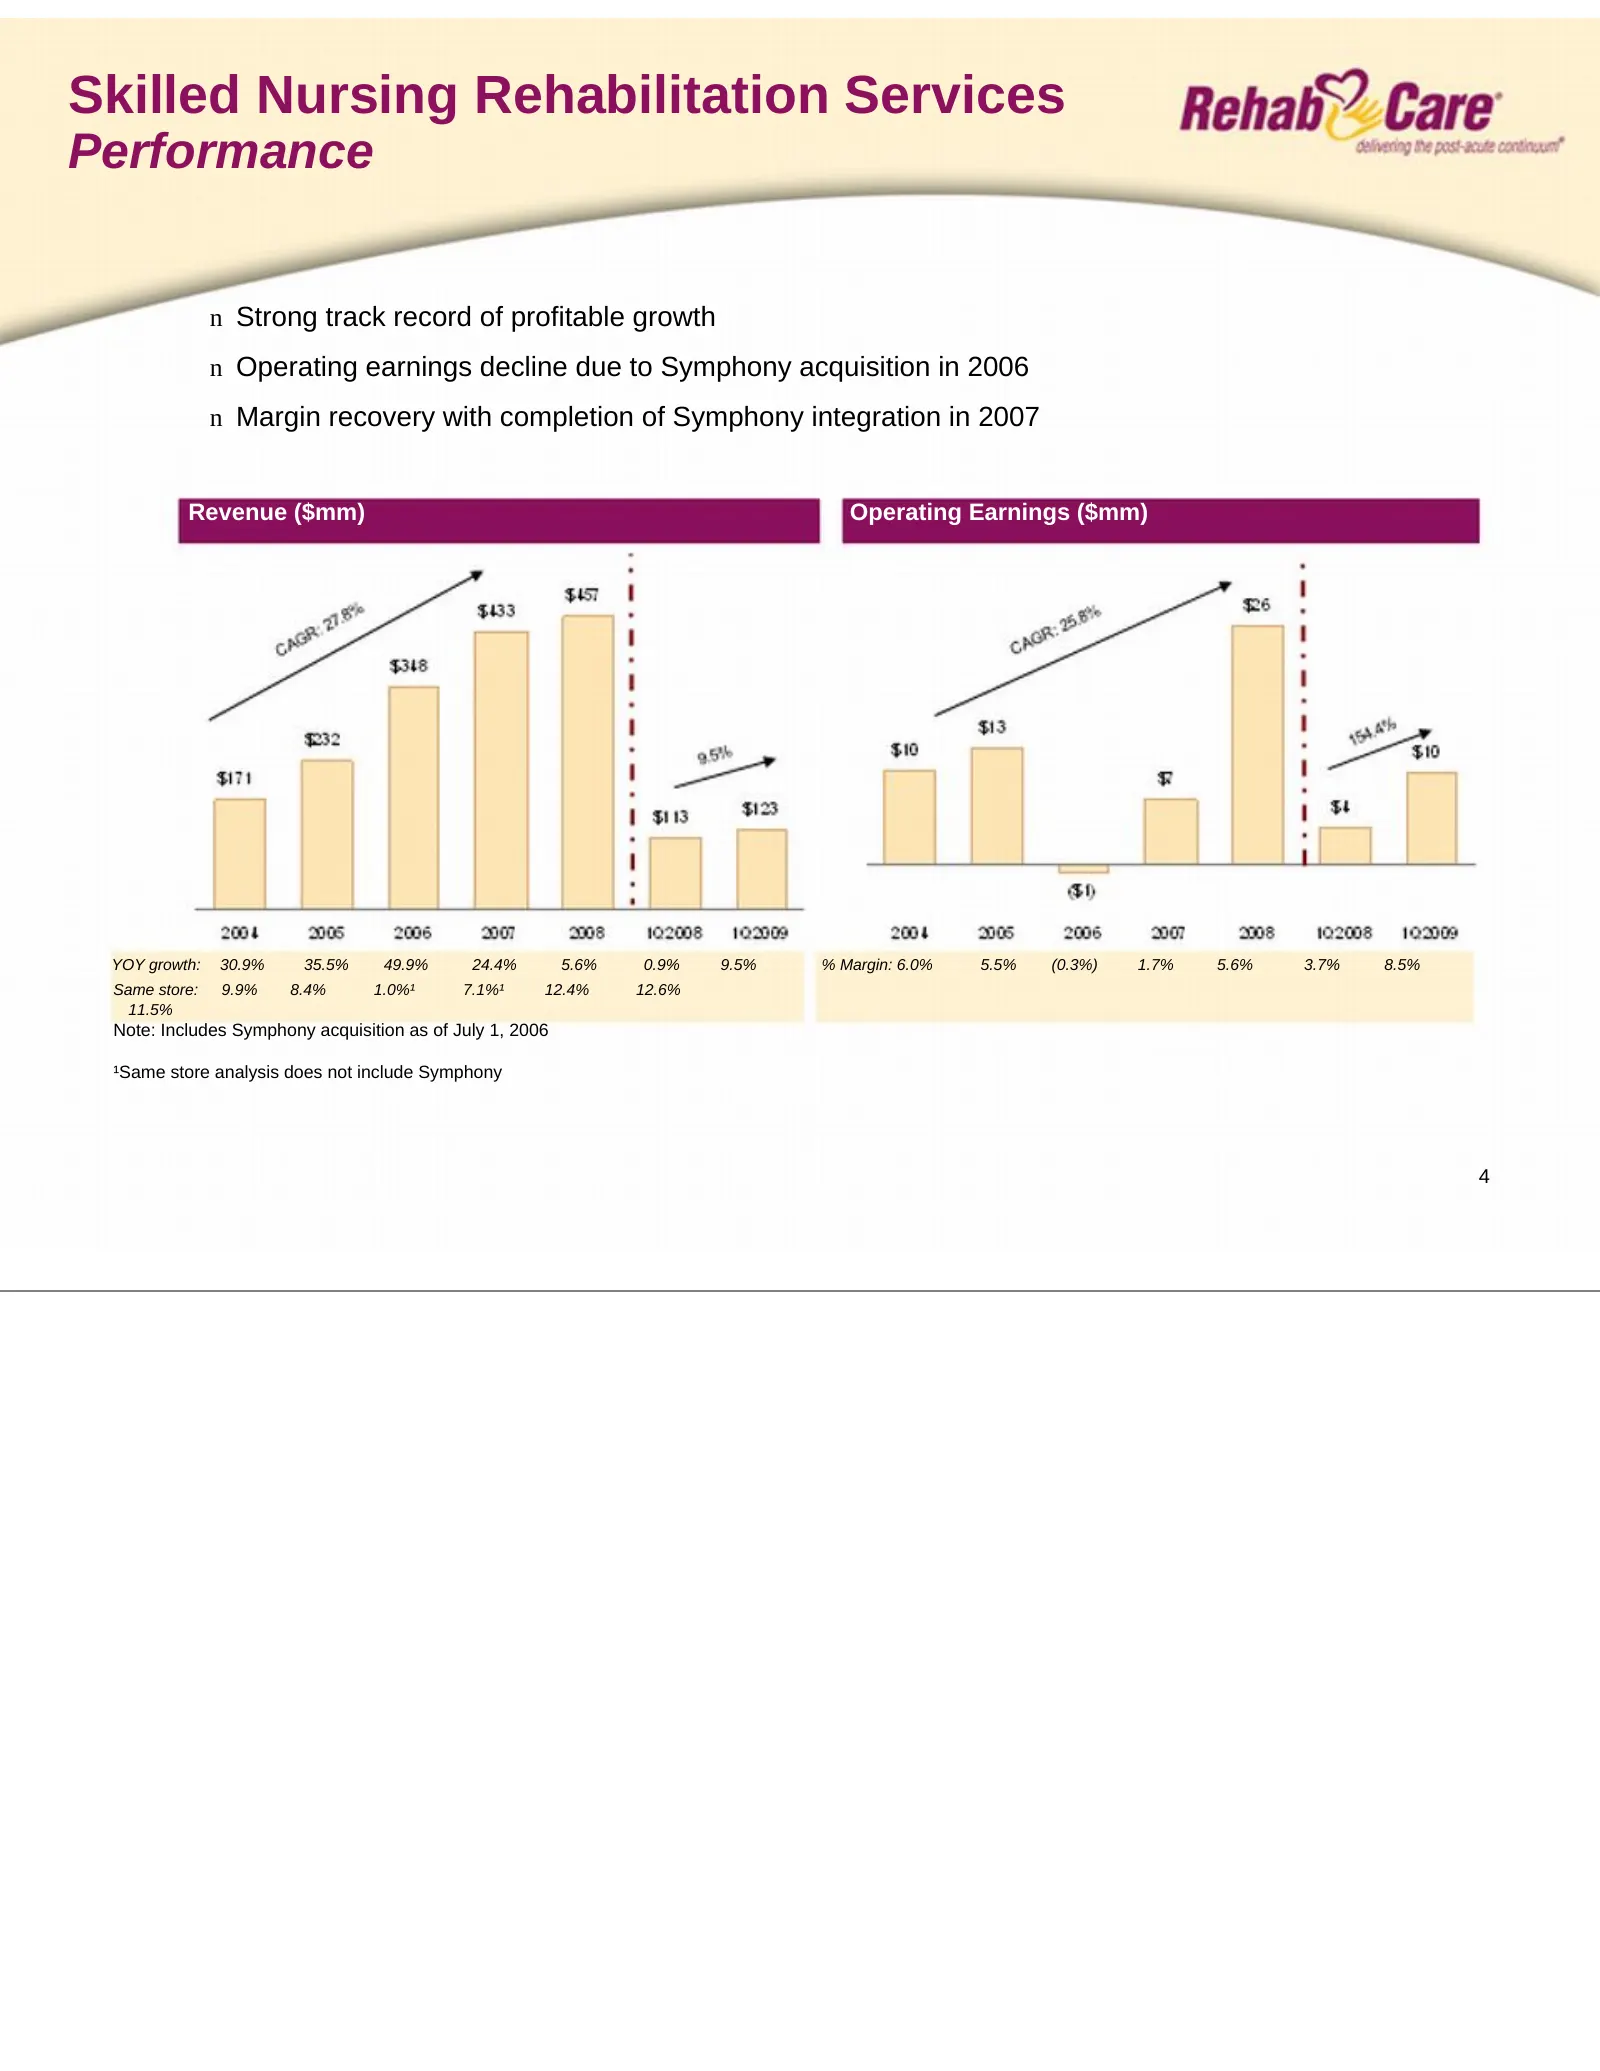
Skilled Nursing Rehabilitation Services Performance n Strong track record of profitable growth n Operating earnings decline due to Symphony acquisition in 2006 n Margin recovery with completion of Symphony integration in 2007 Revenue ($mm) Operating Earnings ($mm) YOY growth: 30.9% 35.5% 49.9% 24.4%
Slide 6: Hospital Rehabilitation Services Division overview
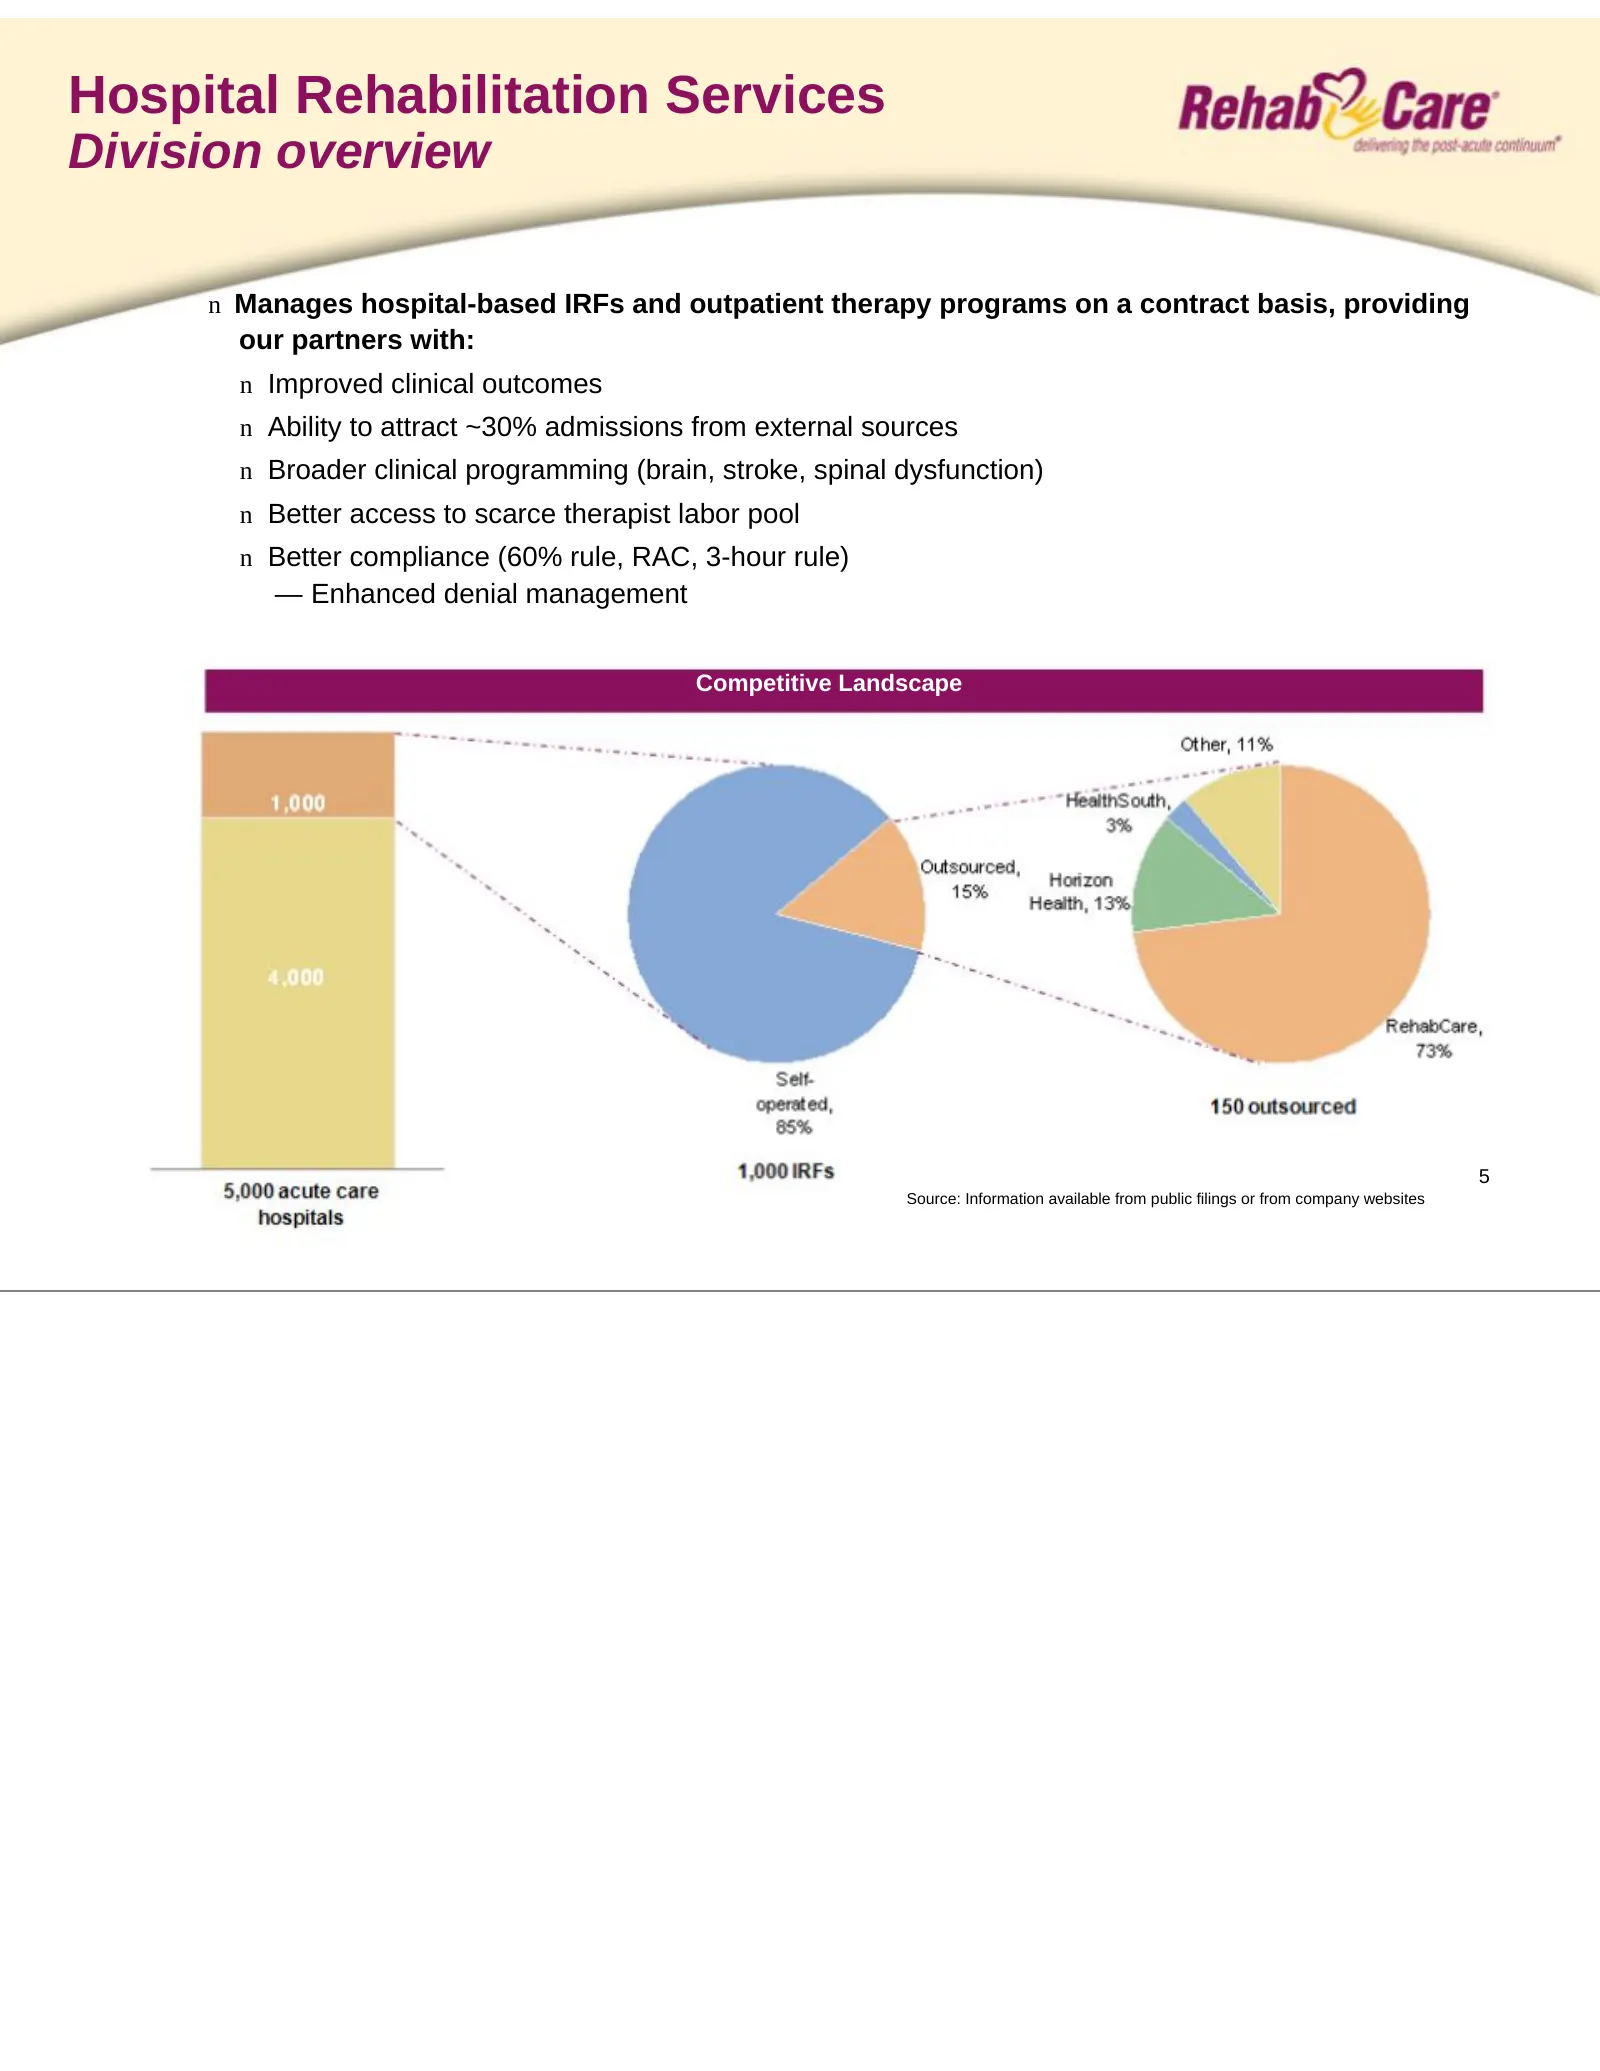
Hospital Rehabilitation Services Division overview n Manages hospital-based IRFs and outpatient therapy programs on a contract basis, providing our partners with: n Improved clinical outcomes n Ability to attract ~30% admissions from external sources n Broader clinical programming (brain, stroke, sp
Slide 7: WPAHS agreement: A continuum of care model
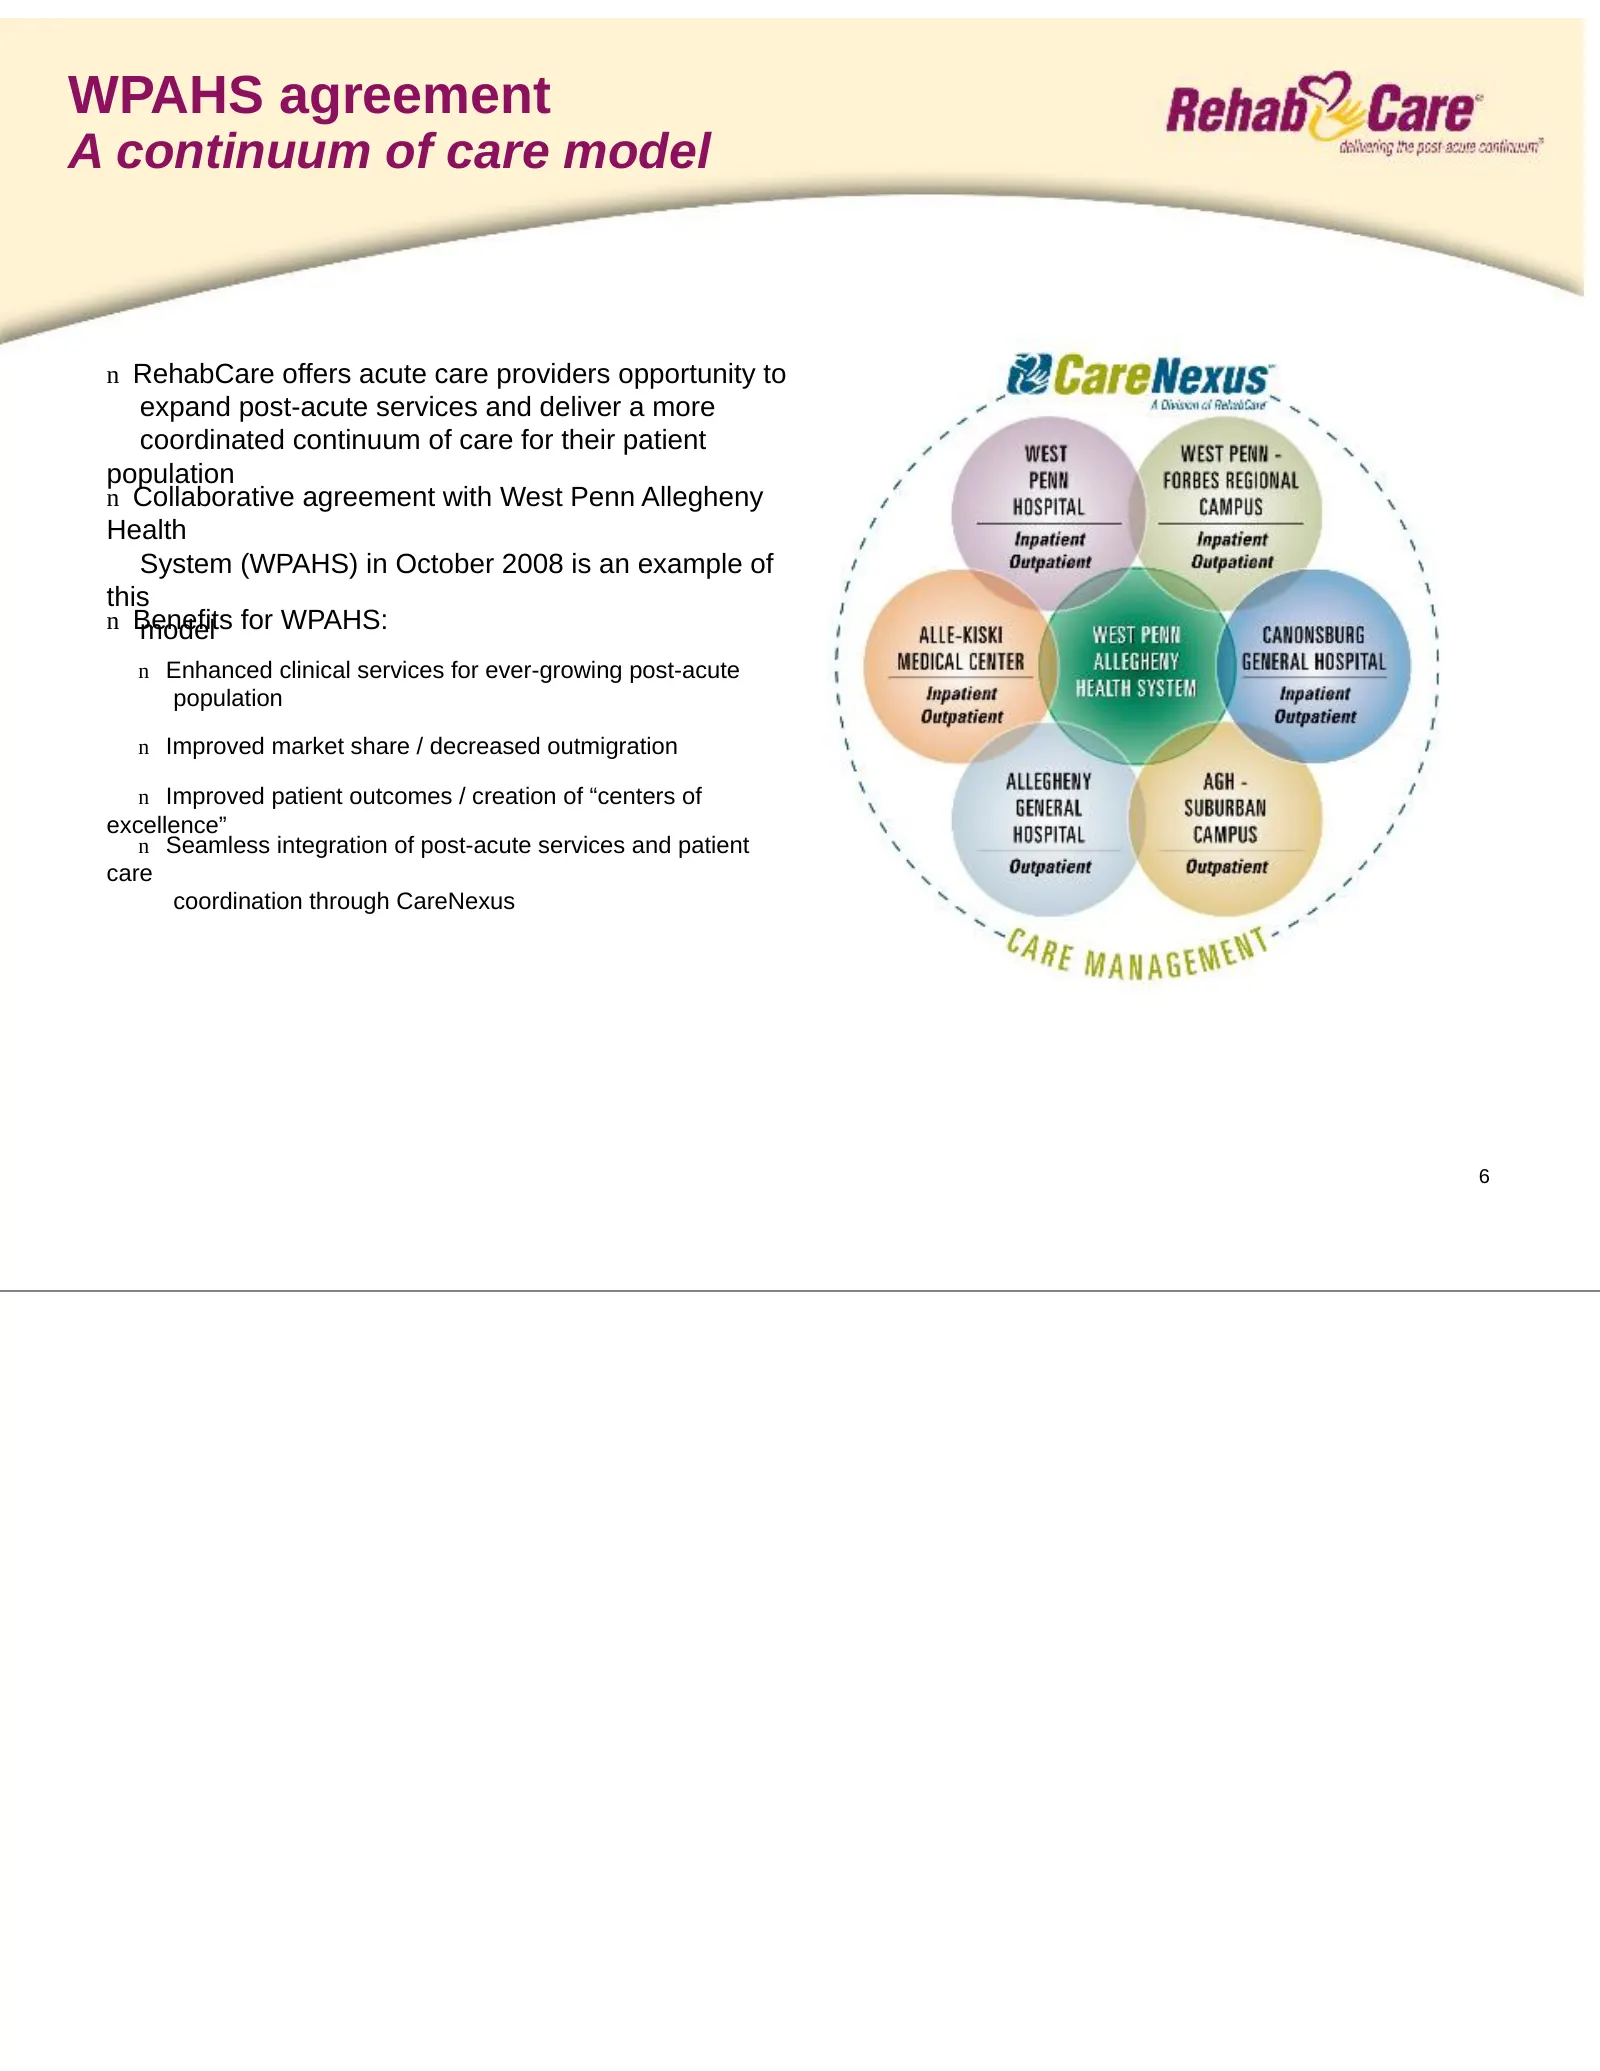
WPAHS agreement A continuum of care model n RehabCare offers acute care providers opportunity to expand post-acute services and deliver a more coordinated continuum of care for their patient population n Collaborative agreement with West Penn Allegheny Health System (WPAHS) in October 2008 is an exa
Slide 8: Hospital Rehabilitation Services Performance
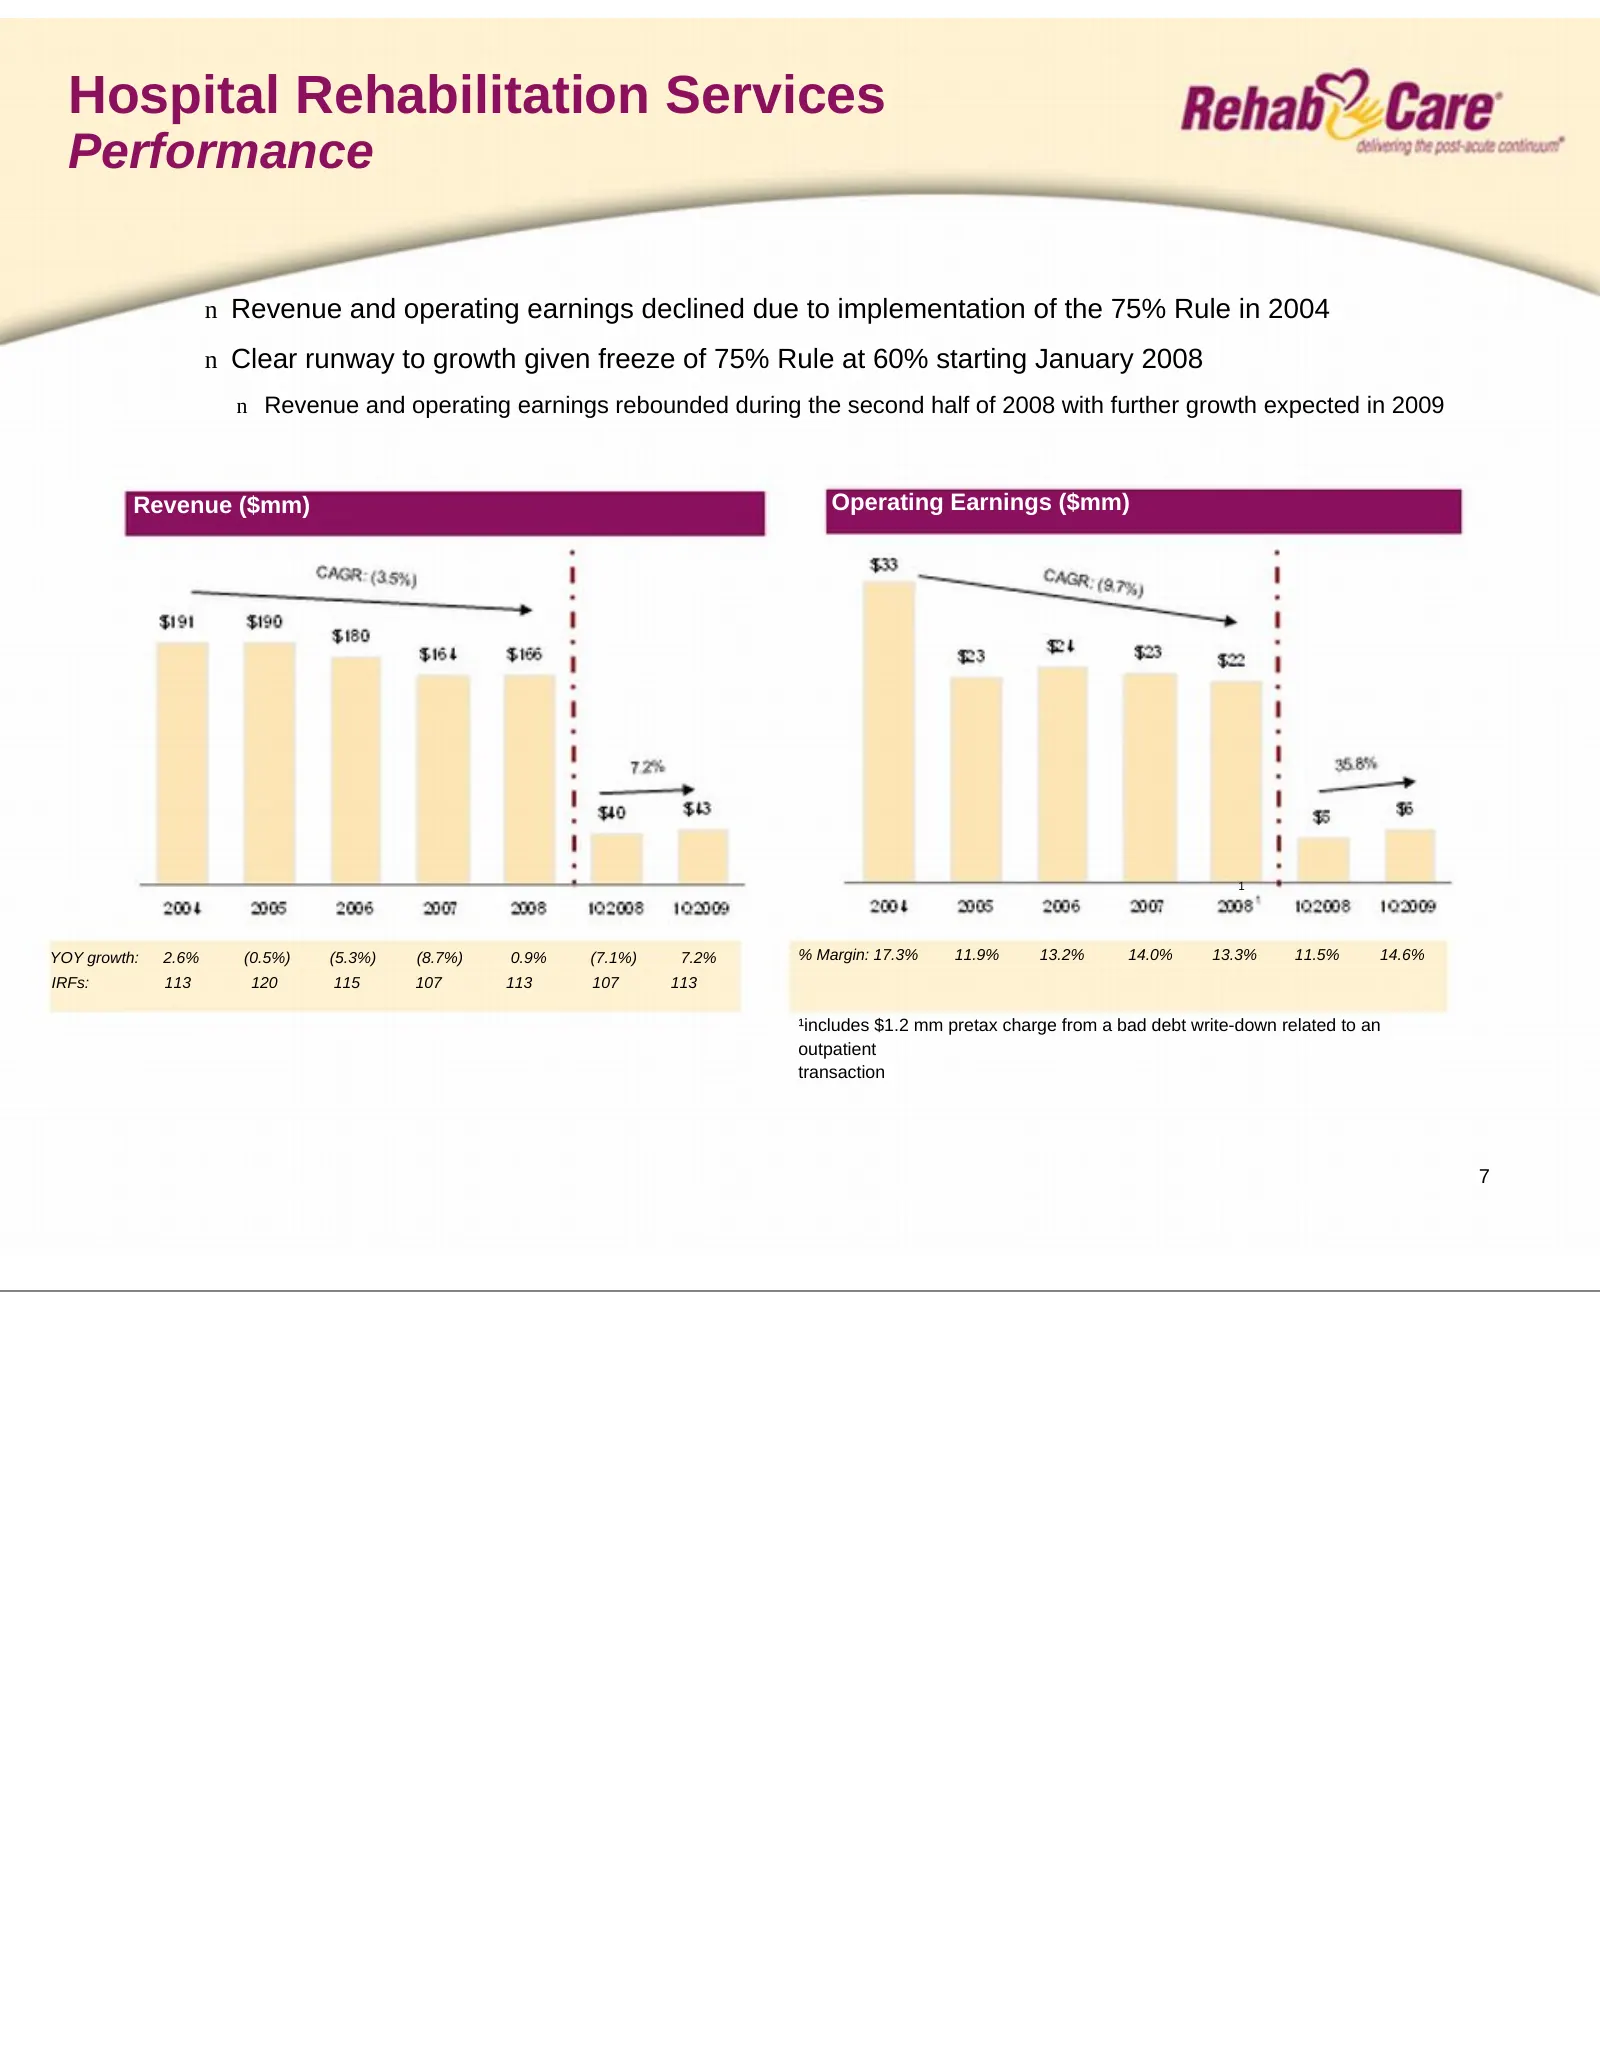
Hospital Rehabilitation Services Performance n Revenue and operating earnings declined due to implementation of the 75% Rule in 2004 n Clear runway to growth given freeze of 75% Rule at 60% starting January 2008 n Revenue and operating earnings rebounded during the second half of 2008 with further g
Slide 9: Hospital Division Market overview
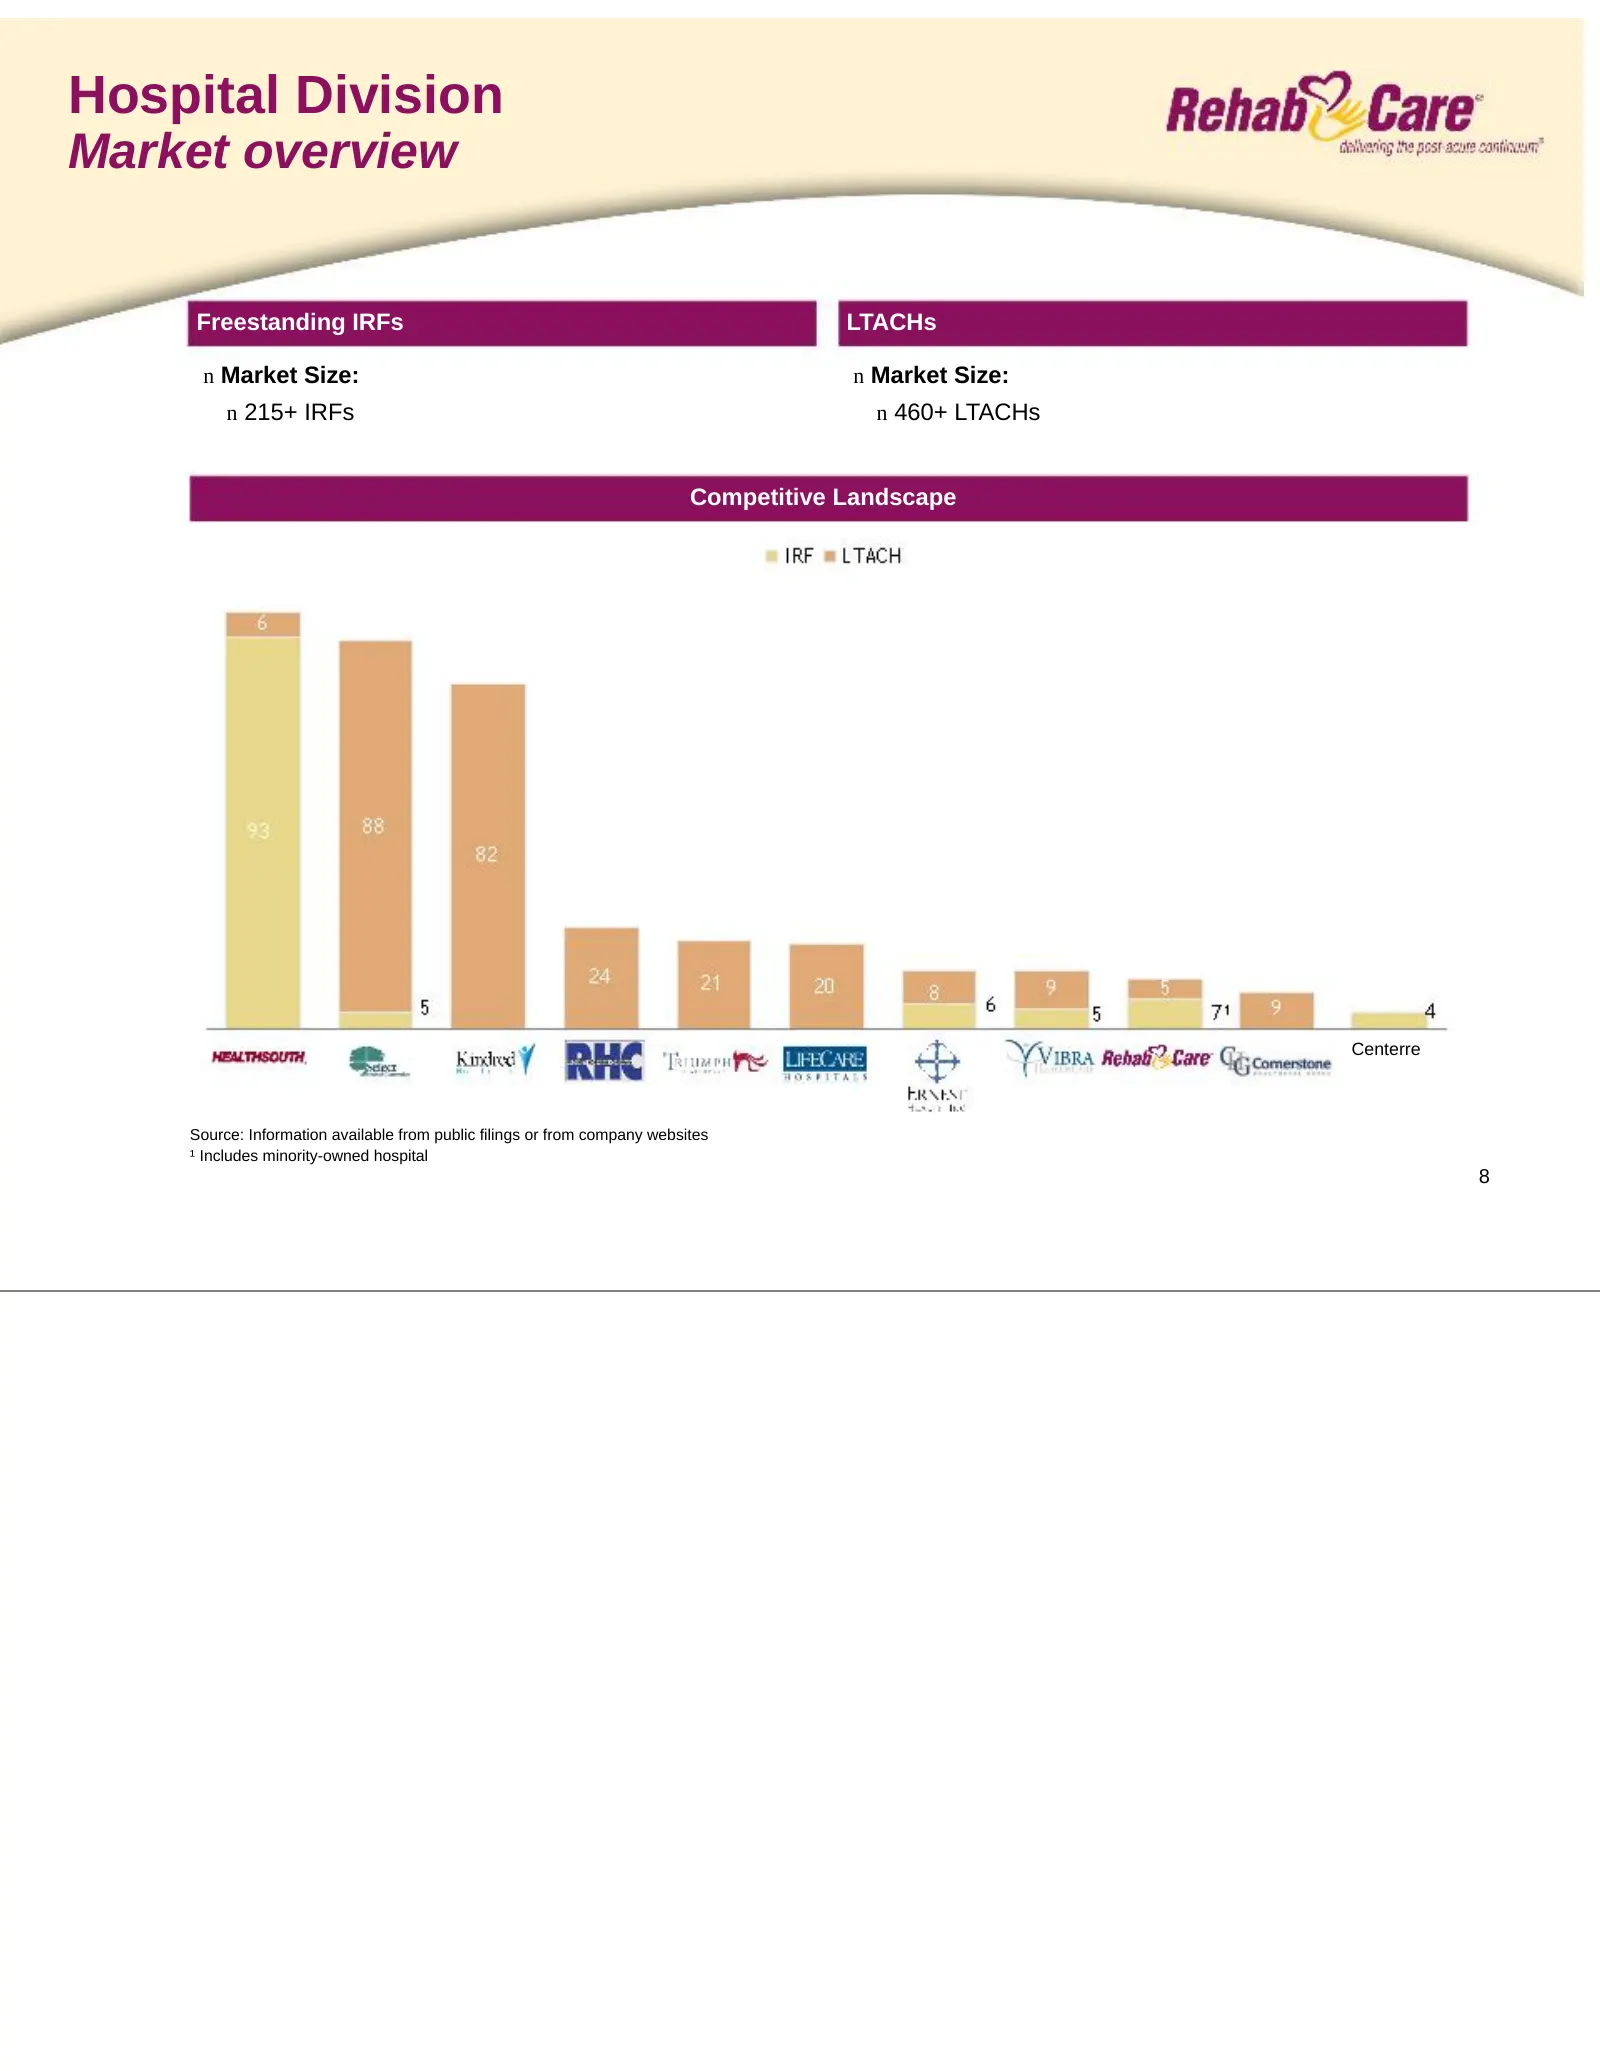
Hospital Division Market overview Freestanding IRFs LTACHs n Market Size: n Market Size: n 215+ IRFs n 460+ LTACHs Competitive Landscape Centerre Source: Information available from public filings or from company websites ¹ Includes minority-owned hospital 8
Slide 10: Growing portfolio of post-acute hospitals
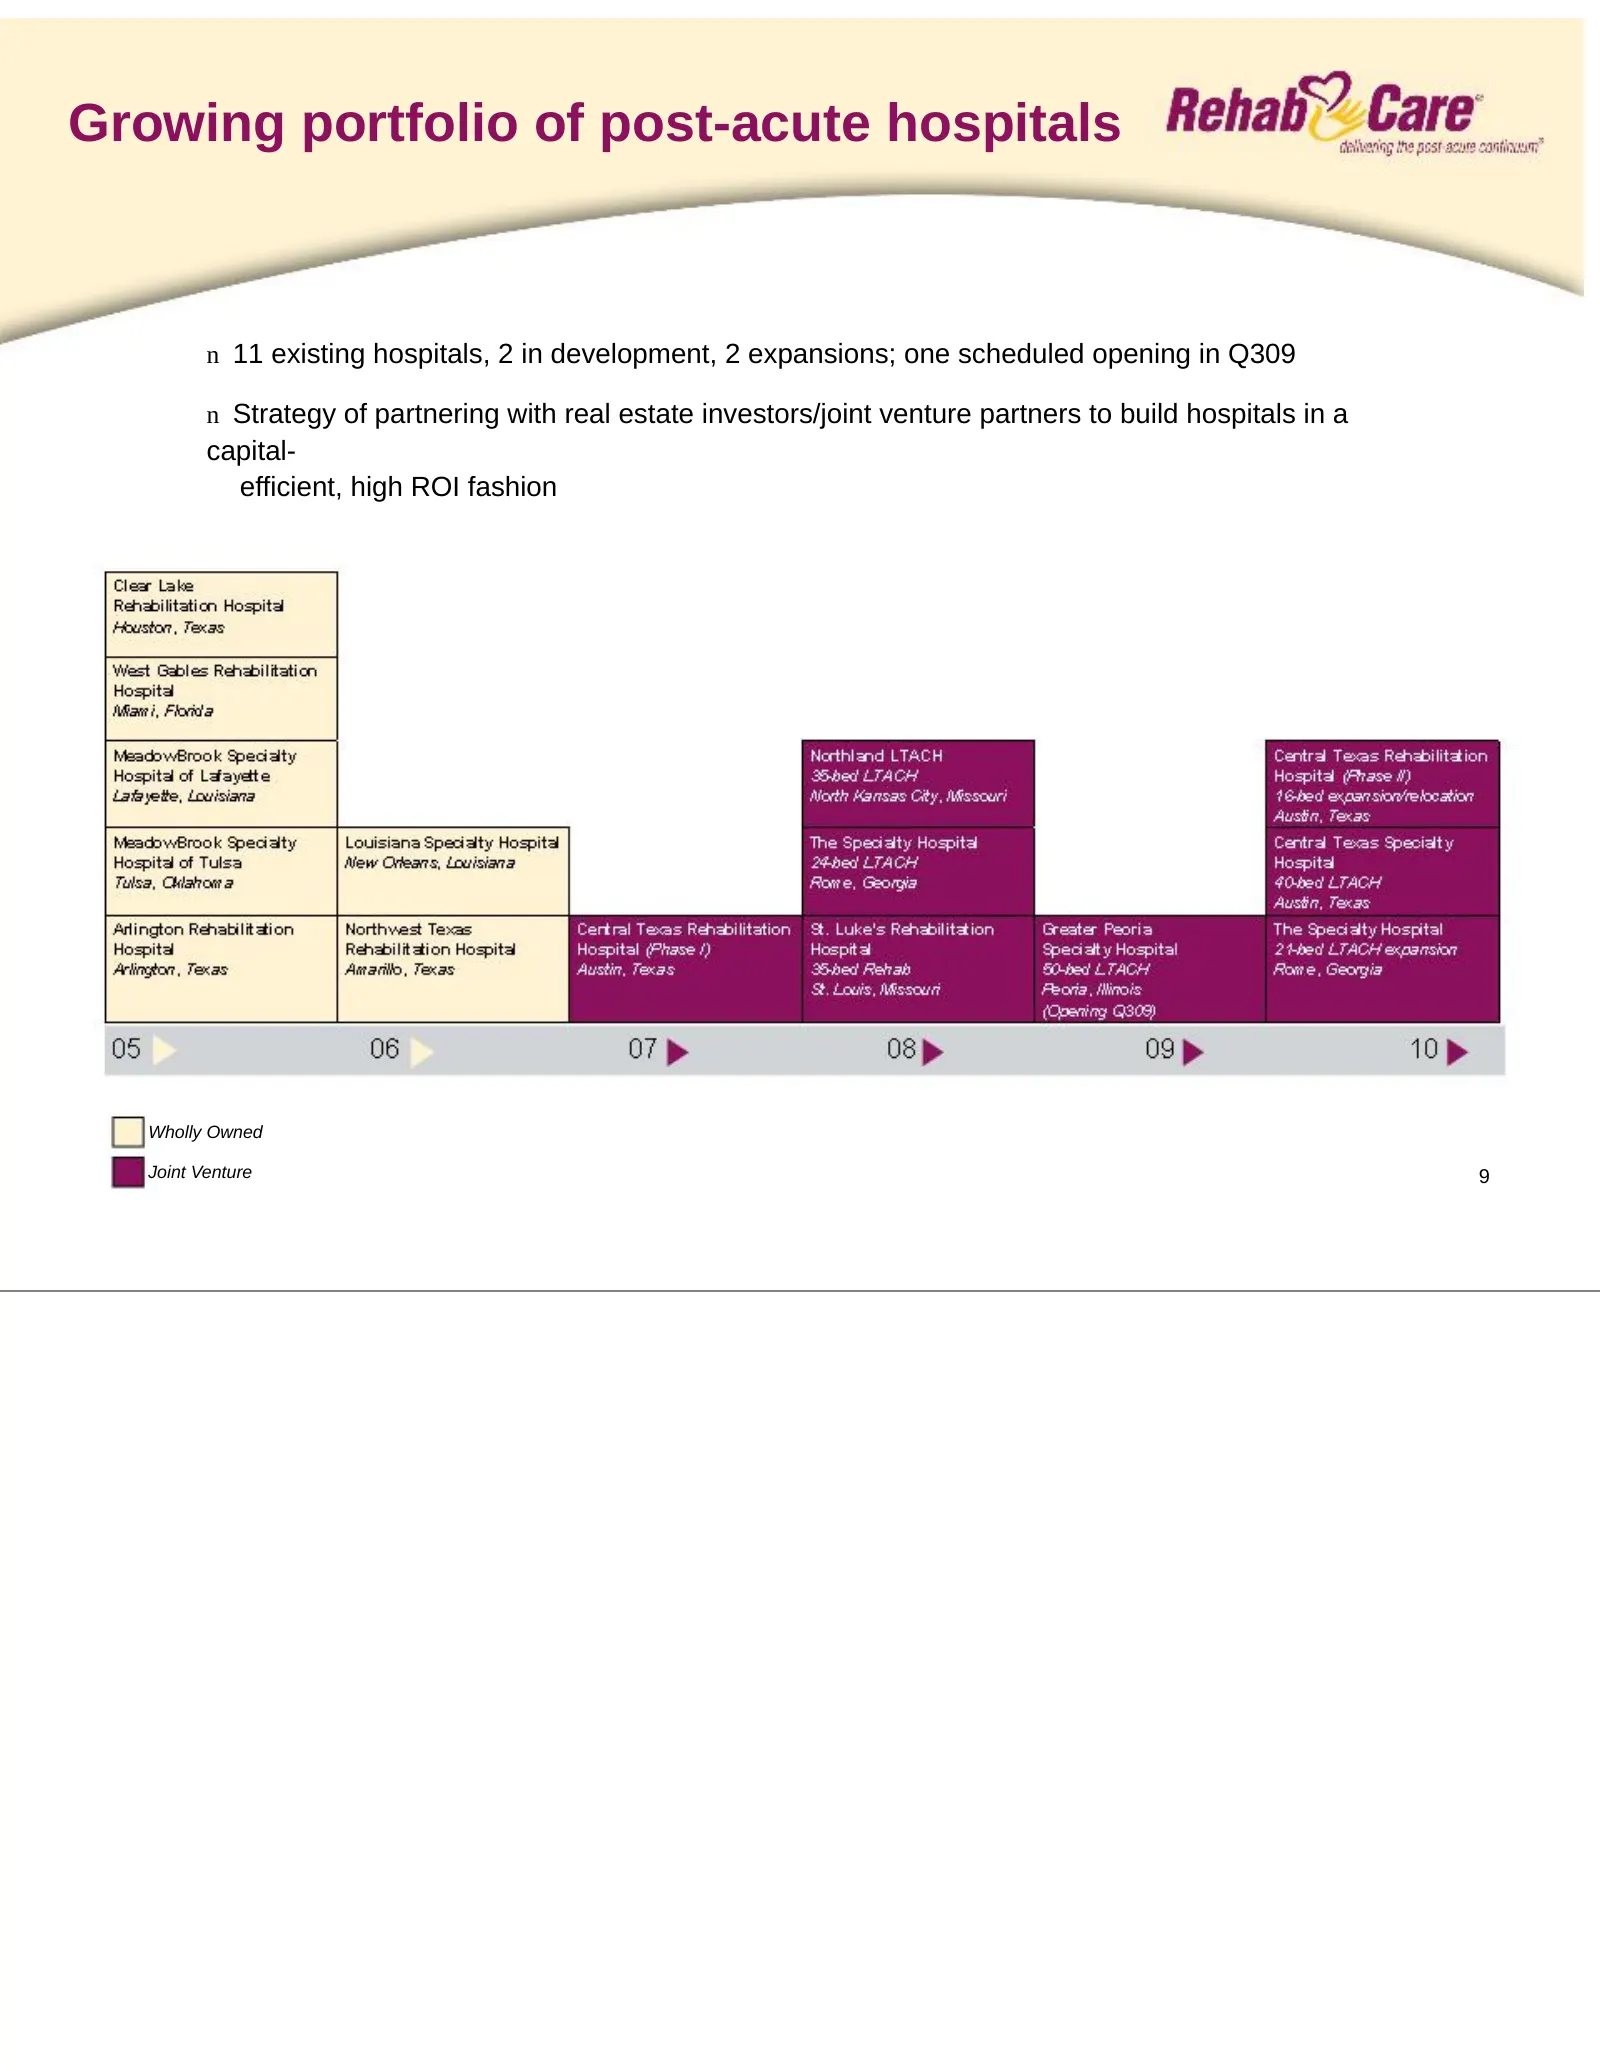
Growing portfolio of post-acute hospitals n 11 existing hospitals, 2 in development, 2 expansions; one scheduled opening in Q309 n Strategy of partnering with real estate investors/joint venture partners to build hospitals in a capital- efficient, high ROI fashion Wholly Owned Joint Venture 9
Slide 11: Hospital Division Performance
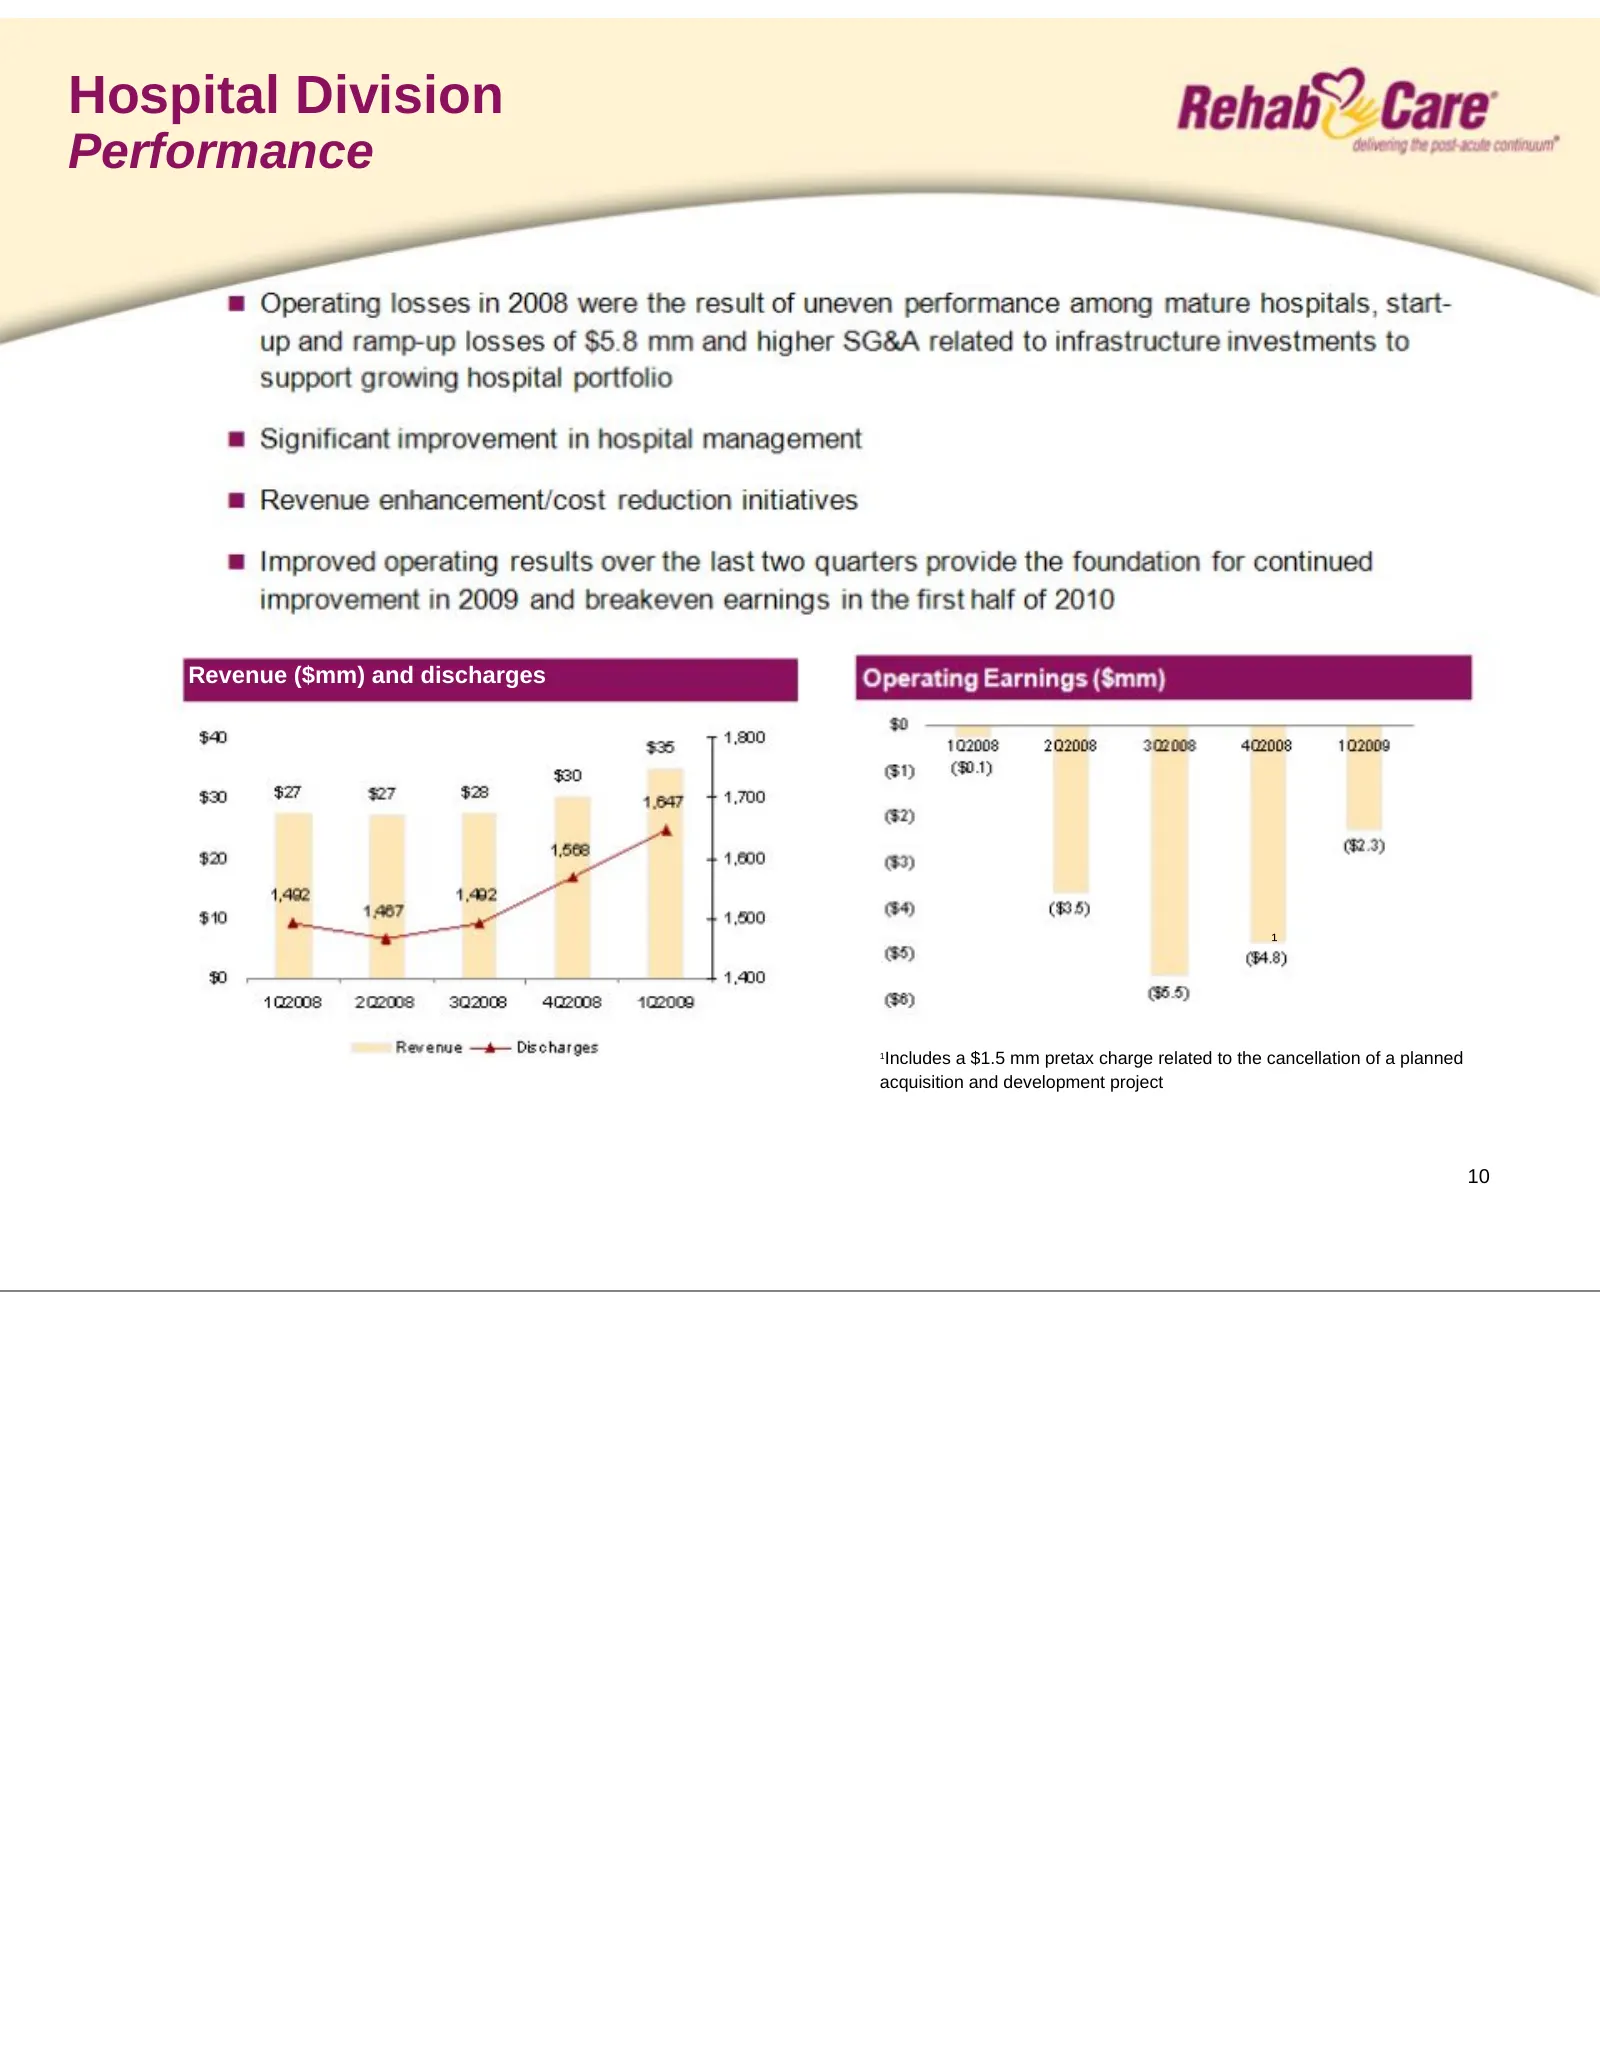
Hospital Division Performance Revenue ($mm) and discharges ¹ Includes a $1.5 mm pretax charge related to the cancellation of a planned 1 acquisition and development project 10
Slide 12: Consolidated financial summary
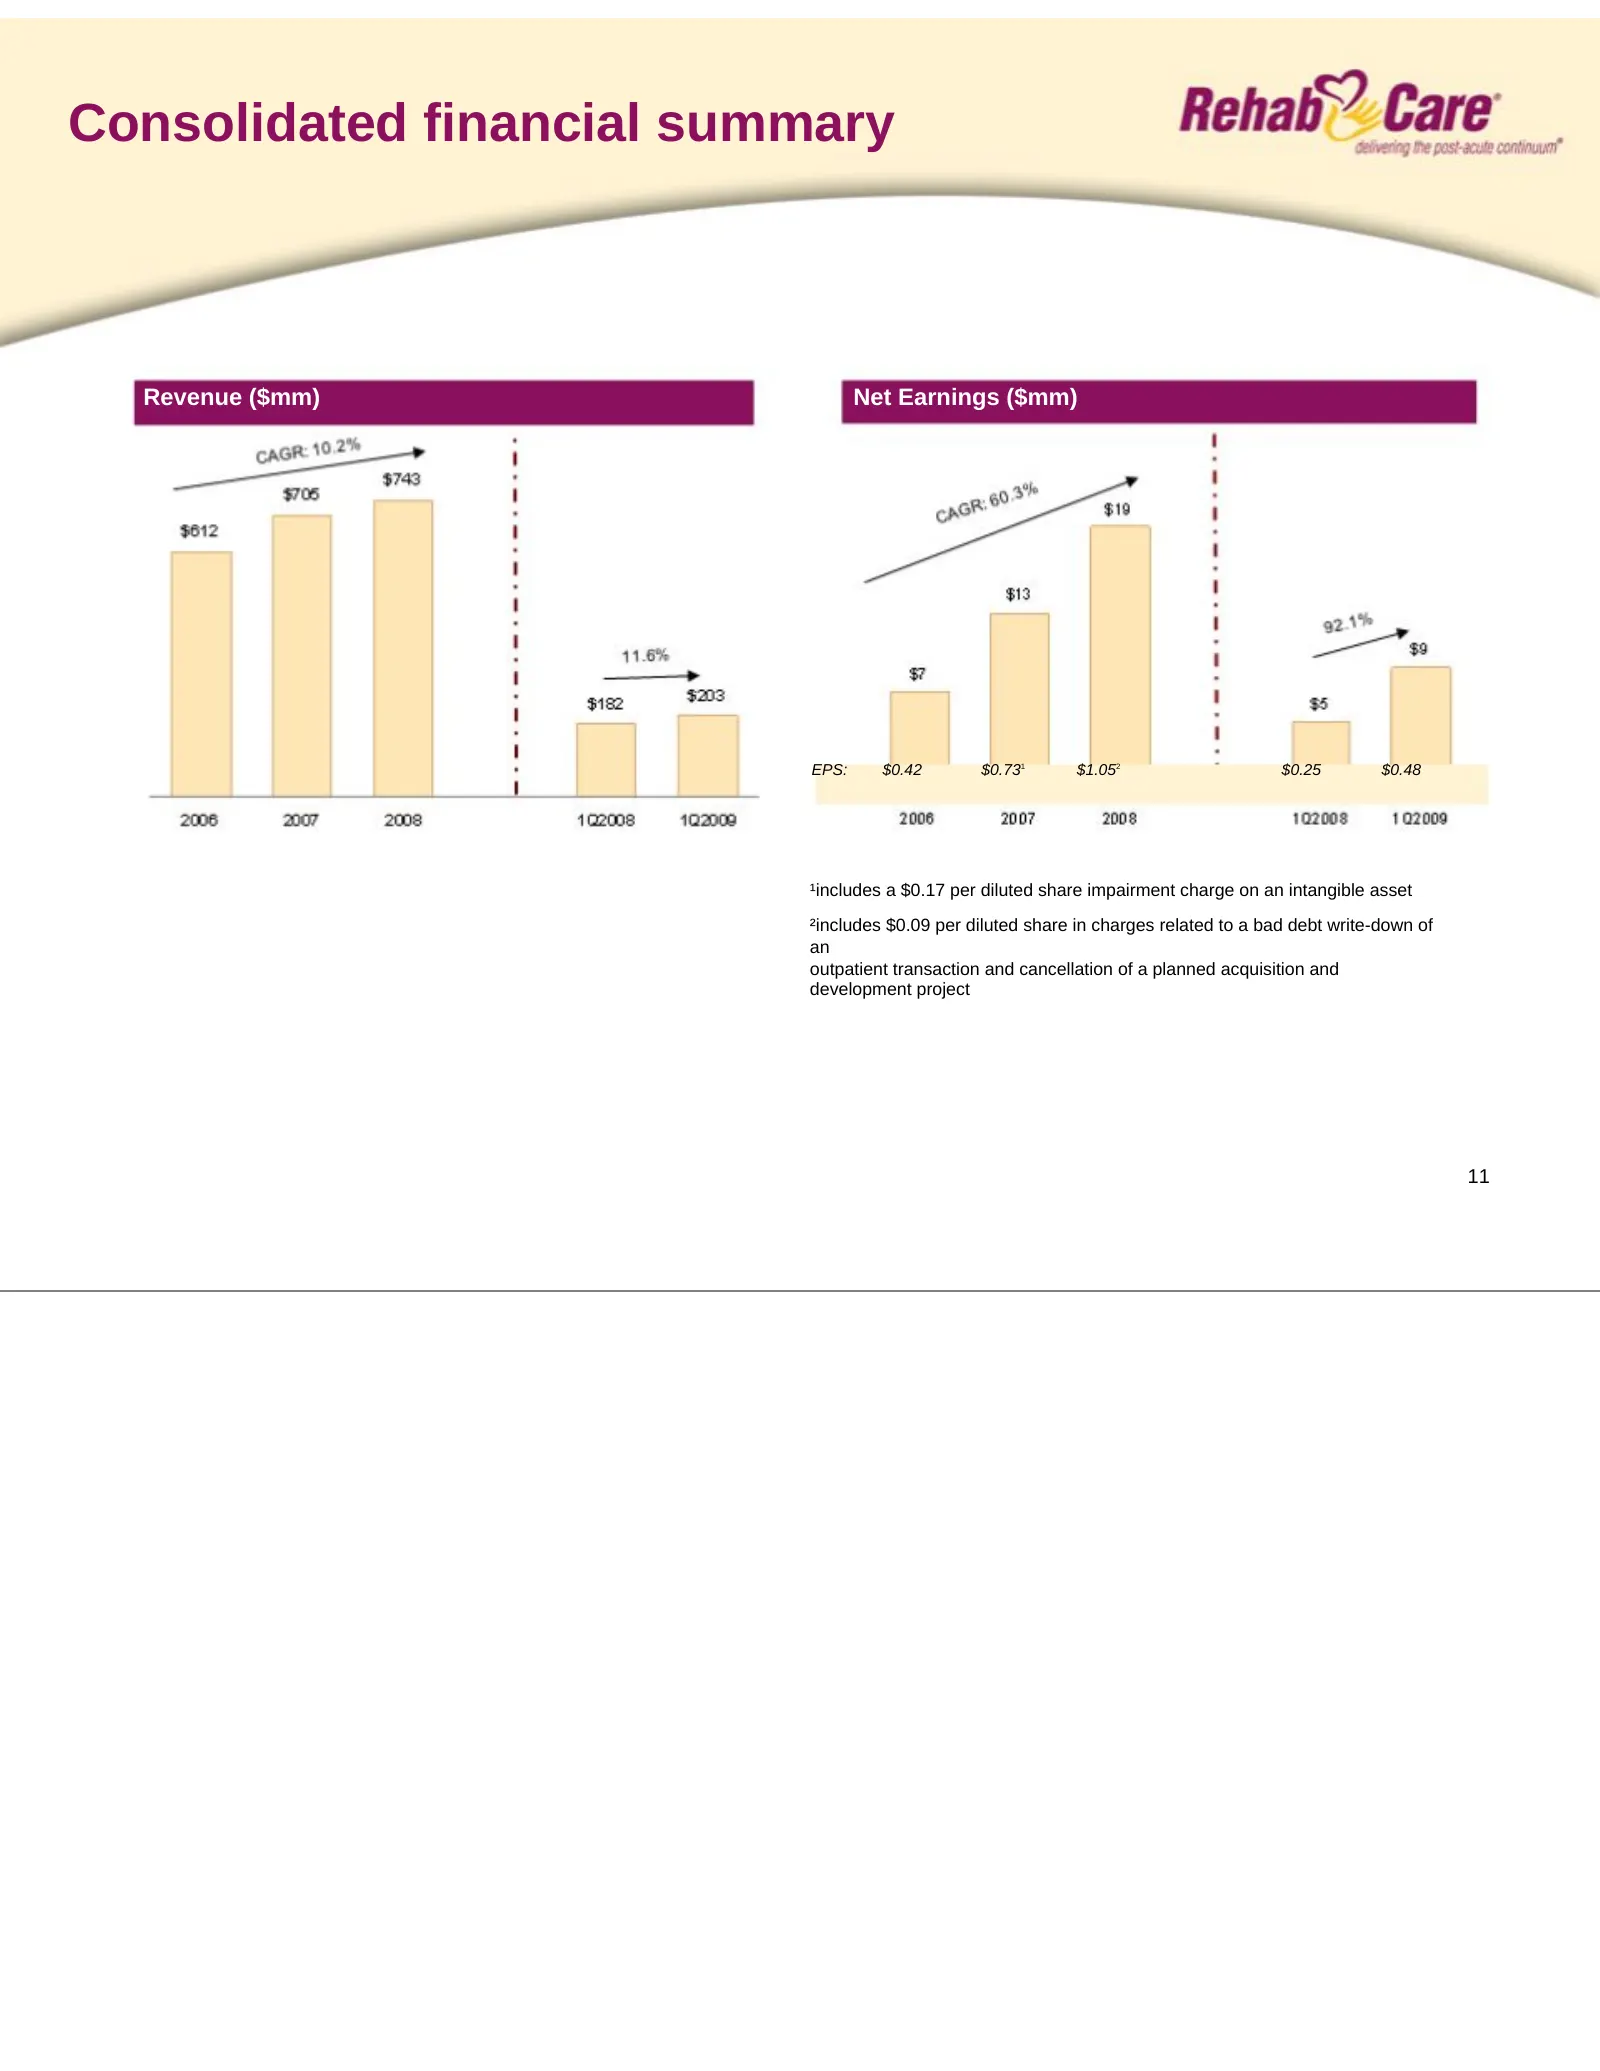
Consolidated financial summary Revenue ($mm) Net Earnings ($mm) EPS: $0.42 $0.731 $1.052 $0.25 $0.48 ¹includes a $0.17 per diluted share impairment charge on an intangible asset ²includes $0.09 per diluted share in charges related to a bad debt write-down of an outpatient transaction and cancellatio
Slide 13: Consolidated balance sheet
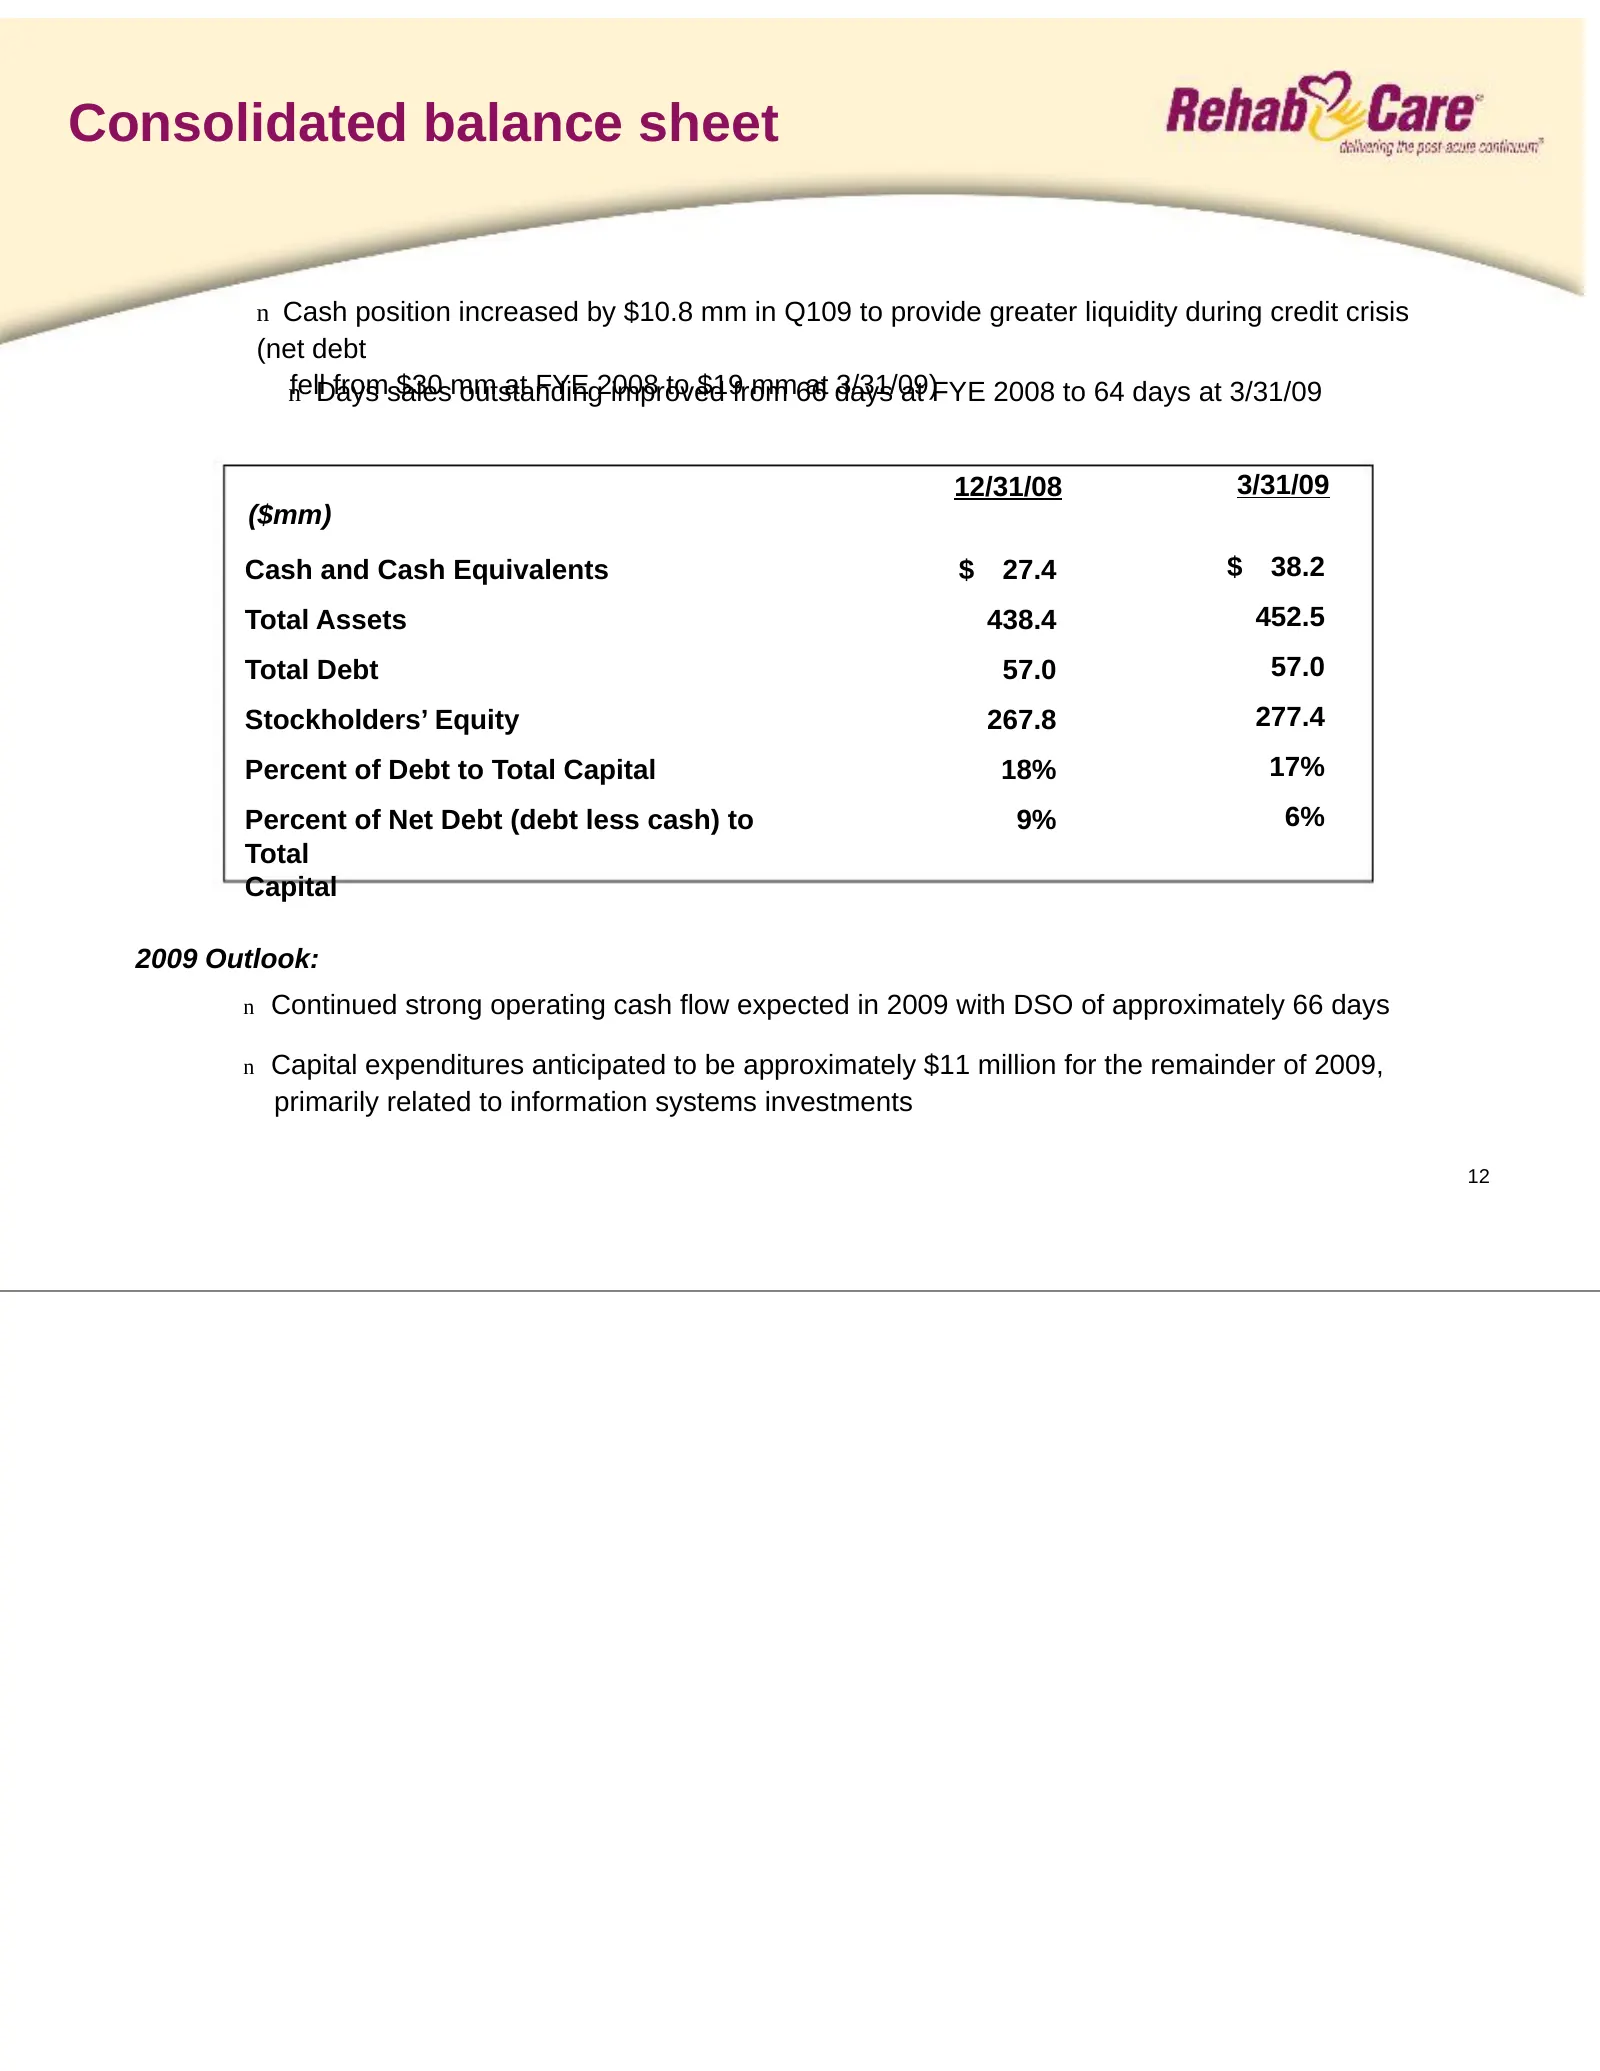
Consolidated balance sheet n Cash position increased by $10.8 mm in Q109 to provide greater liquidity during credit crisis (net debt nfellDays fromsales $30 mm at FYE 2008 outstanding to $19from improved mm66 at days 3/31/09) at FYE 2008 to 64 days at 3/31/09 12/31/08 3/31/09 ($mm) Cash and Cash Equ
Slide 14: Current reimbursement environment
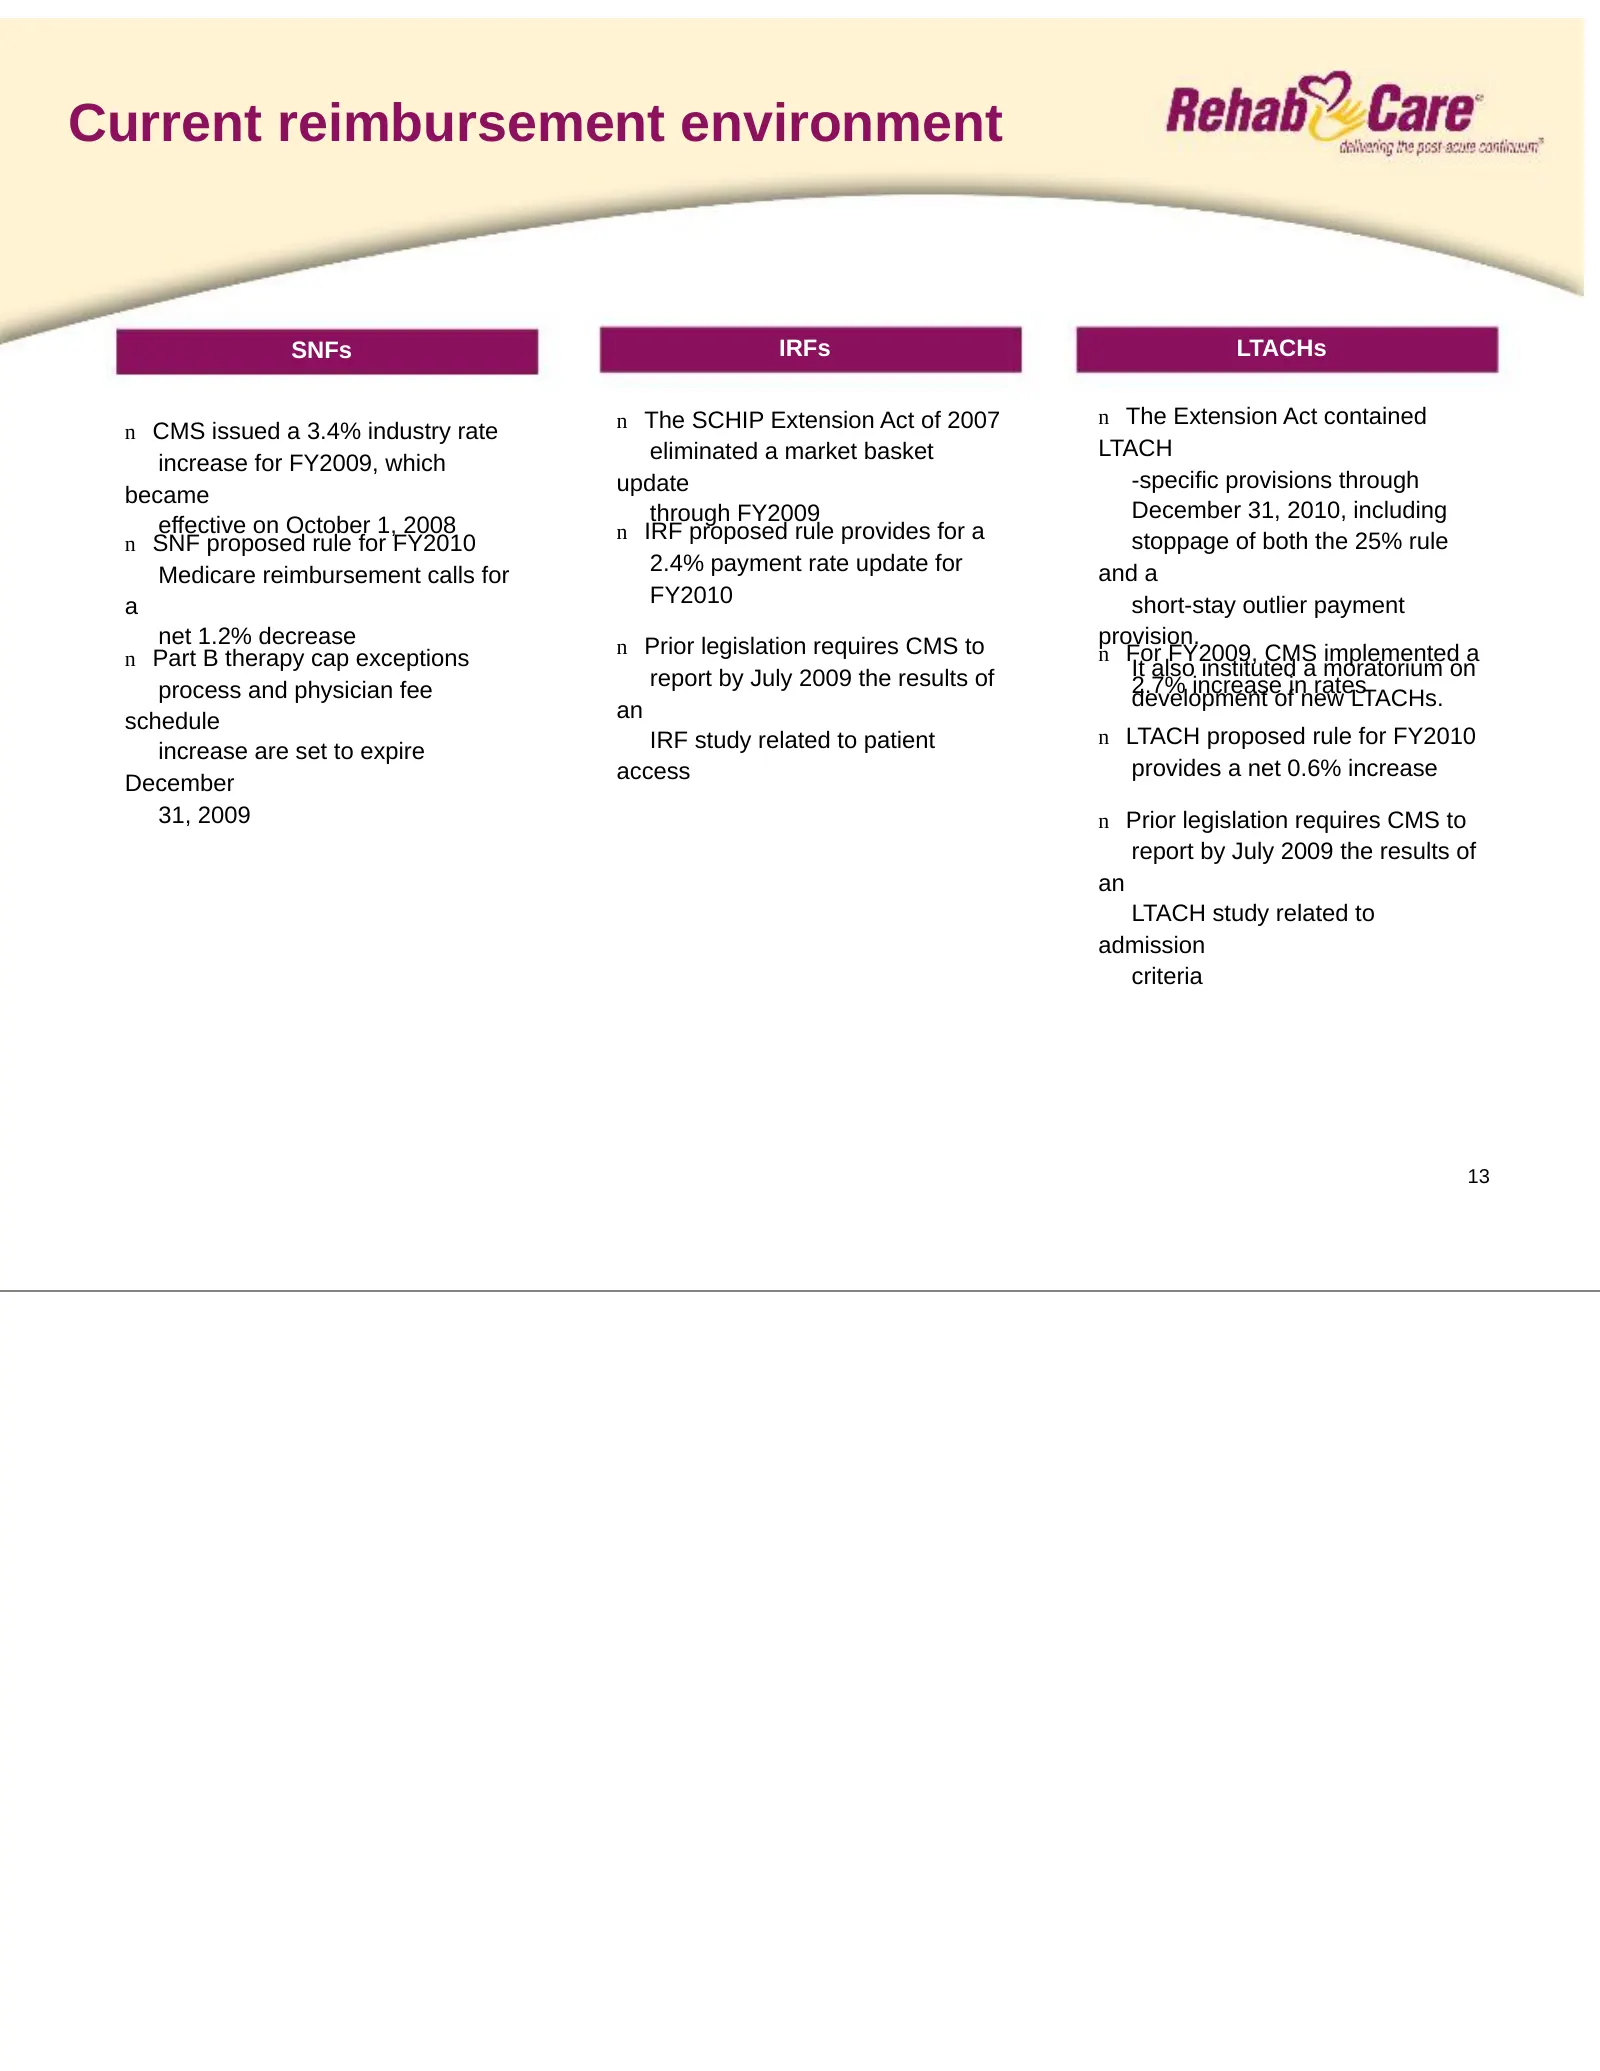
Current reimbursement environment SNFs IRFs LTACHs n The SCHIP Extension Act of 2007 n The Extension Act contained n CMS issued a 3.4% industry rate eliminated a market basket LTACH increase for FY2009, which update -specific provisions through became through FY2009 December 31, 2010, including effe
Slide 15: Bundled payment proposal: Impact on post-acute care
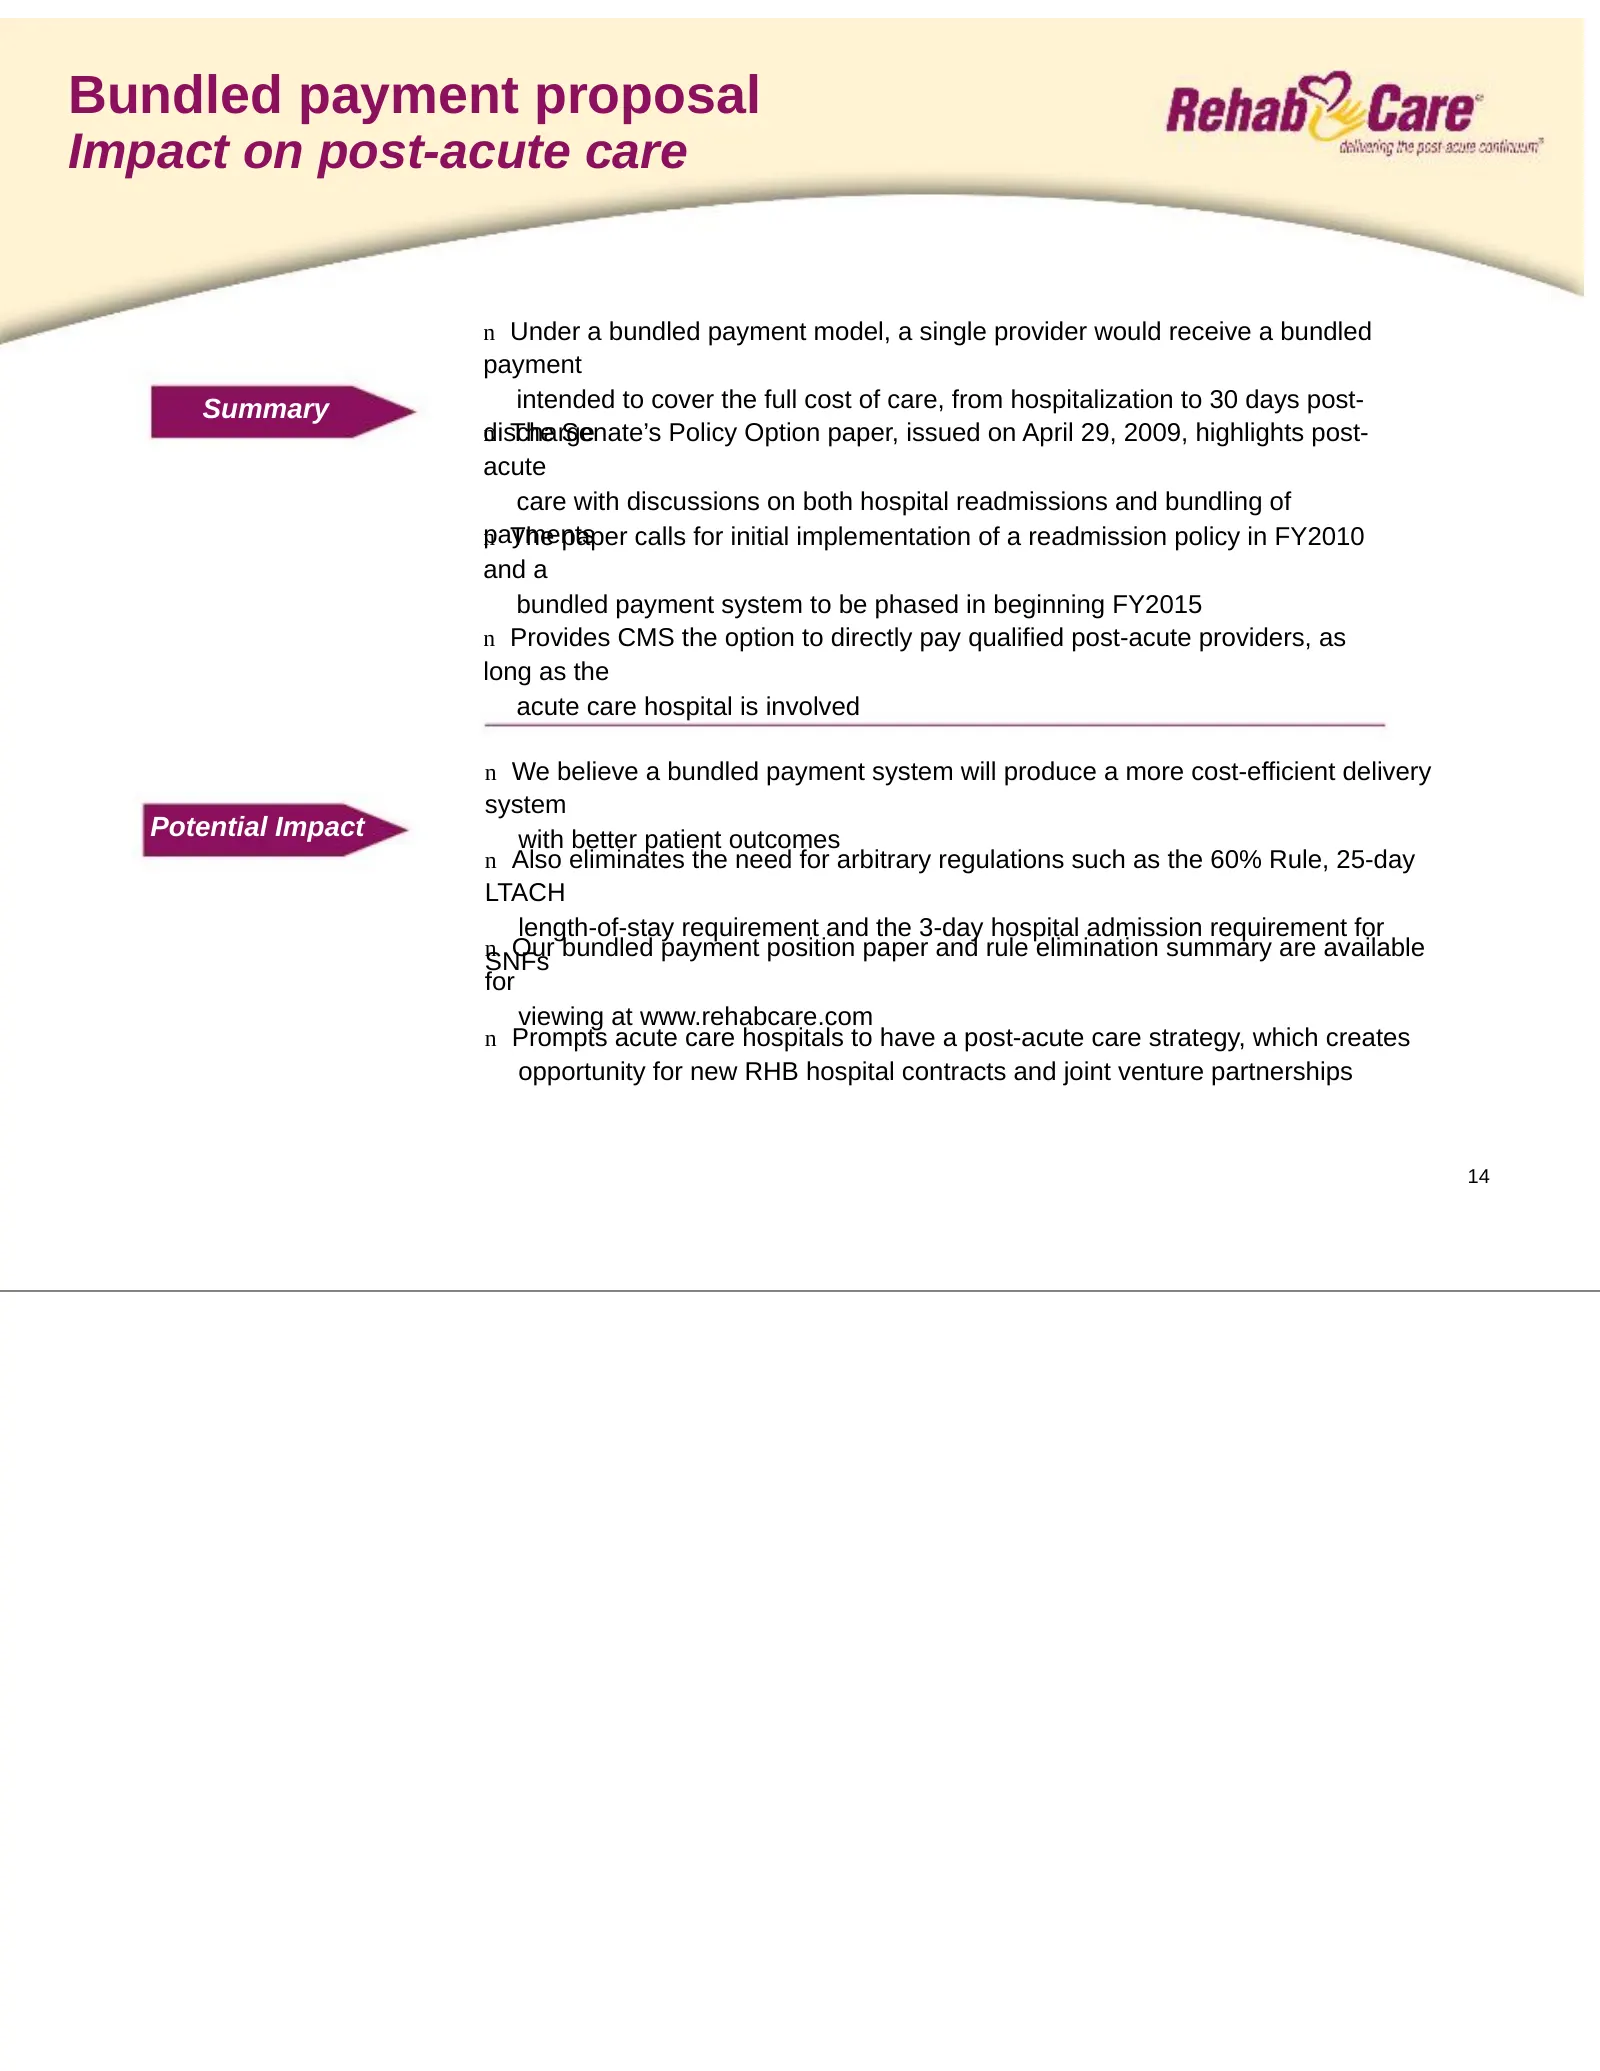
Bundled payment proposal Impact on post-acute care n Under a bundled payment model, a single provider would receive a bundled payment Summary intended to cover the full cost of care, from hospitalization to 30 days post- ndischarge The Senate’s Policy Option paper, issued on April 29, 2009, highligh
Slide 16: 2009 Outlook
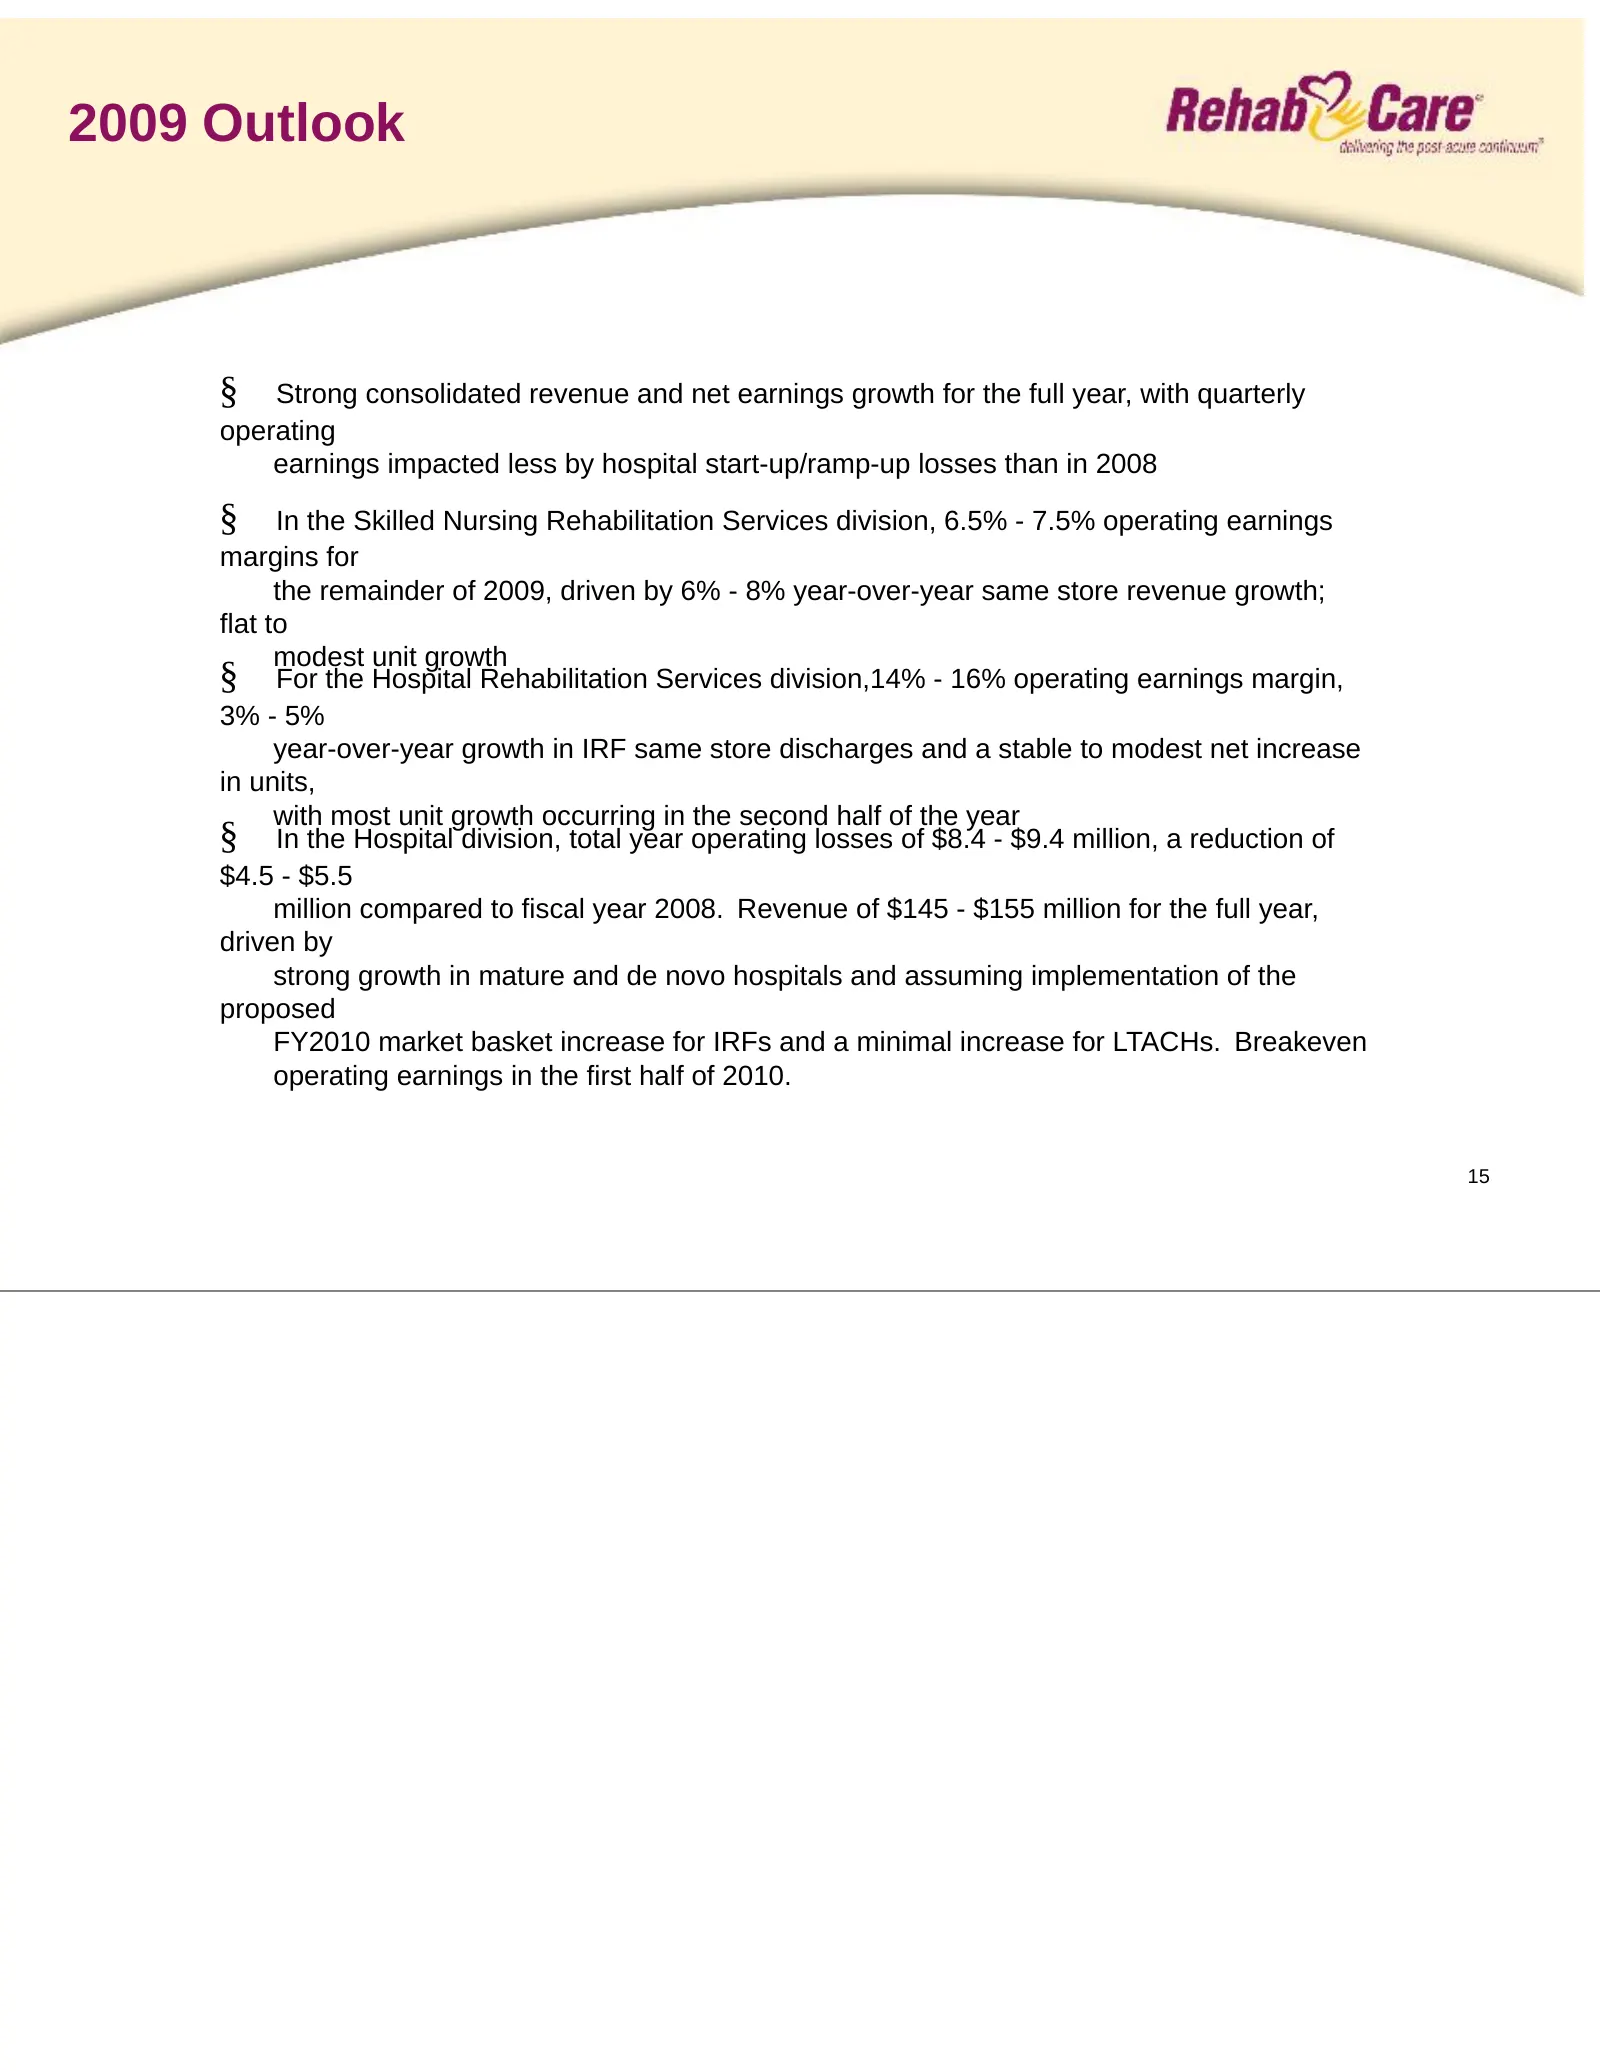
2009 Outlook § Strong consolidated revenue and net earnings growth for the full year, with quarterly operating earnings impacted less by hospital start-up/ramp-up losses than in 2008 § In the Skilled Nursing Rehabilitation Services division, 6.5% - 7.5% operating earnings margins for the remainder o
Slide 17: Long-term strategic plan
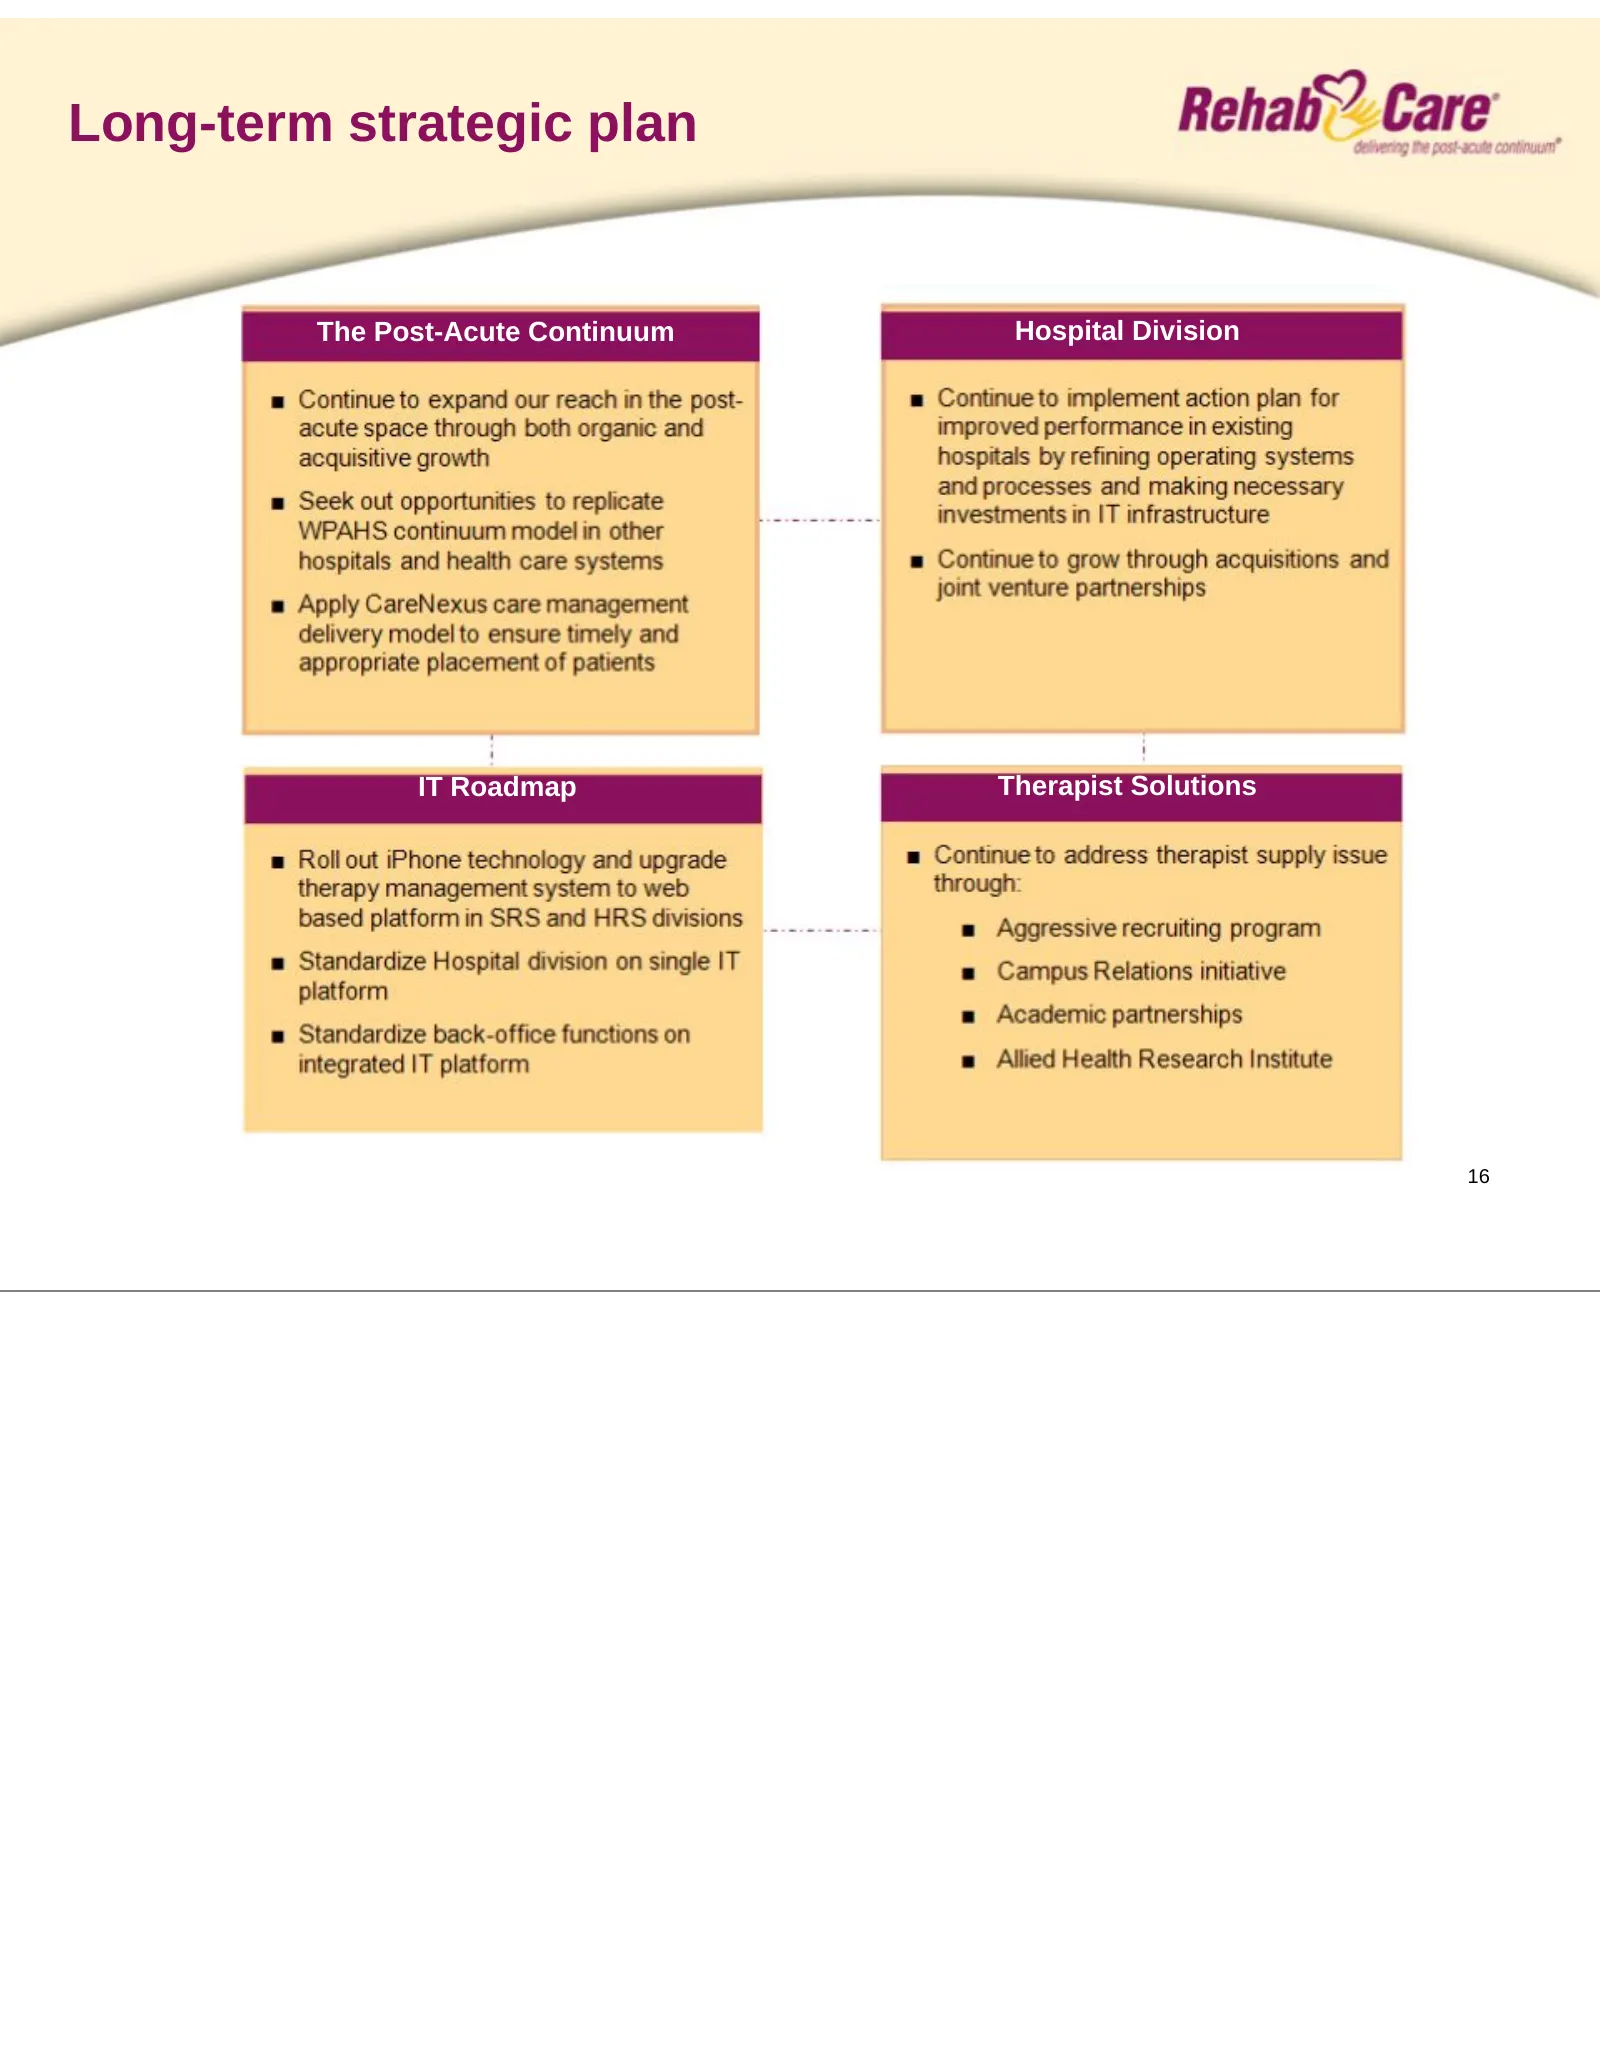
Long-term strategic plan The Post-Acute Continuum Hospital Division IT Roadmap Therapist Solutions 16
Slide 18: Why RehabCare?
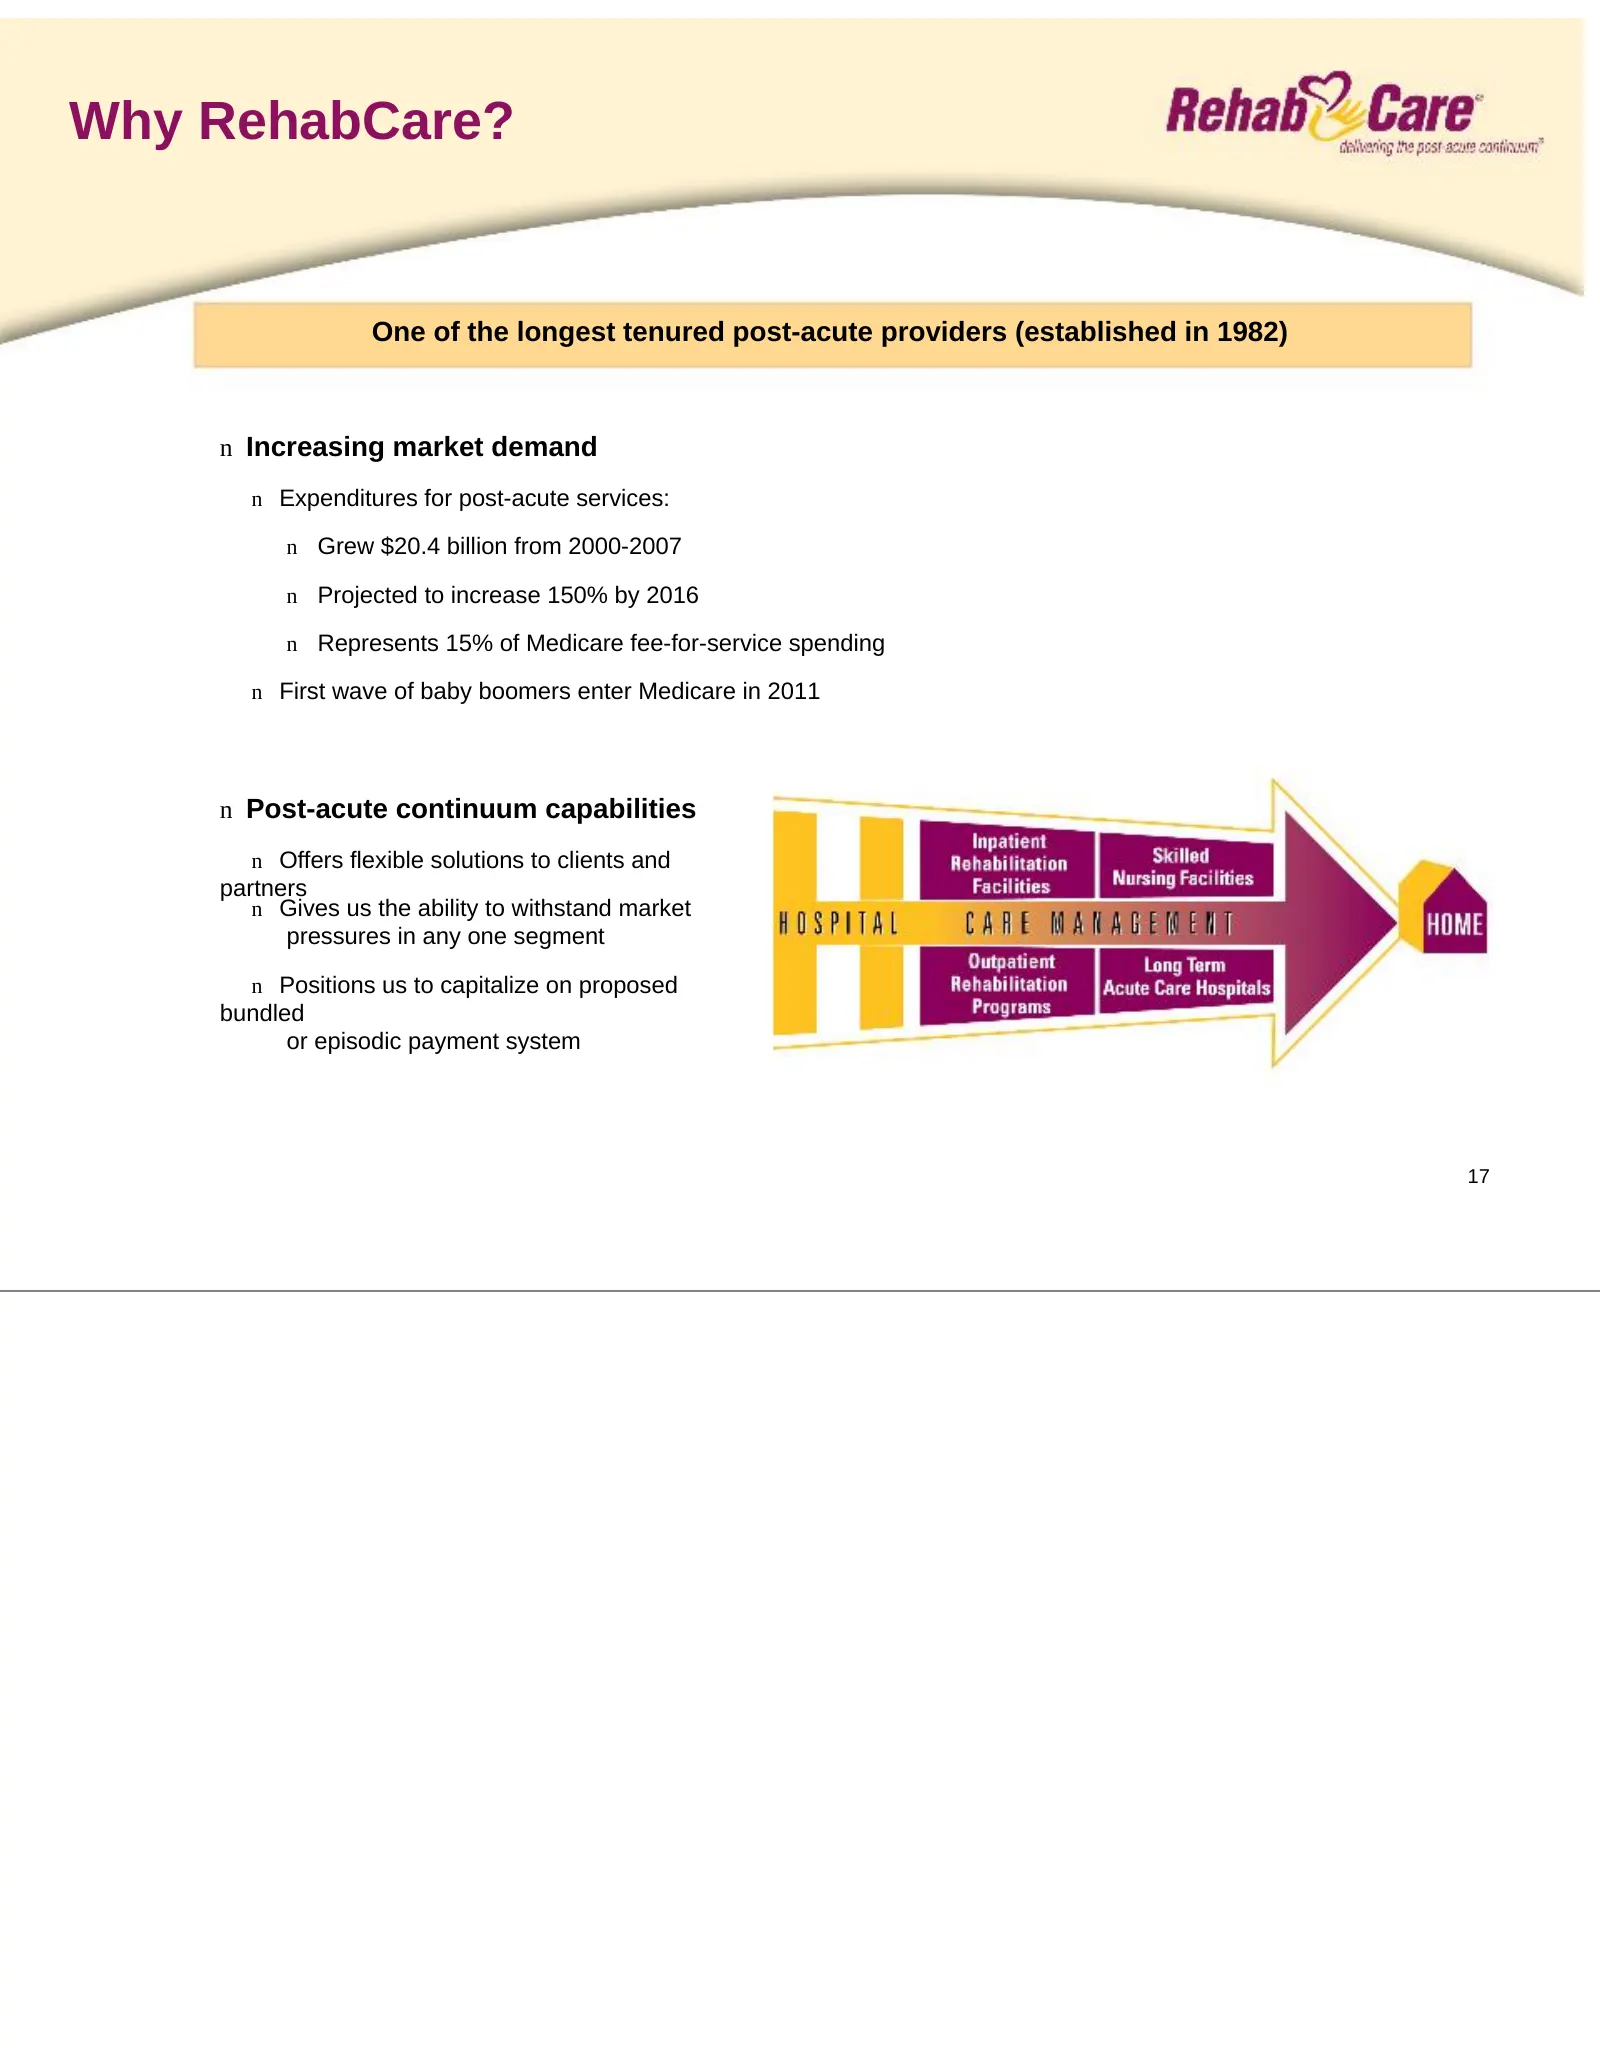
Why RehabCare? One of the longest tenured post-acute providers (established in 1982) n Increasing market demand n Expenditures for post-acute services: n Grew $20.4 billion from 2000-2007 n Projected to increase 150% by 2016 n Represents 15% of Medicare fee-for-service spending n First wave of baby
Slide 19: Why RehabCare?
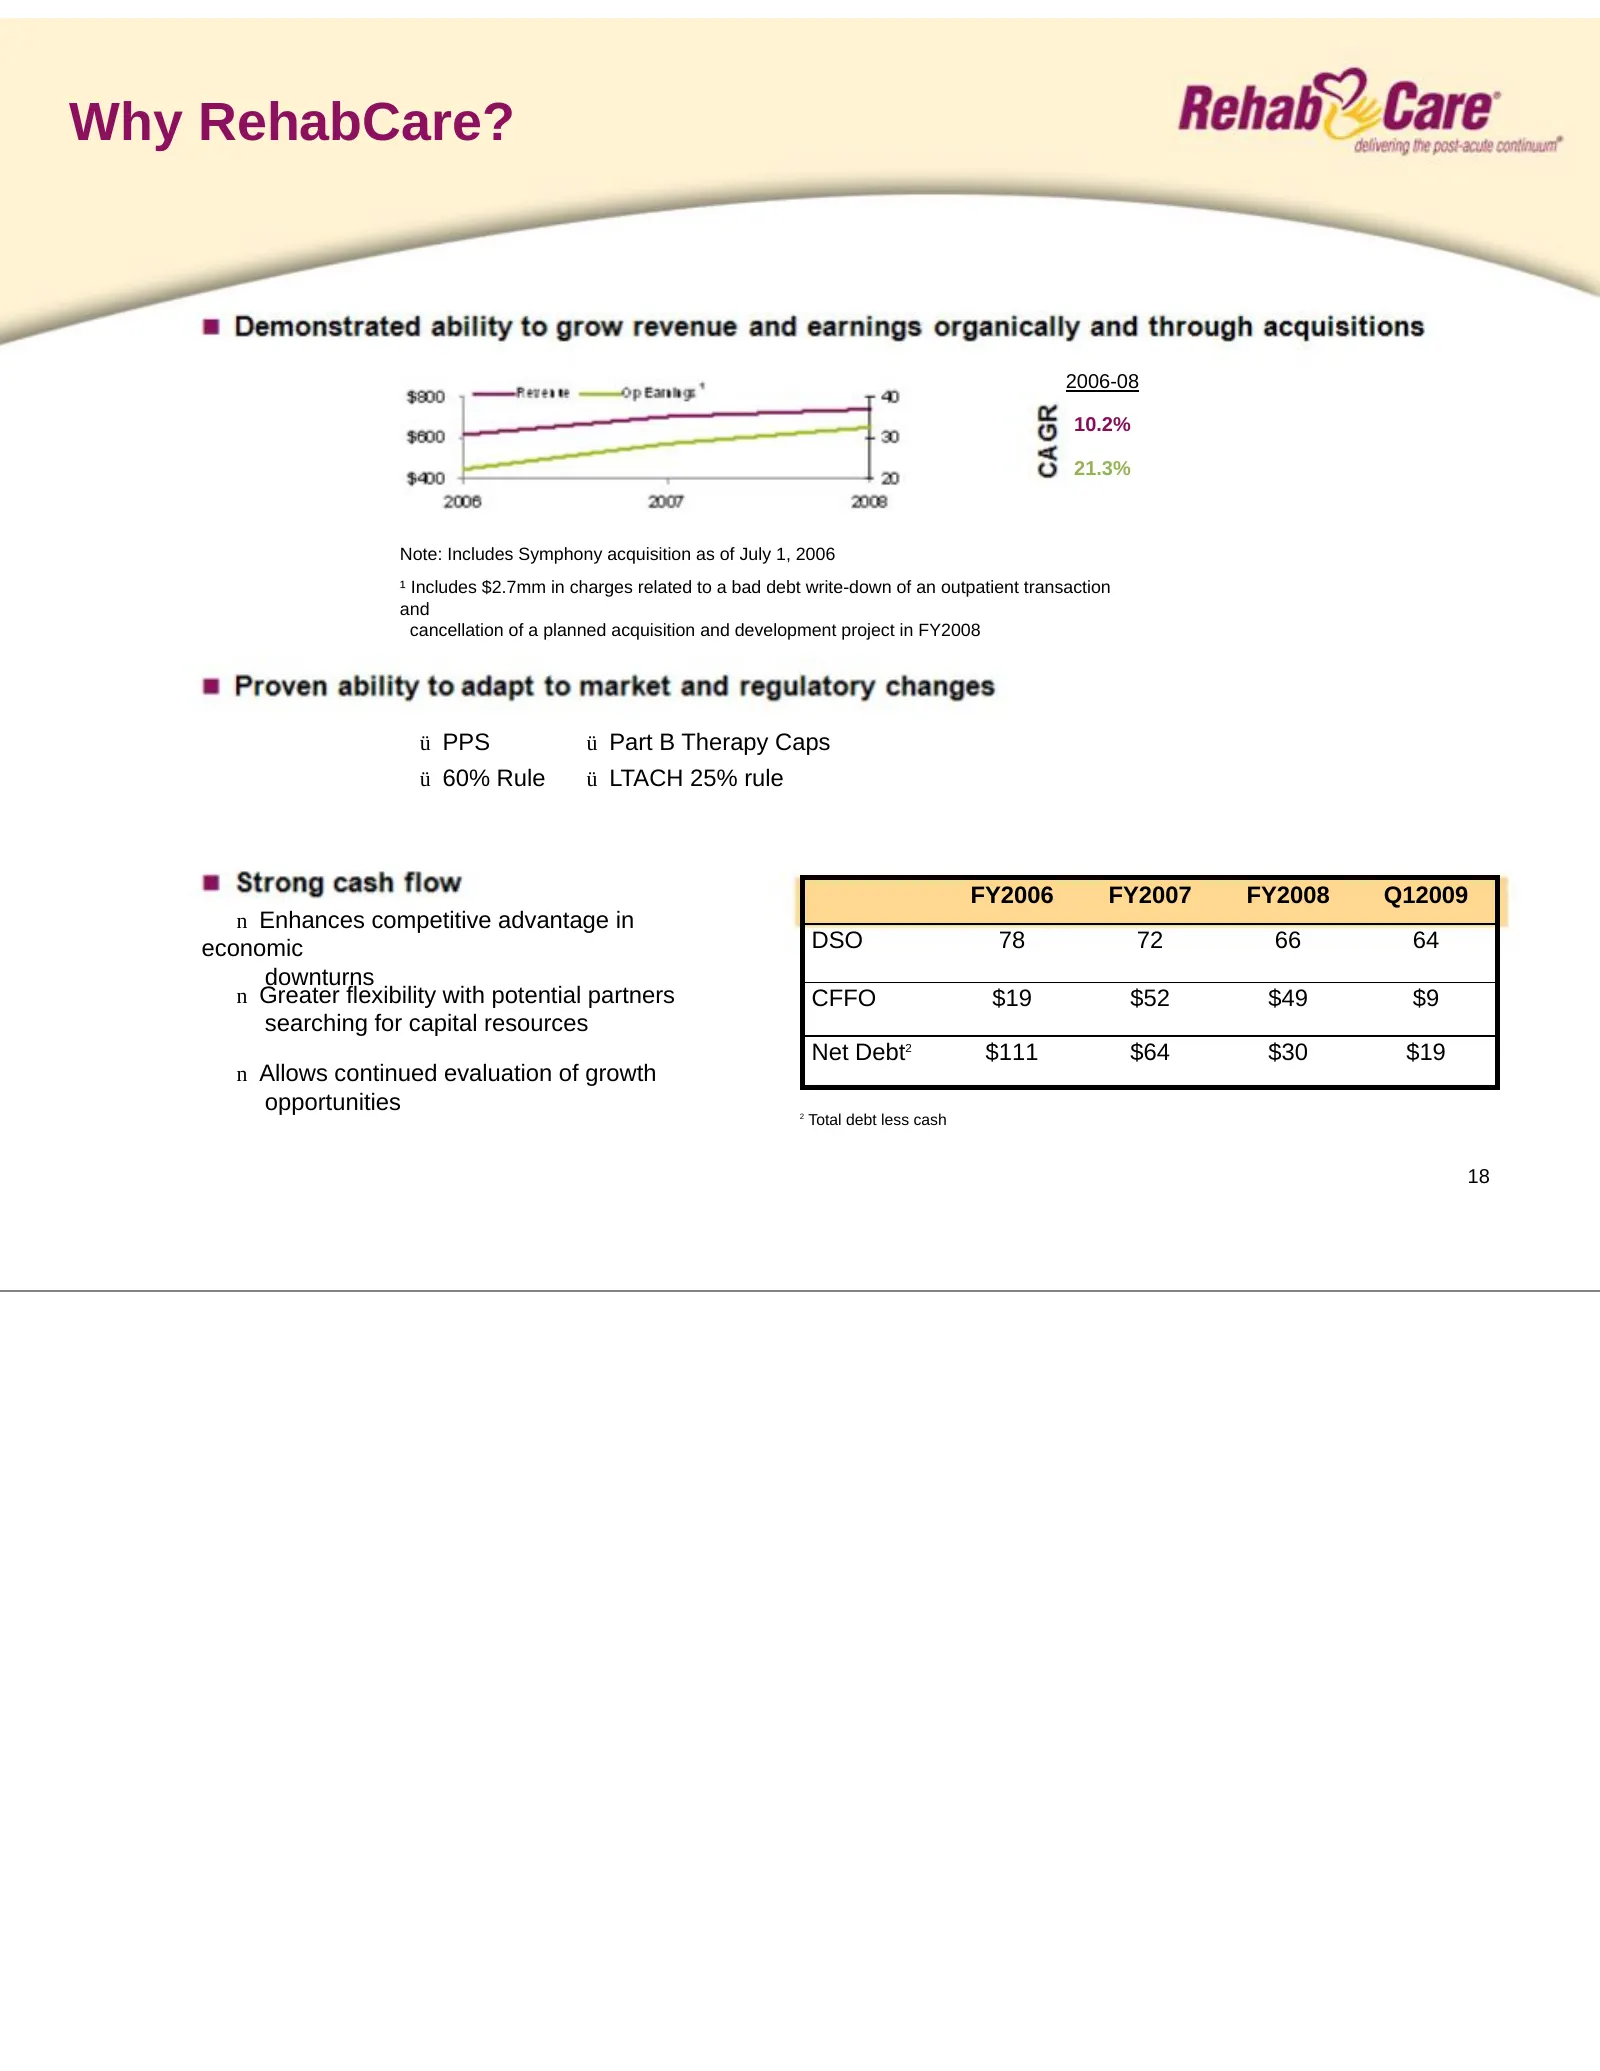
Why RehabCare? 2006-08 10.2% 21.3% Note: Includes Symphony acquisition as of July 1, 2006 ¹ Includes $2.7mm in charges related to a bad debt write-down of an outpatient transaction and cancellation of a planned acquisition and development project in FY2008 ü PPS ü Part B Therapy Caps ü 60% Rule ü LT
Slide 20: Safe Harbor
Safe Harbor Forward-looking statements have been provided pursuant to the safe harbor provisions of the Private Securities Litigation Reform Act of 1995. Such statements are based on the Company’s current expectations and could be affected by numerous factors, risks and uncertainties discussed in th
Source: SEC EDGAR · 8-K filed May 12, 2009
More decks from Rehabcare Group Inc
 Merger or Acquisition (May 2011)42 slides · May 12, 2011
 Merger or Acquisition (March 2011)35 slides · Mar 16, 2011
 Merger or Acquisition (March 2011)28 slides · Mar 3, 2011
 Merger or Acquisition (February 2011)15 slides · Feb 10, 2011
 J.P. Morgan Healthcare Conference 201127 slides · Jan 10, 2011
 Q3 2010 Earnings Presentation26 slides · Nov 17, 2010