SUSS MicroTec SE · XETR:SMHN
SUSS MicroTec — Q1 2018 Earnings Presentation
9 slides from SUSS MicroTec's earnings presentation, May 3, 2018
Slide 1: SUSS MicroTec – Q1 Results 2018
SUSS MICROTEC – Q1 RESULTS 2018 MAY 3, 2018
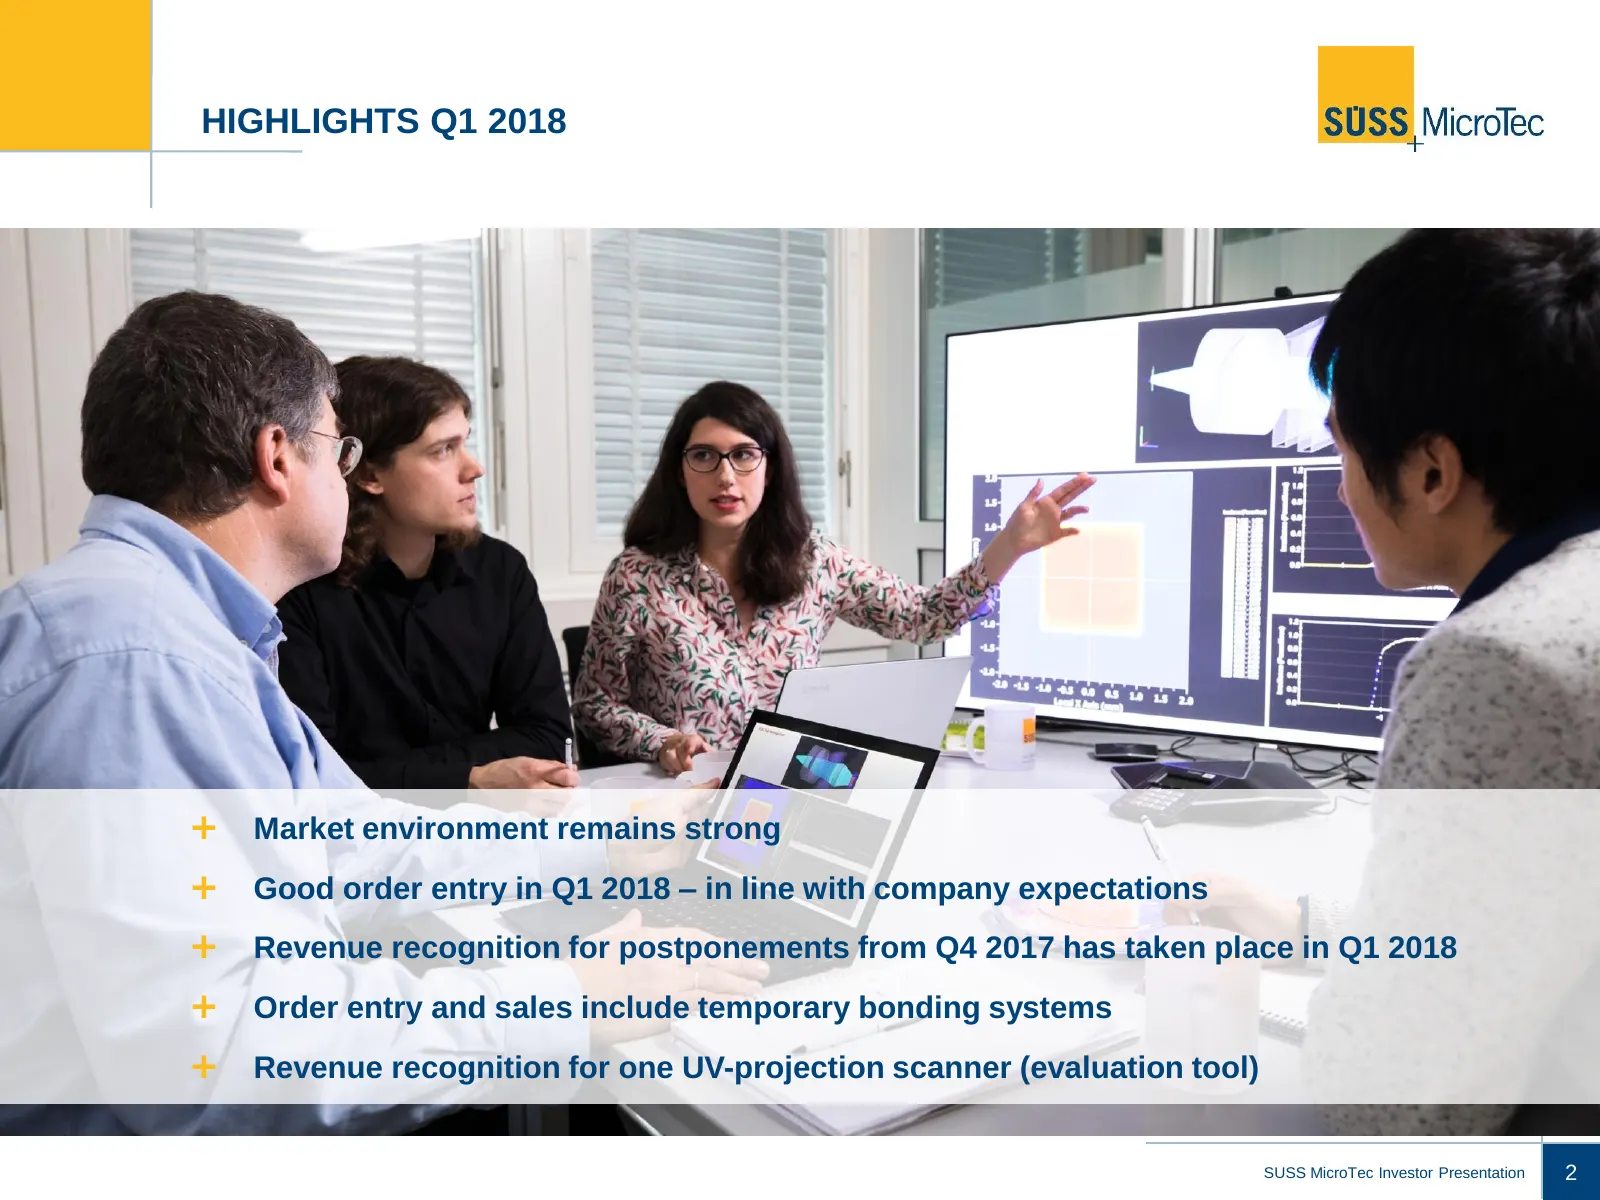
Slide 2: Highlights Q1 2018
HIGHLIGHTS Q1 2018 Market environment remains strong Good order entry in Q1 2018 – in line with company expectations Revenue recognition for postponements from Q4 2017 has taken place in Q1 2018 Order entry and sales include temporary bonding systems Revenue recognition for one UV-projecti
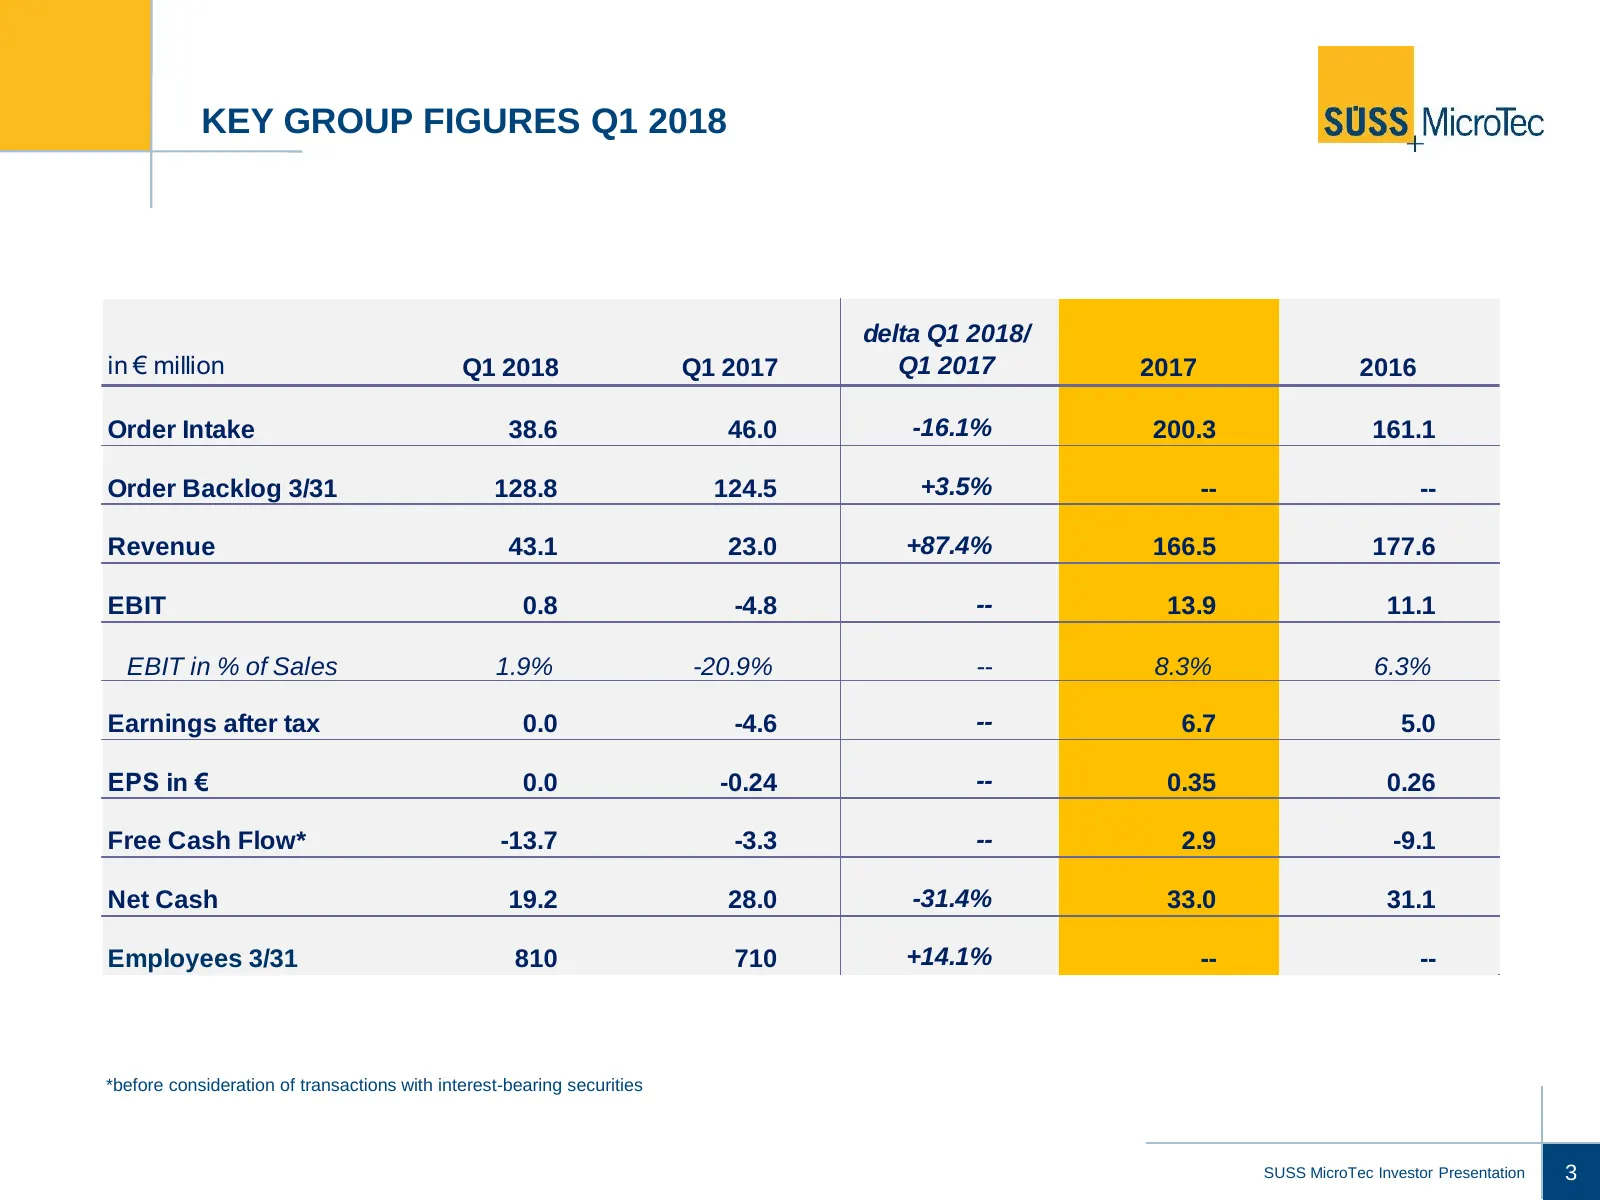
Slide 3: Key Group Figures Q1 2018
KEY GROUP FIGURES Q1 2018 delta Q1 2018/ in € million Q1 2018 Q1 2017 Q1 2017 2017 2016 Order Intake 38.6 46.0 -16.1% 200.3 161.1 Order Backlog 3/31 128.8 124.5 +3.5% -- -- Revenue 43.1 23.0 +87.4% 166.5 177.6 EBIT 0.8 -4.8 -- 13.9 11.1 EBIT in % of Sales 1.9% -20.9% -- 8.3% 6.3% Earnings after tax
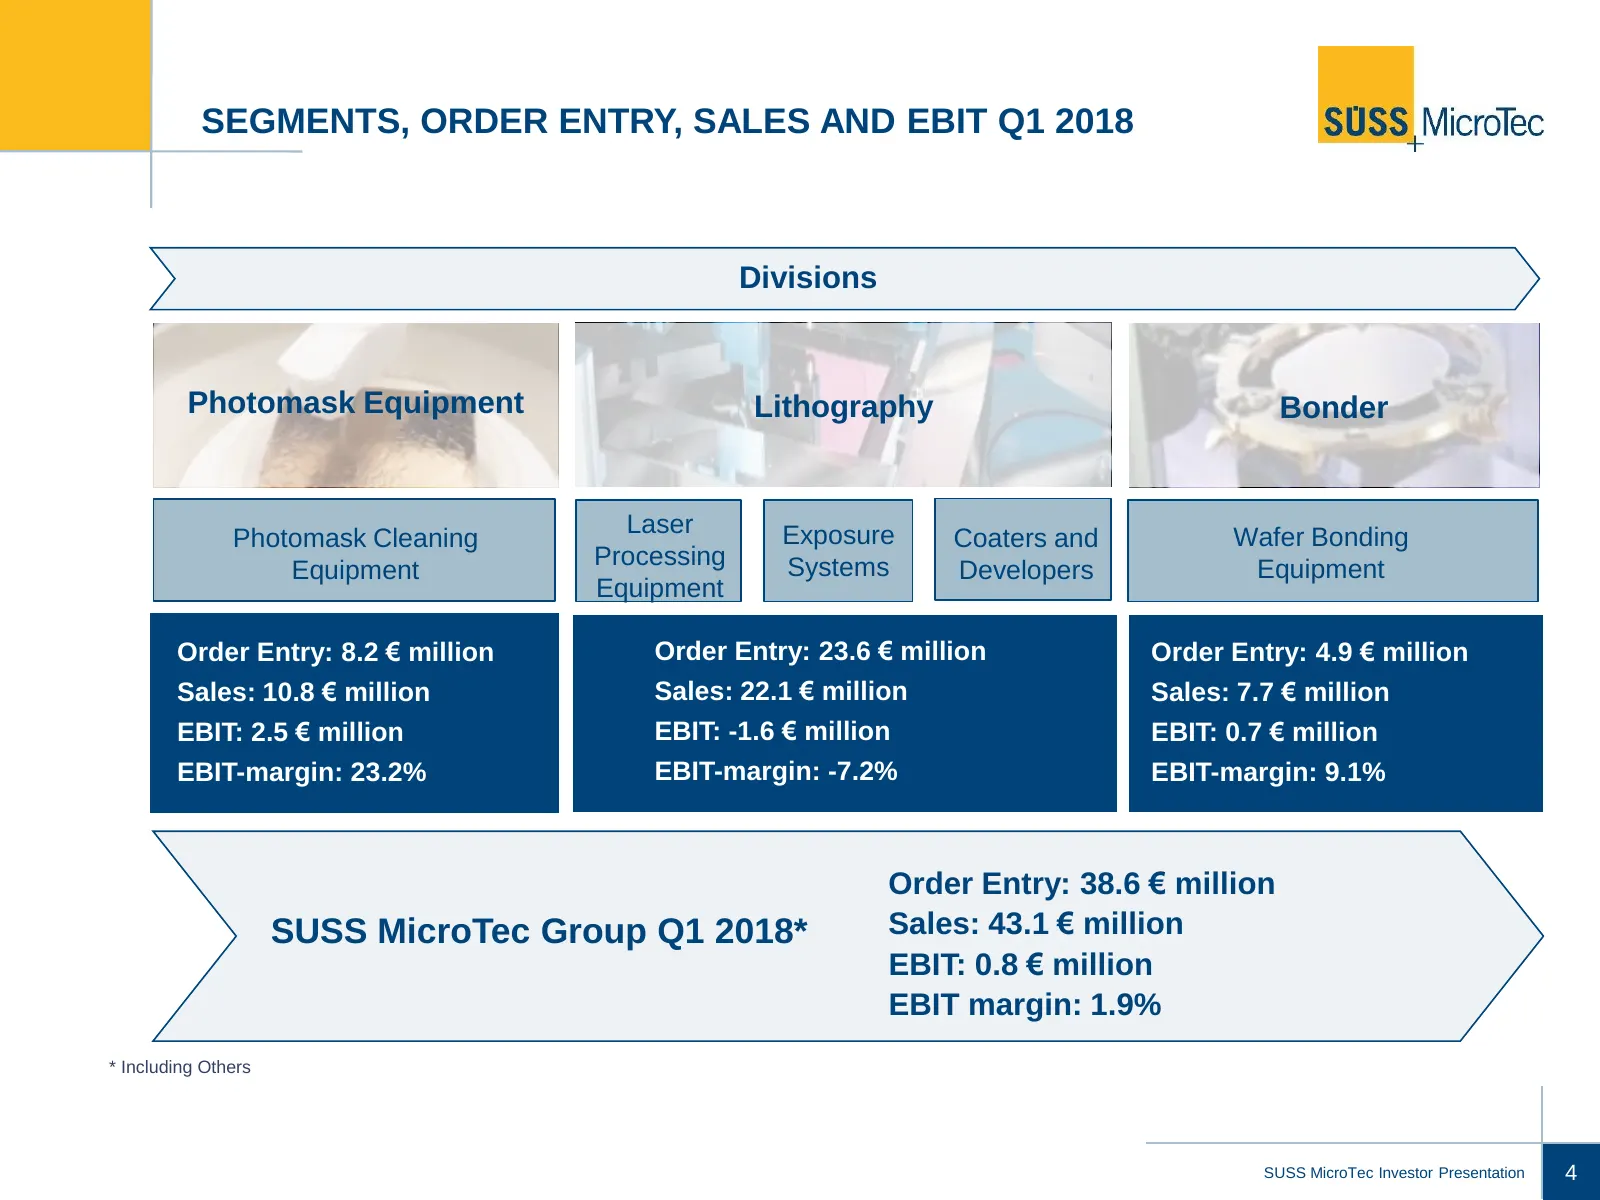
Slide 4: Segments, Order Entry, Sales and EBIT Q1 2018
SEGMENTS, ORDER ENTRY, SALES AND EBIT Q1 2018 Divisions Photomask Equipment Lithography Bonder Laser Exposure Photomask Cleaning Coaters and Wafer Bonding Processing Systems Equipment Developers Equipment Equipment Order Entry: 8.2 € million Order Entry: 23.6 € million Order Entry: 4.9 € million Sal
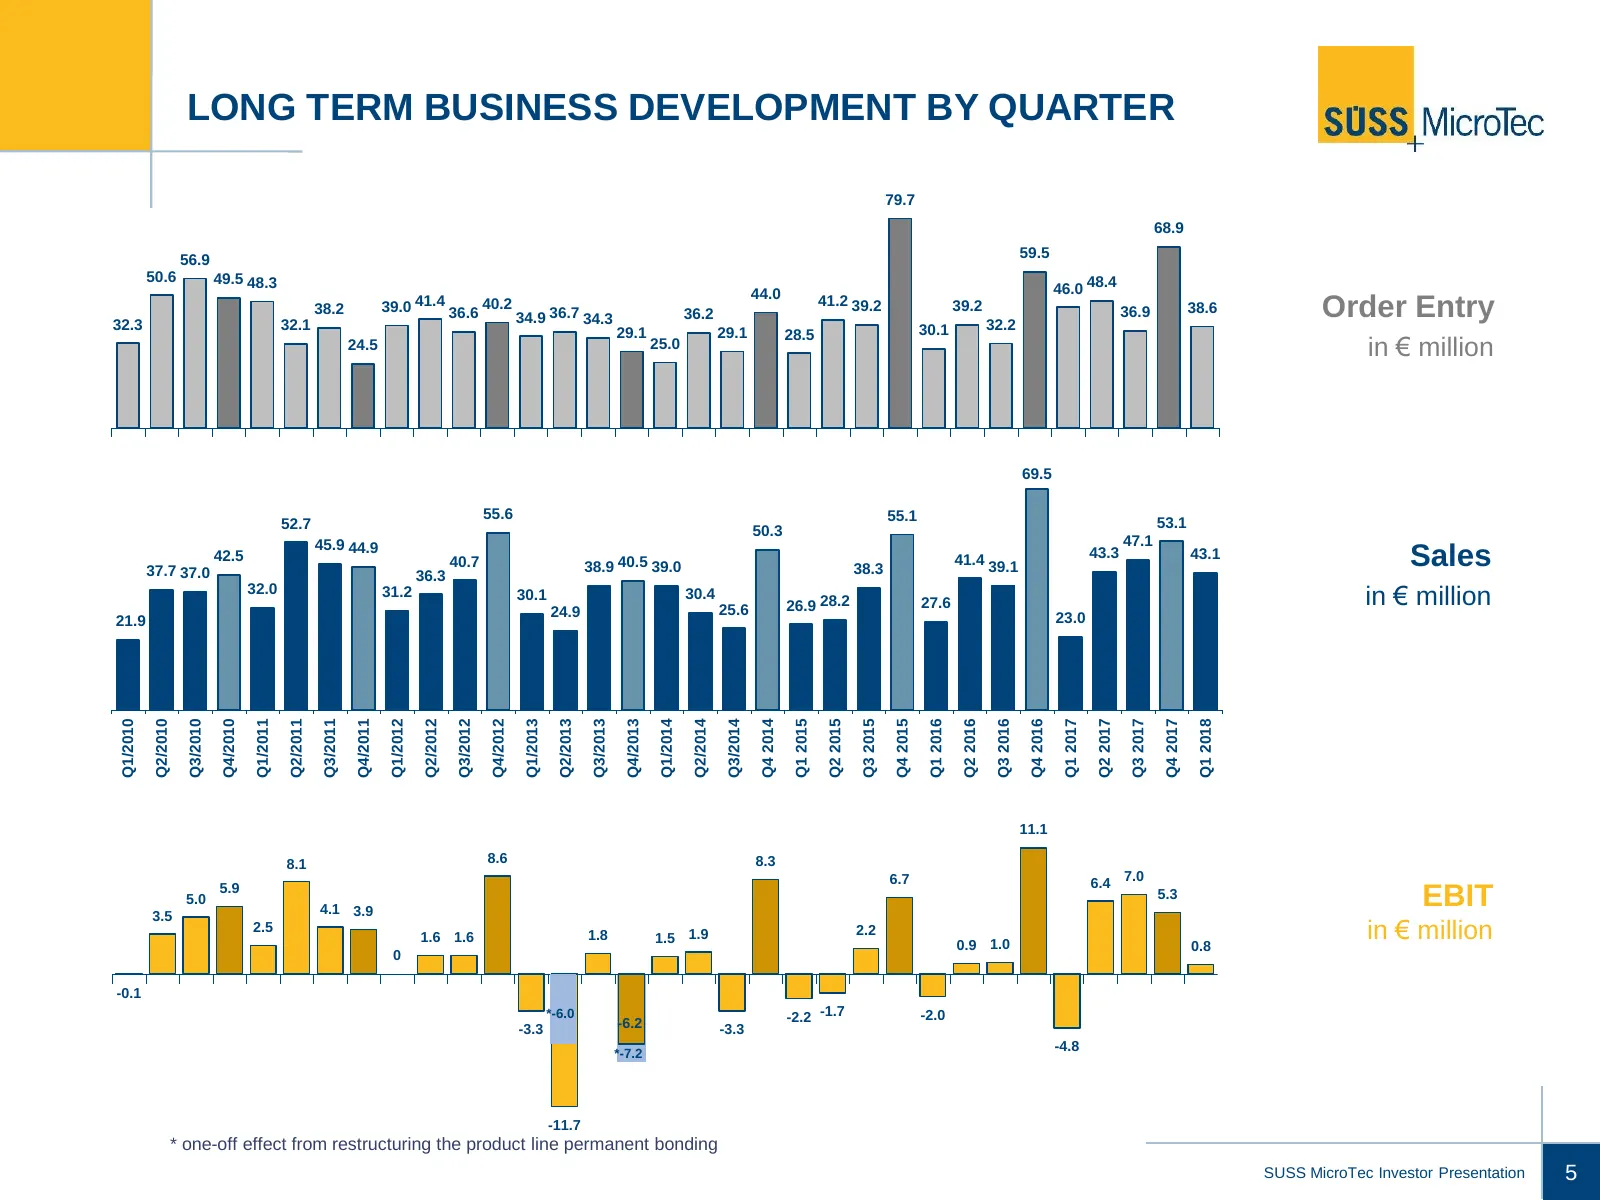
Slide 5: Long Term Business Development by Quarter
LONG TERM BUSINESS DEVELOPMENT BY QUARTER 79.7 68.9 56.9 59.5 50.6 49.5 48.3 44.0 46.0 48.4 32.3 32.1 38.2 39.0 41.4 36.6 40.2 34.9 36.7 34.3 36.2 41.2 39.2 39.2 32.2 36.9 38.6 Order Entry 29.1 29.1 28.5 30.1 24.5 25.0 in € million 69.5 55.6 55.1 52.7 53.1 50.3 45.9 44.9 47.1 37.7 37.0 42.5 36.3 40.
Slide 6: Outlook
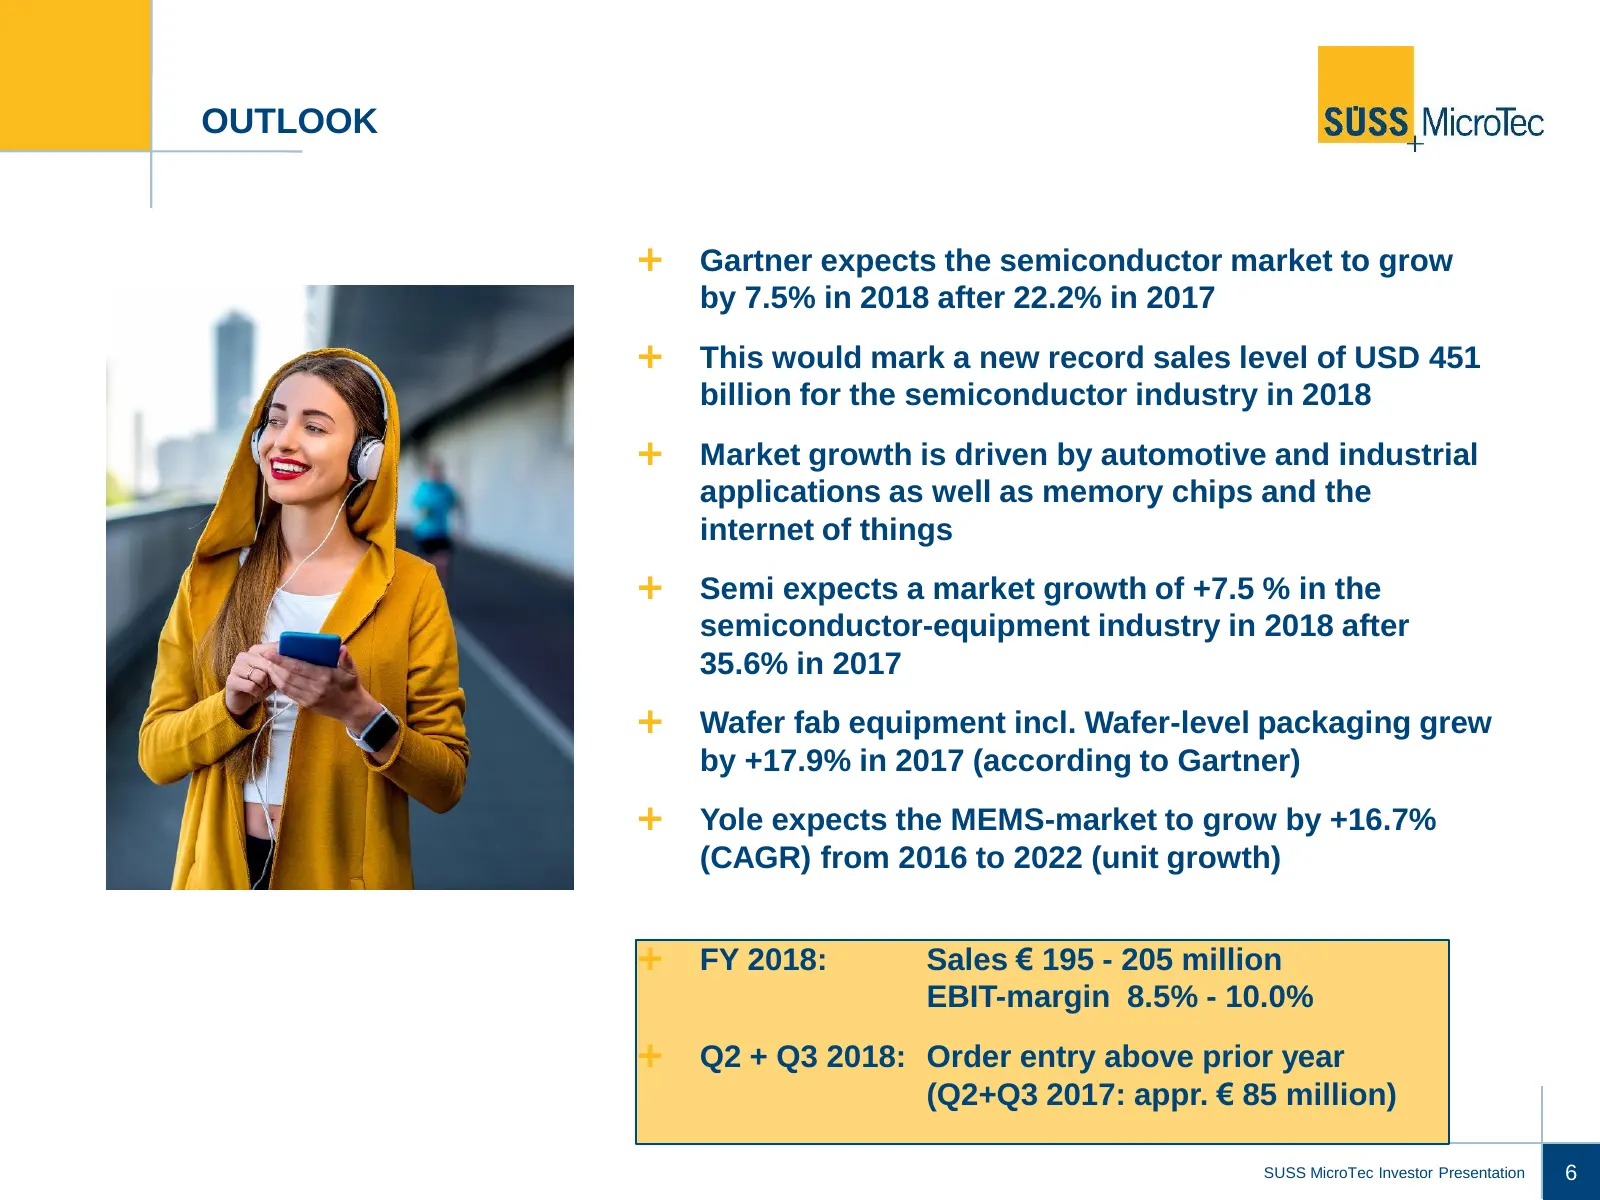
OUTLOOK Gartner expects the semiconductor market to grow by 7.5% in 2018 after 22.2% in 2017 This would mark a new record sales level of USD 451 billion for the semiconductor industry in 2018 Market growth is driven by automotive and industrial applications as well as memory chips and the inte
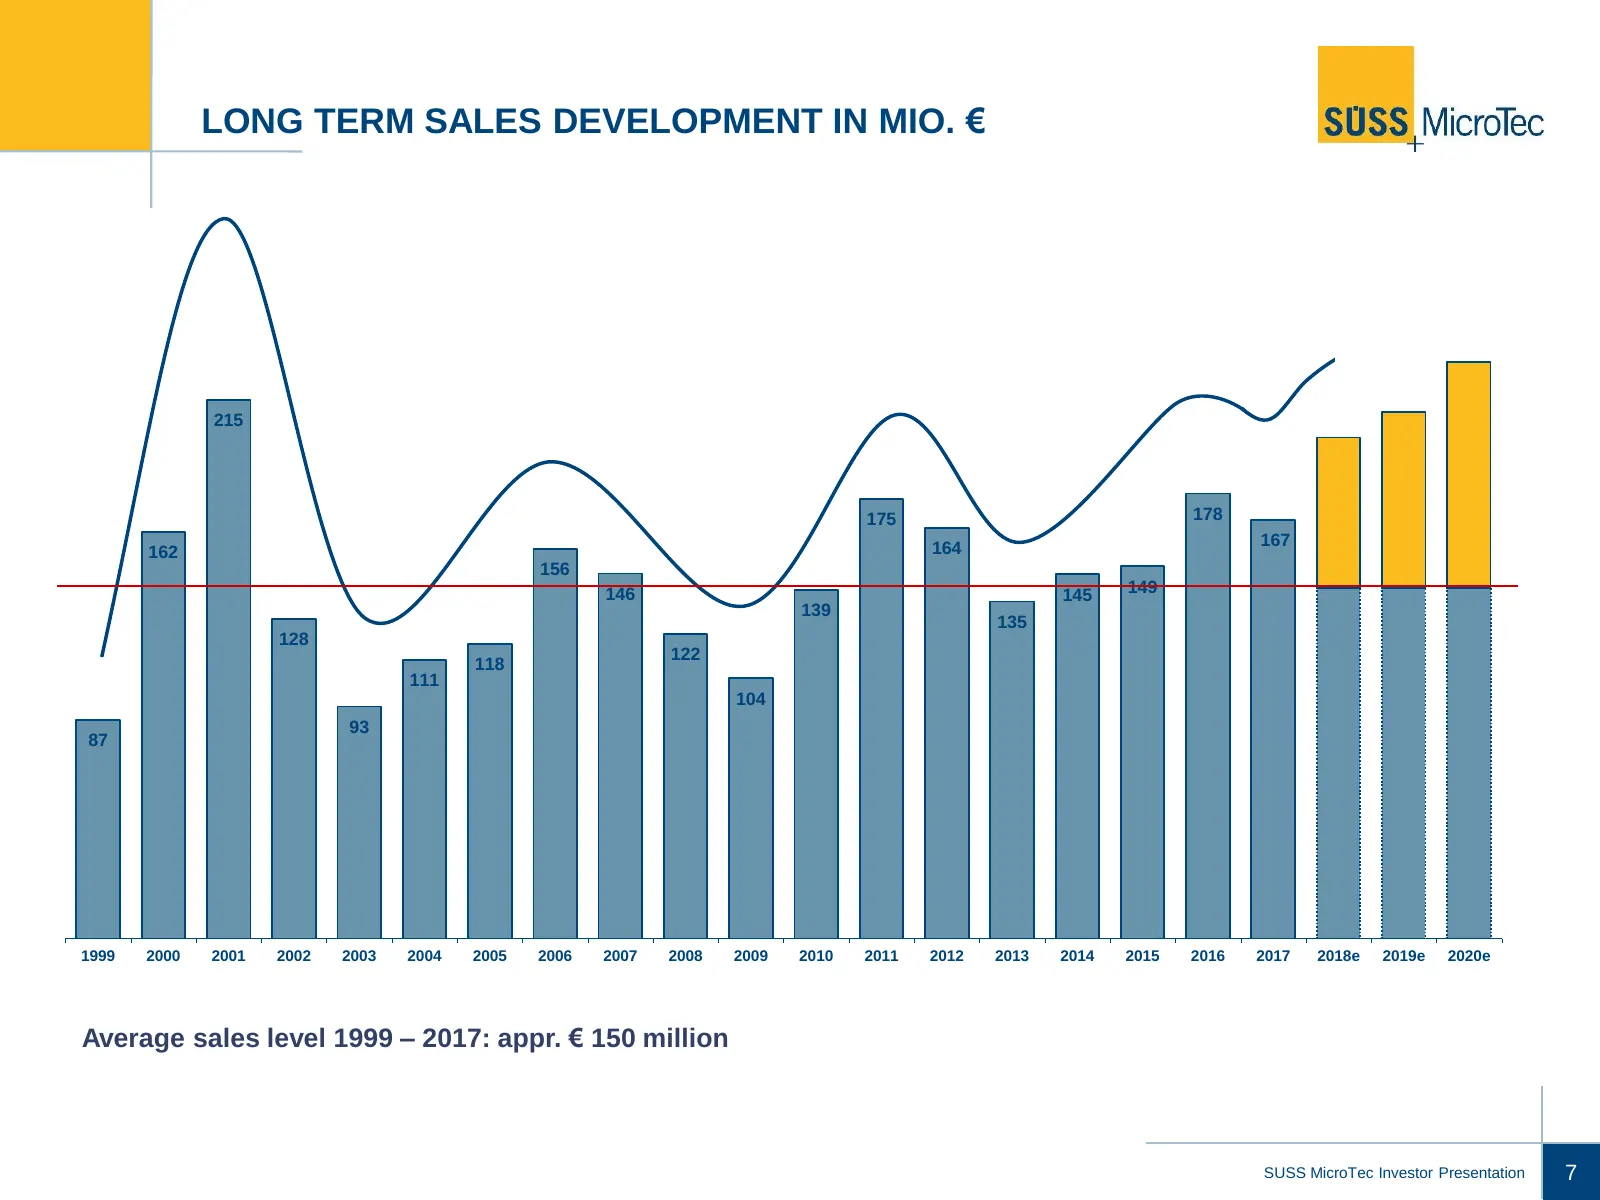
Slide 7: Long Term Sales Development in Mio. €
LONG TERM SALES DEVELOPMENT IN MIO. € 215 175 178 164 167 162 156 146 145 149 139 135 128 122 118 111 104 93 87 1999 2000 2001 2002 2003 2004 2005 2006 2007 2008 2009 2010 2011 2012 2013 2014 2015 2016 2017 2018e 2019e 2020e Average sales level 1999 – 2017: appr. € 150 million SUSS MicroTec Investor
Slide 8: Disclaimer
DISCLAIMER This presentation contains forward-looking statements relating to the business, financial performance and earnings of SUSS MicroTec SE and its subsidiaries and associates. Forward-looking statements are based on current plans, estimates, projections and expectations and are therefore subj

Slide 9: SÜSS MicroTec SE contact
SÜSS MicroTec SE Schleissheimer Str. 90 85748 Garching www.suss.com SUSS MicroTec Investor Presentation 9
Source: Internet Archive copy of suss.com
More decks from SUSS MicroTec SE
 9M 2026 Earnings Presentation23 slides · Nov 5, 2026
 Investor Presentation (October 2026)41 slides · October 2026
 H1 2026 Earnings Presentation24 slides · Aug 6, 2026
 Q1 2026 Earnings Presentation19 slides · May 7, 2026
 FY2025 Earnings Presentation26 slides · Mar 30, 2026
 Investor Presentation (March 2026)42 slides · Mar 1, 2026