Regional Management Corp. · NYSE:RM
Regional Management — Debt Investor Presentation (October 2025)
33 slides from Regional Management's debt investor presentation, Oct 7, 2025
Slide 1: ABS Investor Presentation October 7, 2025
ABS Investor Presentation October 7, 2025
Slide 2: Legal Disclosures
Legal Disclosures The information contained in this electronic presentation (the “Information”) is being provided to you on a confidential basis solely for your review and may not be downloaded, copied, reproduced, or redistributed, in whole or in part, directly or indirectly, by you. The Informatio
Slide 3: Legal Disclosures (continued)
Legal Disclosures (continued) Factors that could cause actual results or performance to differ from the expectations expressed or implied in forward-looking statements include, but are not limited to, the following: managing growth effectively, implementing Regional Management's growth strategy, and

Slide 4: Company Overview
Company Overview
Slide 5: Company Overview
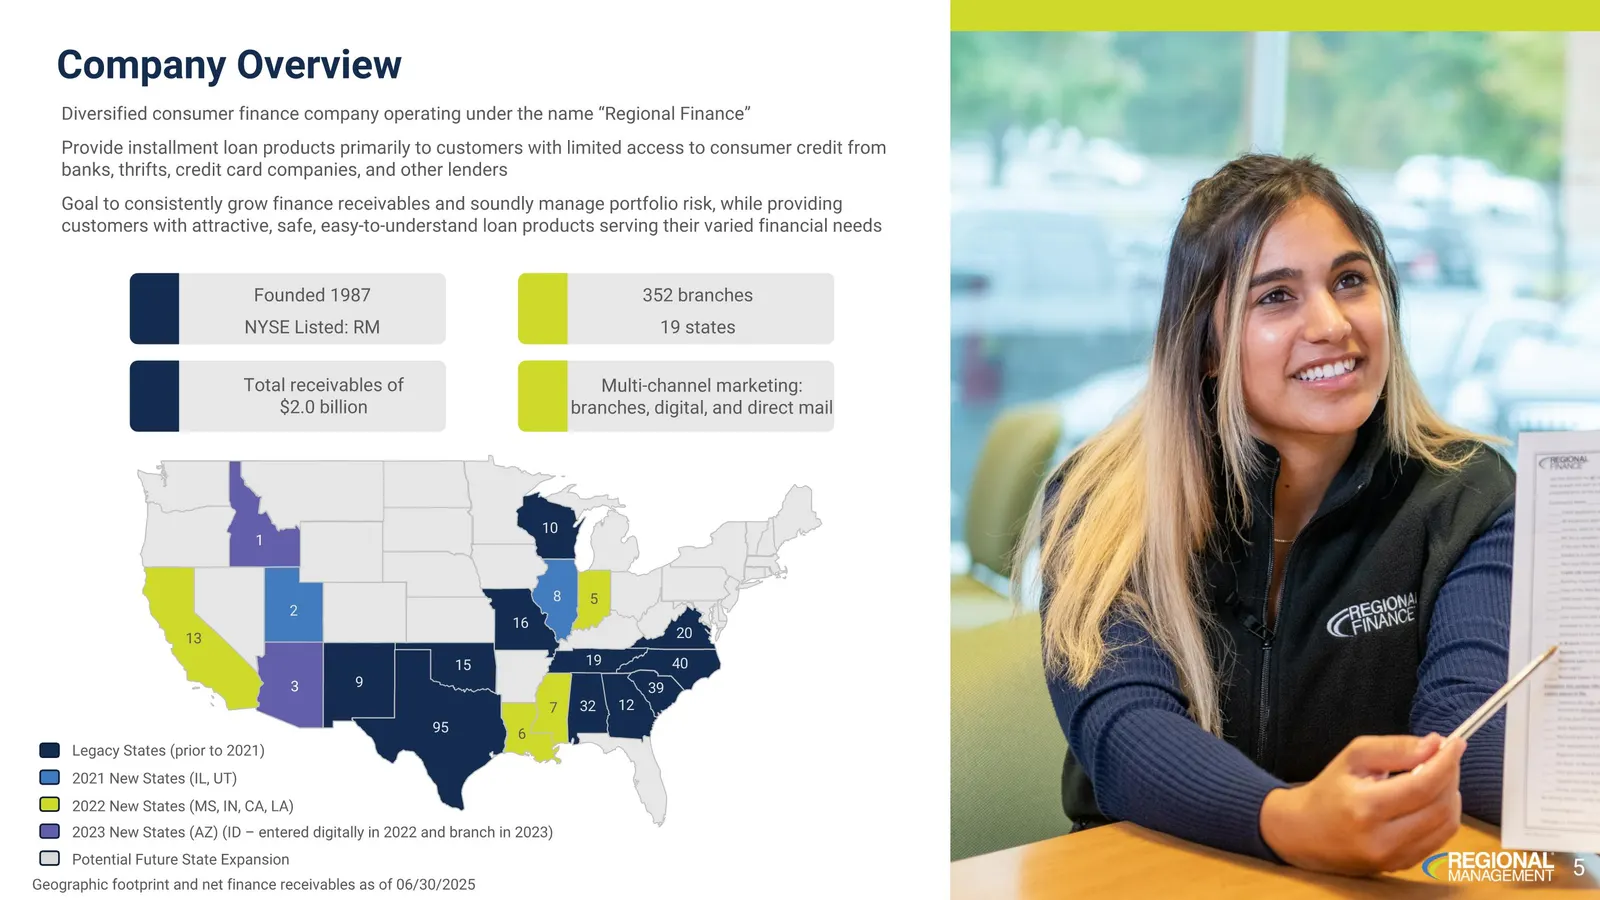
Company Overview Founded 1987 NYSE Listed: RM 352 branches 19 states Total receivables of $2.0 billion Multi-channel marketing: branches, digital, and direct mail Legacy States (prior to 2021) 2021 New States (IL, UT) 2022 New States (MS, IN, CA, LA) Potential Future State Expansion Geographic footp
Slide 6: Growth Strategy
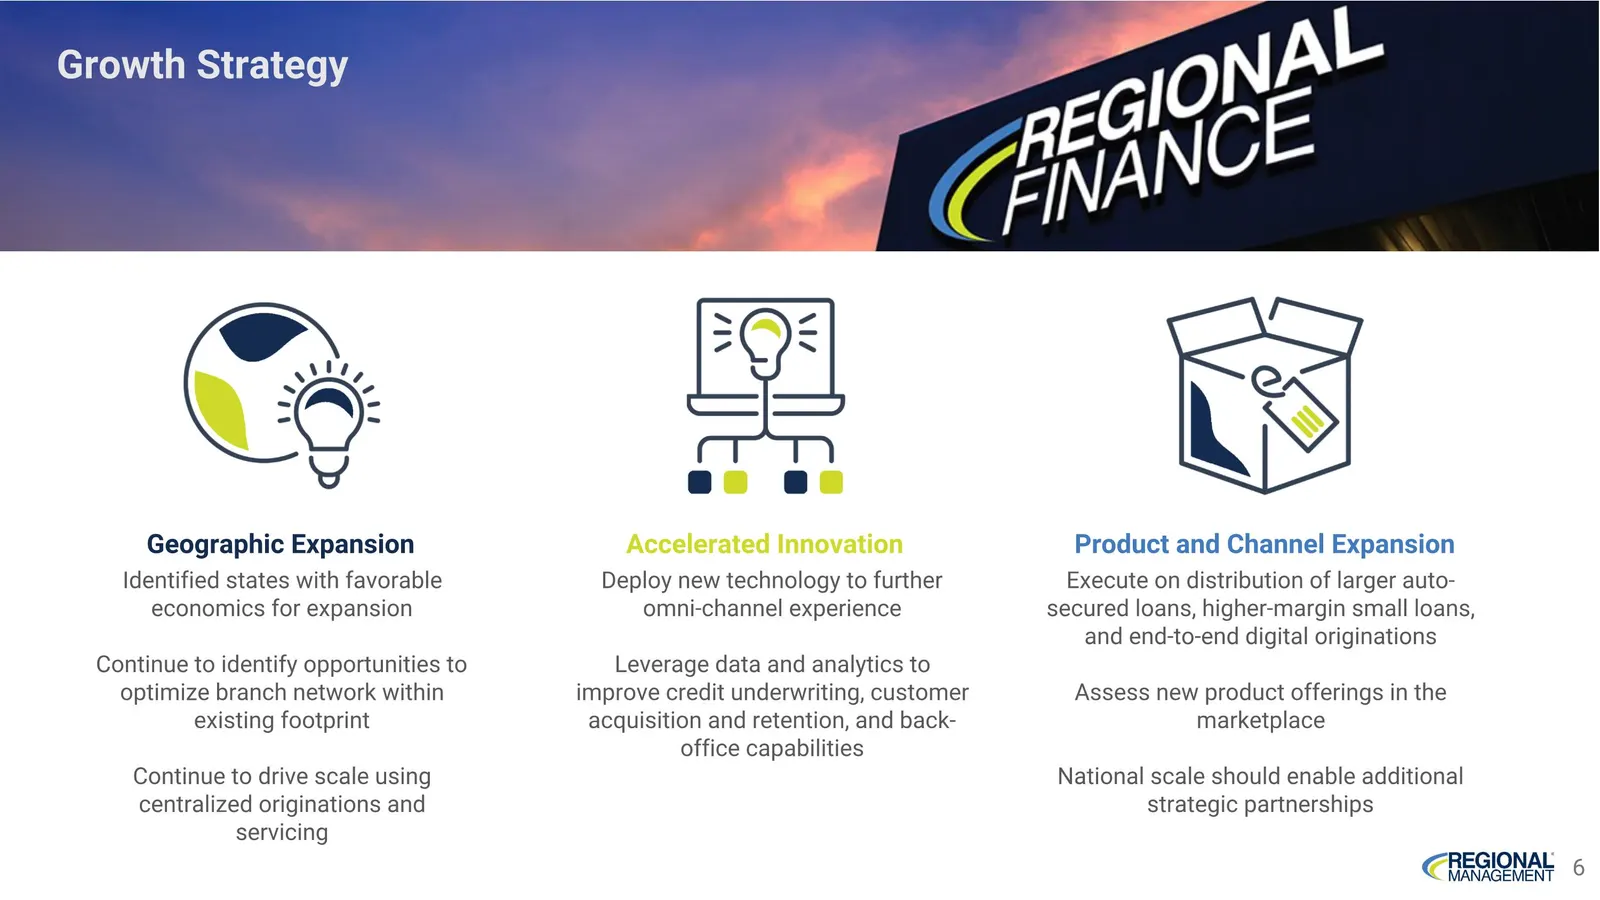
Growth Strategy Geographic Expansion Accelerated Innovation Product and Channel Expansion Identified states with favorable economics for expansion Continue to identify opportunities to optimize branch network within existing footprint Continue to drive scale using centralized originations and servic
Slide 7: Investment Highlights
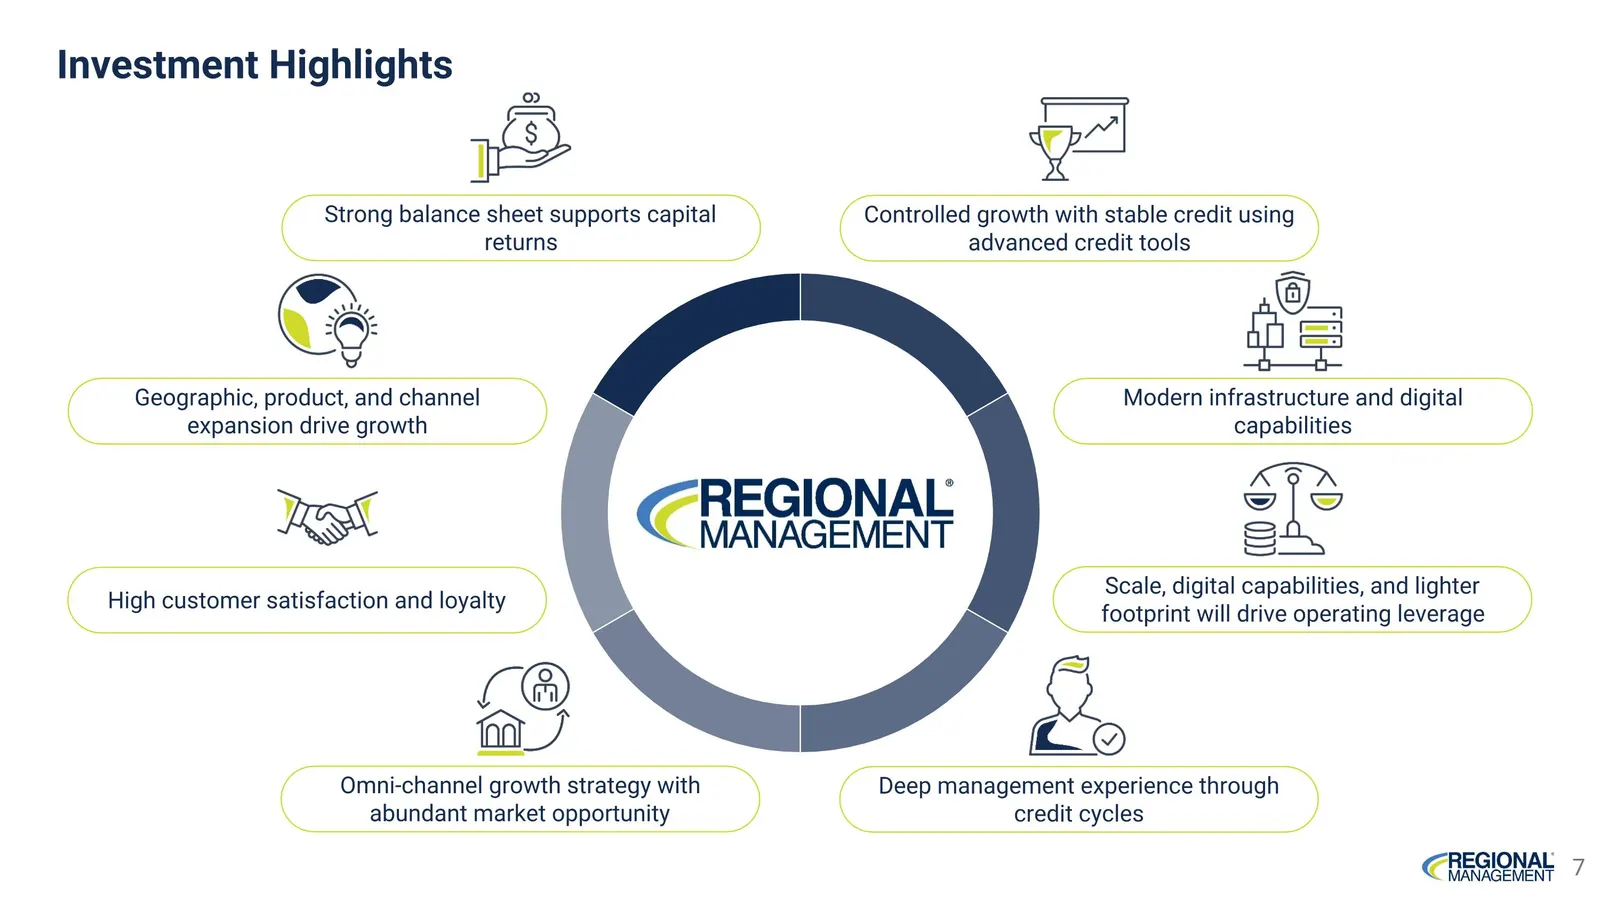
Investment Highlights Strong balance sheet supports capital returns Geographic, product, and channel expansion drive growth Omni-channel growth strategy with abundant market opportunity Controlled growth with stable credit using advanced credit tools Modern infrastructure and digital capabilities De
Slide 8: Financial Overview: Key Financial Results
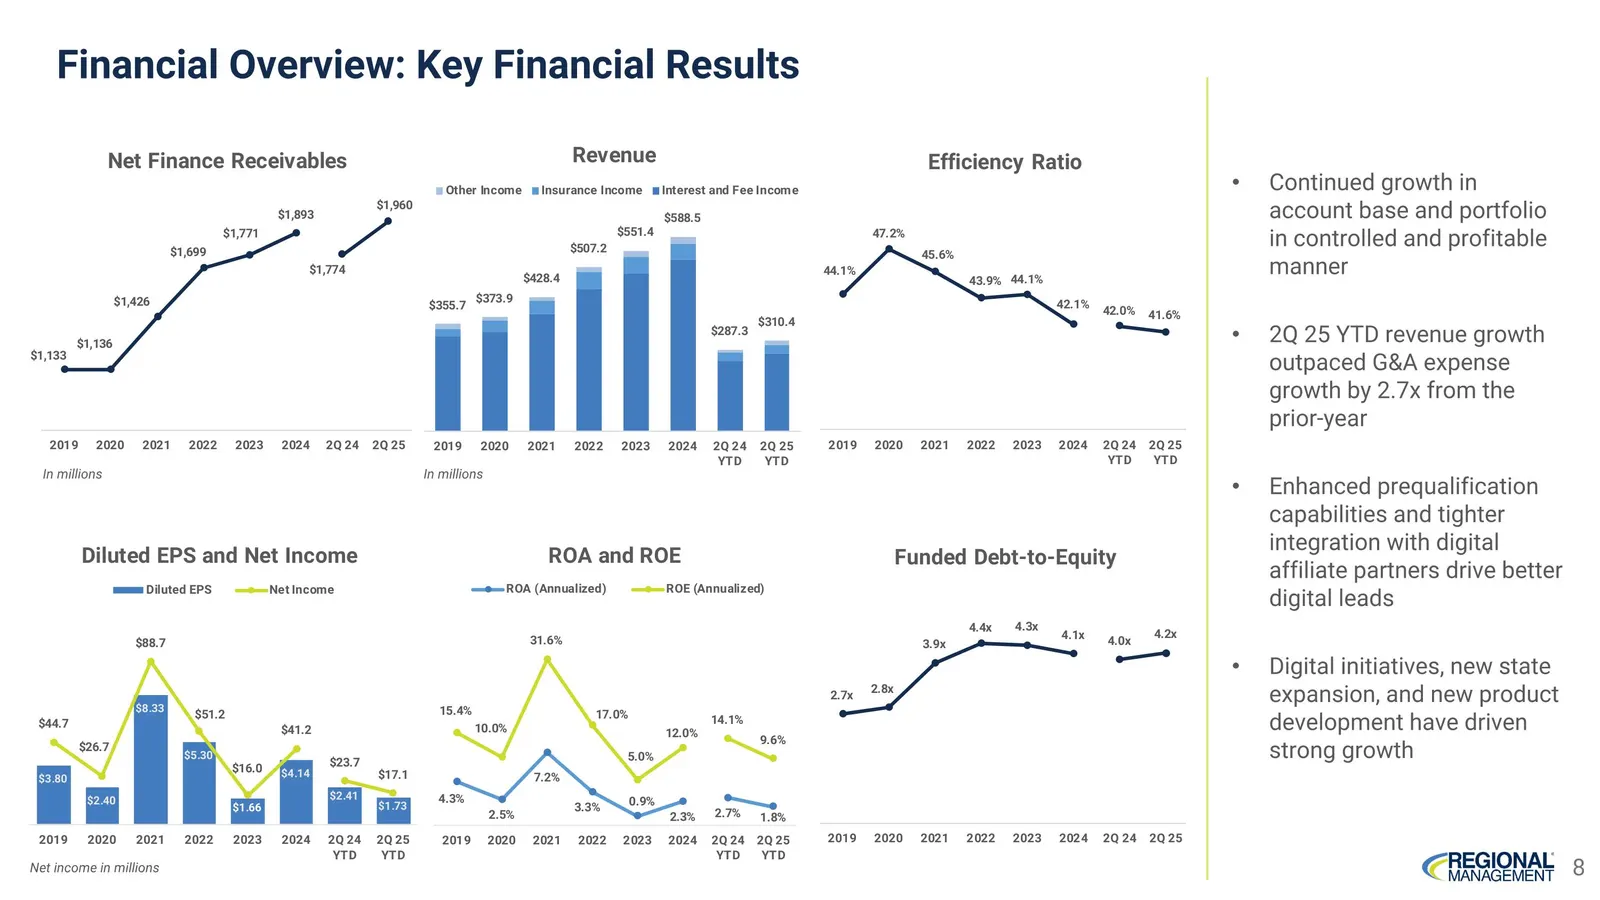
Financial Overview: Key Financial Results In millions Continued growth in account base and portfolio in controlled and profitable manner 2Q 25 YTD revenue growth outpaced G&A expense growth by 2.7x from the prior-year Enhanced prequalification capabilities and tighter integration with digital affili
Slide 9: Abundant Total Addressable Market
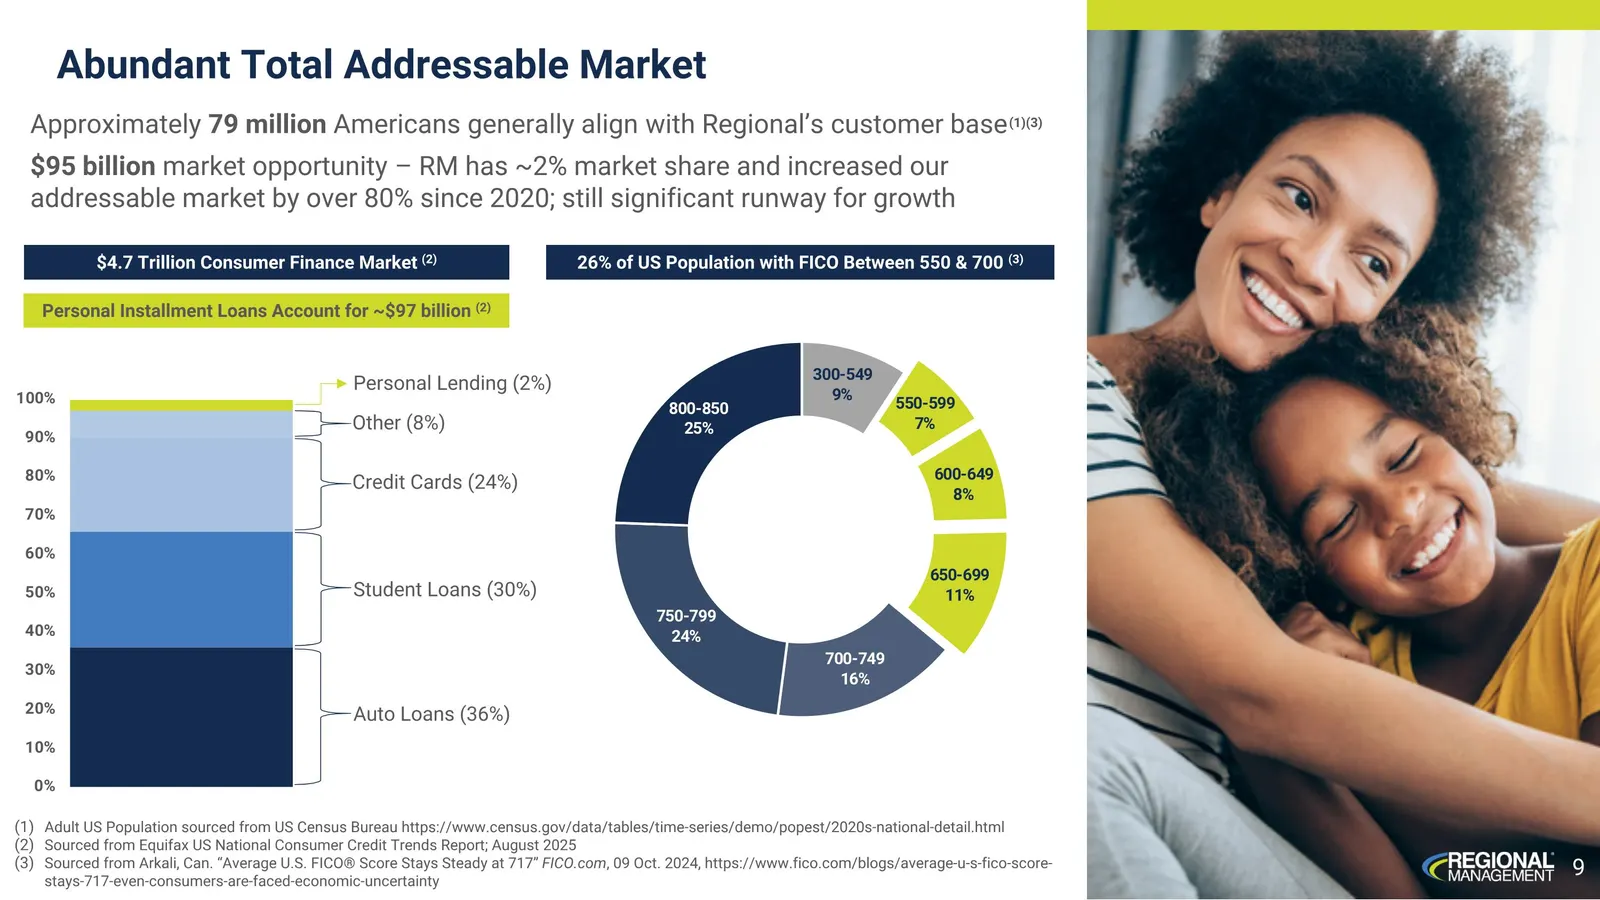
Abundant Total Addressable Market Approximately 79 million Americans generally align with Regional’s customer base (1)(3) $95 billion market opportunity – RM has ~2% market share and increased our addressable market by over 80% since 2020; still significant runway for growth $4.7 Trillion Consumer F
Slide 10: Serving Our Customers Best
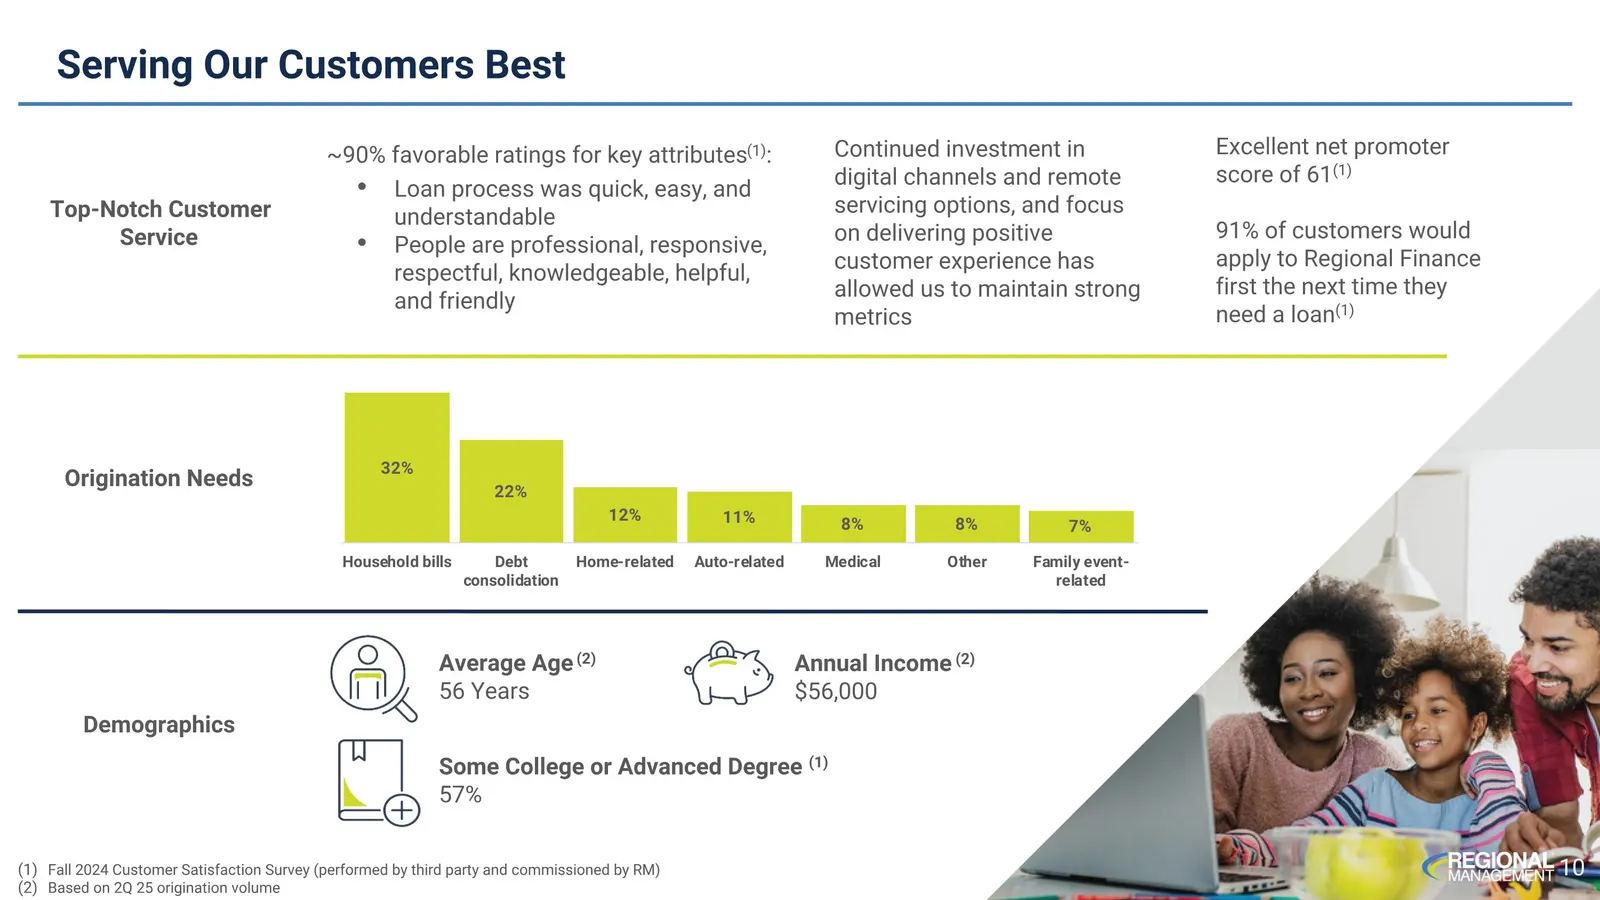
Serving Our Customers Best Excellent net promoter score of 61(1) 91% of customers would apply to Regional Finance first the next time they need a loan(1) ~90% favorable ratings for key attributes(1): Loan process was quick, easy, and understandable People are professional, responsive, respectful, kn
Slide 11: Product Offerings
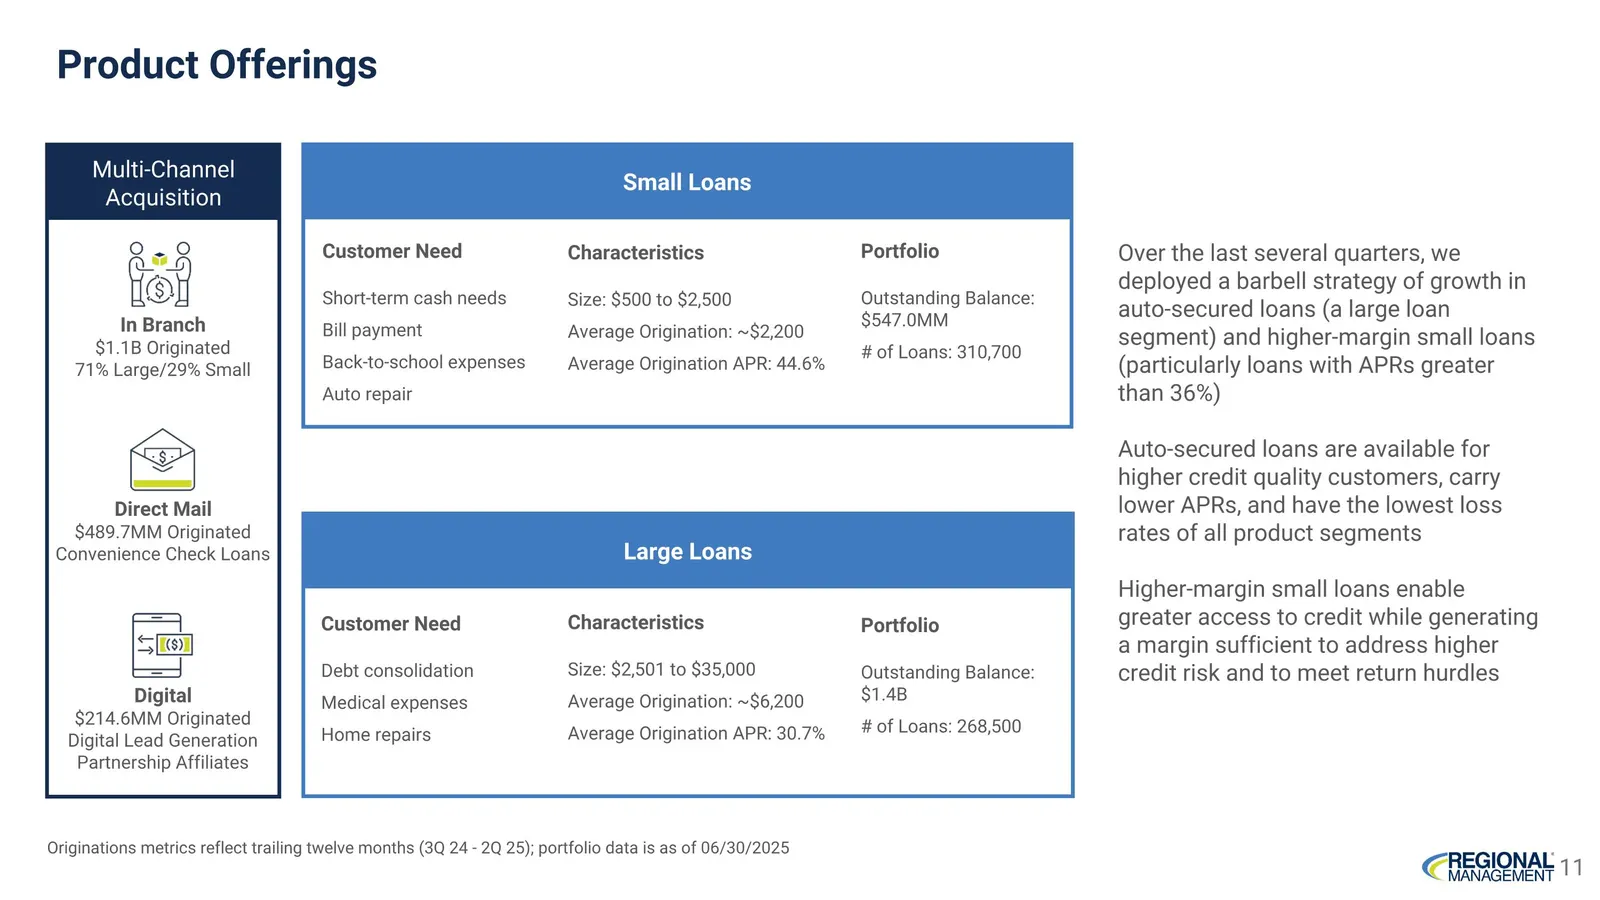
Product Offerings Multi-Channel Acquisition Small Loans Large Loans In Branch $1.1B Originated 71% Large/29% Small Direct Mail $489.7MM Originated Convenience Check Loans Digital $214.6MM Originated Digital Lead Generation Partnership Affiliates Customer Need Short-term cash needs Bill payment Back-
Slide 12: Originations
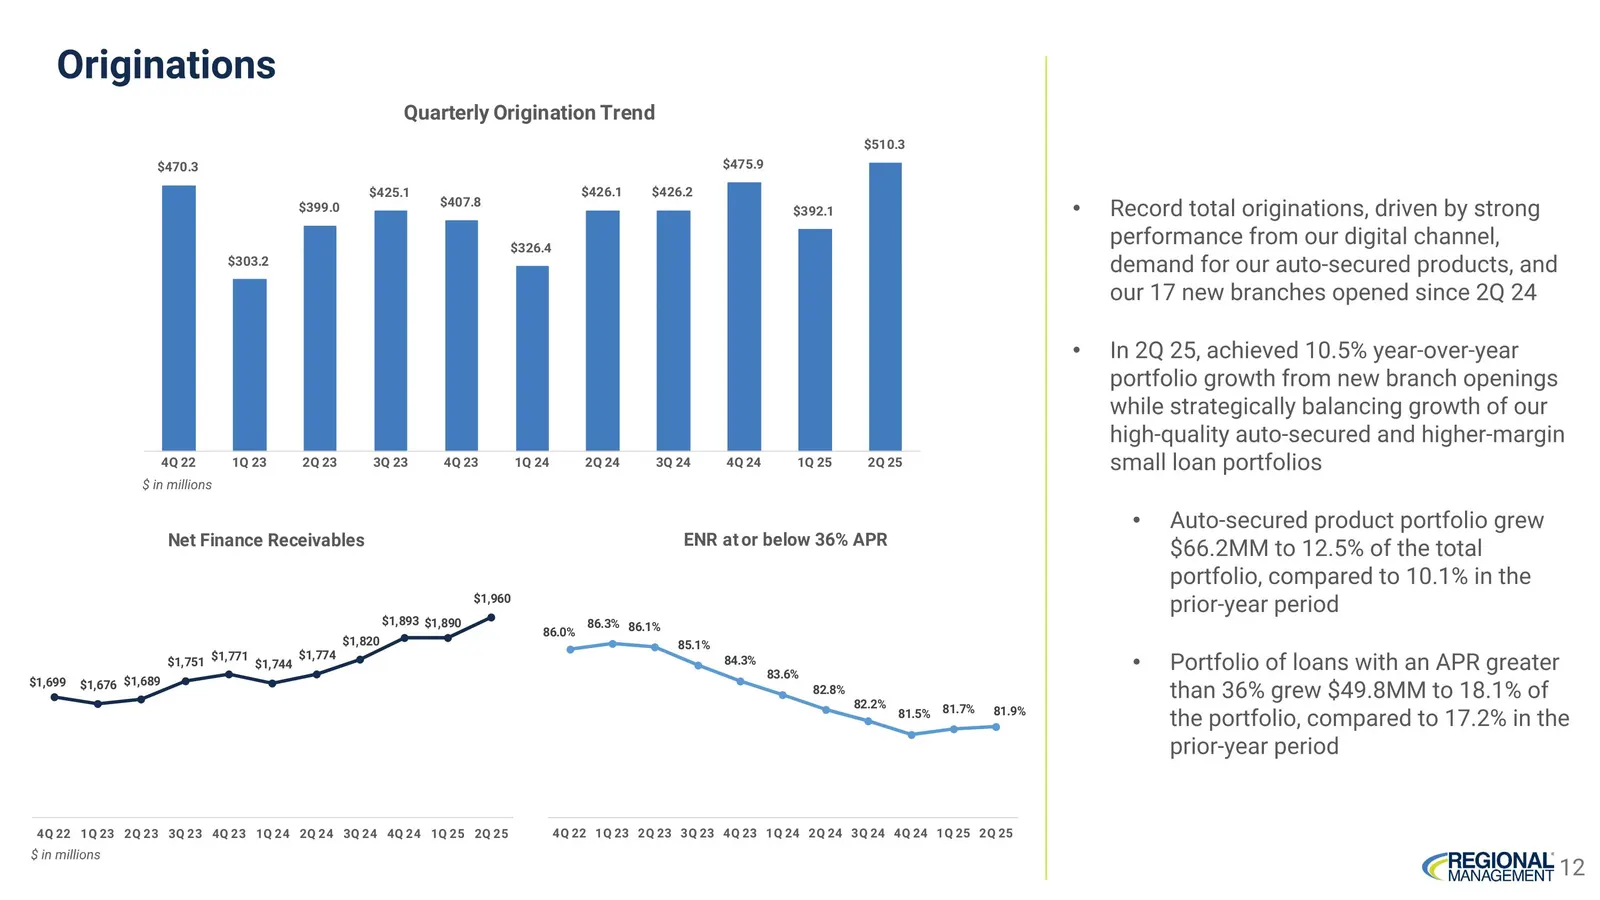
Originations $ in millions Record total originations, driven by strong performance from our digital channel, demand for our auto-secured products, and our 17 new branches opened since 2Q 24 In 2Q 25, achieved 10.5% year-over-year portfolio growth from new branch openings while strategically balancin

Slide 13: Funding
Funding
Slide 14: Diversified Liquidity Profile
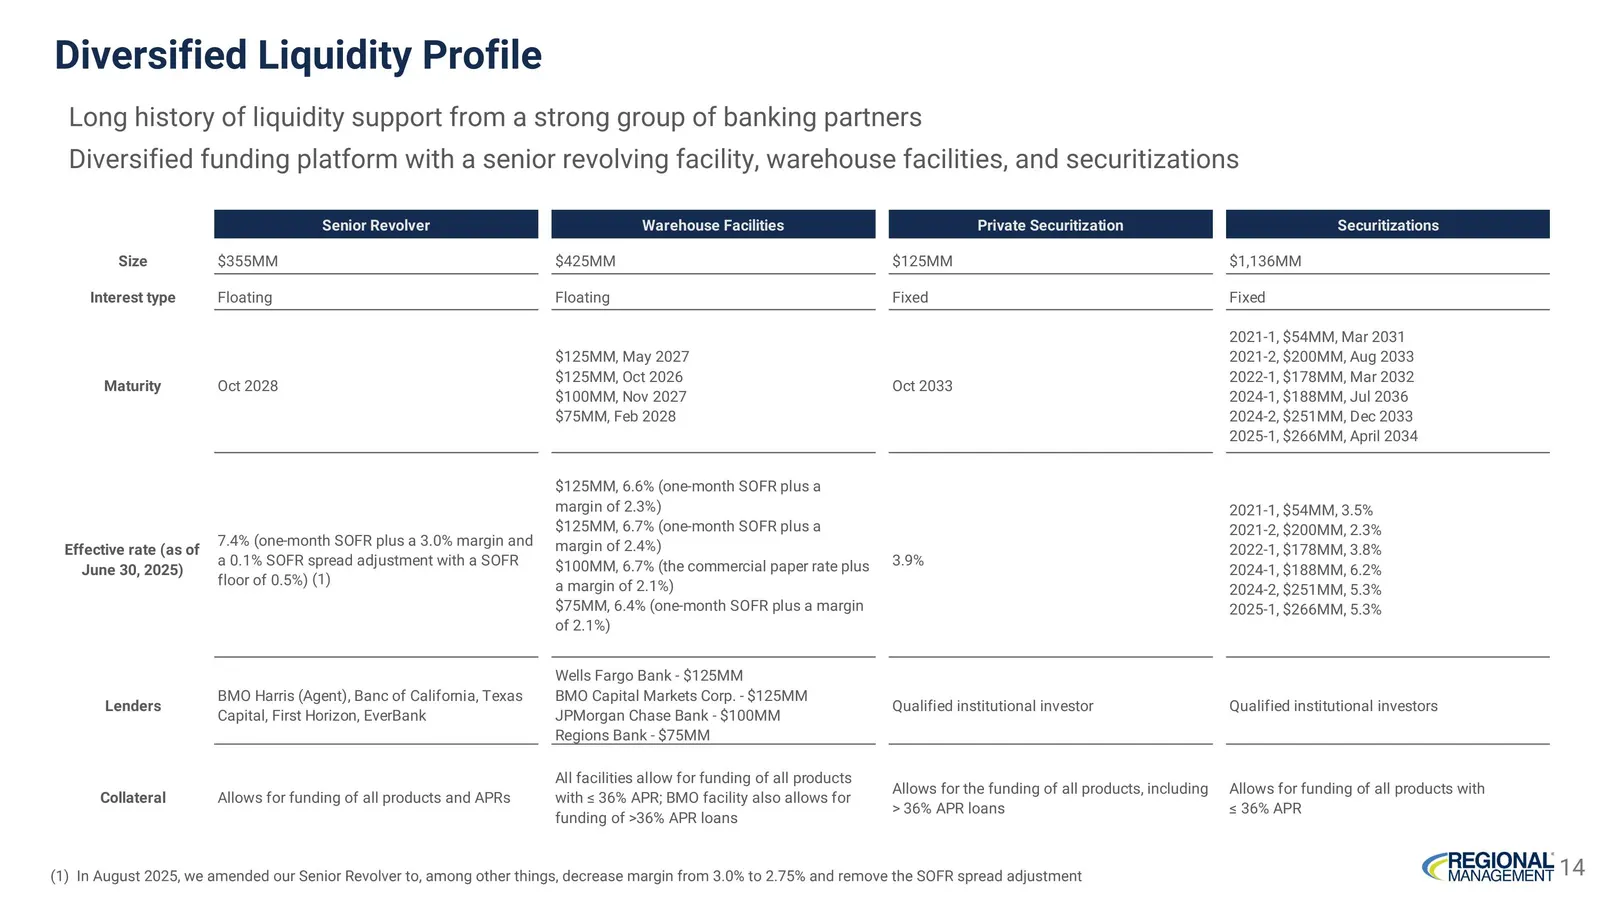
Diversified Liquidity Profile Long history of liquidity support from a strong group of banking partners Diversified funding platform with a senior revolving facility, warehouse facilities, and securitizations (1) In August 2025, we amended our Senior Revolver to, among other things, decrease margin
Slide 15: Strength of Sponsor
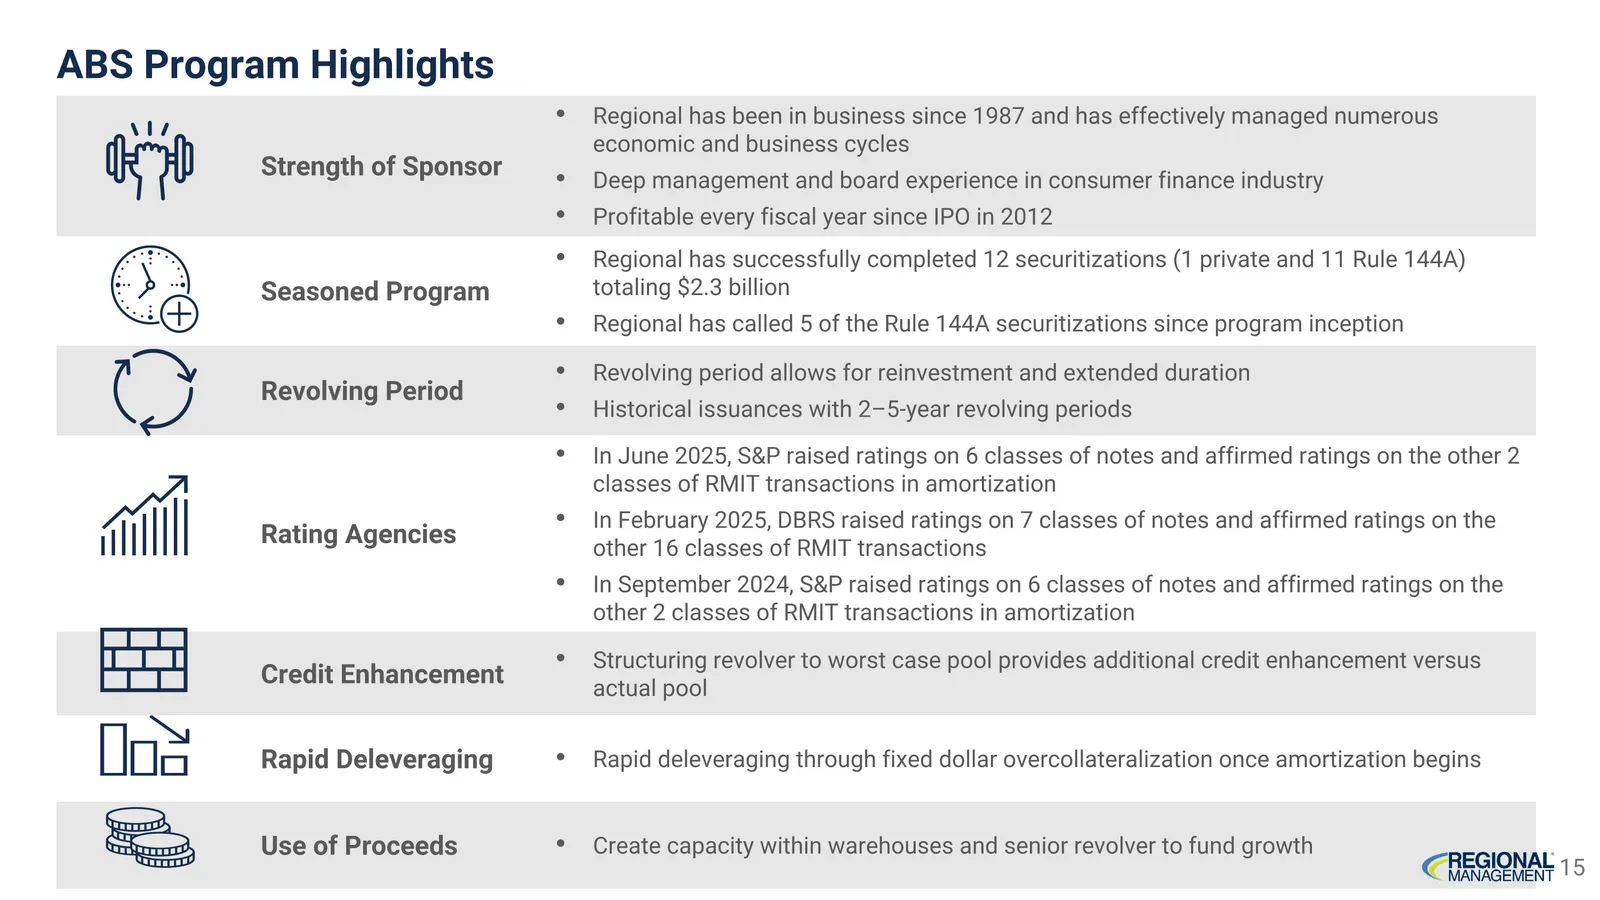
Strength of Sponsor Regional has been in business since 1987 and has effectively managed numerous economic and business cycles Deep management and board experience in consumer finance industry Profitable every fiscal year since IPO in 2012 Seasoned Program Regional has successfully completed 12 secu

Slide 16: Governance & Controls
Governance & Controls
Slide 17: Public Company Discipline and Transparency
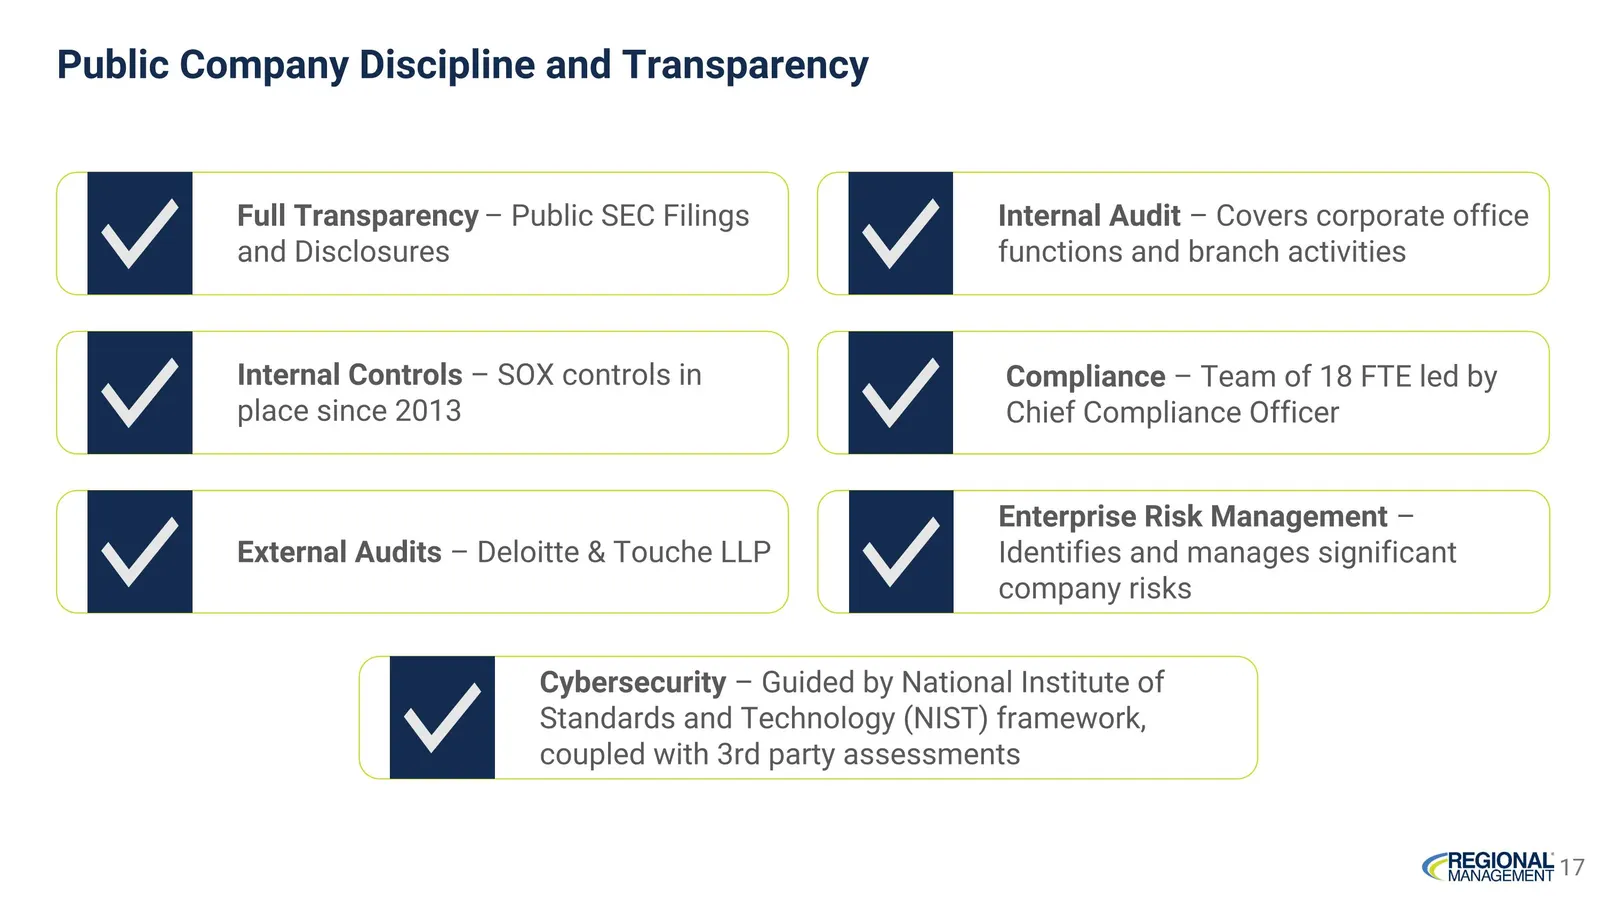
Public Company Discipline and Transparency Full Transparency – Public SEC Filings and Disclosures Internal Controls – SOX controls in place since 2013 External Audits – Deloitte & Touche LLP Compliance – Team of 18 FTE led by Chief Compliance Officer Enterprise Risk Management – Identifies and manag
Slide 18: Deep Management Experience
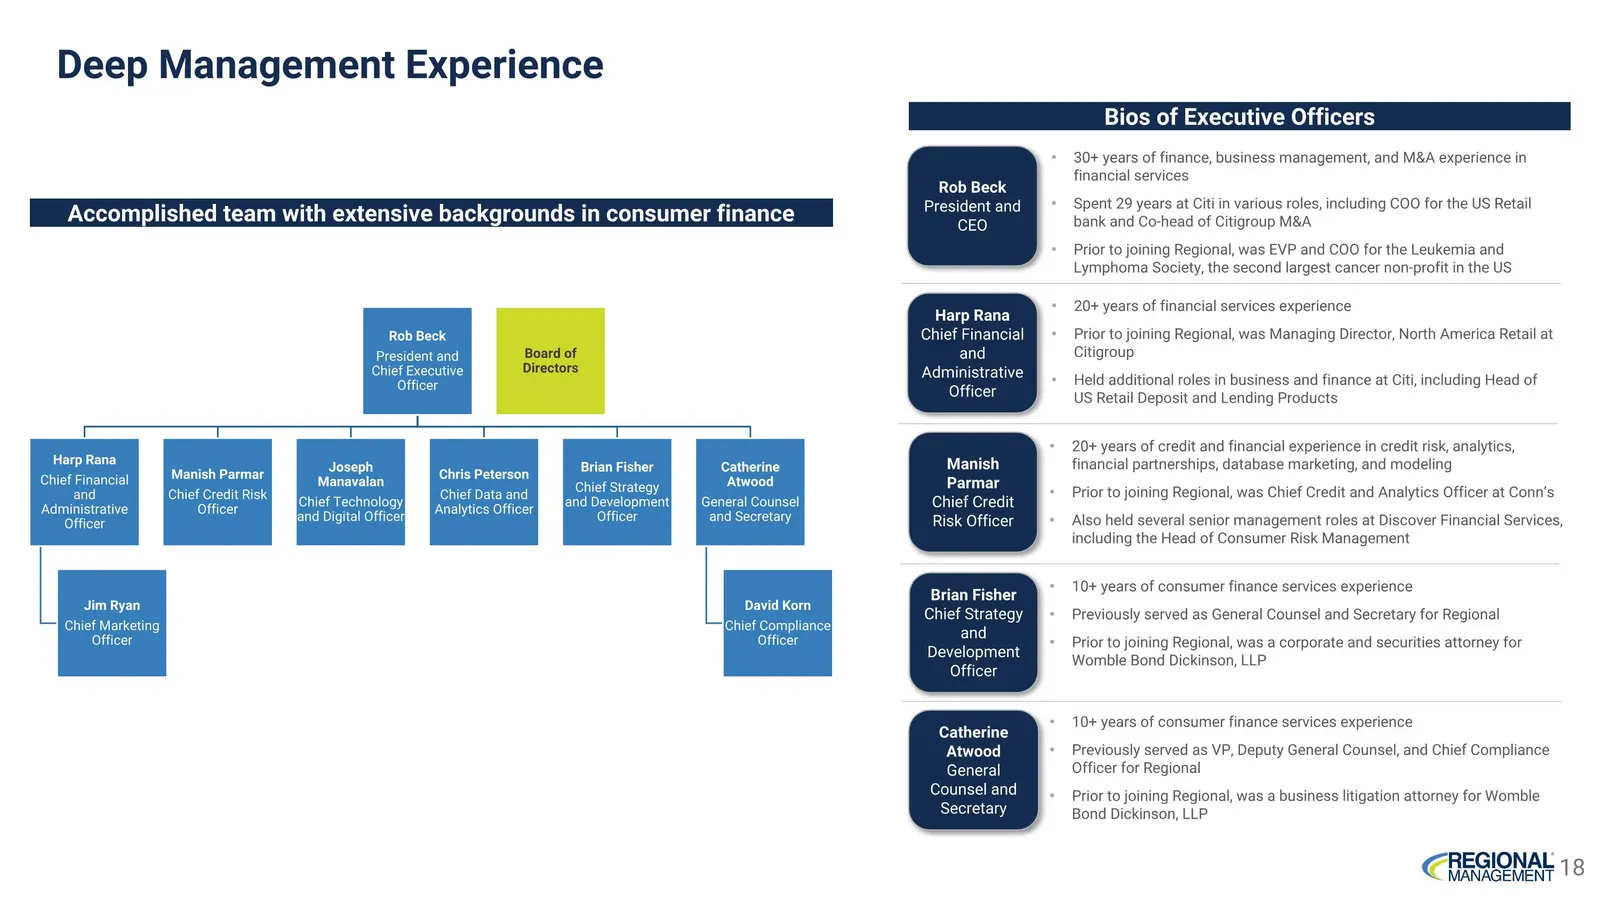
Rob Beck President and Chief Executive Officer Harp Rana Chief Financial and Administrative Officer Jim Ryan Chief Marketing Officer Manish Parmar Chief Credit Risk Officer Joseph Manavalan Chief Technology and Digital Officer Chris Peterson Chief Data and Analytics Officer Brian Fisher Chief Strate
Slide 19: Strong Corporate Governance and Diverse Board of Directors
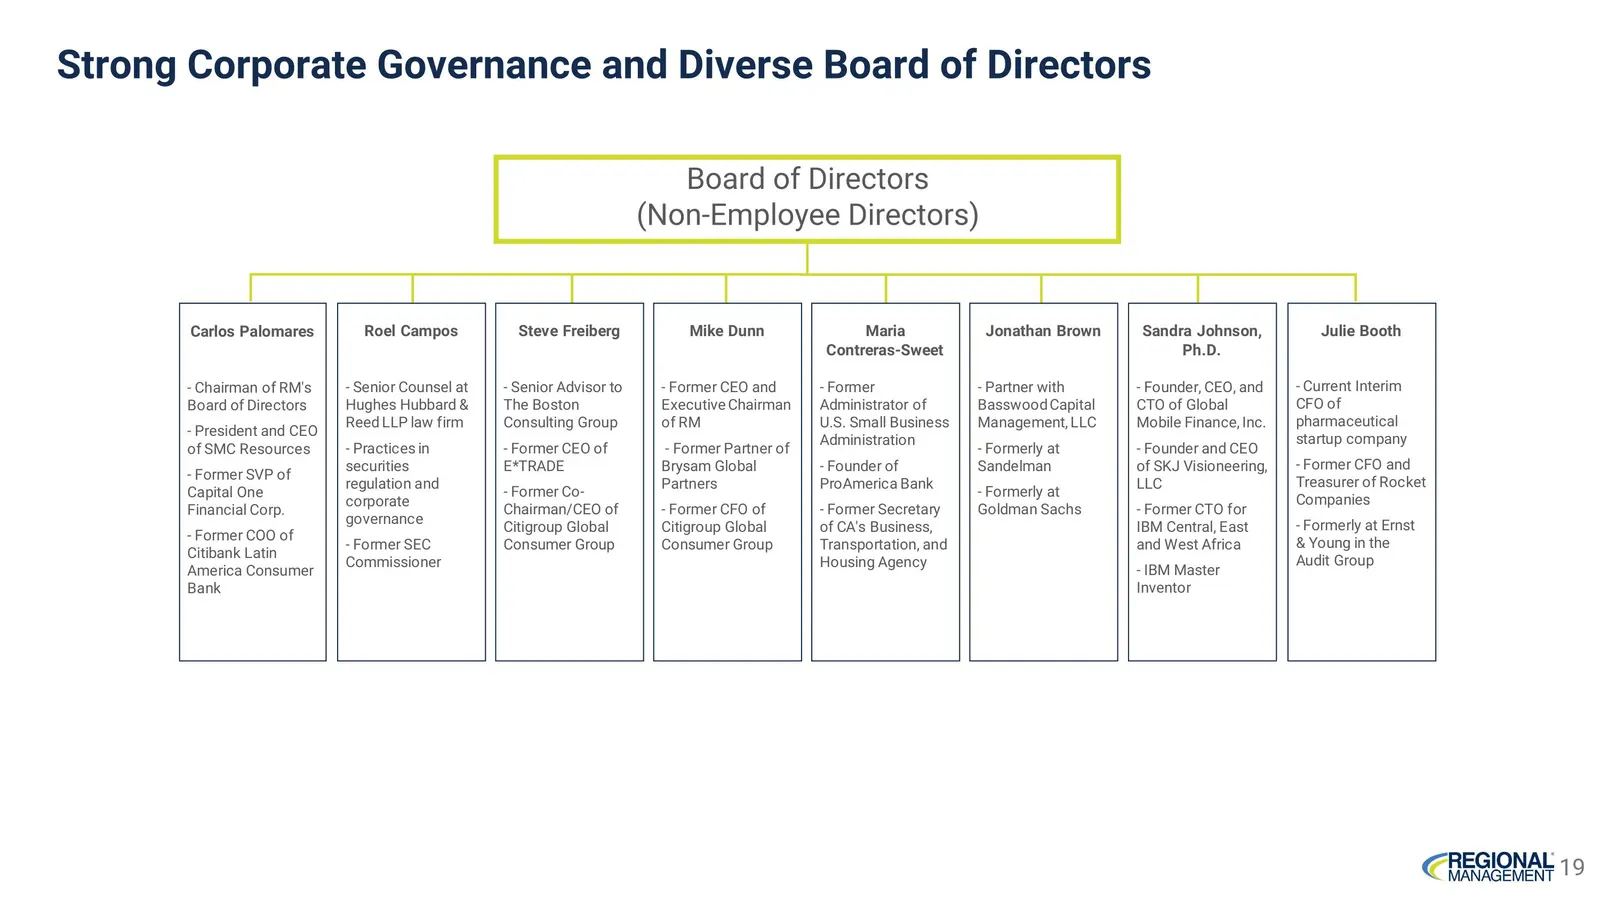
Strong Corporate Governance and Diverse Board of Directors Jonathan Brown Partner with Basswood Capital Management, LLC Formerly at Sandelman Partners Formerly at Goldman Sachs Maria Contreras-Sweet Former Administrator of U.S. Small Business Administration Founder of ProAmerica Bank Former Secretar
Slide 20: Robust Procedures and Controls
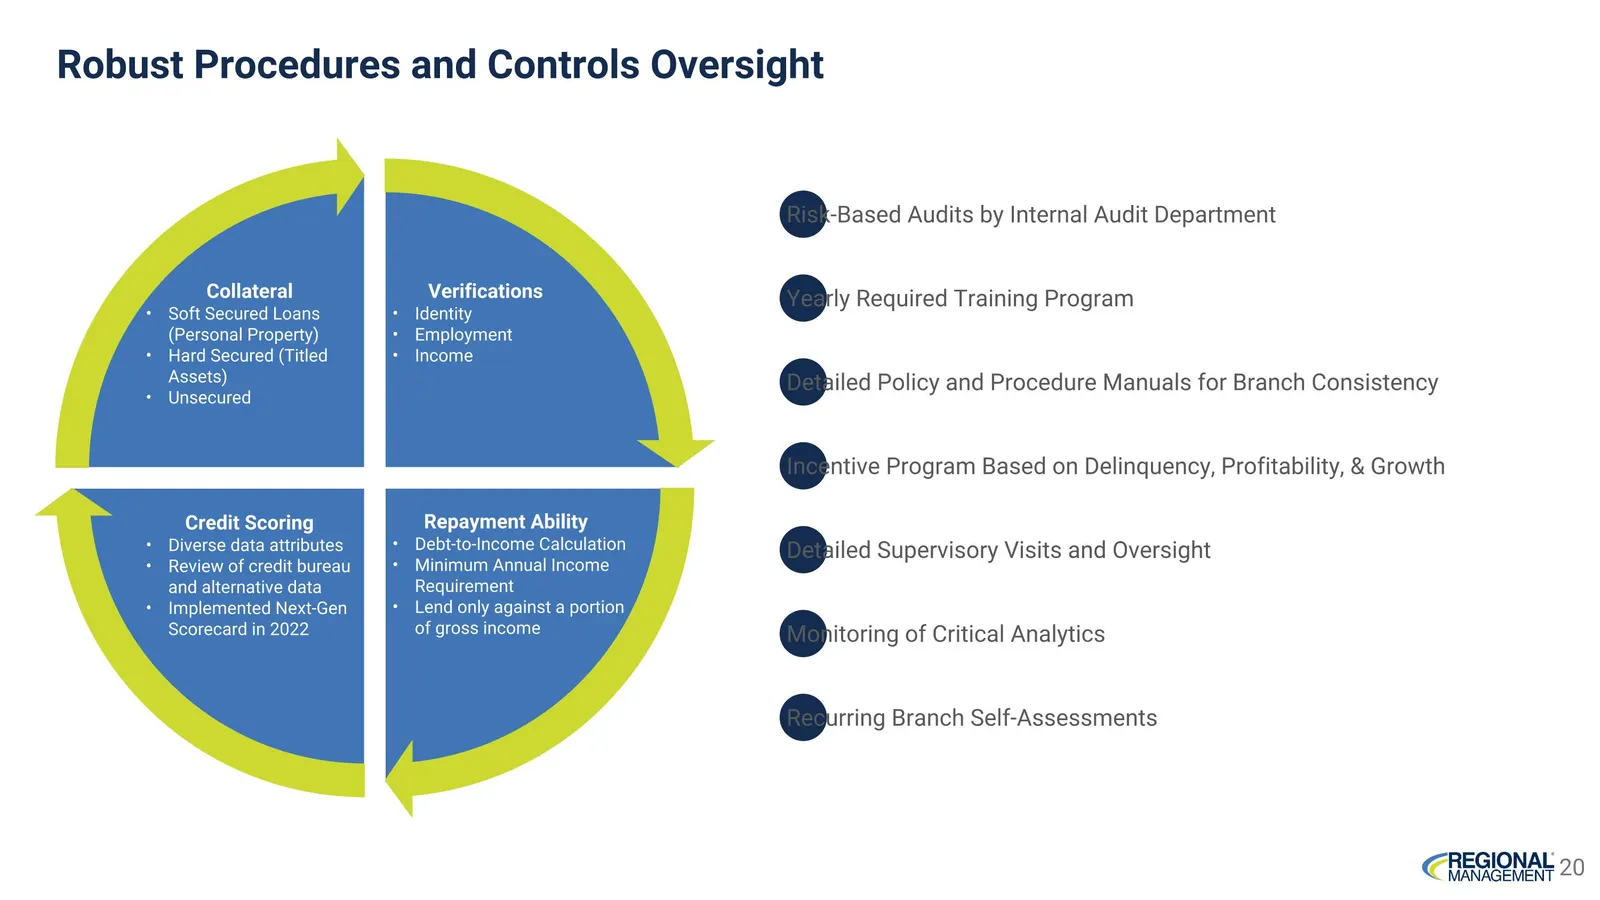
Robust Procedures and Controls Oversight Collateral All borrowers must provide collateral Secured by titled assets (hard secured) or personal property (soft secured) Verifications Identity Employment Income Credit Scoring Diverse data attributes Review of credit bureau information Implementation of
Slide 21: Compliance and Audit
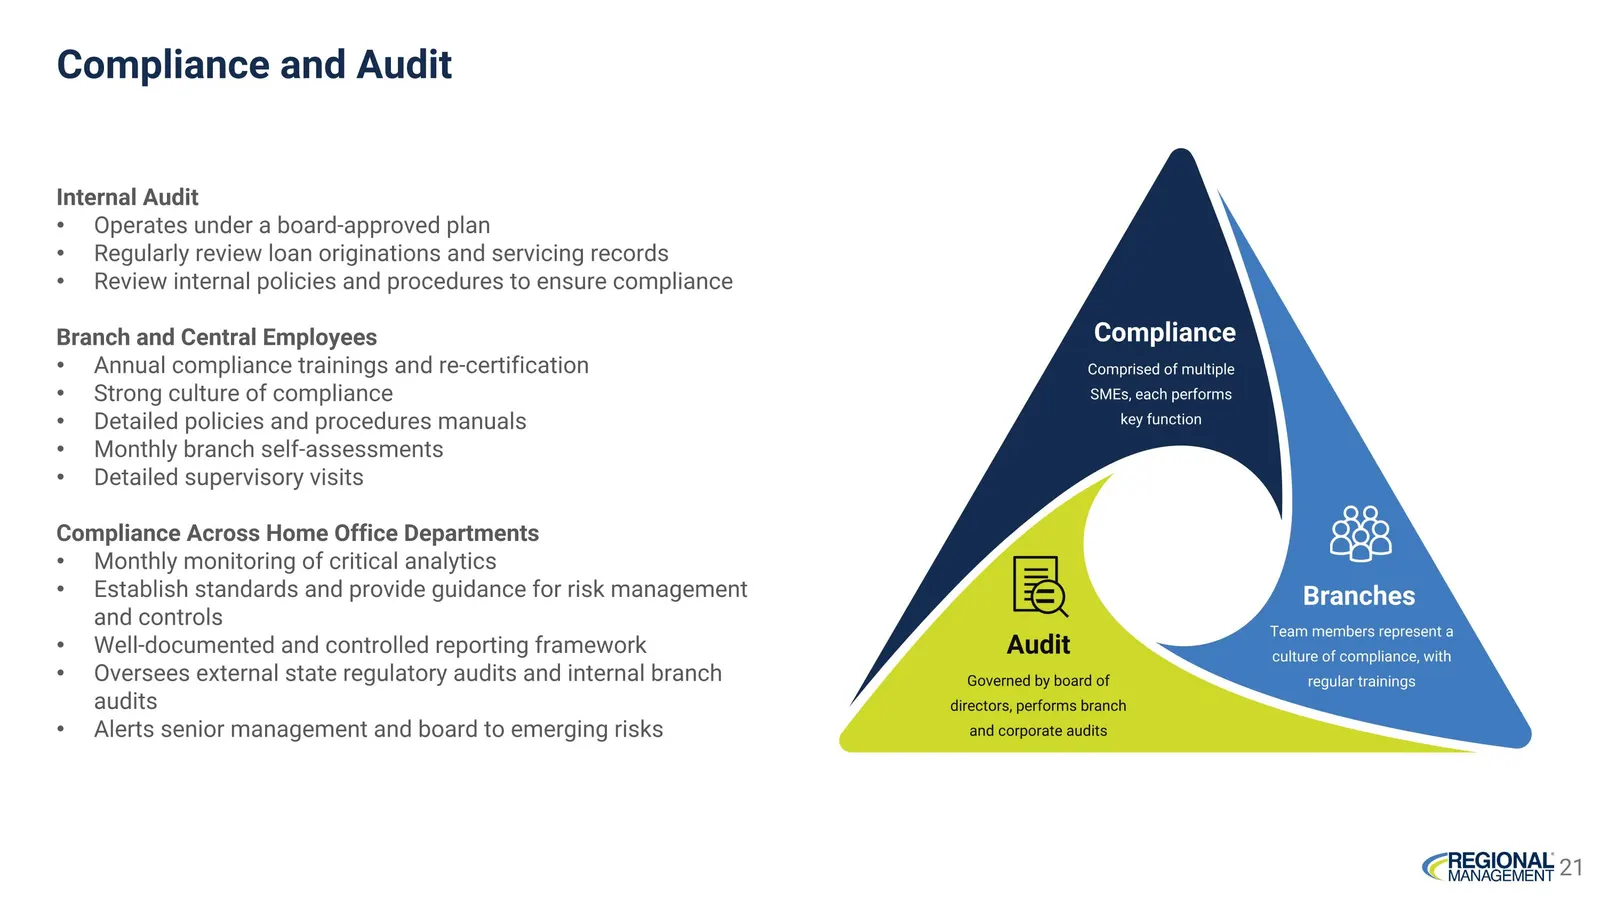
Compliance and Audit Internal Audit Operates under a board-approved plan Regularly review loan originations and servicing records Review internal policies and procedures to ensure compliance Branch and Central Employees Annual compliance trainings and re-certification Strong culture of compliance De
Slide 22: Loss Mitigation
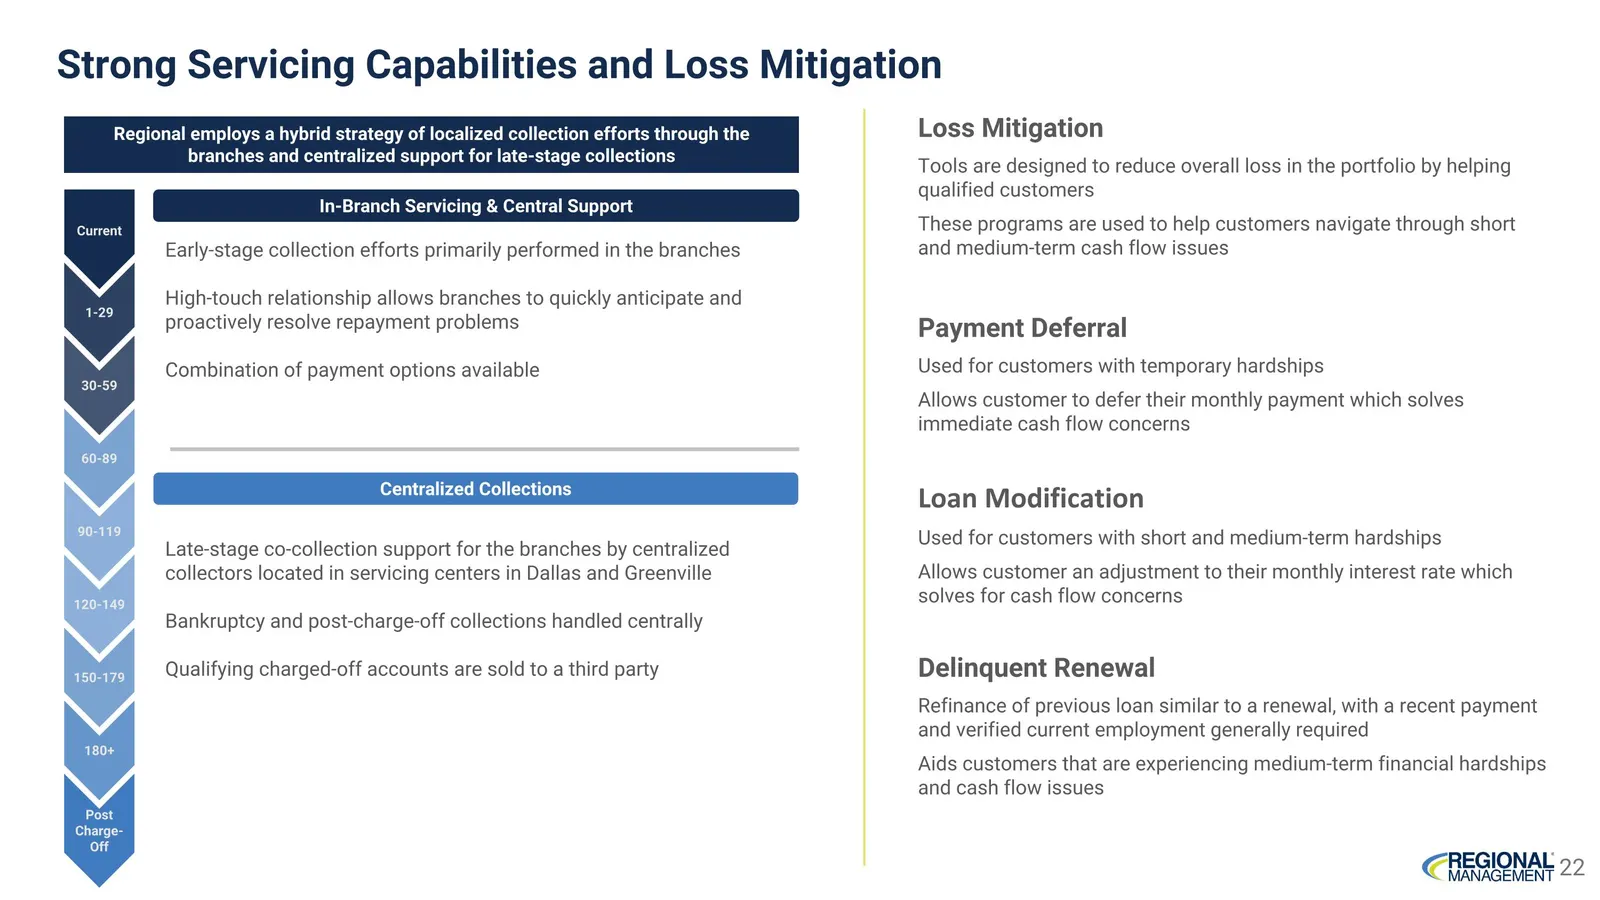
Loss Mitigation Tools are designed to reduce overall loss in the portfolio by helping qualified customers These programs are used to help customers navigate through short and medium-term cash flow issues Payment Deferral Used for customers with temporary hardships Allows customer to defer their mont

Slide 23: Credit Performance
Credit Performance
Slide 24: Portfolio Credit Metrics
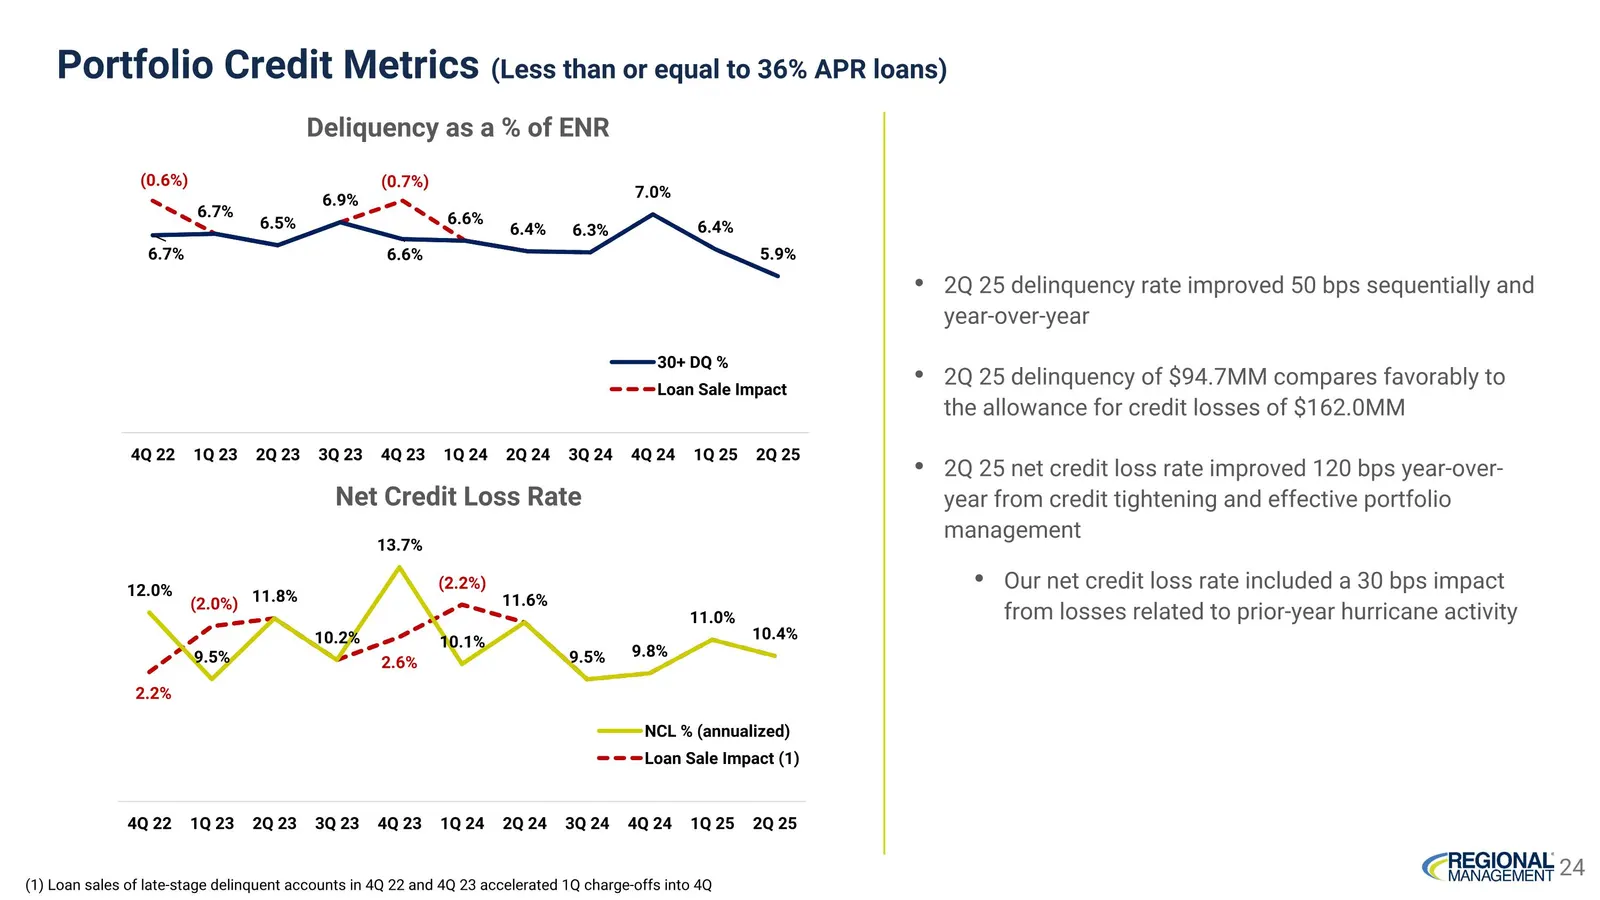
Portfolio Credit Metrics (Less than or equal to 36% APR loans) (1) Loan sales of late-stage delinquent accounts in 4Q 22 and 4Q 23 accelerated 1Q charge-offs into 4Q 2Q 25 delinquency rate improved 50 bps sequentially and year-over-year 2Q 25 delinquency of $94.7MM compares favorably to the allowanc
Slide 25: Origination Metrics by Product
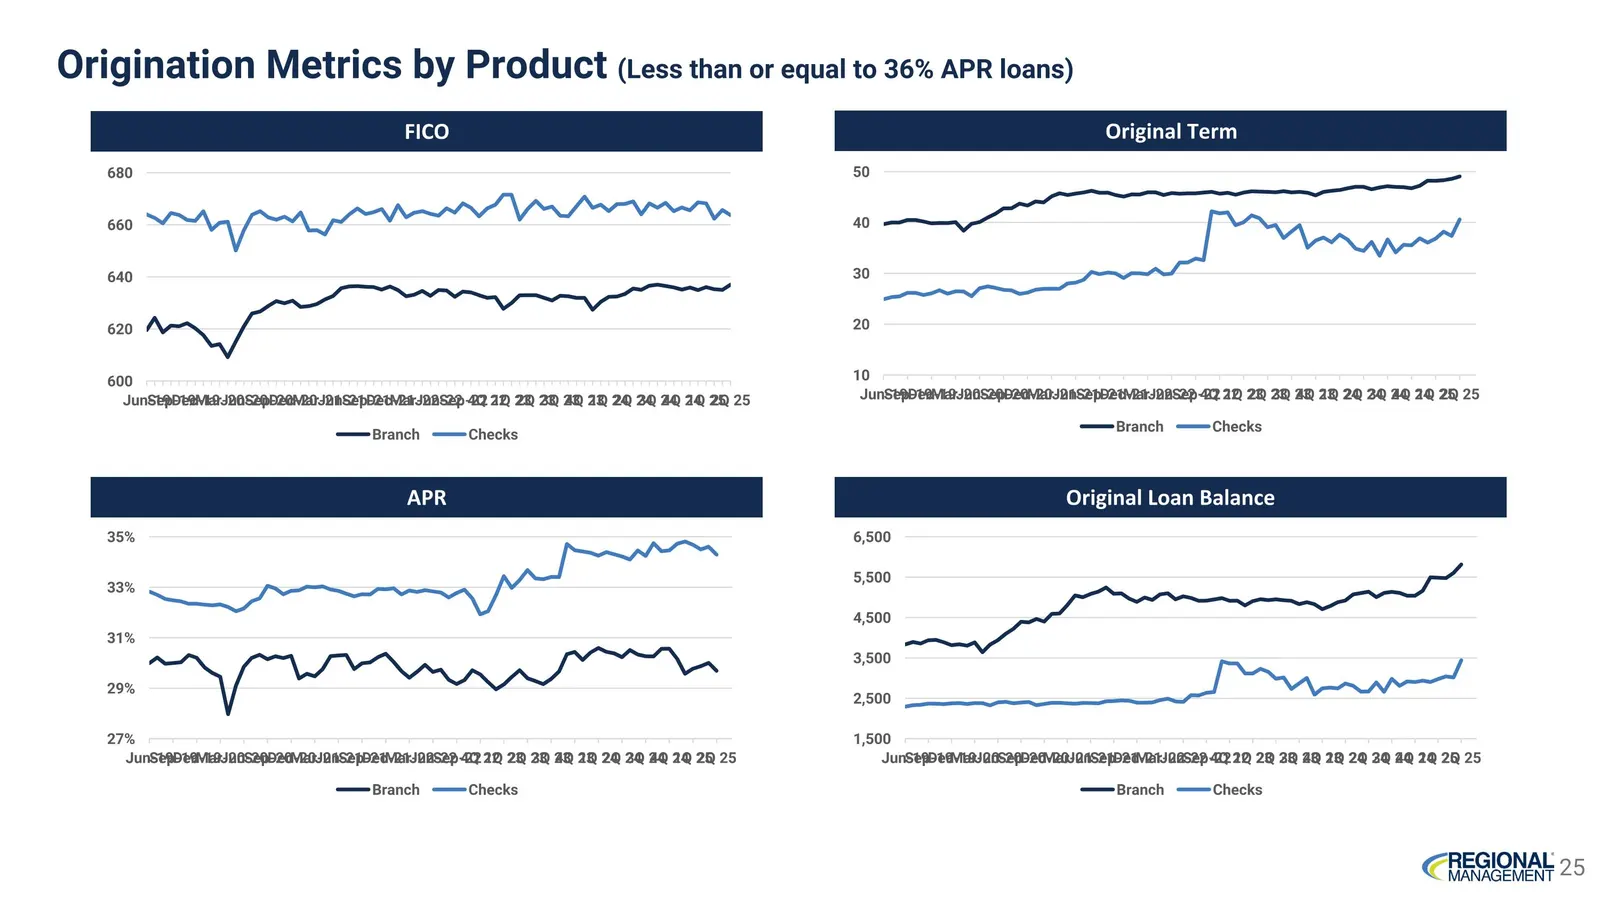
Origination Metrics by Product (Less than or equal to 36% APR loans) FICO Original Term APR Original Loan Balance
Slide 26: Net Loss Curves
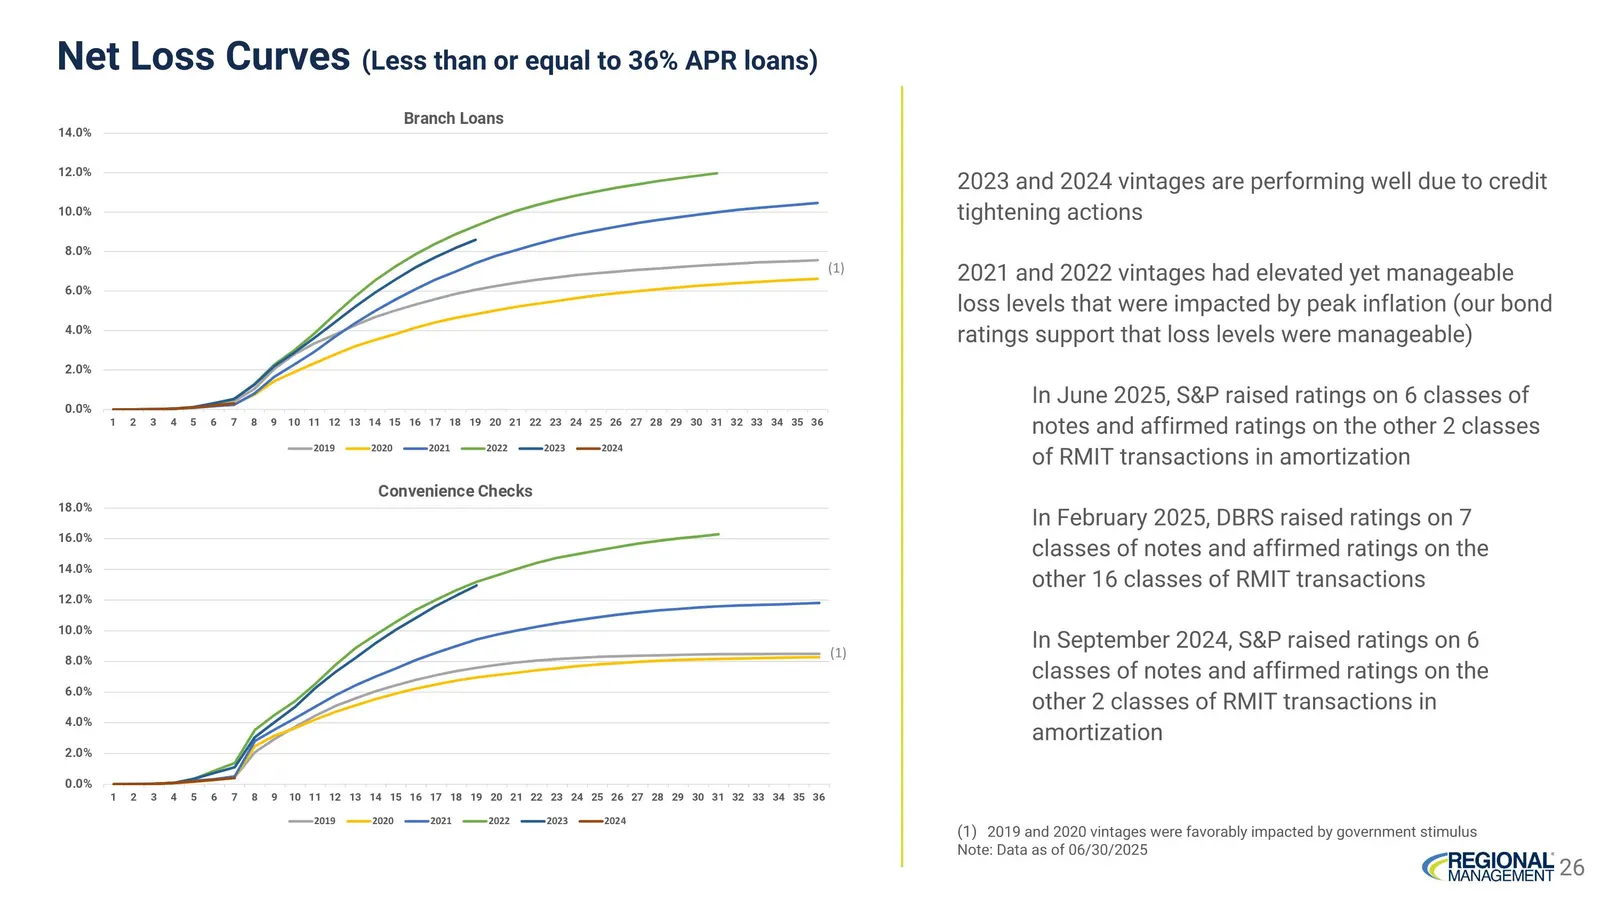
Net Loss Curves (Less than or equal to 36% APR loans) 2019 and 2020 vintages were favorably impacted by government stimulus Note: Data as of 06/30/2025 2023 and 2024 vintages are performing well due to credit tightening actions 2021 and 2022 vintages had elevated yet manageable loss levels that were
Slide 27: Consistent Credit Performance for Rule 144a Transactions
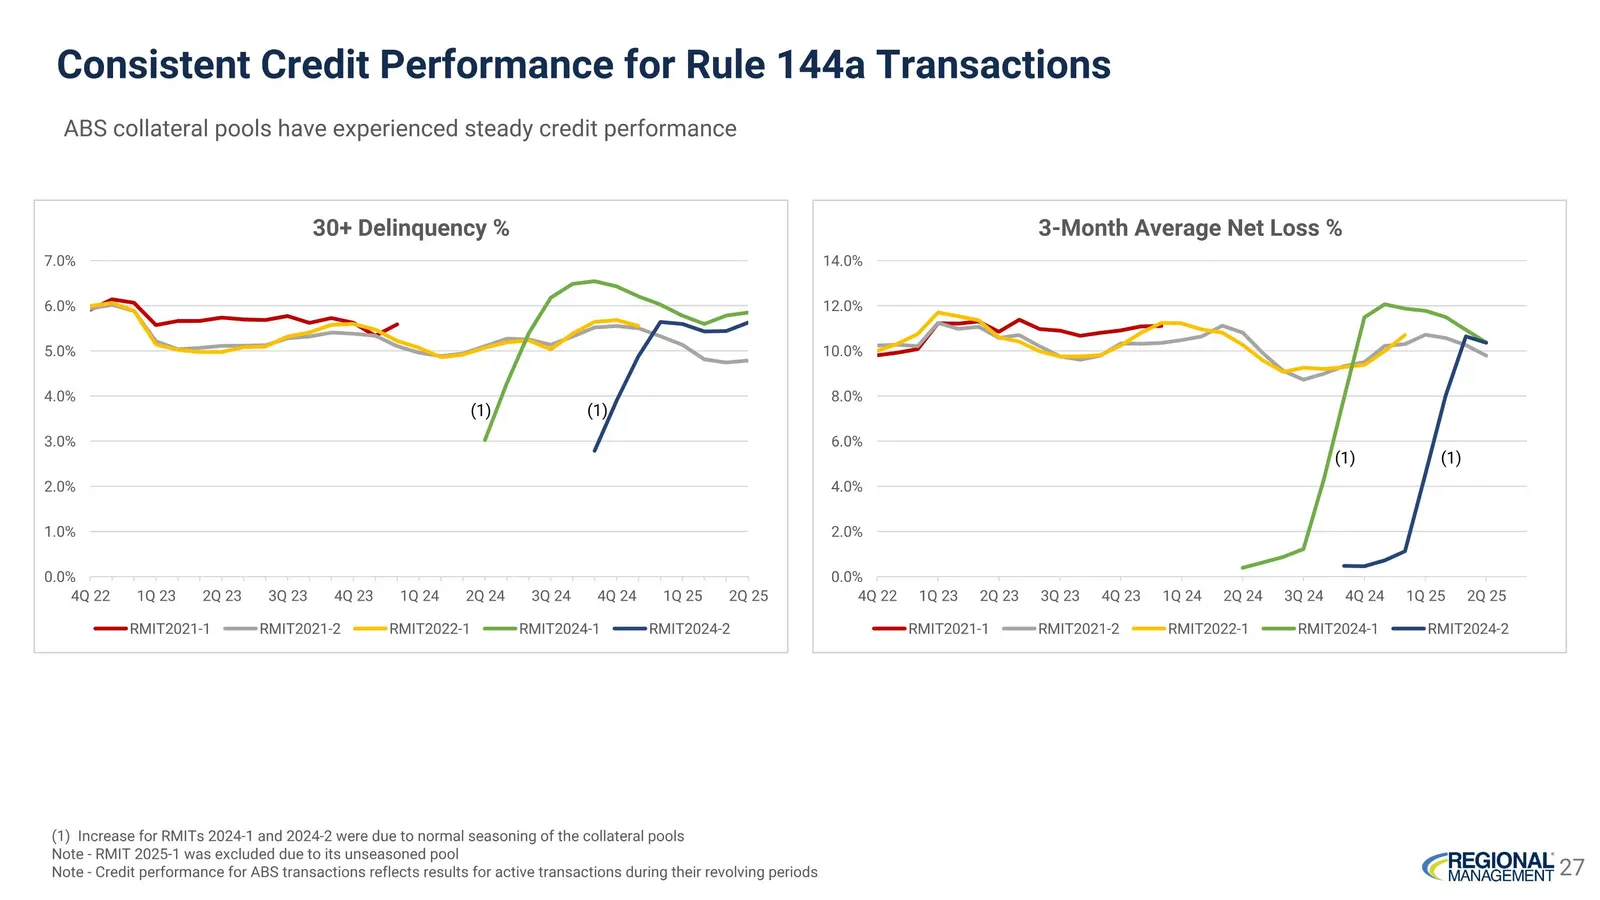
Consistent Credit Performance for Rule 144a Transactions (1) Increase for RMITs 2024-1 and 2024-2 were due to normal seasoning of the collateral pools Note - RMIT 2025-1 was excluded due to its unseasoned pool Note - Credit performance for ABS transactions reflects results for active transactions du
Slide 28: Payment Channel Mix
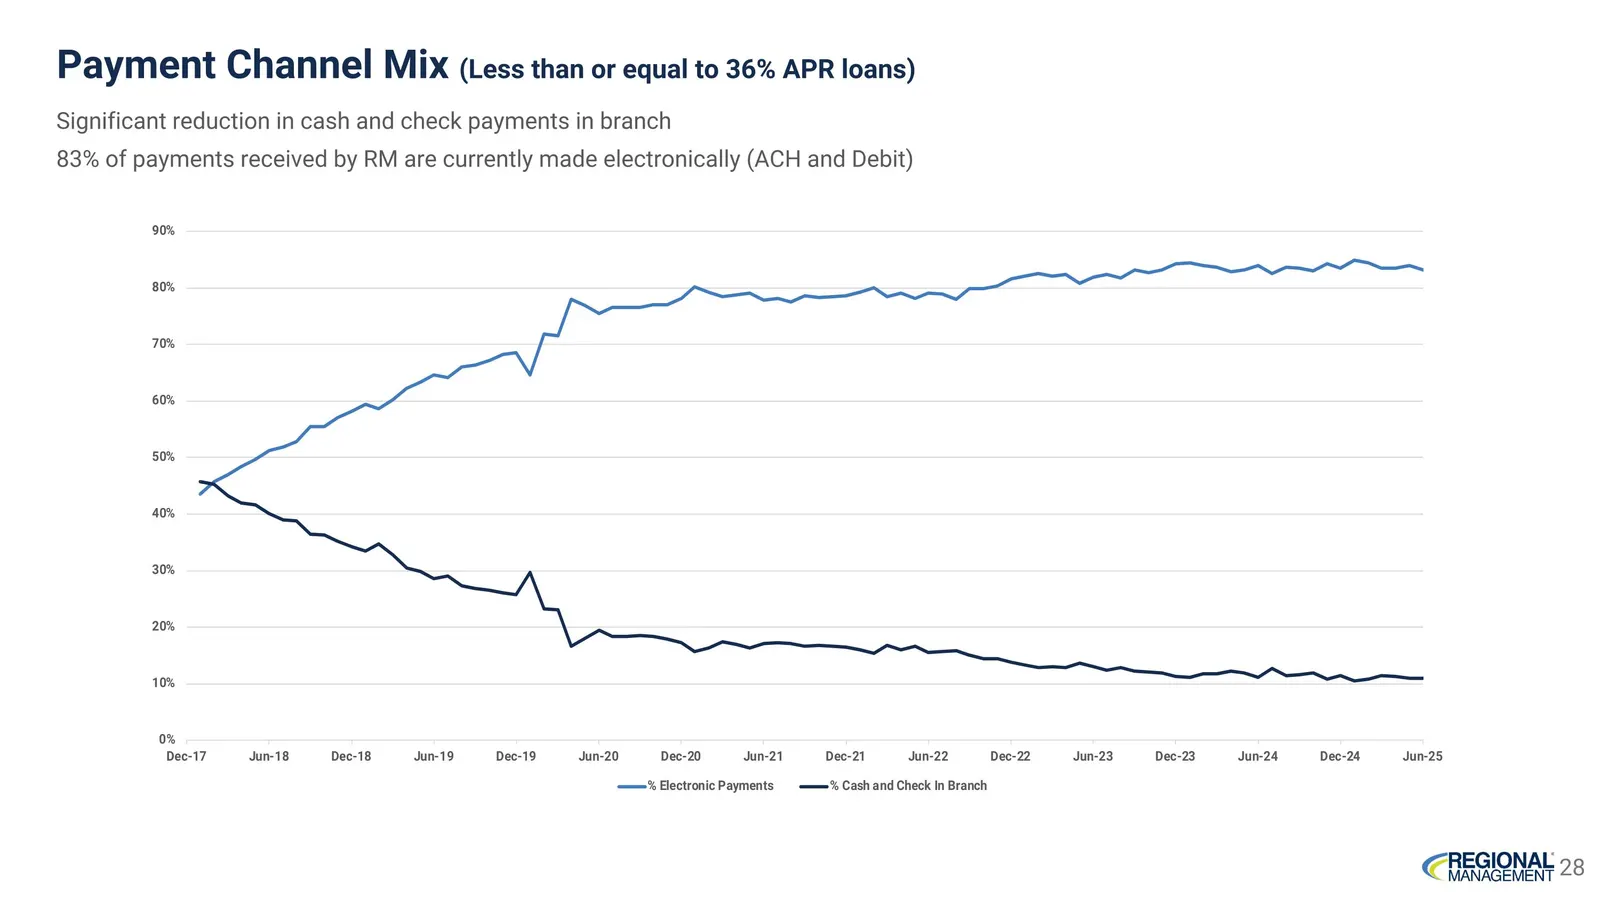
Payment Channel Mix (Less than or equal to 36% APR loans) Significant reduction in cash and check payments in branch 83% of payments received by RM are currently made electronically (ACH and Debit)

Slide 29: Appendix
Appendix
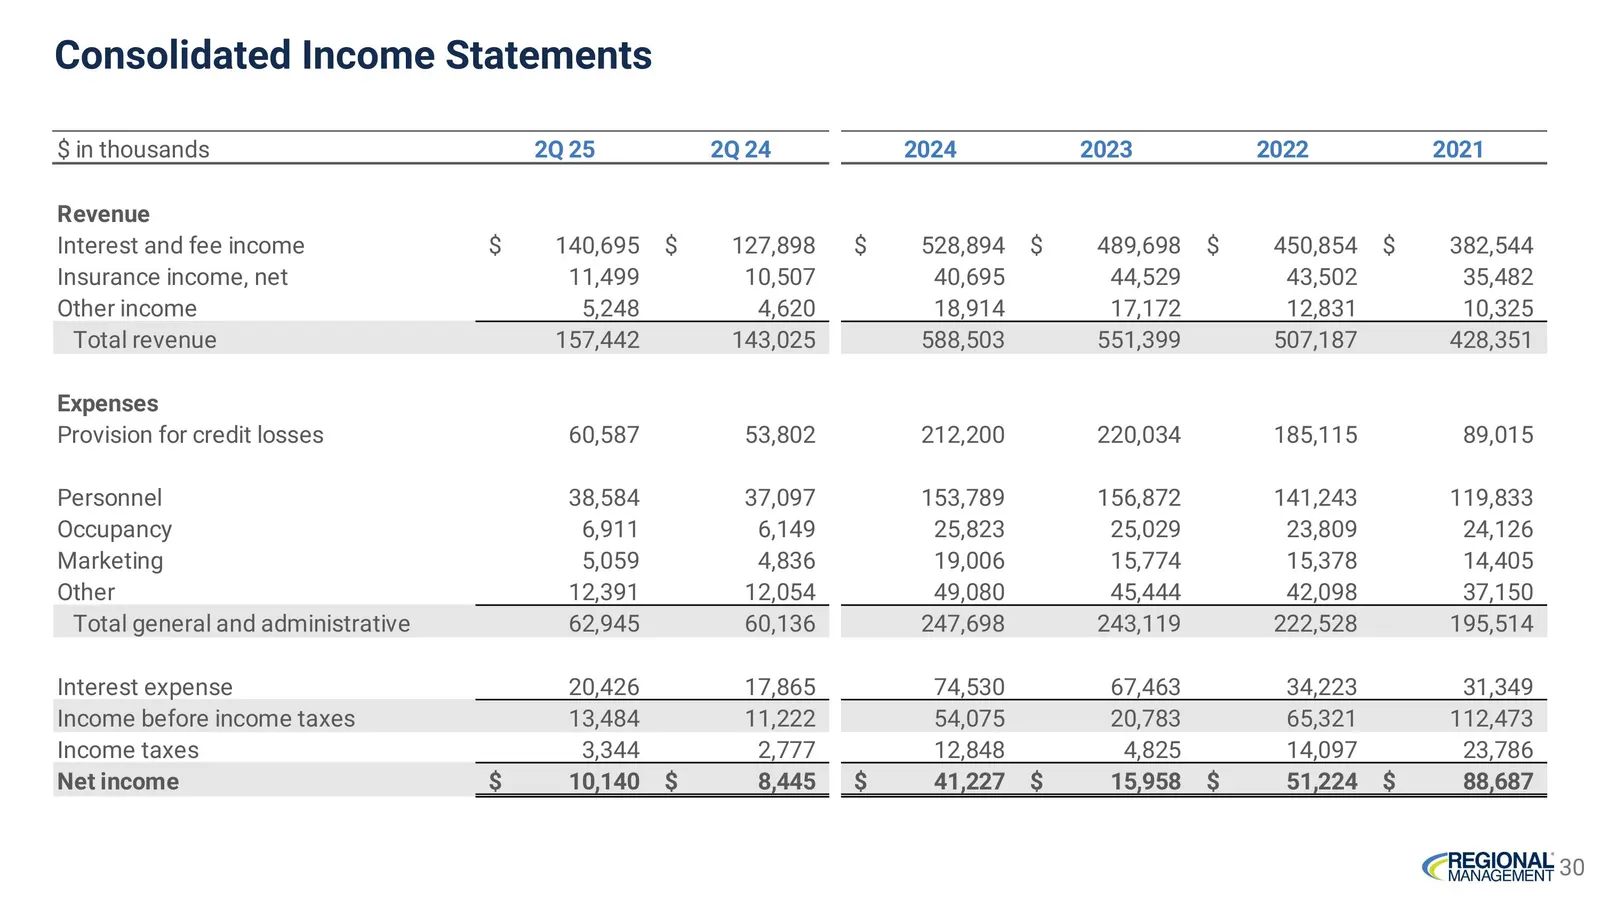
Slide 30: Consolidated Income Statements
Consolidated Income Statements
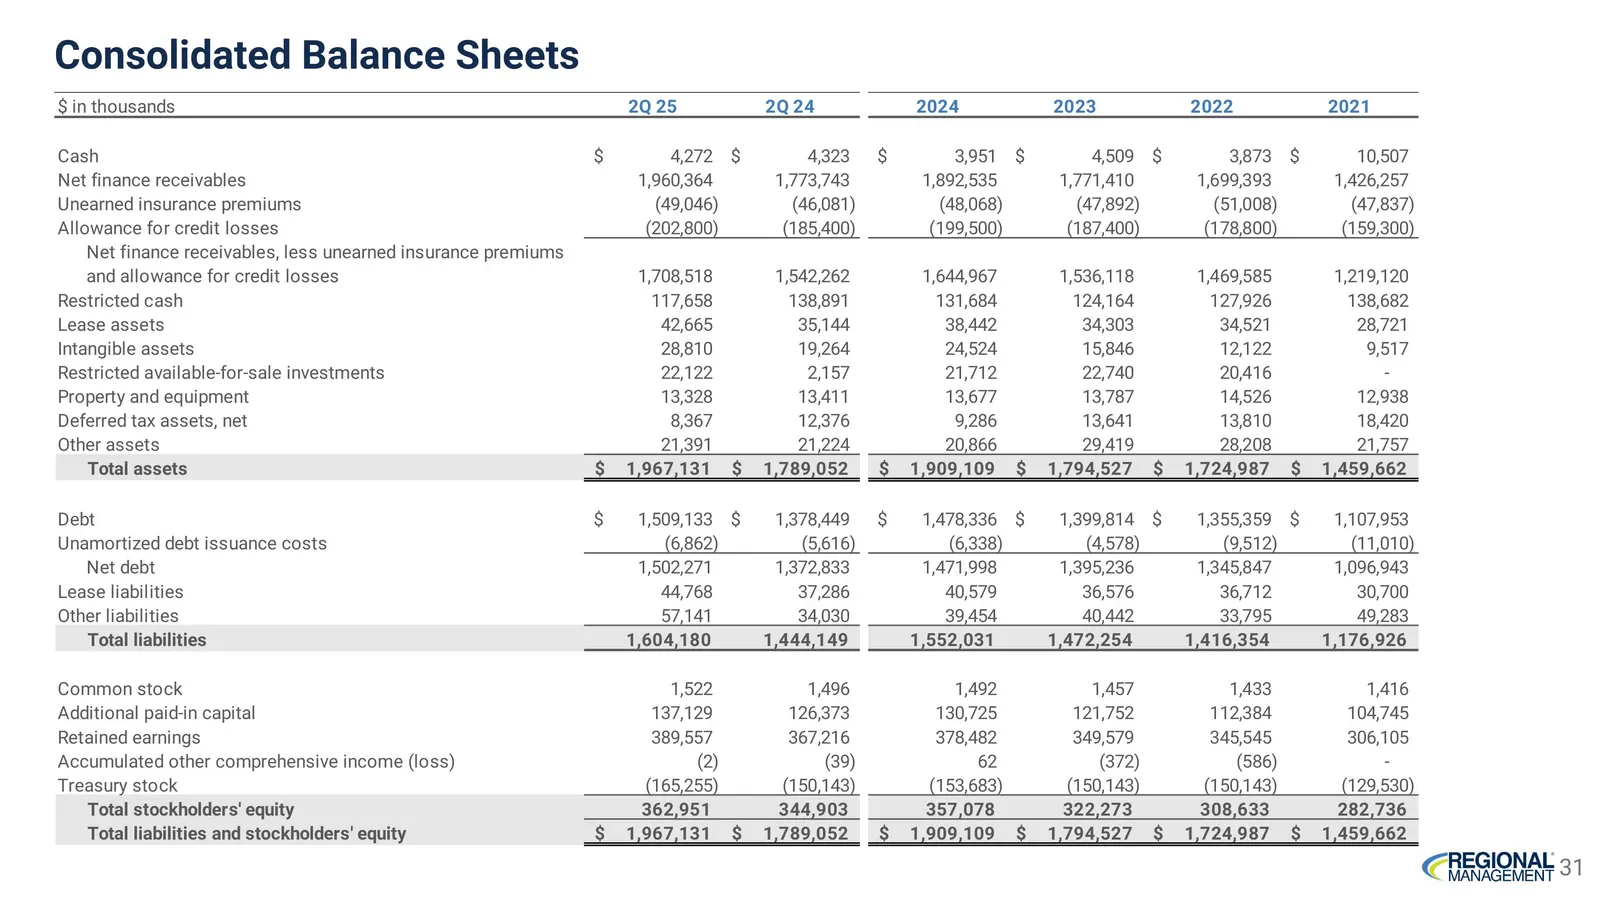
Slide 31: Consolidated Balance Sheets
Consolidated Balance Sheets
Slide 32: Glossary
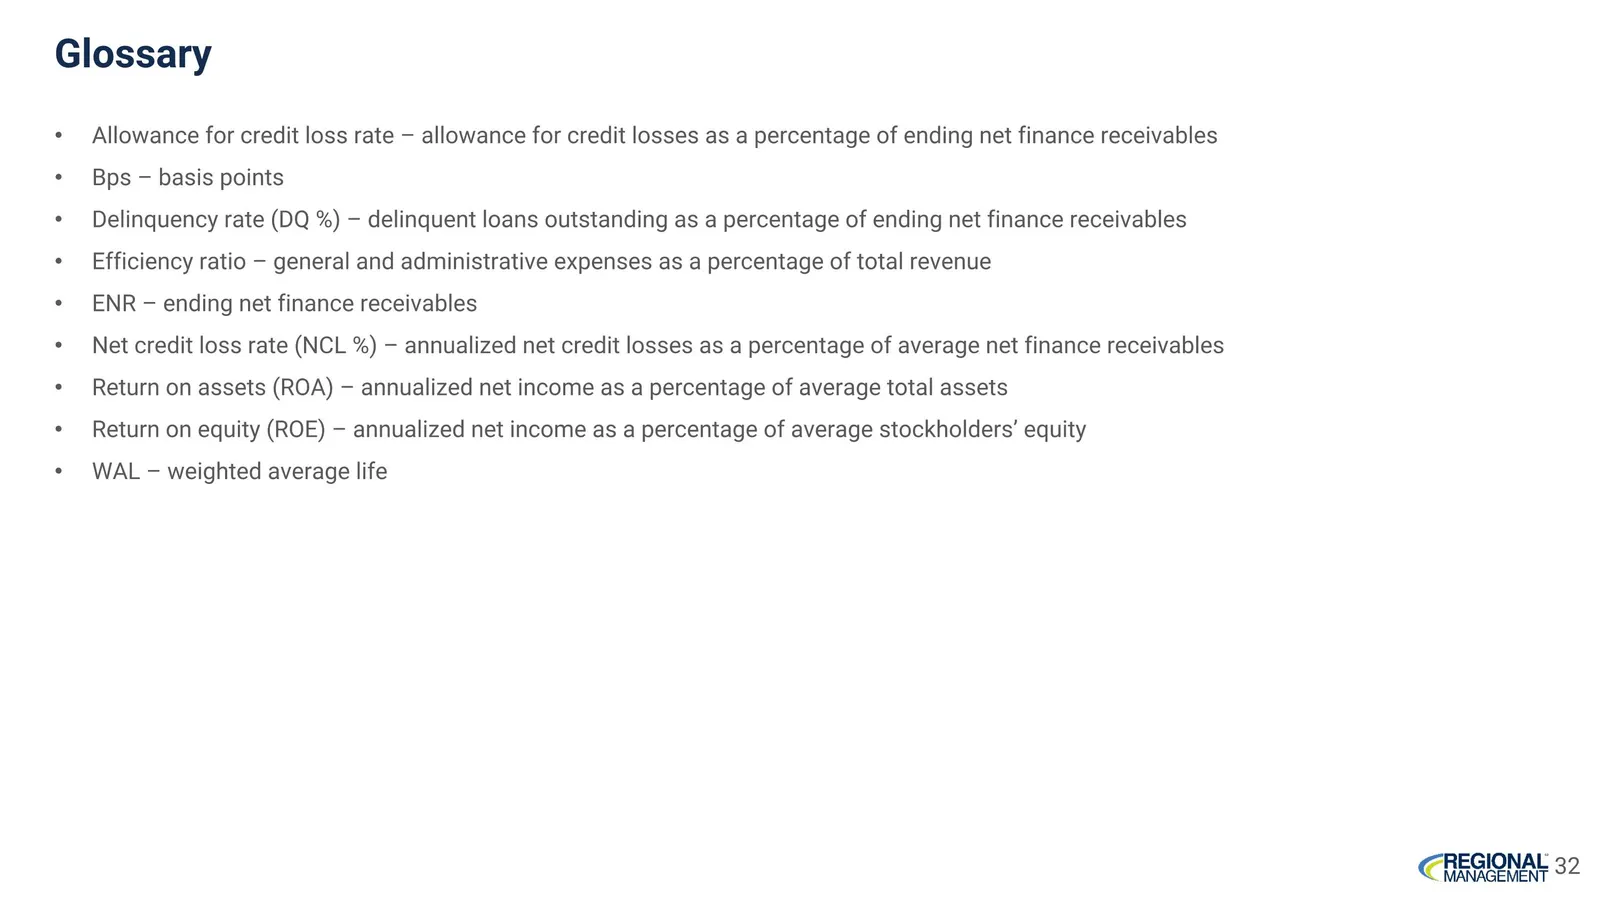
Glossary 32 Allowance for credit loss rate – allowance for credit losses as a percentage of ending net finance receivables Bps – basis points Delinquency rate (DQ %) – delinquent loans outstanding as a percentage of ending net finance receivables Efficiency ratio – general and administrative expense
Slide 33: Regional Management
¢ REGIONAL = MANAGEMENT. nyse NYSE
Source: SEC EDGAR · 8-K filed Oct 7, 2025
More decks from Regional Management Corp.
 Debt Investor Presentation (November 2026)41 slides · Nov 10, 2026
 Q3 2026 Earnings Presentation23 slides · Oct 28, 2026
 Investor Presentation (September 2026)25 slides · Sep 16, 2026
 Q2 2026 Earnings Presentation23 slides · Jul 29, 2026
 Q1 2026 Earnings Presentation23 slides · Apr 29, 2026
 Investor Presentation (February 2026)33 slides · Feb 20, 2026