Lorillard — Consumer Analyst Group of New York Conference 2012
49 slides from Lorillard's conference presentation, Feb 23, 2012
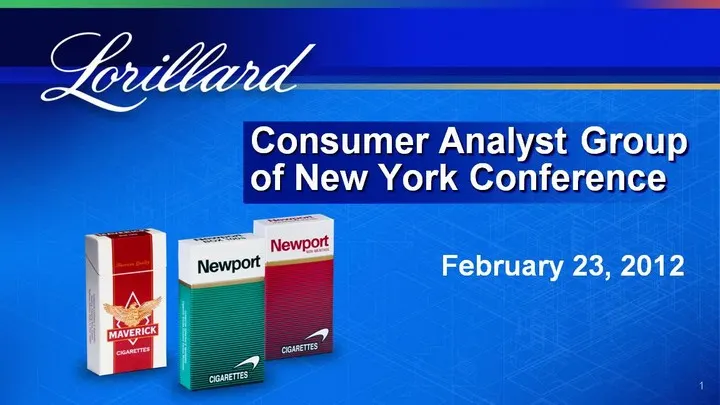
Slide 1: Consumer Analyst Group of New York Conference
1 February 23, 2012 Consumer Analyst Group of New York Conference

Slide 2: Chairman, President and Chief Executive Officer Murray S. Kessler
2 Chairman, President and Chief Executive Officer Murray S. Kessler
Slide 3: Safe Harbor Disclaimer
3 Safe Harbor Disclaimer You are cautioned that certain statements made in this presentation are "forward-looking" statements within the meaning of the Private Securities Litigation Reform Act of 1995. Forward-looking statements include, without limitation, any statement that may project, indicate o
Slide 4: Regulation G Compliance
Regulation G Compliance You are also reminded that during this presentation, certain non-GAAP financial measures, such as Adjusted Operating Income, Adjusted Net Income and Adjusted Earnings Per Share may be discussed. These measures should not be considered an alternative to operating income, net i
Slide 5: Who is Lorillard?
5 Who is Lorillard?
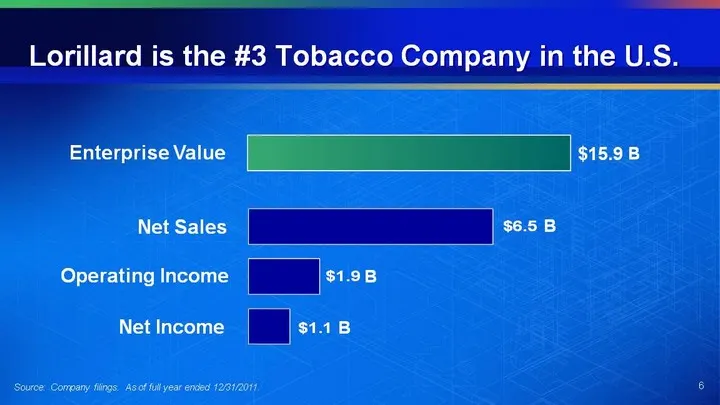
Slide 6: Lorillard is the #3 Tobacco Company in the U.S.
Lorillard is the #3 Tobacco Company in the U.S. Source: Company filings. As of full year ended 12/31/2011. 6 Enterprise Value Operating Income Net Income Net Sales B B B B
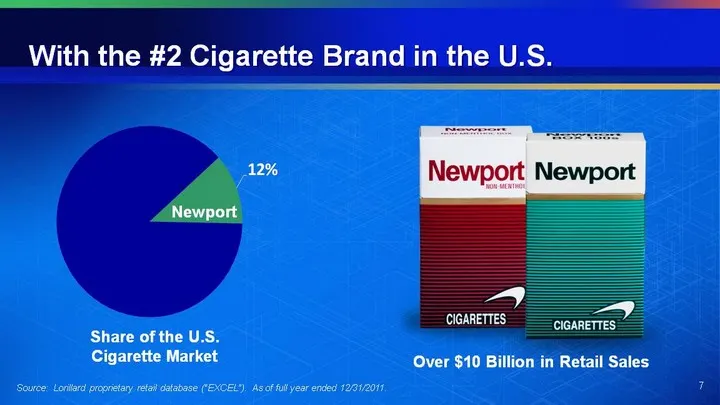
Slide 7: With the #2 Cigarette Brand in the U.S.
With the #2 Cigarette Brand in the U.S. 7 Newport Share of the U.S. Cigarette Market Over $10 Billion in Retail Sales Source: Lorillard proprietary retail database ("EXCEL"). As of full year ended 12/31/2011.
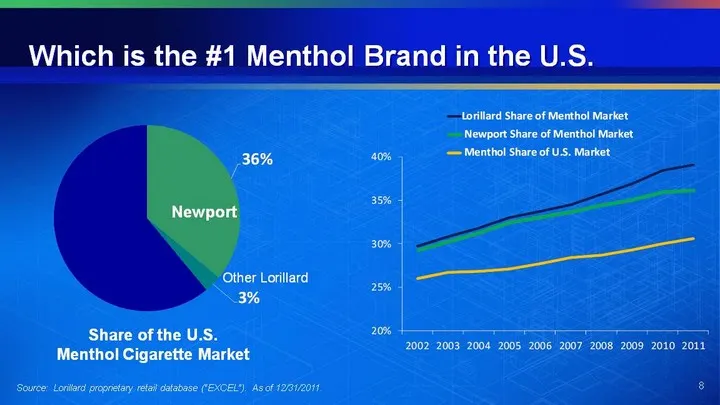
Slide 8: Which is the #1 Menthol Brand in the U.S.
Which is the #1 Menthol Brand in the U.S. 8 Newport Share of the U.S. Menthol Cigarette Market Other Lorillard Source: Lorillard proprietary retail database ("EXCEL"). As of 12/31/2011.
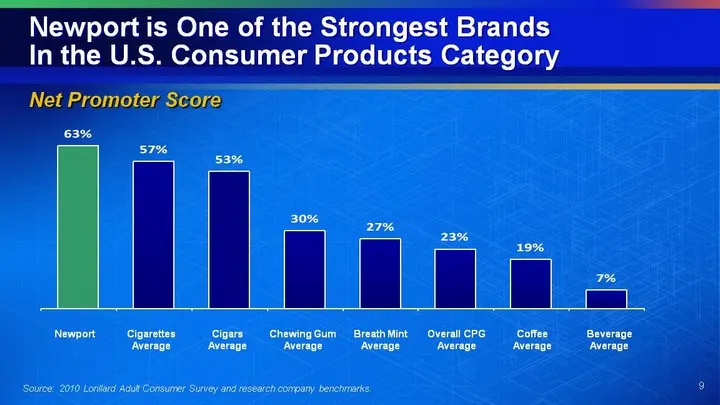
Slide 9: Newport is One of the Strongest Brands in U.S. Consumer Products
9 Newport is One of the Strongest Brands In the U.S. Consumer Products Category Net Promoter Score Newport Cigarettes Average Cigars Average Chewing Gum Average Breath Mint Average Overall CPG Average Coffee Average Beverage Average Source: 2010 Lorillard Adult Consumer Survey and research company b
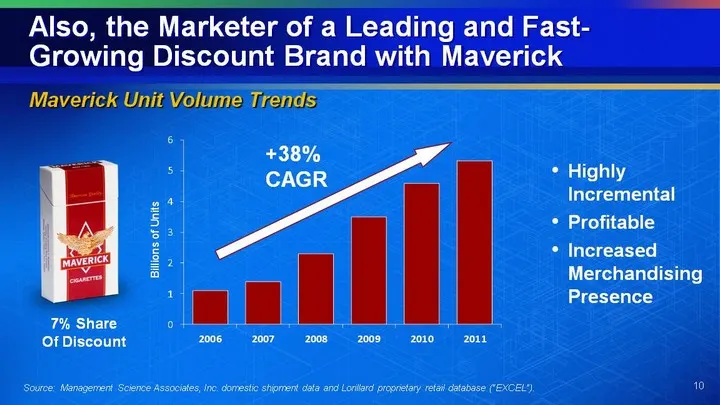
Slide 10: Also, Marketer of a Leading and Fast-Growing Discount Brand with Maverick
10 Also, the Marketer of a Leading and Fast- Growing Discount Brand with Maverick Maverick Unit Volume Trends Highly Incremental Profitable Increased Merchandising Presence Source: Management Science Associates, Inc. domestic shipment data and Lorillard proprietary retail database ("EXCEL"). +38% CA
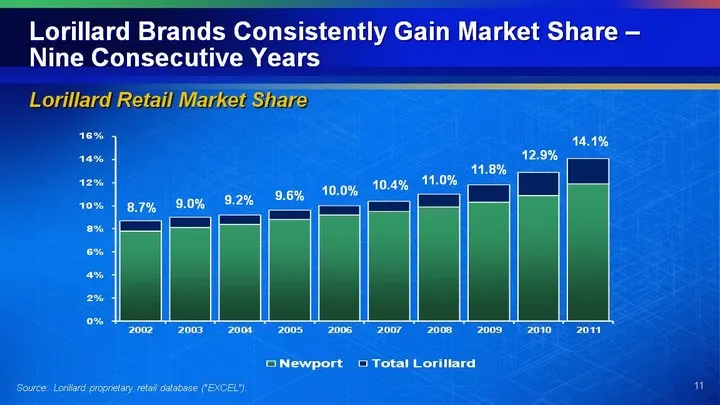
Slide 11: Lorillard Brands Consistently Gain Market Share - Nine Consecutive Years
11 Lorillard Brands Consistently Gain Market Share - Nine Consecutive Years Lorillard Retail Market Share Source: Lorillard proprietary retail database ("EXCEL"). 14.1%
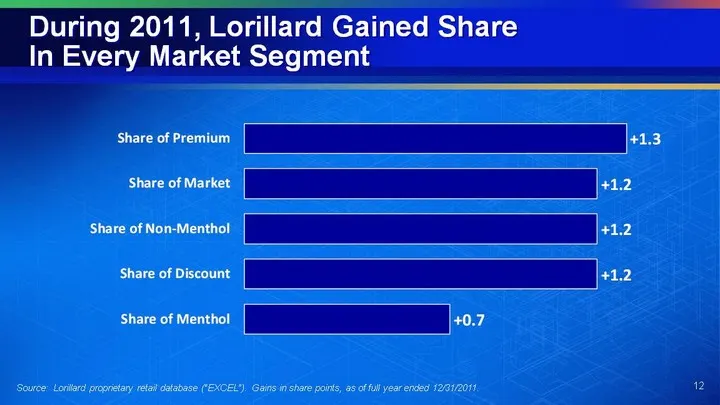
Slide 12: During 2011, Lorillard Gained Share In Every Market Segment
During 2011, Lorillard Gained Share In Every Market Segment 12 Source: Lorillard proprietary retail database ("EXCEL"). Gains in share points, as of full year ended 12/31/2011.
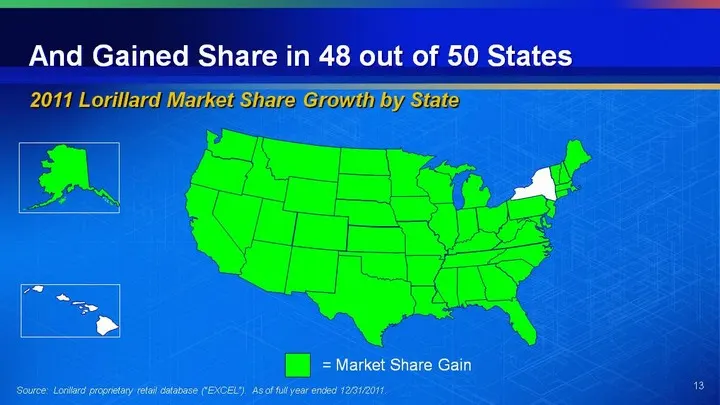
Slide 13: 2011 Lorillard Market Share Growth by State
= Market Share Gain And Gained Share in 48 out of 50 States 2011 Lorillard Market Share Growth by State 13 Source: Lorillard proprietary retail database ("EXCEL"). As of full year ended 12/31/2011.
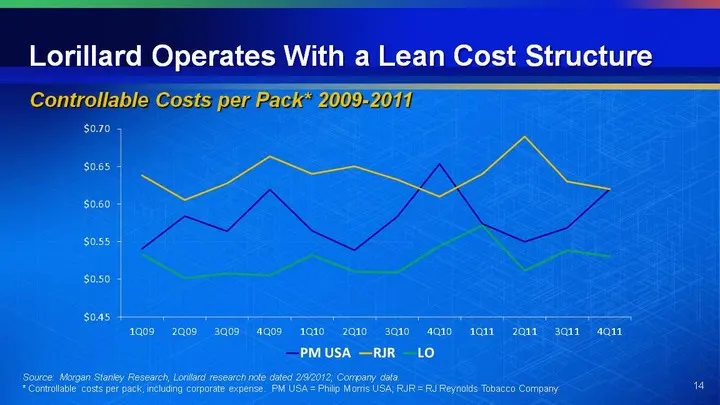
Slide 14: Lorillard Operates With a Lean Cost Structure
Lorillard Operates With a Lean Cost Structure Controllable Costs per Pack* 2009-2011 Source: Morgan Stanley Research, Lorillard research note dated 2/9/2012; Company data. * Controllable costs per pack, including corporate expense. PM USA = Philip Morris USA; RJR = RJ Reynolds Tobacco Company 14
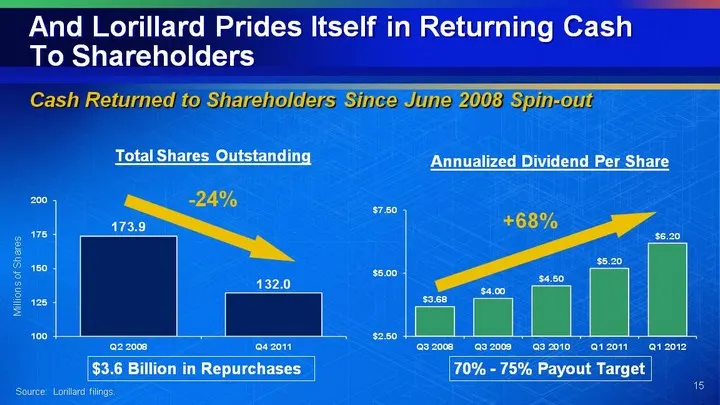
Slide 15: Lorillard Prides Itself in Returning Cash To Shareholders
And Lorillard Prides Itself in Returning Cash To Shareholders Cash Returned to Shareholders Since June 2008 Spin-out -24% +68% Total Shares Outstanding Annualized Dividend Per Share Millions of Shares Source: Lorillard filings. $3.6 Billion in Repurchases 70% - 75% Payout Target 15
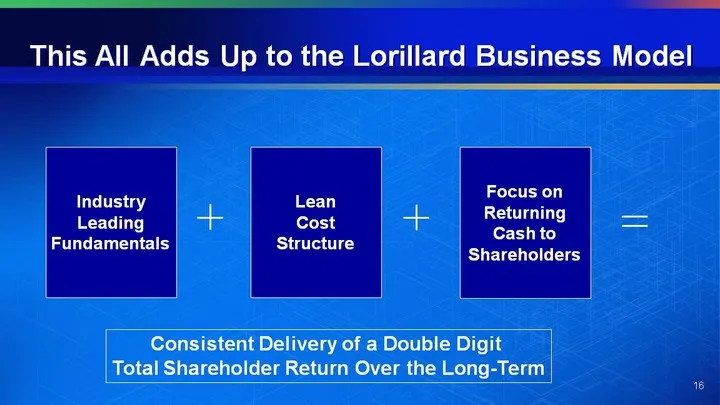
Slide 16: This All Adds Up to the Lorillard Business Model
This All Adds Up to the Lorillard Business Model Industry Leading Fundamentals Lean Cost Structure Focus on Returning Cash to Shareholders Consistent Delivery of a Double Digit Total Shareholder Return Over the Long-Term 16
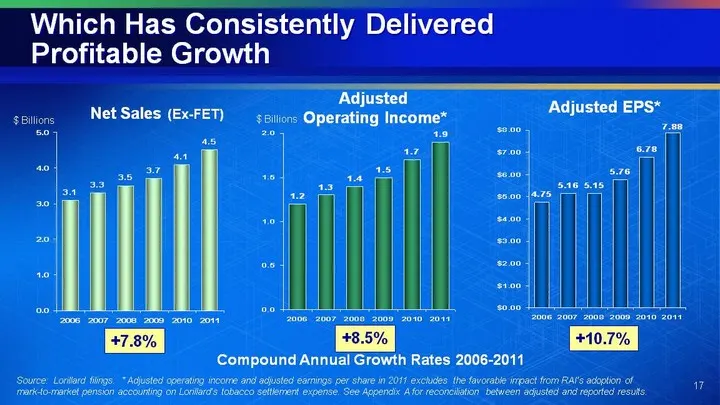
Slide 17: Which Has Consistently Delivered Profitable Growth
Source: Lorillard filings. * Adjusted operating income and adjusted earnings per share in 2011 excludes the favorable impact from RAI's adoption of mark-to-market pension accounting on Lorillard's tobacco settlement expense. See Appendix A for reconciliation between adjusted and reported results. Wh
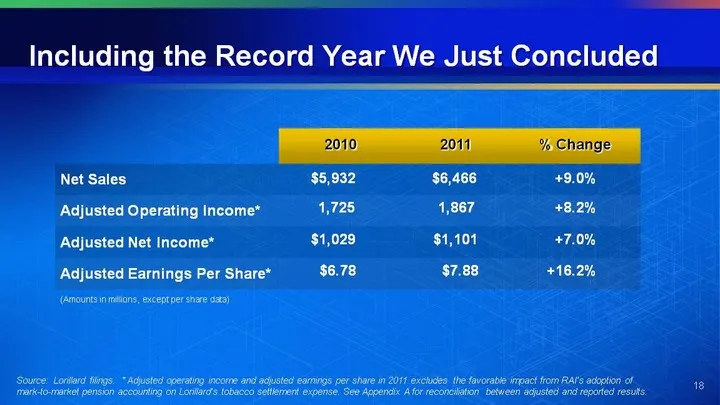
Slide 18: Including the Record Year We Just Concluded
18 Including the Record Year We Just Concluded Net Sales Adjusted Operating Income* Adjusted Net Income* Adjusted Earnings Per Share* $5,932 1,725 $1,029 $6.78 $6,466 1,867 $1,101 $7.88 2010 2011 % Change +9.0% +8.2% +7.0% +16.2% (Amounts in millions, except per share data) Source: Lorillard filings
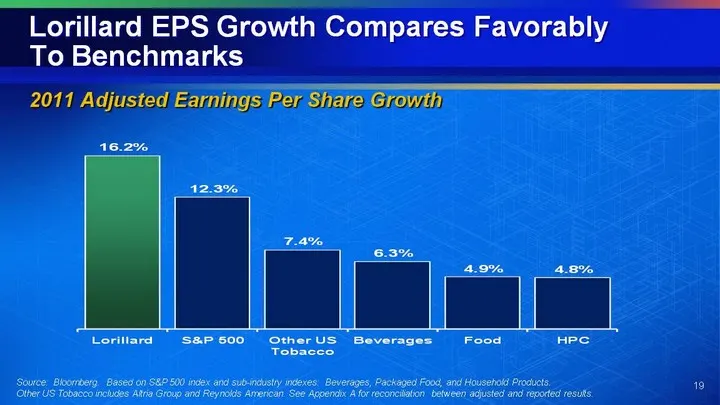
Slide 19: Lorillard EPS Growth Compares Favorably To Benchmarks
19 Lorillard EPS Growth Compares Favorably To Benchmarks 2011 Adjusted Earnings Per Share Growth Source: Bloomberg. Based on S&P 500 index and sub-industry indexes: Beverages, Packaged Food, and Household Products. Other US Tobacco includes Altria Group and Reynolds American. See Appendix A for reco
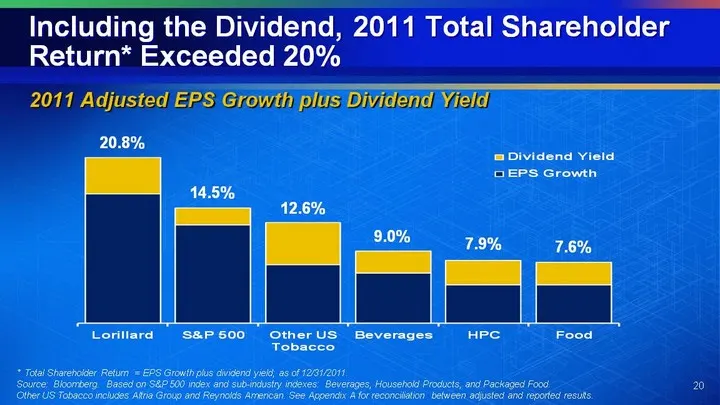
Slide 20: 2011 Total Shareholder Return Exceeded 20%
20 Including the Dividend, 2011 Total Shareholder Return* Exceeded 20% 2011 Adjusted EPS Growth plus Dividend Yield * Total Shareholder Return = EPS Growth plus dividend yield; as of 12/31/2011. Source: Bloomberg. Based on S&P 500 index and sub-industry indexes: Beverages, Household Products, and Pa
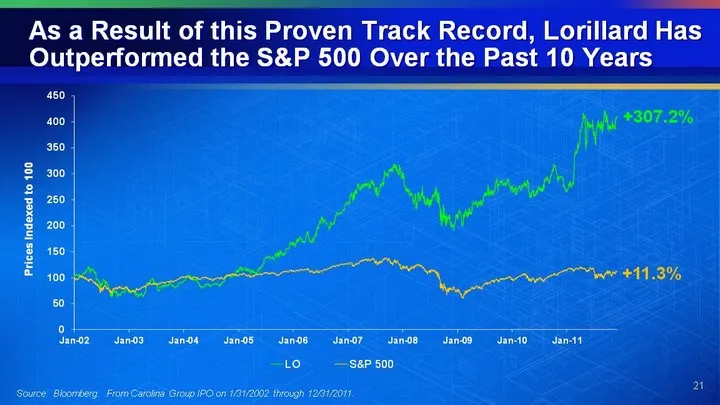
Slide 21: Lorillard Has Outperformed the S&P 500 Over the Past 10 Years
As a Result of this Proven Track Record, Lorillard Has Outperformed the S&P 500 Over the Past 10 Years Source: Bloomberg. From Carolina Group IPO on 1/31/2002 through 12/31/2011. +307.2% +11.3% Prices Indexed to 100 21
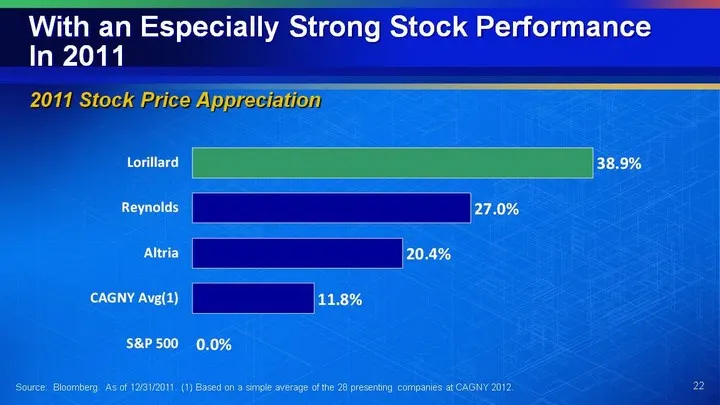
Slide 22: With an Especially Strong Stock Performance In 2011
With an Especially Strong Stock Performance In 2011 22 2011 Stock Price Appreciation Source: Bloomberg. As of 12/31/2011. (1) Based on a simple average of the 28 presenting companies at CAGNY 2012.
Slide 23: Two Key Questions Determine Future Value Creation Potential
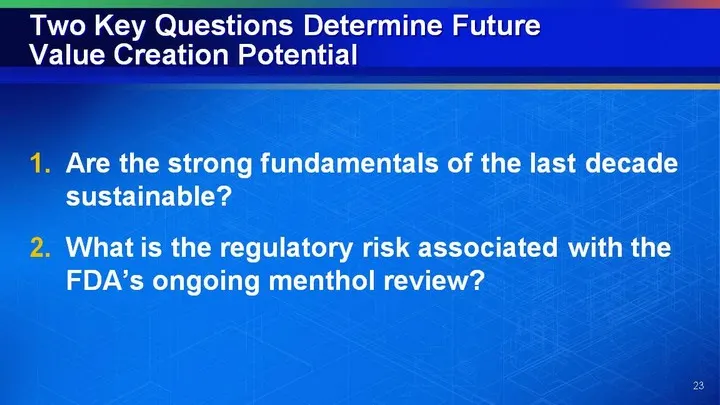
23 Two Key Questions Determine Future Value Creation Potential Are the strong fundamentals of the last decade sustainable? What is the regulatory risk associated with the FDA's ongoing menthol review?
Slide 24: Strategic Assessment Indicates Business Model is Sustainable
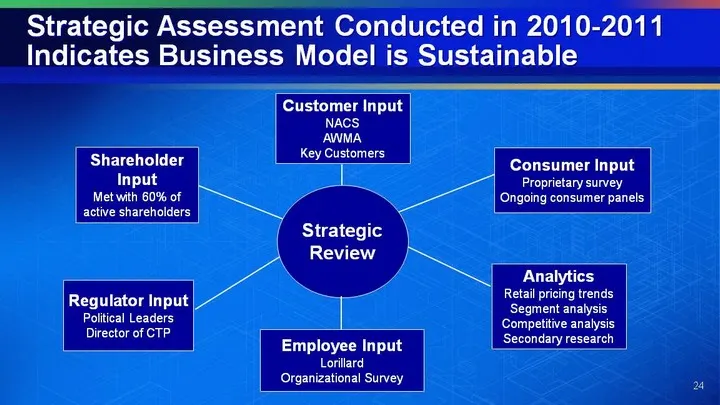
24 Strategic Assessment Conducted in 2010-2011 Indicates Business Model is Sustainable Strategic Review Shareholder Input Met with 60% of active shareholders Customer Input NACS AWMA Key Customers Regulator Input Political Leaders Director of CTP Employee Input Lorillard Organizational Survey Consum

Slide 25: Identified Expanded Lorillard Vision
25 Identified Expanded Lorillard Vision
Slide 26: To be Executed Via a Three-Prong Strategy
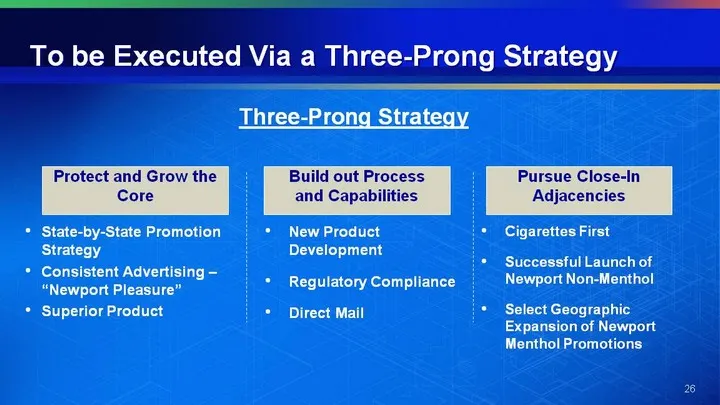
To be Executed Via a Three-Prong Strategy State-by-State Promotion Strategy Consistent Advertising - "Newport Pleasure" Superior Product 26 New Product Development Regulatory Compliance Direct Mail Cigarettes First Successful Launch of Newport Non-Menthol Select Geographic Expansion of Newport Menth
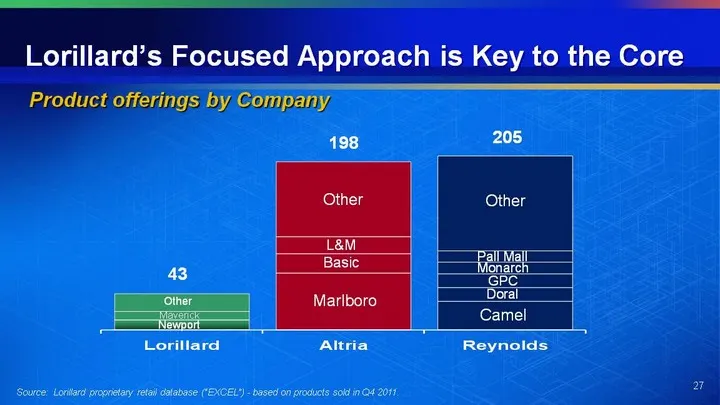
Slide 27: Lorillard's Focused Approach is Key to the Core
27 Lorillard's Focused Approach is Key to the Core Product offerings by Company Source: Lorillard proprietary retail database ("EXCEL") - based on products sold in Q4 2011. 43 205 198 Newport Maverick Other Marlboro Basic L&M Other Camel Doral GPC Monarch Pall Mall Other
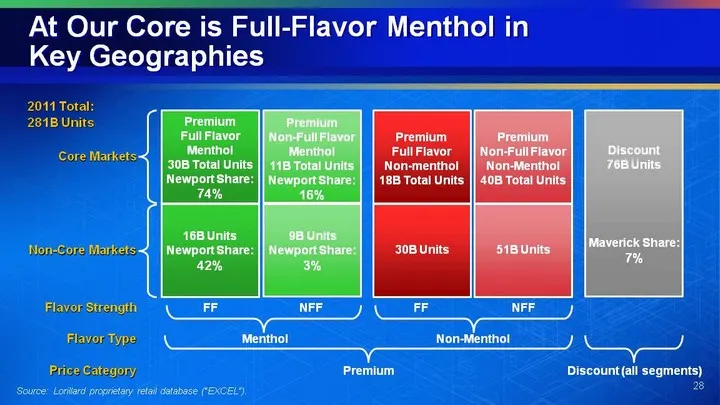
Slide 28: At Our Core is Full-Flavor Menthol in Key Geographies
28 At Our Core is Full-Flavor Menthol in Key Geographies FF NFF Menthol Non-Menthol FF NFF Flavor Strength Flavor Type Price Category Premium Full Flavor Menthol 30B Total Units Newport Share: 74% Premium Non-Full Flavor Menthol 11B Total Units Newport Share: 16% Premium Full Flavor Non-menthol 18B
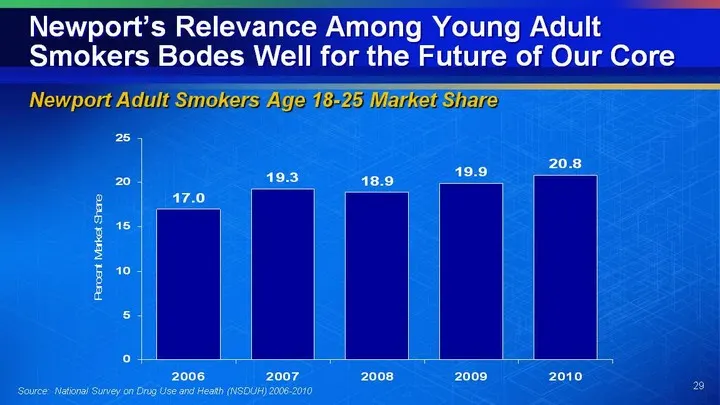
Slide 29: Newport's Relevance Among Young Adult Smokers Bodes Well for the Future
Newport's Relevance Among Young Adult Smokers Bodes Well for the Future of Our Core 2006 2007 2008 2009 2010 East 17 19.3 18.9 19.9 20.8 Source: National Survey on Drug Use and Health (NSDUH) 2006-2010 Newport Adult Smokers Age 18-25 Market Share 29
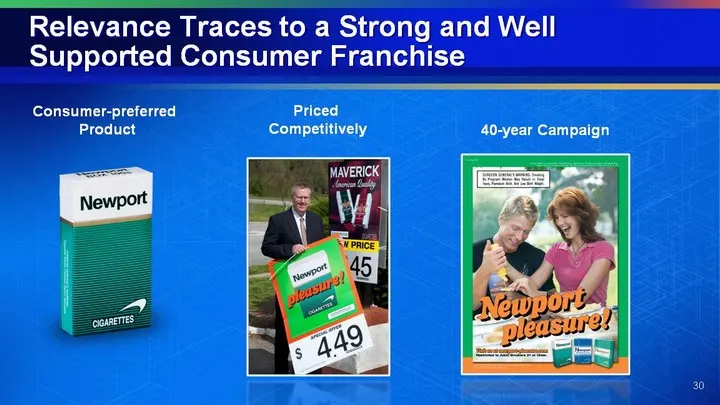
Slide 30: Relevance Traces to a Strong and Well Supported Consumer Franchise
30 Relevance Traces to a Strong and Well Supported Consumer Franchise Priced Competitively 40-year Campaign Consumer-preferred Product
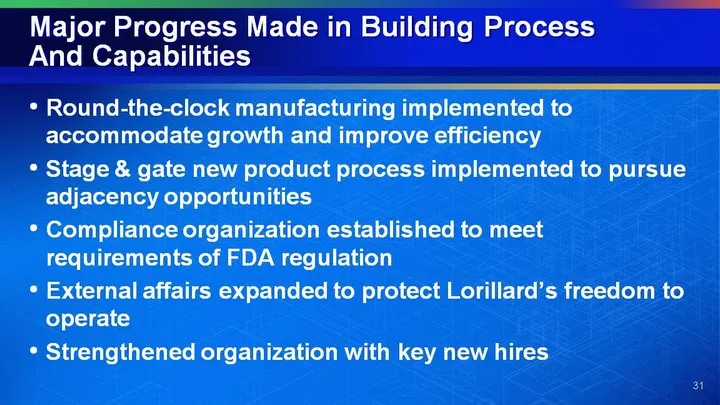
Slide 31: Major Progress Made in Building Process And Capabilities
Major Progress Made in Building Process And Capabilities Round-the-clock manufacturing implemented to accommodate growth and improve efficiency Stage & gate new product process implemented to pursue adjacency opportunities Compliance organization established to meet requirements of FDA regulation Ex
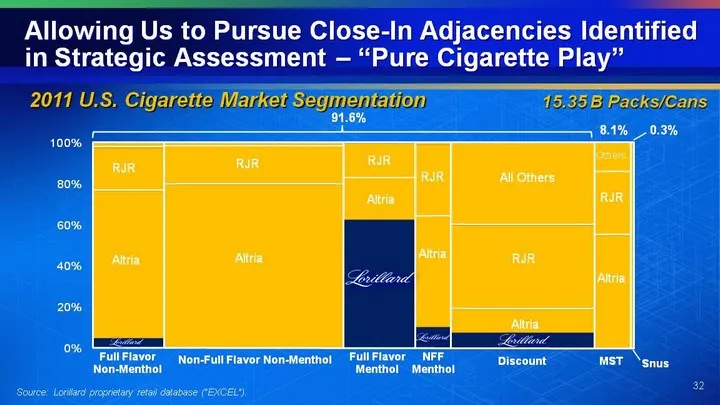
Slide 32: Allowing Us to Pursue Close-In Adjacencies
Allowing Us to Pursue Close-In Adjacencies Identified in Strategic Assessment - "Pure Cigarette Play" 32 15.35 B Packs/Cans Source: Lorillard proprietary retail database ("EXCEL"). Altria RJR Others 91.6% 8.1% 0.3% 2011 U.S. Cigarette Market Segmentation
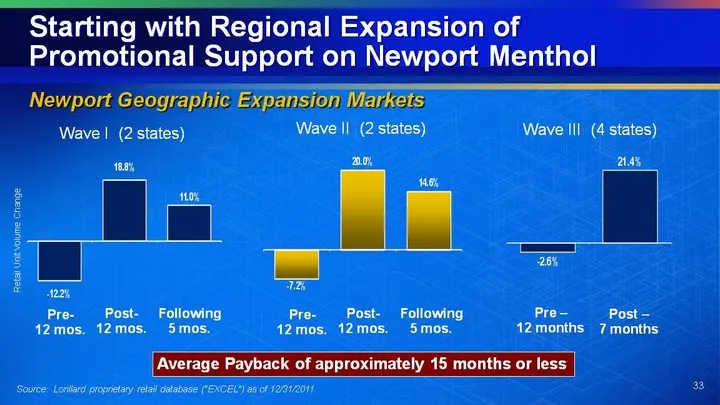
Slide 33: Regional Expansion of Promotional Support on Newport Menthol
33 Starting with Regional Expansion of Promotional Support on Newport Menthol Newport Geographic Expansion Markets Wave I (2 states) Wave II (2 states) Average Payback of approximately 15 months or less Pre- 12 mos. Post- 12 mos. Pre - 12 months Post - 7 months Source: Lorillard proprietary retail d
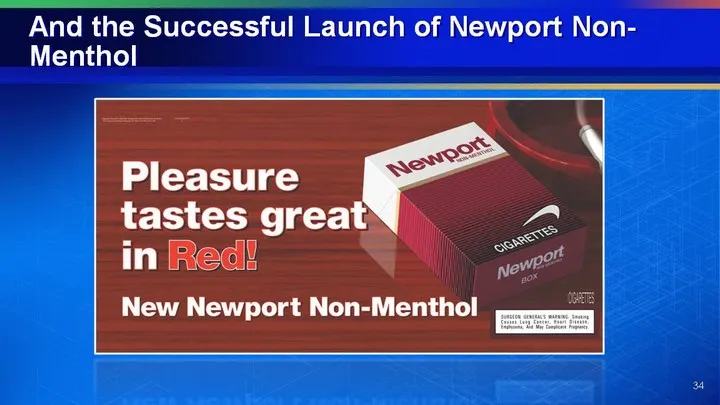
Slide 34: And the Successful Launch of Newport Non-Menthol
34 And the Successful Launch of Newport Non- Menthol
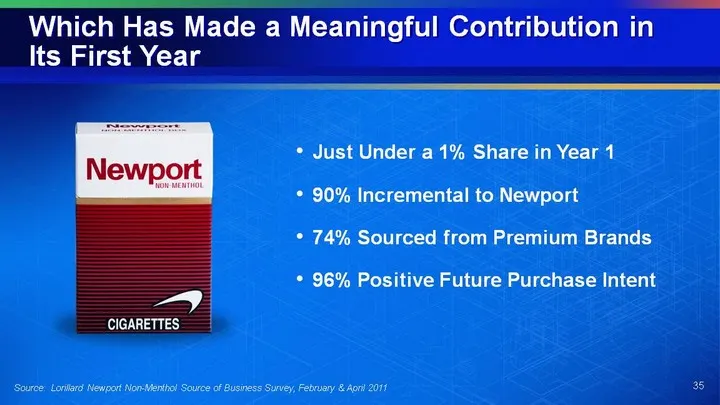
Slide 35: Newport Non-Menthol Made a Meaningful Contribution in Its First Year
35 Source: Lorillard Newport Non-Menthol Source of Business Survey, February & April 2011 Which Has Made a Meaningful Contribution in Its First Year Just Under a 1% Share in Year 1 90% Incremental to Newport 74% Sourced from Premium Brands 96% Positive Future Purchase Intent
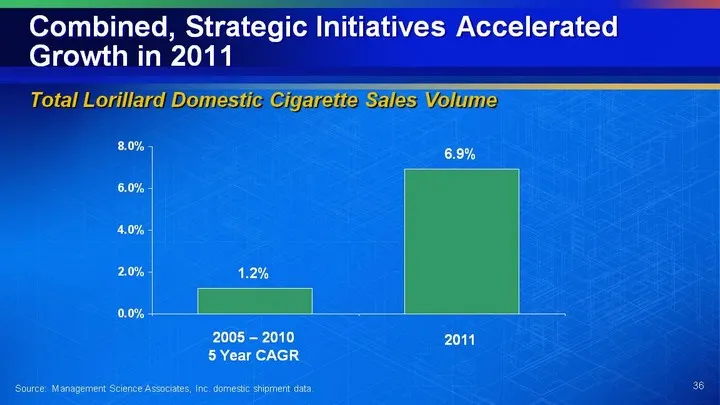
Slide 36: Combined, Strategic Initiatives Accelerated Growth in 2011
Combined, Strategic Initiatives Accelerated Growth in 2011 2005 - 2010 5 Year CAGR 2011 Source: Management Science Associates, Inc. domestic shipment data. Total Lorillard Domestic Cigarette Sales Volume 36
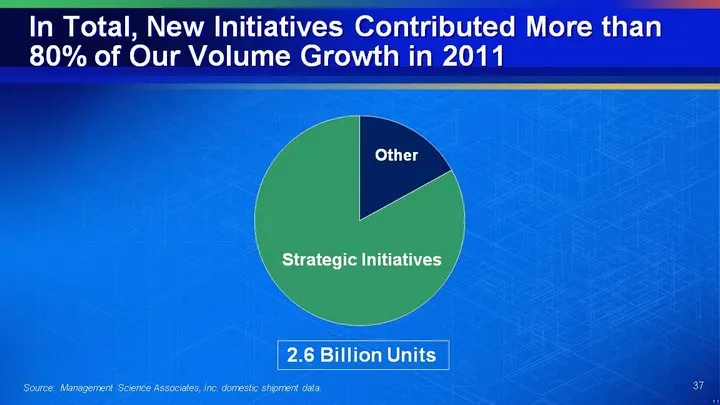
Slide 37: New Initiatives Contributed More than 80% of Volume Growth in 2011
In Total, New Initiatives Contributed More than 80% of Our Volume Growth in 2011 Source: Management Science Associates, Inc. domestic shipment data. Strategic Initiatives Other 2.6 Billion Units 37
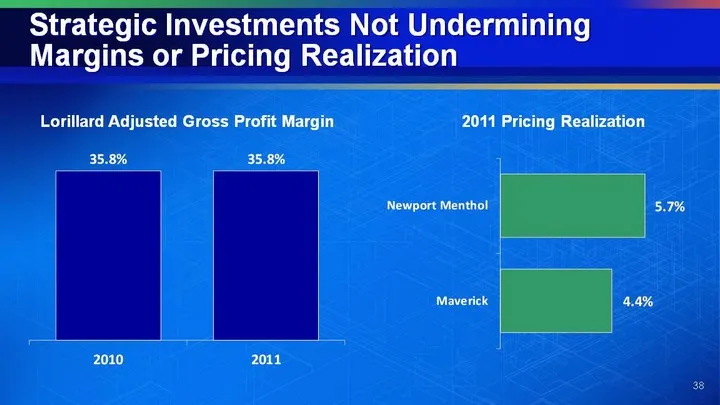
Slide 38: Strategic Investments Not Undermining Margins or Pricing Realization
Strategic Investments Not Undermining Margins or Pricing Realization Lorillard Adjusted Gross Profit Margin 2011 Pricing Realization 38

Slide 39: Are the strong fundamentals of the last decade sustainable?
39 Question 1 Are the strong fundamentals of the last decade sustainable? Yes - Lorillard believes it will continue to outperform industry peers
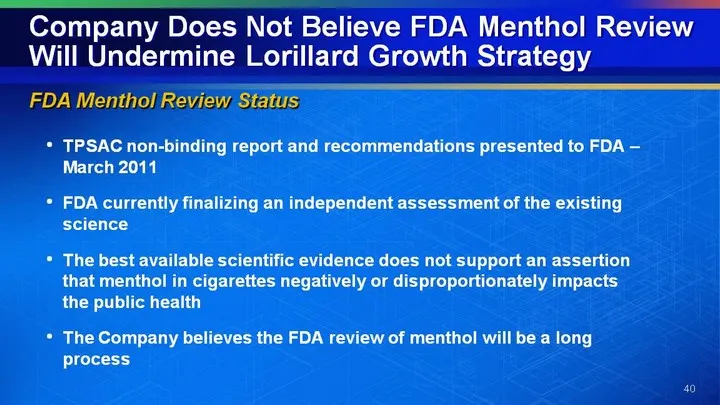
Slide 40: Company Does Not Believe FDA Menthol Review Will Undermine Growth Strategy
Company Does Not Believe FDA Menthol Review Will Undermine Lorillard Growth Strategy TPSAC non-binding report and recommendations presented to FDA - March 2011 FDA currently finalizing an independent assessment of the existing science The best available scientific evidence does not support an assert
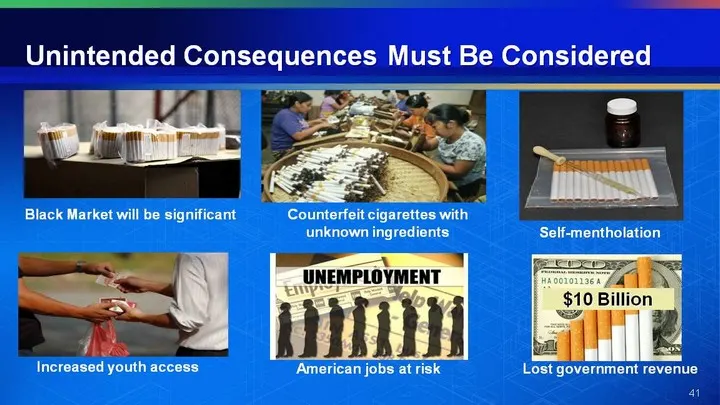
Slide 41: Unintended Consequences Must Be Considered
41 41 41 41 Black Market will be significant Counterfeit cigarettes with unknown ingredients Self-mentholation Increased youth access $10 Billion Lost government revenue American jobs at risk American jobs at risk Unintended Consequences Must Be Considered
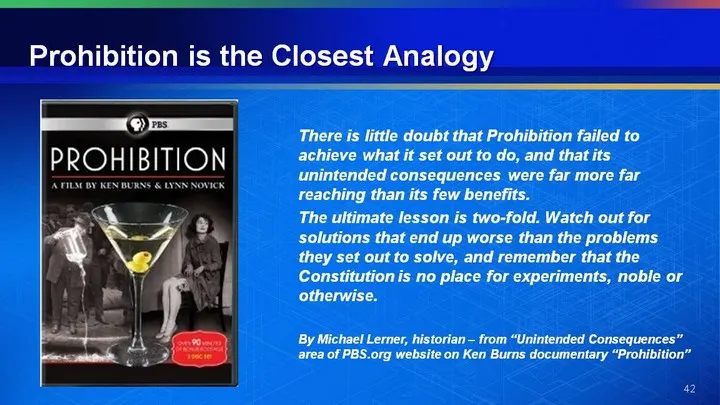
Slide 42: Prohibition is the Closest Analogy
Prohibition is the Closest Analogy There is little doubt that Prohibition failed to achieve what it set out to do, and that its unintended consequences were far more far reaching than its few benefits. The ultimate lesson is two-fold. Watch out for solutions that end up worse than the problems they
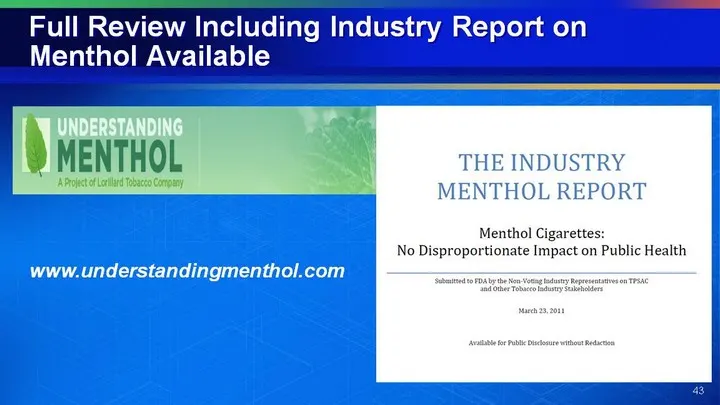
Slide 43: Full Review Including Industry Report on Menthol Available
Full Review Including Industry Report on Menthol Available www.understandingmenthol.com 43
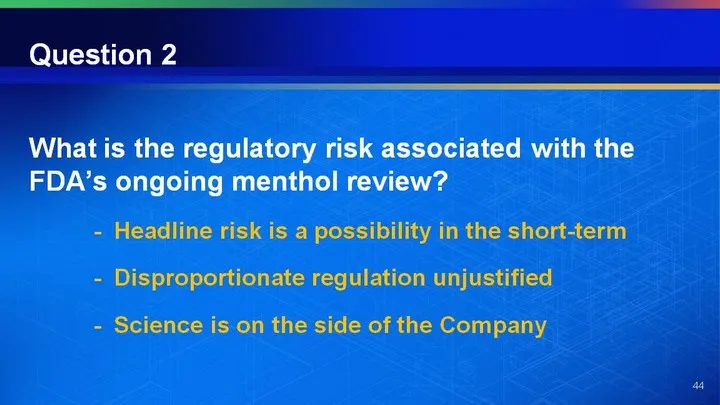
Slide 44: What is the regulatory risk of the FDA's ongoing menthol review?
44 Question 2 What is the regulatory risk associated with the FDA's ongoing menthol review? - Headline risk is a possibility in the short-term - Disproportionate regulation unjustified - Science is on the side of the Company
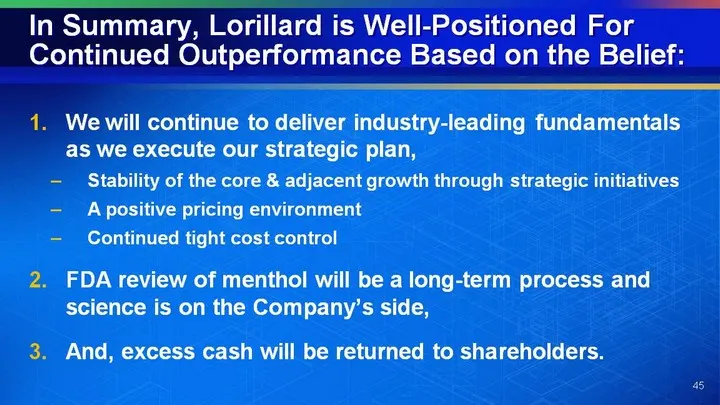
Slide 45: In Summary, Lorillard is Well-Positioned For Continued Outperformance
45 In Summary, Lorillard is Well-Positioned For Continued Outperformance Based on the Belief: We will continue to deliver industry-leading fundamentals as we execute our strategic plan, Stability of the core & adjacent growth through strategic initiatives A positive pricing environment Continued tig
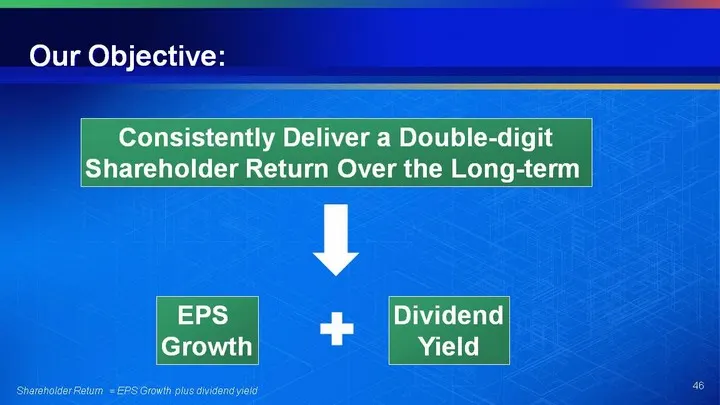
Slide 46: Our Objective: Consistently Deliver a Double-digit Shareholder Return
Our Objective: Consistently Deliver a Double-digit Shareholder Return Over the Long-term EPS Growth Dividend Yield Shareholder Return = EPS Growth plus dividend yield 46
Slide 47: Questions
Questions Murray S. Kessler Chairman, President and Chief Executive Officer David H. Taylor Executive Vice President and Chief Financial Officer Ronald S. Milstein Executive Vice President and General Counsel 47
Slide 48: Appendix A Regulation G Reconciliations
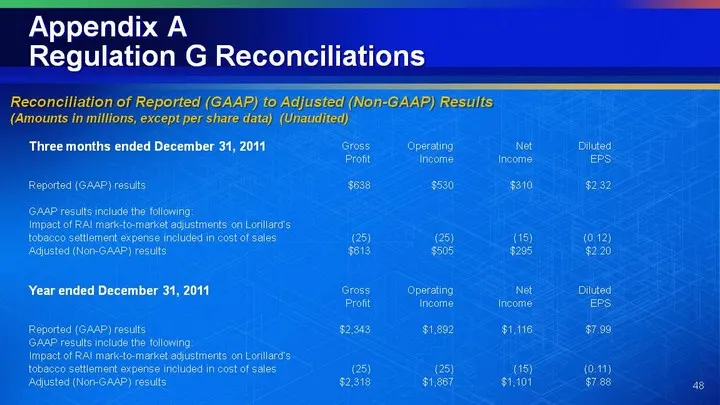
48 Appendix A Regulation G Reconciliations Reconciliation of Reported (GAAP) to Adjusted (Non-GAAP) Results (Amounts in millions, except per share data) (Unaudited) Three months ended December 31, 2011 Gross Profit Operating Income Net Income Diluted EPS Reported (GAAP) results $638 $530 $310 $2.32

Slide 49: 49
49
Source: SEC EDGAR · 8-K filed Feb 23, 2012
More decks from Lorillard Inc
 Merger or Acquisition (February 2015)62 slides · Feb 18, 2015
 Merger or Acquisition (November 2014)40 slides · Nov 17, 2014
 Merger or Acquisition (September 2014)25 slides · Sep 4, 2014
 Merger or Acquisition (July 2014)13 slides · Jul 15, 2014
 Merger or Acquisition (July 2014)42 slides · Jul 15, 2014
 Merger or Acquisition (July 2014)30 slides · Jul 15, 2014