INFICON Holding AG · SIX:IFCN
INFICON — Q1 2019 Earnings Presentation
20 slides from INFICON's earnings presentation, Apr 17, 2019
Slide 1: Q1 2019 Earnings Conference Call
Q1 2019 EARNINGS CONFERENCE CALL April 17, 2019 Bad Ragaz, Switzerland
Slide 2: Speakers
Summary End Markets Outlook P&L / Balance Sheet Guidance Speakers Lukas Winkler, President and CEO Key figures Q1 2019 Target market business review Expectations 2019 Matthias Tröndle, Vice President and CFO Financials Q1 2019 Guidance April 17, 2019 2
Slide 3: Speakers: Lukas Winkler
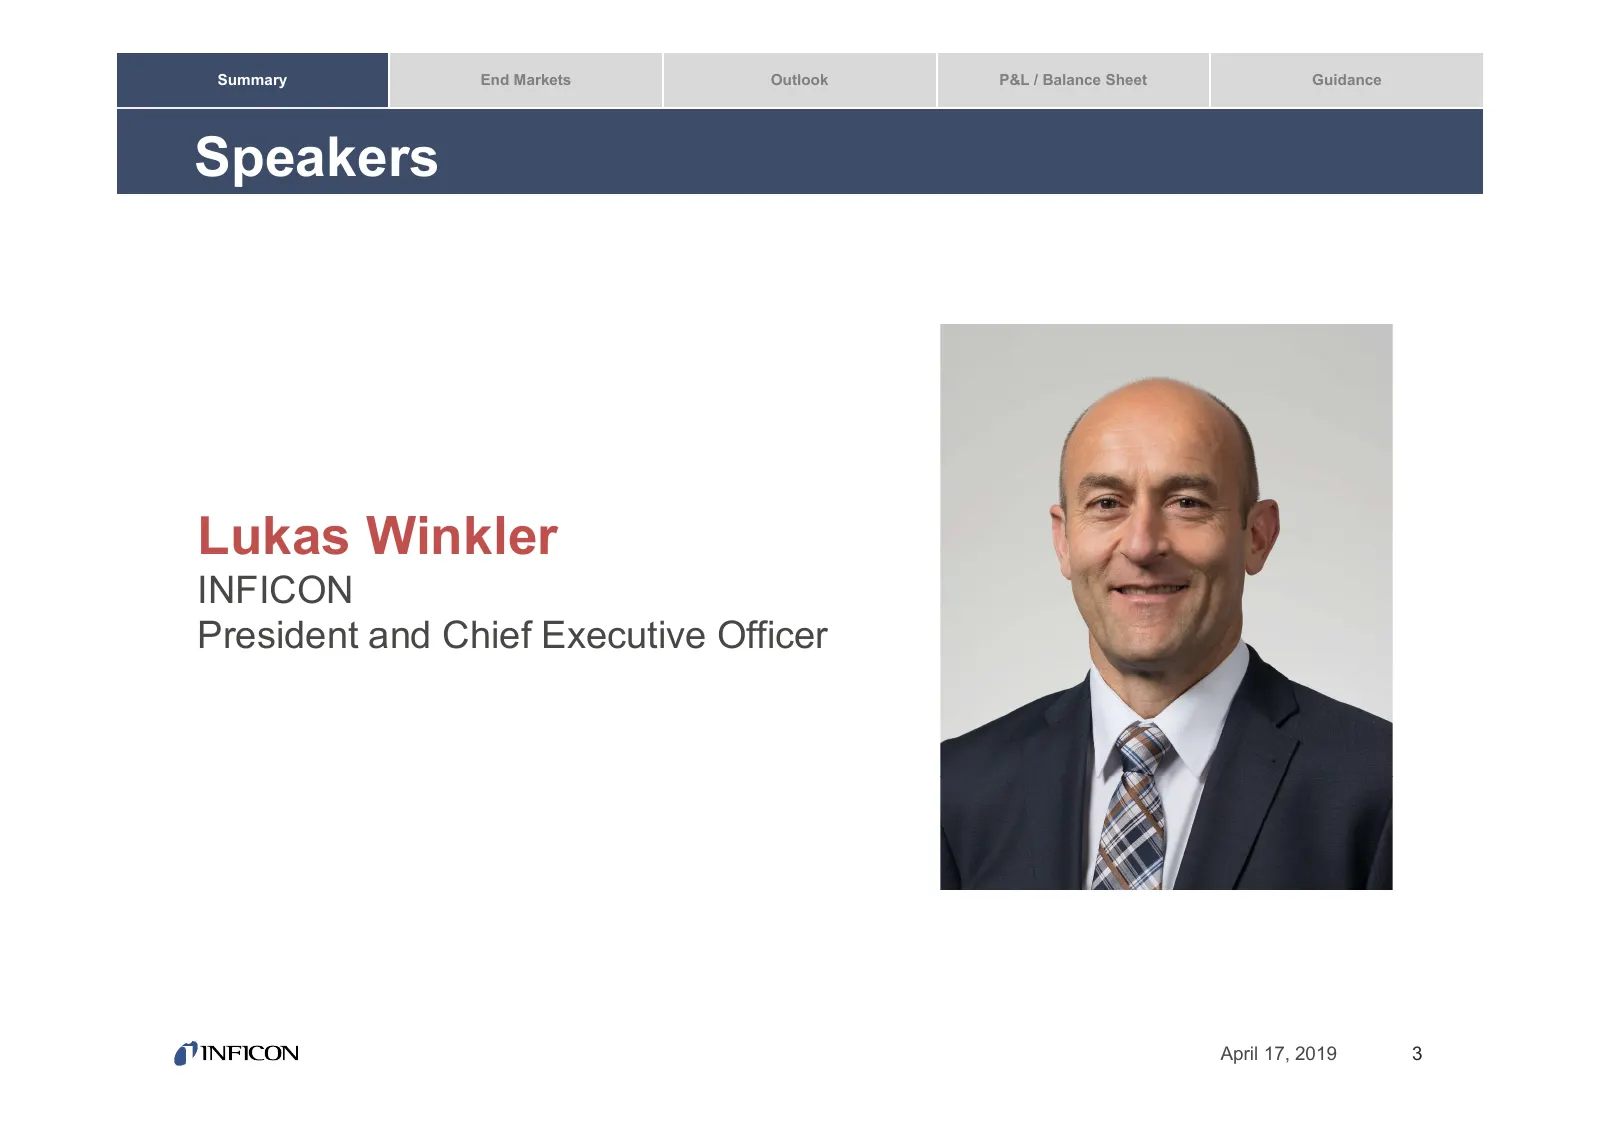
Summary End Markets Outlook P&L / Balance Sheet Guidance Speakers Lukas Winkler INFICON President and Chief Executive Officer April 17, 2019 3
Slide 4: Q1 2019 Key Figures
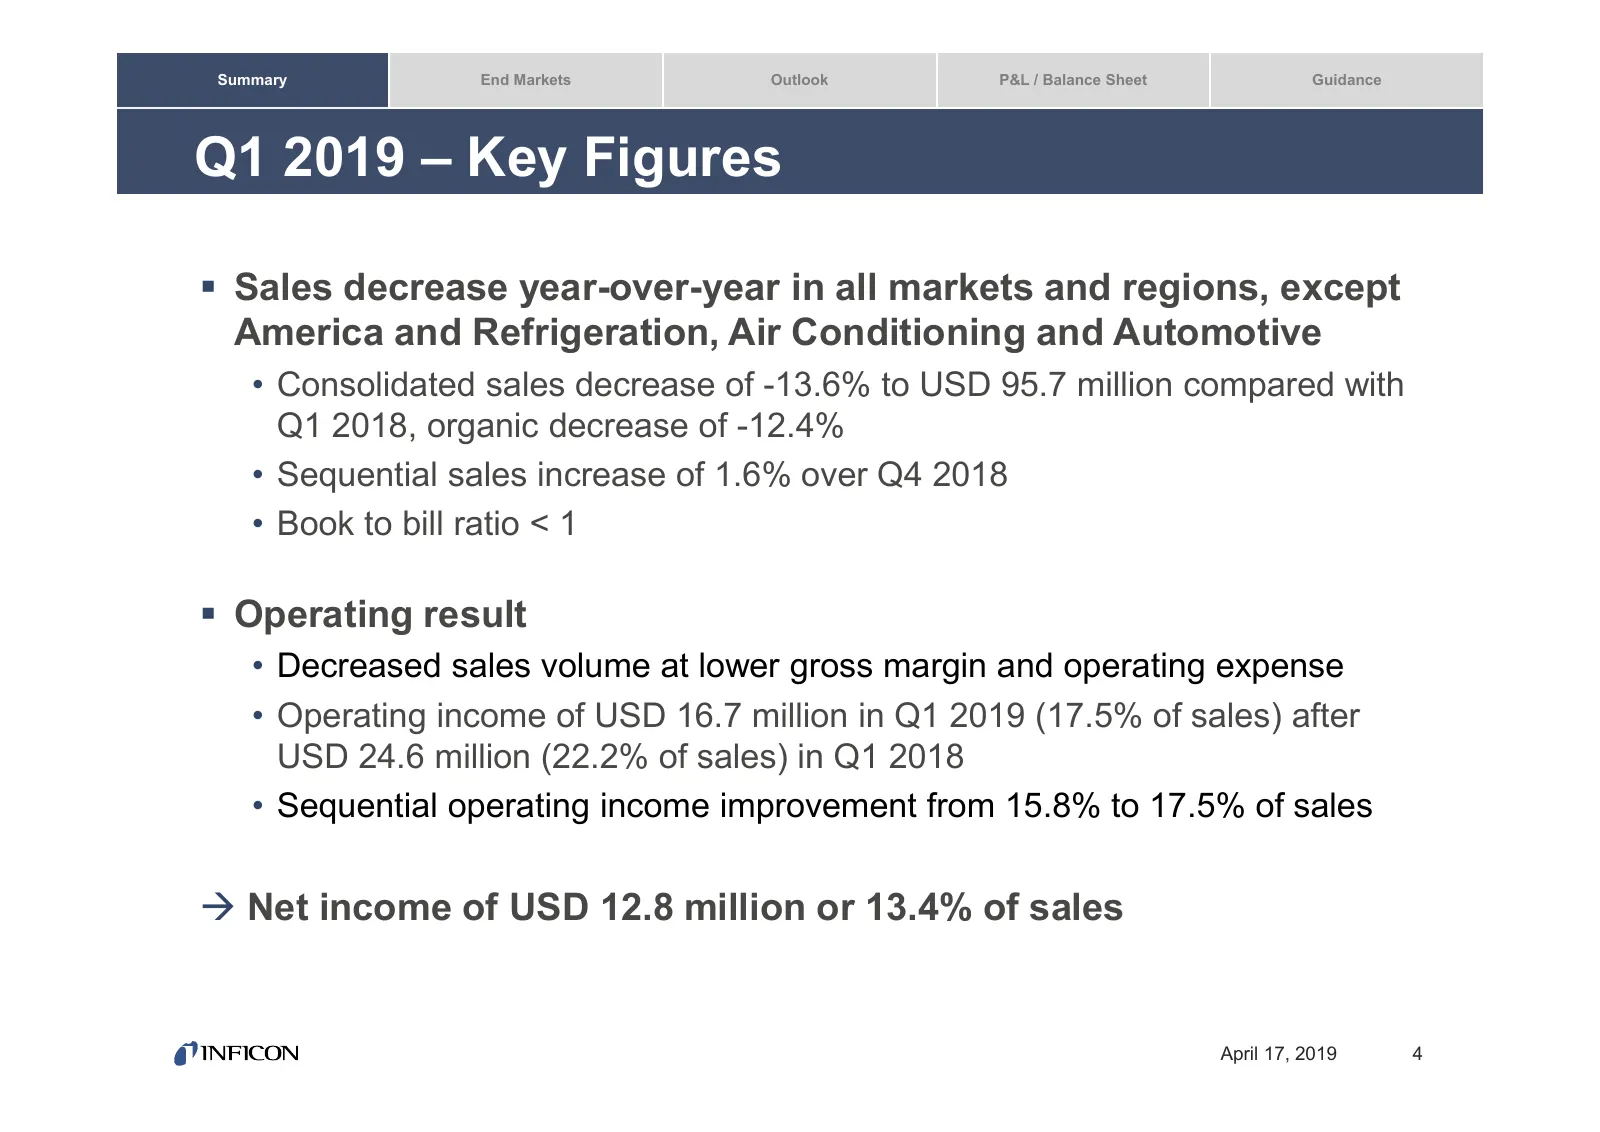
Summary End Markets Outlook P&L / Balance Sheet Guidance Q4 2019 Q1 2018 – Key Figures Sales decrease year-over-year in all markets and regions, except America and Refrigeration, Air Conditioning and Automotive • Consolidated sales decrease of -13.6% to USD 95.7 million compared with Q1 2018, orga
Slide 5: Net Sales by End Market
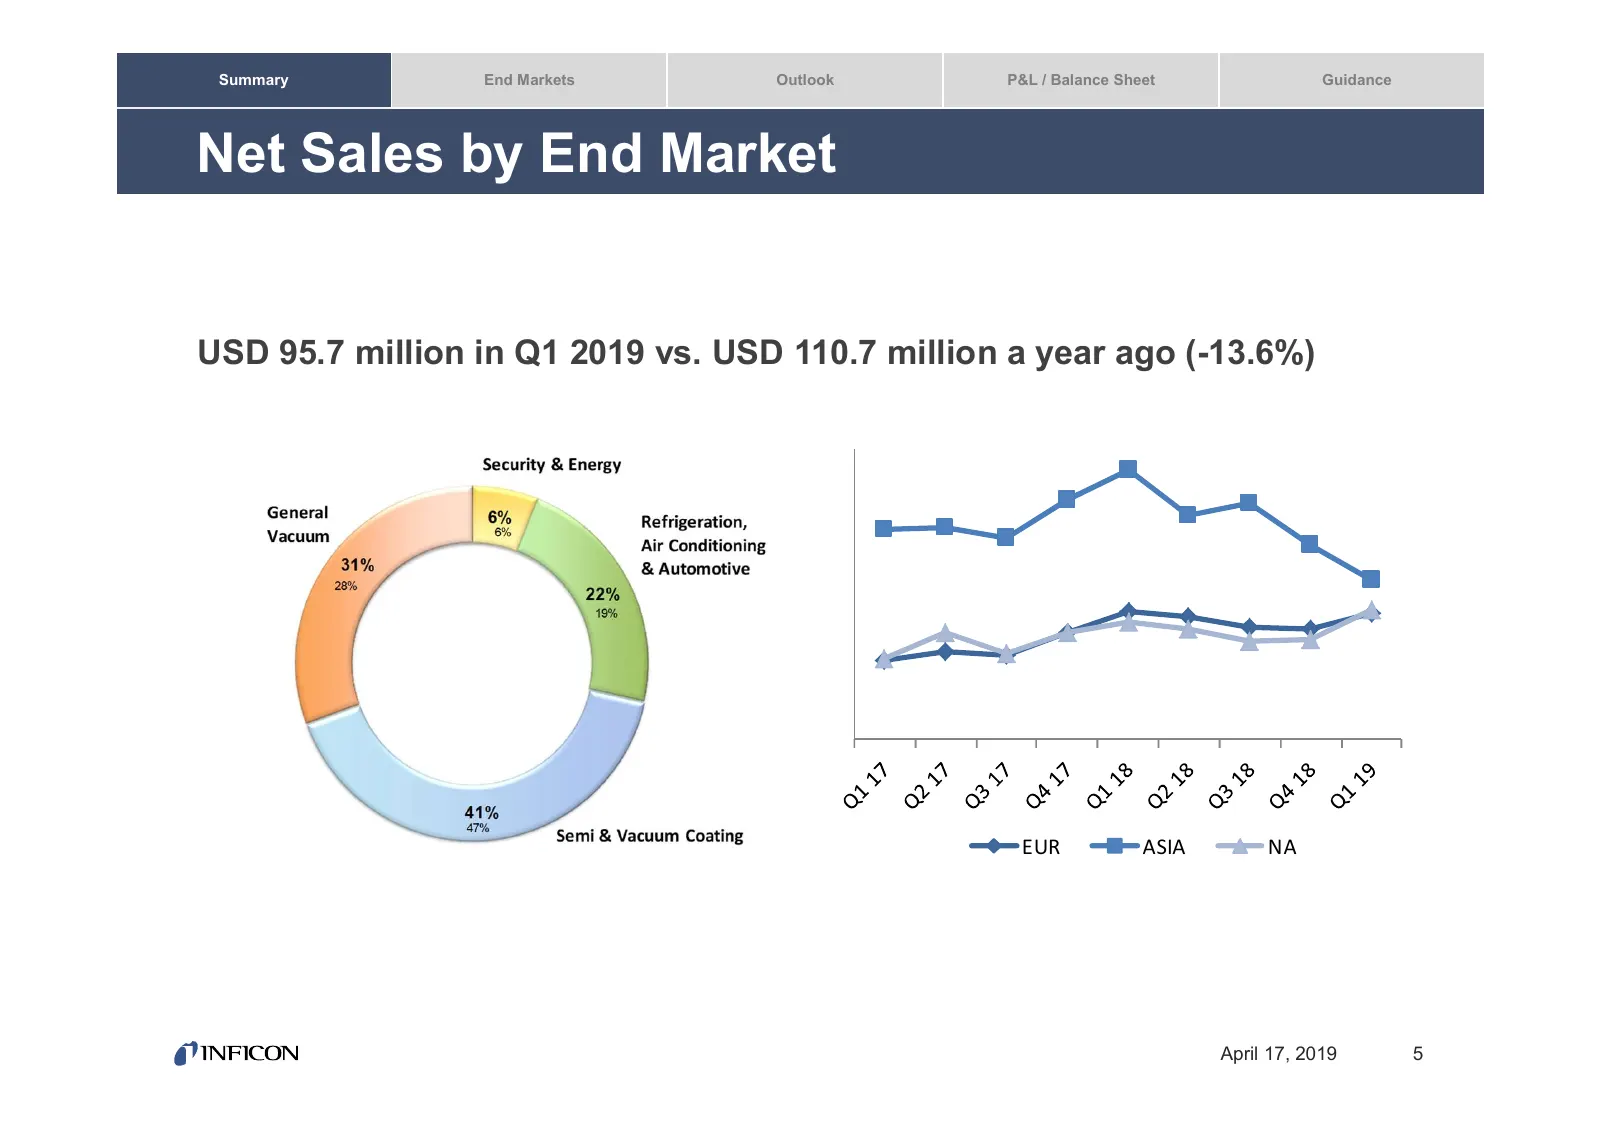
Summary End Markets Outlook P&L / Balance Sheet Guidance Net Sales by End Market USD 95.7 million in Q1 2019 vs. USD 110.7 million a year ago (-13.6%) EUR ASIA NA April 17, 2019 5
Slide 6: Security & Energy
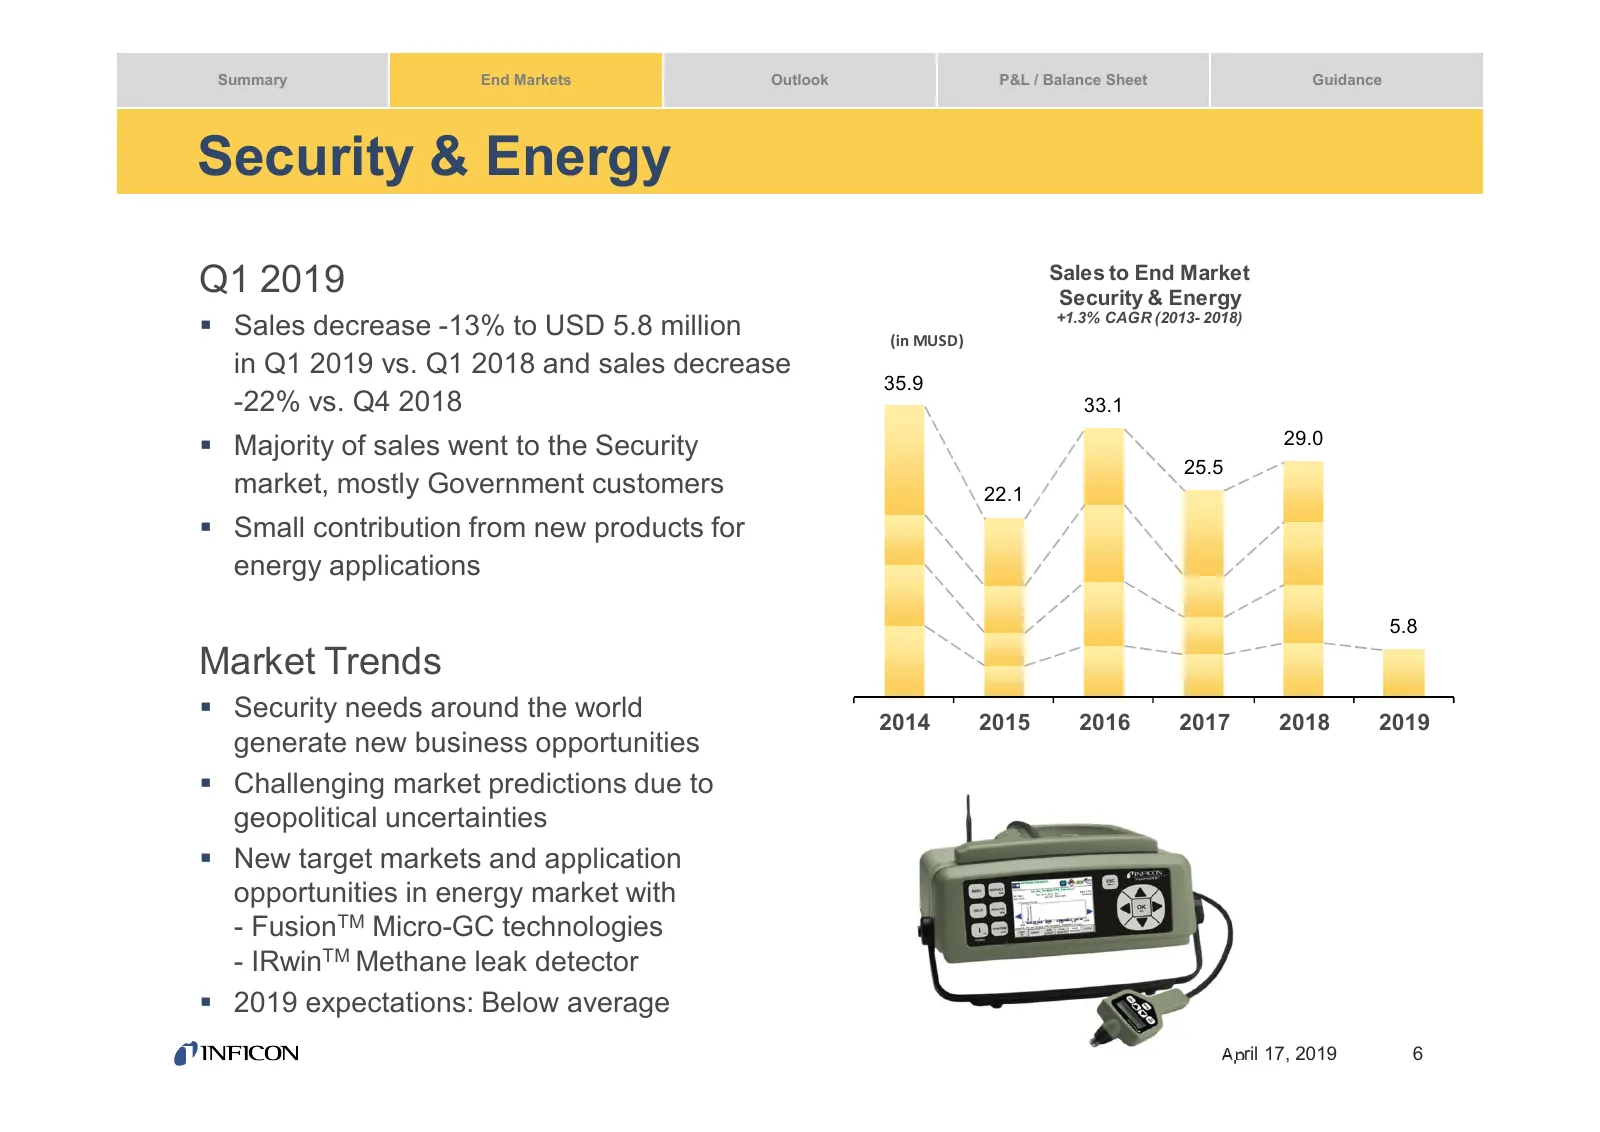
Summary End Markets Outlook P&L / Balance Sheet Guidance Security & Energy Q1 2019 Sales to End Market Security & Energy +1.3% CAGR (2013- 2018) Sales decrease -13% to USD 5.8 million (in MUSD) in Q1 2019 vs. Q1 2018 and sales decrease 35.9 -22% vs. Q4 2018 33.1 Majority of sales went to the Sec
Slide 7: Refrigeration, Air Conditioning & Automotive
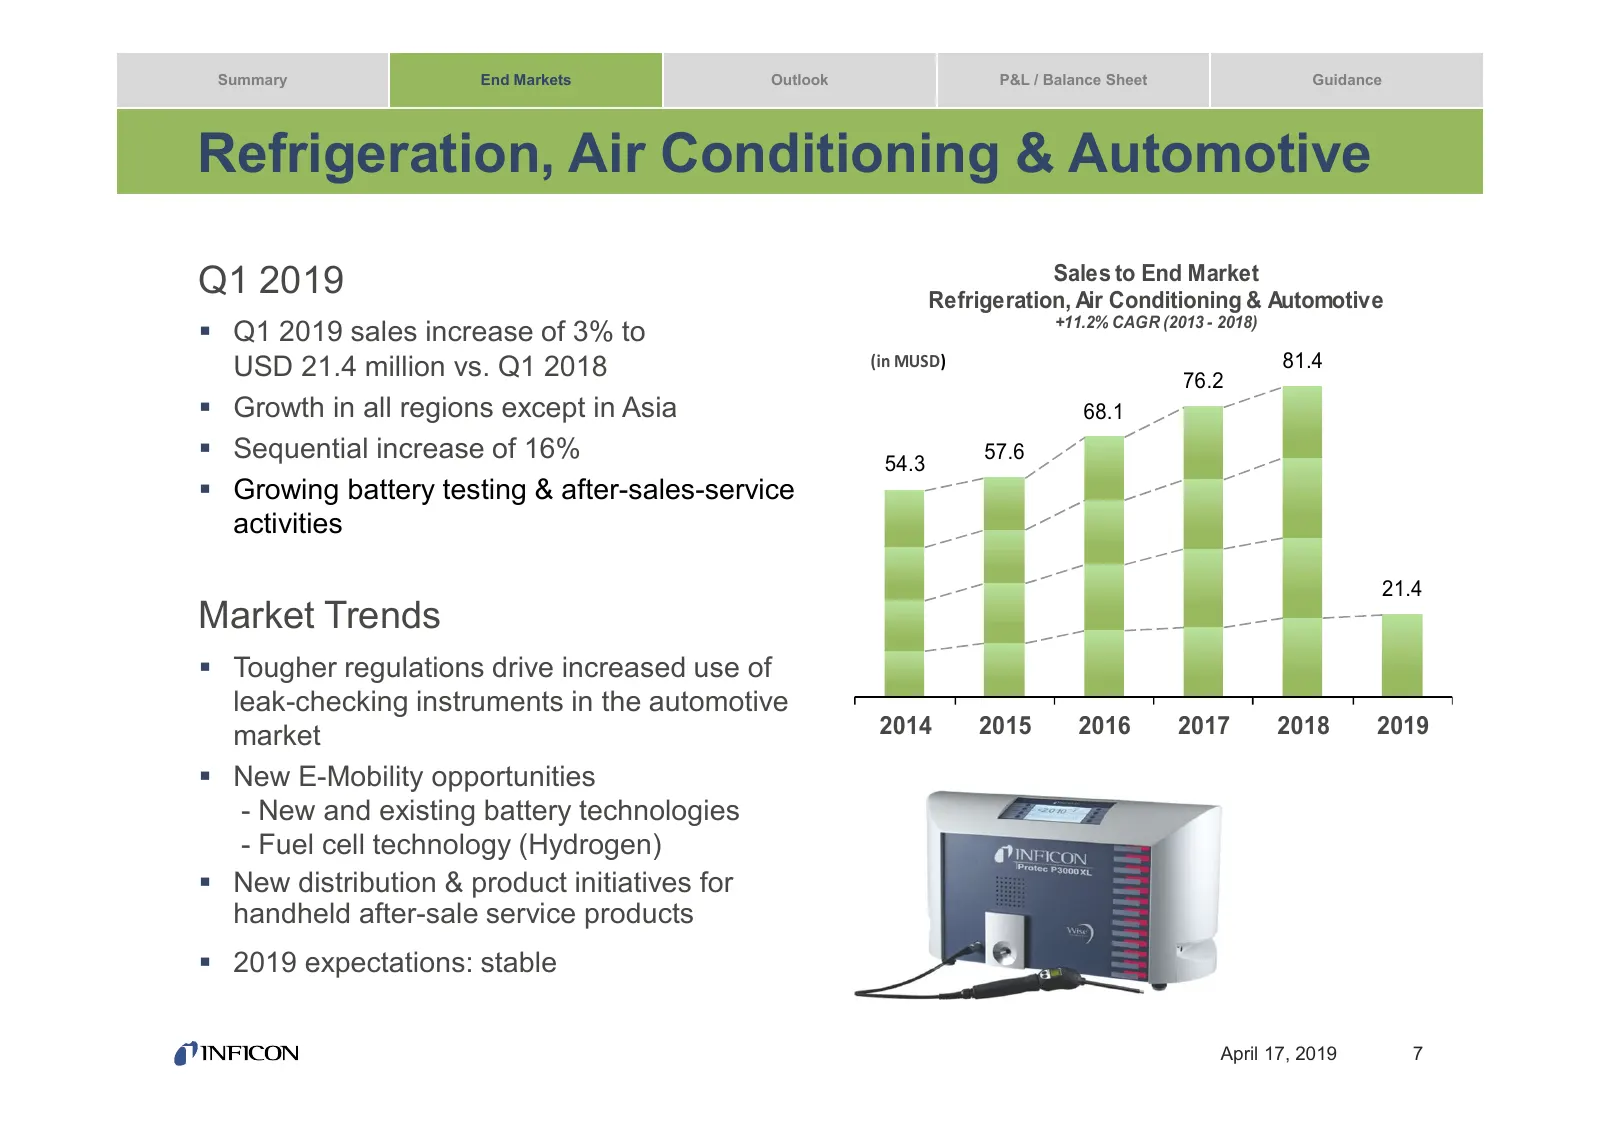
Summary End Markets Outlook P&L / Balance Sheet Guidance Refrigeration, Air Conditioning & Automotive Q1 2019 Sales to End Market Refrigeration, Air Conditioning & Automotive +11.2% CAGR (2013 - 2018) Q1 2019 sales increase of 3% to USD 21.4 million vs. Q1 2018 (in MUSD) 81.4 76.2 Growth in all
Slide 8: Semi & Vacuum Coating
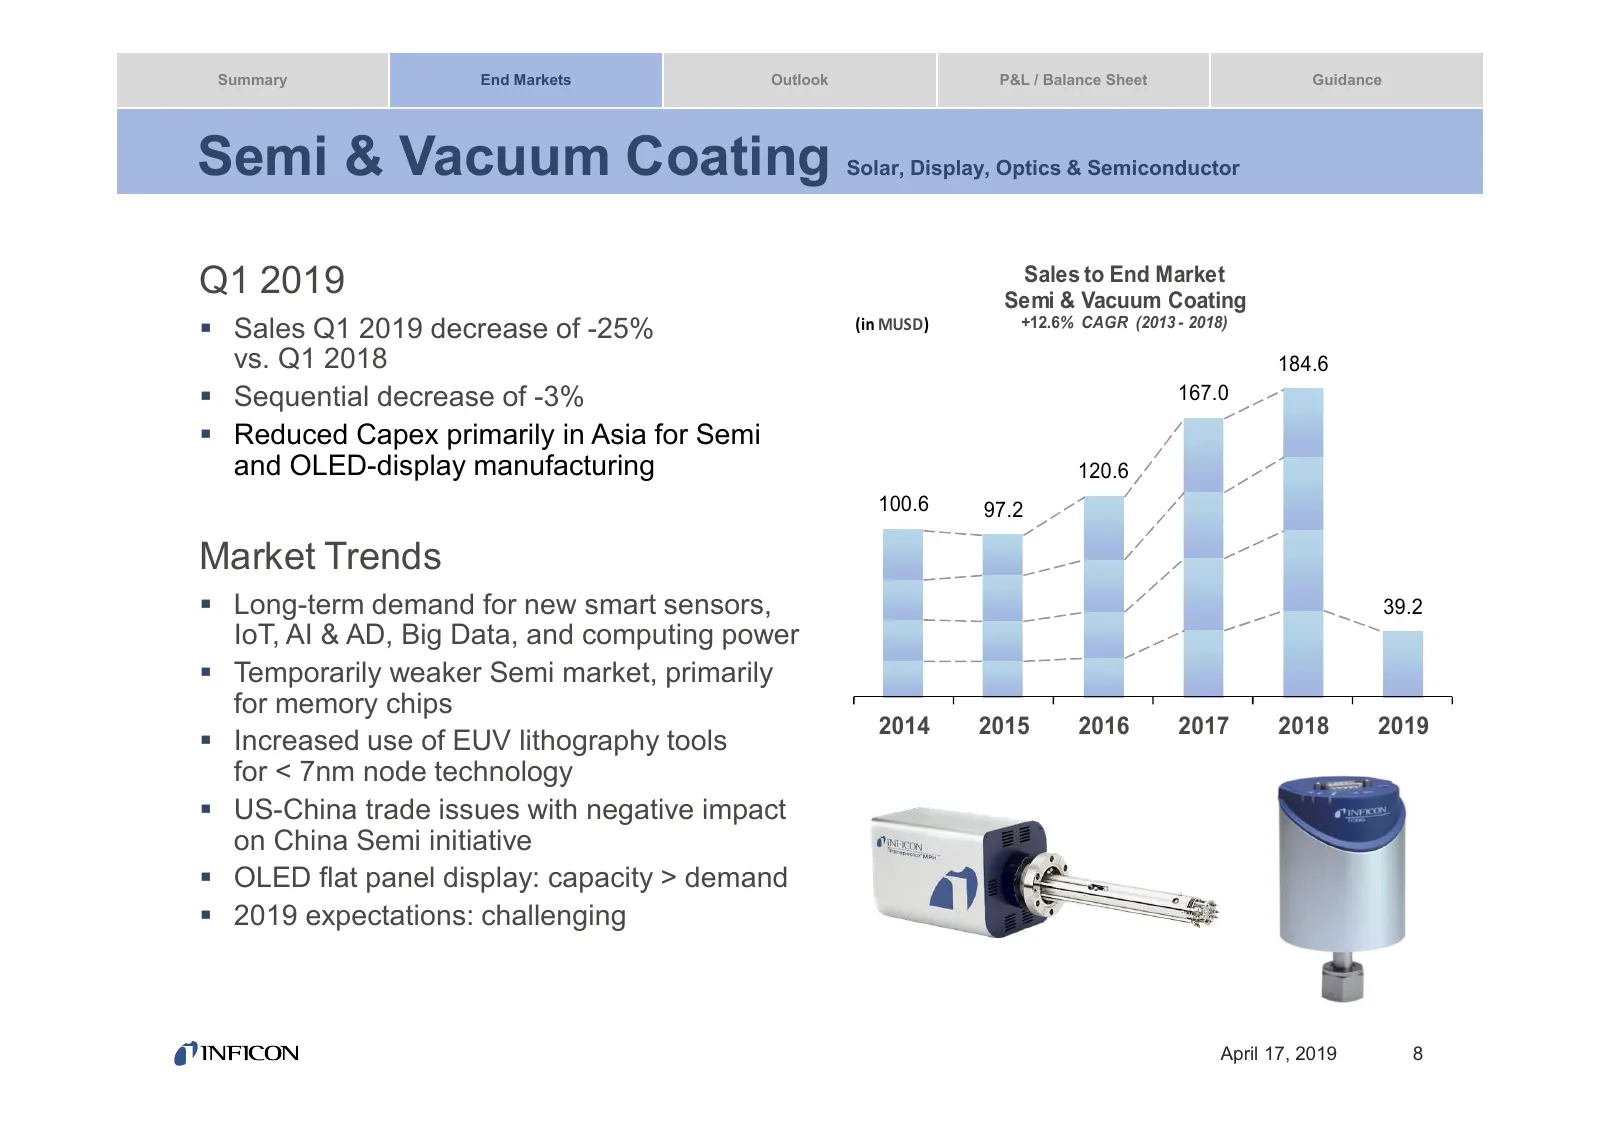
Summary End Markets Outlook P&L / Balance Sheet Guidance Semi & Vacuum Coating Solar, Display, Optics & Semiconductor Q1 2019 Sales to End Market Semi & Vacuum Coating Sales Q1 2019 decrease of -25% (in MUSD) +12.6% CAGR (2013 - 2018) vs. Q1 2018 184.6 Sequential decrease of -3% 167.0 Reduced
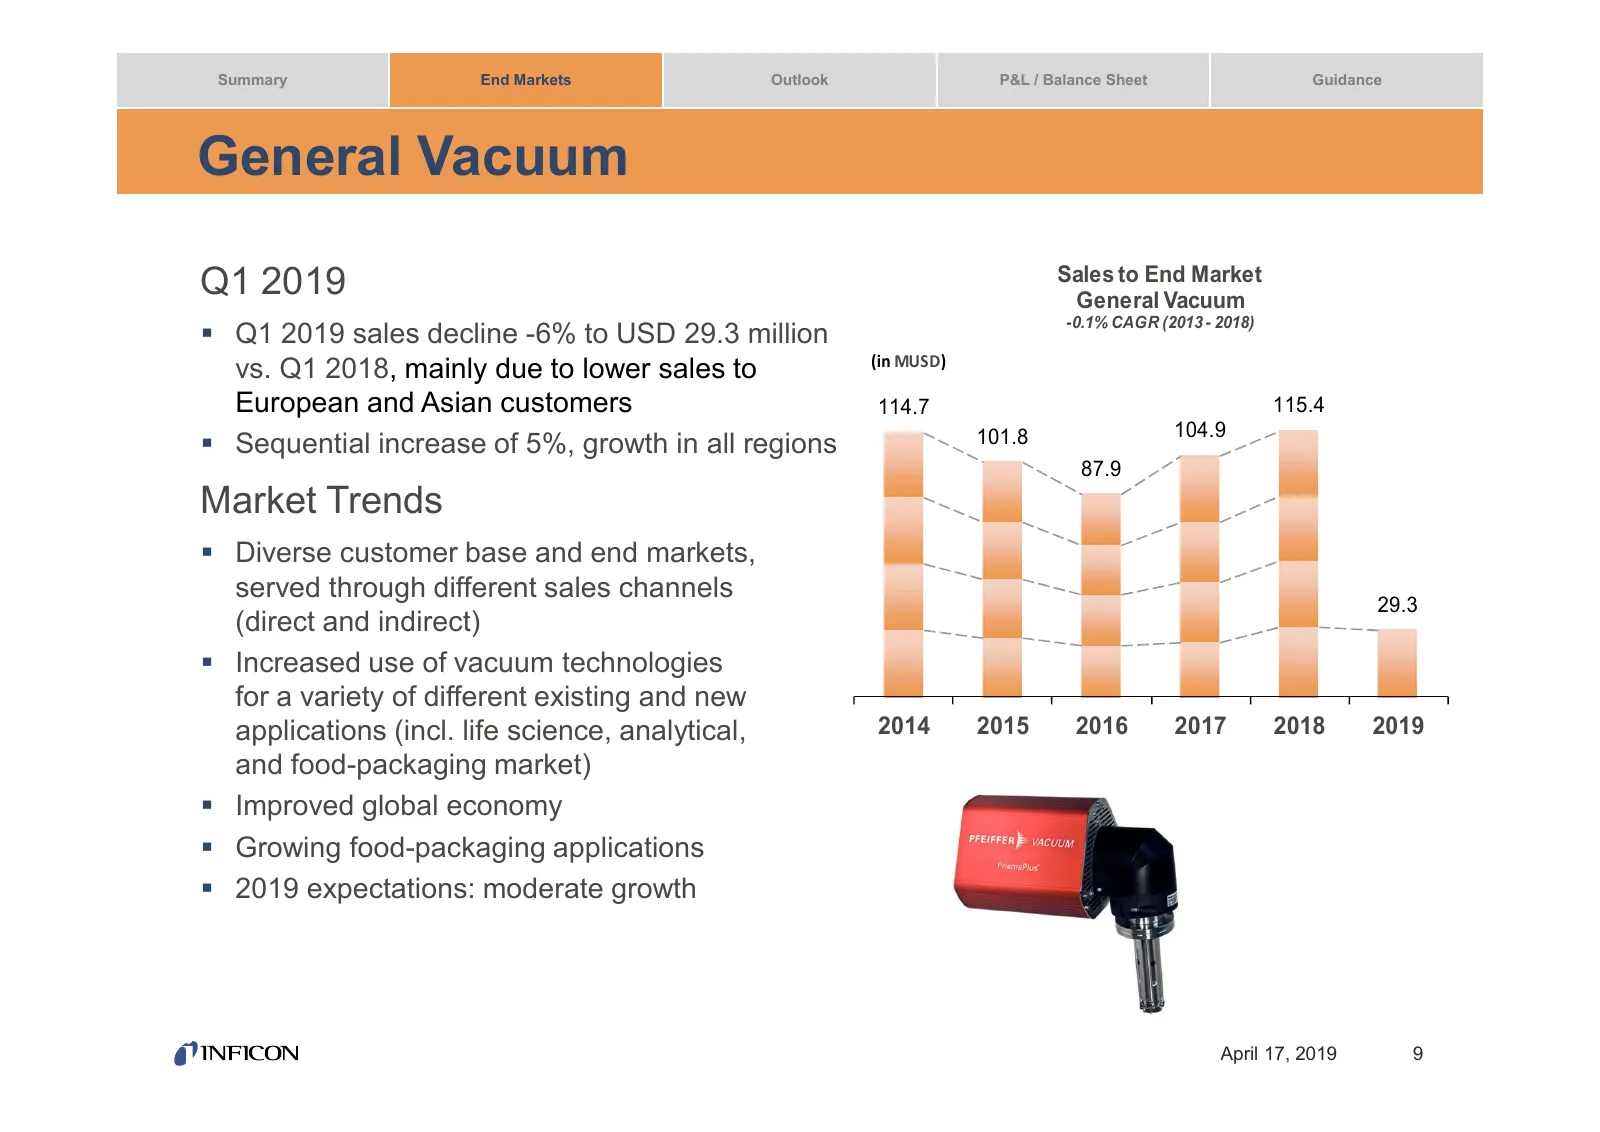
Slide 9: General Vacuum
Summary End Markets Outlook P&L / Balance Sheet Guidance General Vacuum Q1 2019 Sales to End Market General Vacuum -0.1% CAGR (2013 - 2018) Q1 2019 sales decline -6% to USD 29.3 million (in MUSD) vs. Q1 2018, mainly due to lower sales to European and Asian customers 114.7 115.4 101.8 104.9 Seque
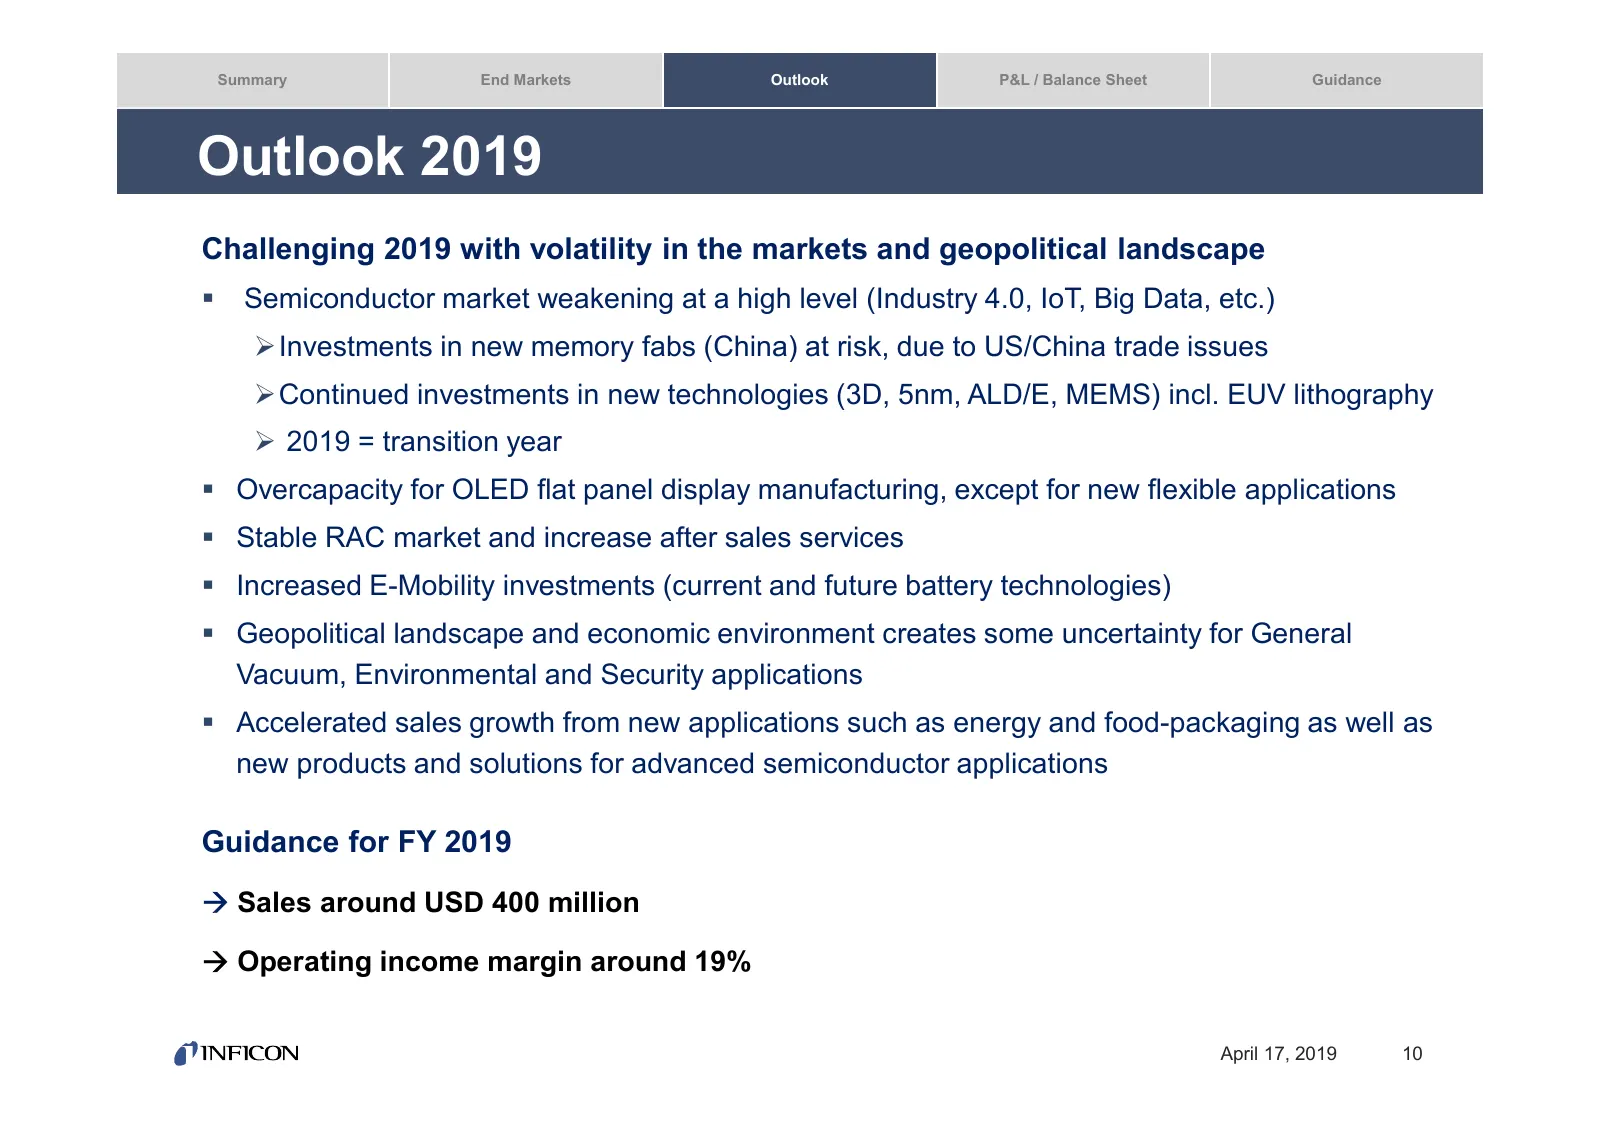
Slide 10: Outlook 2019
Summary End Markets Outlook P&L / Balance Sheet Guidance Outlook 2019 Challenging 2019 with volatility in the markets and geopolitical landscape Semiconductor market weakening at a high level (Industry 4.0, IoT, Big Data, etc.) Investments in new memory fabs (China) at risk, due to US/China trade
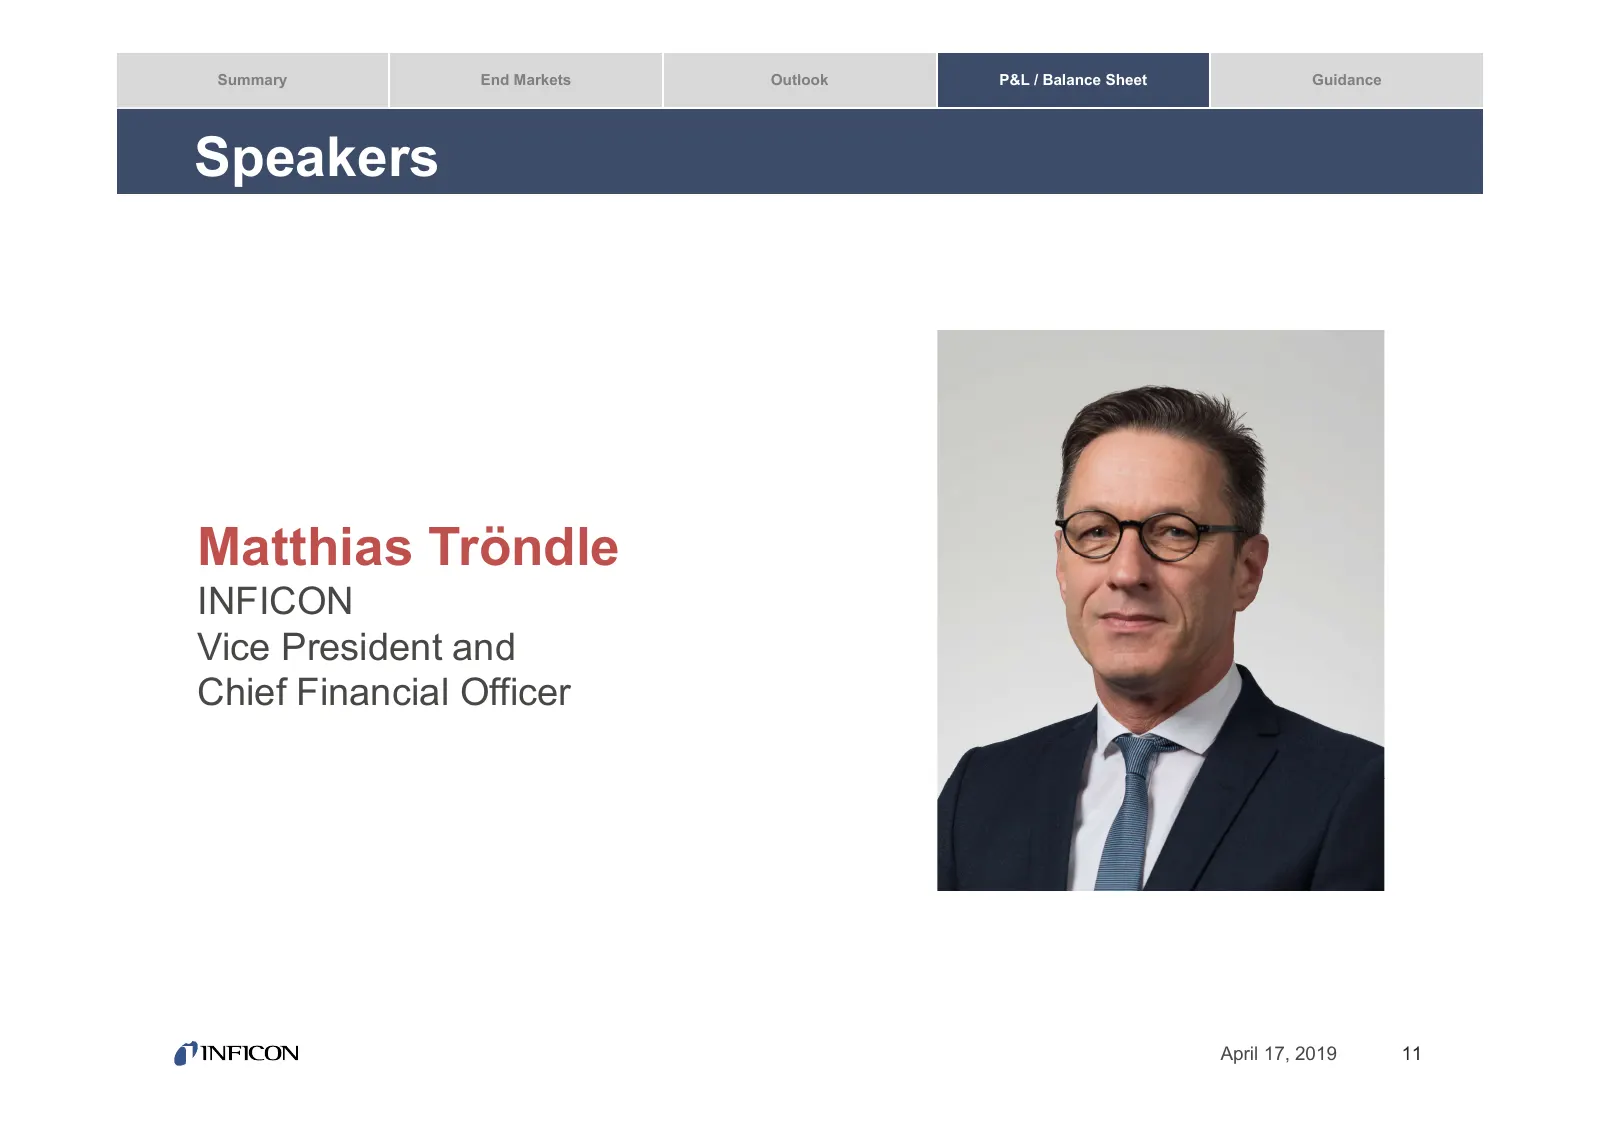
Slide 11: Speakers: Matthias Tröndle
Summary End Markets Outlook P&L / Balance Sheet Guidance Speakers Matthias Tröndle INFICON Vice President and Chief Financial Officer April 17, 2019 11
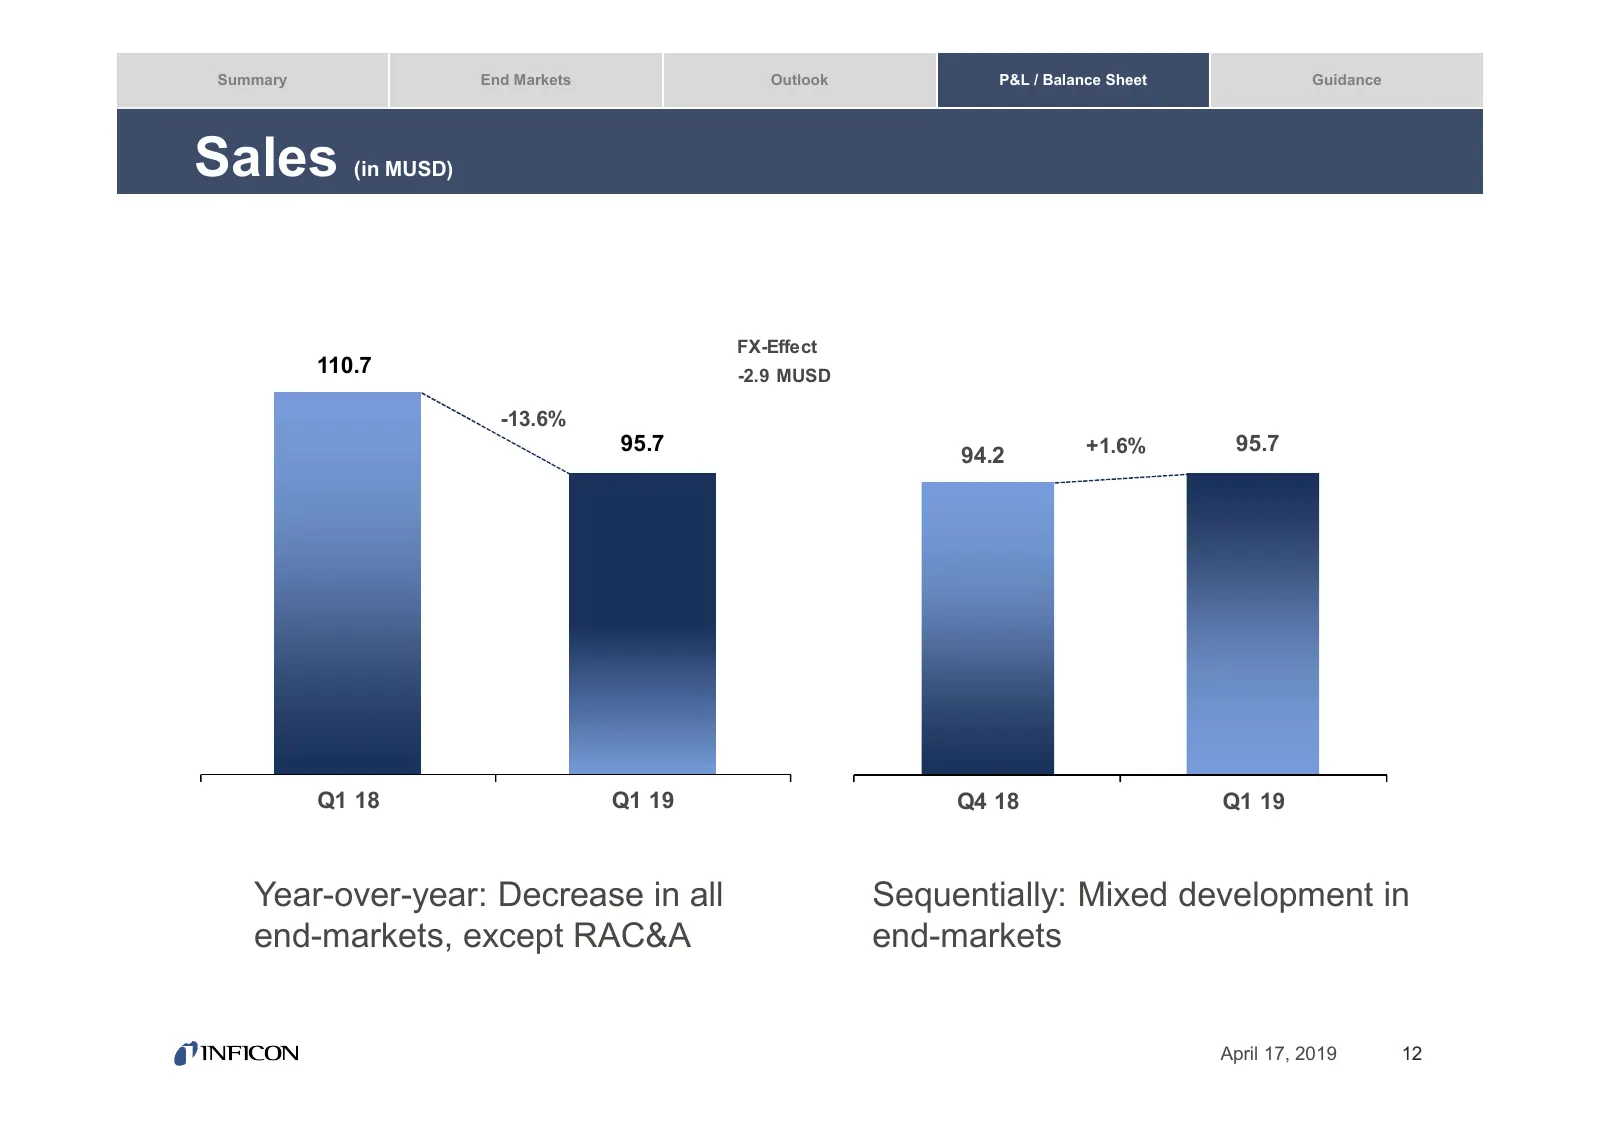
Slide 12: Sales
Summary End Markets Outlook P&L / Balance Sheet Guidance Sales (in MUSD) FX-Effect 110.7 -2.9 MUSD -13.6% 95.7 +1.6% 95.7 94.2 Q1 18 Q1 19 Q4 18 Q1 19 Year-over-year: Decrease in all Sequentially: Mixed development in end-markets, except RAC&A end-markets April 17, 2019 12
Slide 13: Geographic Sales Breakdown – Quarter
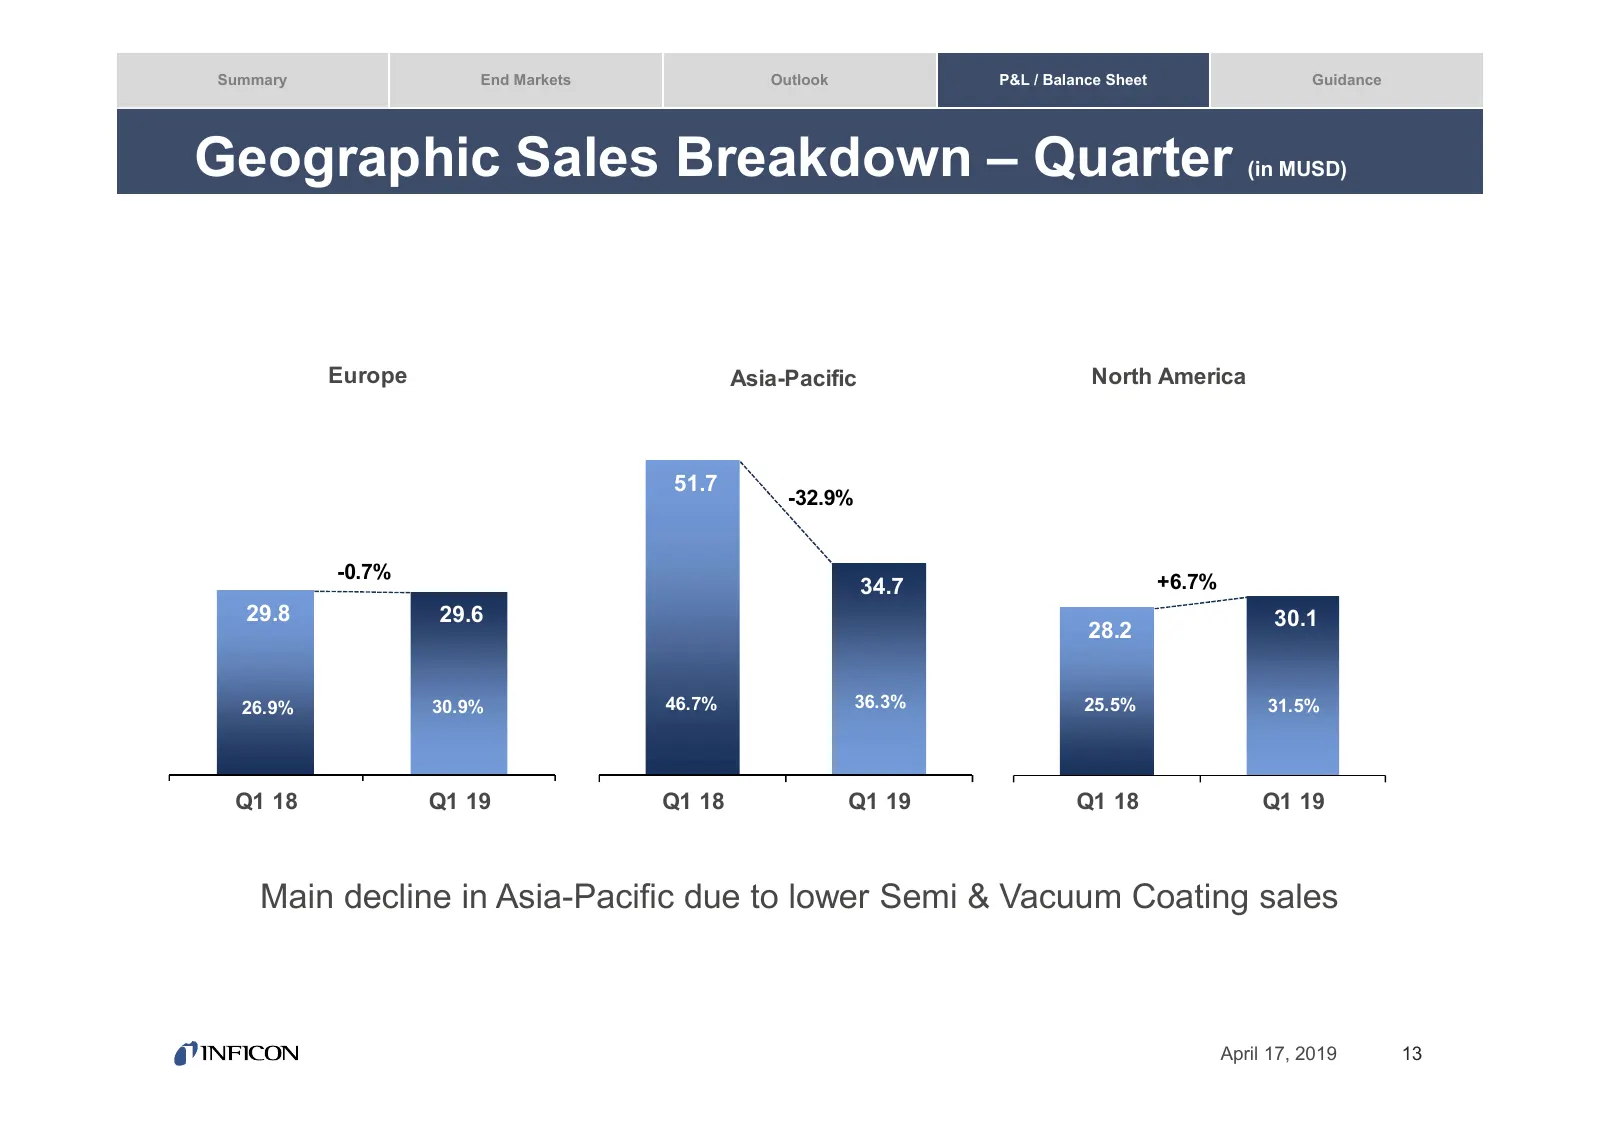
Summary End Markets Outlook P&L / Balance Sheet Guidance Geographic Sales Breakdown – Quarter (in MUSD) Europe Asia-Pacific North America 51.7 -32.9% -0.7% +6.7% 34.7 29.8 29.6 30.1 28.2 26.9% 30.9% 46.7% 36.3% 25.5% 31.5% Q1 18 Q1 19 Q1 18 Q1 19 Q1 18 Q1 19 Main decline in Asia-Pacific due to lower
Slide 14: Gross Profit, Costs, and Operating Income
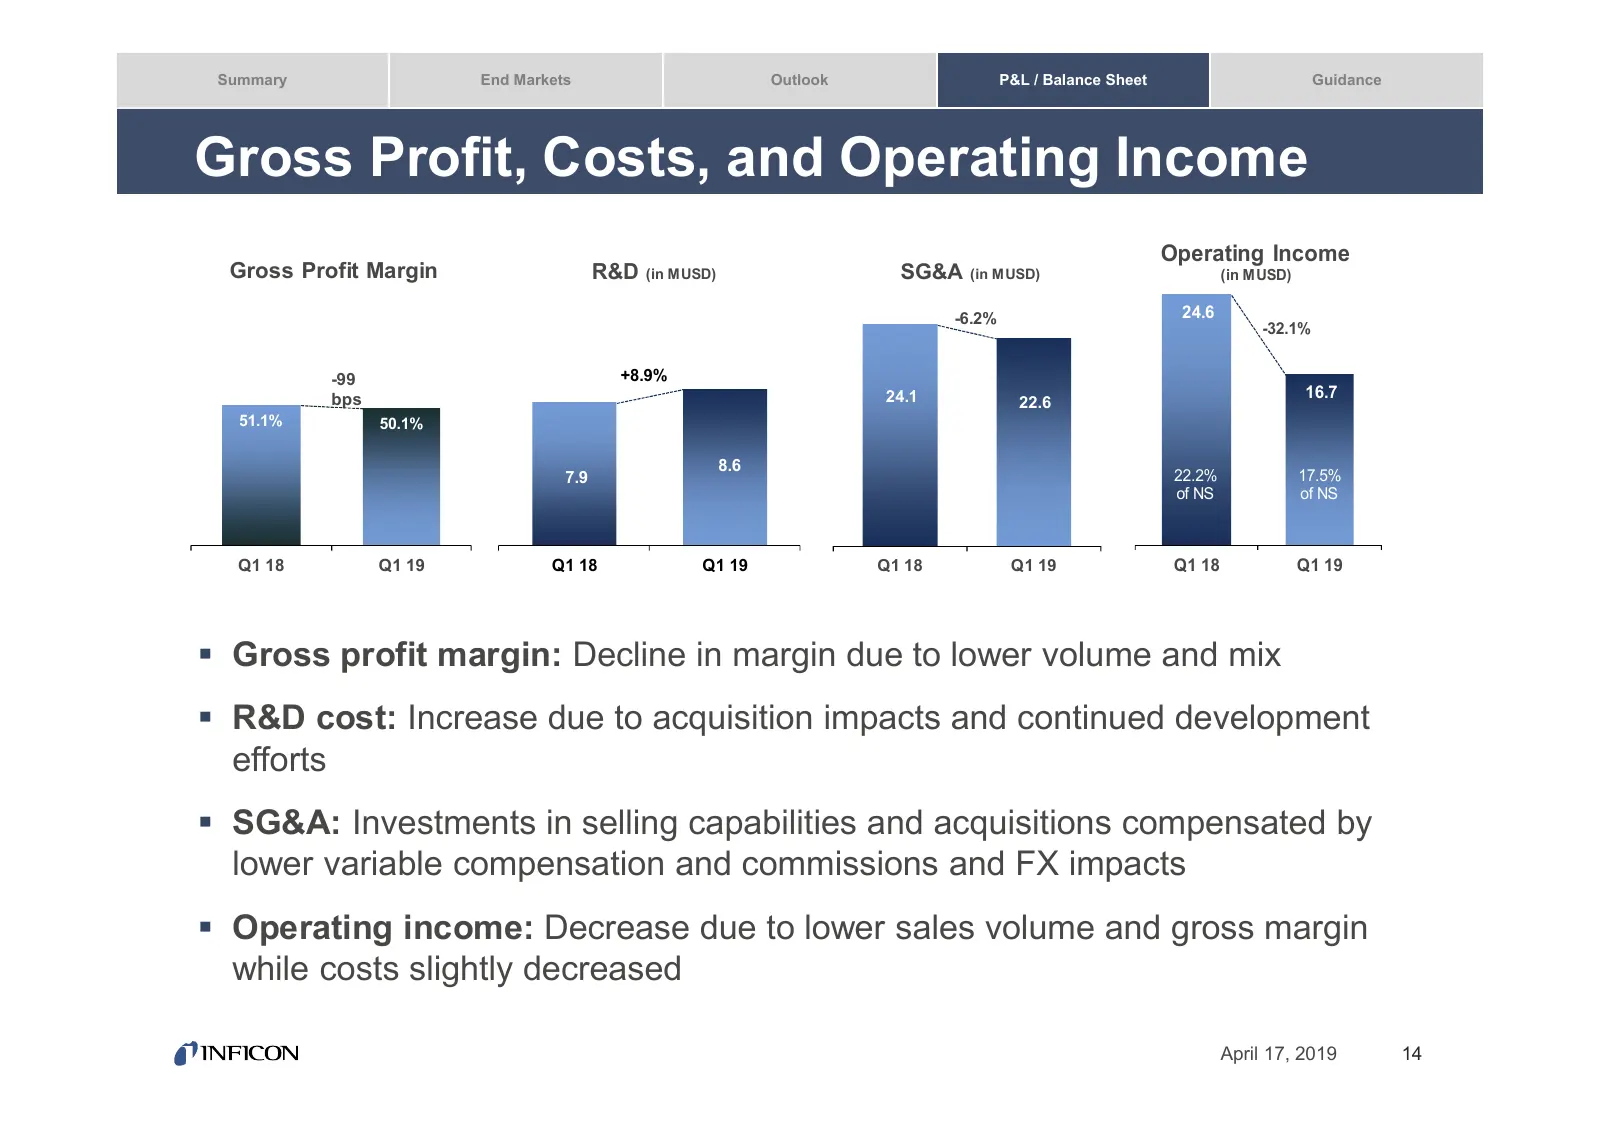
Summary End Markets Outlook P&L / Balance Sheet Guidance Gross Profit, Costs, and Operating Income Operating Income Gross Profit Margin R&D (in MUSD) SG&A (in MUSD) (in M USD) -6.2% 24.6 -32.1% -99 +8.9% bps 24.1 16.7 22.6 51.1% 50.1% 8.6 7.9 22.2% 17.5% of NS of NS Q1 18 Q1 19 Q1 18 Q1 19 Q1 18 Q1
Slide 15: Net Income and EPS Development
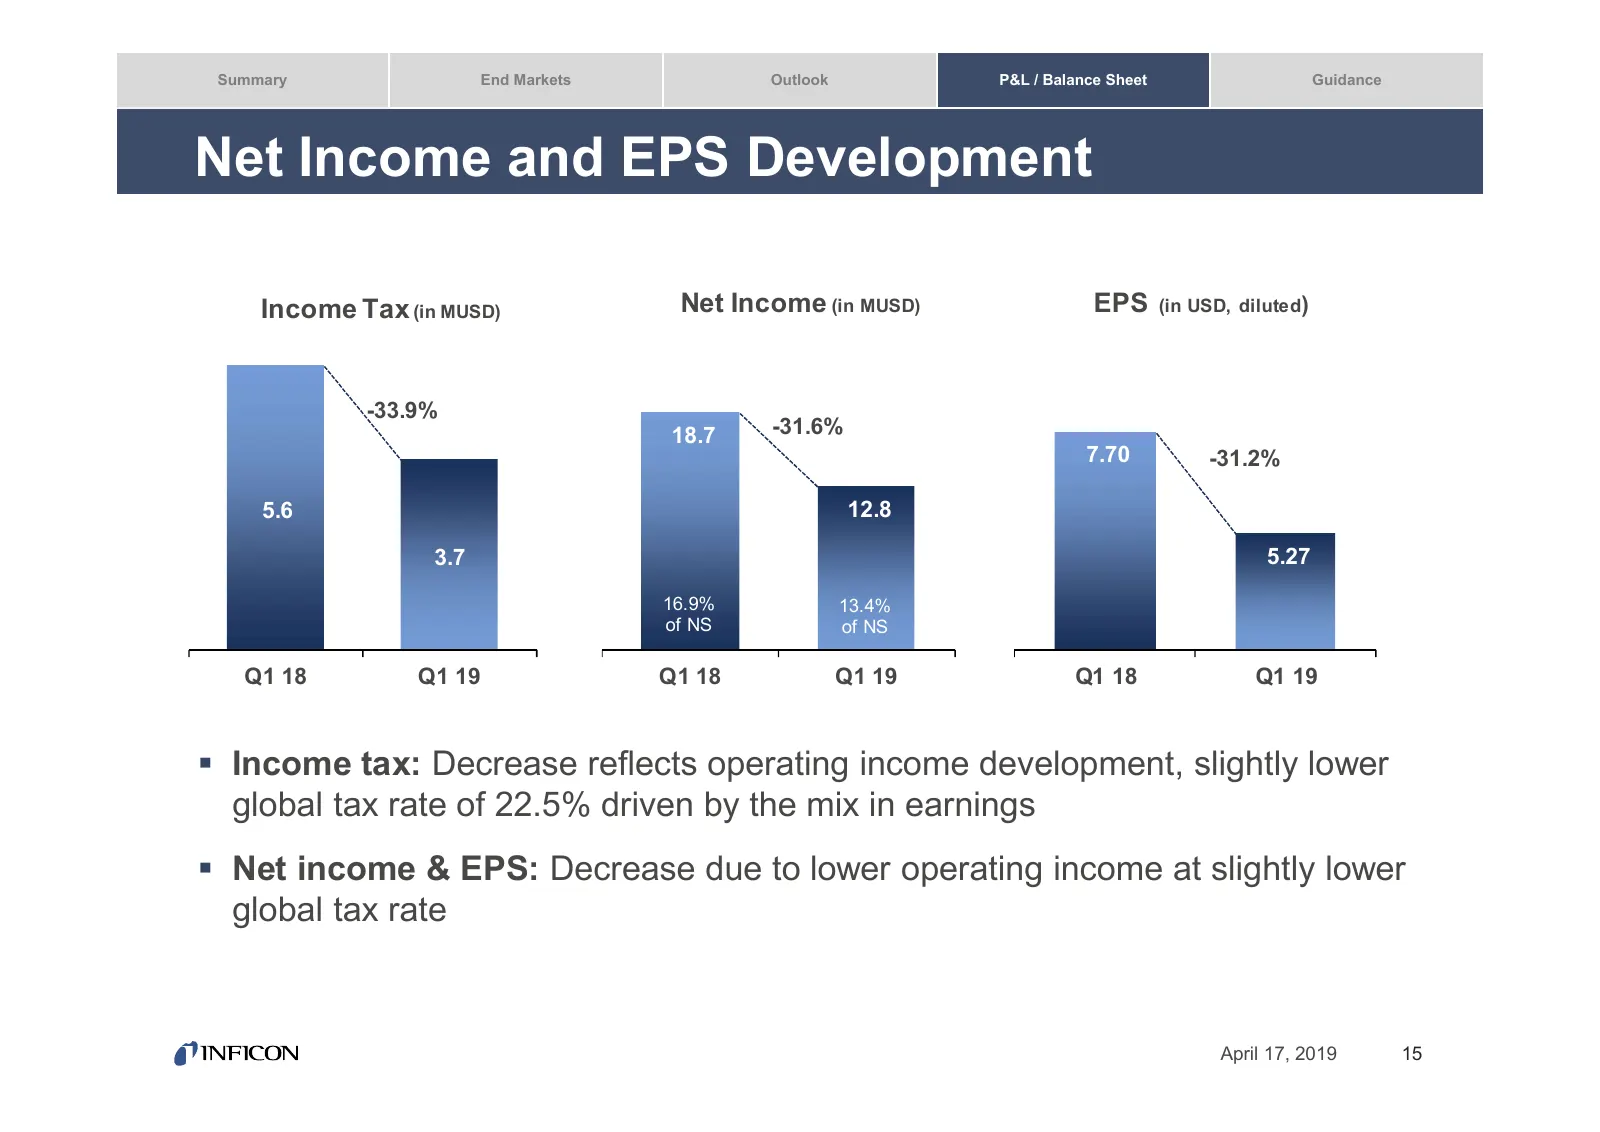
Summary End Markets Outlook P&L / Balance Sheet Guidance Net Income and EPS Development Income Tax (in MUSD) Net Income (in MUSD) EPS (in USD, diluted) -33.9% 18.7 -31.6% 7.70 -31.2% 5.6 12.8 3.7 5.27 16.9% 13.4% of NS of NS Q1 18 Q1 19 Q1 18 Q1 19 Q1 18 Q1 19 Income tax: Decrease reflects operati
Slide 16: Balance Sheet Highlights
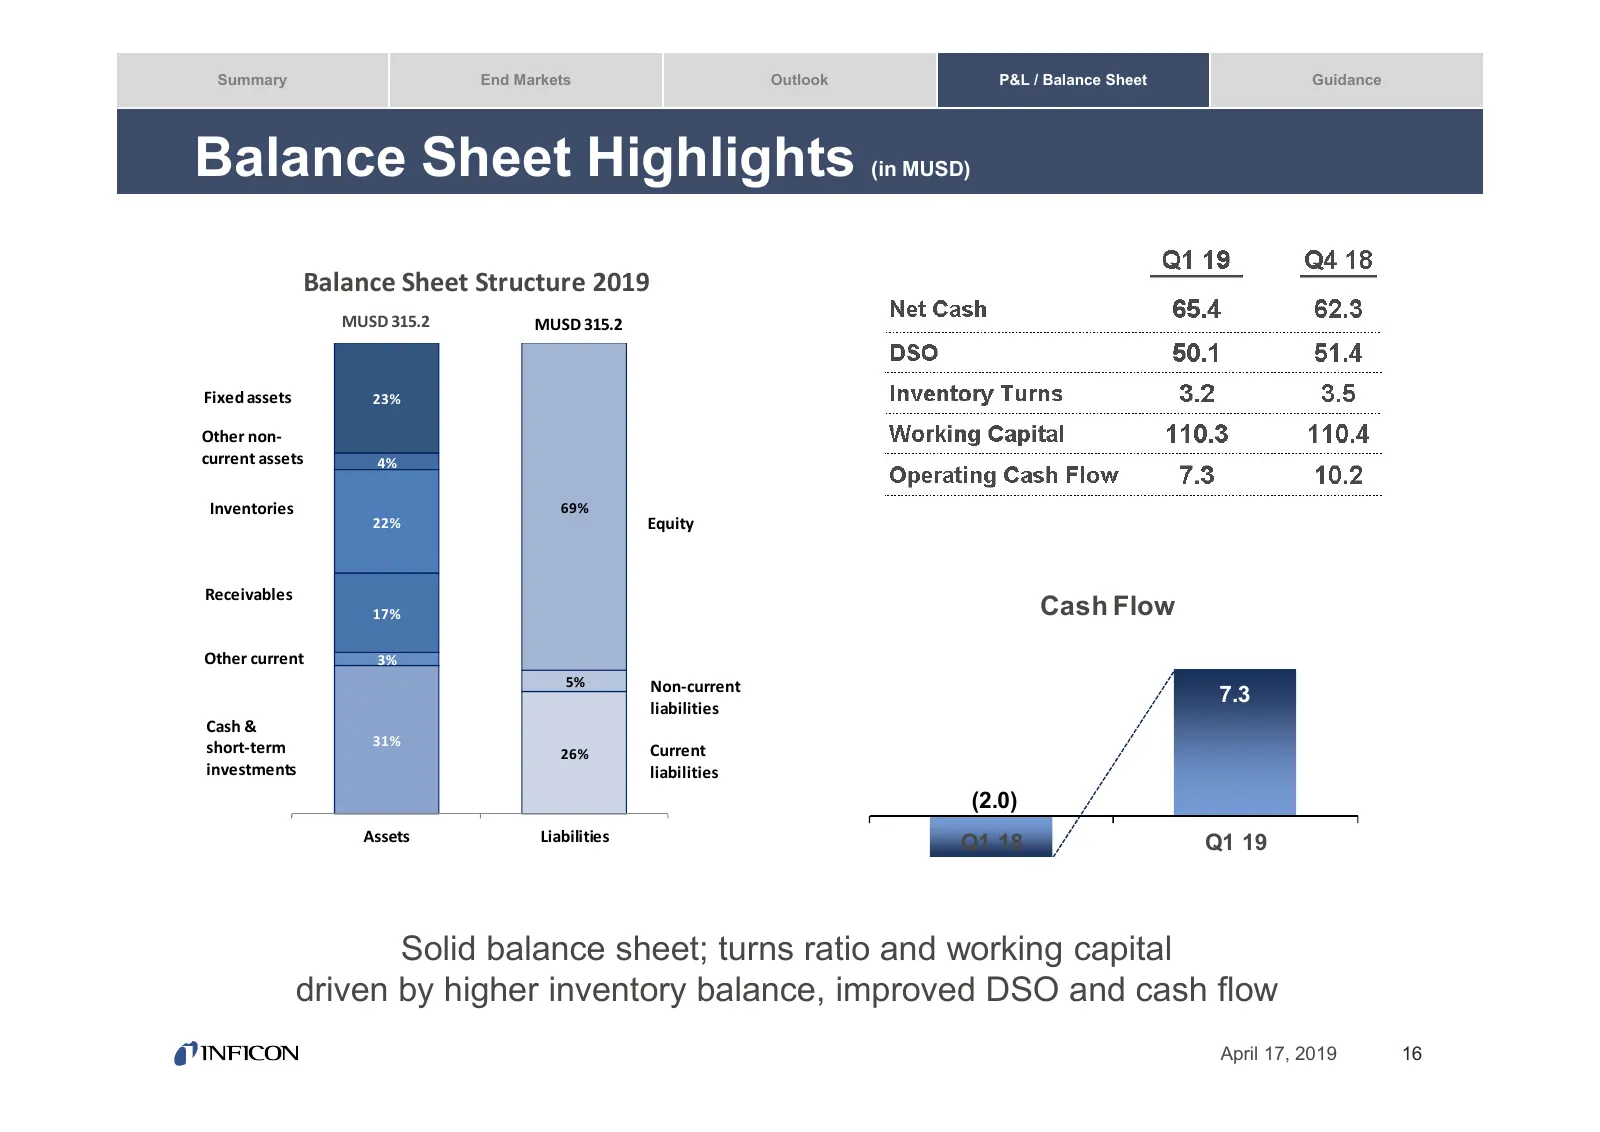
Summary End Markets Outlook P&L / Balance Sheet Guidance Balance Sheet Highlights (in MUSD) Balance Sheet Structure 2019 MUSD 315.2 MUSD 315.2 Fixed assets 23% Other non- current assets 4% Inventories 69% 22% Equity Receivables 17% Cash Flow Other current 3% 5% Non-current 7.3 liabilities Cash & 31%
Slide 17: Guidance FY 2019 and Corporate Communication Calendar
Summary End Markets Outlook P&L / Balance Sheet Guidance GUIDANCE FY 2019 AND CORPORATE COMMUNICATION CALENDAR April 17, 2019 17
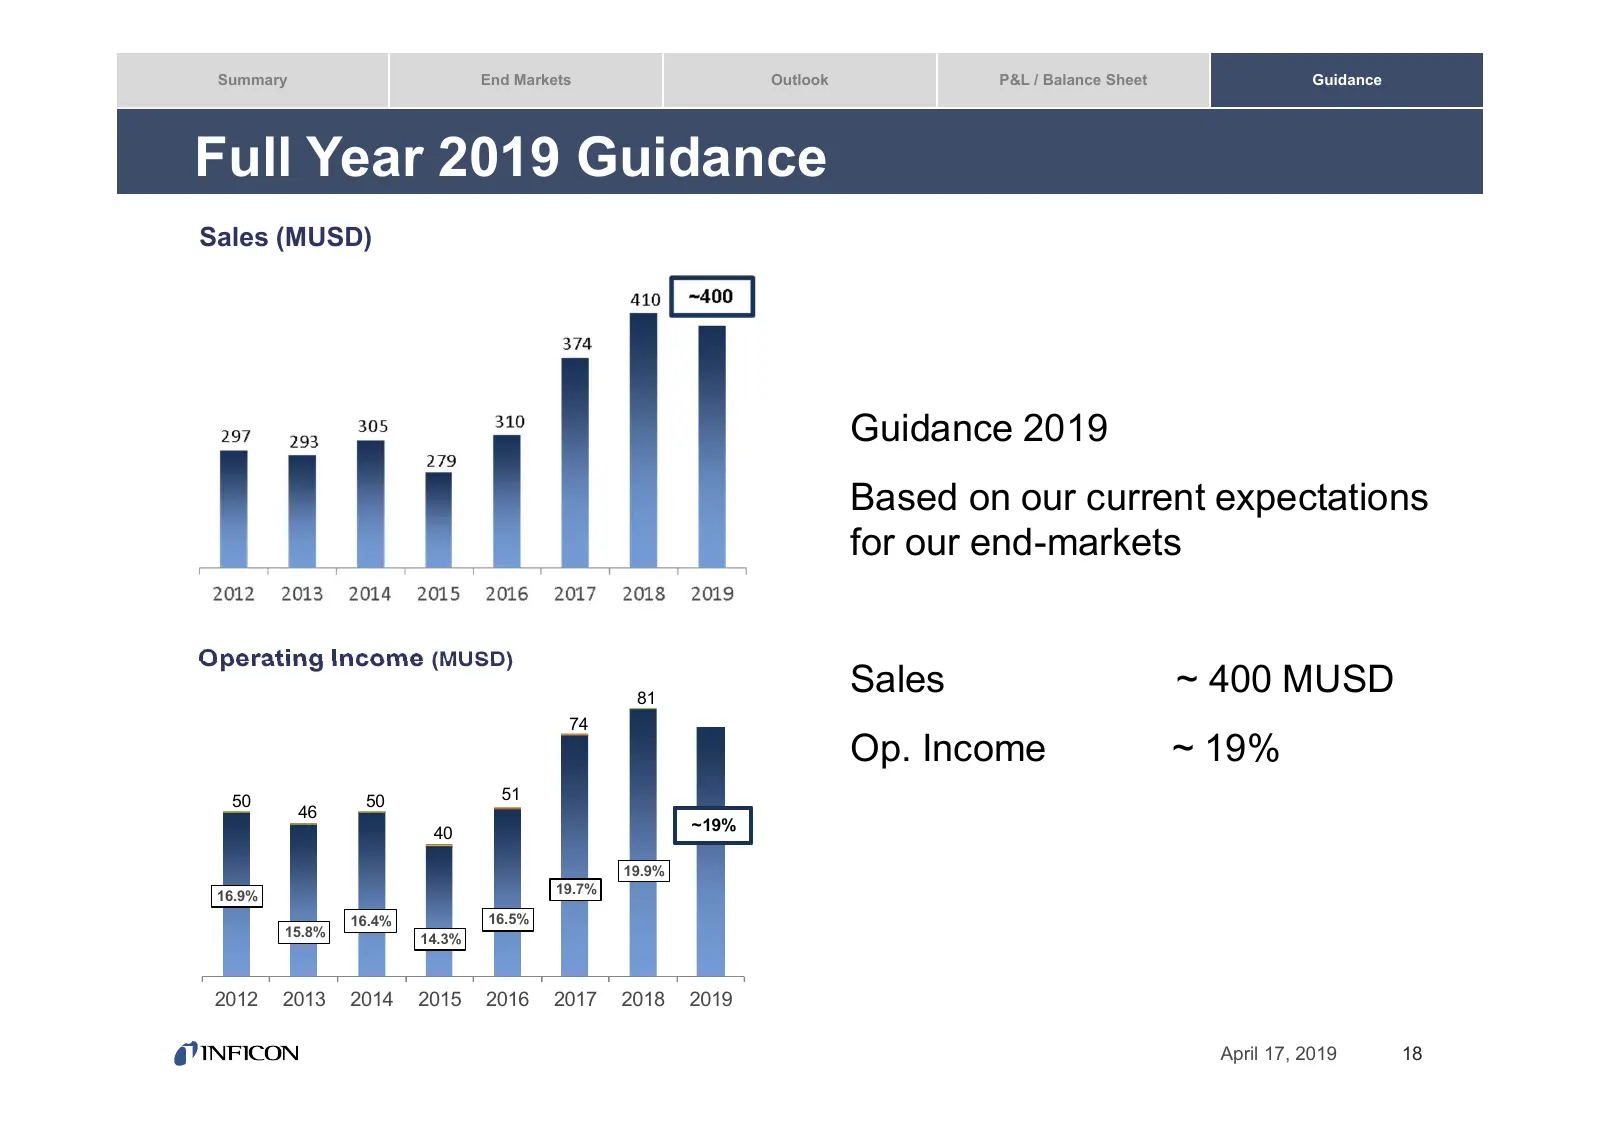
Slide 18: Full Year 2019 Guidance
Summary End Markets Outlook P&L / Balance Sheet Guidance Full Year 2019 Guidance Sales (MUSD) Guidance 2019 Based on our current expectations for our end-markets Operating Income (MUSD) 81 Sales ~ 400 MUSD 74 Op. Income ~ 19% 50 50 51 46 40 ~19% 19.9% 16.9% 19.7% 16.4% 16.5% 15.8% 14.3% 2012 2013 20
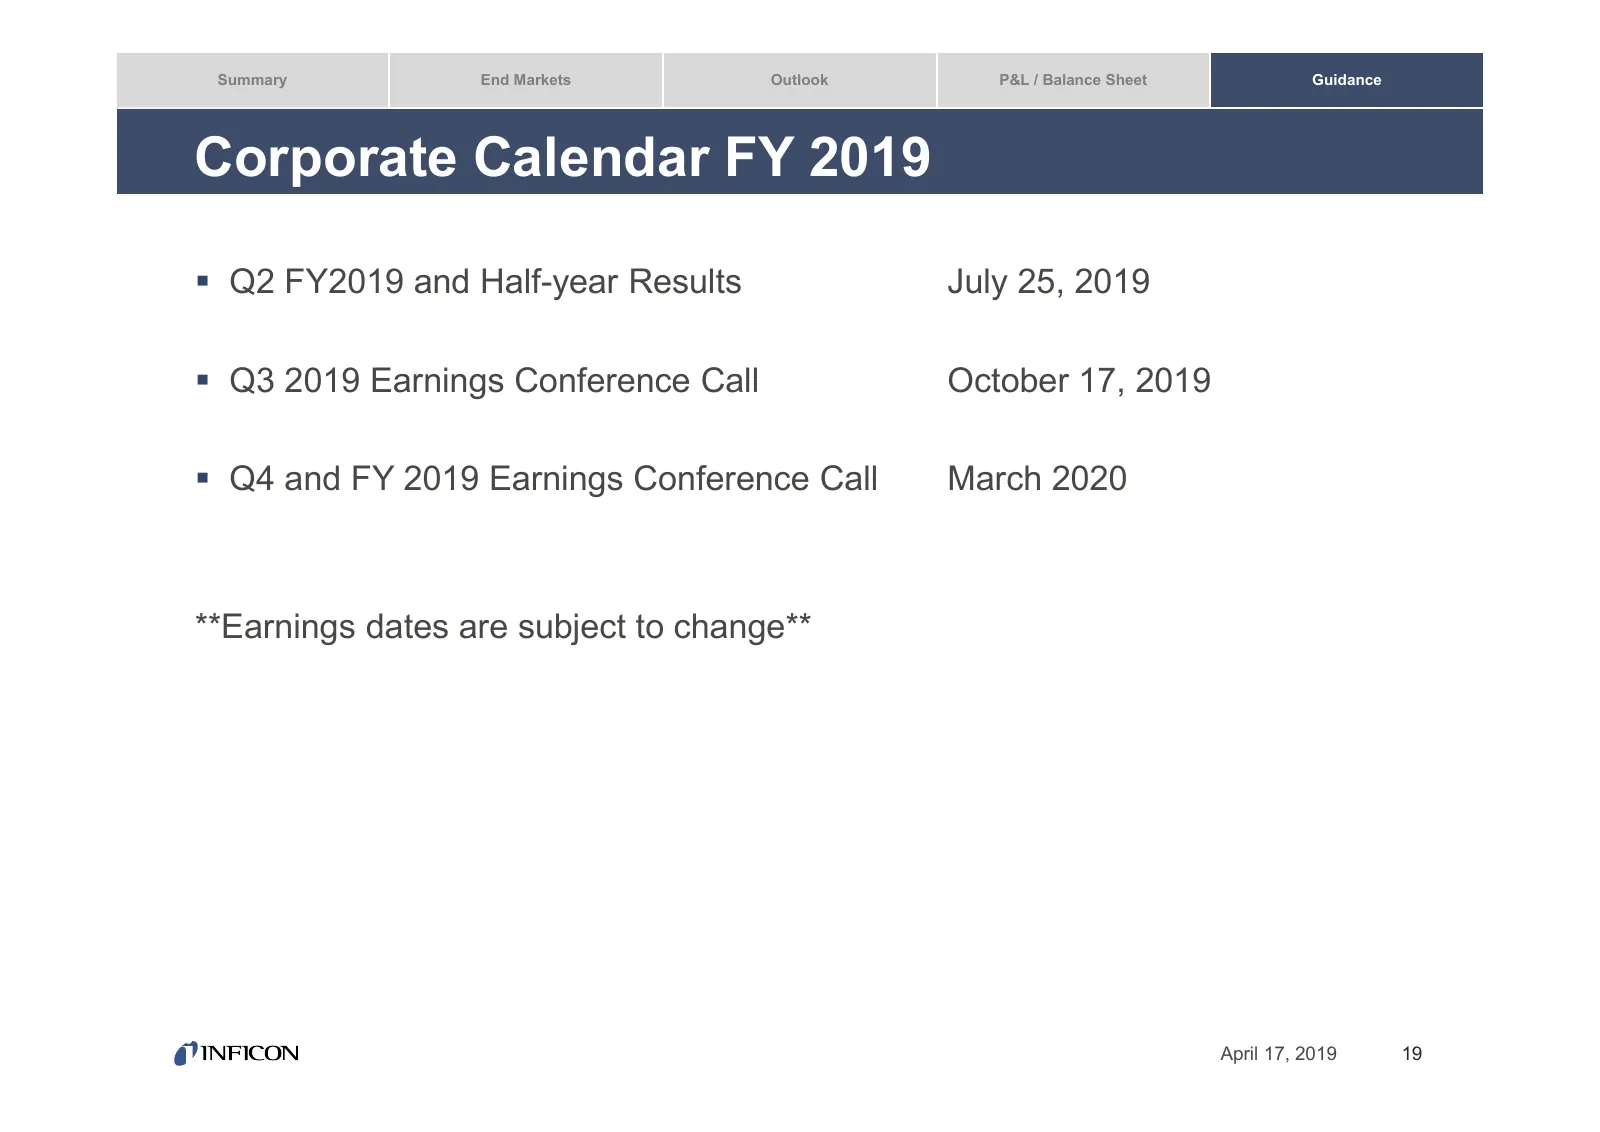
Slide 19: Corporate Calendar FY 2019
Summary End Markets Outlook P&L / Balance Sheet Guidance Corporate Calendar FY 2019 Q2 FY2019 and Half-year Results July 25, 2019 Q3 2019 Earnings Conference Call October 17, 2019 Q4 and FY 2019 Earnings Conference Call March 2020 **Earnings dates are subject to change** April 17, 2019 19
Slide 20: Thank You! Q&A
THANK YOU! Q&A
Source: Internet Archive copy of ir.inficon.com
More decks from INFICON Holding AG
 Q3 2026 Earnings Presentation18 slides · Oct 27, 2026
 Q2 2026 Earnings Presentation20 slides · Jul 30, 2026
 Q1 2026 Earnings Presentation20 slides · Apr 24, 2026
 Q4 2025 Earnings Presentation32 slides · Mar 24, 2026
 Q1 2025 Earnings Presentation20 slides · Apr 24, 2025
 Technical Presentation (September 2024)44 slides · September 2024