Ascom Holding AG · SIX:ASCN
Ascom — H1 2016 Earnings Presentation
33 slides from Ascom's earnings presentation, Aug 17, 2016

Slide 1: Welcome to Ascom's 2016 Half-Year Media Conference
WELCOME TO ASCOM’S 2016 HALF-YEAR MEDIA CONFERENCE
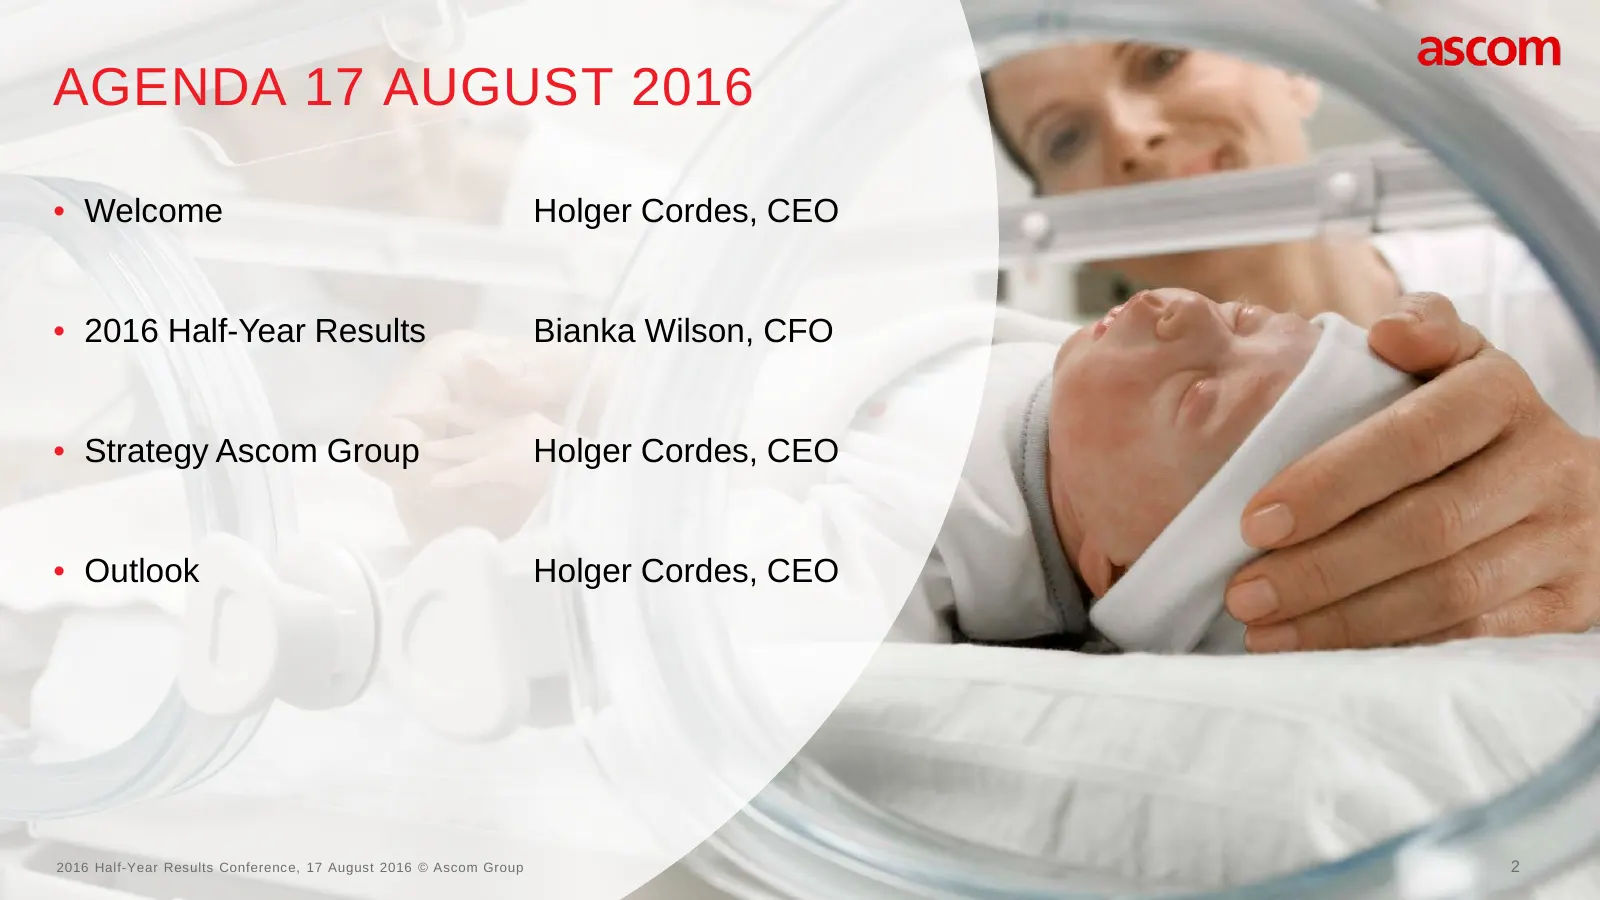
Slide 2: Agenda 17 August 2016
AGENDA 17 AUGUST 2016 • Welcome Holger Cordes, CEO • 2016 Half-Year Results Bianka Wilson, CFO • Strategy Ascom Group Holger Cordes, CEO • Outlook Holger Cordes, CEO 2016 Half-Year Results Conference, 17 August 2016 © Ascom Group 2

Slide 3: Financial Results Half-Year 2016
Financial Results Half-Year 2016 Bianka Wilson, CFO
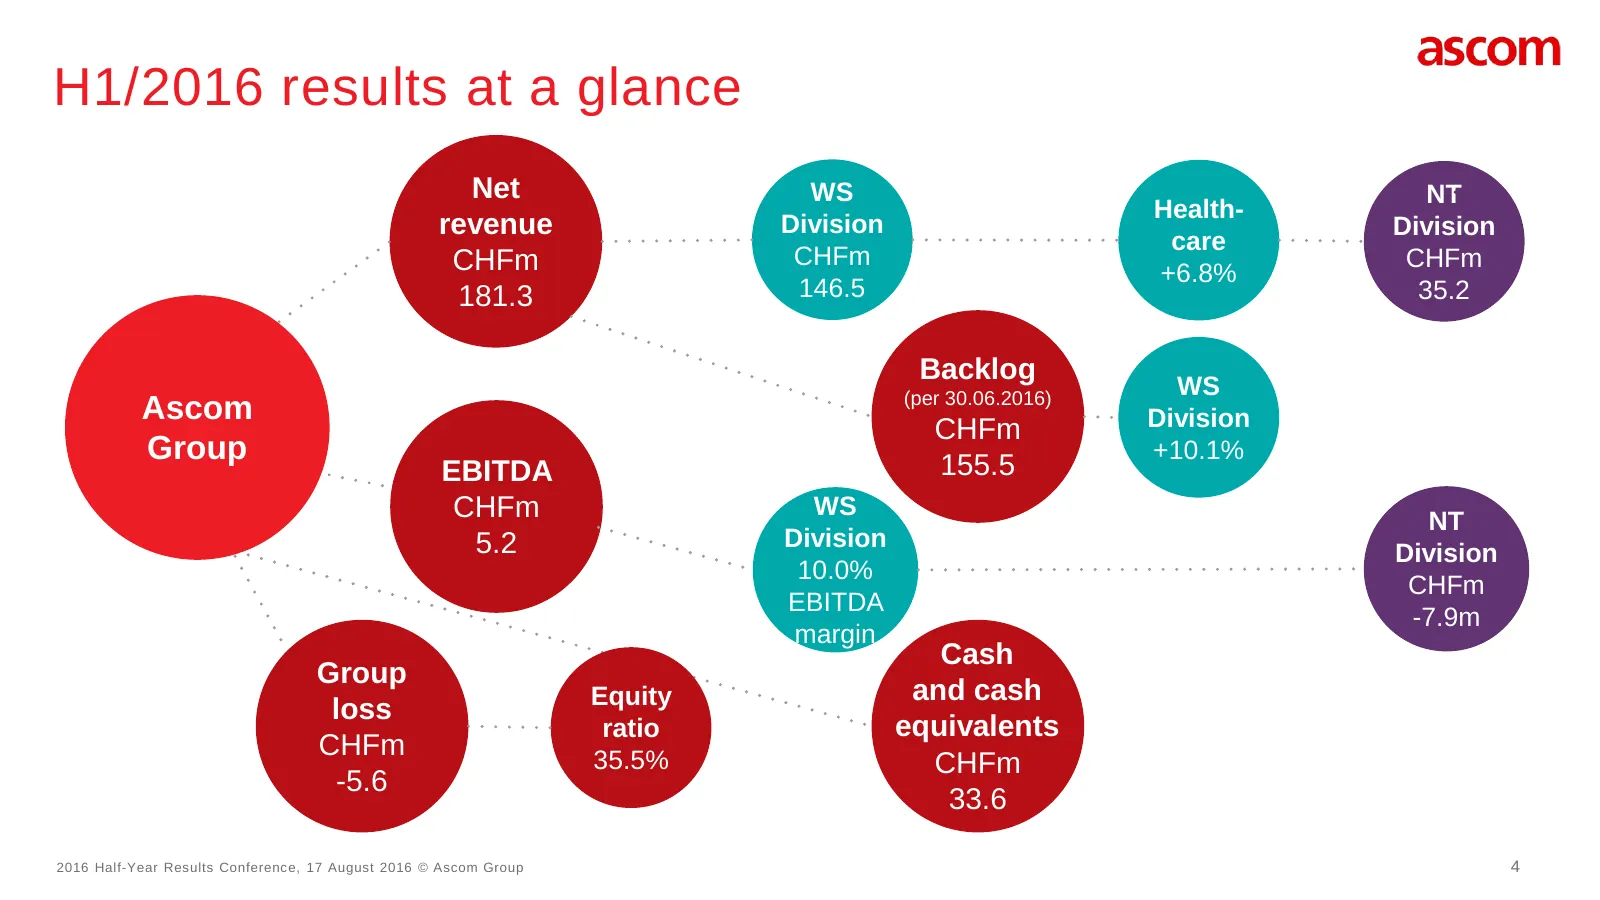
Slide 4: H1/2016 results at a glance
H1/2016 results at a glance Net WS NT Health- revenue Division Division care CHFm CHFm CHFm +6.8% 181.3 146.5 35.2 Backlog (per 30.06.2016) WS Ascom Division CHFm Group 155.5 +10.1% EBITDA CHFm WS NT 5.2 Division Division 10.0% CHFm EBITDA -7.9m margin Cash Group Equity and cash loss ratio equivalen
Slide 5: H1/2016 review
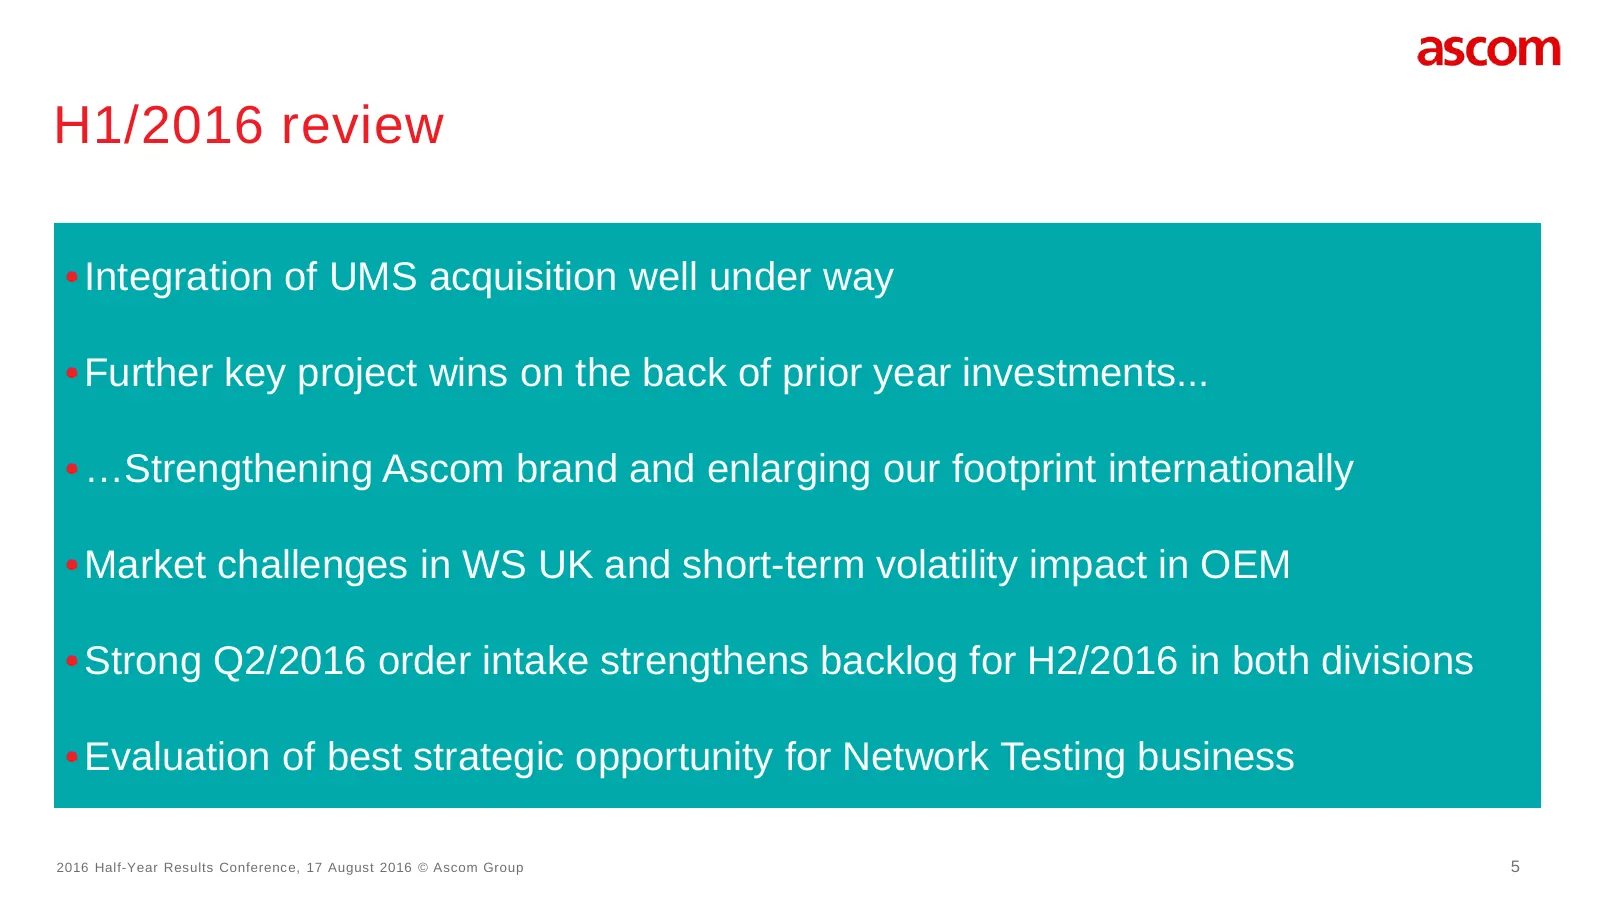
H1/2016 review • Integration of UMS acquisition well under way • Further key project wins on the back of prior year investments... • …Strengthening Ascom brand and enlarging our footprint internationally • Market challenges in WS UK and short-term volatility impact in OEM • Strong Q2/2016 order inta
Slide 6: Key project wins
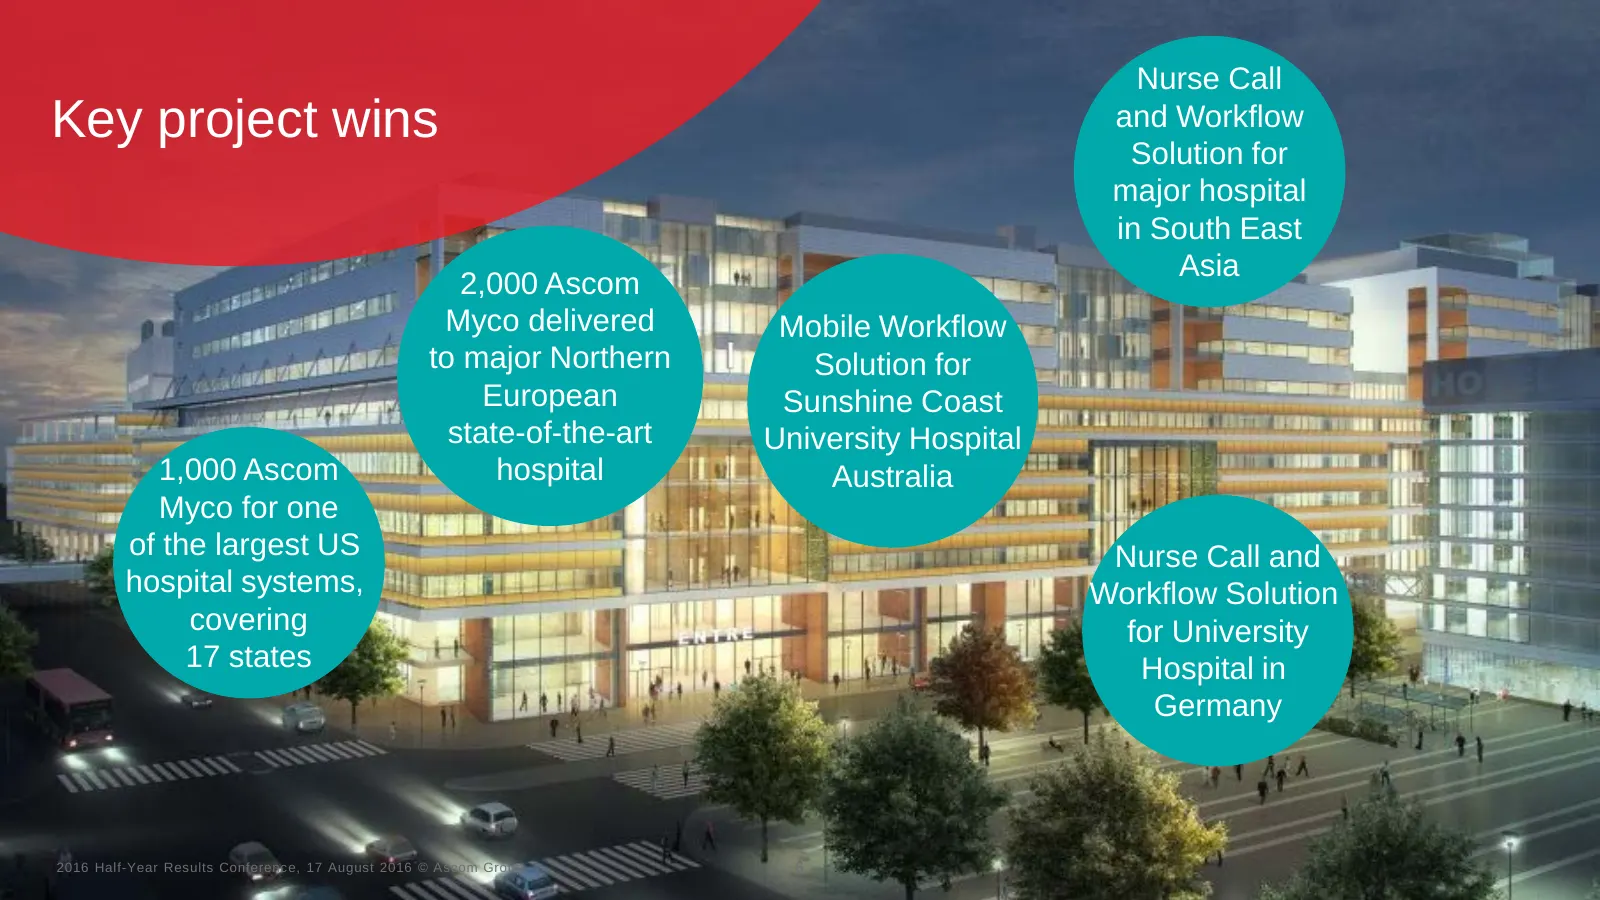
Nurse Call Key project wins and Workflow Solution for major hospital in South East Asia 2,000 Ascom Myco delivered Mobile Workflow to major Northern Solution for European Sunshine Coast state-of-the-art University Hospital 1,000 Ascom hospital Australia Myco for one of the largest US Nurse Call and
Slide 7: Top line analysis
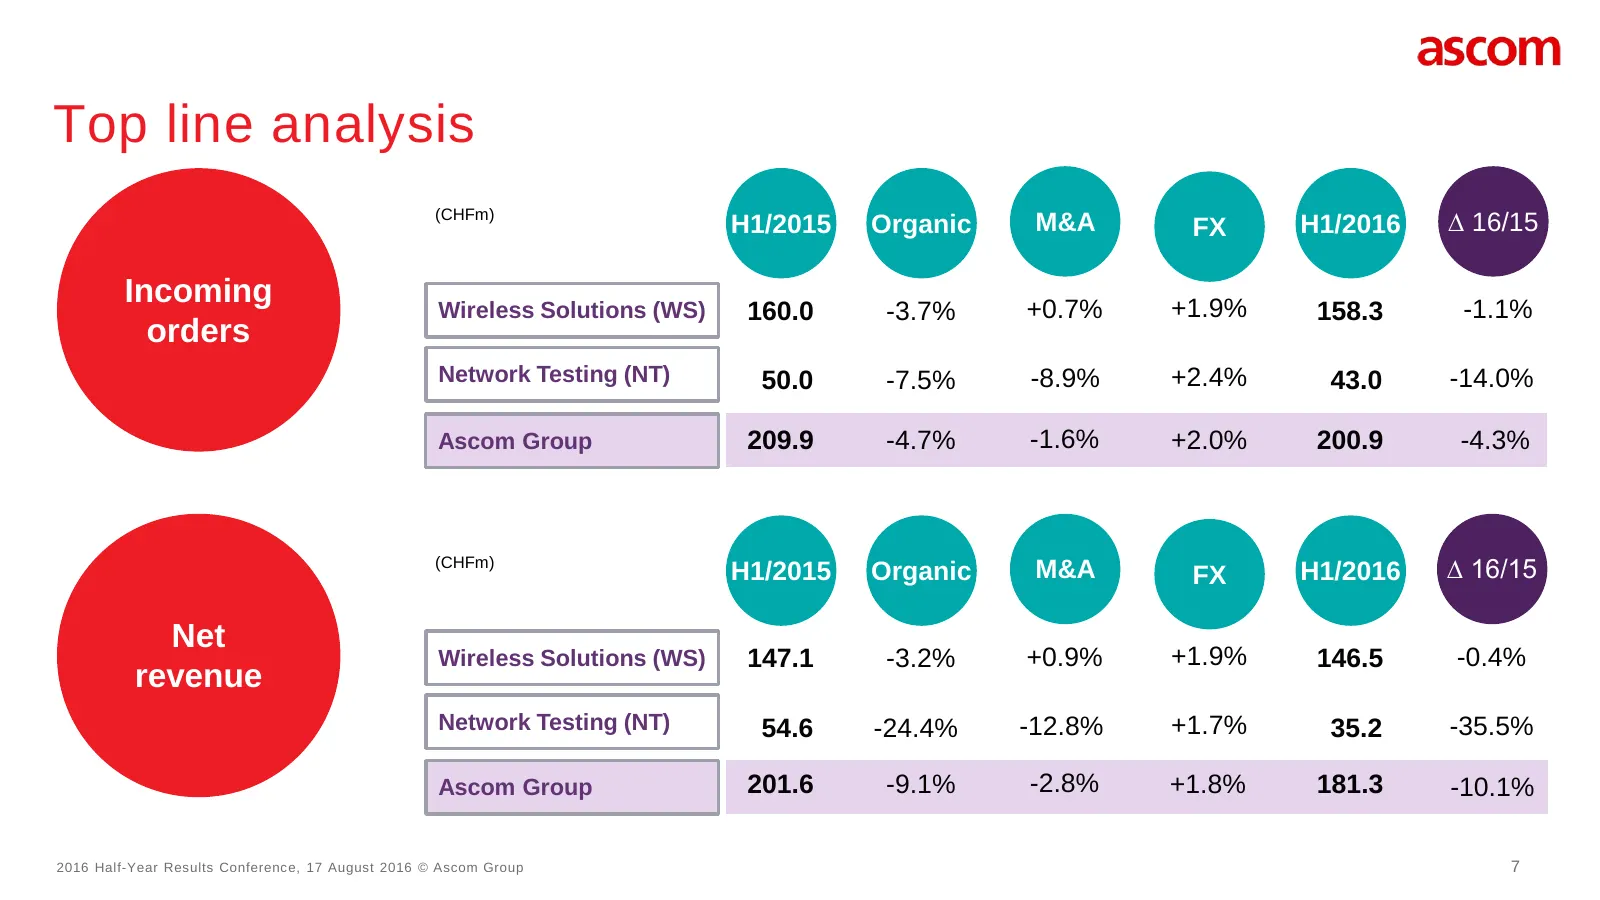
Top line analysis (CHFm) H1/2015 Organic M&A FX H1/2016 ∆ 16/15 Incoming +0.7% +1.9% -1.1% Wireless Solutions (WS) 160.0 -3.7% 158.3 orders Network Testing (NT) 50.0 -7.5% -8.9% +2.4% 43.0 -14.0% Ascom Group 209.9 -4.7% -1.6% +2.0% 200.9 -4.3% (CHFm) H1/2015 Organic M&A FX H1/2016 ∆ 16/15 Net Wirele
Slide 8: WS – Net revenue development
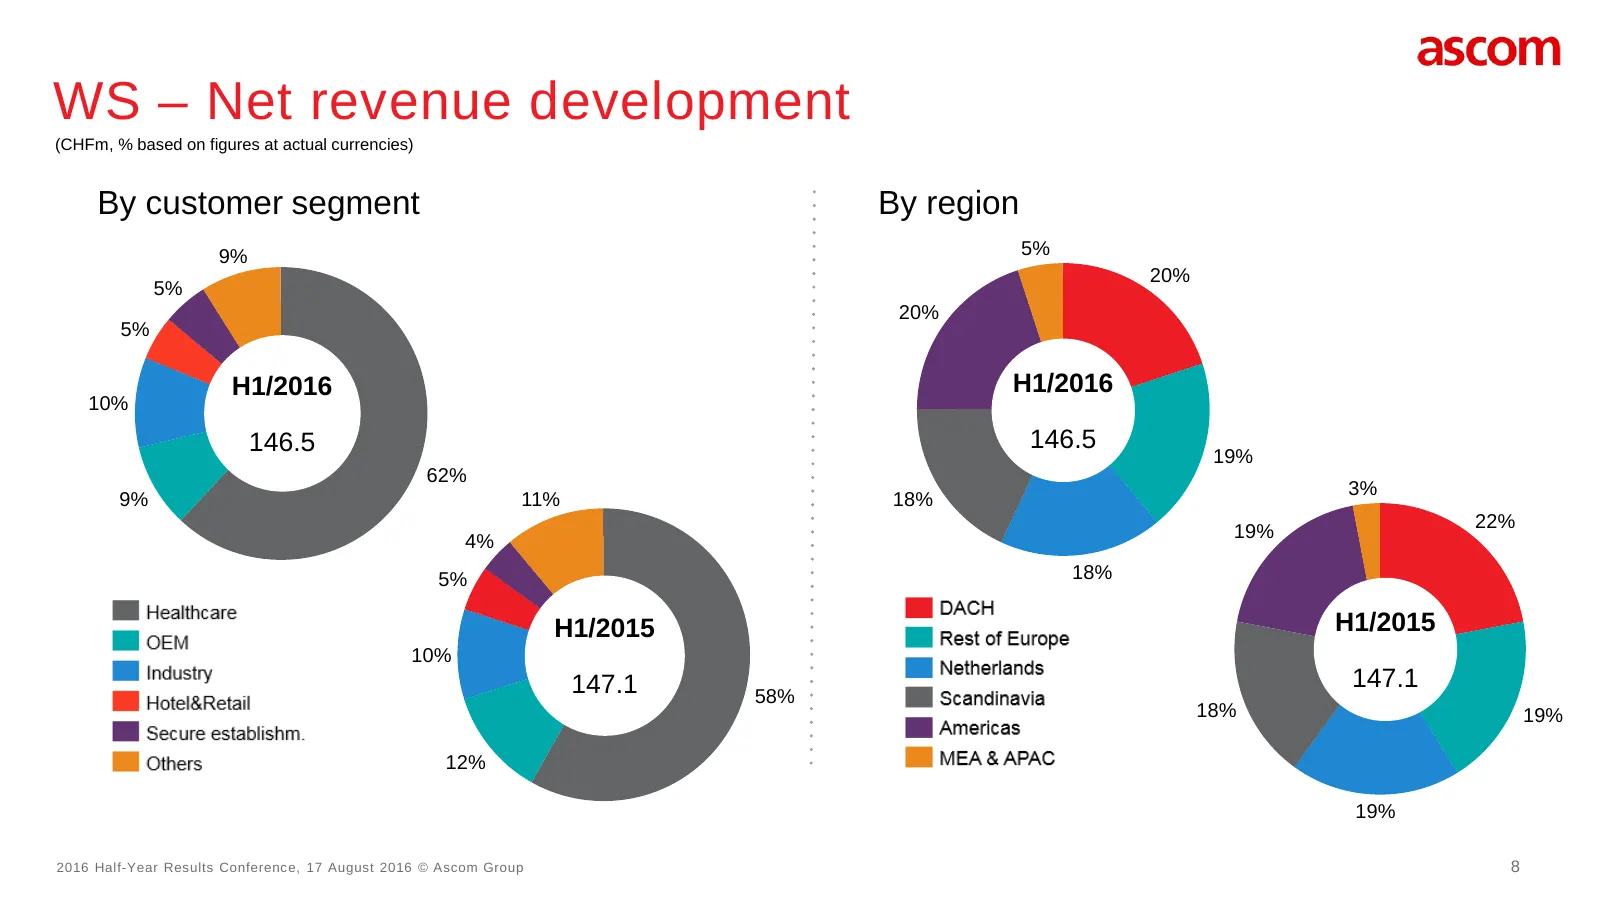
WS – Net revenue development (CHFm, % based on figures at actual currencies) By customer segment By region 9% 5% 20% 5% 20% 5% H1/2016 H1/2016 10% 146.5 146.5 19% 62% 3% 9% 11% 18% 22% 4% 19% 5% 18% H1/2015 H1/2015 10% 147.1 147.1 58% 18% 19% 12% 19% 2016 Half-Year Results Conference, 17 August 2016
Slide 9: H1/2016 financial performance drivers
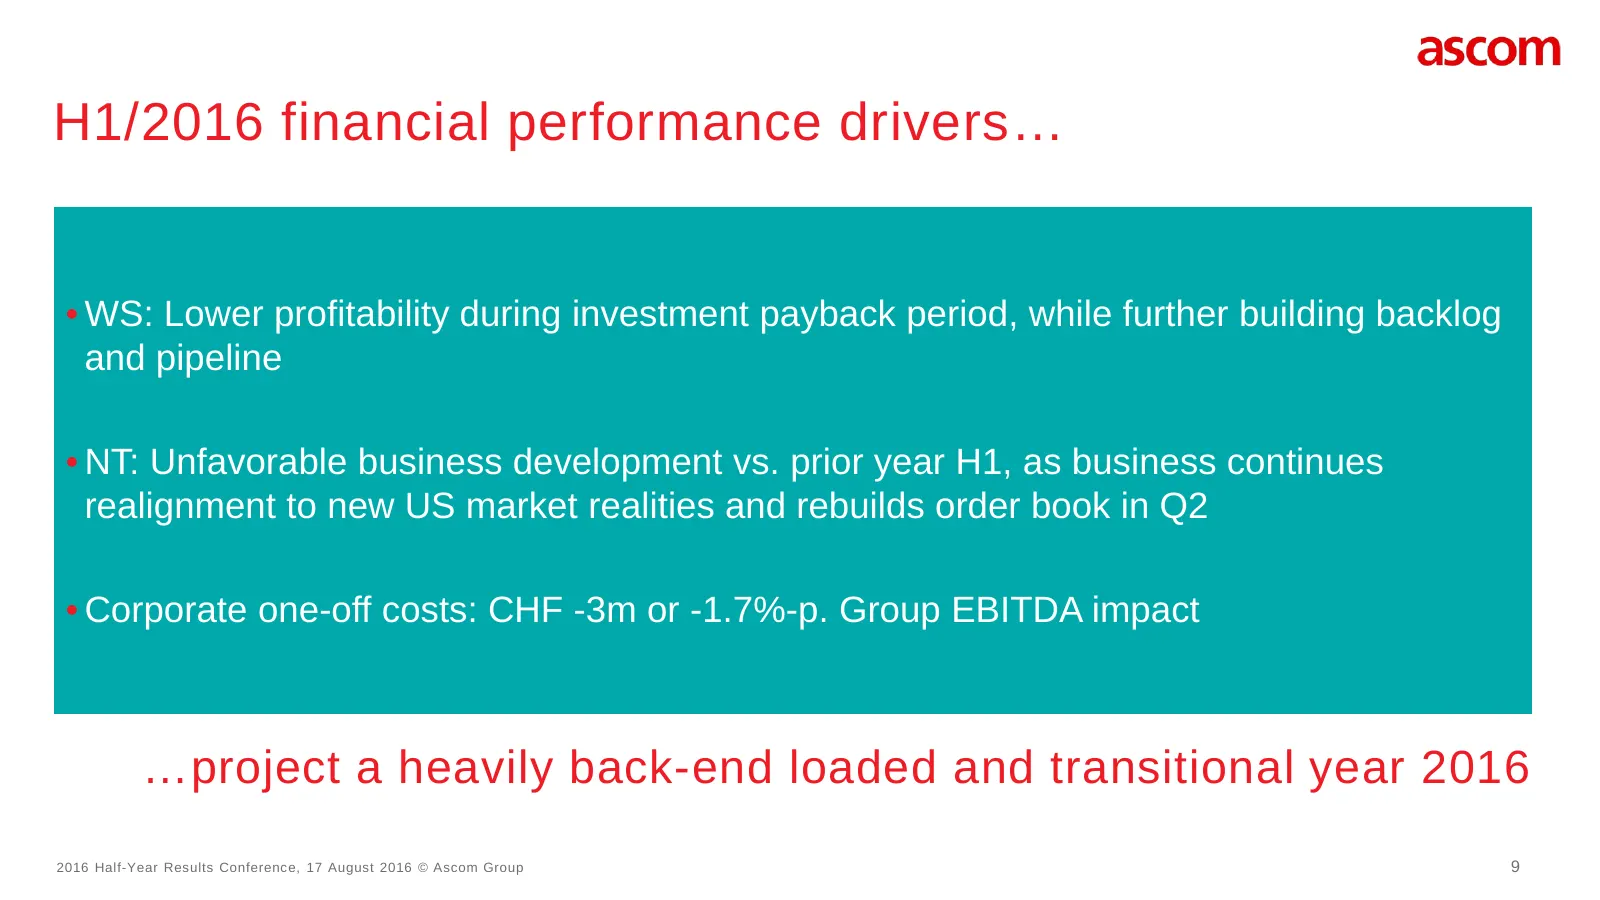
H1/2016 financial performance drivers… • WS: Lower profitability during investment payback period, while further building backlog and pipeline • NT: Unfavorable business development vs. prior year H1, as business continues realignment to new US market realities and rebuilds order book in Q2 • Corpor
Slide 10: WS – EBITDA bridge
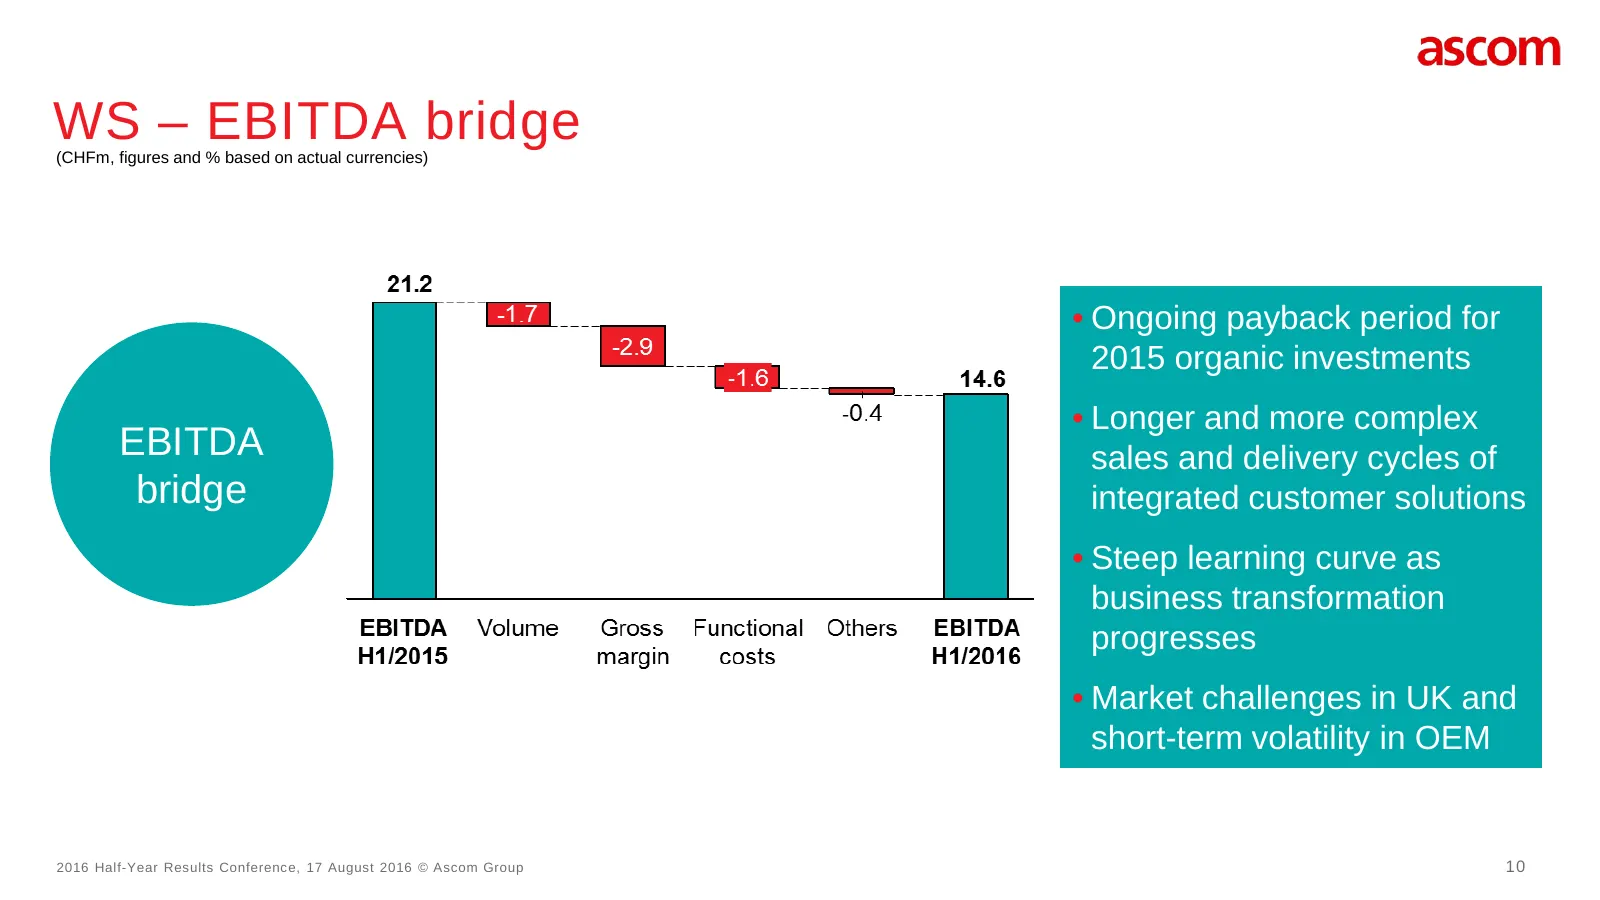
WS – EBITDA bridge (CHFm, figures and % based on actual currencies) • Ongoing payback period for 2015 organic investments • Longer and more complex EBITDA sales and delivery cycles of bridge integrated customer solutions • Steep learning curve as business transformation progresses • Market challenge
Slide 11: NT – EBITDA bridge
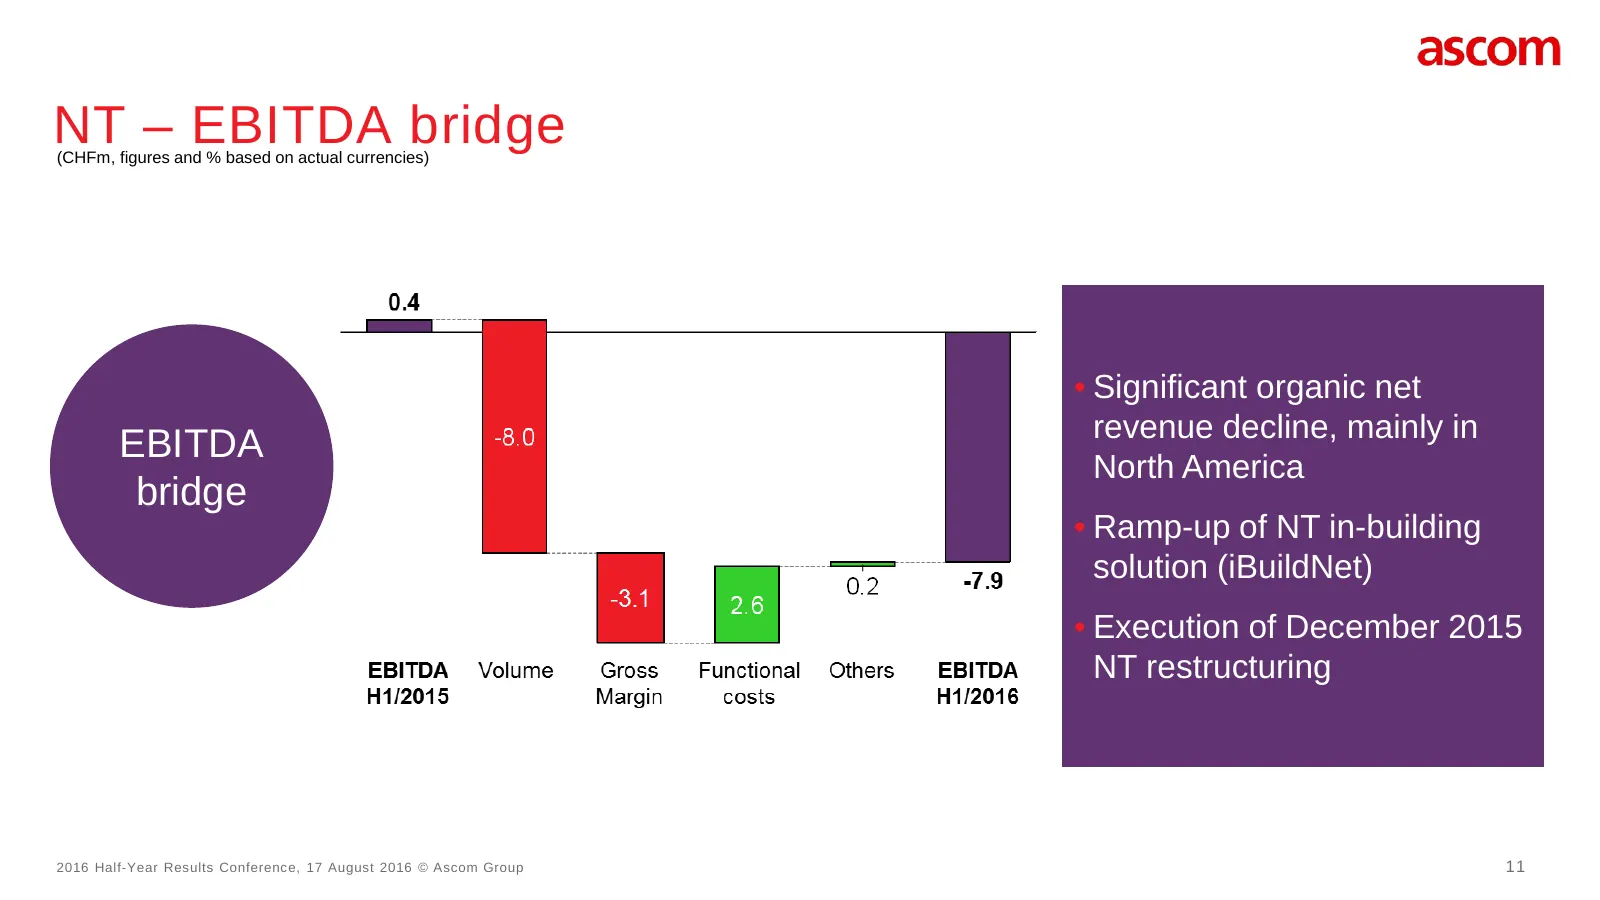
NT – EBITDA bridge (CHFm, figures and % based on actual currencies) • Significant organic net revenue decline, mainly in EBITDA North America bridge • Ramp-up of NT in-building solution (iBuildNet) • Execution of December 2015 NT restructuring 2016 Half-Year Results Conference, 17 August 2016 © Asco
Slide 12: Group loss due to reduced EBITDA and FX impact
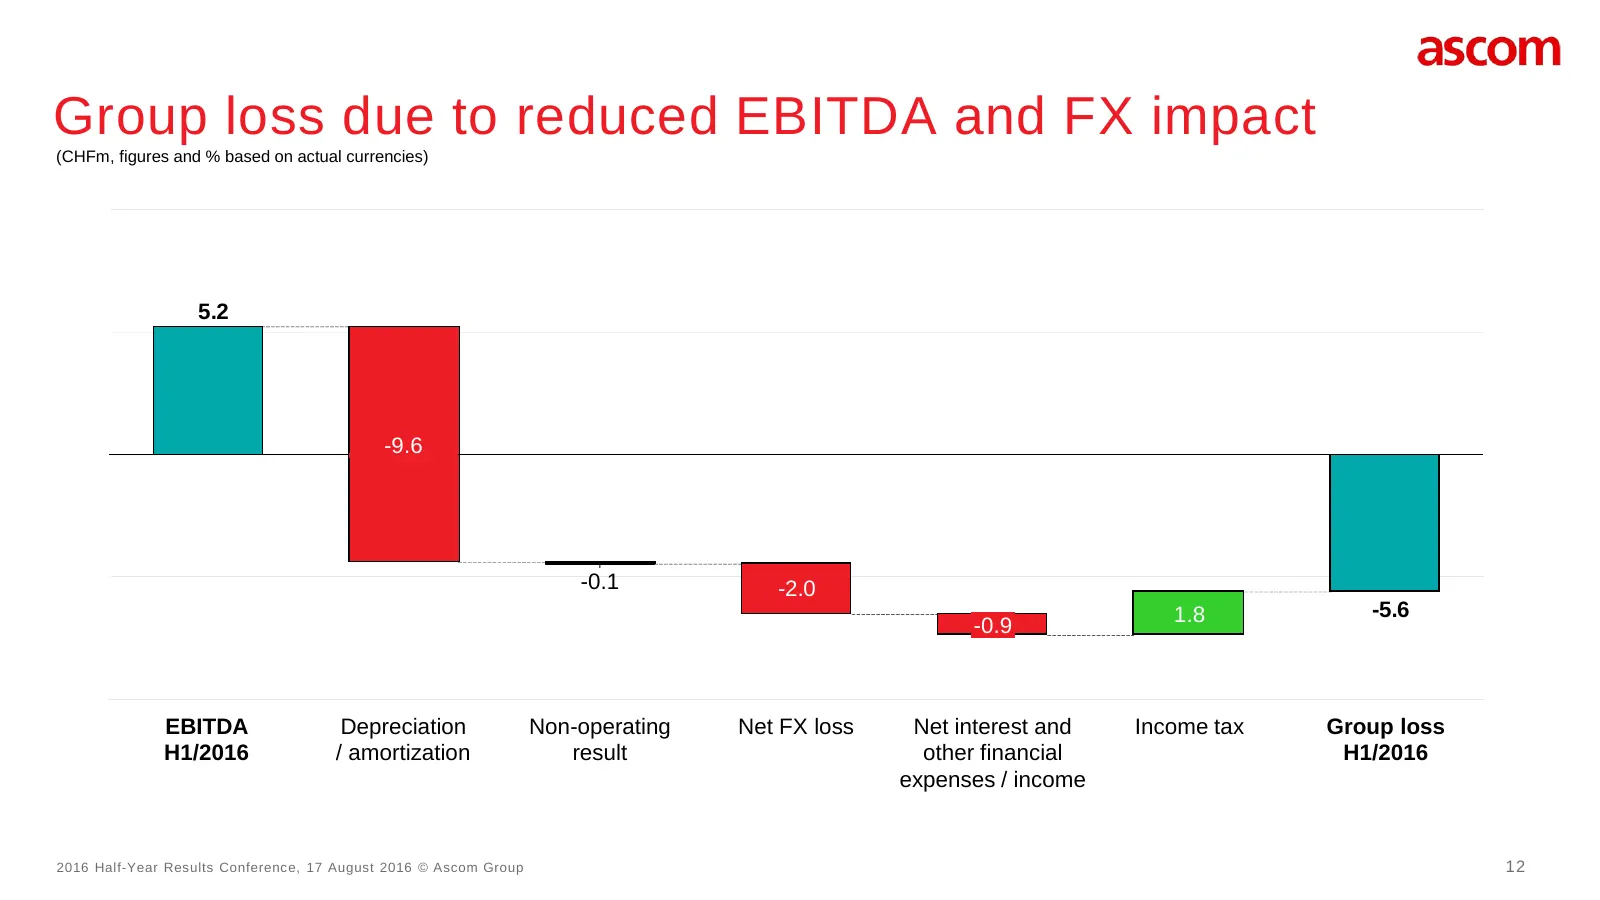
Group loss due to reduced EBITDA and FX impact (CHFm, figures and % based on actual currencies) 5.2 -9.6 -0.1 -2.0 1.8 -5.6 -0.9 EBITDA Depreciation Non-operating Net FX loss Net interest and Income tax Group loss H1/2016 / amortization result other financial H1/2016 expenses / income 2016 Half-Year
Slide 13: Balance sheet highlights
Balance sheet highlights • Overall, sound balance sheet with solid equity ratio of 35.5% as per 30.6.2016 • Healthy cash balance of CHF 33.6m as per 30.6.2016, overall net cash position • Continuous net working capital improvement 2016 Half-Year Results Conference, 17 August 2016 © Ascom Group 13

Slide 14: Ascom OneCompany Strategy
Ascom OneCompany Strategy Holger Cordes, CEO
Slide 15: Today's challenges of healthcare
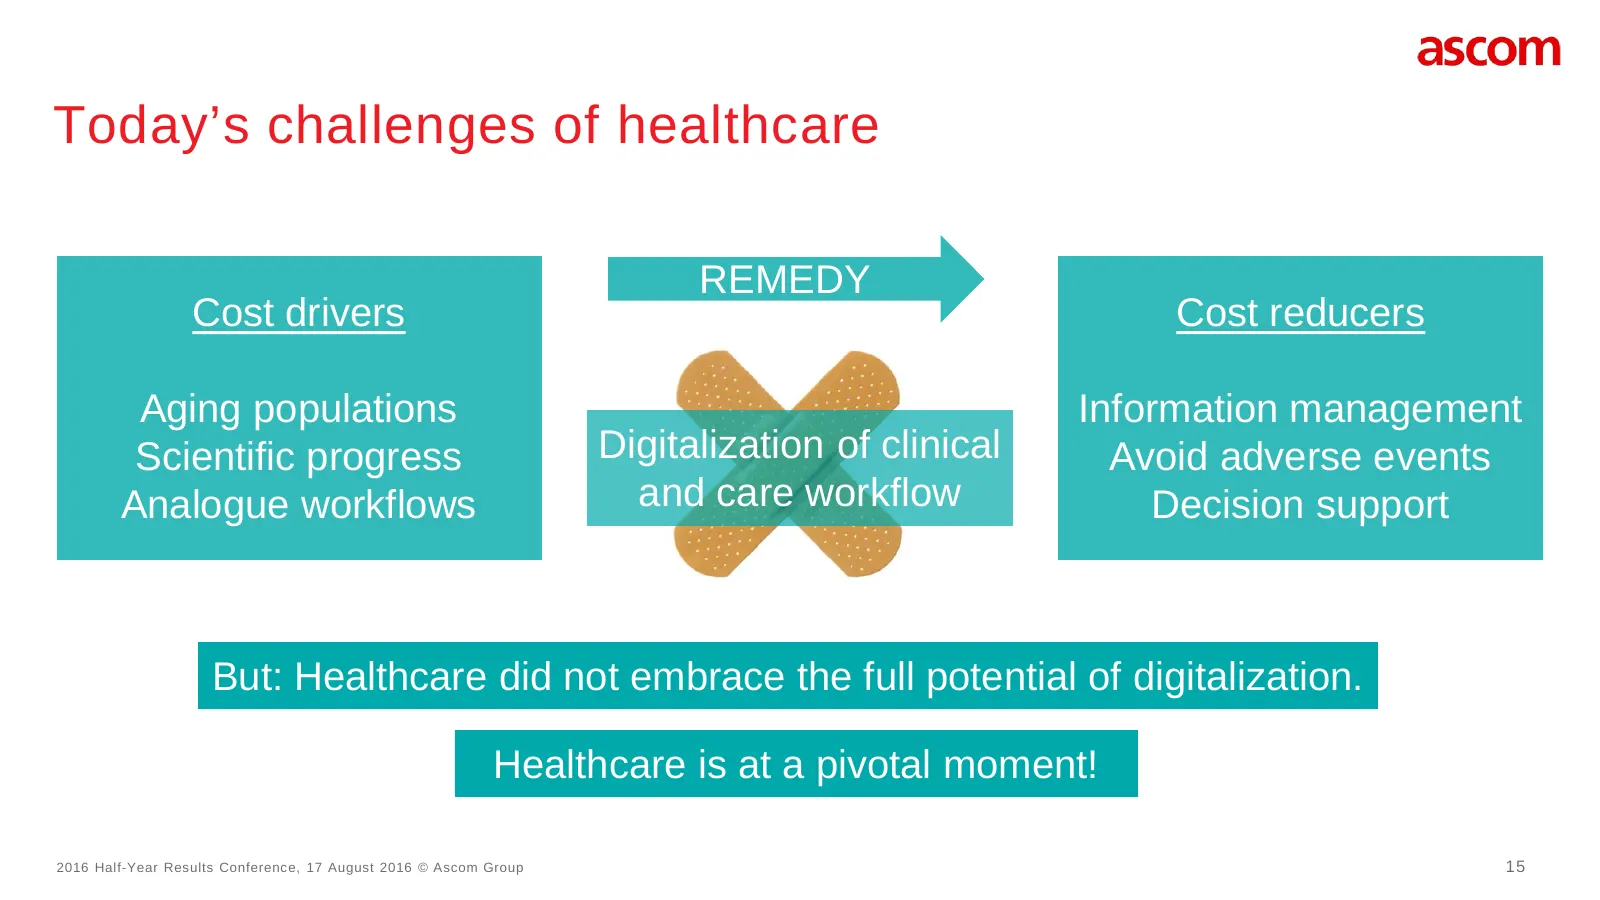
Today’s challenges of healthcare REMEDY Cost drivers Cost reducers Aging populations Information management Scientific progress Digitalization of clinical Avoid adverse events Analogue workflows and care workflow Decision support But: Healthcare did not embrace the full potential of digitalization.
Slide 16: Why is healthcare not digital?
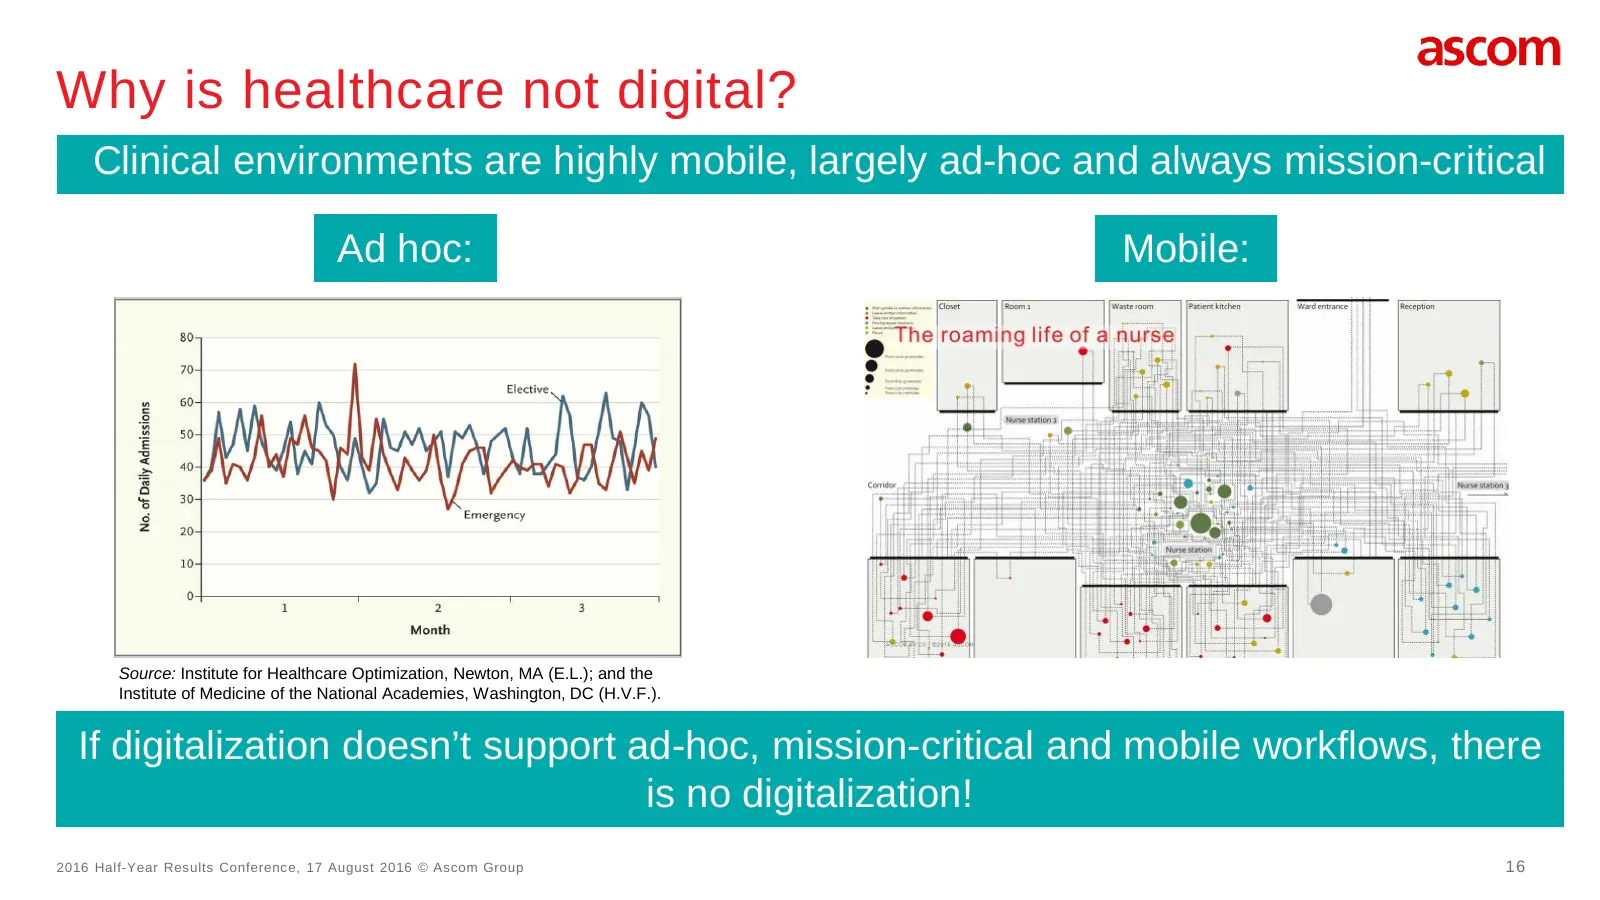
Why is healthcare not digital? Clinical environments are highly mobile, largely ad-hoc and always mission-critical Ad hoc: Mobile: Source: Institute for Healthcare Optimization, Newton, MA (E.L.); and the Institute of Medicine of the National Academies, Washington, DC (H.V.F.). If digitalization doe
Slide 17: Vision of Ascom
Vision of Ascom Ascom strives to close the digital information gap allowing for the best possible decisions - anytime and anywhere. 2016 Half-Year Results Conference, 17 August 2016 © Ascom Group 17
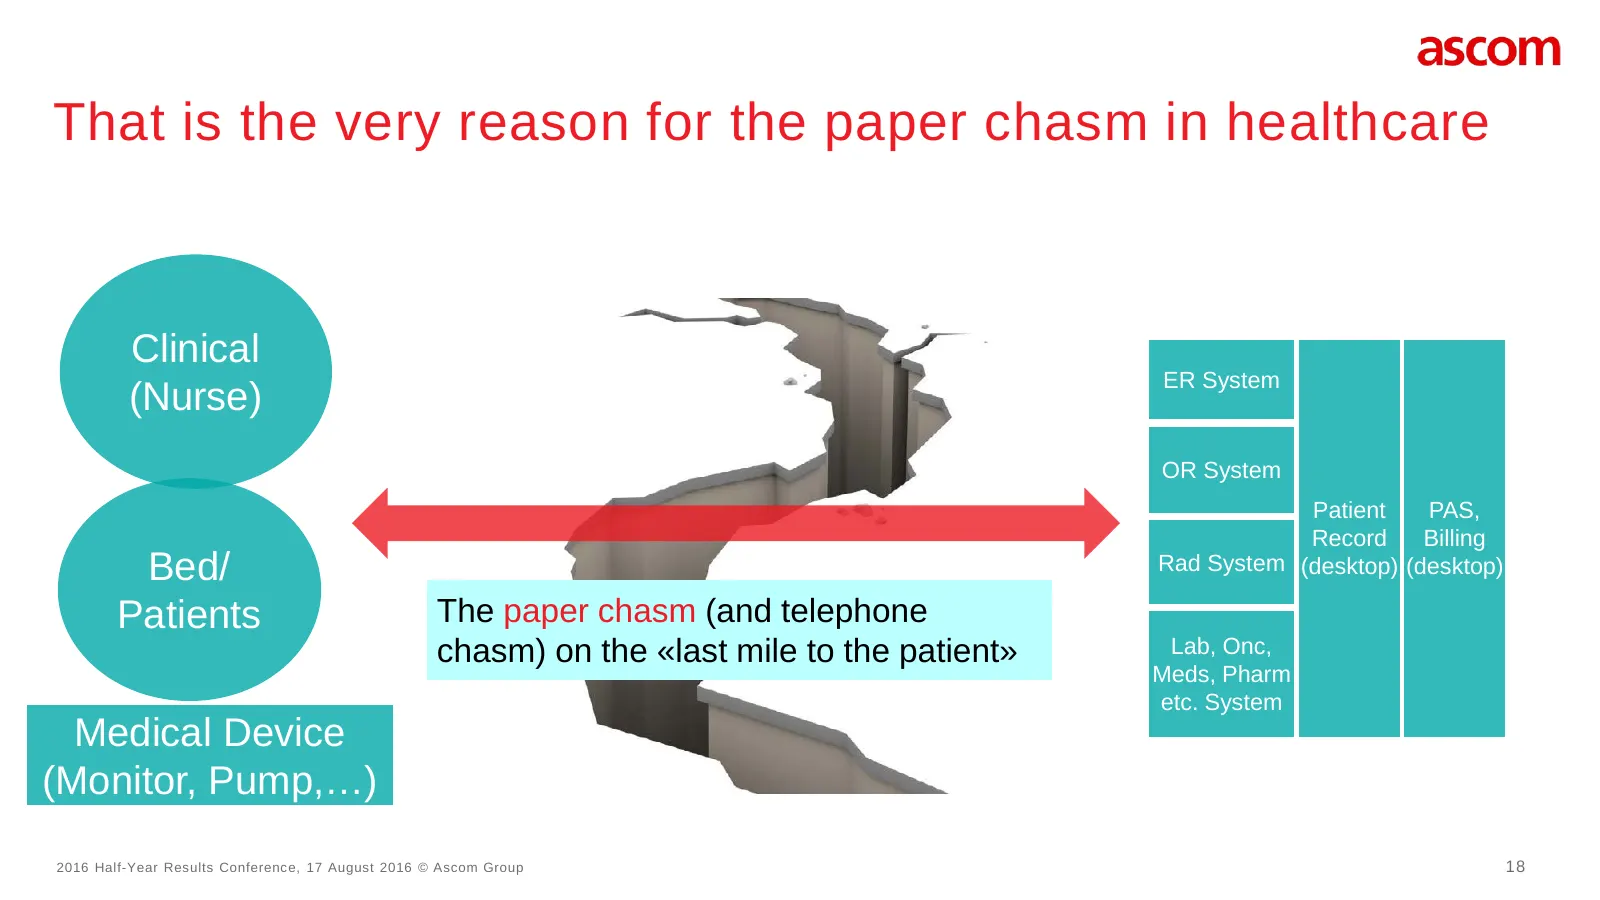
Slide 18: The paper chasm in healthcare
That is the very reason for the paper chasm in healthcare Clinical ER System (Nurse) OR System Patient PAS, Record Billing Bed/ Rad System (desktop) (desktop) Patients The paper chasm (and telephone chasm) on the «last mile to the patient» Lab, Onc, Meds, Pharm etc. System Medical Device (Monitor, P
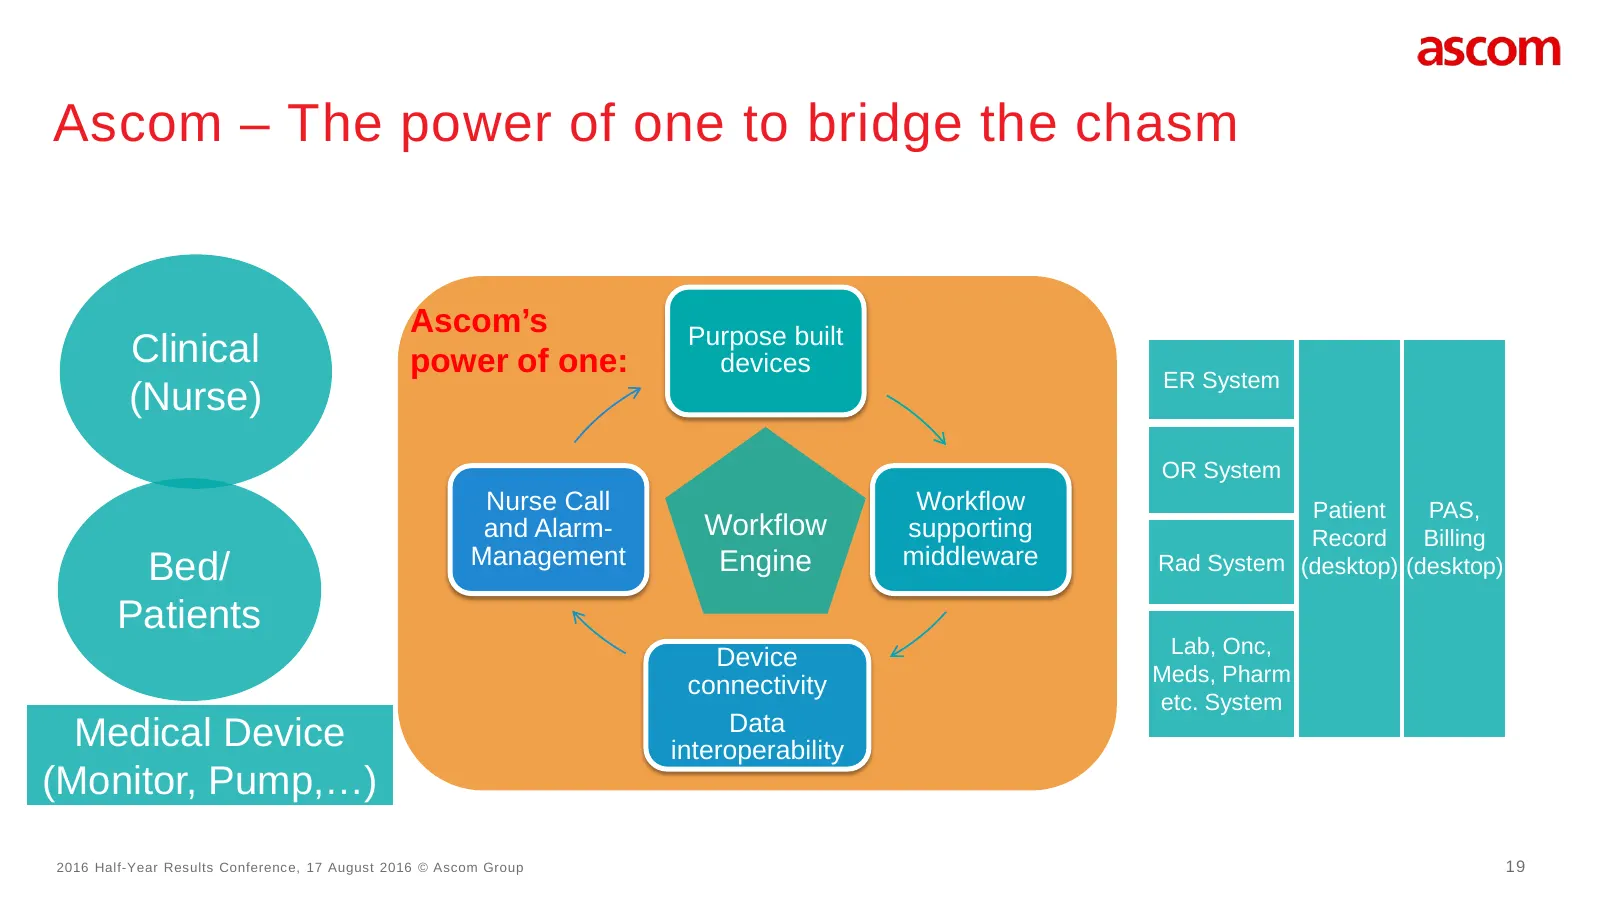
Slide 19: Ascom – The power of one to bridge the chasm
Ascom – The power of one to bridge the chasm Ascom’s Purpose built Clinical power of one: devices ER System (Nurse) OR System Nurse Call Workflow Patient PAS, and Alarm- Workflow supporting Record Billing Management Engine middleware Bed/ Rad System (desktop) (desktop) Patients Lab, Onc, Device conn
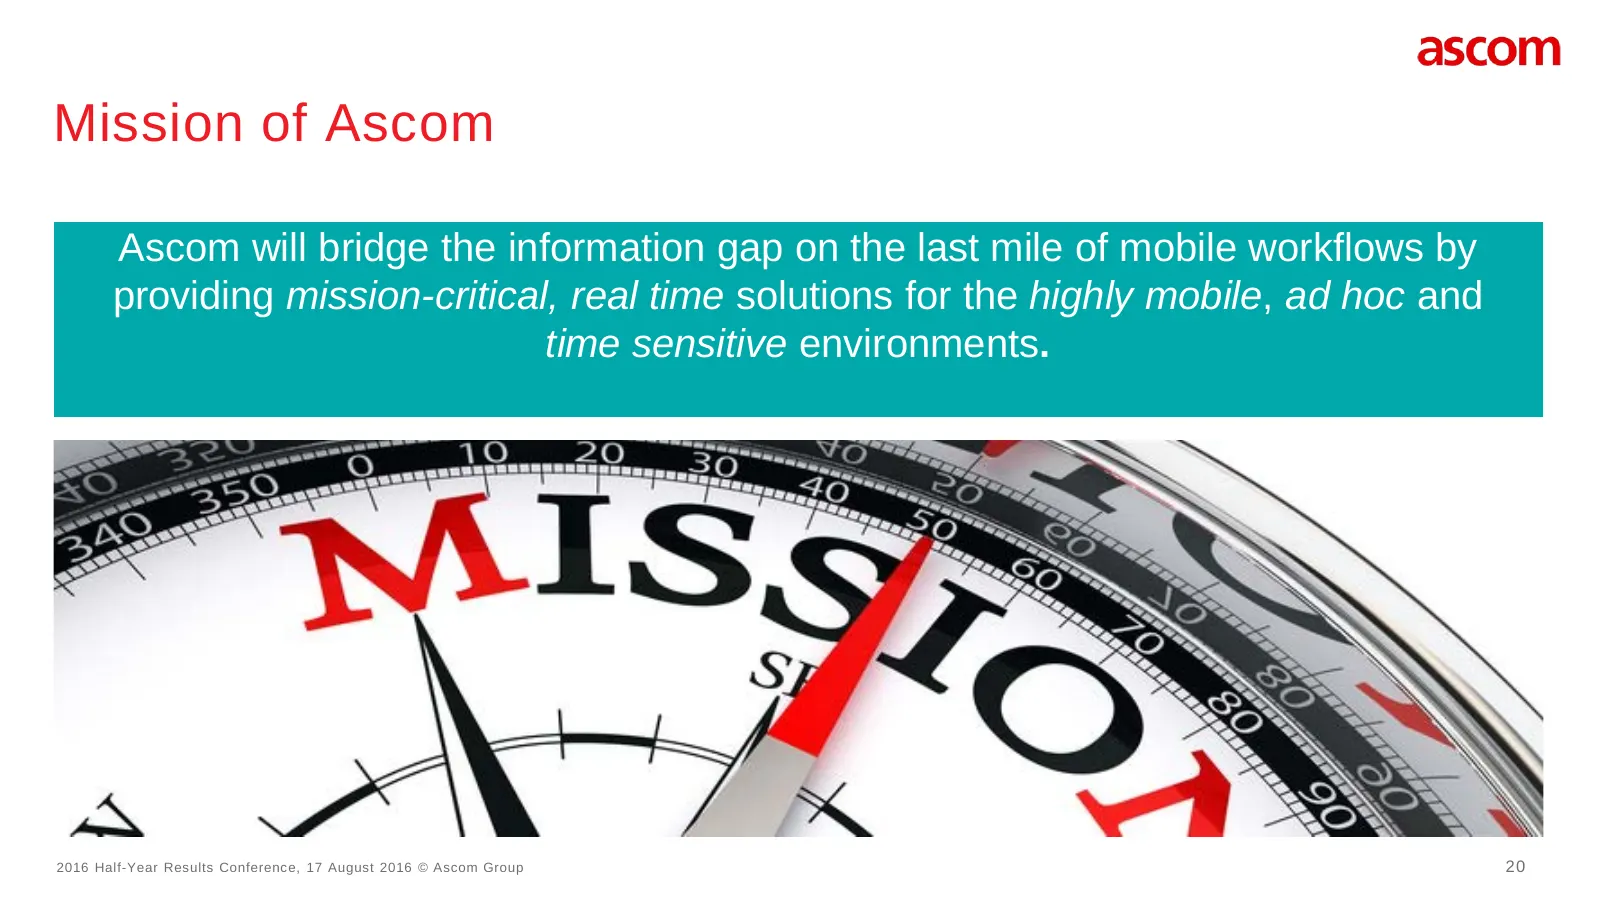
Slide 20: Mission of Ascom
Mission of Ascom Ascom will bridge the information gap on the last mile of mobile workflows by providing mission-critical, real time solutions for the highly mobile, ad hoc and time sensitive environments. 2016 Half-Year Results Conference, 17 August 2016 © Ascom Group 20
Slide 21: A worthwhile mission indeed!
A worthwhile mission indeed! • We make clinical providers more effective and efficient and improve healthcare provision • More patient safety and better outcome quality • We connect the analogue and the digital world and bring the lever of healthcare digitalization to bear at all • We will thus play
Slide 22: Promising addressable healthcare market
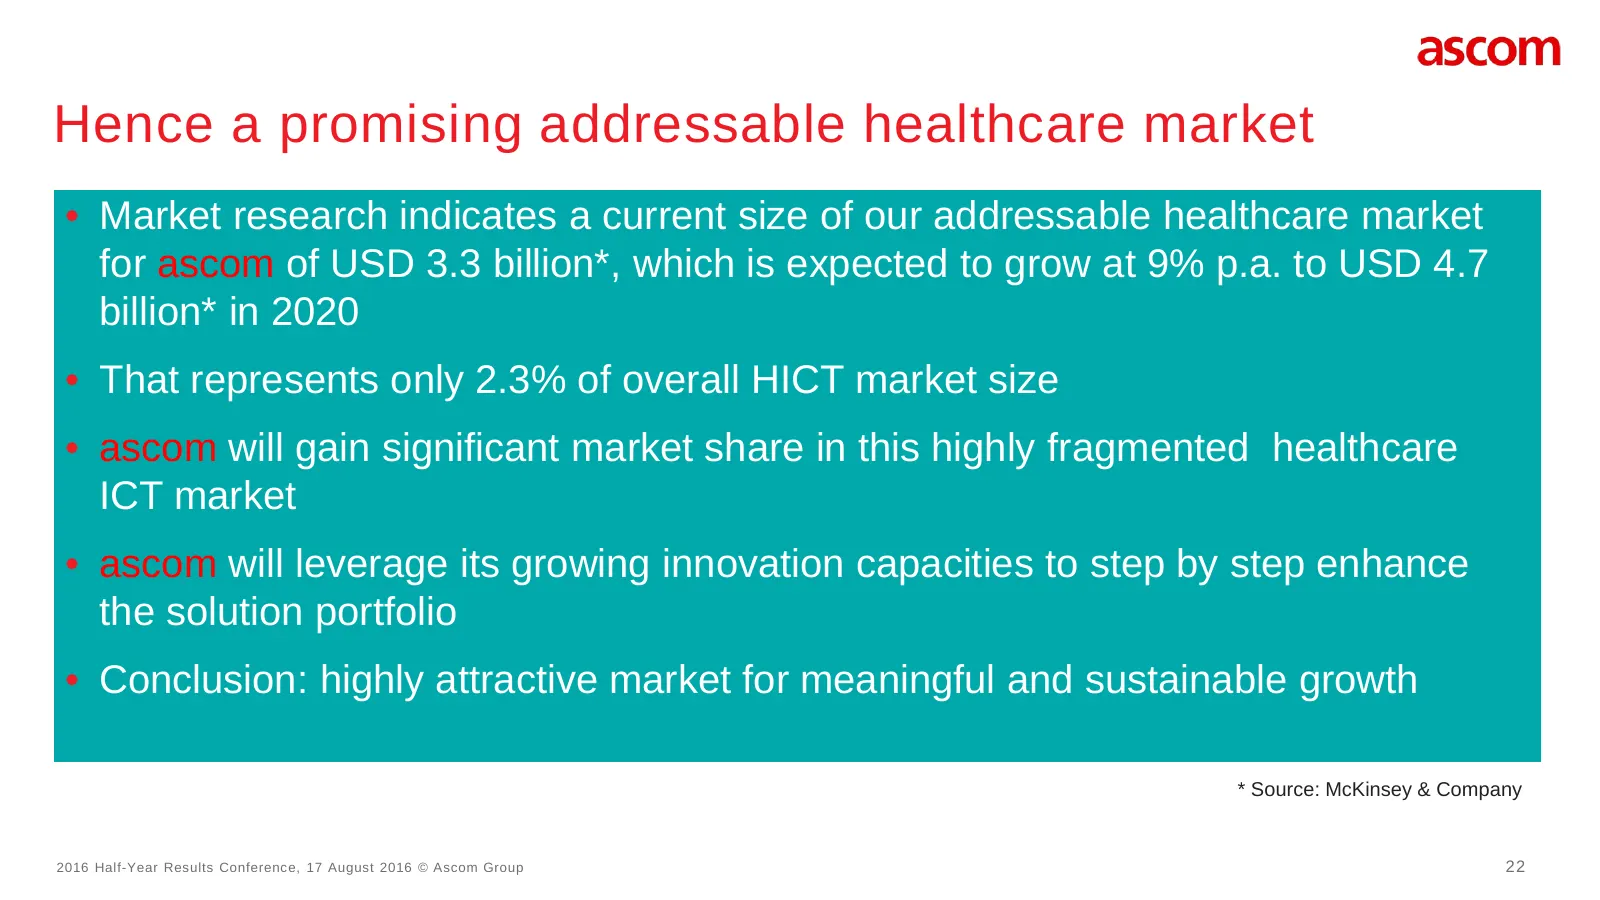
Hence a promising addressable healthcare market • Market research indicates a current size of our addressable healthcare market for ascom of USD 3.3 billion*, which is expected to grow at 9% p.a. to USD 4.7 billion* in 2020 • That represents only 2.3% of overall HICT market size • ascom will gain si
Slide 23: Where do we stand?
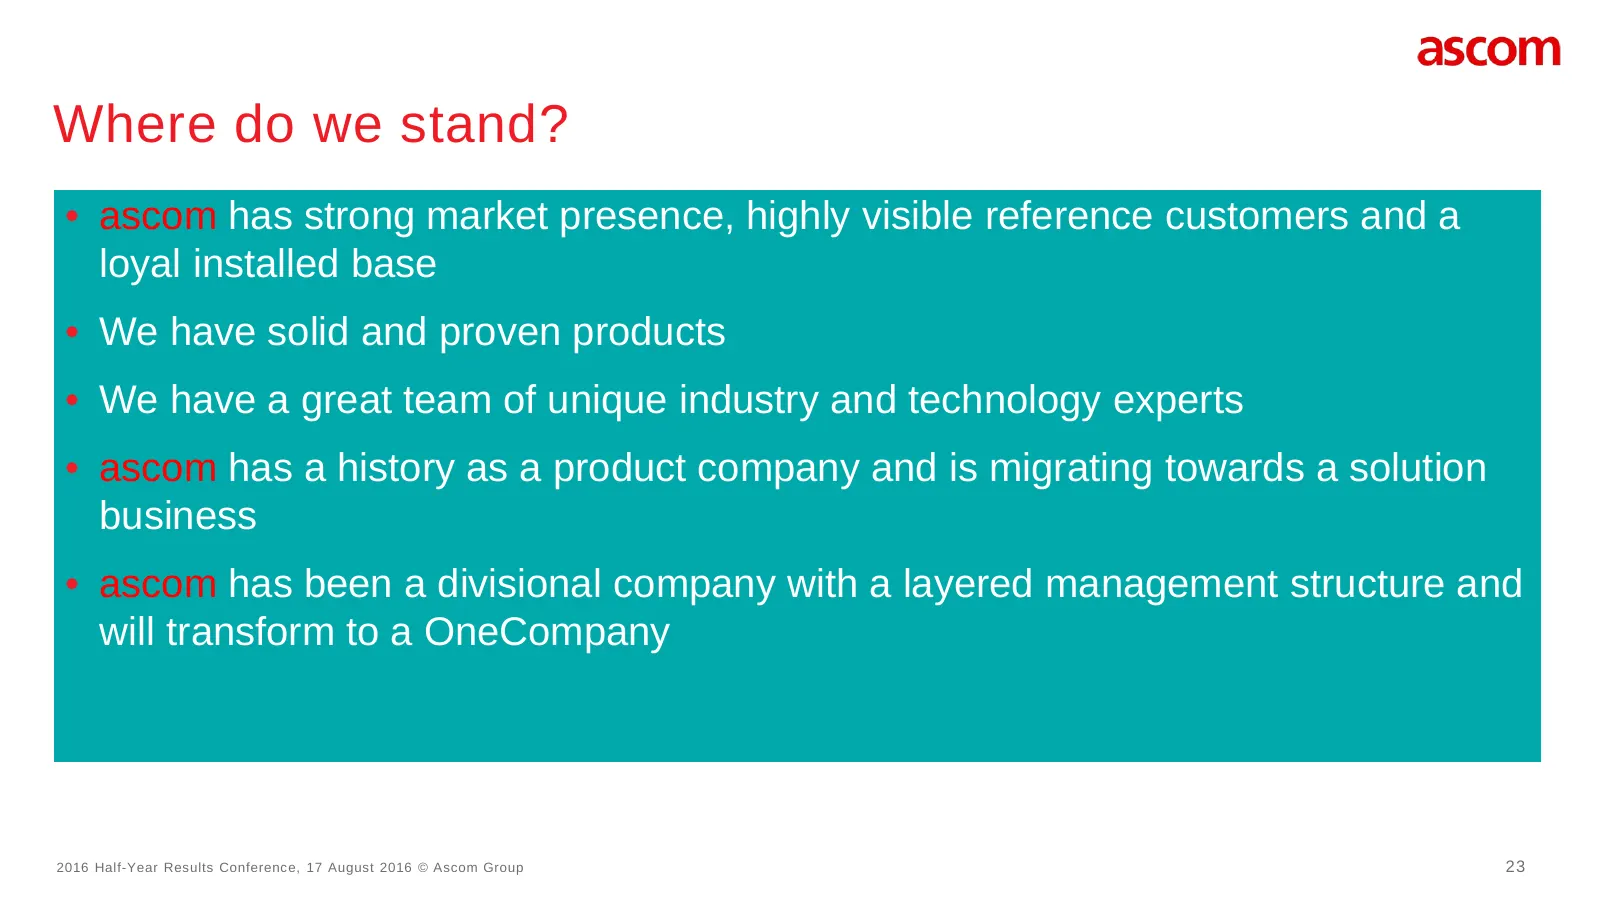
Where do we stand? • ascom has strong market presence, highly visible reference customers and a loyal installed base • We have solid and proven products • We have a great team of unique industry and technology experts • ascom has a history as a product company and is migrating towards a solution bus
Slide 24: Four main strategy areas to address change
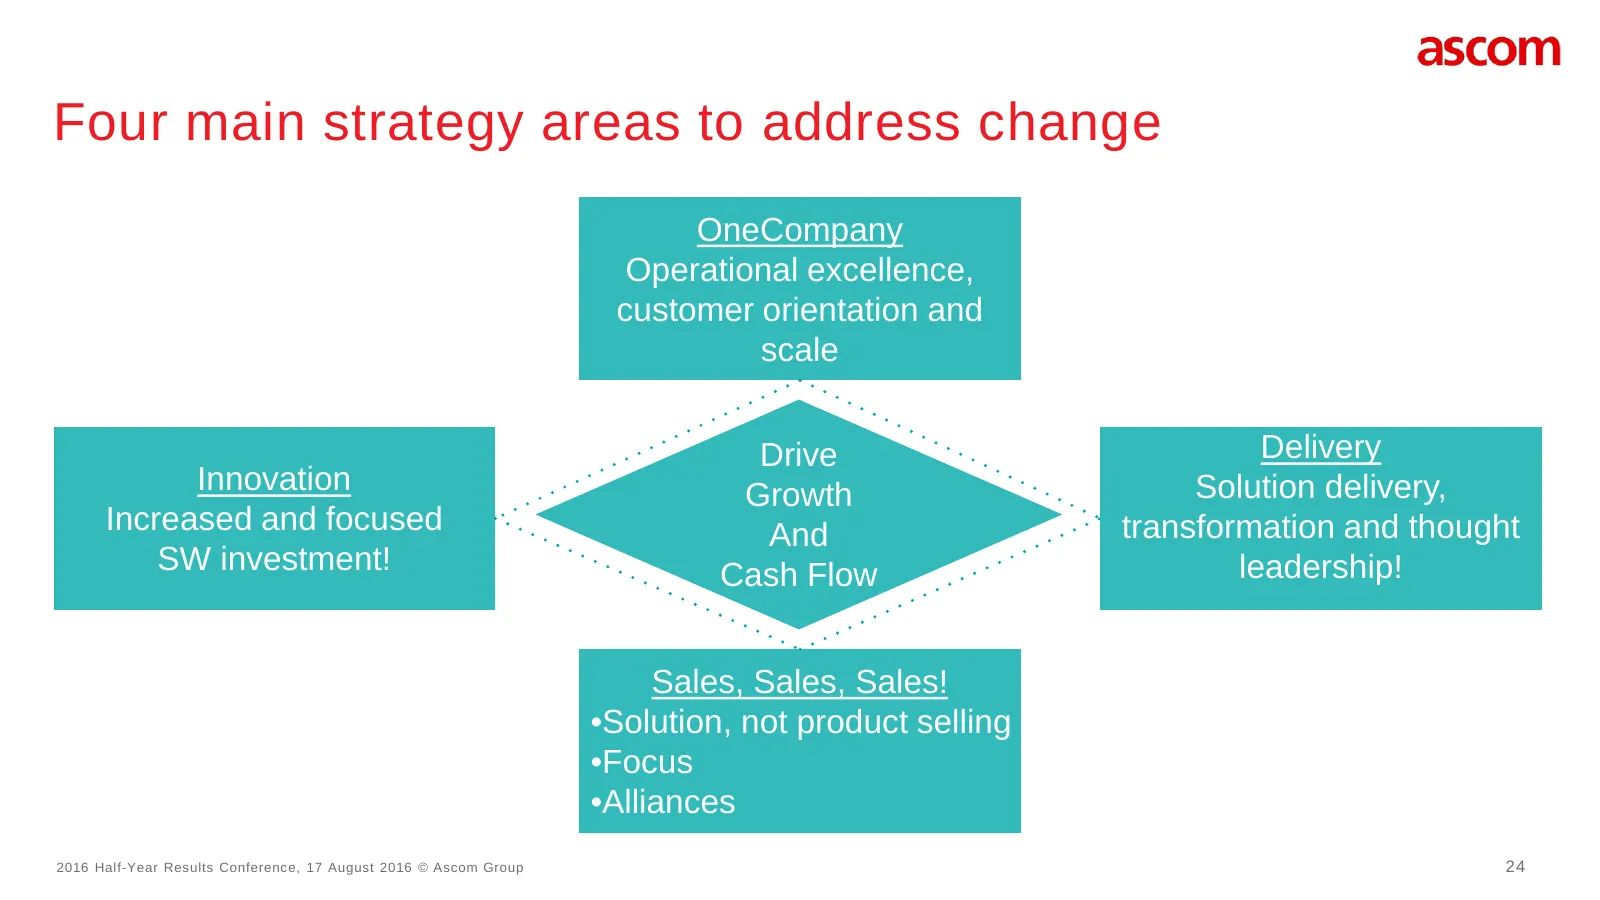
Four main strategy areas to address change OneCompany Operational excellence, customer orientation and scale Drive Delivery Innovation Growth Solution delivery, Increased and focused And transformation and thought SW investment! Cash Flow leadership! Sales, Sales, Sales! •Solution, not product selli
Slide 25: "OneCompany" strategy
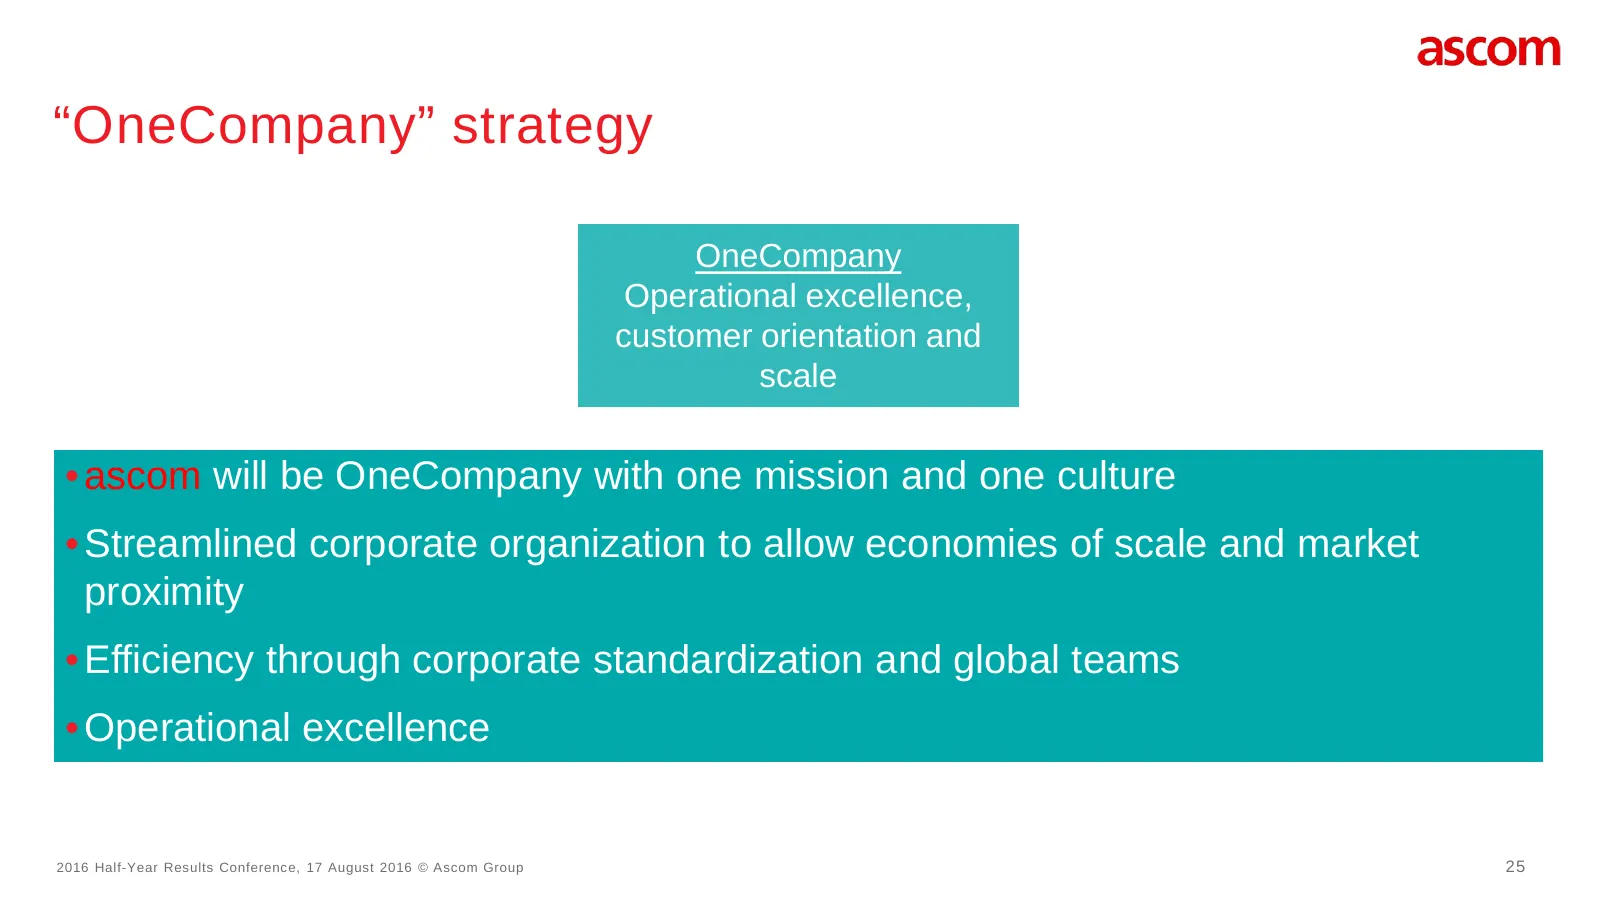
“OneCompany” strategy OneCompany Operational excellence, customer orientation and scale • ascom will be OneCompany with one mission and one culture • Streamlined corporate organization to allow economies of scale and market proximity • Efficiency through corporate standardization and global teams •
Slide 26: Strategic focus on innovation
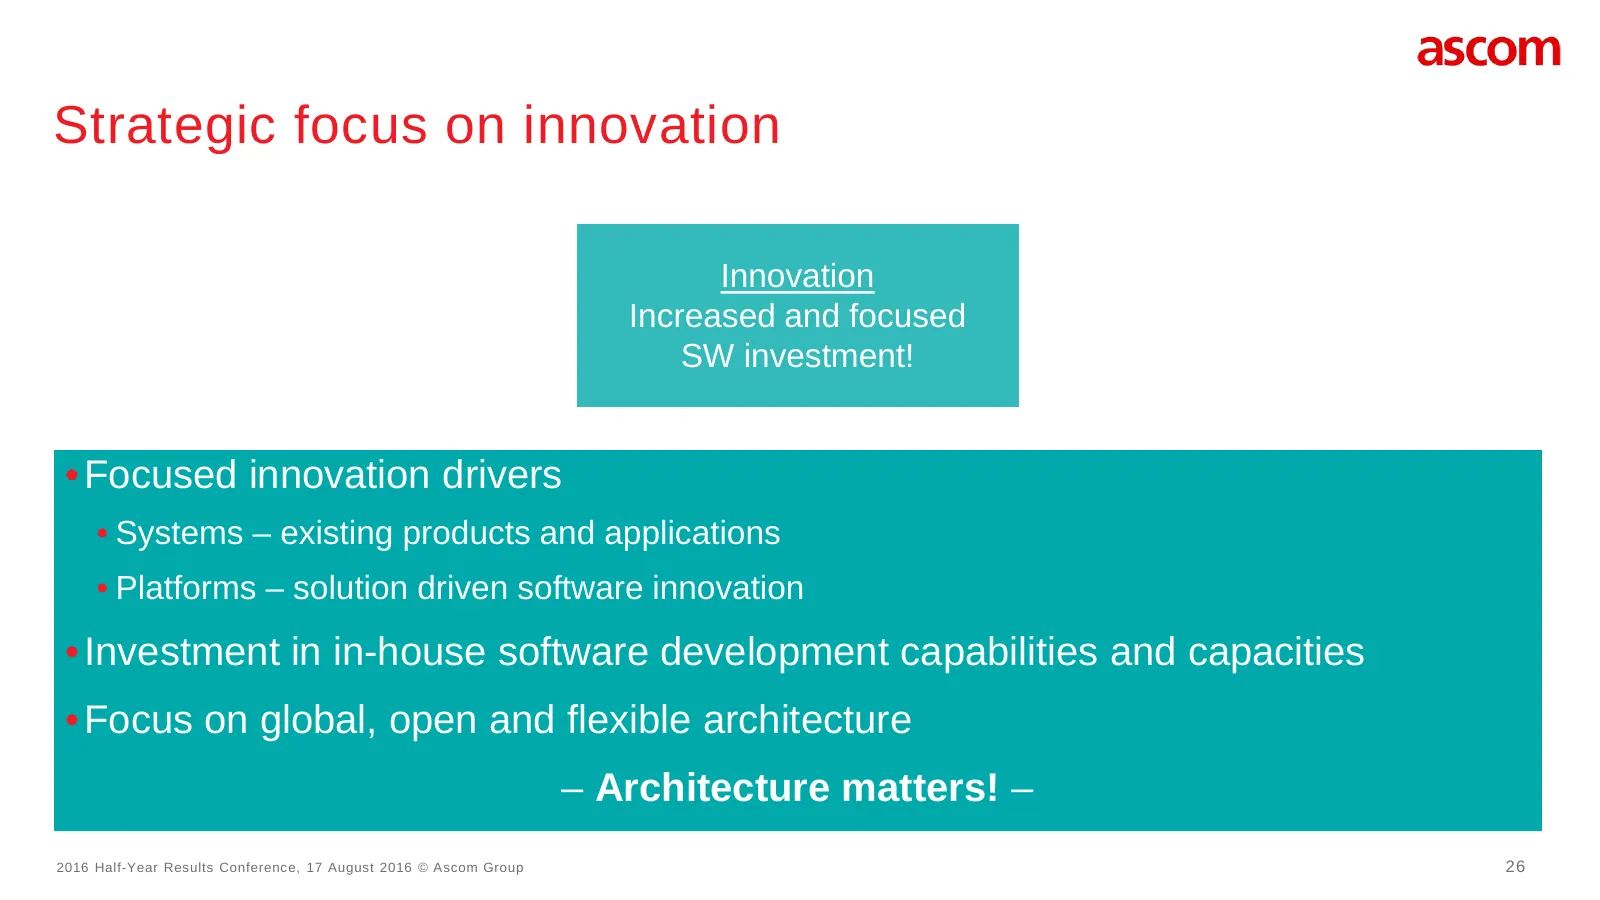
Strategic focus on innovation Innovation Increased and focused SW investment! • Focused innovation drivers • Systems – existing products and applications • Platforms – solution driven software innovation • Investment in in-house software development capabilities and capacities • Focus on global, ope
Slide 27: Strategic delivery
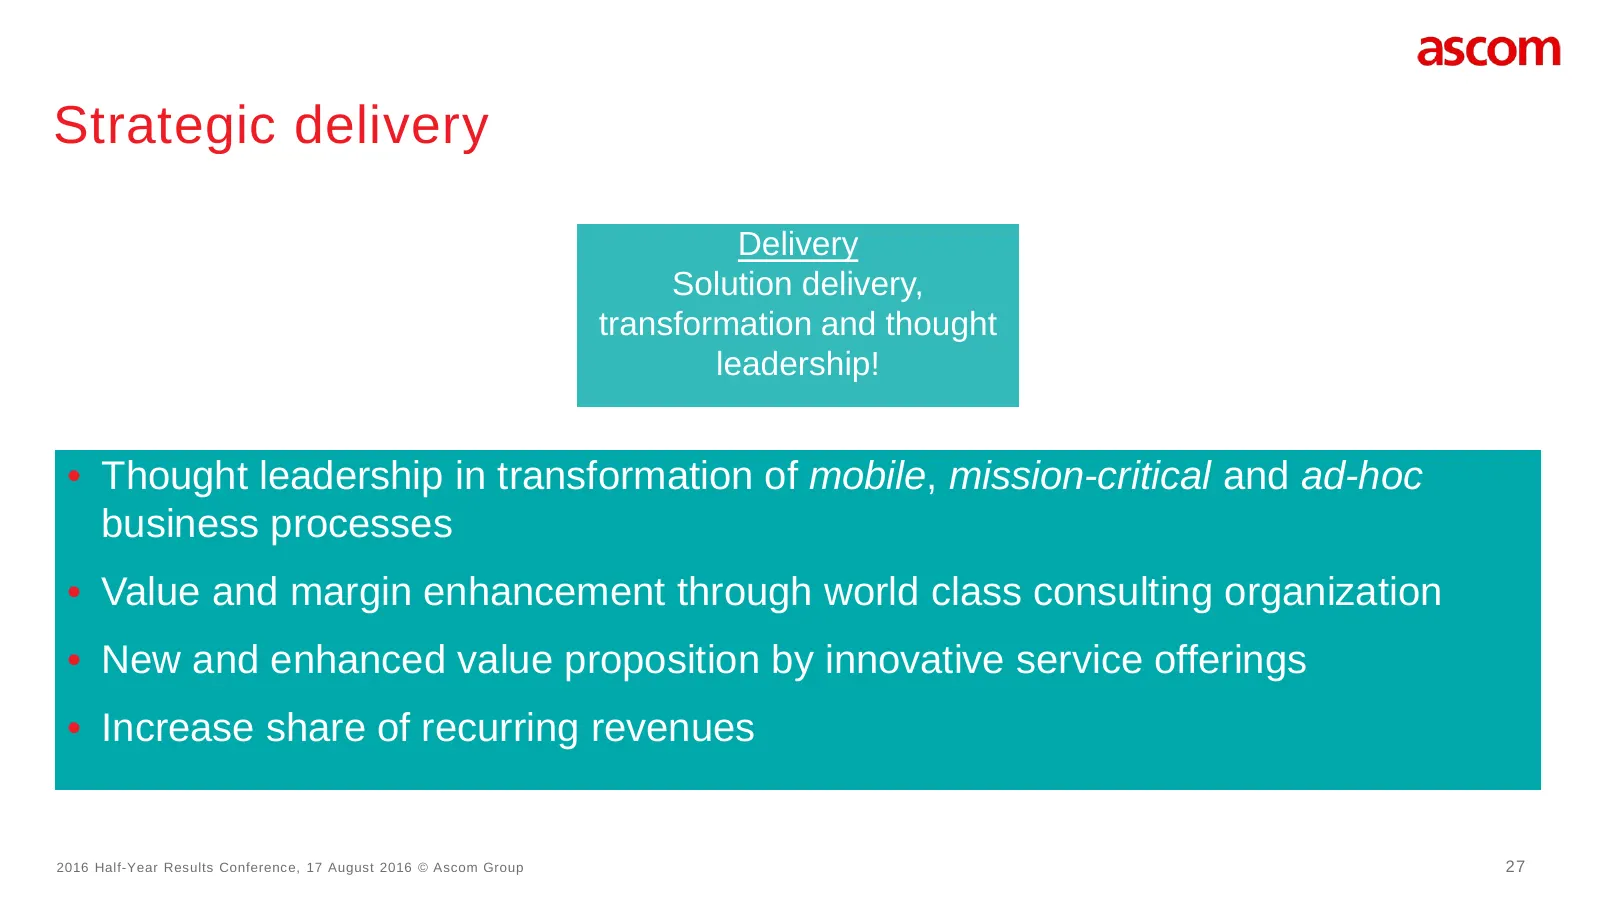
Strategic delivery Delivery Solution delivery, transformation and thought leadership! • Thought leadership in transformation of mobile, mission-critical and ad-hoc business processes • Value and margin enhancement through world class consulting organization • New and enhanced value proposition by in
Slide 28: Strategic area Sales
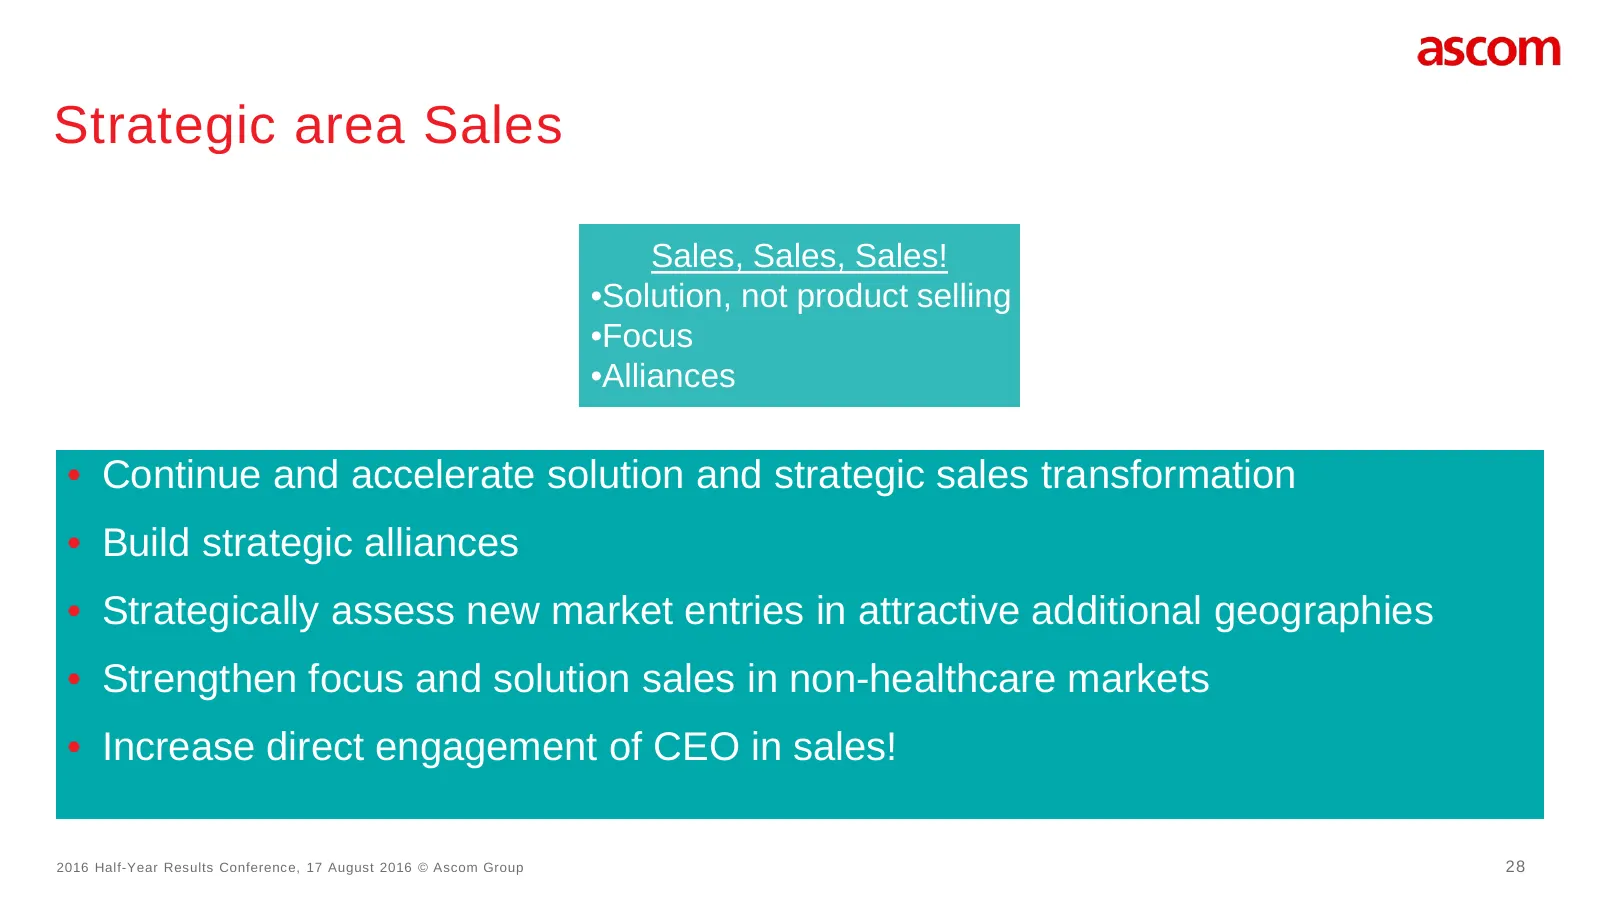
Strategic area Sales Sales, Sales, Sales! •Solution, not product selling •Focus •Alliances • Continue and accelerate solution and strategic sales transformation • Build strategic alliances • Strategically assess new market entries in attractive additional geographies • Strengthen focus and solution
Slide 29: Looking ahead
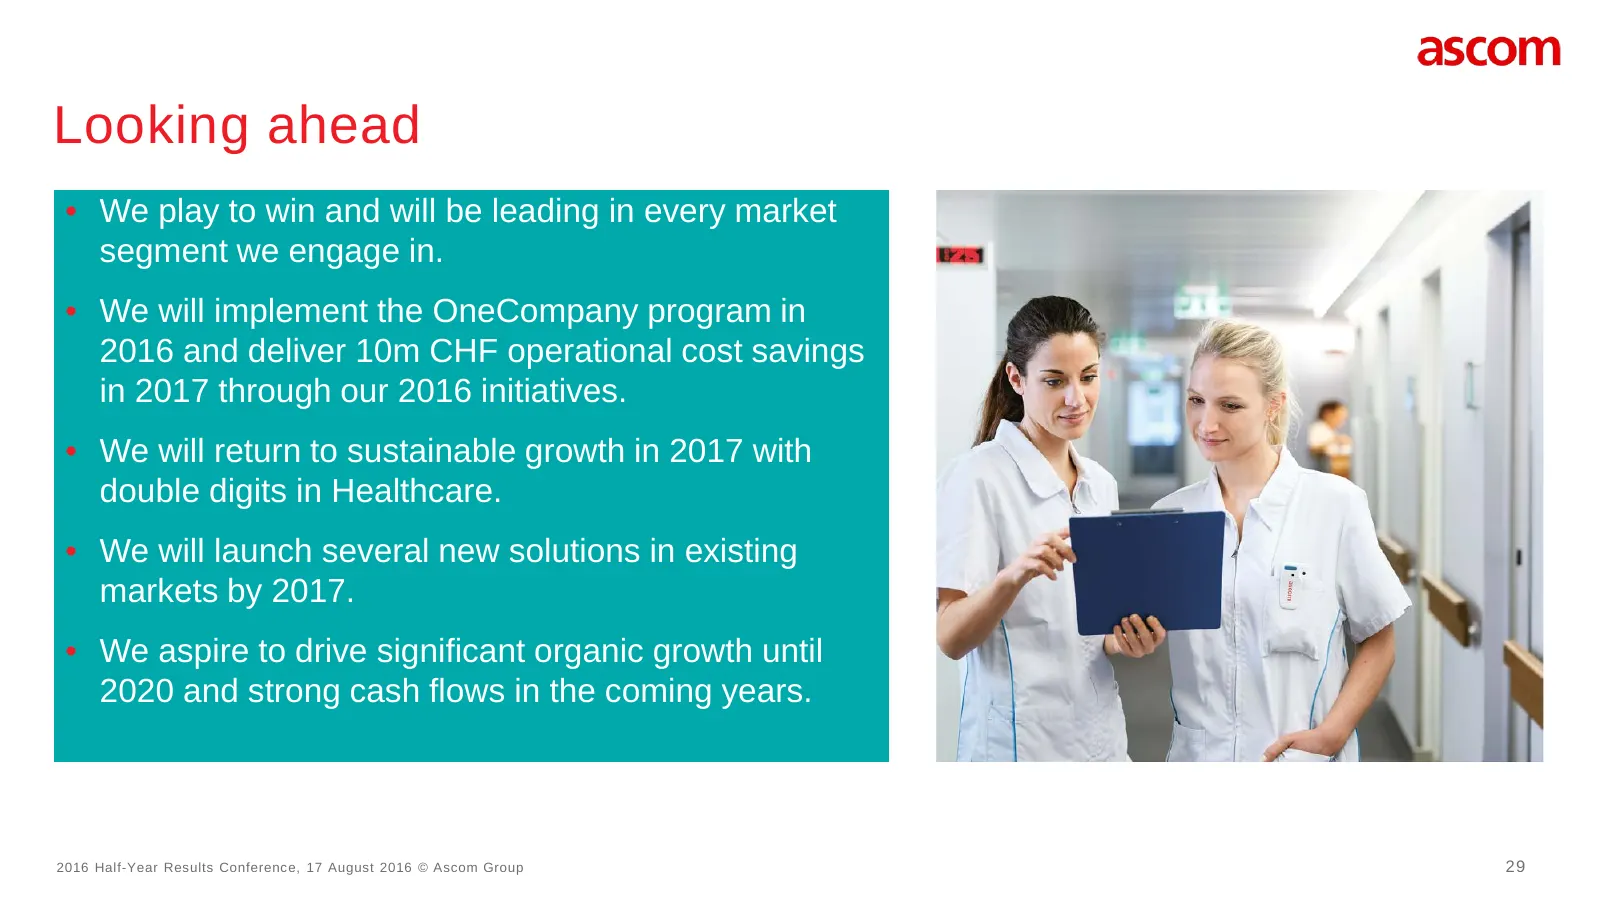
Looking ahead • We play to win and will be leading in every market segment we engage in. • We will implement the OneCompany program in 2016 and deliver 10m CHF operational cost savings in 2017 through our 2016 initiatives. • We will return to sustainable growth in 2017 with double digits in Healthca

Slide 30: Q&A
Q&A 30

Slide 31: Thank you
Thank you 31
Slide 32: Legal Disclaimer
Legal Disclaimer This document contains specific forward-looking statements, e.g. statements including terms like “believe”, “expect” or similar expressions. Such forward-looking statements are subject to known and unknown risks, uncertainties and other factors which may result in a substantial dive
Slide 33: Ascom Holding AG contact details
Ascom Holding AG Zugerstrasse 32 Baar, Switzerland www.ascom.com Phone: +41 41 544 78 00 www.linkedin.com/company/ascom 2016 Half-Year Results Conference, 17 August 2016 © Ascom Group 33
Source: Internet Archive copy of ascom.com