Hudson City Bancorp — 2010 Bank and Thrift Conference
38 slides from Hudson City Bancorp's conference presentation, May 13, 2010
Slide 1: 2010 Bank and Thrift Conference Sponsored by Janney Capital Markets
2010 Bank and Thrift Conference Sponsored by Janney Capital Markets May 13, 2010
Slide 2: Forward-Looking Statement
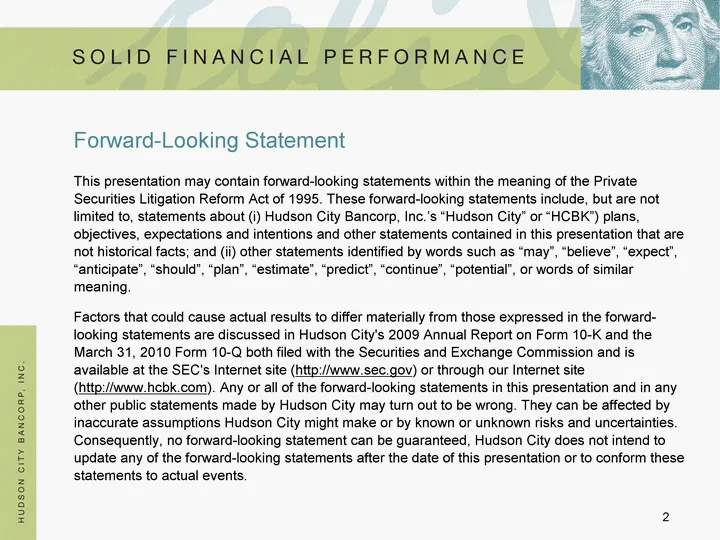
Forward-Looking Statement This presentation may contain forward-looking statements within the meaning of the Private Securities Litigation Reform Act of 1995. These forward-looking statements include, but are not limited to, statements about (i) Hudson City Bancorp, Inc.'s "Hudson City" or "HCBK") p
Slide 3: Background
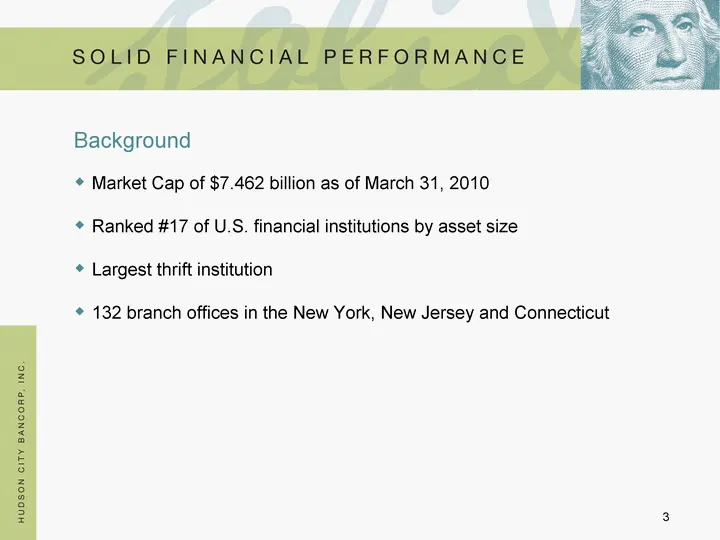
Background Market Cap of $7.462 billion as of March 31, 2010 Ranked #17 of U.S. financial institutions by asset size Largest thrift institution 132 branch offices in the New York, New Jersey and Connecticut
Slide 4: Simple, Consistent Operating Model
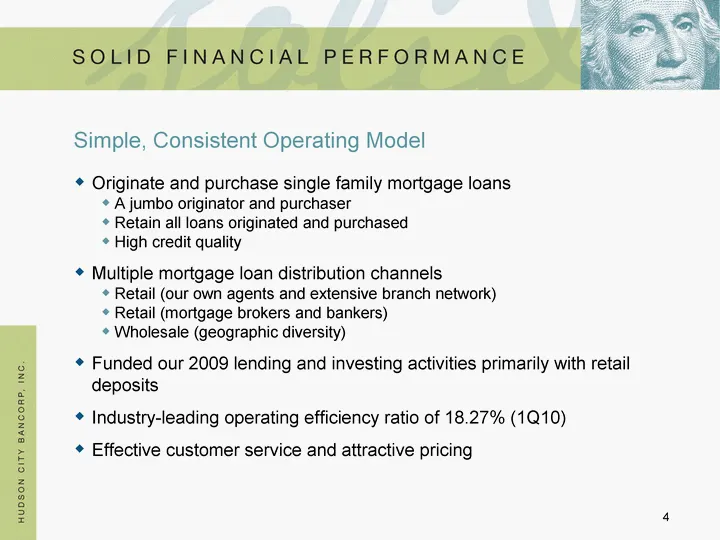
Simple, Consistent Operating Model Originate and purchase single family mortgage loans A jumbo originator and purchaser Retain all loans originated and purchased High credit quality Multiple mortgage loan distribution channels Retail (our own agents and extensive branch network) Retail (mortgage bro
Slide 5: Overview of First Quarter 2010
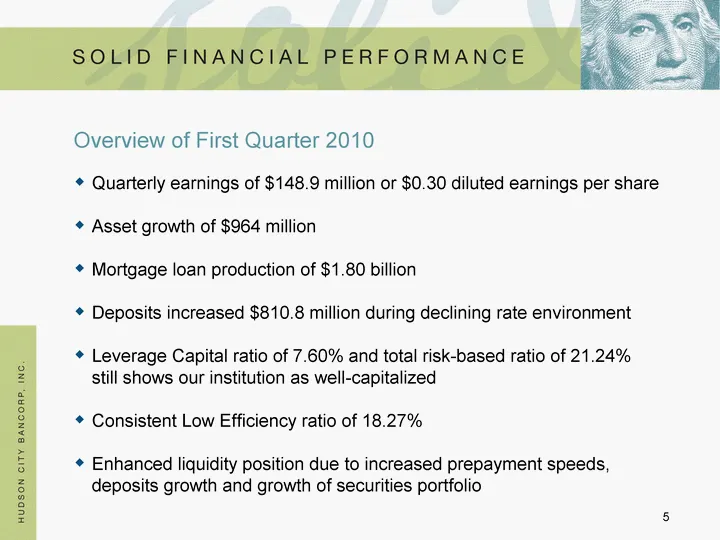
Overview of First Quarter 2010 Quarterly earnings of $148.9 million or $0.30 diluted earnings per share Asset growth of $964 million Mortgage loan production of $1.80 billion Deposits increased $810.8 million during declining rate environment Leverage Capital ratio of 7.60% and total risk-based rati
Slide 6: Earnings and Dividends Growth
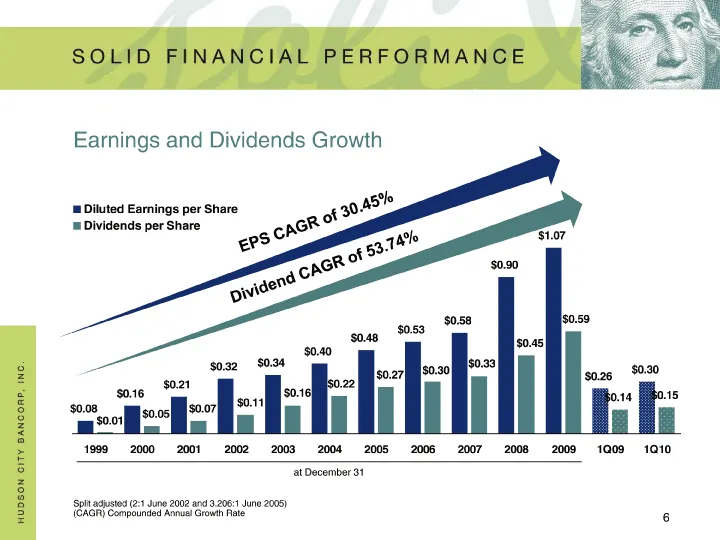
Diluted Earnings per Share Dividends per Share 1999 0.075 0.008 2000 0.162 0.045 2001 0.212 0.073 2002 0.315 0.108 2003 0.34 0.162 2004 0.402 0.218 2005 0.48 0.268 2006 0.53 0.3 2007 0.58 0.33 2008 0.9 0.45 2009 1.07 0.59 1Q09 0.26 0.14 1Q10 0.3 0.15 Split adjusted (2:1 June 2002 and 3.206:1 June 20
Slide 7: Strong Asset Growth
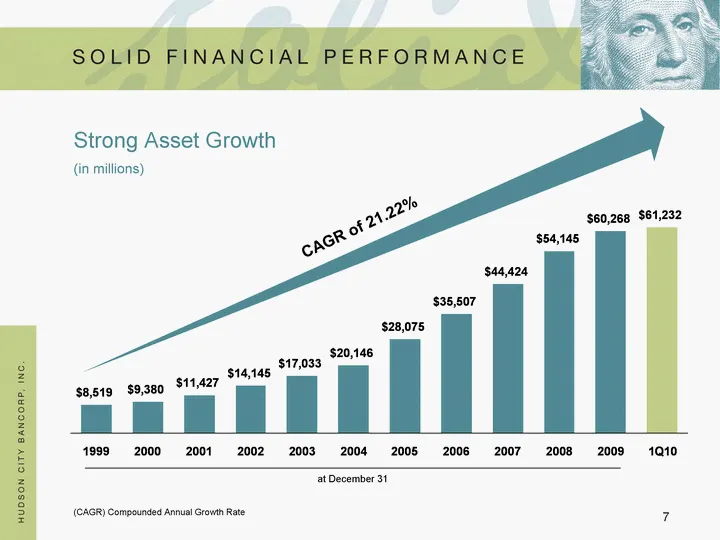
Strong Asset Growth (in millions) (CAGR) Compounded Annual Growth Rate Total Assets 1999 8519 2000 9380.373 2001 11426.768 2002 14144.604 2003 17033.36 2004 20145.981 2005 28075 2006 35507 2007 44424 2008 54145 2009 60268 1Q10 61232 CAGR of 21.22% at December 31
Slide 8: Borrowing Philosophy
Borrowing Philosophy Borrow using reverse repurchase agreements and FHLB advances Existing borrowings primarily have 10-year final maturities with quarterly call options after a fixed period of 2 to 5 years Modifying current portfolio during this low rate environment to extend maturity and repurchas
Slide 9: Securities
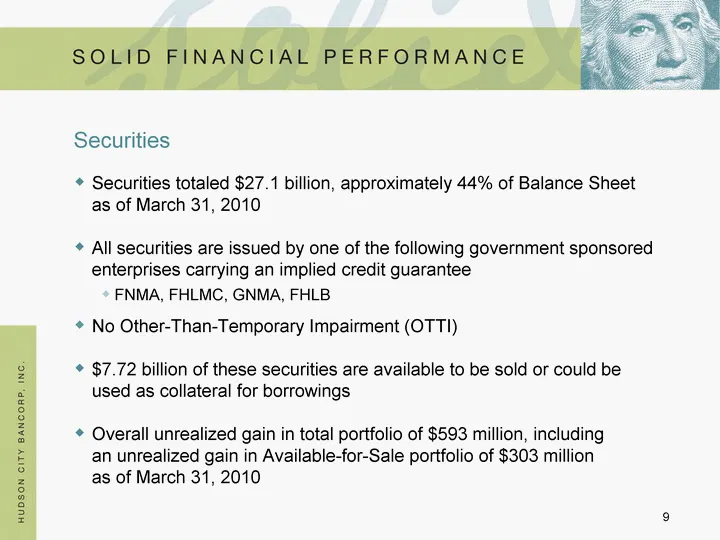
Securities Securities totaled $27.1 billion, approximately 44% of Balance Sheet as of March 31, 2010 All securities are issued by one of the following government sponsored enterprises carrying an implied credit guarantee FNMA, FHLMC, GNMA, FHLB No Other-Than-Temporary Impairment (OTTI) $7.72 billion
Slide 10: Investment Portfolio Composition/Strategy
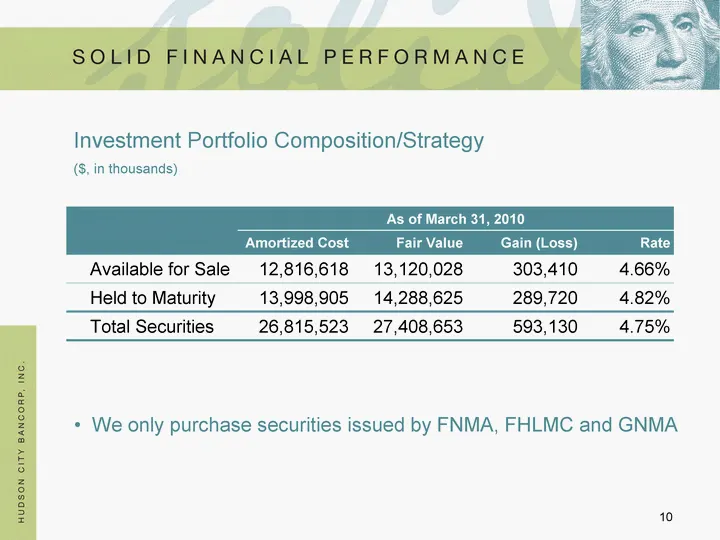
Investment Portfolio Composition/Strategy As of March 31, 2010 As of March 31, 2010 As of March 31, 2010 As of March 31, 2010 Amortized Cost Fair Value Gain (Loss) Rate Available for Sale 12,816,618 13,120,028 303,410 4.66% Held to Maturity 13,998,905 14,288,625 289,720 4.82% Total Securities 26,815
Slide 11: Mortgage Loans
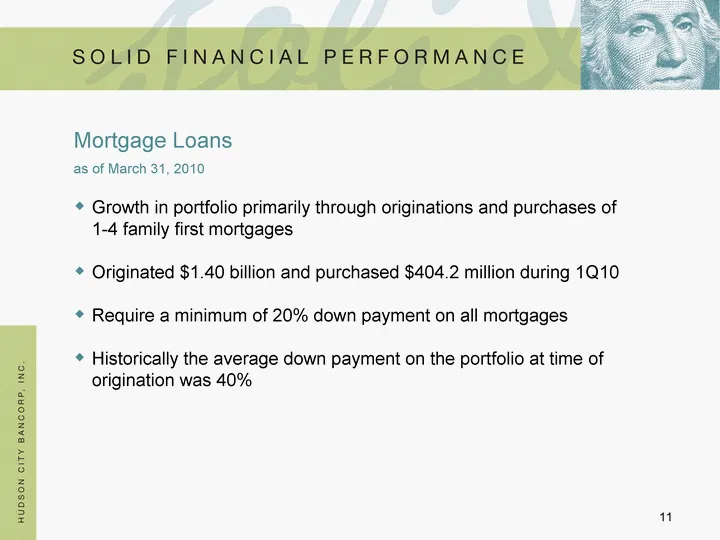
Mortgage Loans Growth in portfolio primarily through originations and purchases of 1-4 family first mortgages Originated $1.40 billion and purchased $404.2 million during 1Q10 Require a minimum of 20% down payment on all mortgages Historically the average down payment on the portfolio at time of ori
Slide 12: What We Haven't Done...
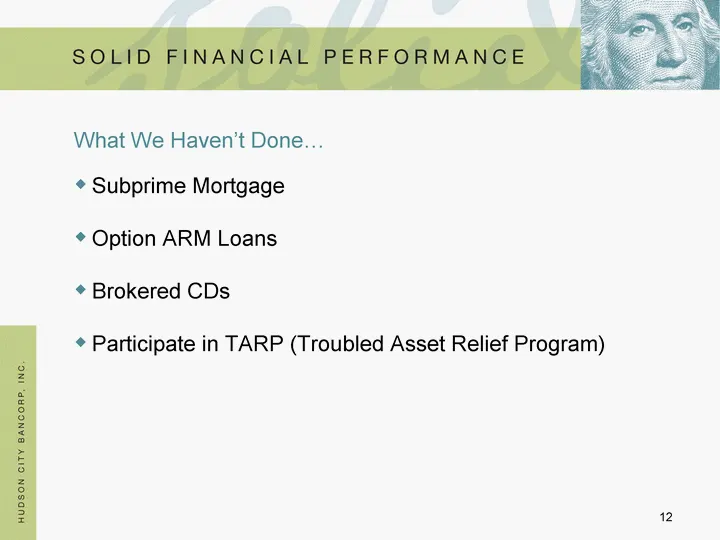
What We Haven't Done... Subprime Mortgage Option ARM Loans Brokered CDs Participate in TARP (Troubled Asset Relief Program)
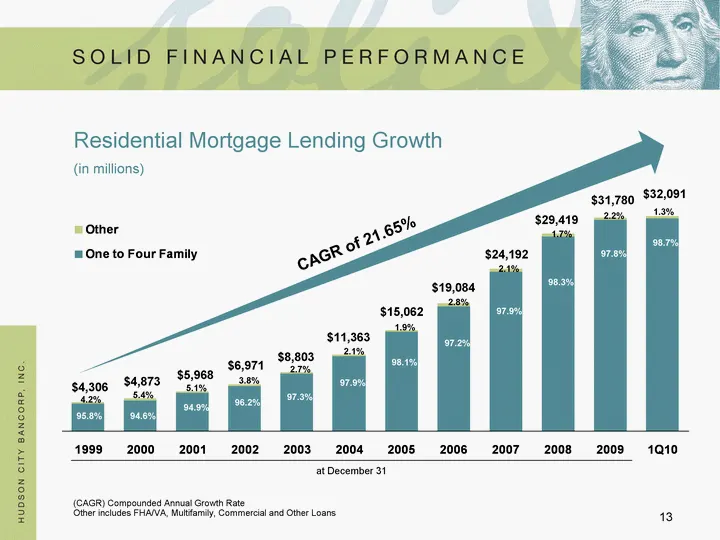
Slide 13: Residential Mortgage Lending Growth
One to Four Family Other 1999 4125.03 180.85 2000 4609.61 263.13 2001 5663.79 304.38 2002 6706.01 264.89 2003 8565.38 237.68 2004 11124.42 238.62 2005 14775.82 286.18 2006 18561.467 522.15 2007 23683.97 508.032 2008 28948 471 2009 31430 350 1Q10 31673.82 417.183 Residential Mortgage Lending Growth (
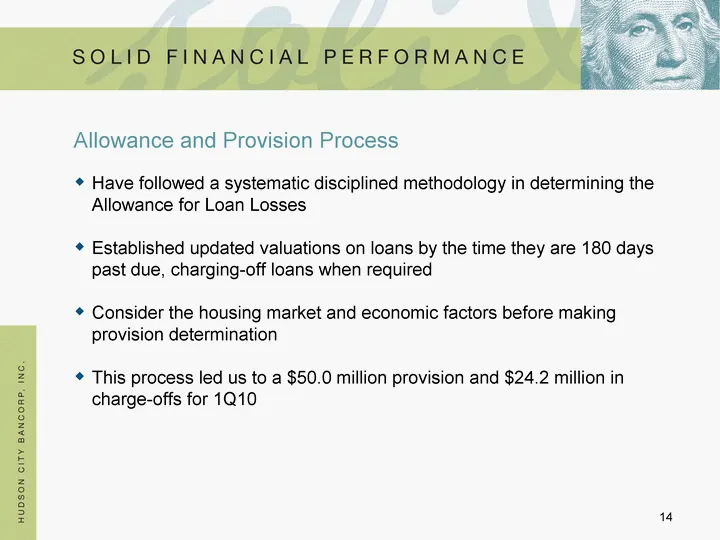
Slide 14: Allowance and Provision Process
Allowance and Provision Process Have followed a systematic disciplined methodology in determining the Allowance for Loan Losses Established updated valuations on loans by the time they are 180 days past due, charging-off loans when required Consider the housing market and economic factors before mak
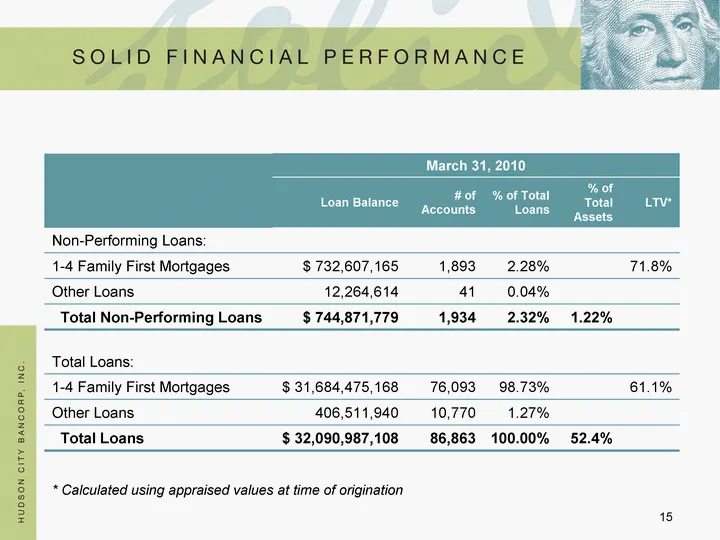
Slide 15: Non-Performing and Total Loans
March 31, 2010 March 31, 2010 March 31, 2010 March 31, 2010 March 31, 2010 Loan Balance # of Accounts % of Total Loans % of Total Assets LTV* Non-Performing Loans: 1-4 Family First Mortgages $ 732,607,165 1,893 2.28% 71.8% Other Loans 12,264,614 41 0.04% Total Non-Performing Loans $ 744,871,779 1,93
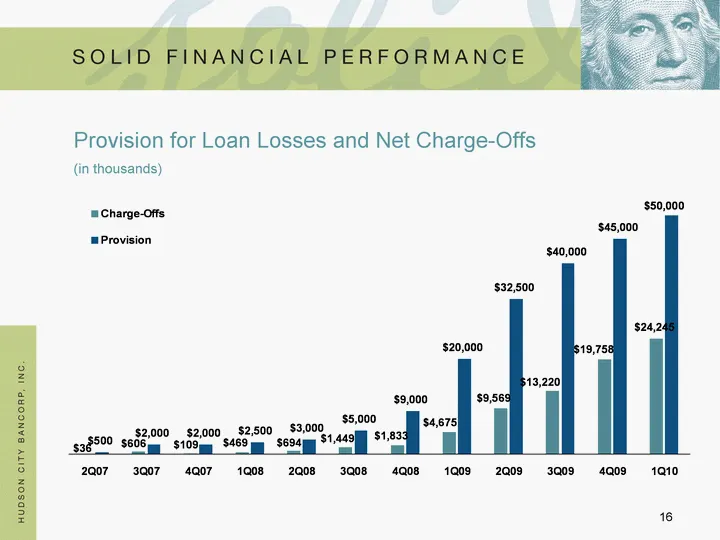
Slide 16: Provision for Loan Losses and Net Charge-Offs
Provision for Loan Losses and Net Charge-Offs Charge-Offs Provision 2Q07 36 500 3Q07 606 2000 4Q07 109 2000 1Q08 469 2500 2Q08 694 3000 3Q08 1449 5000 4Q08 1833 9000 1Q09 4675 20000 2Q09 9569 32500 3Q09 13220 40000 4Q09 19758 45000 1Q10 24245 50000 (in thousands)
Slide 17: Asset Quality
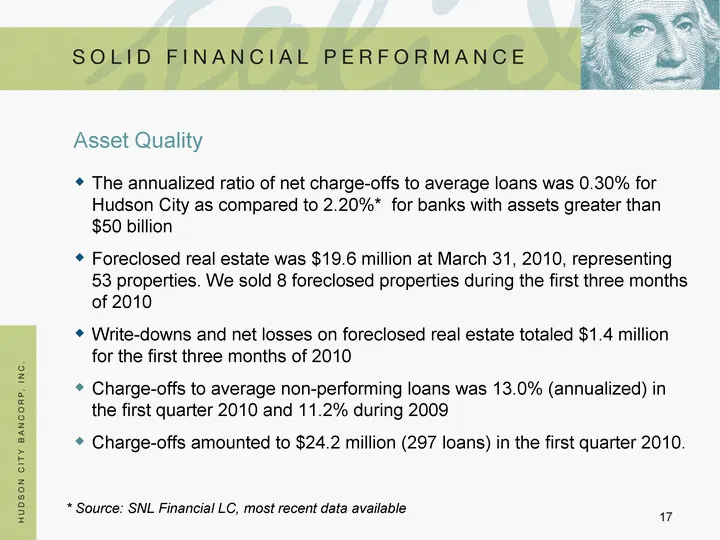
Asset Quality The annualized ratio of net charge-offs to average loans was 0.30% for Hudson City as compared to 2.20%* for banks with assets greater than $50 billion Foreclosed real estate was $19.6 million at March 31, 2010, representing 53 properties. We sold 8 foreclosed properties during the fir
Slide 18: Home Price Index for Major U.S. Markets vs. Market Peak
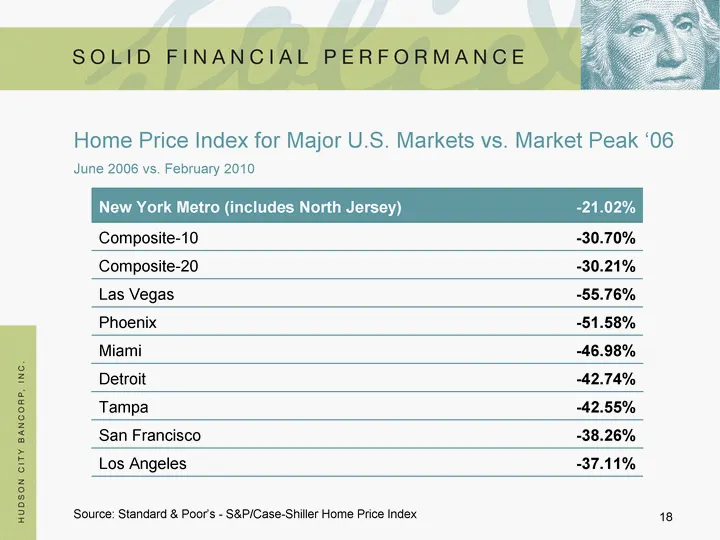
Home Price Index for Major U.S. Markets vs. Market Peak '06 June 2006 vs. February 2010 Source: Standard & Poor's - S&P/Case-Shiller Home Price Index New York Metro (includes North Jersey) -21.02% Composite-10 -30.70% Composite-20 -30.21% Las Vegas -55.76% Phoenix -51.58% Miami -46.98% Detroit -42.7
Slide 19: Home Price Index for New York Metro
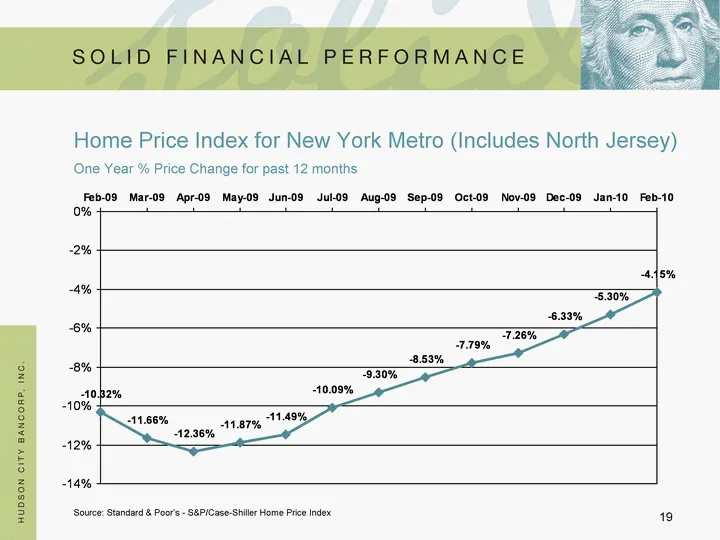
Home Price Index for New York Metro (Includes North Jersey) One Year % Price Change for past 12 months Source: Standard & Poor's - S&P/Case-Shiller Home Price Index 2/1/2009 3/1/2009 4/1/2009 5/1/2009 6/1/2009 7/1/2009 8/1/2009 9/1/2009 10/1/2009 11/1/2009 12/1/2009 1/1/2010 2/1/2010 NY Metro Area -
Slide 20: Loan Geographic Exposure
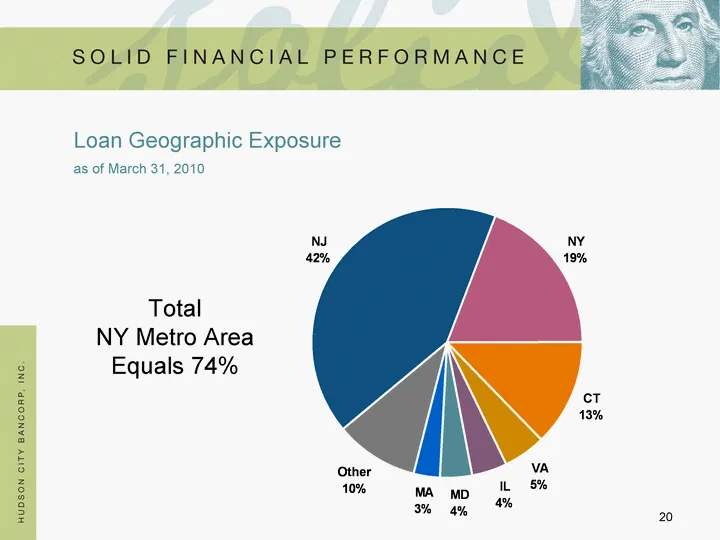
Loan Geographic Exposure as of March 31, 2010 Total NY Metro Area Equals 74% NJ NY CT VA IL MD MA Other 0.42 0.19 0.13 0.05 0.04 0.04 0.03 0.1
Slide 21: Deposits
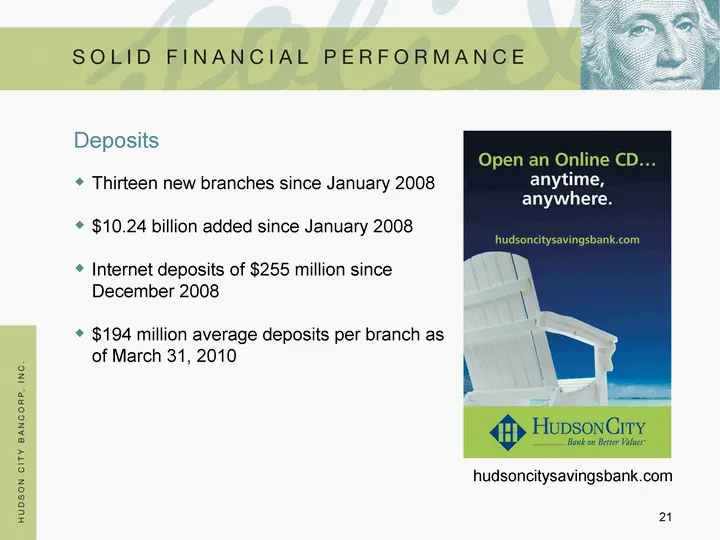
Deposits Thirteen new branches since January 2008 $10.24 billion added since January 2008 Internet deposits of $255 million since December 2008 $194 million average deposits per branch as of March 31, 2010 hudsoncitysavingsbank.com
Slide 22: Deposit Growth
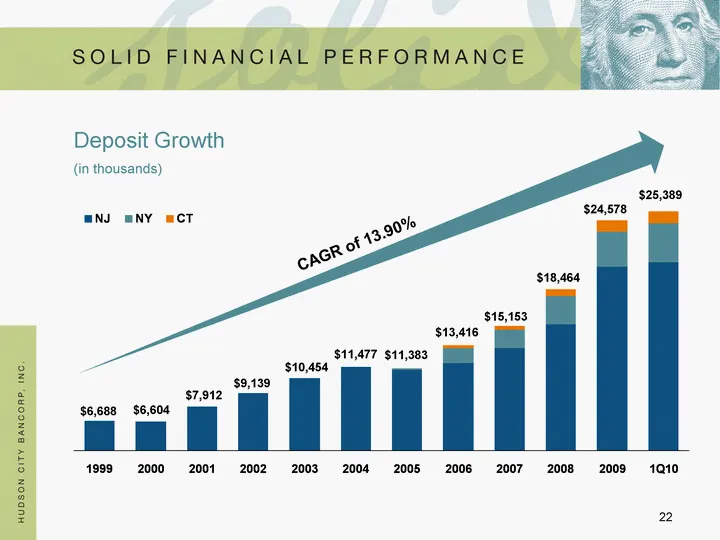
Deposit Growth NJ NY CT 1999 6688.044 0 0 2000 6604.121 0 0 2001 7912.762 0 0 2002 9138.629 0 0 2003 10453.78 0 0 2004 11463.674 13.626 0 2005 11230.96 152.34 0 2006 11833.411 1311.481 270.695 2007 13152.263 1665.786 335.333 2008 15297.492 2521.037 645.513 2009 20419 3172 987 1Q10 20857 3506 1026 (i
Slide 23: Attractive Branch Network
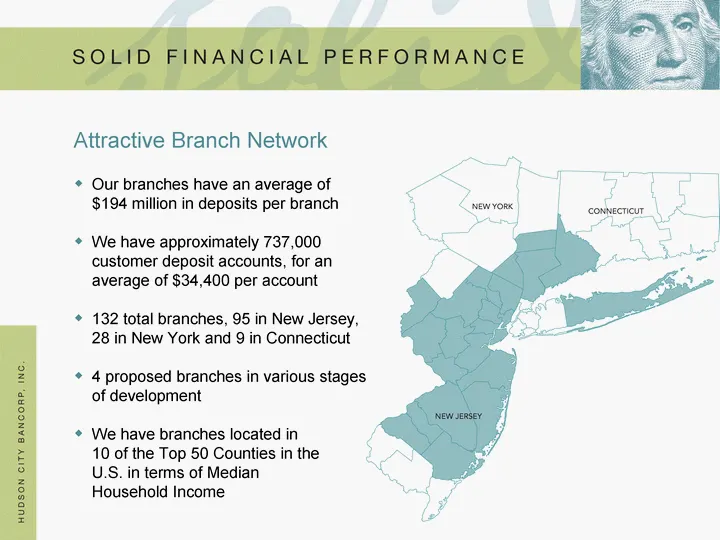
Attractive Branch Network Our branches have an average of $194 million in deposits per branch We have approximately 737,000 customer deposit accounts, for an average of $34,400 per account 132 total branches, 95 in New Jersey, 28 in New York and 9 in Connecticut 4 proposed branches in various stages
Slide 24: Growth in Desirable Markets
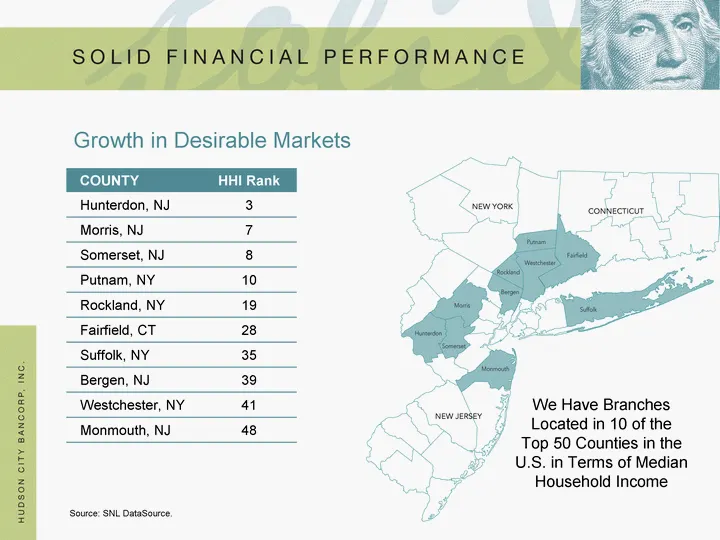
Growth in Desirable Markets COUNTY HHI Rank Hunterdon, NJ 3 Morris, NJ 7 Somerset, NJ 8 Putnam, NY 10 Rockland, NY 19 Fairfield, CT 28 Suffolk, NY 35 Bergen, NJ 39 Westchester, NY 41 Monmouth, NJ 48 Source: SNL DataSource. We Have Branches Located in 10 of the Top 50 Counties in the U.S. in Terms of
Slide 25: Return on Equity - Capital Deployment
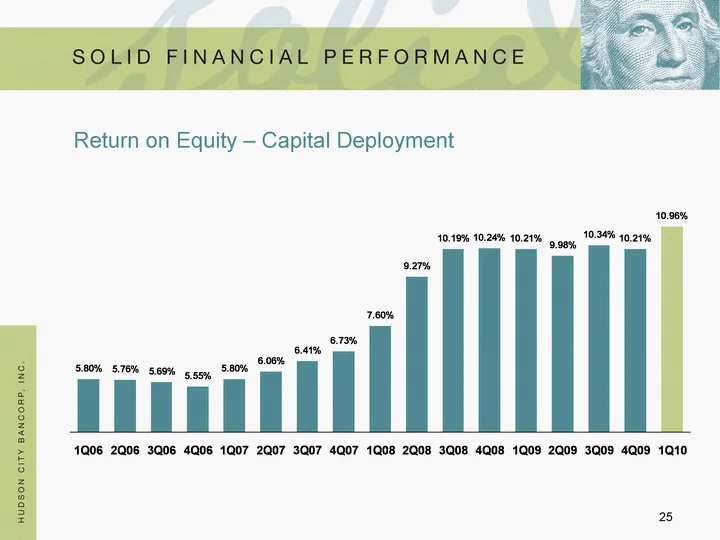
Return on Equity - Capital Deployment 1Q06 2Q06 3Q06 4Q06 1Q07 2Q07 3Q07 4Q07 1Q08 2Q08 3Q08 4Q08 1Q09 2Q09 3Q09 4Q09 1Q10 ROE 0.058 0.0576 0.0569 0.0555 0.058 0.0606 0.0641 0.0673 0.076 0.0927 0.1019 0.1024 0.1021 0.0998 0.1034 0.1021 0.1096
Slide 26: Dividends
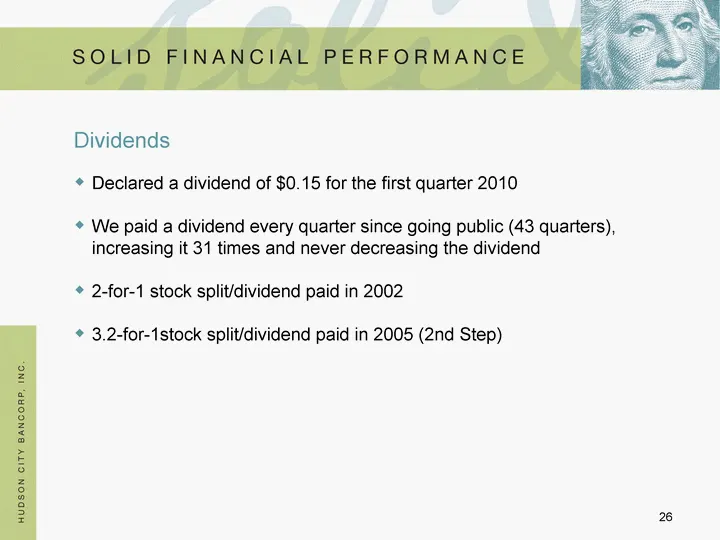
Dividends Declared a dividend of $0.15 for the first quarter 2010 We paid a dividend every quarter since going public (43 quarters), increasing it 31 times and never decreasing the dividend 2-for-1 stock split/dividend paid in 2002 3.2-for-1stock split/dividend paid in 2005 (2nd Step)
Slide 27: Stock Repurchased and Stockholder Dividends
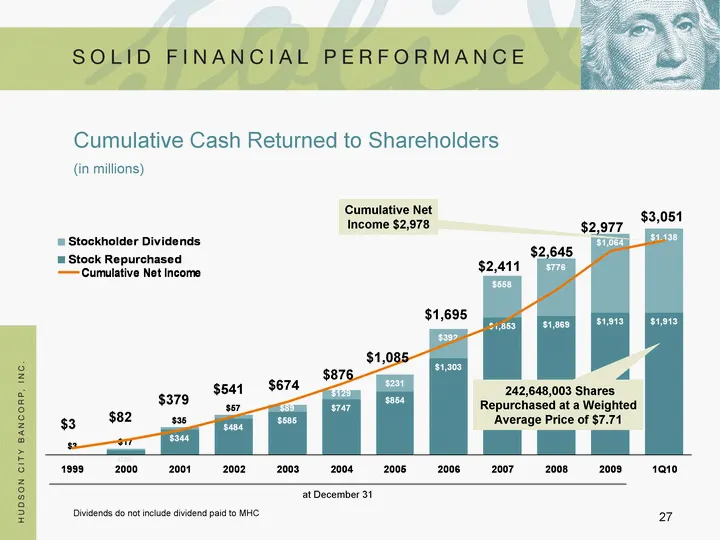
Stock Repurchased Stockholder Dividends 1999 - 2717585 2717585 2000 65456281 16949978 82406259 2001 343914660 34686477 378601137 2002 484087909 56901550 540989459 2003 585145110 88788718 673933828 2004 746807170 129270718 876077888 2005 854306200 231373718 1085679918 2006 1303000000 392000000 169500
Slide 28: Cumulative return on IPO share purchase
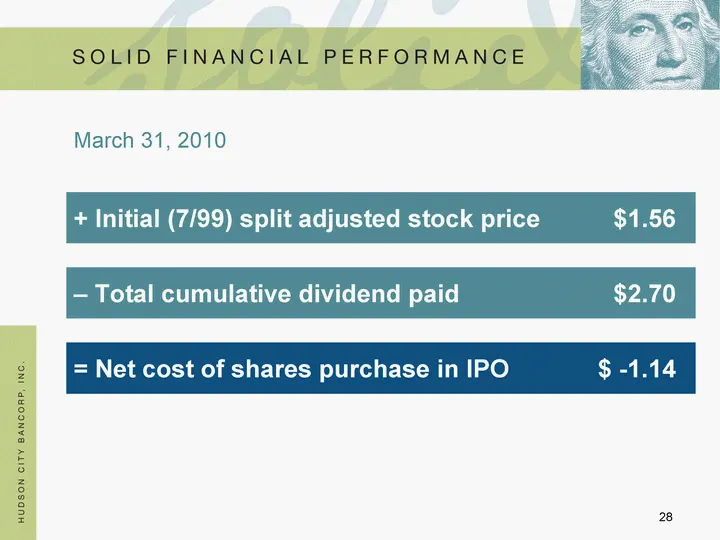
+ Initial (7/99) split adjusted stock price $1.56 - - Total cumulative dividend paid $2.70 = Net cost of shares purchase in IPO $ -1.14 March 31, 2010
Slide 29: Quarterly Comparison
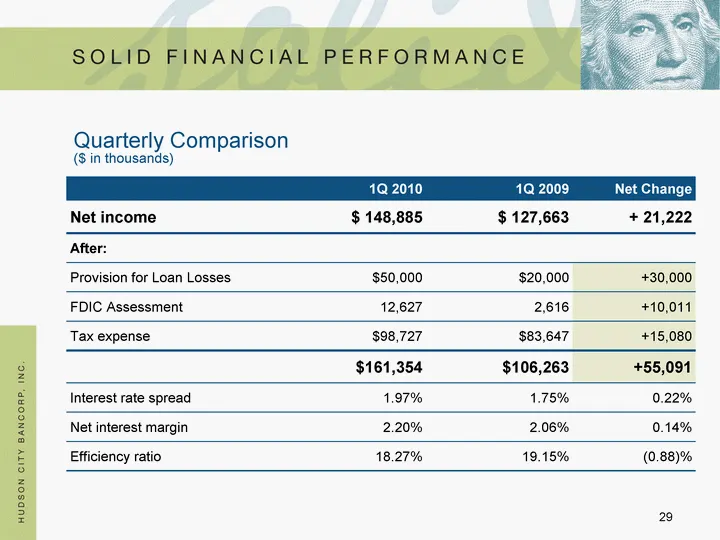
Quarterly Comparison 1Q 2010 1Q 2009 Net Change Net income $ 148,885 $ 127,663 + 21,222 After: Provision for Loan Losses $50,000 $20,000 +30,000 FDIC Assessment 12,627 2,616 +10,011 Tax expense $98,727 $83,647 +15,080 $161,354 $106,263 +55,091 Interest rate spread 1.97% 1.75% 0.22% Net interest marg
Slide 30: Industry-Leading Operational Efficiency
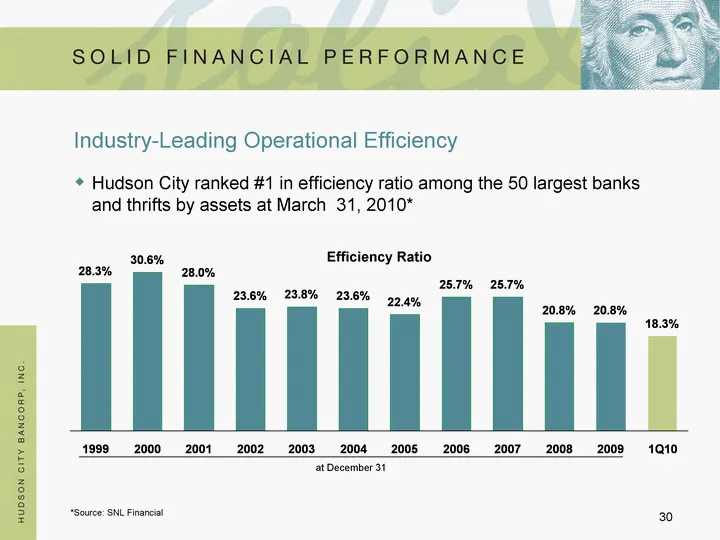
*Source: SNL Financial Industry-Leading Operational Efficiency Hudson City ranked #1 in efficiency ratio among the 50 largest banks and thrifts by assets at March 31, 2010* Efficiency Ratio 1999 0.283 2000 0.3055 2001 0.2804 2002 0.236 2003 0.2381 2004 0.236 2005 0.224 2006 0.257 2007 0.257 2008 0.2
Slide 31: Expense Discipline
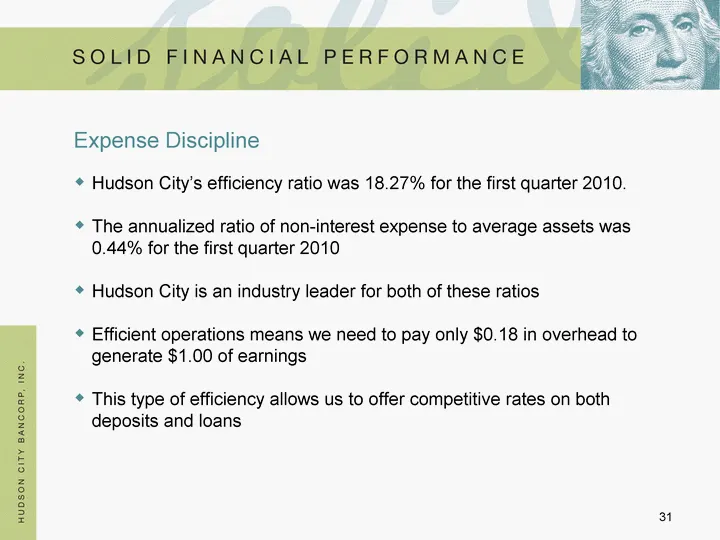
Expense Discipline Hudson City's efficiency ratio was 18.27% for the first quarter 2010. The annualized ratio of non-interest expense to average assets was 0.44% for the first quarter 2010 Hudson City is an industry leader for both of these ratios Efficient operations means we need to pay only $0.18
Slide 32: Winning Formula
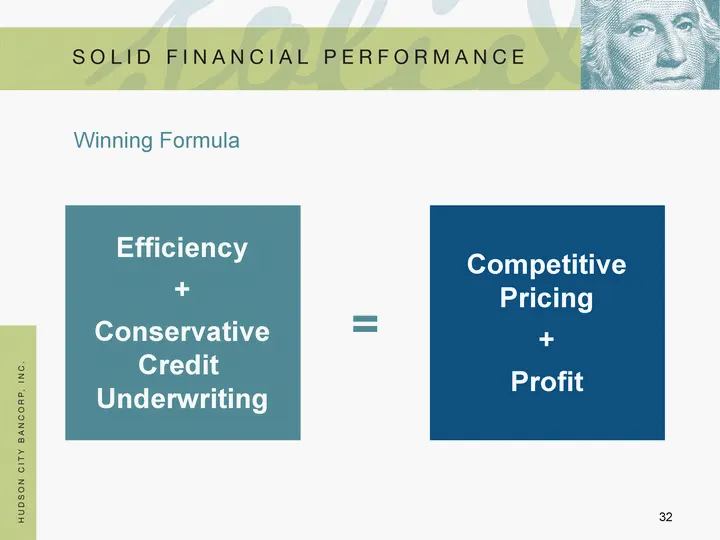
Efficiency + Conservative Credit Underwriting Competitive Pricing + Profit Winning Formula =
Slide 33: HCBK Ownership Breakdown
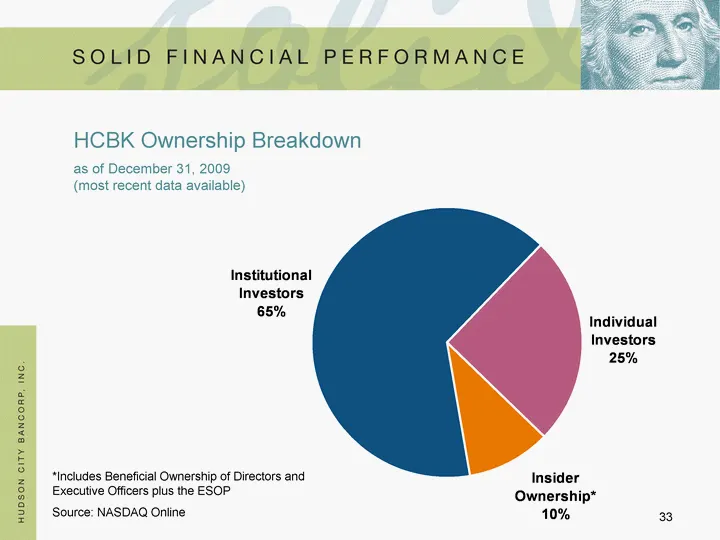
HCBK Ownership Breakdown as of December 31, 2009 (most recent data available) *Includes Beneficial Ownership of Directors and Executive Officers plus the ESOP Source: NASDAQ Online Institutional Investors Individual Investors Insider Ownership* 0.65 0.25 0.1
Slide 34: Positioned for a Rising Interest Rate Environment
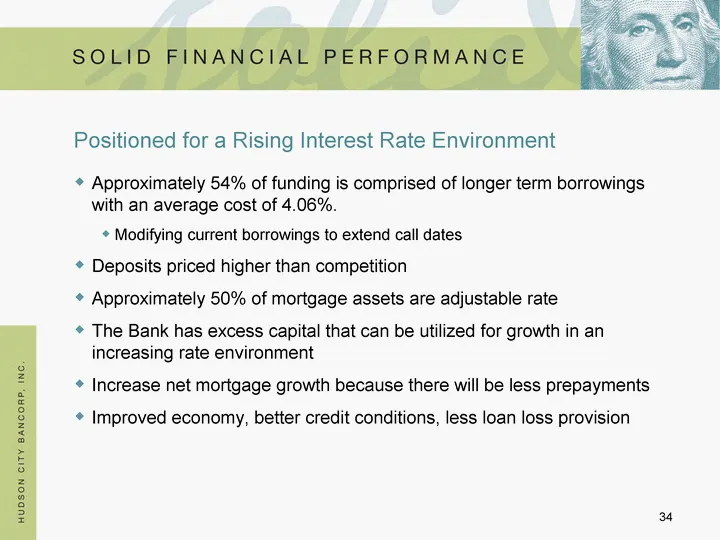
Positioned for a Rising Interest Rate Environment Approximately 54% of funding is comprised of longer term borrowings with an average cost of 4.06%. Modifying current borrowings to extend call dates Deposits priced higher than competition Approximately 50% of mortgage assets are adjustable rate The
Slide 35: Total Assets, Market Capitalization and Total Deposits Rankings
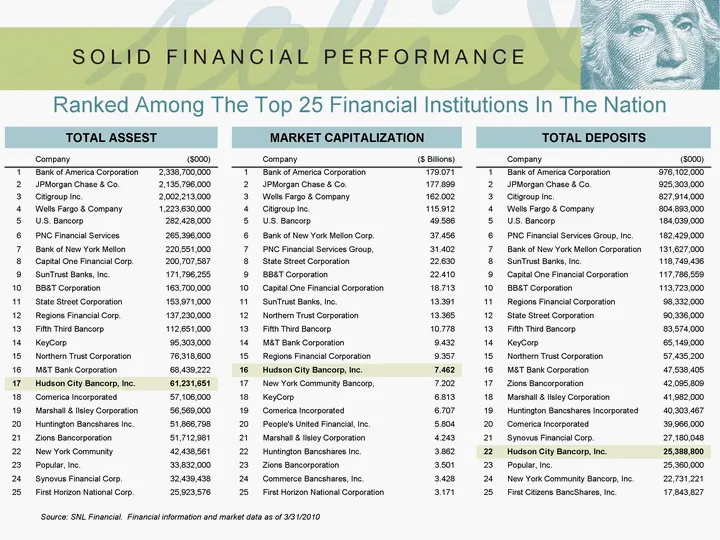
TOTAL ASSEST TOTAL ASSEST TOTAL ASSEST MARKET CAPITALIZATION MARKET CAPITALIZATION MARKET CAPITALIZATION TOTAL DEPOSITS TOTAL DEPOSITS TOTAL DEPOSITS Company ($000) Company ($ Billions) Company ($000) 1 Bank of America Corporation 2,338,700,000 1 Bank of America Corporation 179.071 1 Bank of America
Slide 36: Shelf Registration
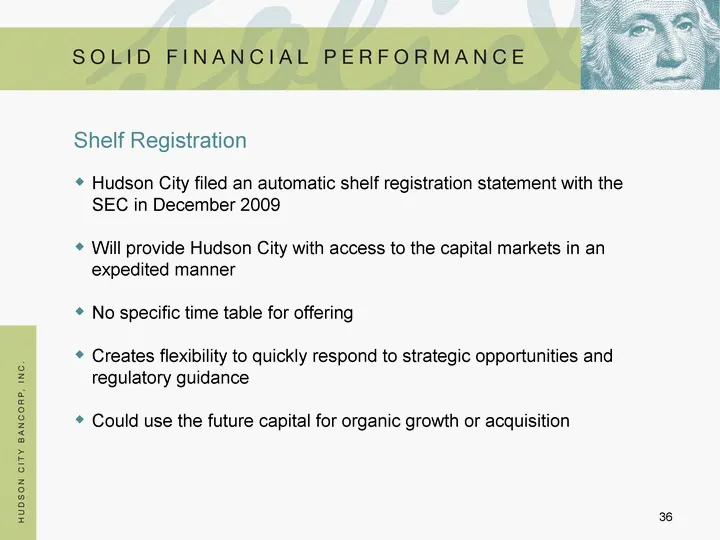
Shelf Registration Hudson City filed an automatic shelf registration statement with the SEC in December 2009 Will provide Hudson City with access to the capital markets in an expedited manner No specific time table for offering Creates flexibility to quickly respond to strategic opportunities and re

Slide 37: Among the Best-Managed Banks in America
saw SOLID FINANCIAL PERFORMANCE i Z aj Among the Best-Managed America Banks in
Slide 38: 2010 Bank and Thrift Conference Sponsored by Janney Capital Markets
2010 Bank and Thrift Conference Sponsored by Janney Capital Markets May 13, 2010
Source: SEC EDGAR · 8-K filed May 13, 2010
More decks from Hudson City Bancorp Inc
 Citigroup 2013 US Financial Services Conference30 slides · Mar 6, 2013
 BancAnalysts Association of Boston Conference 201229 slides · Nov 2, 2012
 Barclays Global Financial Services Conference 201234 slides · Sep 10, 2012
 Merger or Acquisition (August 2012)32 slides · Aug 27, 2012
 Shareholder Meeting (April 2012)20 slides · Apr 25, 2012
 Shareholder Meeting (April 2011)38 slides · Apr 19, 2011