Bankunited Financial — Investor Presentation (November 2006)
38 slides from Bankunited Financial's investor presentation, Nov 2, 2006

Slide 1: BankUnited Financial Corporation Investor Presentation November 2006
BankUnited Financial Corporation Investor Presentation November 2006 Exhibit 99.1

Slide 2: Forward Looking Information
Forward Looking Information This presentation contains certain forward looking statements which are based on management’s expectations regarding factors that may impact the Company's strategic initiatives, and economic outlook. Such forward-looking statements are based on current plans and expectati
Slide 3: BankUnited's Strategy
BankUnited's Strategy Build successful Florida community bank complemented by a national residential lending business anchored in Florida With key emphasis on High quality credit culture Customer service Local delivery Experienced and trained managers
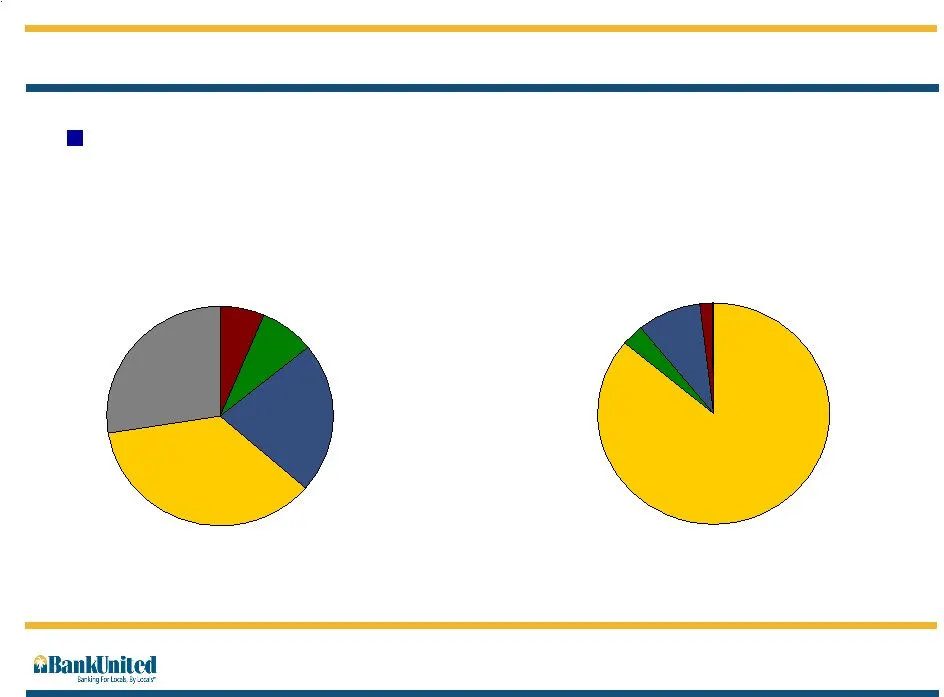
Slide 4: Loan & Deposit Portfolio at September 30, 2006
Retail CDs 36.2% Non Interest Demand Deposits 6.5% Savings Accounts 22.1% Jumbo CDs 27.5% Transaction Accounts / MMA 7.7% Deposit Portfolio Loan & Deposit Portfolio at September 30, 2006 Commercial 1.7% 1-4 Family 86.0% Commercial R.E. 9.0% Consumer 0.2% Home equity and lines of credit 3.1% Loan Por

Slide 5: Deep and Experienced Management Team
Deep and Experienced Management Team EVP Wealth Management Average years of banking experience in the Florida market EVP Commercial Real Estate EVP Bank Services EVP Corporate Real Estate Services EVP Human Resources EVP and General Auditor EVP Corporate and Commercial Banking EVP Residential Lendin

Slide 6: A Local Florida Bank
A Local Florida Bank
Slide 7: The Florida Market: Population Growth and Jobs
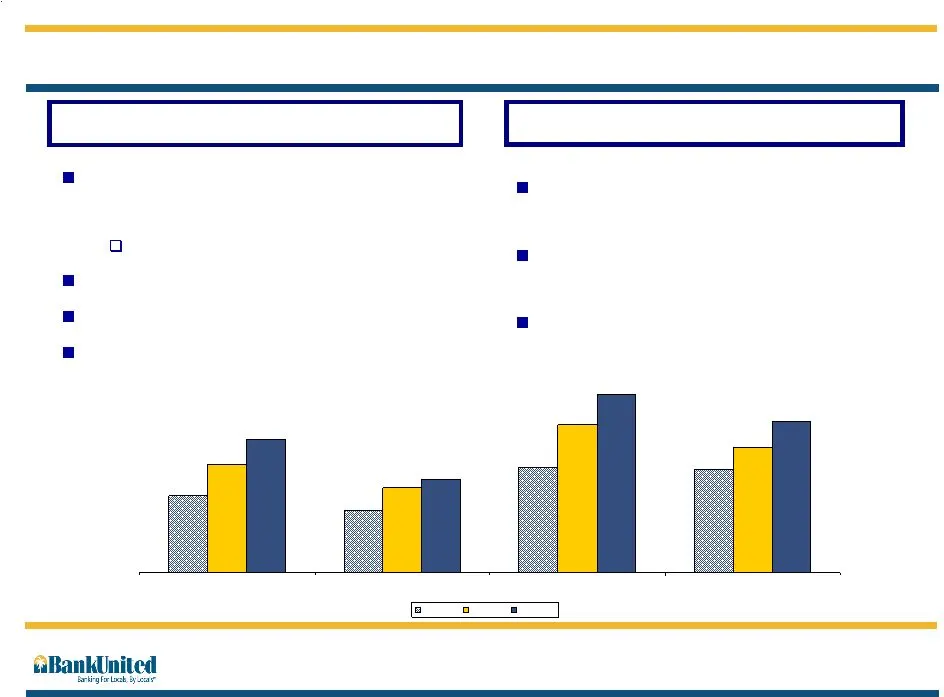
The Florida Market: Population Growth and Jobs Population th largest state in the U.S. (18 million people) The population within BankUnited's footprint is comparable to the th largest state in the U.S. >8 million people - 46% of the state’s total Population growth projected to reach 29 million by 20
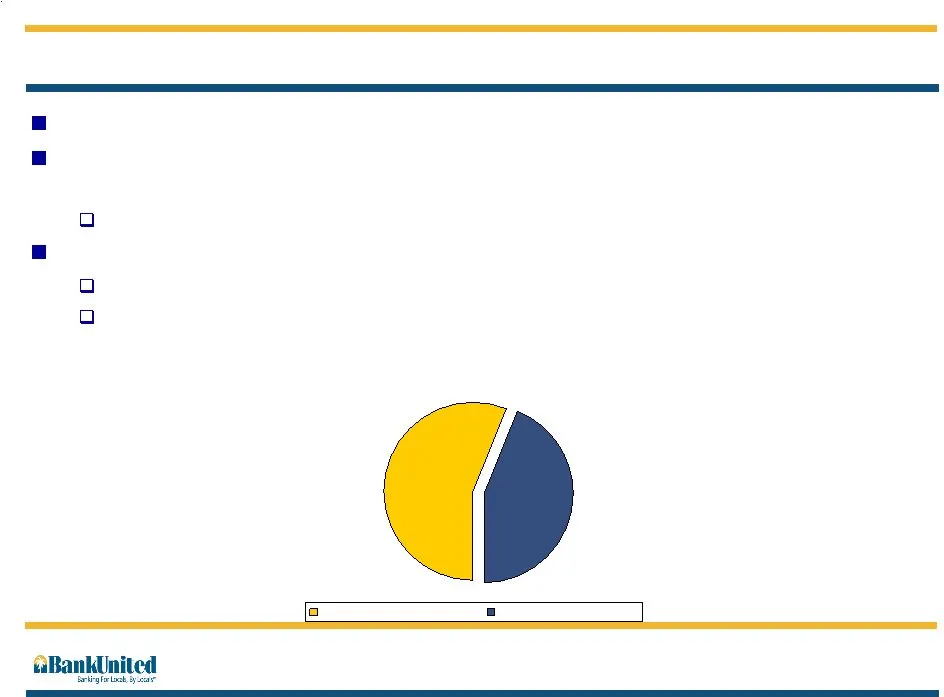
Slide 8: The Florida Market: Large & Growing Deposit Base
The Florida Market: Large & Growing Deposit Base $343 billion deposit base - 6% of the U.S. total BankUnited's footprint contains $191 billion of deposits or 56% of the Florida total >$60,000 in deposits per household Market share growth opportunity BankUnited is ranked th in Florida, th in its mark
Slide 9: Florida Branch Map
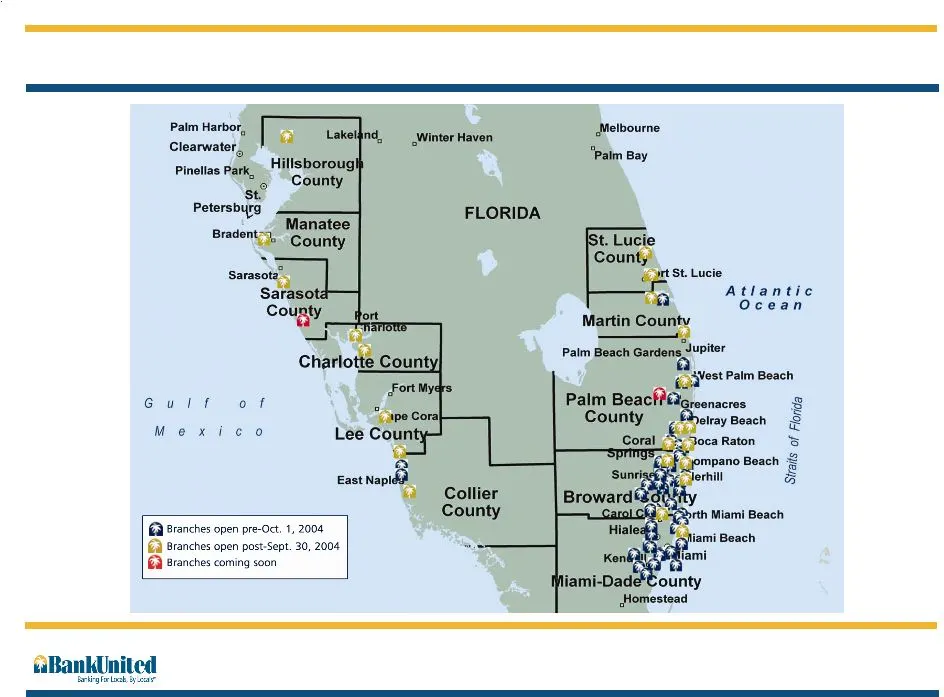
Melbourne "Palm Bay nd, _Winter Haven Palm Harbor, ms Clearwater, Hillsboroug} Pinellas P nla Fa County ‘St. Petersburg FLORIDA bradent-q, Manatee *» County Sarasota - Sarasot Atlantic County Martin County eile Palm Beach Gardens Jupiter (lest Paim Beach Guth of Palm Beact? deena County elray Beach
Slide 10: Micro-market Retail Strategy
Micro-market Retail Strategy Select geographic micro-markets based on demographics and customer preferences Products tailored to each market Local marketing and community involvement High-touch interaction with customers Localized decision making Customer Service Continue to expand branch franchise
Slide 11: Core Deposit Growth
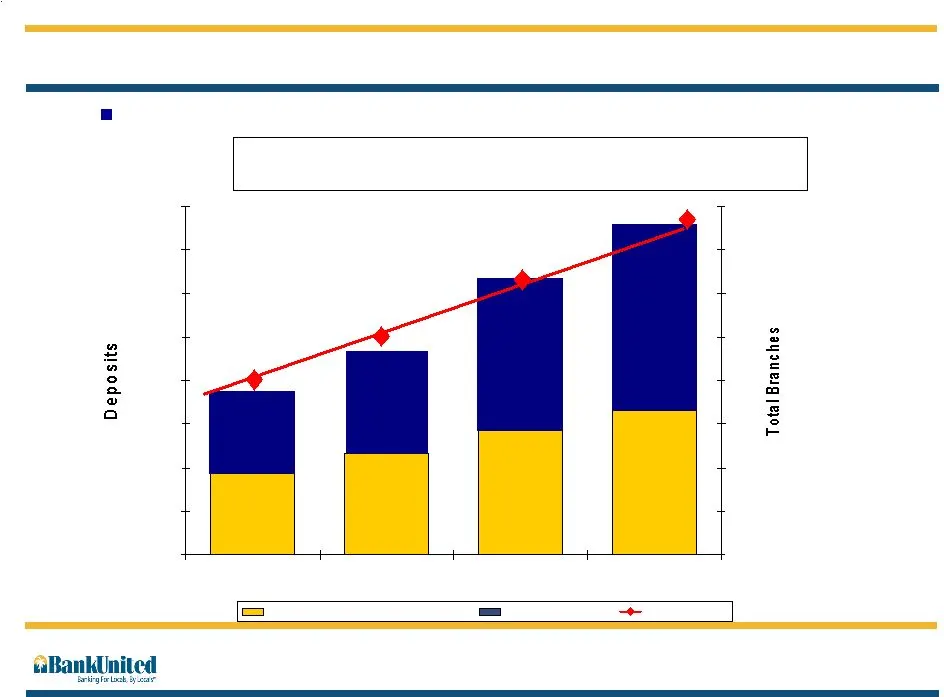
$2,496 $2,796 $3,521 $4,403 $2,204 $1,429 $1,659 $1,934 $500 $1,000 $1,500 $2,000 $2,500 $3,000 $3,500 $4,000 $4,500 FY 03 FY 04 FY 05 FY06 Core Deposit Growth Dollars in Millions Branch expansion focused on target customer base to attract core deposits 52% Growth in Checking, Savings, and Money Mar
Slide 12: Loan Production Mix
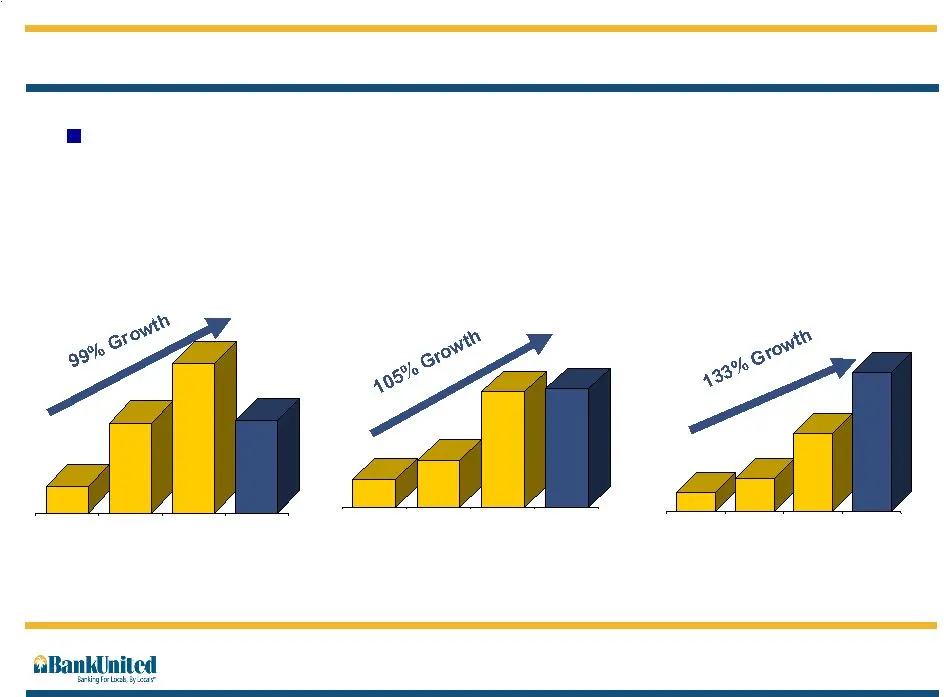
$5,880 $304 $670 Loan Production Mix Dollars in Millions The growth rate of commercial and consumer loan production has outpaced mortgage loan production. Mortgage Loans Commercial Loans (1) Consumer Loans ( 1) Includes commercial & commercial R.E. loans Fiscal year end: September 30th $2,522 $2,912
Slide 13: Commercial & Commercial Real Estate Strategy
Commercial & Commercial Real Estate Strategy Build full service banking relationships Use our local decision making and local knowledge to outmaneuver the out of state banks Use product selection, service and asset size to outmaneuver the local banks Experienced local lenders Credit Quality as guidi
Slide 14: Commercial Banking Landscape
Commercial Banking Landscape Expanding our commercial banking market north into Broward and Palm Beach counties Recently hired lending team in Palm Beach County Benefit from current market conditions Steady commercial industrial growth by attracting business from other financial institutions — Local
Slide 15: Commercial Banking Relationships
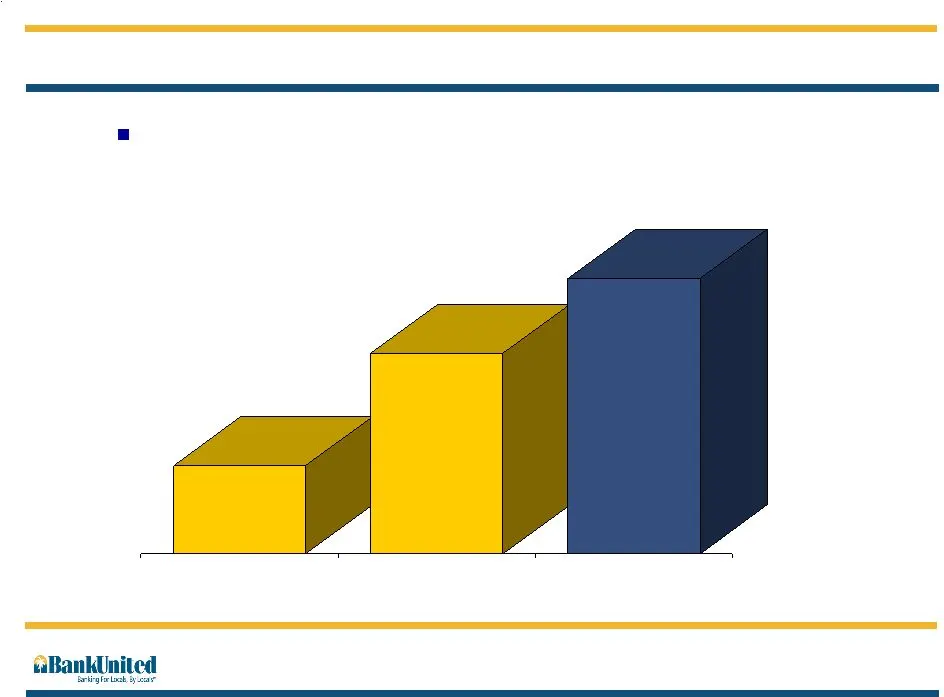
227 Commercial Banking Relationships FY 03 FY 05 FY06 Enhancing and developing commercial banking relationships Fiscal year end: September 30th
Slide 16: Commercial Banking Loan Balances
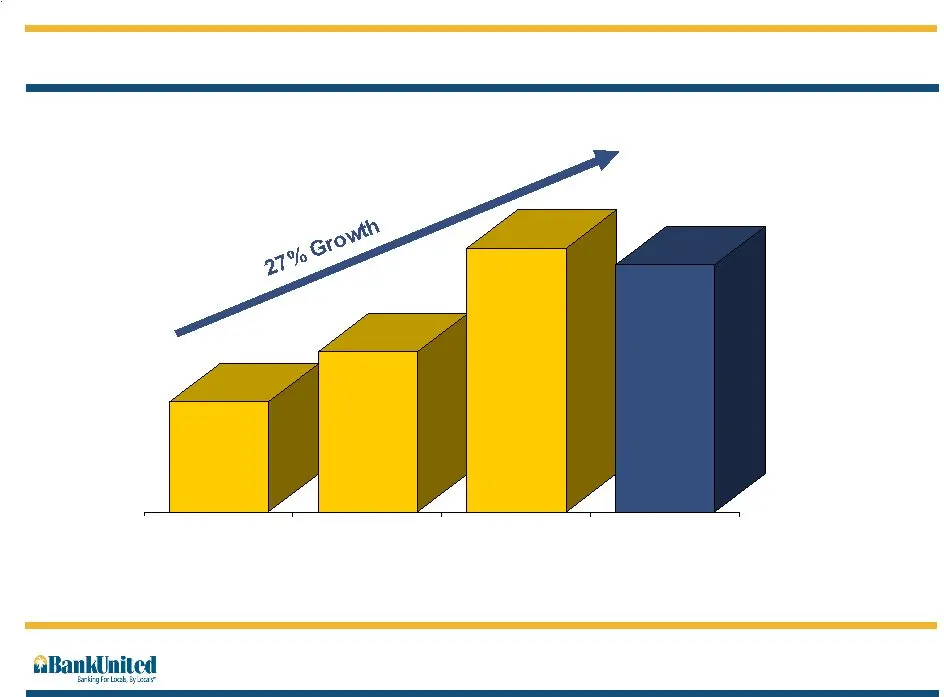
$194 Commercial Banking Loan Balances Dollars in Millions $153 $168 $199 FY 03 FY 04 FY 05 FY06 Commercial Portfolio Balance Fiscal year end: September 30th
Slide 17: Commercial Real Estate Landscape
Commercial Real Estate Landscape Expansion of CRE Team Recently hired lending team in Palm Beach, Collier and Sarasota County Minimal Condo Lending Exposure Benefit from strong local market Warehouses Shopping Centers Offices
Slide 18: Commercial Real Estate Loan Balances
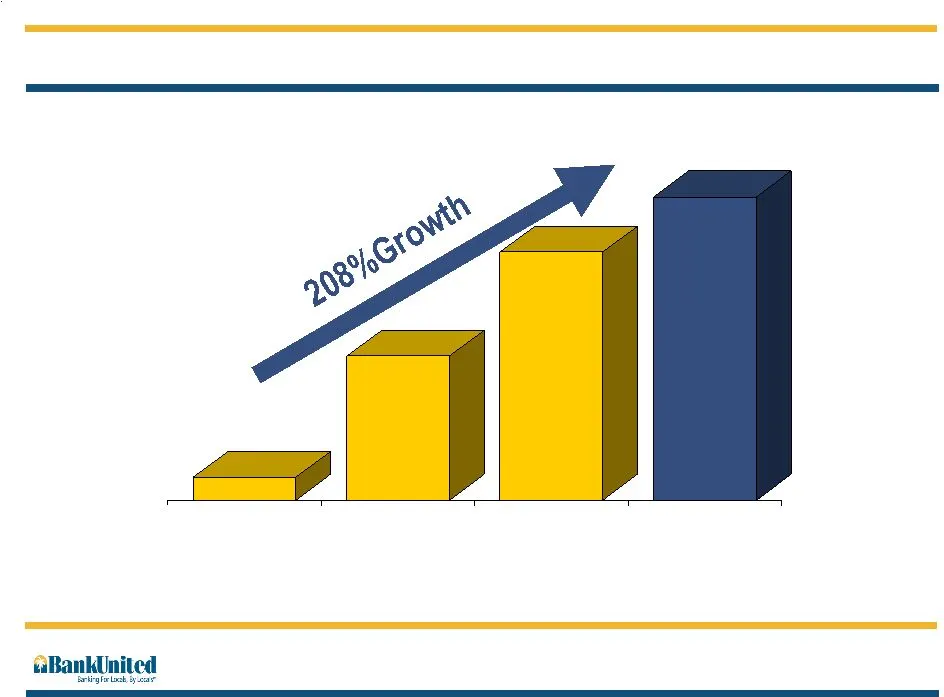
$1,200 Commercial Real Estate Loan Balances $389 $600 $779 FY 03 FY 04 FY 05 FY06 Dollars in Millions Fiscal year end: September 30
Slide 19: Non-residential Portfolio Asset Quality
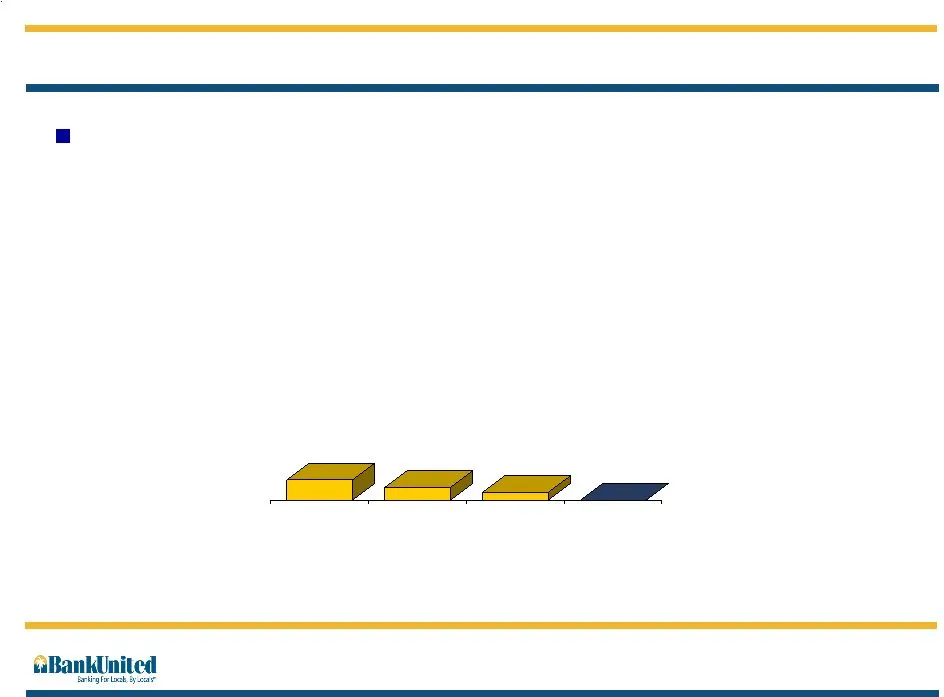
Non-residential Portfolio Asset Quality Growth in the non-residential portfolio achieved while consistently improving asset quality 0.08% 0.05% 0.03% 0.00% FY 03 FY 04 FY 05 FY06 Net Charge-offs / Average Loans Fiscal year end: September 30

Slide 20: Residential Lending
Residential Lending
Slide 21: Residential Loan Portfolio Mix
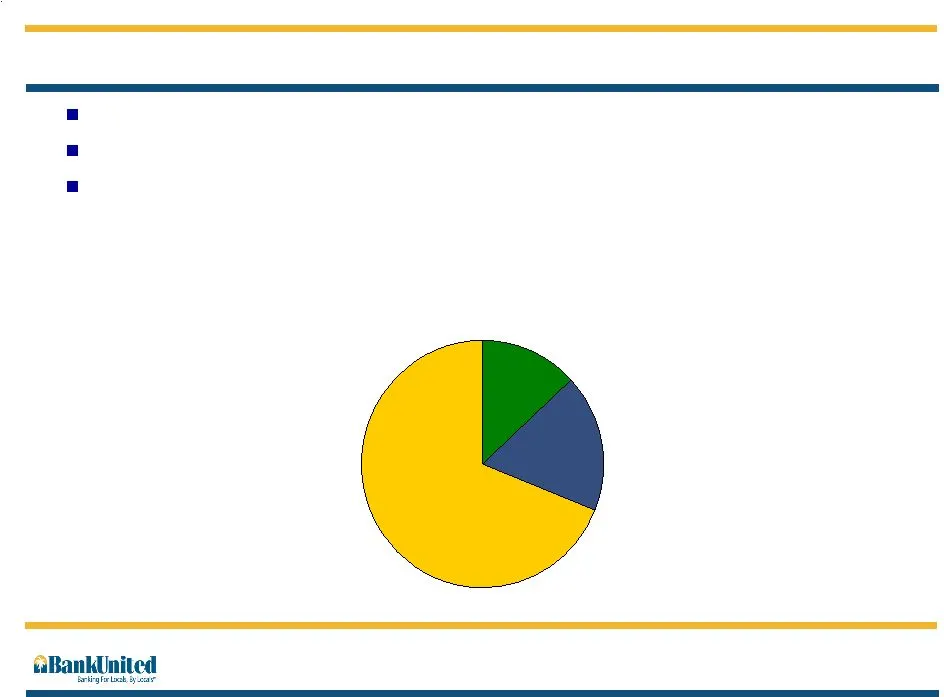
Residential Loan Portfolio Mix Fixed Rate Loans 13% Traditional ARM 18% MTA Option ARMs 69% Total Residential Loans (at 9/30/2006) Originations primarily for portfolio $9.7 billion of residential loans outstanding MTA Option ARMs = 68.9% of the residential portfolio and 58.0% of total loans Fiscal y
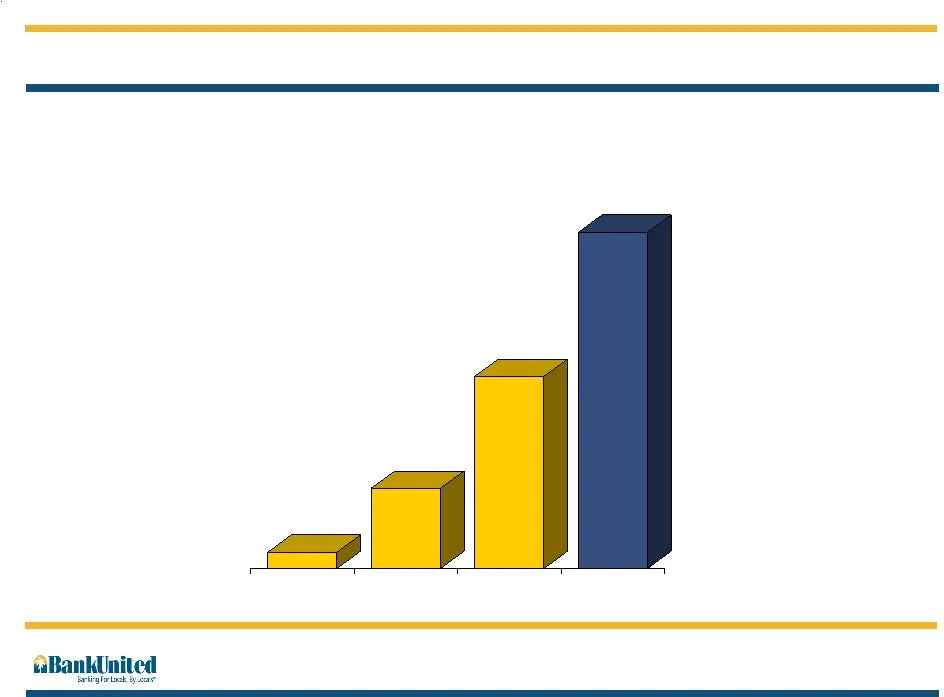
Slide 22: MTA Option ARM Loan Balances
$6,652 $319 $1,586 $3,801 FY 03 FY 04 FY 05 FY06 Monthly Adjustable MTA Loan Balances MTA Option ARM Loan Balances Fiscal year end: September 30
Slide 23: MTA Option ARM Product Description
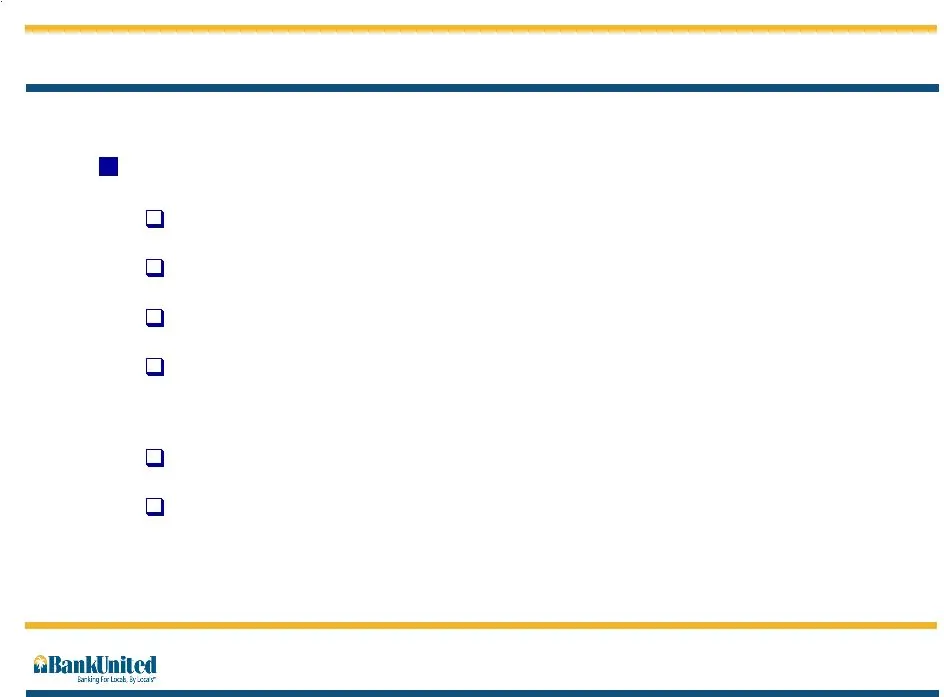
MTA Option ARM Product Description Characteristics of BankUnited’s Option ARM Underwriting is performed at the fully-indexed rate Indexed to last 12-month’s 1 year CMT Prepayment fees Negative amortization limited to a maximum of 115% of the original principal balance 5 year re-cast No piggybacking
Slide 24: Who is BankUnited's Option ARM Customer?
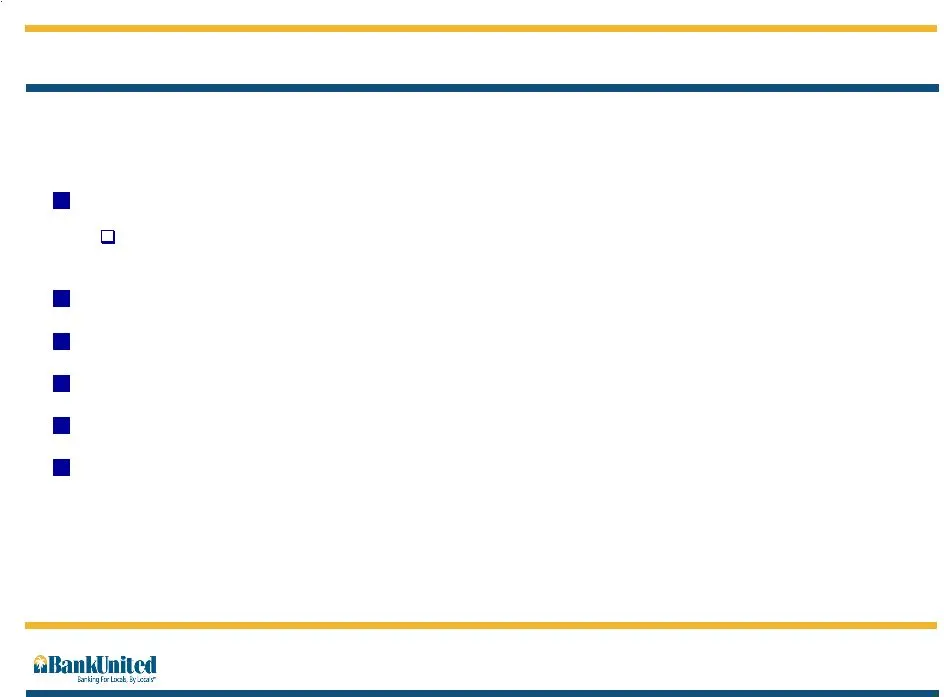
Who is BankUnited’s Option ARM Customer? Average Loan-to-Value (LTV) ratio of 73% at initiation (1) No piggybacking (this means the additional 27% of the loan value is not financed by BankUnited) Average FICO score > 710 No sub-prime loans Average size of loan $303,000 80% - family homes, 3% high ri
Slide 25: Underwriting Process
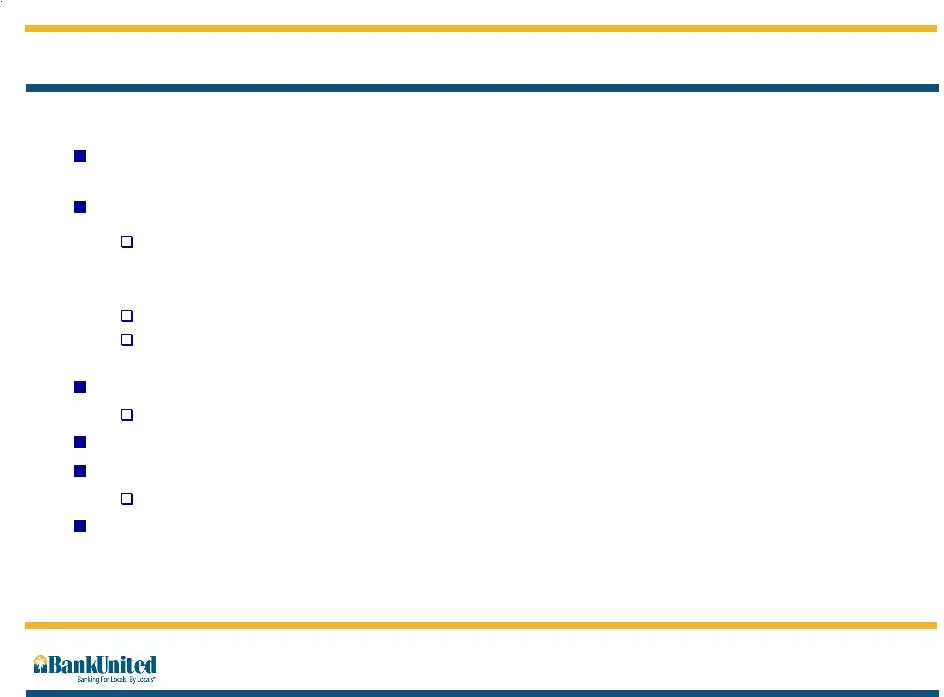
Underwriting Process BankUnited selects who to do business with based on internal guidelines led by credit quality Strict process from start to finish Only pre-approved brokers can submit loans — BankUnited Account Executive has account/broker limit — Internal due diligence is run on all brokers pri
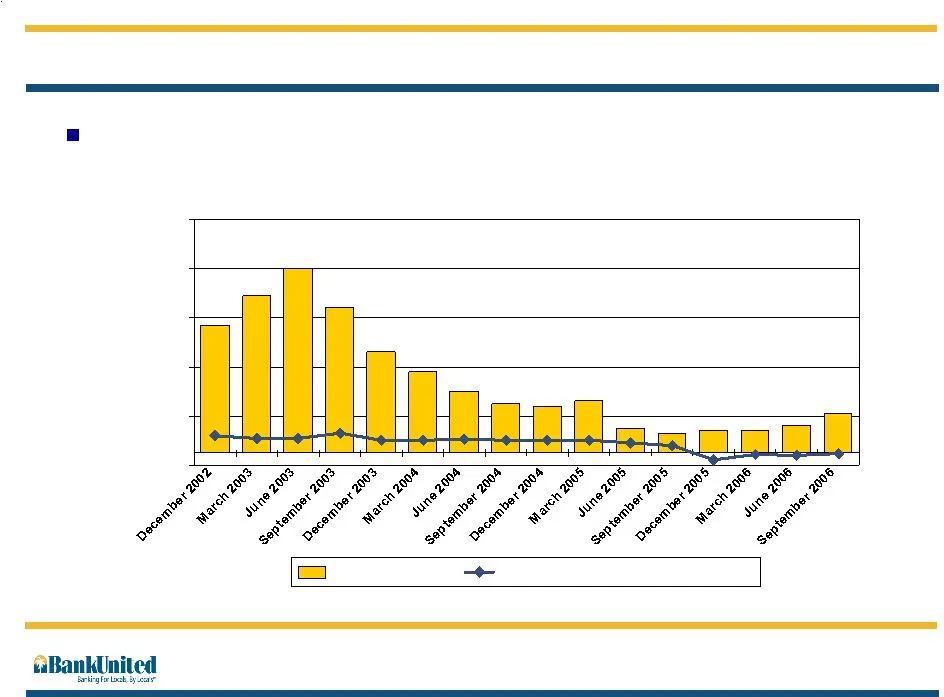
Slide 26: Asset Quality
Asset Quality -0.05% 0.15% 0.35% 0.55% 0.75% 0.95% NPA's/Assets YTD NCO's/YTD Avg Loans BankUnited has maintained asset quality while delivering strong loan growth Fiscal year end: September 30th
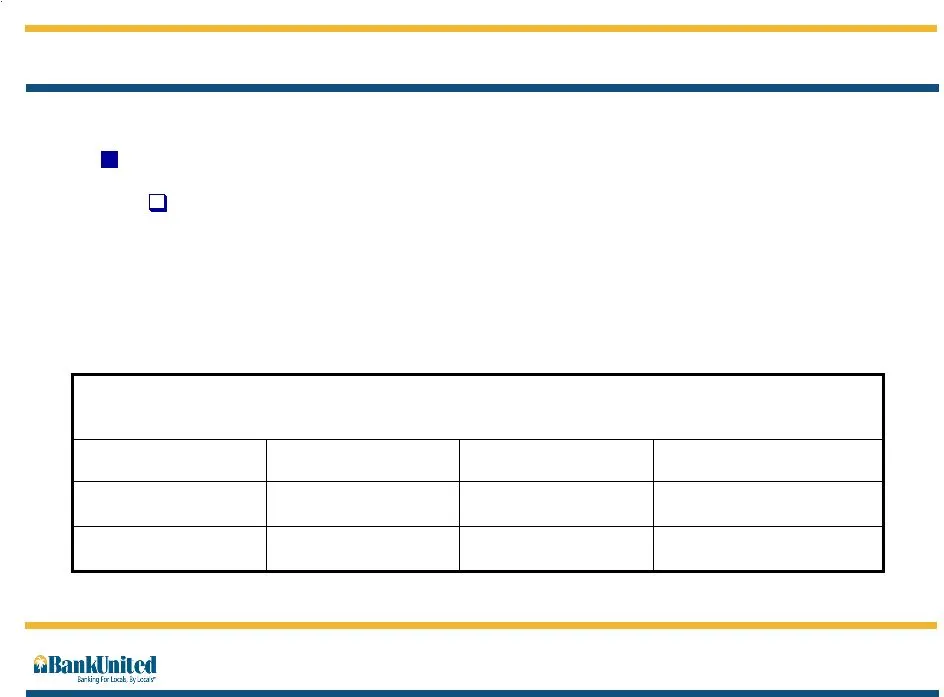
Slide 27: MTA Option ARM – Positives for Borrower
MTA Option ARM – Positives for Borrower Advantage over fixed rate loan is customer has flexibility Payment Options — Minimum payment — Interest only — Fully amortizing — Fully amortizing + additional principal Fully Amortizing Interest Only Minimum $686.45 $686.45 N/A N/A FIXED $609.42 $421.60 MTA*
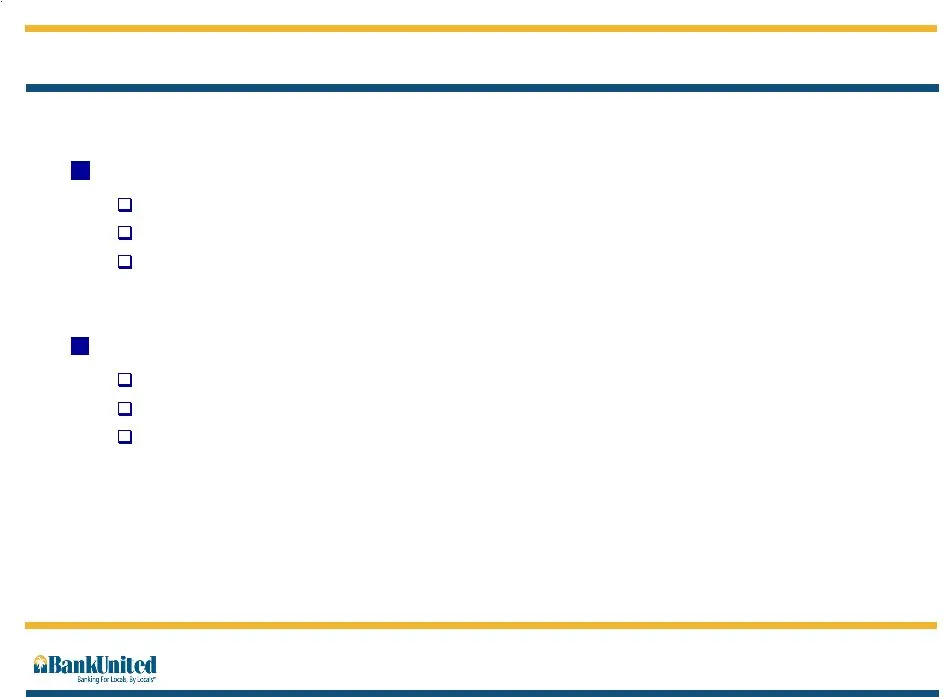
Slide 28: Negative Amortization
Negative Amortization MTA Option ARMs are designed to allow negative amortization (Negative amortization = Current Principal Balance – Original Principal Balance) For a borrower, this is similar to a home equity without the need to apply for another loan or to pay additional closing costs BankUnited
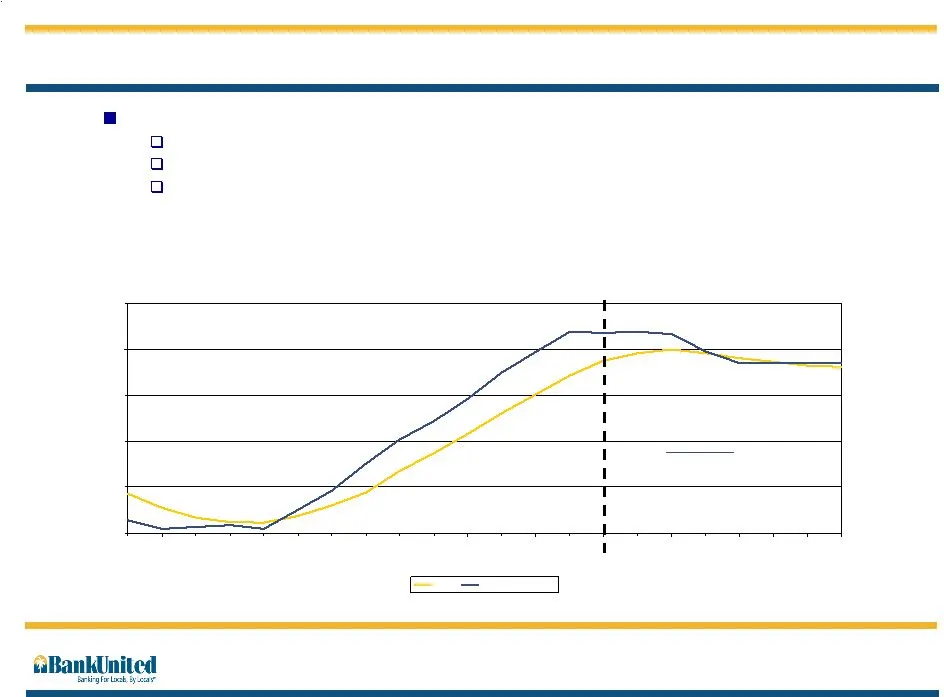
Slide 29: MTA Option ARM – Positives for Lender
MTA Option ARM – Positives for Lender Advantage over fixed rate loan Lender’s monthly revenue received adjusts with interest rates Prepayment fees protect against early payments Margin positively impacted — BankUnited’s MTA yield generally lags liability pricing as interest rates rise, margin should
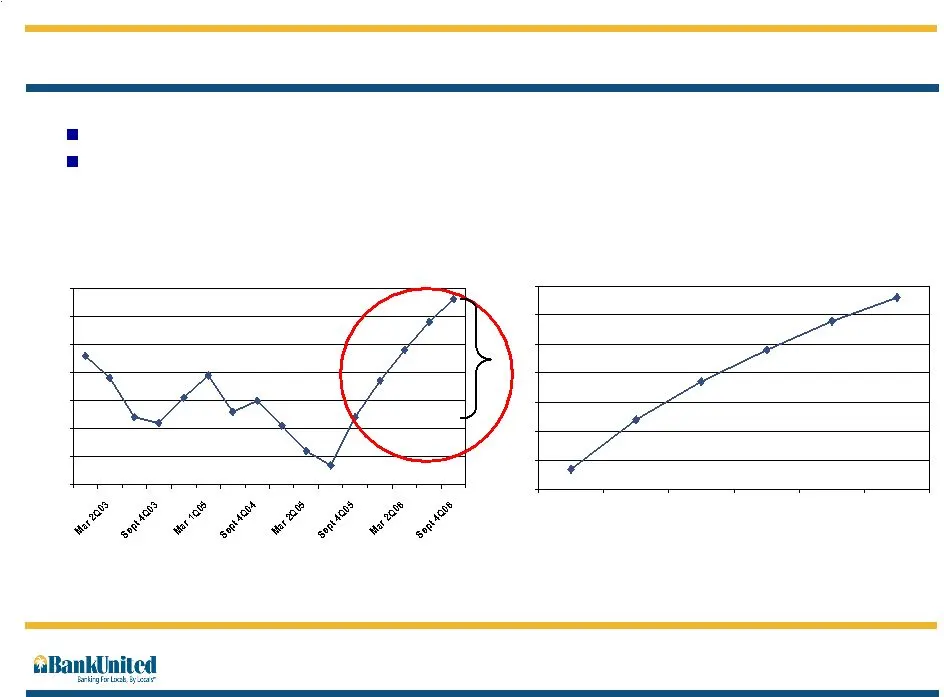
Slide 30: Net Interest Margin Expansion
Net Interest Margin Expansion 42 bps of net interest margin expansion from September 2005 to September MTA index lag and current CPR level should drive further NIM expansion if interest rates continue to moderate 1.60% 1.70% 1.80% 1.90% 2.00% 2.10% 2.20% 2.30% Jun 3Q05 Sep 4Q05 Dec 1Q06 Mar 2Q06 Jun

Slide 31: Financial Overview
Financial Overview
Slide 32: BankUnited
a Q a a «aBankUnited
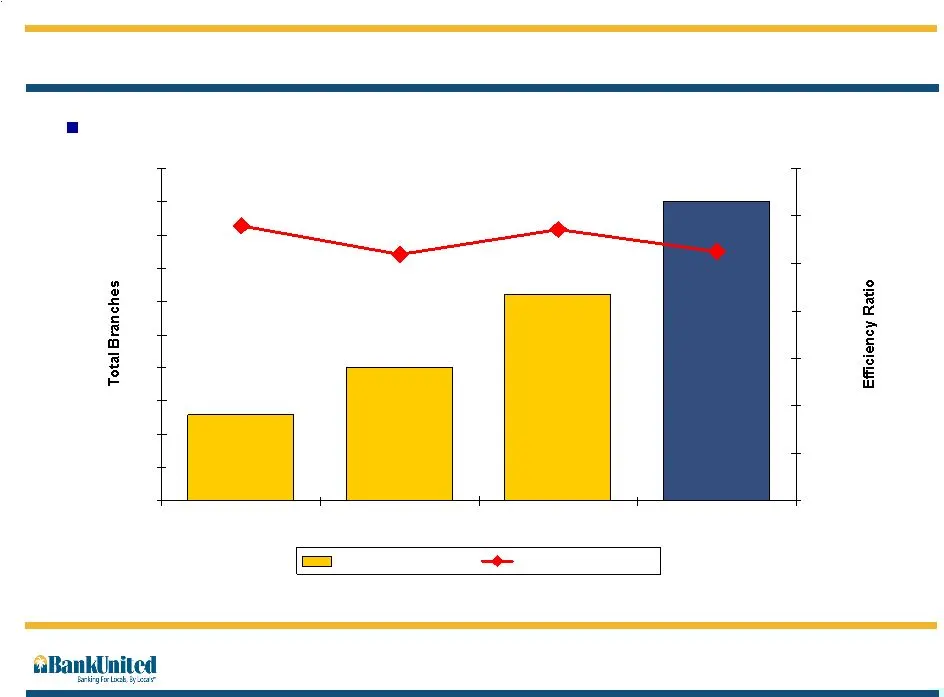
Slide 33: Efficiency Ratio and Total Branches
75 Branches 52.5% 61 Branches 50 Branches 43 Branches 57.1% 51.8% 58.0% FY 03 FY 04 FY 05 FYO6 0.0% 10.0% 20.0% 30.0% 40.0% 50.0% 60.0% 70.0% Total Branches Efficiency Ratio Efficiency Ratio Operating leverage on new branches should improve efficiency (1) (1) Excludes loss on extinguishment of high-
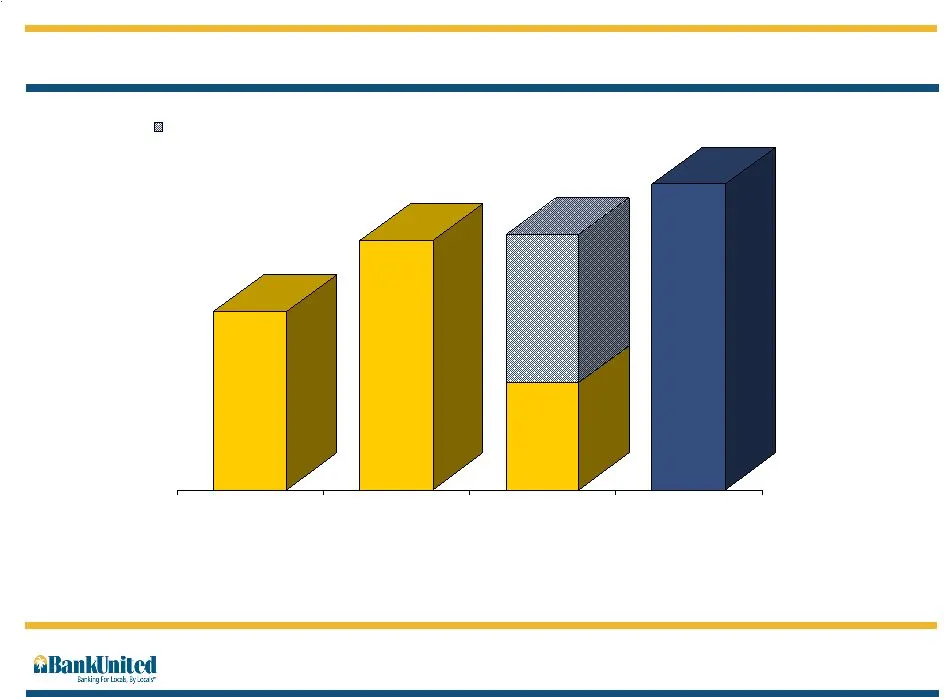
Slide 34: Net Income
$83.9 Net Income $39.1 $50.7 $27.5 $24.2 FY 03 FY 04 FY 05 FY06 Loss on Extinguishment of High-Rate Debt $51.7 Dollars in Millions Fiscal year end: September 30th
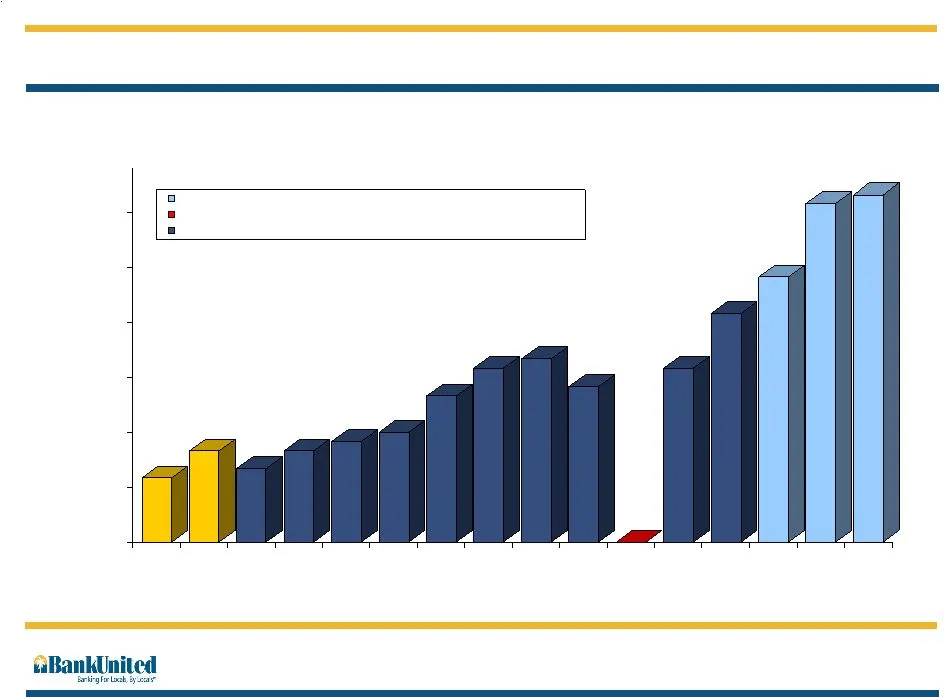
Slide 35: Earnings Per Share
$0.33 $0.35 $0.36 $0.37 $0.41 $0.44 $0.45 $0.42 $0.44 $0.50 Earnings Per Share $0.32 $0.35 -0.5 $0.54 $0.62 $0.63 $0.25 $0.31 $0.37 $0.43 $0.49 $0.55 $0.61 1Q03 2Q03 3Q03 4Q03 1Q04 2Q04 3Q04 4Q04 1Q05 2Q05 3Q05 4Q05 1Q06 2Q06 3Q06 4Q06 Post Secondary Offering January 2006, Issued 5,750,000 Shares at

Slide 36: Valuation
Valuation
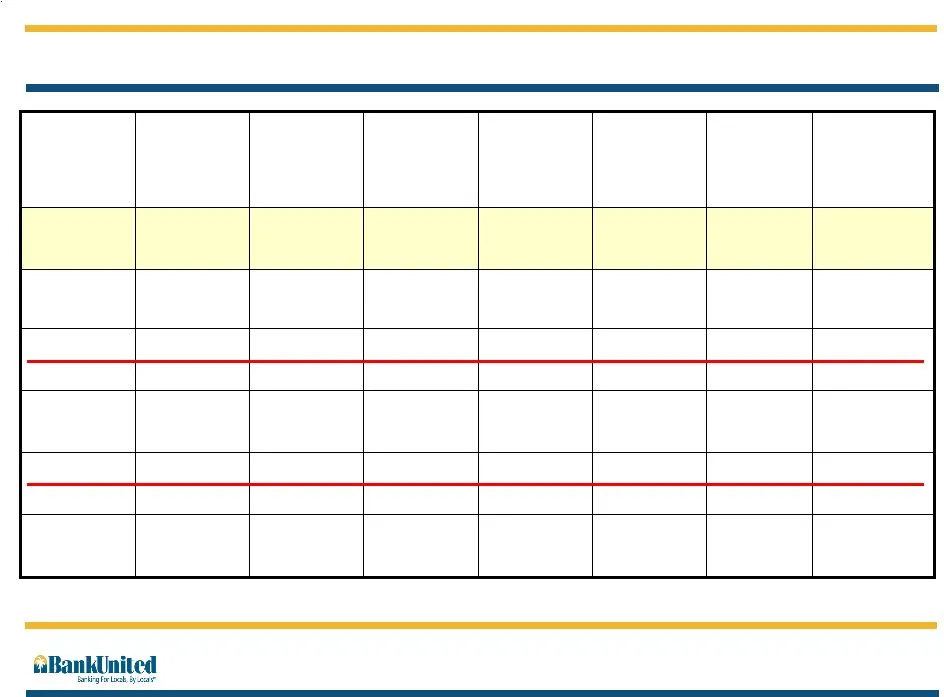
Slide 37: Florida Peer Group: Deposits and Valuation
Florida Peer Group: Deposits and Valuation 26.6x 3.5x $11.19 $39.67 $3.4 B $4.4 B FFFL 17.9x 3.9x $ 8.02 $26.02 $2.0 B $2.4 B SBCF 18.1x 19.1x 23.6x 9.6x Price/ Earnings (1) 2.9x $11.48 $33.67 $2.1 B $2.6 B CCBG 3.2x $14.32 $45.35 $2.3 B $3.3 B HARB 1.8x $7.22 $12.96 $3.7 B $6.6 B BBX 1.4x $19.60 $2

Slide 38: BankUnited Financial Corporation
BankUnited Financial Corporation Investor Presentation November 2006
Source: SEC EDGAR · 8-K filed Nov 2, 2006
More decks from Bankunited Financial Corp
 Q3 2008 Earnings Presentation16 slides · Aug 11, 2008
 Investor Presentation (June 2008)27 slides · Jun 4, 2008
 Q2 FY2008 Earnings Presentation25 slides · May 12, 2008
 Q1 FY2008 Earnings Presentation22 slides · Jan 24, 2008
 Investor Day (February 2007)88 slides · Feb 26, 2007
 Investor Presentation (September 2006)40 slides · Sep 8, 2006