Quadient SA · EURONEXT:QDT
Quadient SA — Neopost — FY2006 Earnings Presentation
40 slides from Quadient SA's earnings presentation, April 2007

Slide 1: 2006 Full Year Results
2006 FULL YEAR RESULTS March / April 2007
Slide 2: Disclaimer
DISCLAIMER Safe Harbour Statement This presentation contains forward-looking statements (made pursuant to the safe harbour provisions of the Private Securities Litigation Reform Act of 1995). By their nature, forward-looking statements involve risk and uncertainty. Forward-looking statements represe
Slide 3: Full Year 2006
FULL YEAR 2006 Highlights Full year accounts Market trends The Neopost model Outlook 3
Slide 4: 2006 Highlights
2006 HIGHLIGHTS 4
Slide 5: 2006 Highlights
2006 HIGHLIGHTS Record growth Continuing improvement in profitability New shareholder return policy implemented While pursuing our investment strategy to prepare for the future 5
Slide 6: Record Revenue Growth
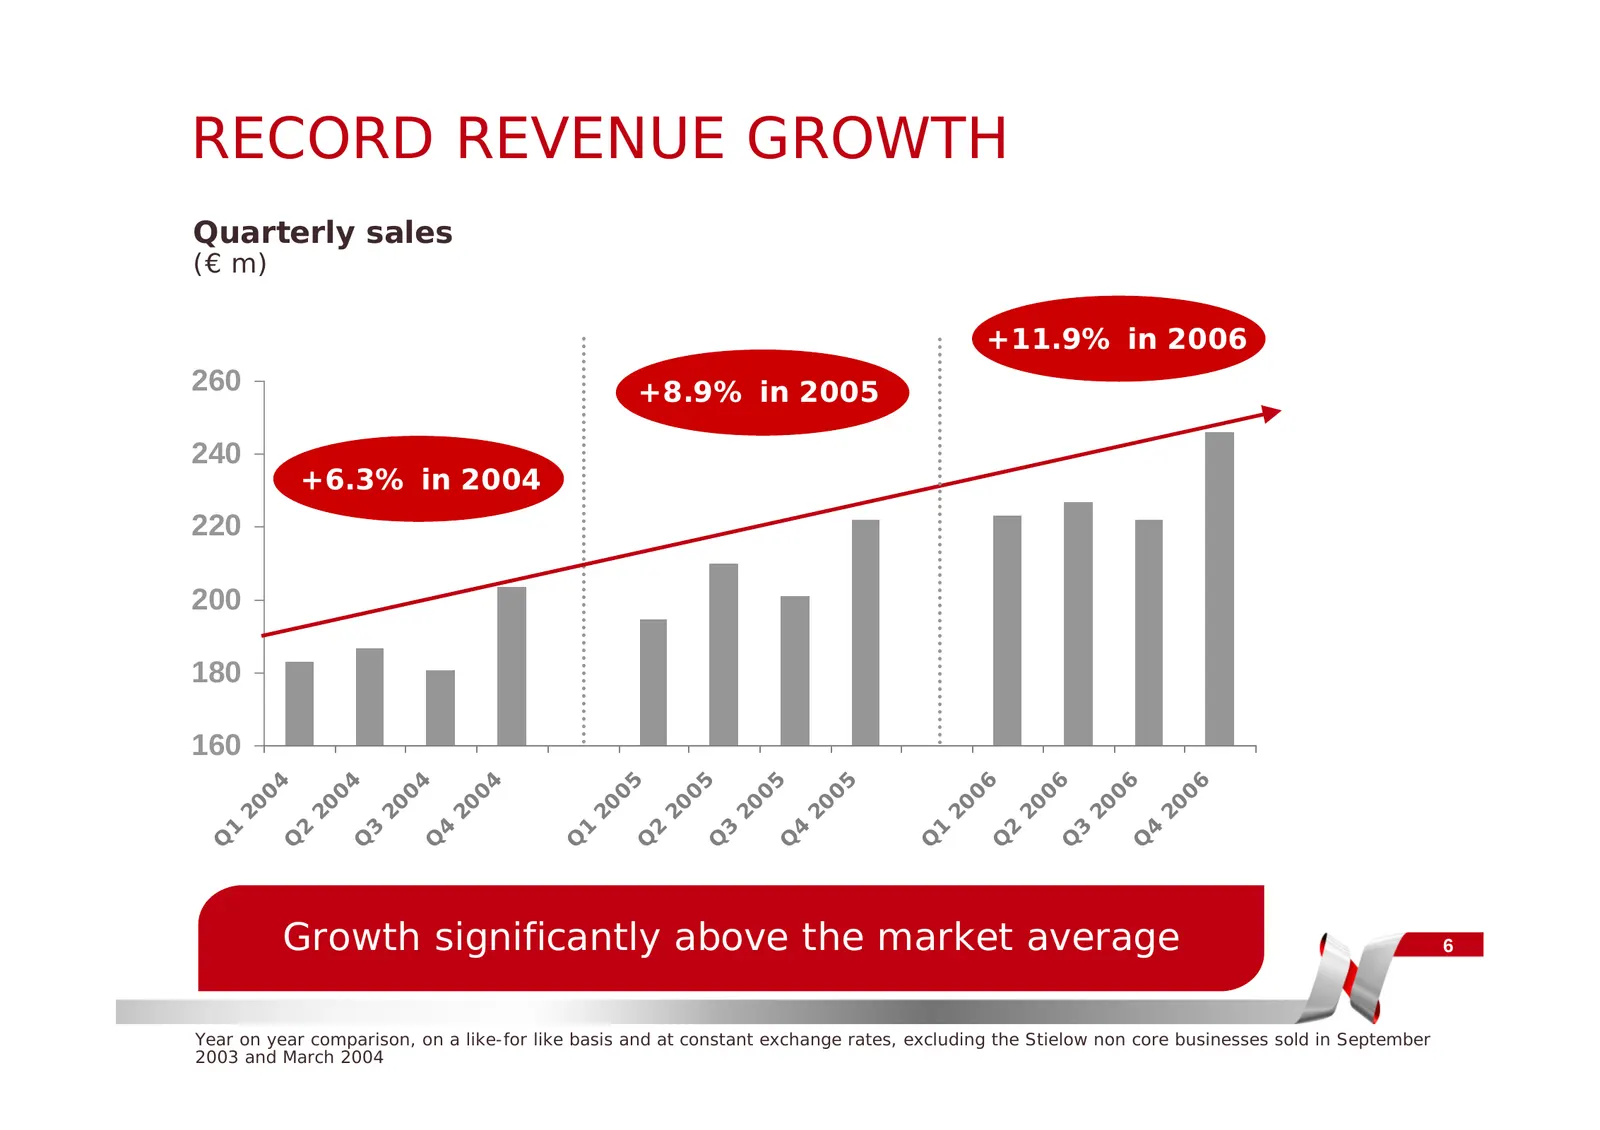
RECORD REVENUE GROWTH Quarterly sales (€ m) +11.9% in 2006 260 +8.9% in 2005 240 +6.3% in 2004 220 200 180 160 6 6 6 4 4 4 4 5 5 5 5 6 0 0 0 0 0 0 0 0 0 0 0 0 20 20 20 20 20 20 20 20 20 20 20 20 1 2 3 4 1 2 3 4 1 2 3 4 Q Q Q Q Q Q Q Q Q Q Q Q Growth significantly above the market average 6 Year on y
Slide 7: Continuing Improvement in Profitability
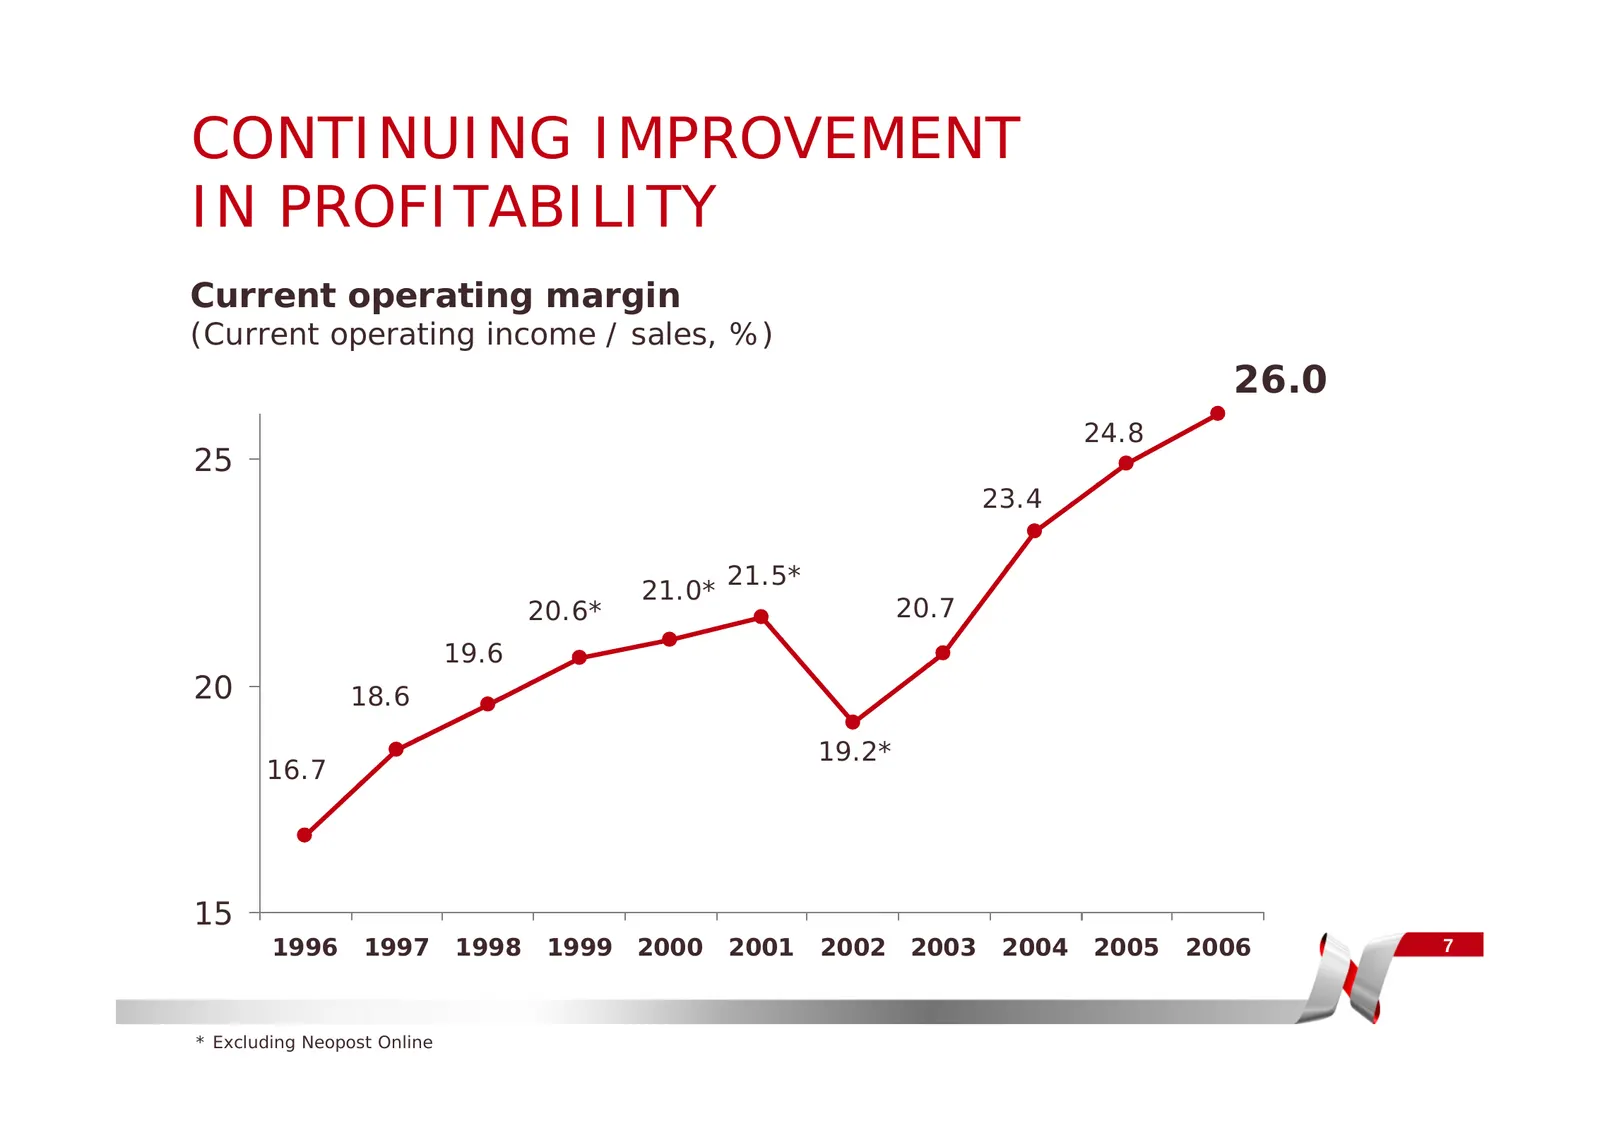
CONTINUING IMPROVEMENT IN PROFITABILITY Current operating margin (Current operating income / sales, %) 26.0 24.8 25 23.4 21.5* 21.0* 20.6* 20.7 19.6 20 18.6 19.2* 16.7 15 1996 1997 1998 1999 2000 2001 2002 2003 2004 2005 2006 7 * Excluding Neopost Online
Slide 8: Implementation of the New Shareholder Return Policy in 2006
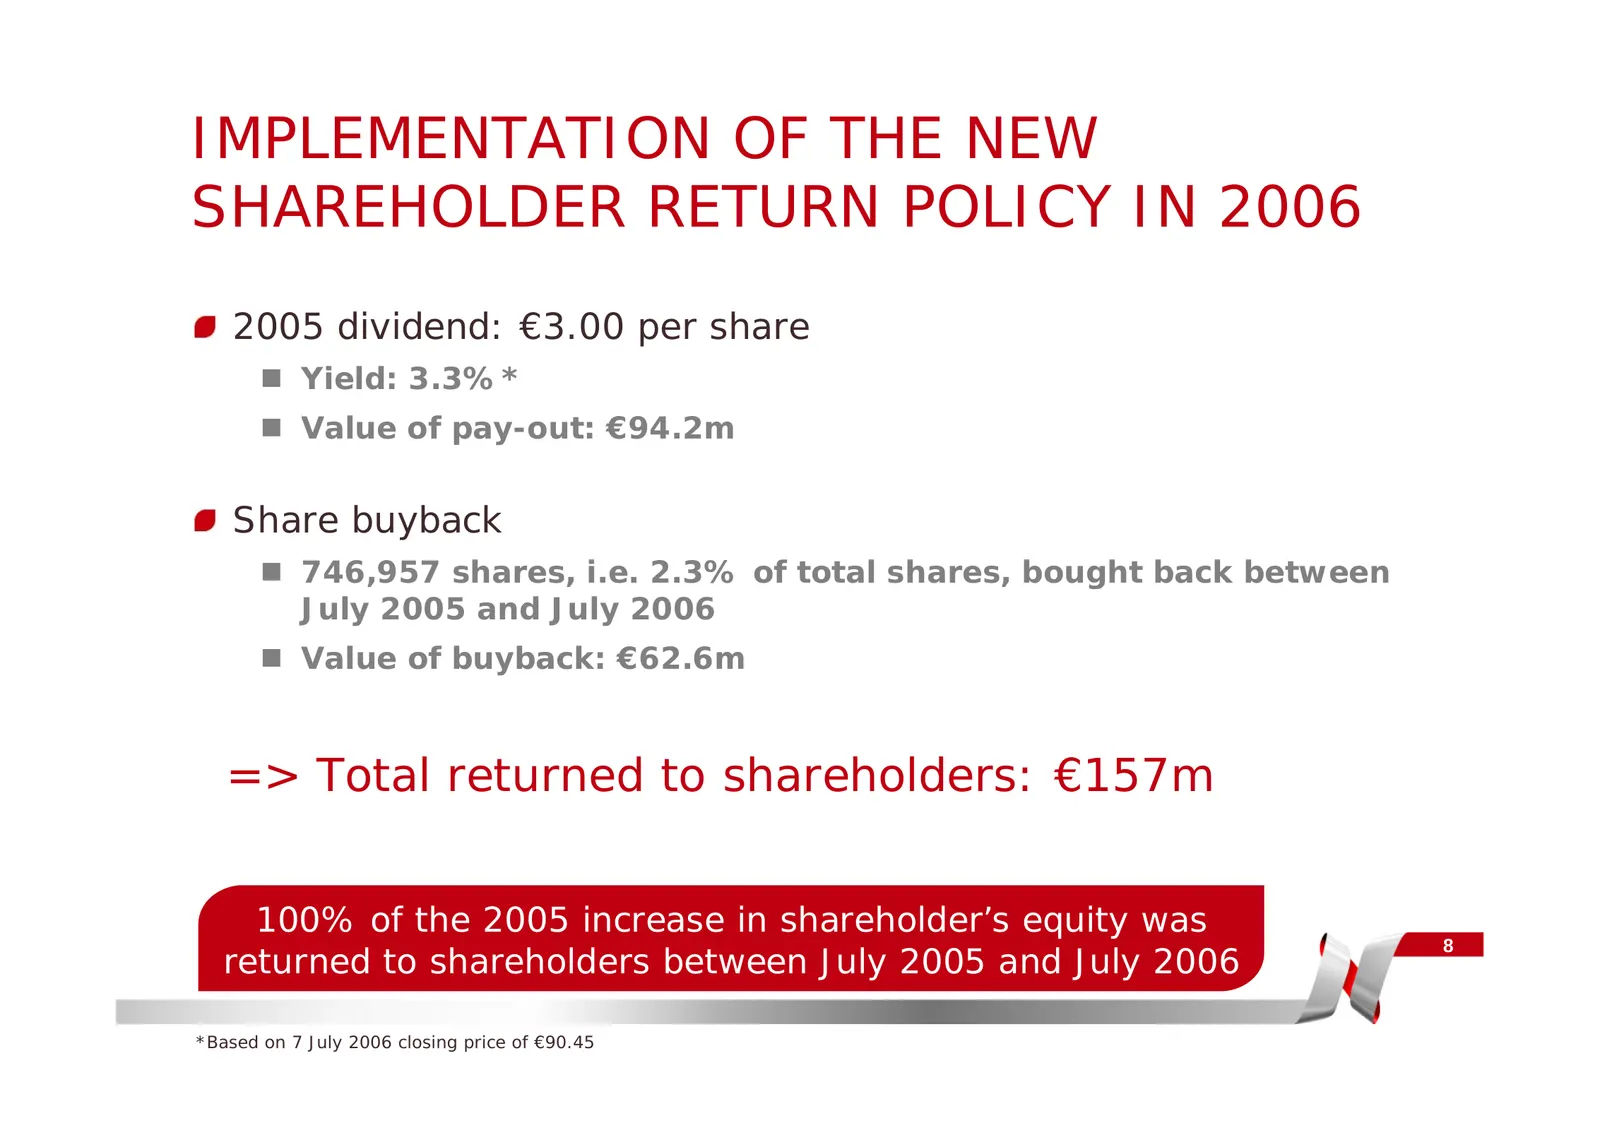
IMPLEMENTATION OF THE NEW SHAREHOLDER RETURN POLICY IN 2006 2005 dividend: €3.00 per share Yield: 3.3%* Value of pay-out: €94.2m Share buyback 746,957 shares, i.e. 2.3% of total shares, bought back between July 2005 and July 2006 Value of buyback: €62.6m => Total returned to shareholders: €1
Slide 9: 2006 Full Year Accounts
2006 FULL YEAR ACCOUNTS 9
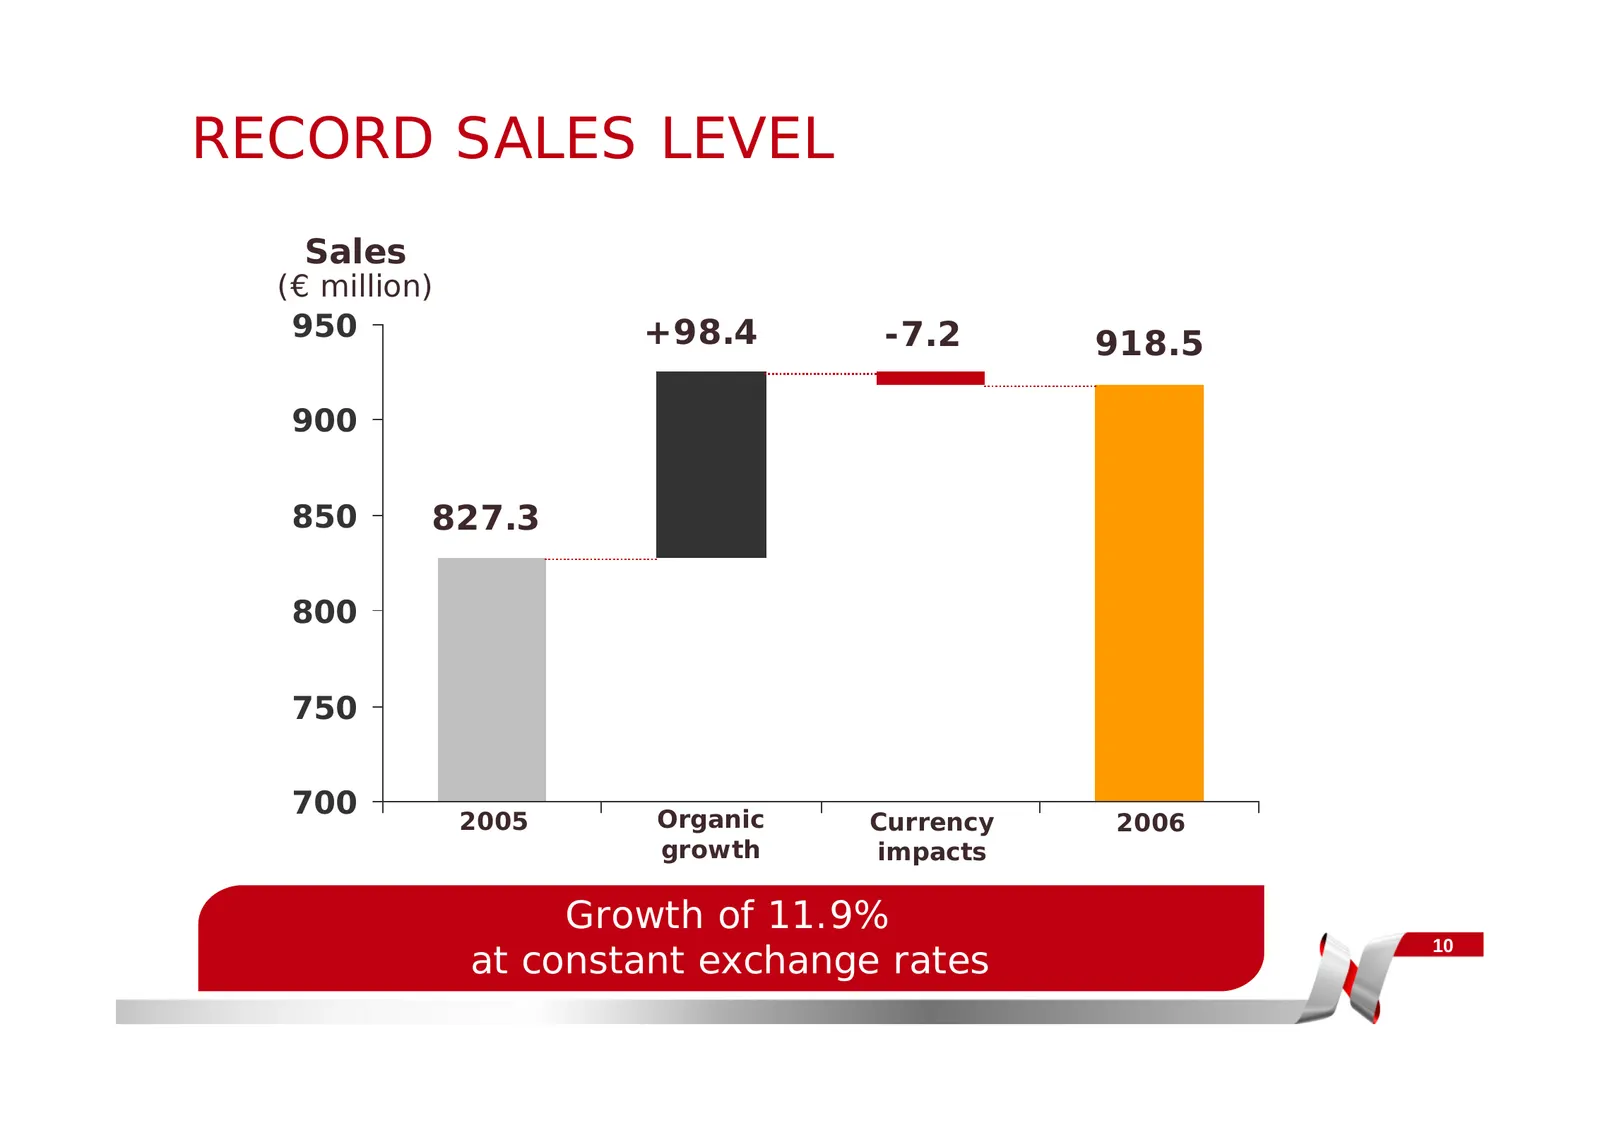
Slide 10: Record Sales Level
RECORD SALES LEVEL Sales (€ million) 950 +98.4 -7.2 918.5 900 850 827.3 800 750 700 Organic 2005 Currency 2006 growth impacts Growth of 11.9% at constant exchange rates 10
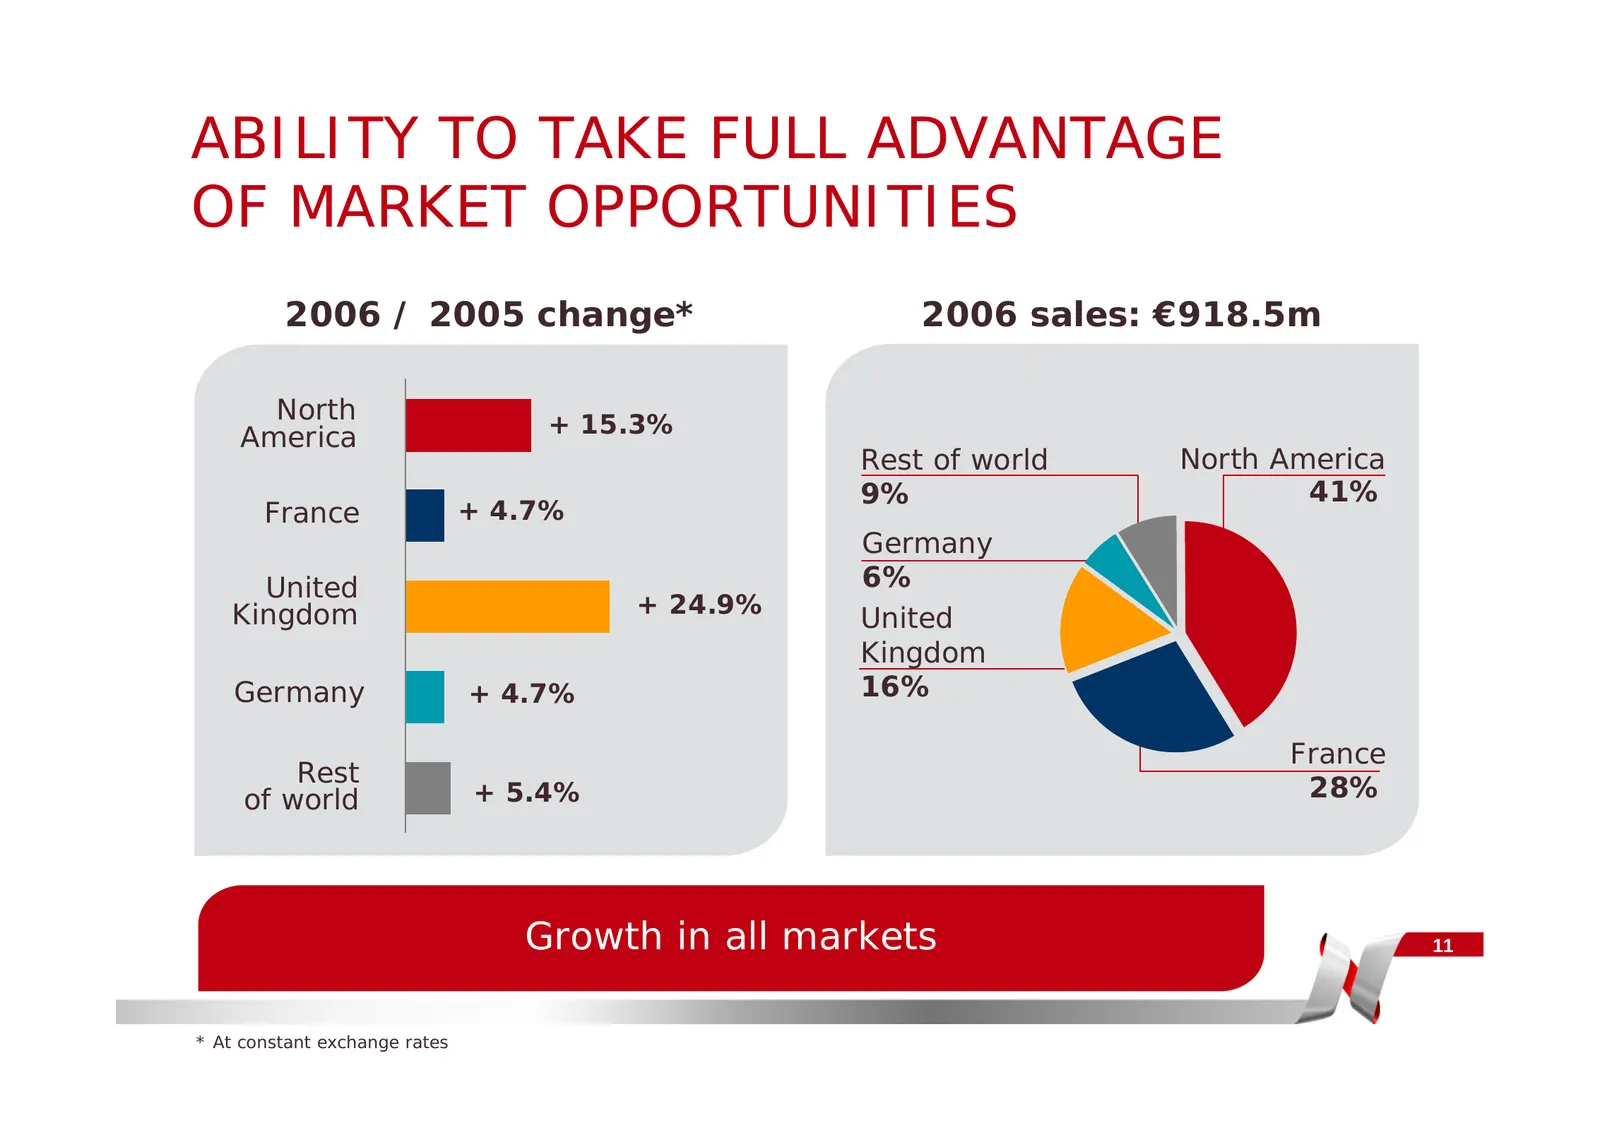
Slide 11: Ability to Take Full Advantage of Market Opportunities
ABILITY TO TAKE FULL ADVANTAGE OF MARKET OPPORTUNITIES 2006 / 2005 change* 2006 sales: €918.5m North America + 15.3% Rest of world North America 9% 41% France + 4.7% Germany United 6% Kingdom + 24.9% United Kingdom Germany + 4.7% 16% France Rest of world + 5.4% 28% Growth in all markets 11 * At cons
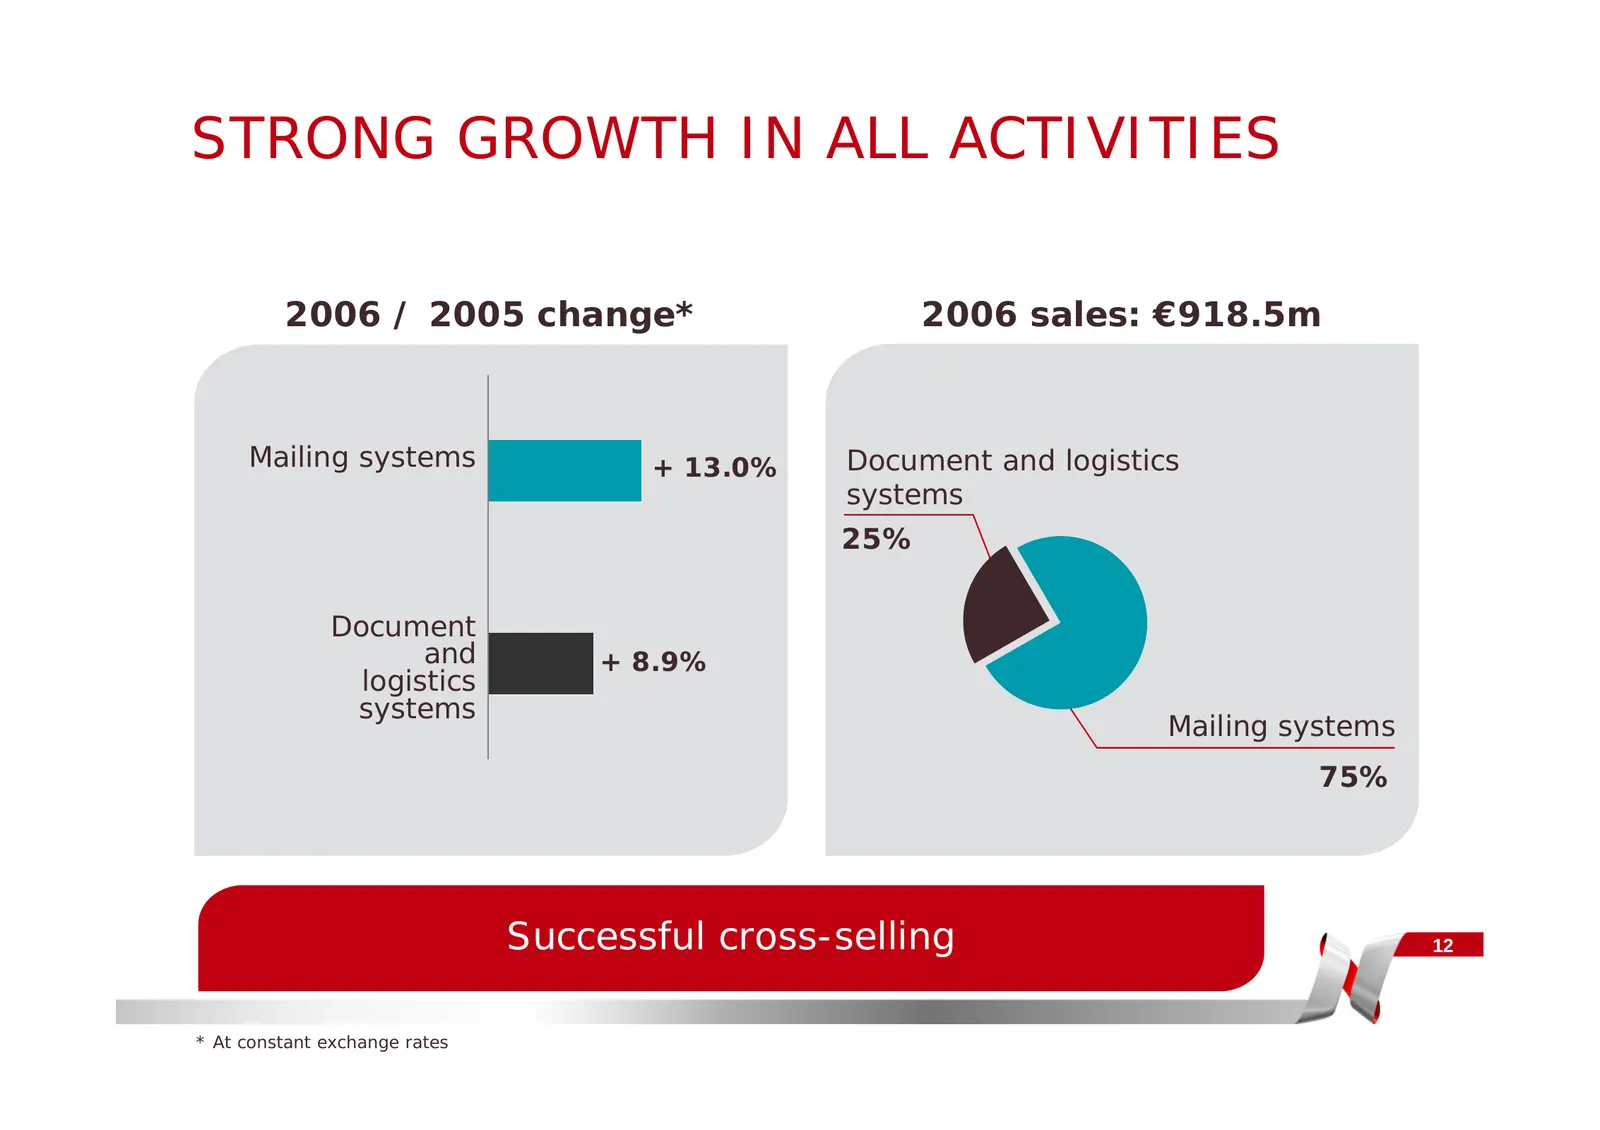
Slide 12: Strong Growth in All Activities
STRONG GROWTH IN ALL ACTIVITIES 2006 / 2005 change* 2006 sales: €918.5m Mailing systems + 13.0% Document and logistics systems 25% Document and + 8.9% logistics systems Mailing systems 75% Successful cross-selling 12 * At constant exchange rates
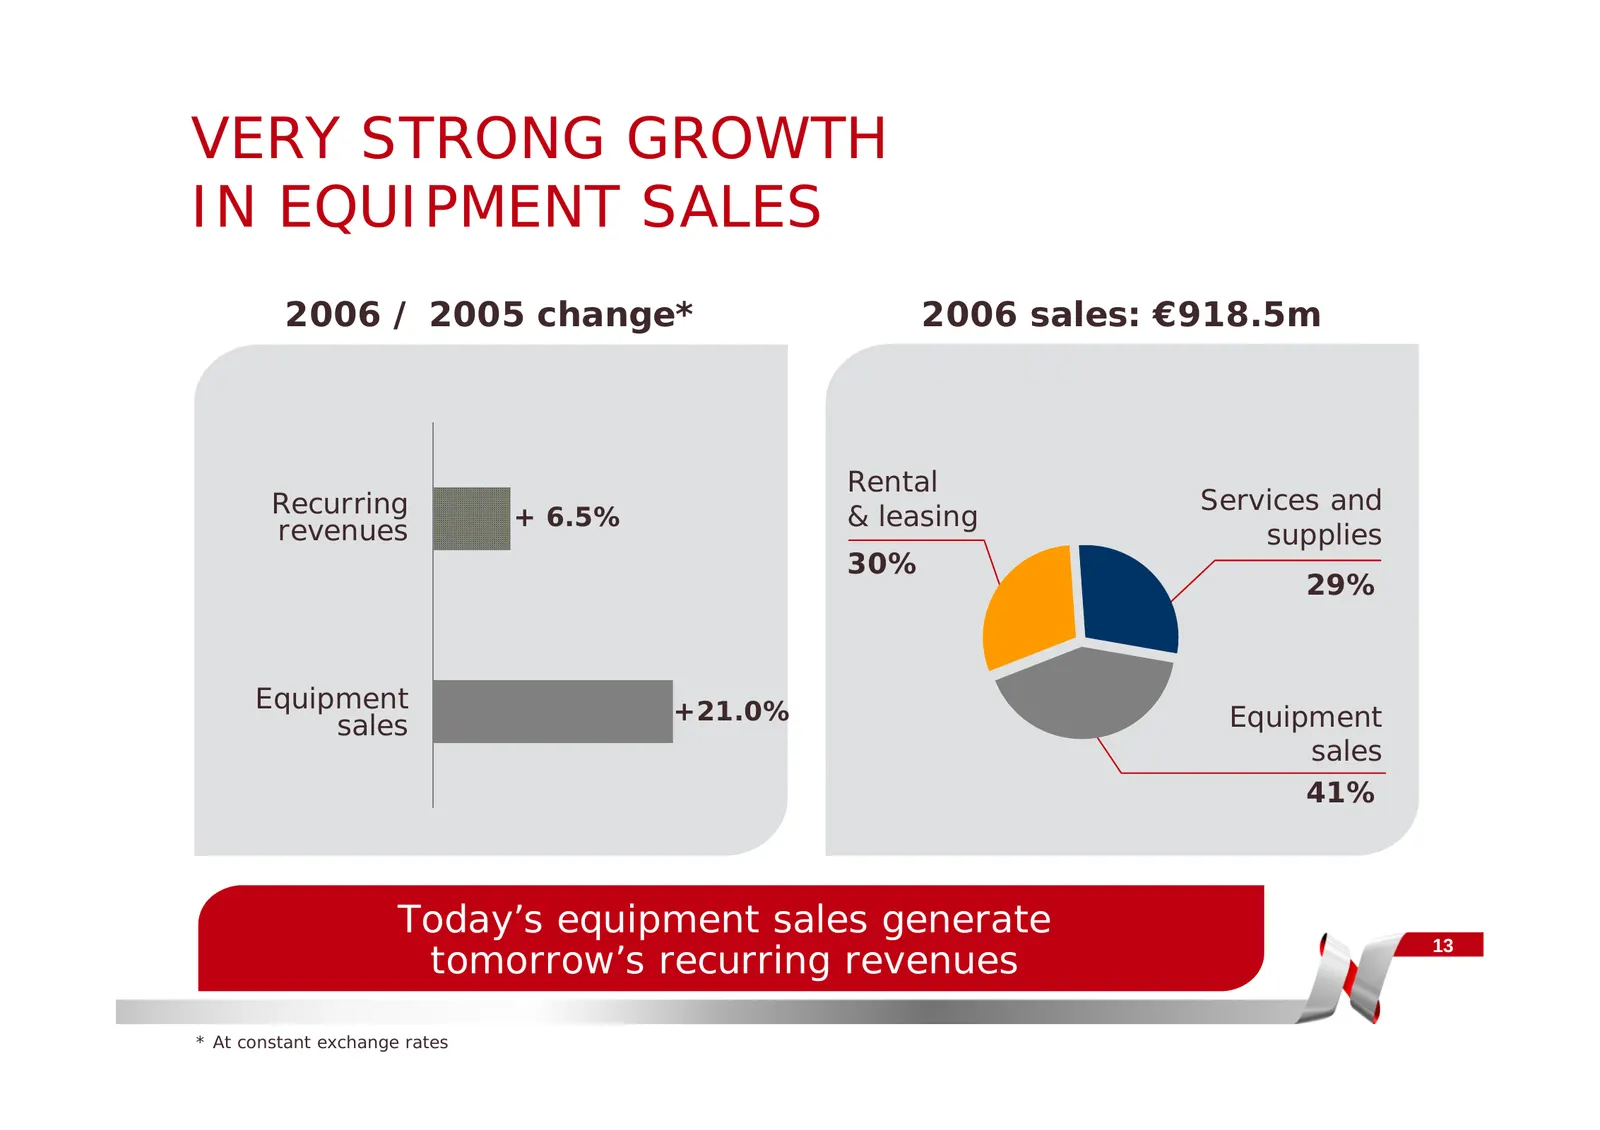
Slide 13: Very Strong Growth in Equipment Sales
VERY STRONG GROWTH IN EQUIPMENT SALES 2006 / 2005 change* 2006 sales: €918.5m Rental Recurring Services and + 6.5% & leasing revenues supplies 30% 29% Equipment +21.0% sales Equipment sales 41% Today’s equipment sales generate tomorrow’s recurring revenues 13 * At constant exchange rates
Slide 14: Further Improvement in Profitability
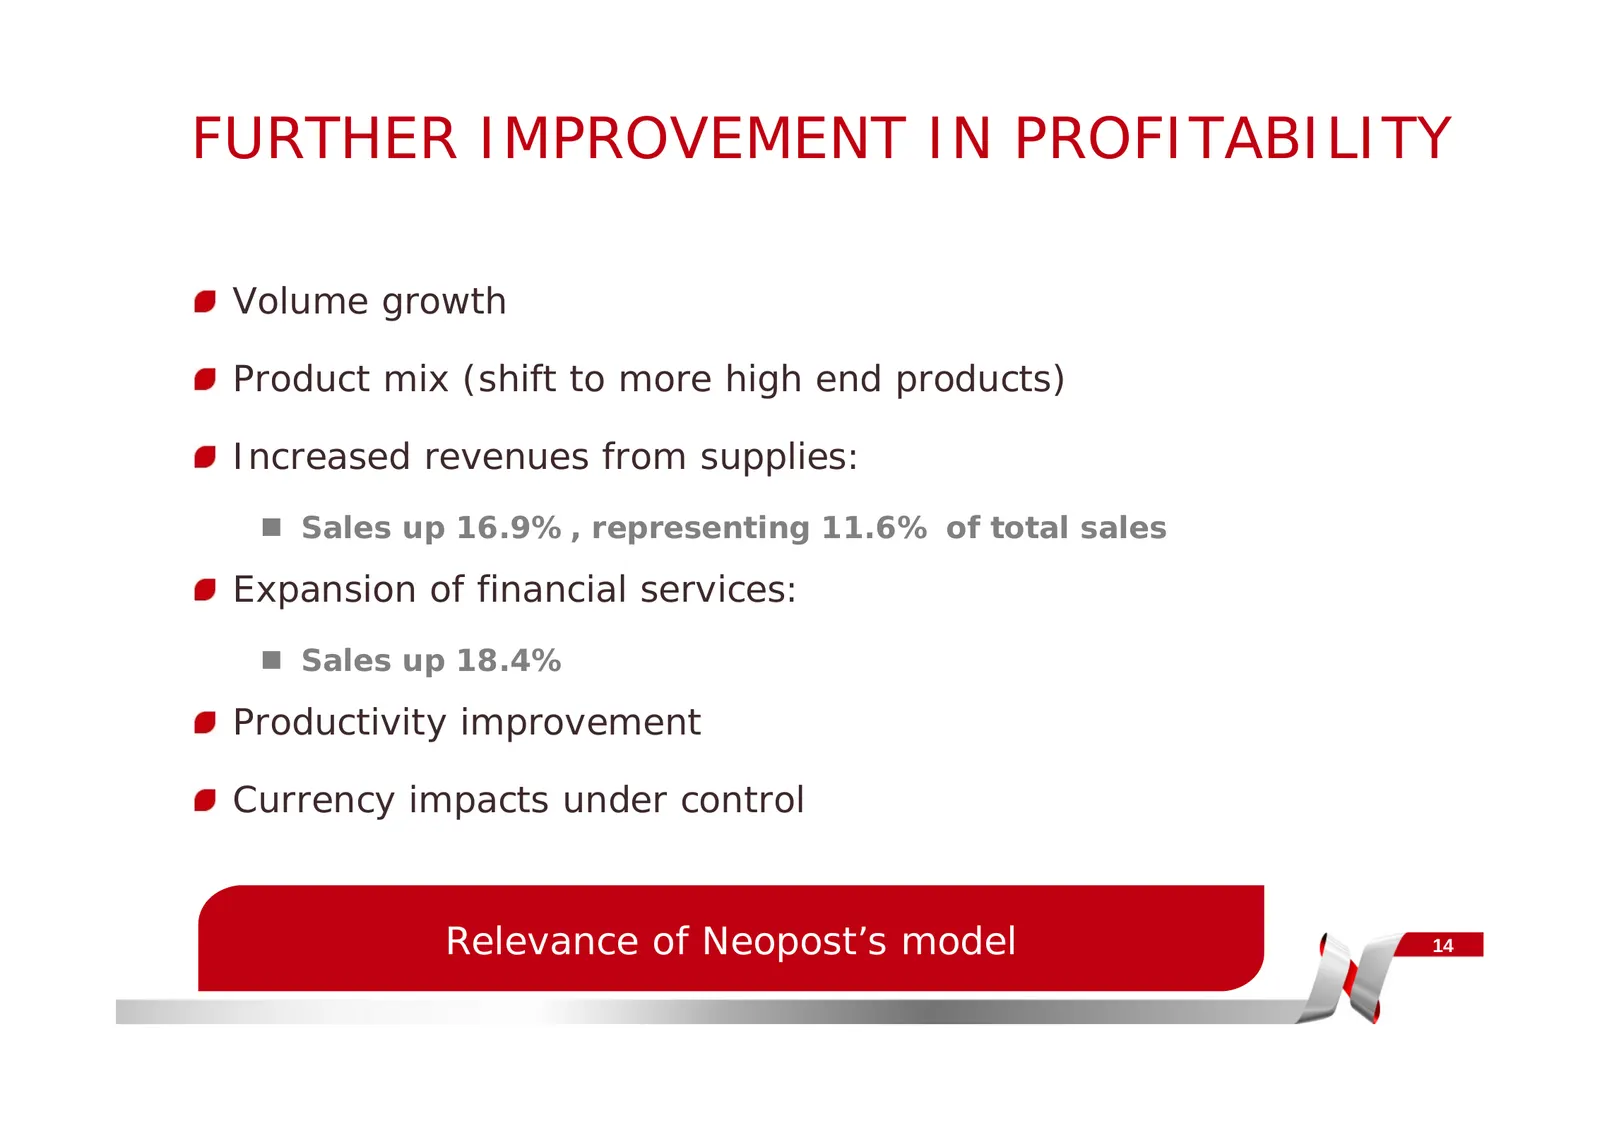
FURTHER IMPROVEMENT IN PROFITABILITY Volume growth Product mix (shift to more high end products) Increased revenues from supplies: Sales up 16.9%, representing 11.6% of total sales Expansion of financial services: Sales up 18.4% Productivity improvement Currency impacts under control Relevance o
Slide 15: Record Current Operating Margin of 26.0%
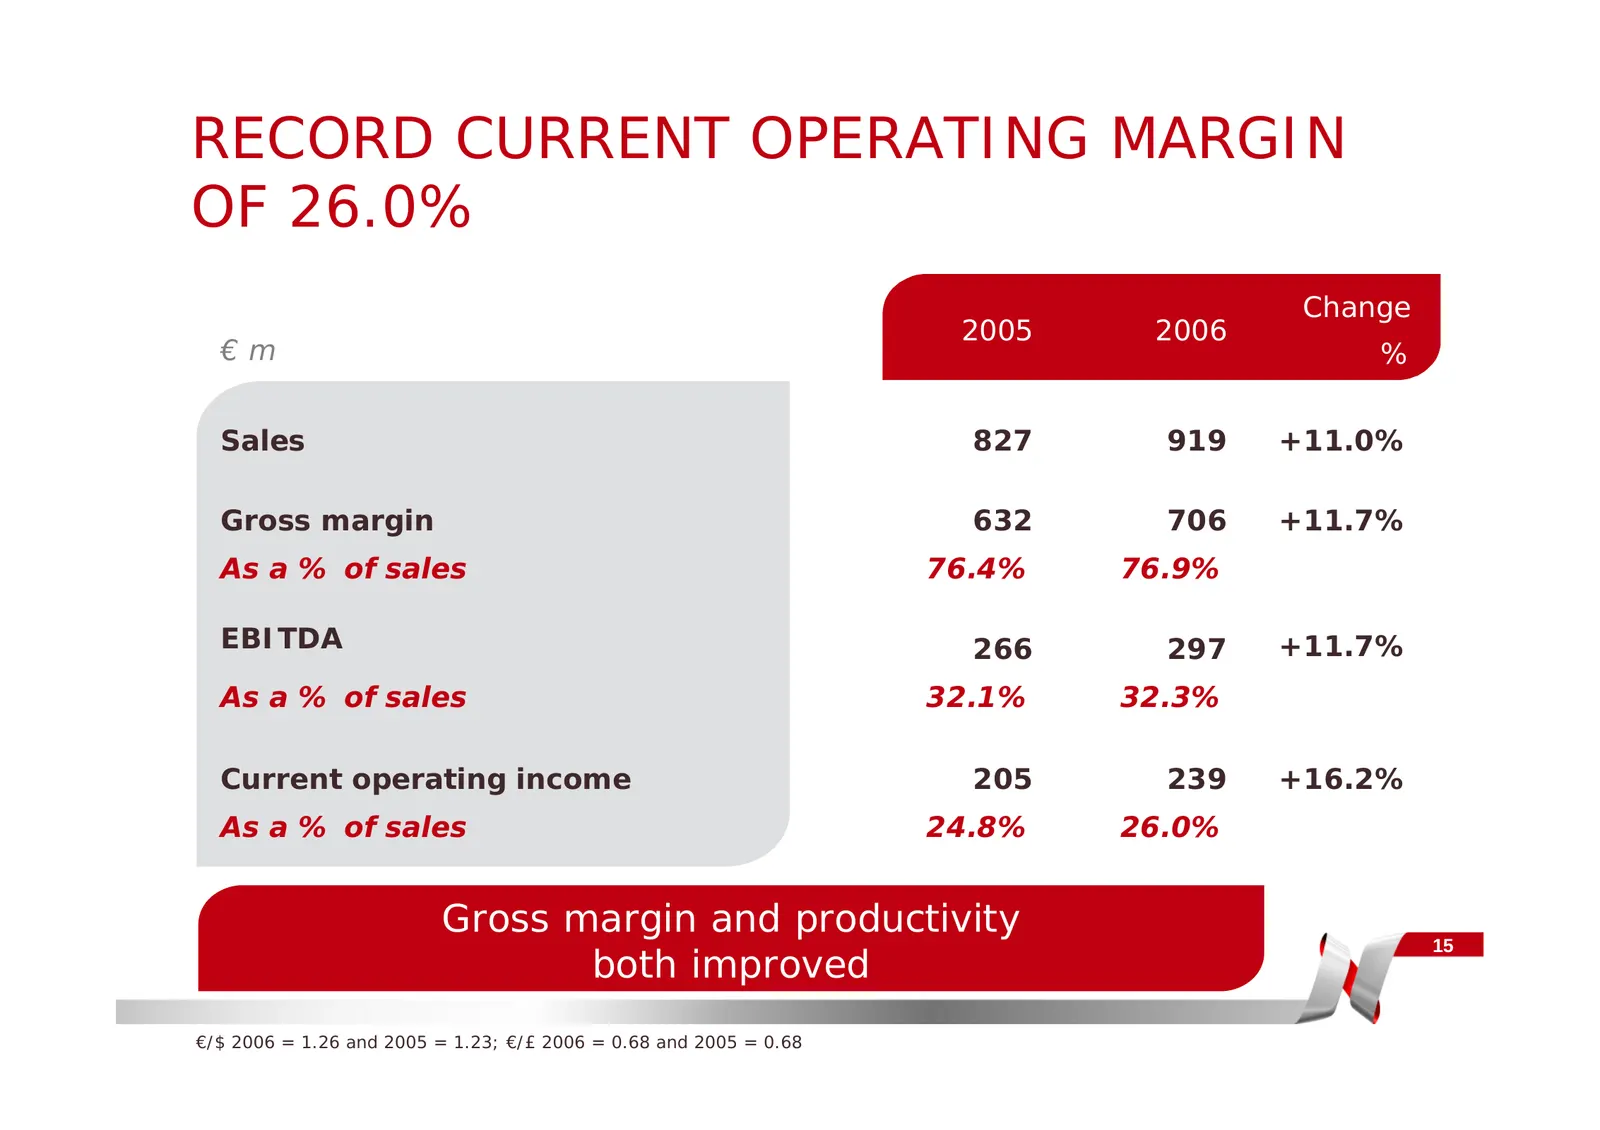
RECORD CURRENT OPERATING MARGIN OF 26.0% Change 2005 2006 €m % Sales 827 919 +11.0% Gross margin 632 706 +11.7% As a % of sales 76.4% 76.9% EBITDA 266 297 +11.7% As a % of sales 32.1% 32.3% Current operating income 205 239 +16.2% As a % of sales 24.8% 26.0% Gross margin and productivity 15 both impr
Slide 16: A 14.0% Increase in Net Income
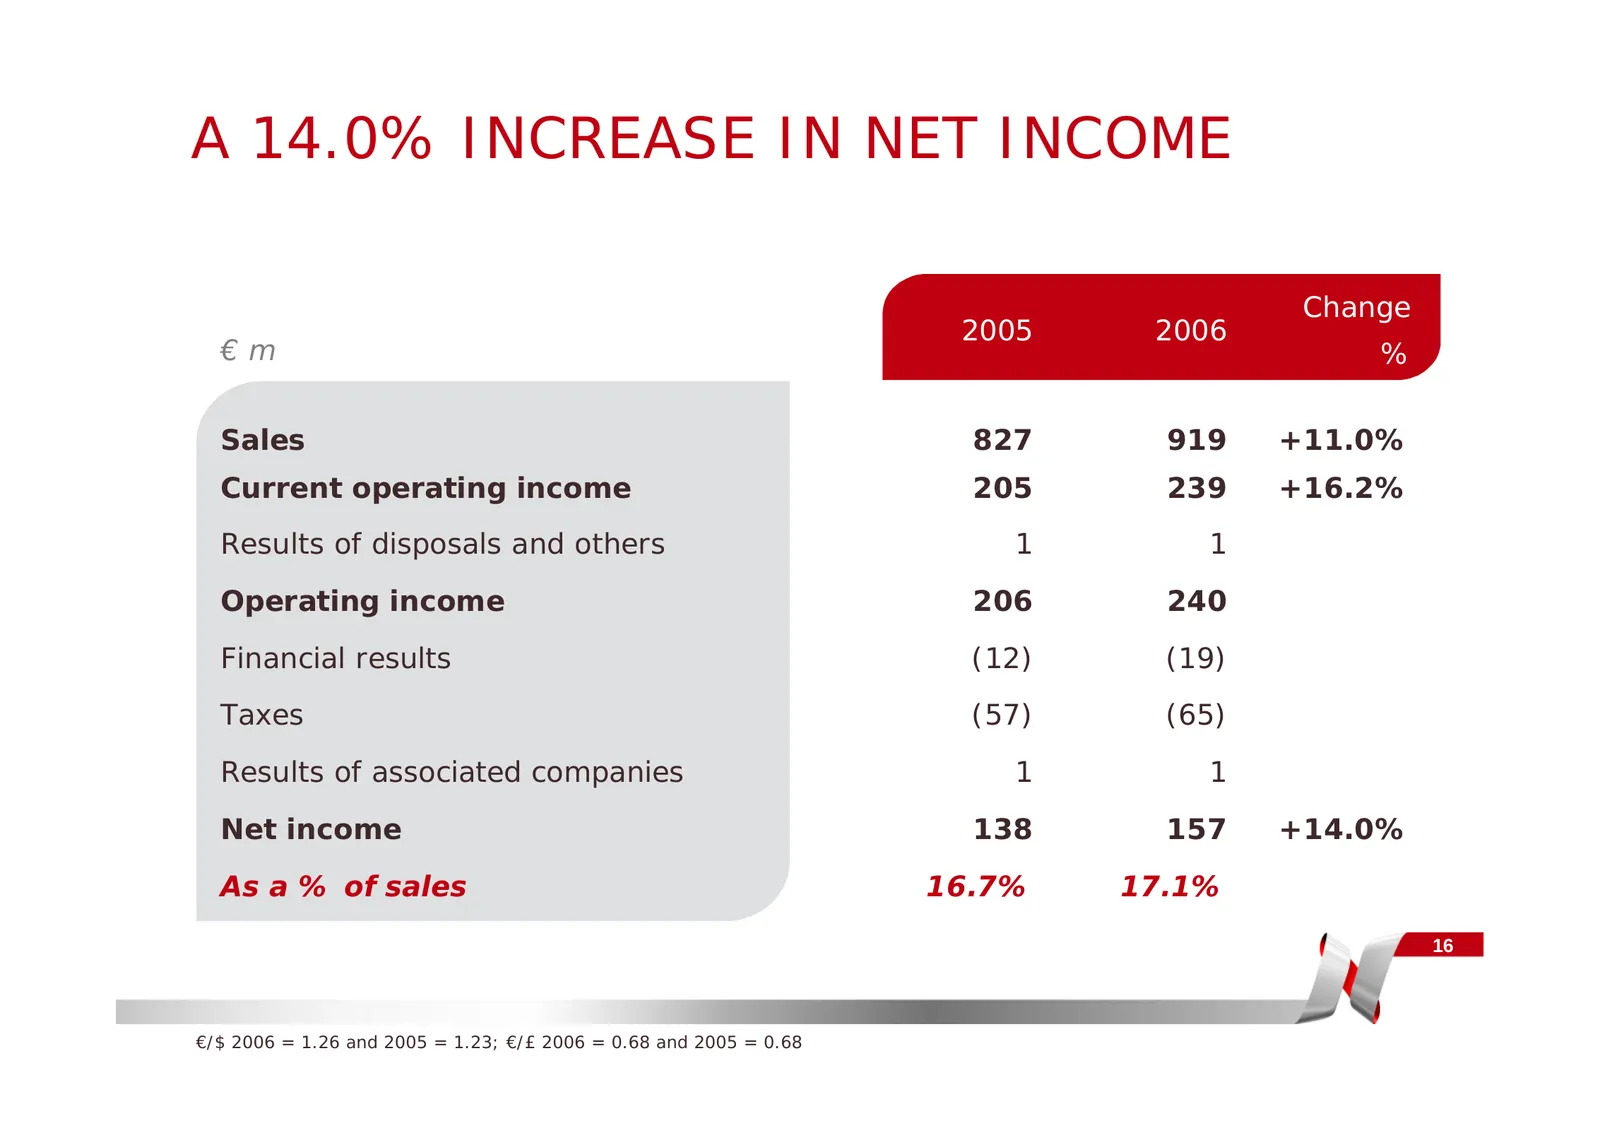
A 14.0% INCREASE IN NET INCOME Change 2005 2006 €m % Sales 827 919 +11.0% Current operating income 205 239 +16.2% Results of disposals and others 1 1 Operating income 206 240 Financial results (12) (19) Taxes (57) (65) Results of associated companies 1 1 Net income 138 157 +14.0% As a % of sales 16.
Slide 17: Sharp Improvement in Working Capital Requirement
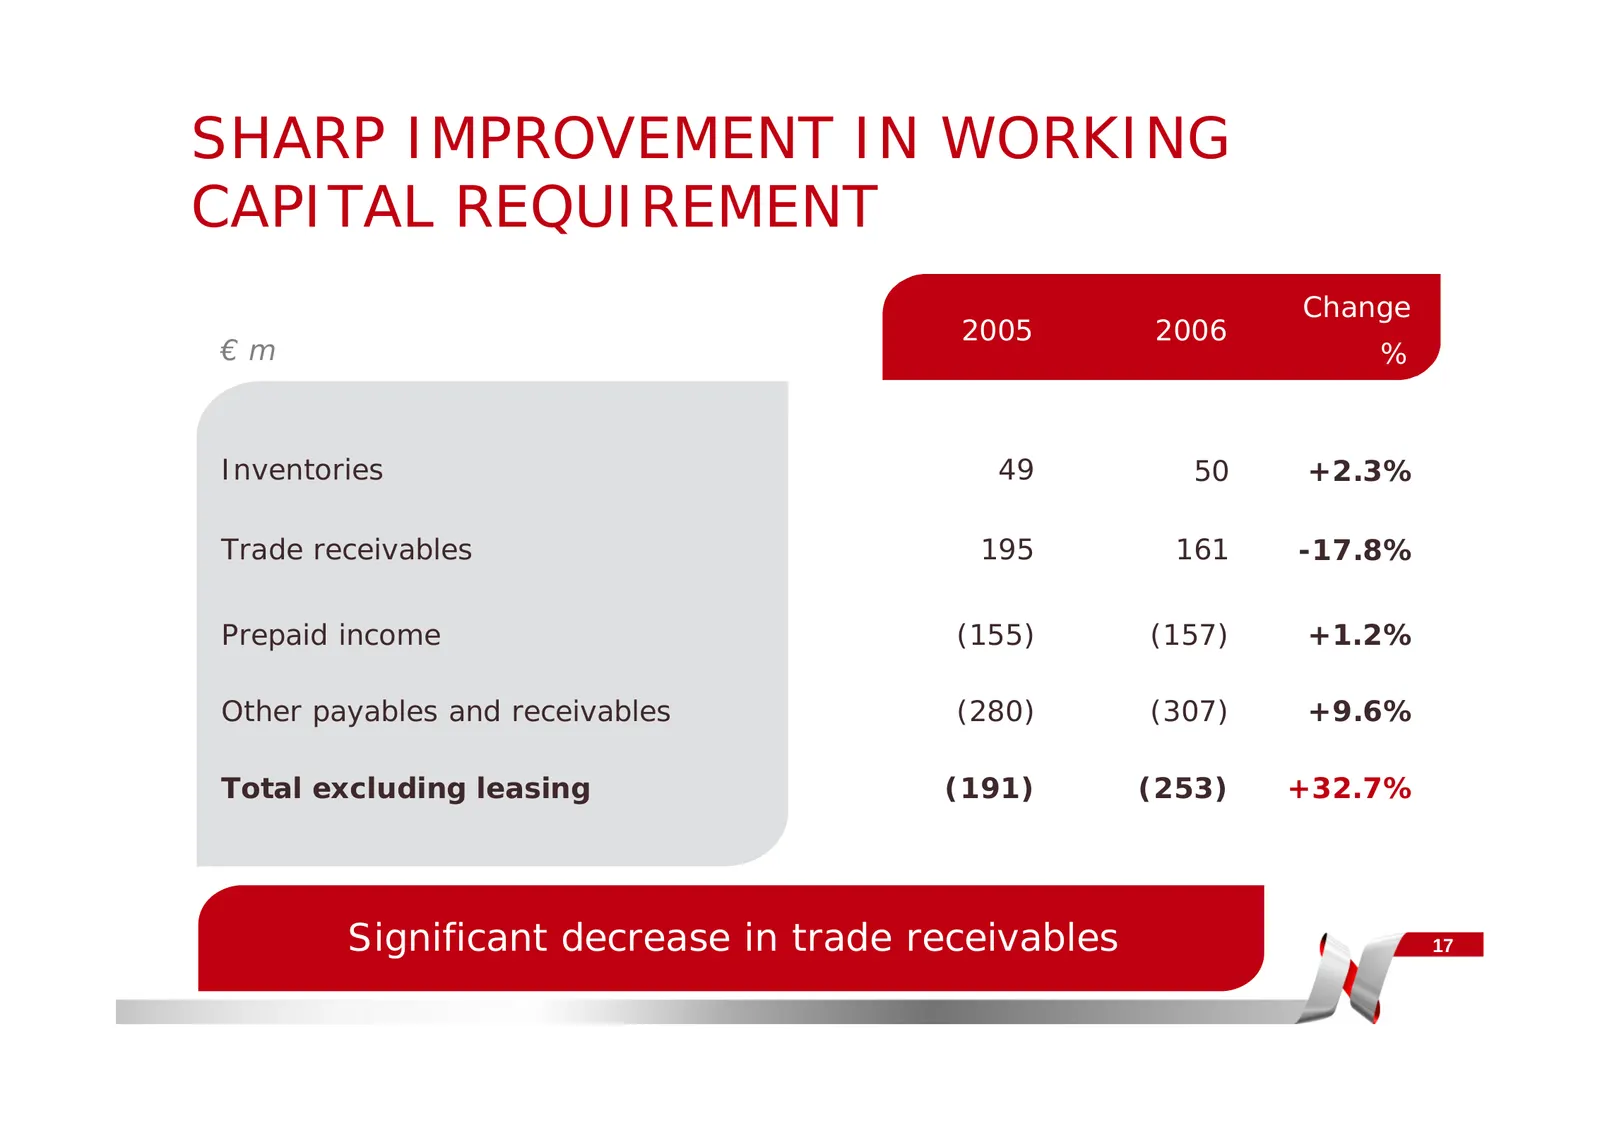
SHARP IMPROVEMENT IN WORKING CAPITAL REQUIREMENT Change 2005 2006 €m % Inventories 49 50 +2.3% Trade receivables 195 161 -17.8% Prepaid income (155) (157) +1.2% Other payables and receivables (280) (307) +9.6% Total excluding leasing (191) (253) +32.7% Significant decrease in trade receivables 17
Slide 18: Very Strong Cash Flow Generation
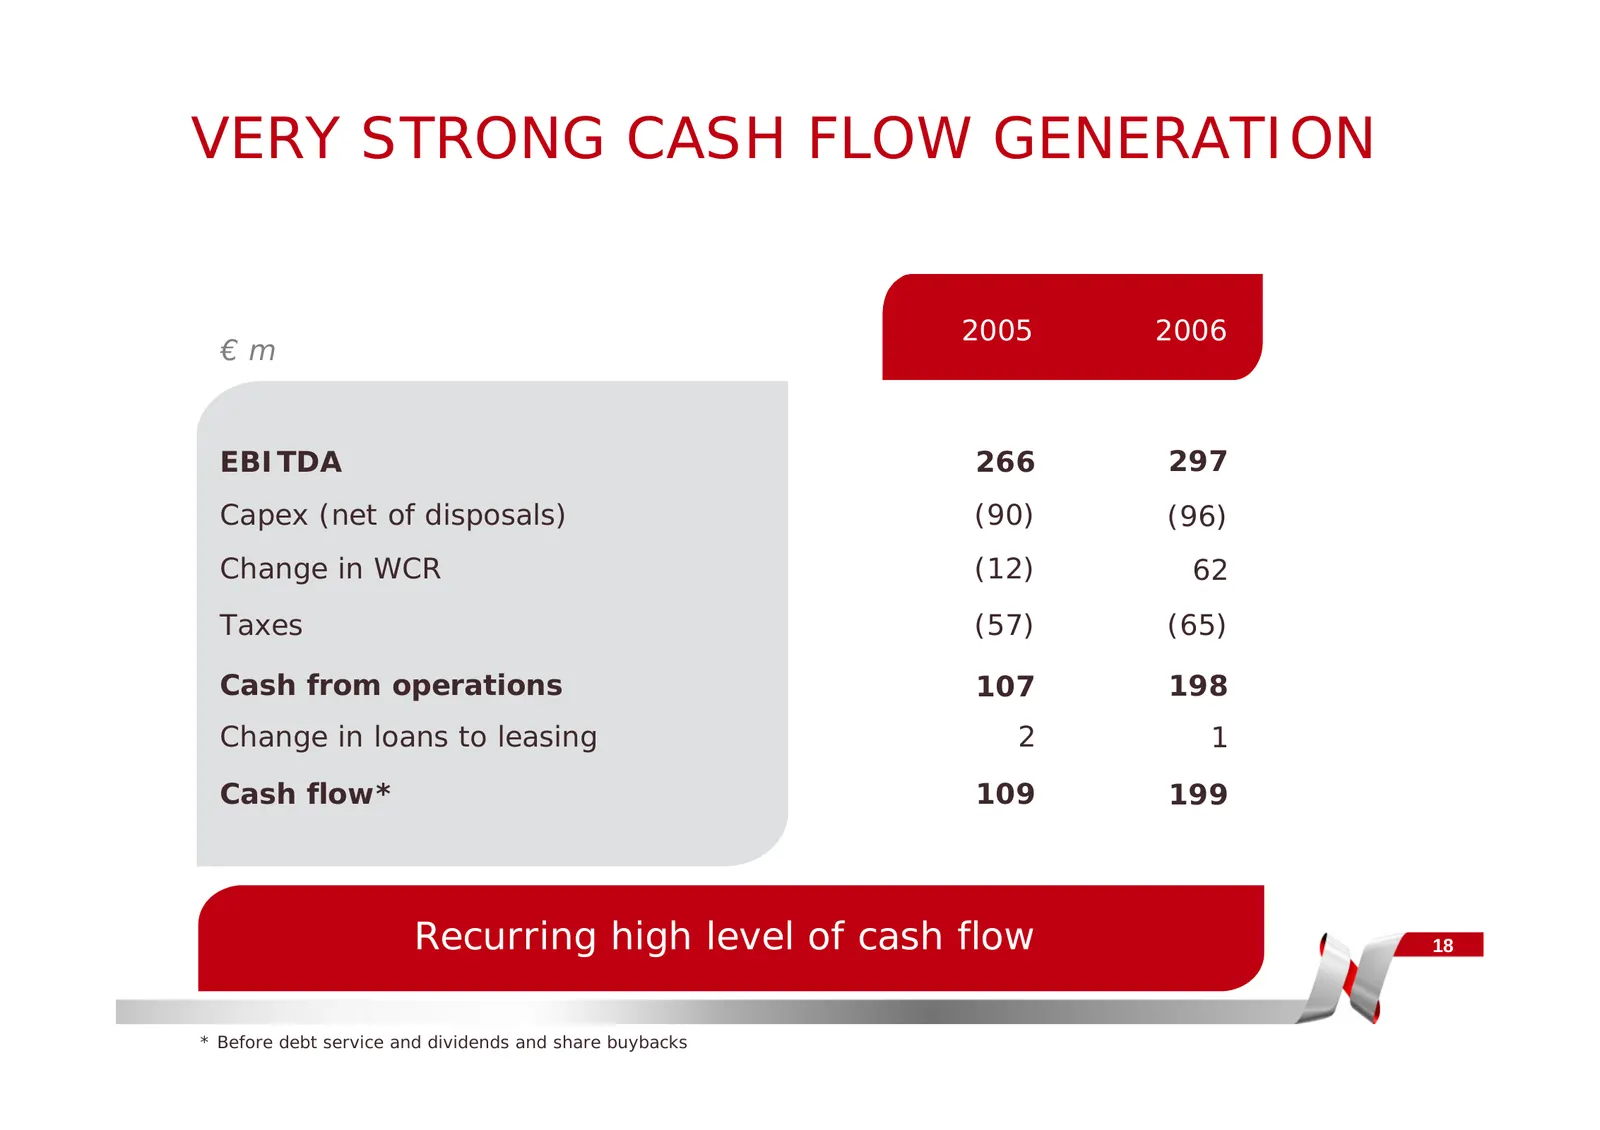
VERY STRONG CASH FLOW GENERATION 2005 2006 €m EBITDA 266 297 Capex (net of disposals) (90) (96) Change in WCR (12) 62 Taxes (57) (65) Cash from operations 107 198 Change in loans to leasing 2 1 Cash flow* 109 199 Recurring high level of cash flow 18 * Before debt service and dividends and share buyb
Slide 19: Debt to Equity Ratio Increased as Planned
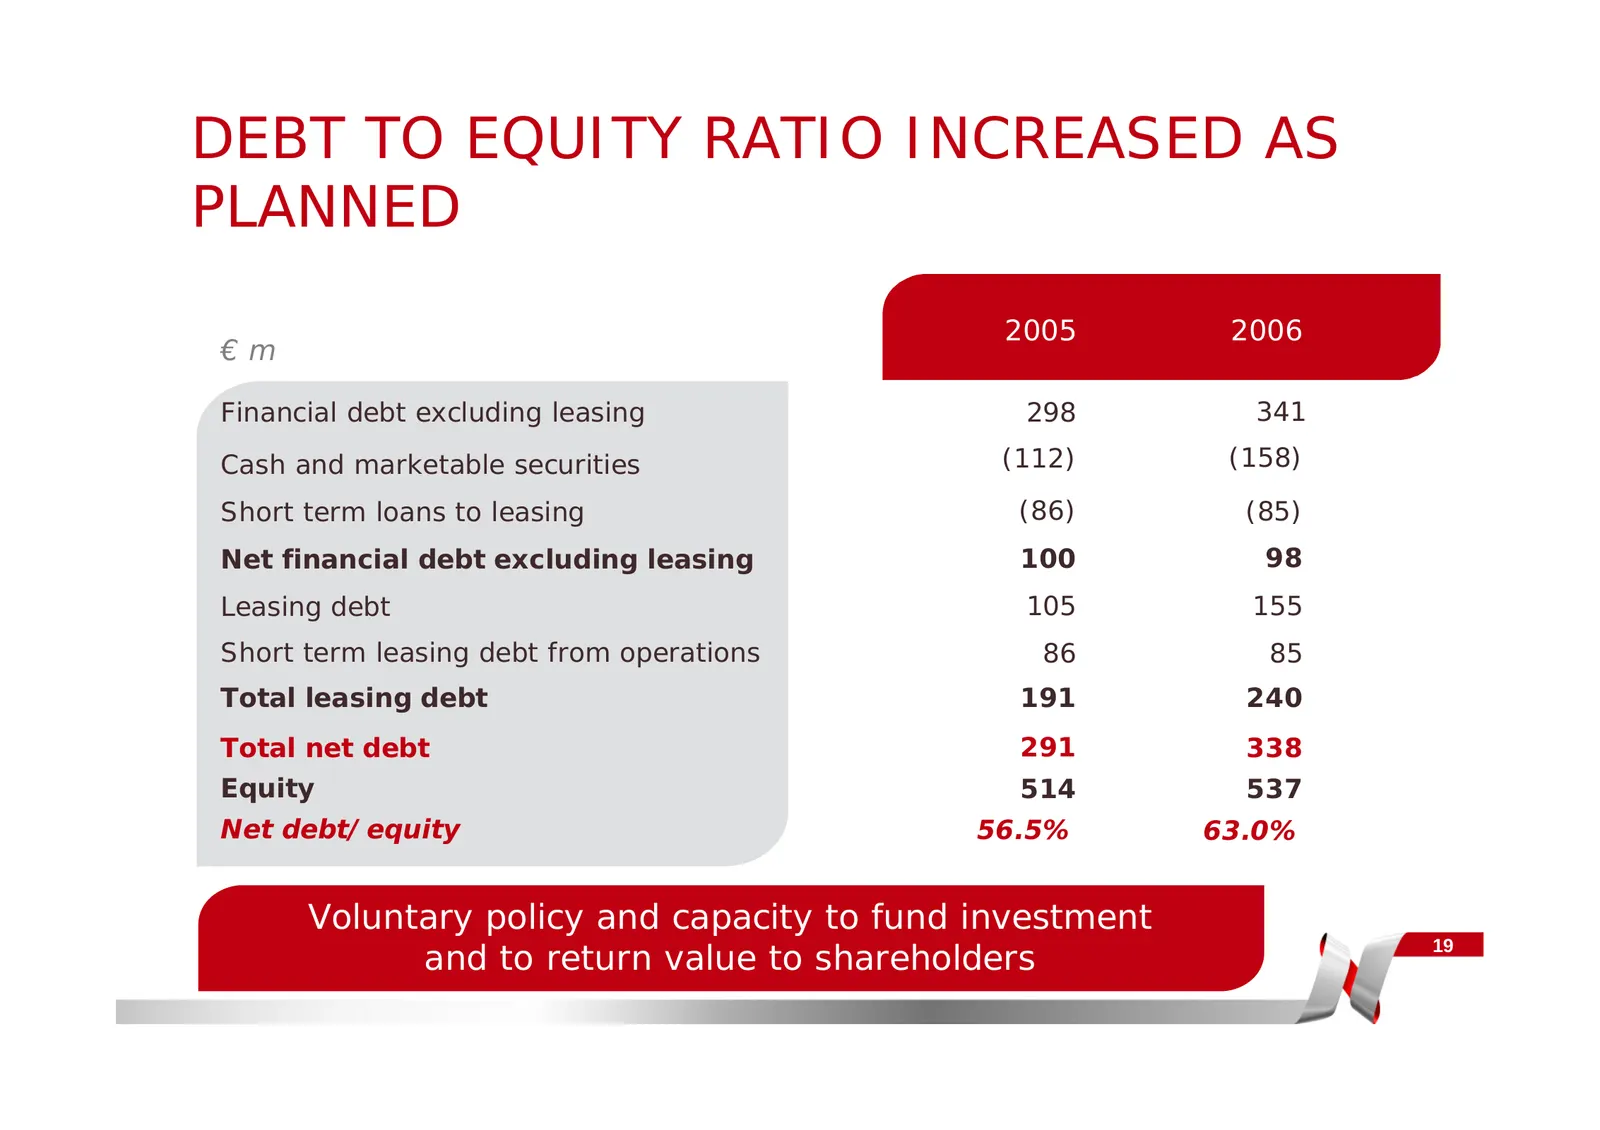
DEBT TO EQUITY RATIO INCREASED AS PLANNED 2005 2006 €m Financial debt excluding leasing 298 341 Cash and marketable securities (112) (158) Short term loans to leasing (86) (85) Net financial debt excluding leasing 100 98 Leasing debt 105 155 Short term leasing debt from operations 86 85 Total leasin
Slide 20: 100% of the Increase in Shareholder's Equity Returned to Shareholders
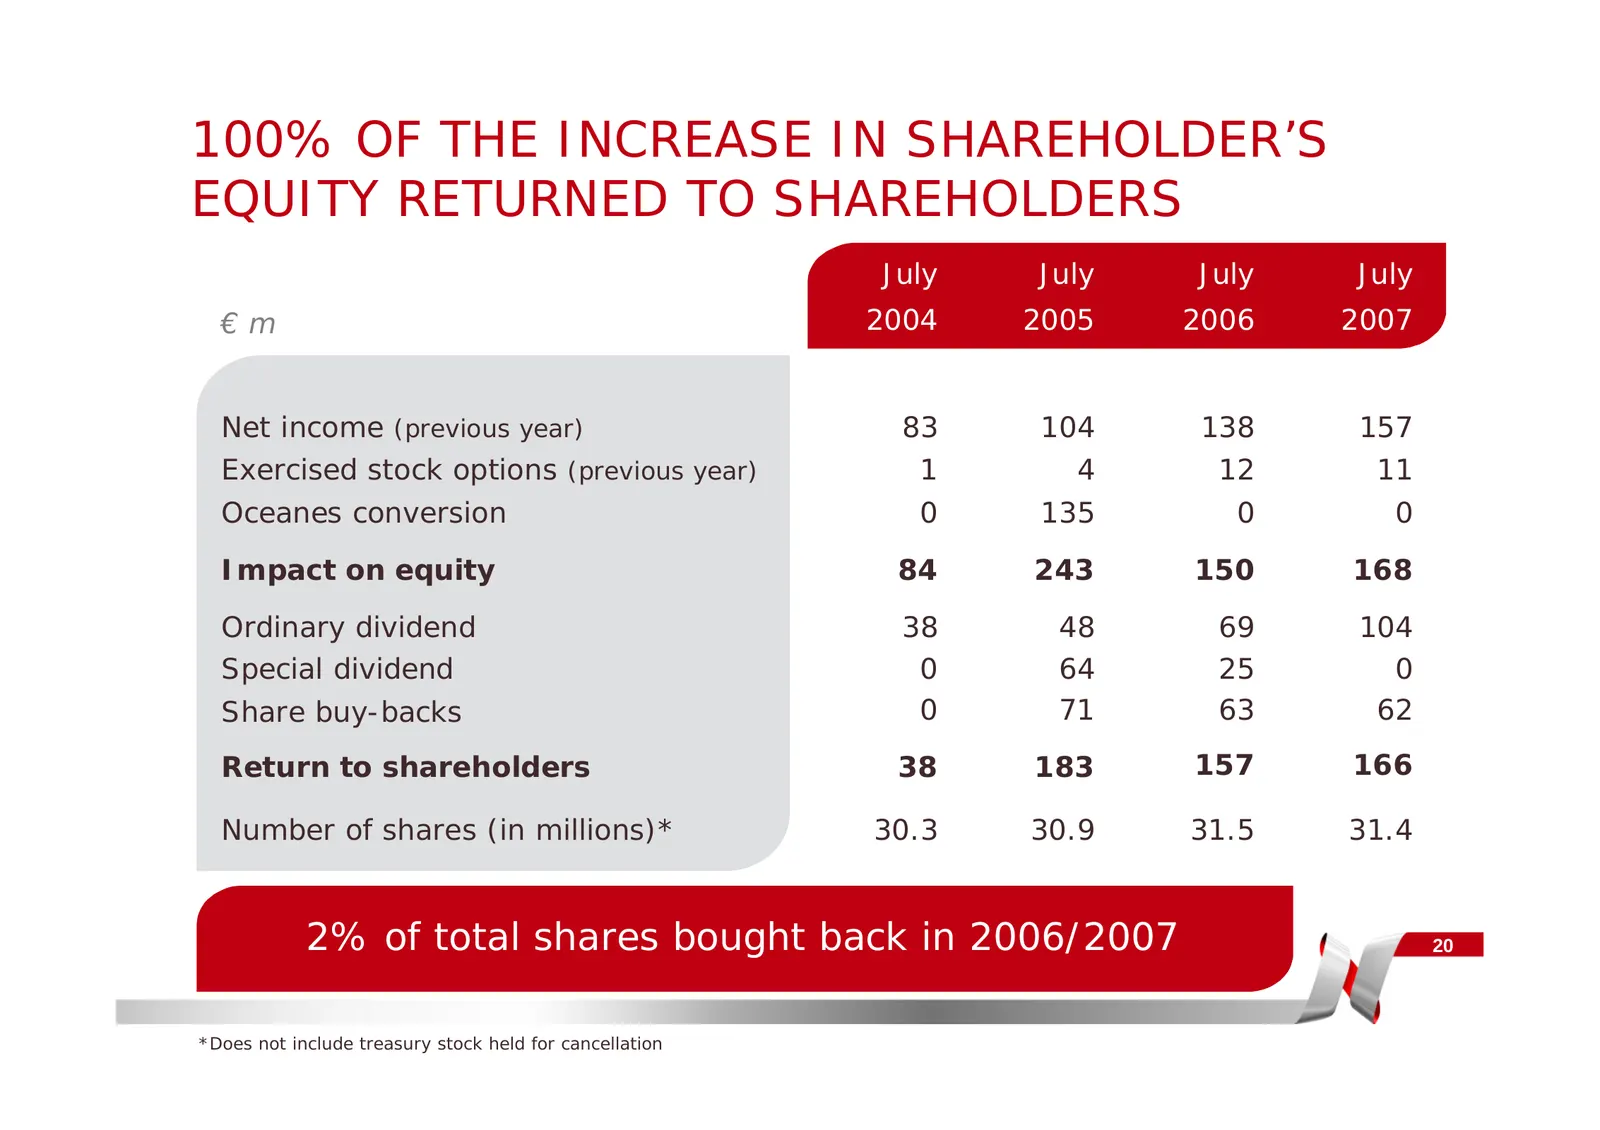
100% OF THE INCREASE IN SHAREHOLDER’S EQUITY RETURNED TO SHAREHOLDERS July July July July €m 2004 2005 2006 2007 Net income (previous year) 83 104 138 157 Exercised stock options (previous year) 1 4 12 11 Oceanes conversion 0 135 0 0 Impact on equity 84 243 150 168 Ordinary dividend 38 48 69 104 Spe
Slide 21: Increase in Dividends
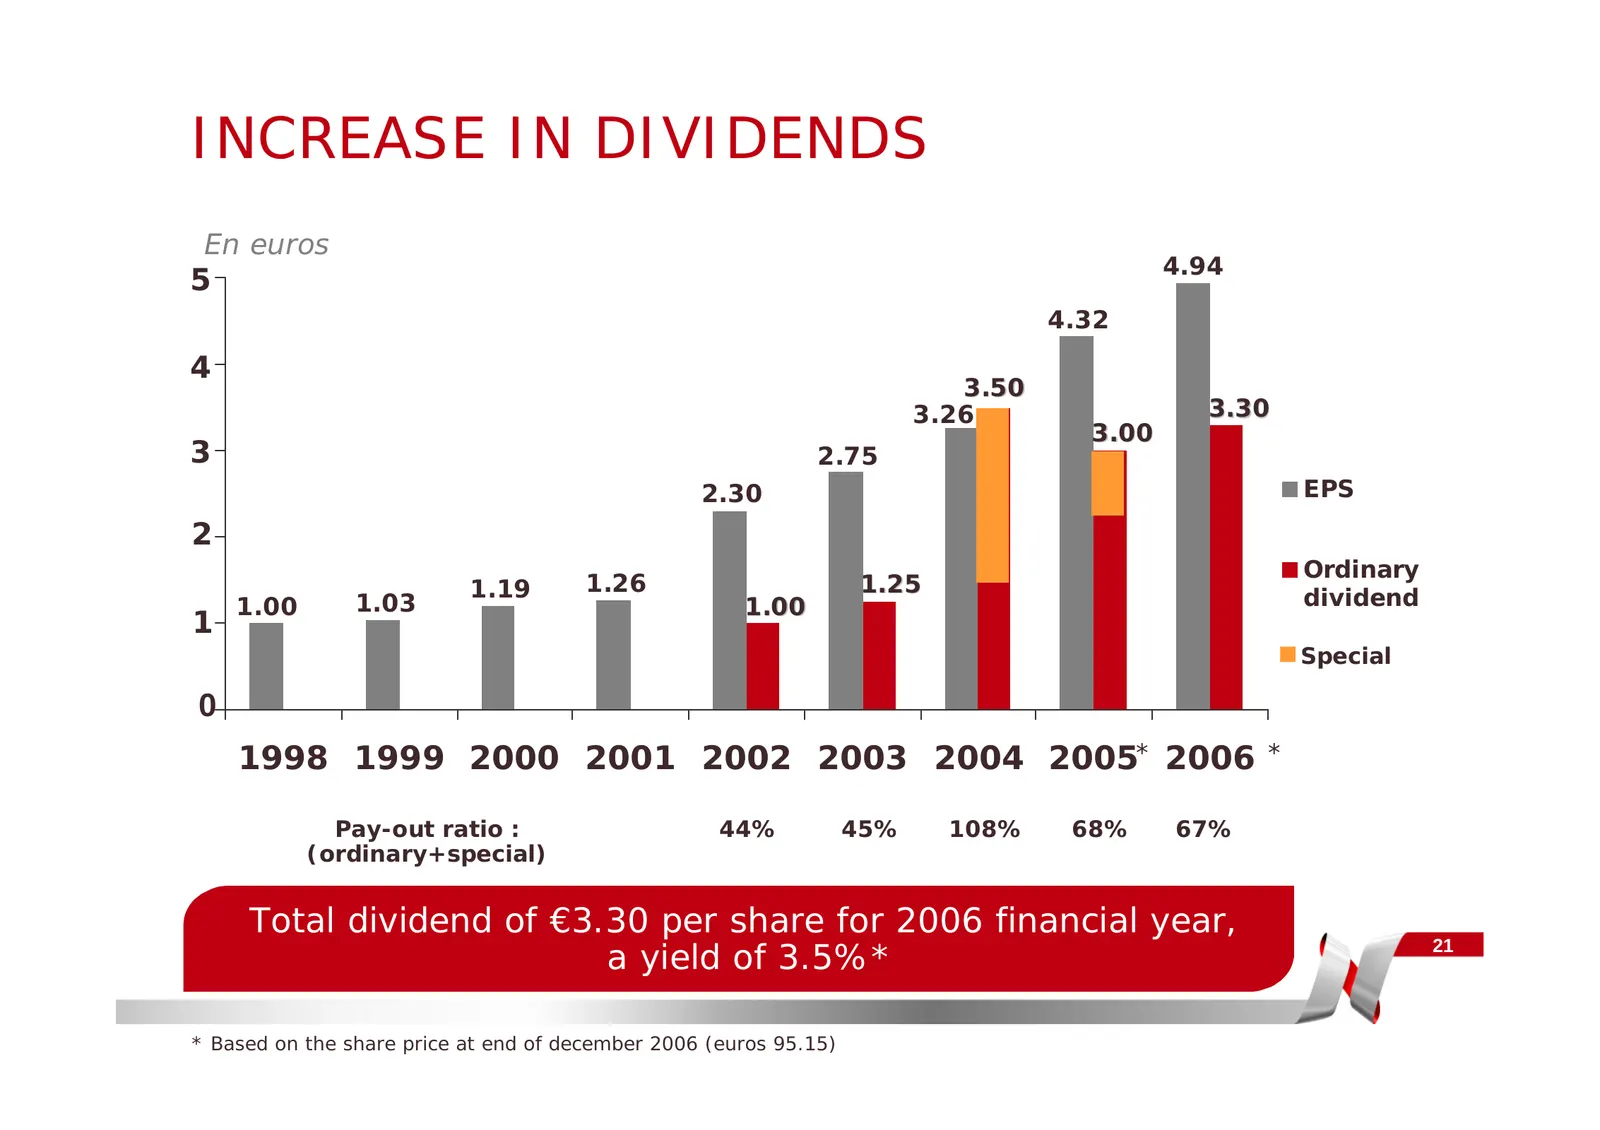
INCREASE IN DIVIDENDS En euros 4.94 55 4.32 44 3.50 3.26 3.30 3.00 33 2.75 2.30 EPS 22 Ordinary 1.19 1.26 1.25 1.00 1.03 1.00 dividend 11 Special 00 1998 1999 2000 2001 2002 2003 2004 2005* 2006 * Pay-out ratio : 44% 45% 108% 68% 67% (ordinary+special) Total dividend of €3.30 per share for 2006 fi
Slide 22: Market Trends
MARKET TRENDS 22
Slide 23: Postal Sector Evolution
POSTAL SECTOR EVOLUTION Mail volume: generally flat or slightly up In the US, mail volume grew by +1.1% per year during the last 5 years (2002-2006 period) Deregulation in Europe: Acceleration of the opening up to competition A situation being still different depending on the countries Economi
Slide 24: Modernisation of Postal Operators' Business
MODERNISATION OF POSTAL OPERATORS’ BUSINESS Automation of mail sorting processes Strong productivity gains New differentiated services possible (next-day, 3-day delivery, …) New marketing and sales practices Incentive prices and increased complexity of pricing structures New services Improveme
Slide 25: Transformation of the Value Chain
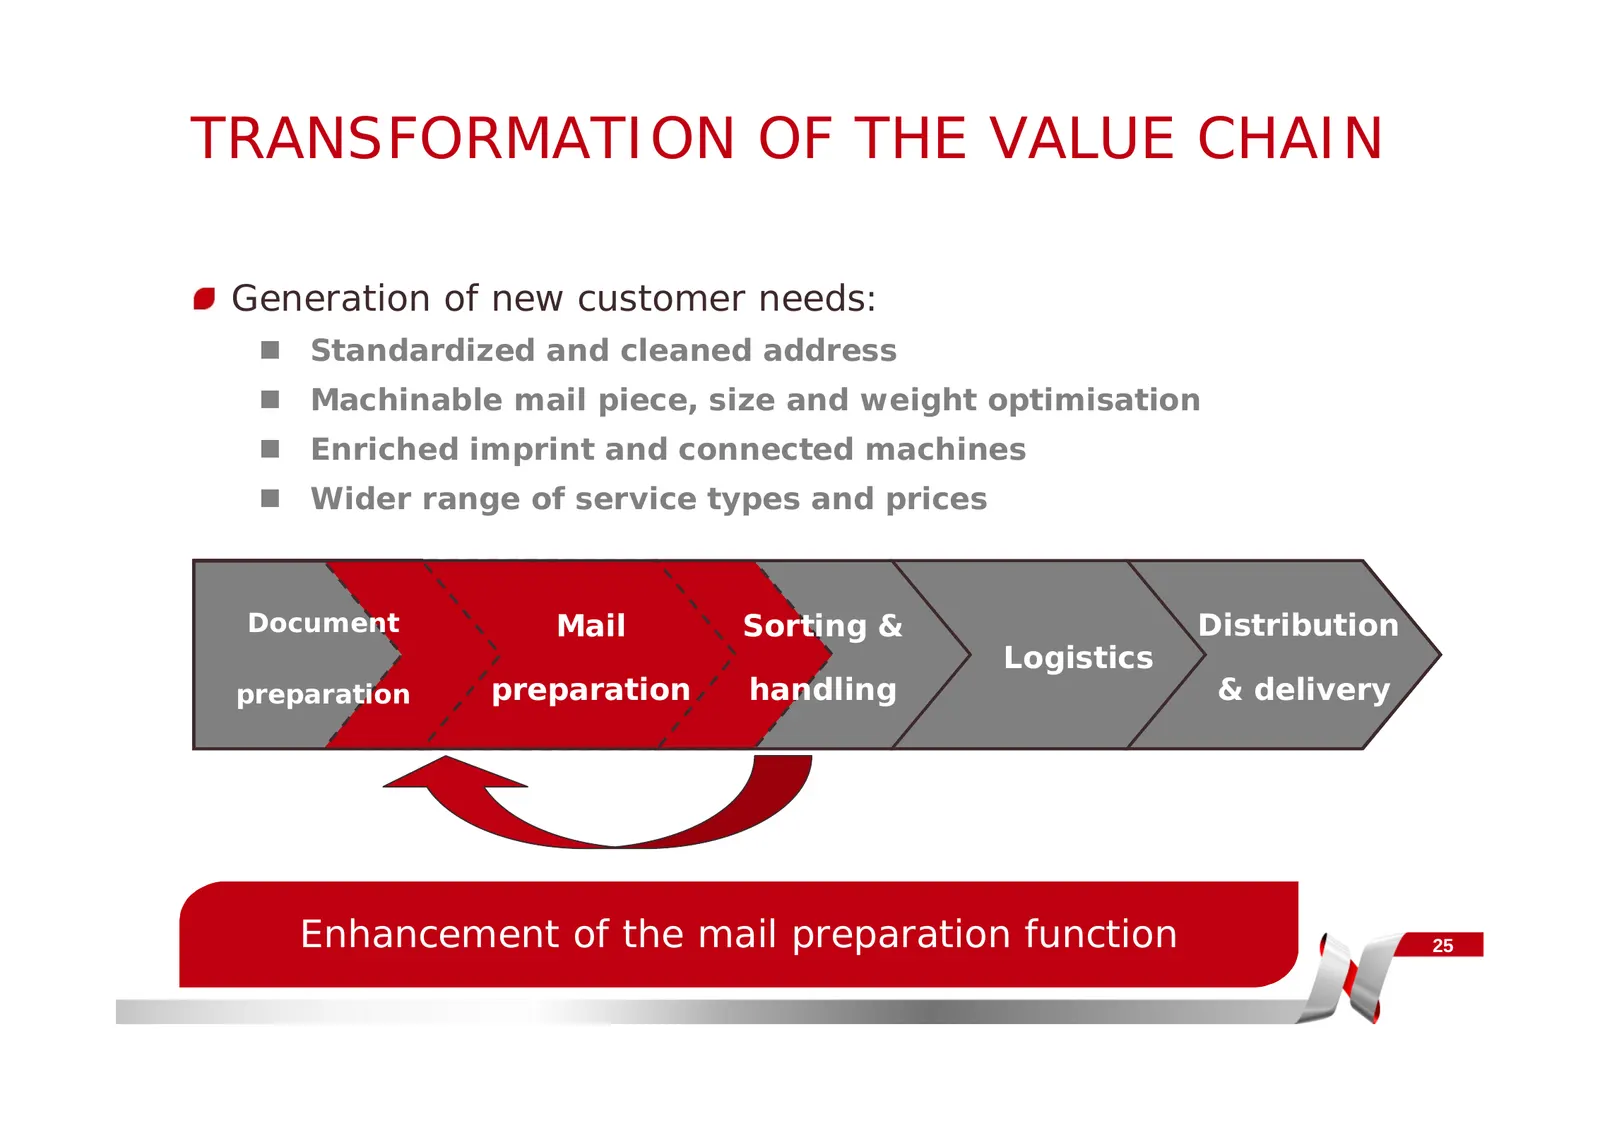
TRANSFORMATION OF THE VALUE CHAIN Generation of new customer needs: Standardized and cleaned address Machinable mail piece, size and weight optimisation Enriched imprint and connected machines Wider range of service types and prices Préparation Document Préparation Préparation Mail Préparati
Slide 26: New Opportunities in Neopost's Core Business
NEW OPPORTUNITIES IN NEOPOST’S CORE BUSINESS Acceleration of equipment renewal Effect comparable to decertifications Customer acquisition of new tools or accessories Dynamic scales helping automate calculation of prices (weight and size) Folding/inserting machines to take advantage of best pos
Slide 27: Sustainable Favourable Conditions
SUSTAINABLE FAVOURABLE CONDITIONS On top of decertifications, expansion of supplies and online services… these new technological and regulatory changes will continue to support the market Changes currently in progress 2006: United Kingdom => Pricing In Proportion 2007: USA => Shape-Based Pricing D
Slide 28: The Neopost Model
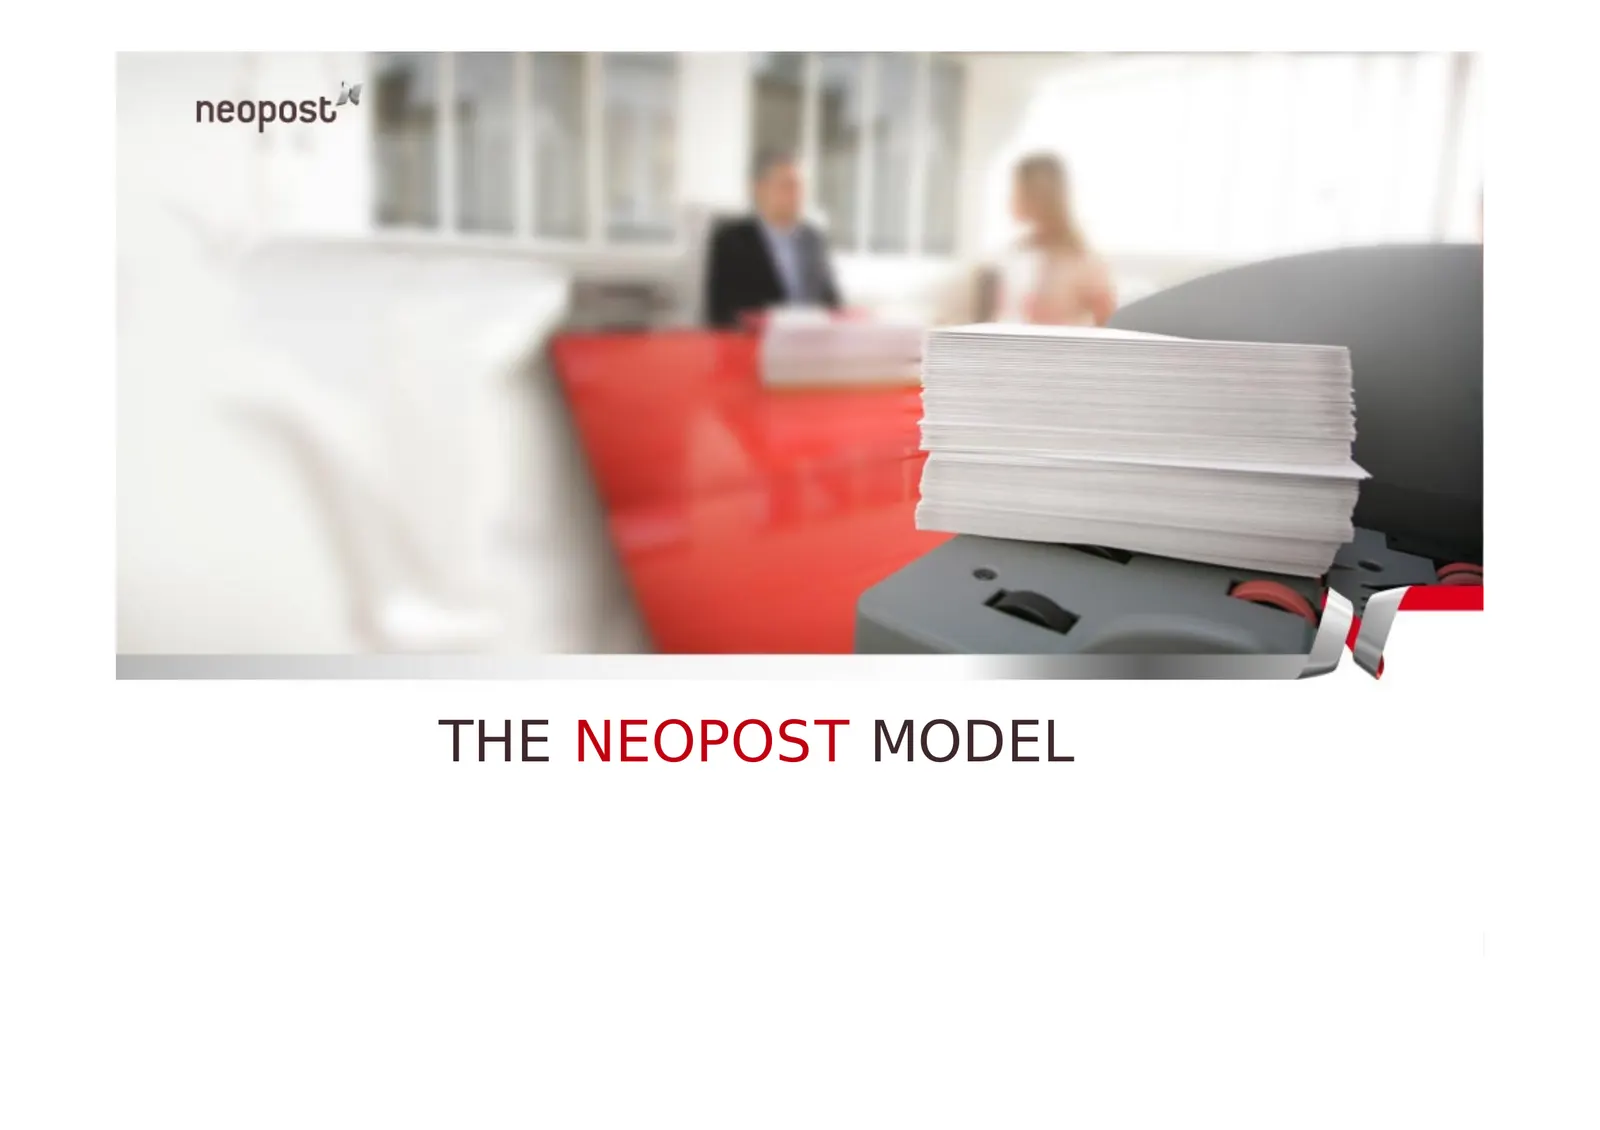
neopost | THE NEOPOST MODEL
Slide 29: Neopost's Strengths
NEOPOST’S STRENGTHS Partner to postal services: long-term relationship and anticipation Decentralised structure: closeness and ability to react Technological innovation: continuous R&D spending Challenger in changing market: sales dynamism Model for growth 29
Slide 30: The Neopost Model
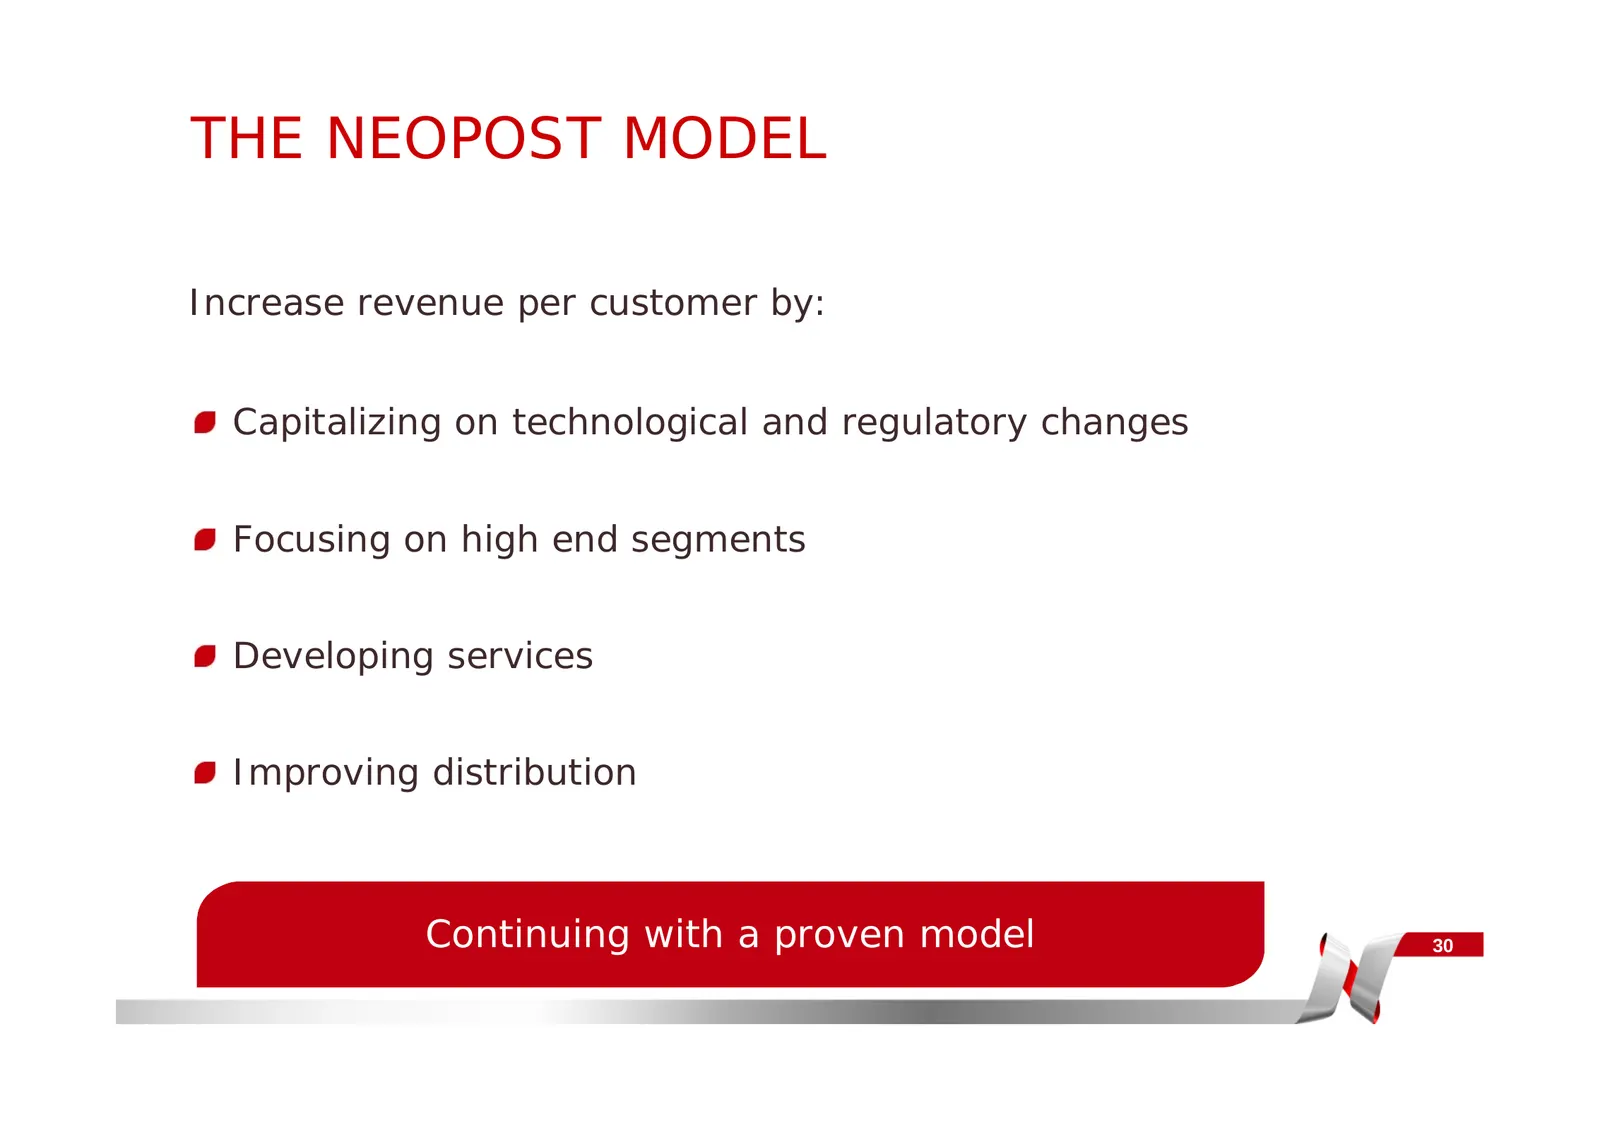
THE NEOPOST MODEL Increase revenue per customer by: Capitalizing on technological and regulatory changes Focusing on high end segments Developing services Improving distribution Continuing with a proven model 30
Slide 31: Capitalizing on Technological and Regulatory Changes
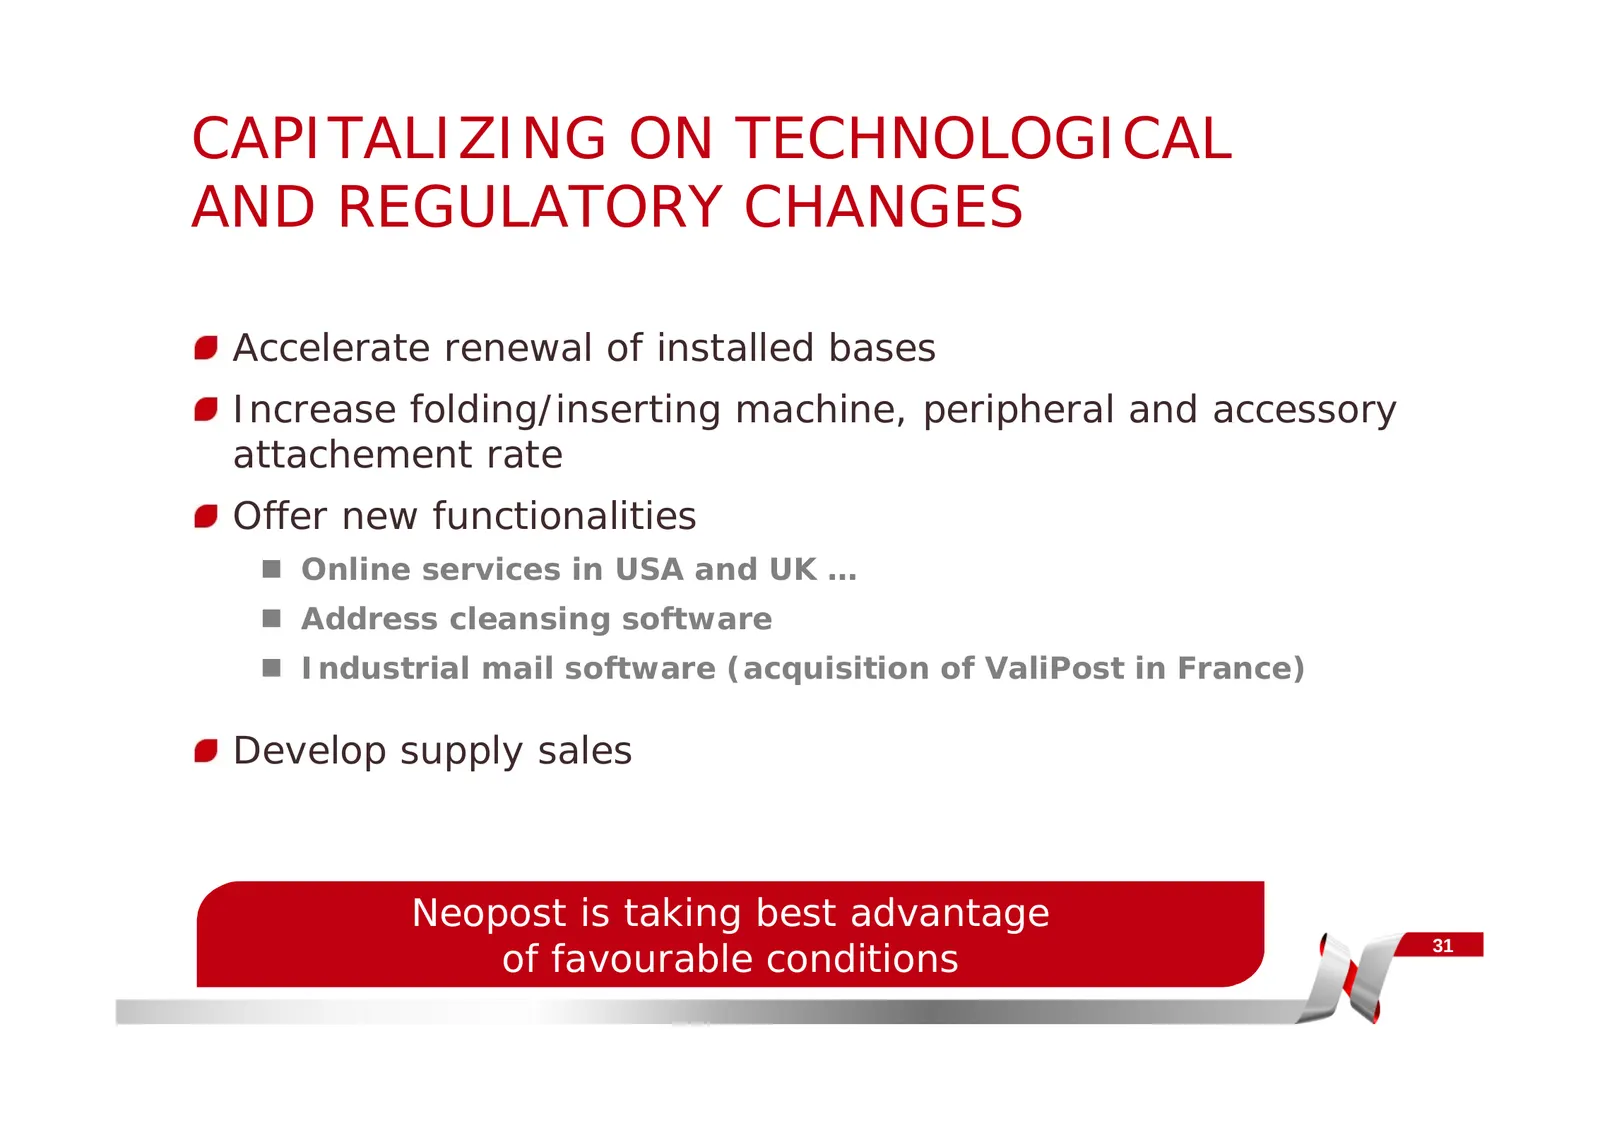
CAPITALIZING ON TECHNOLOGICAL AND REGULATORY CHANGES Accelerate renewal of installed bases Increase folding/inserting machine, peripheral and accessory attachement rate Offer new functionalities Online services in USA and UK … Address cleansing software Industrial mail software (acquisition of
Slide 32: Focusing on High End Segments
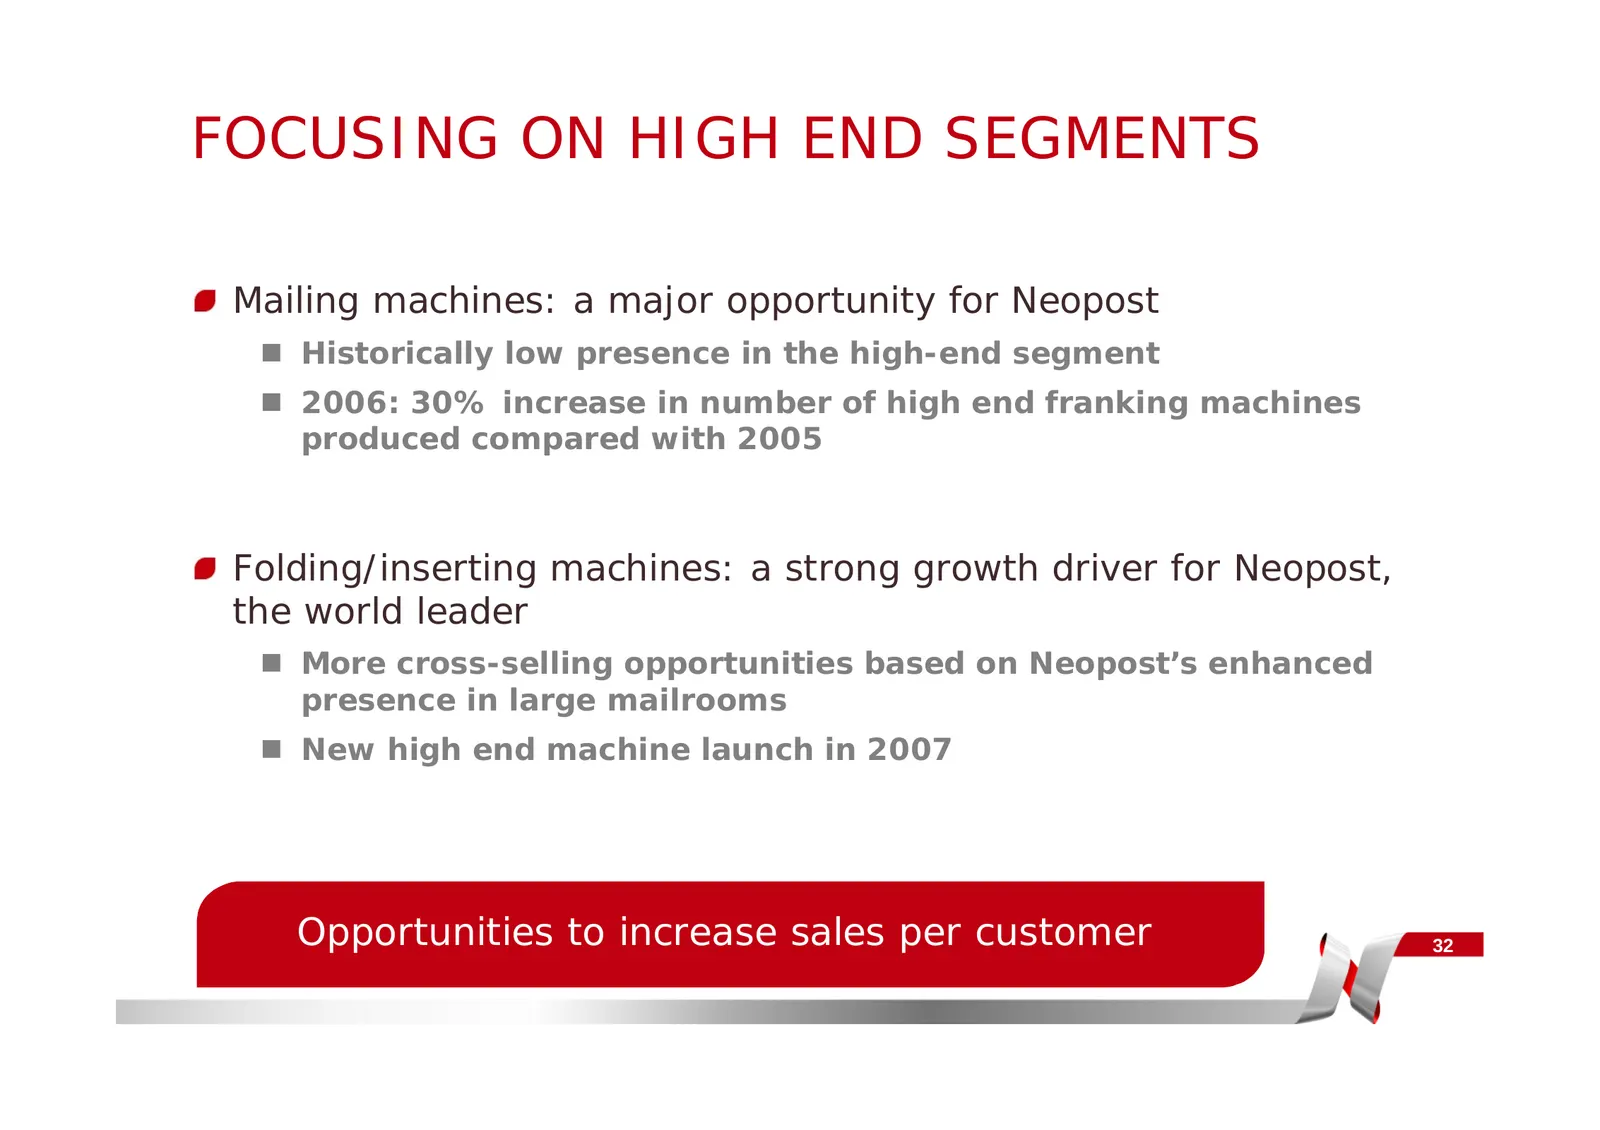
FOCUSING ON HIGH END SEGMENTS Mailing machines: a major opportunity for Neopost Historically low presence in the high-end segment 2006: 30% increase in number of high end franking machines produced compared with 2005 Folding/inserting machines: a strong growth driver for Neopost, the world leade
Slide 33: Developing Financial Services
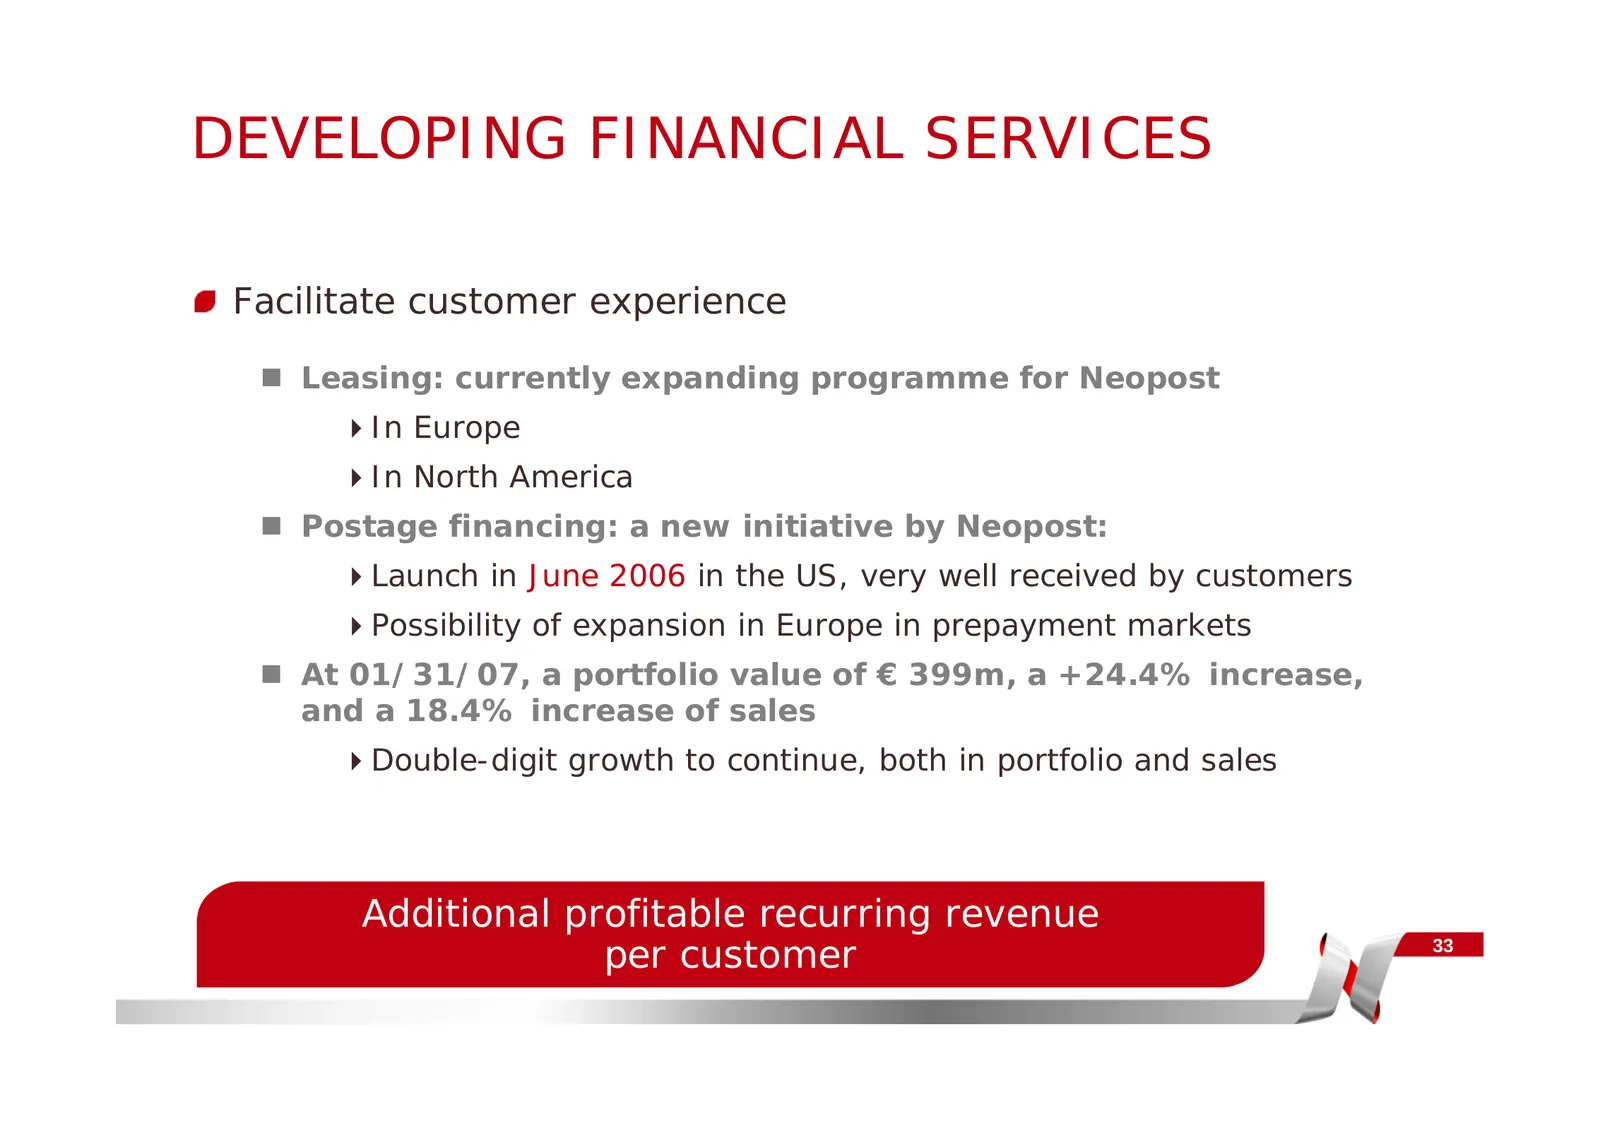
DEVELOPING FINANCIAL SERVICES Facilitate customer experience Leasing: currently expanding programme for Neopost In Europe In North America Postage financing: a new initiative by Neopost: Launch in June 2006 in the US, very well received by customers Possibility of expansion in Europe in prepayme
Slide 34: Improving Distribution
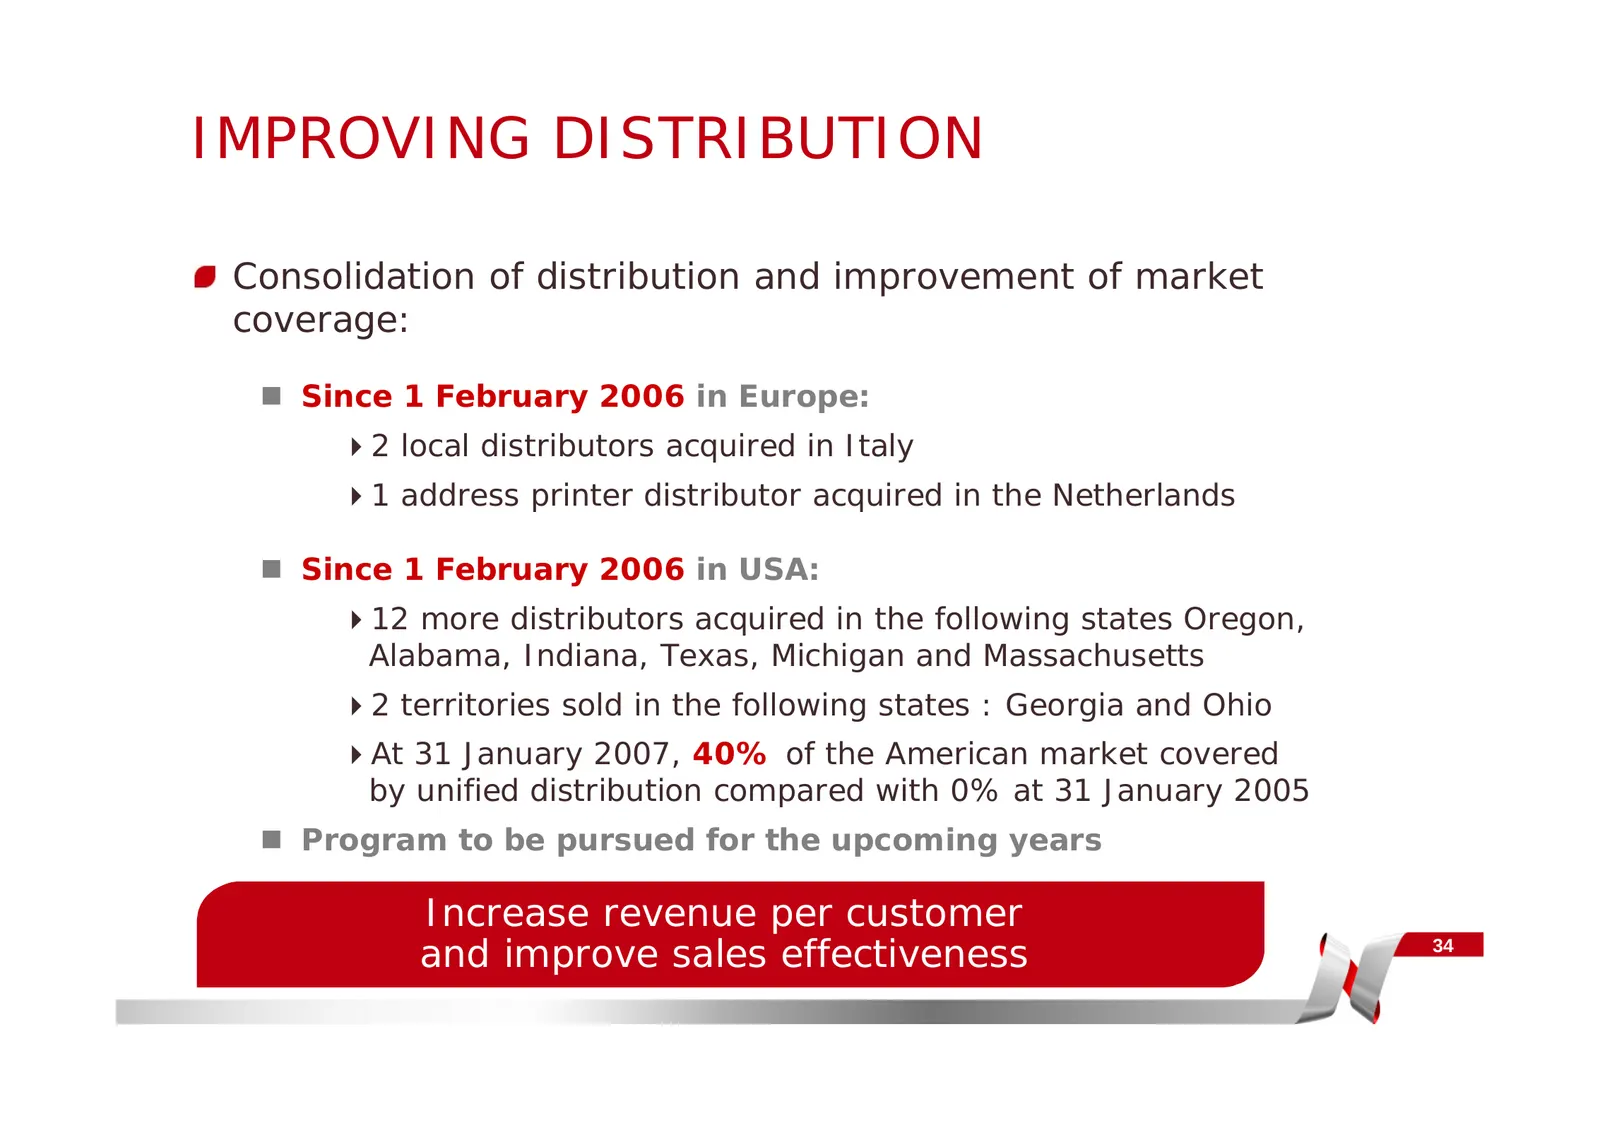
IMPROVING DISTRIBUTION Consolidation of distribution and improvement of market coverage: Since 1 February 2006 in Europe: 2 local distributors acquired in Italy 1 address printer distributor acquired in the Netherlands Since 1 February 2006 in USA: 12 more distributors acquired in the following
Slide 35: Profitability
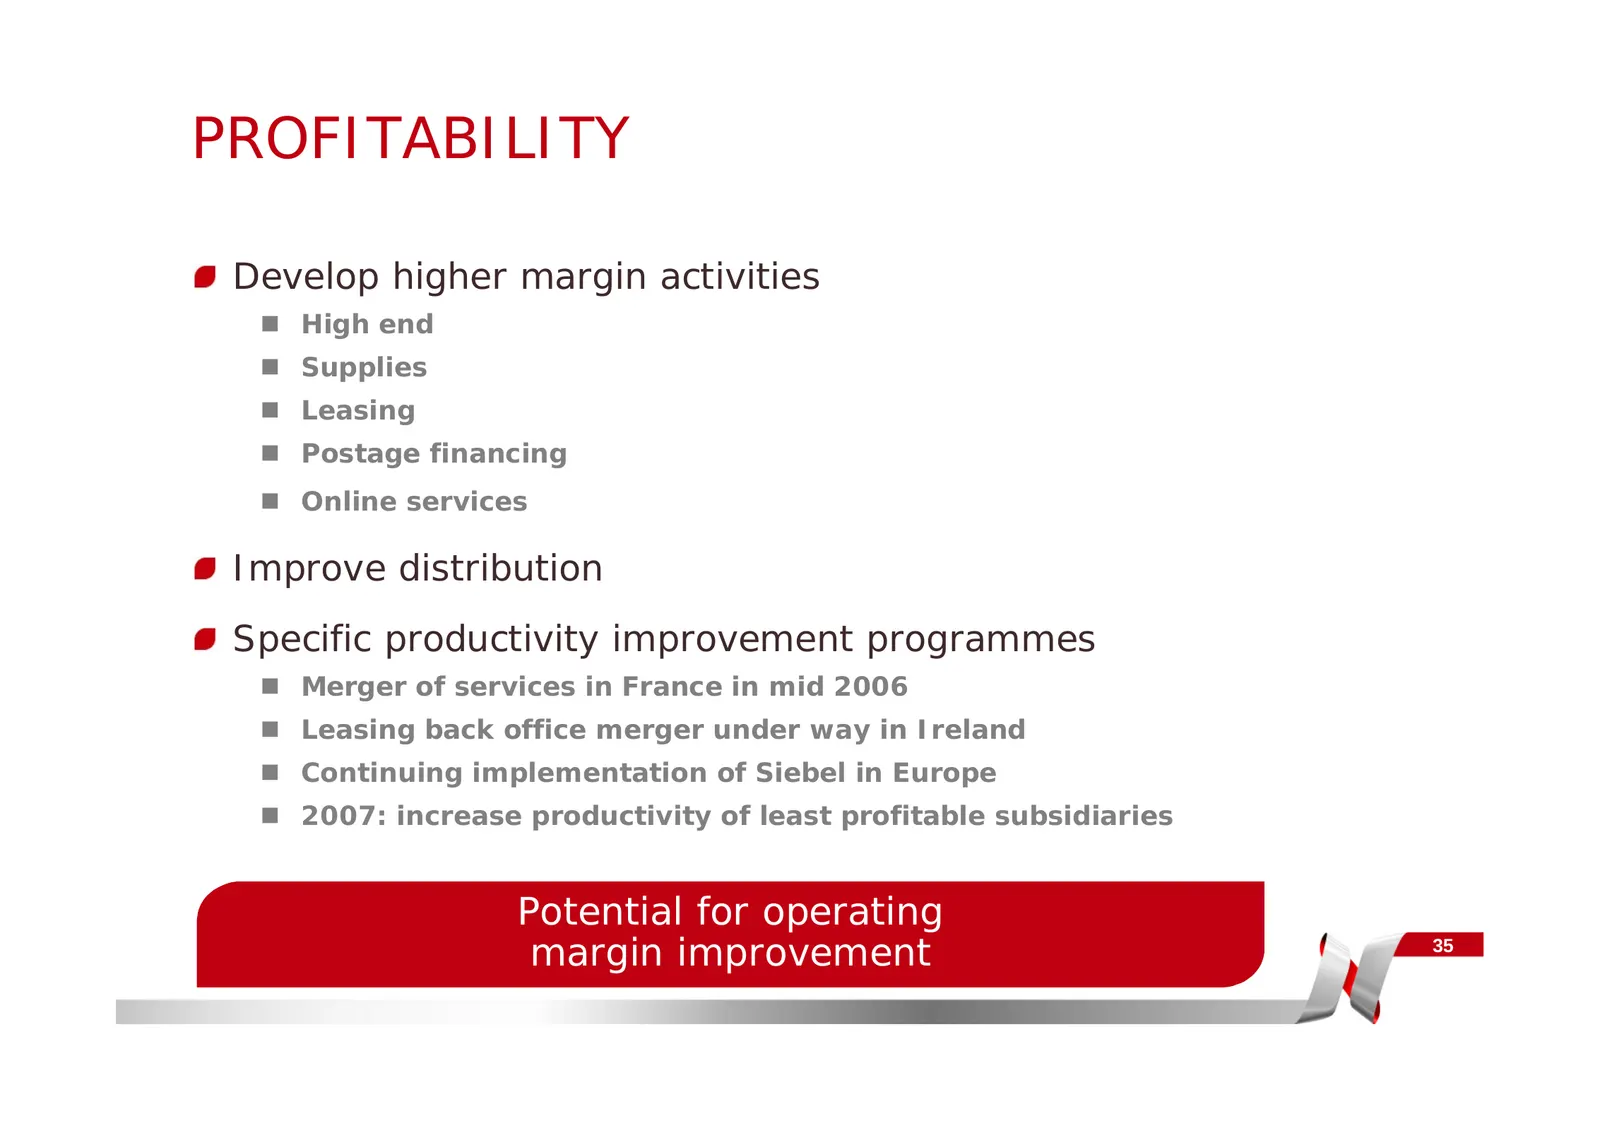
PROFITABILITY Develop higher margin activities High end Supplies Leasing Postage financing Online services Improve distribution Specific productivity improvement programmes Merger of services in France in mid 2006 Leasing back office merger under way in Ireland Continuing implementat

Slide 36: Outlook
OUTLOOK 36
Slide 37: Outlook
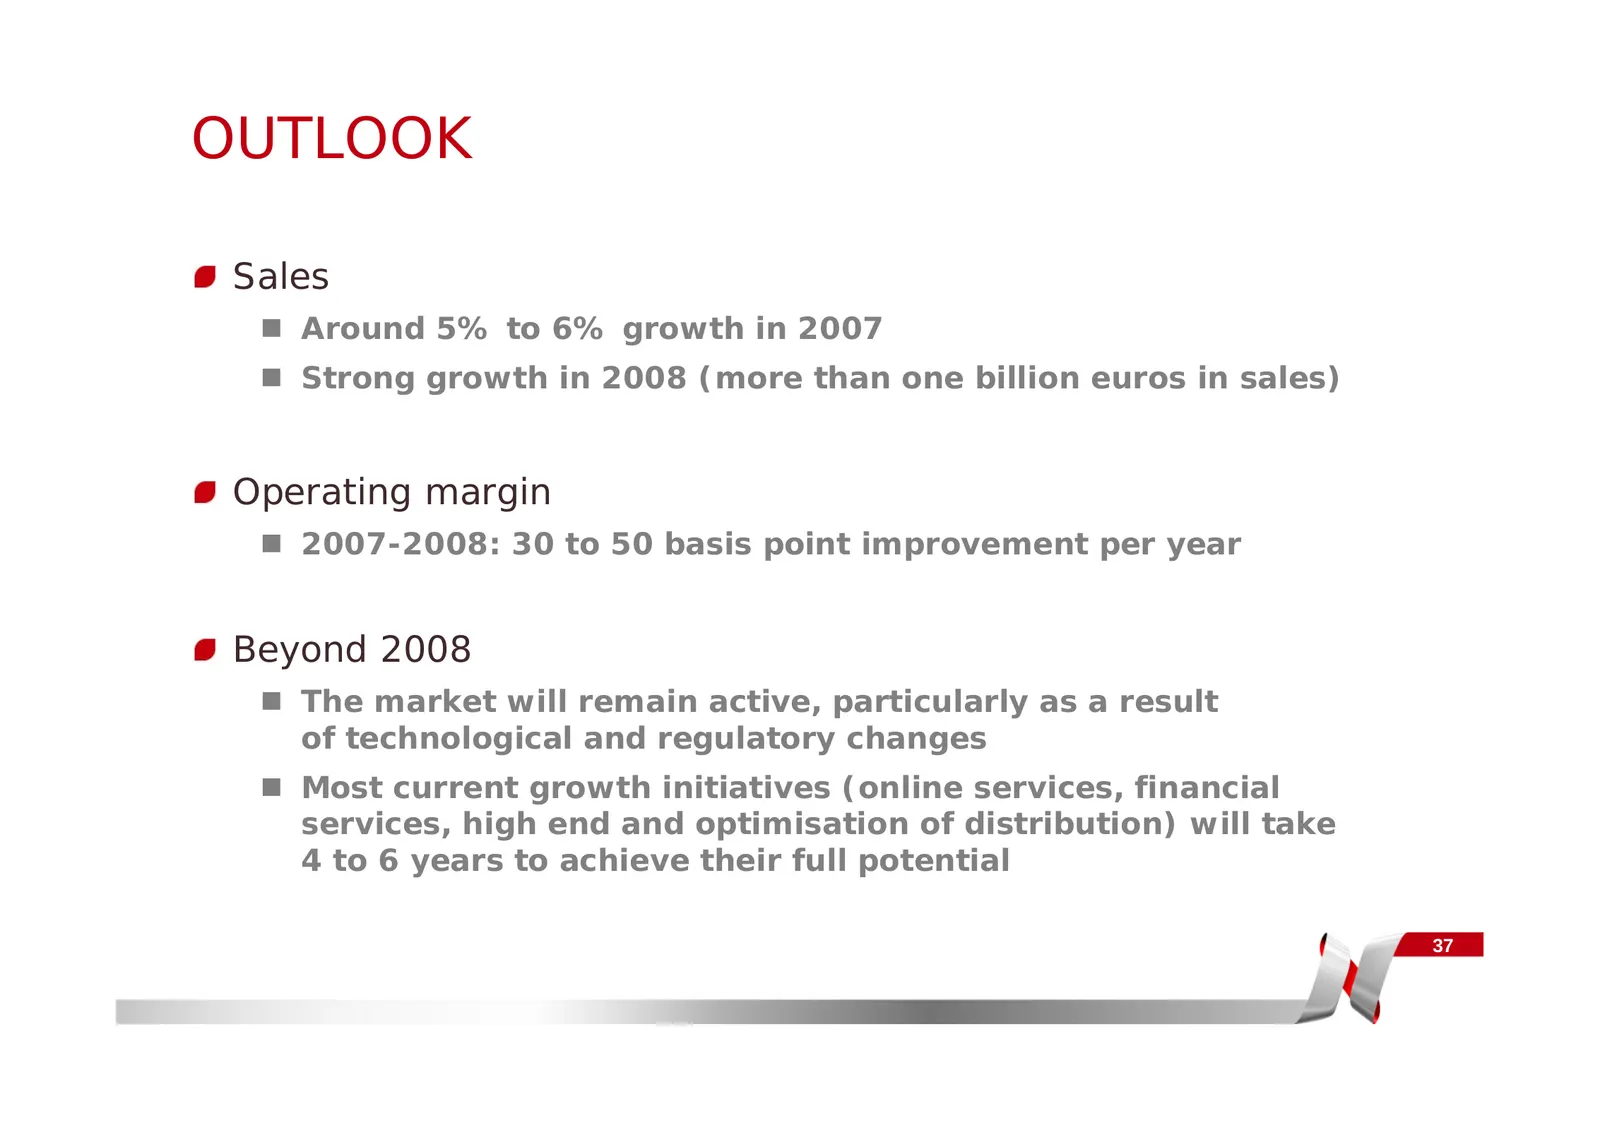
OUTLOOK Sales Around 5% to 6% growth in 2007 Strong growth in 2008 (more than one billion euros in sales) Operating margin 2007-2008: 30 to 50 basis point improvement per year Beyond 2008 The market will remain active, particularly as a result of technological and regulatory changes Most c
Slide 38: Appendix
APPENDIX 38
Slide 39: Consolidated Balance Sheets (1/2)
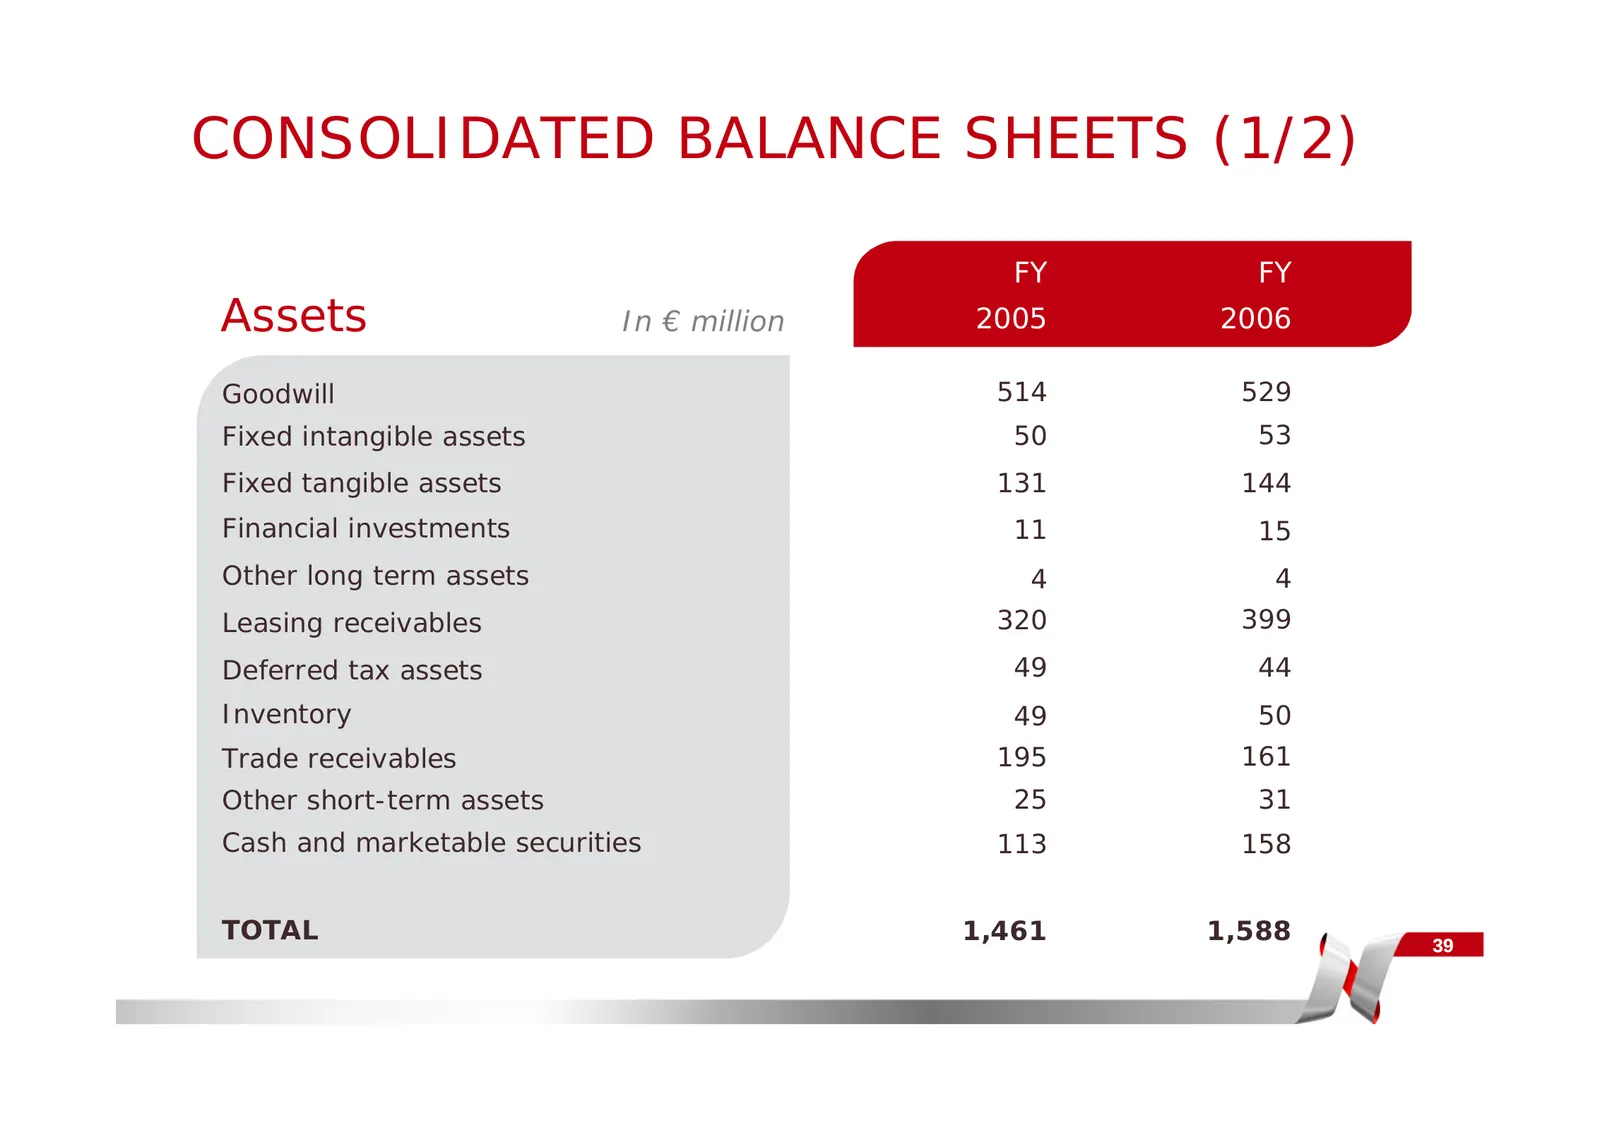
CONSOLIDATED BALANCE SHEETS (1/2) FY FY Assets In € million 2005 2006 Goodwill 514 529 Fixed intangible assets 50 53 Fixed tangible assets 131 144 Financial investments 11 15 Other long term assets 4 4 Leasing receivables 320 399 Deferred tax assets 49 44 Inventory 49 50 Trade receivables 195 161 Ot
Slide 40: Consolidated Balance Sheets (2/2)
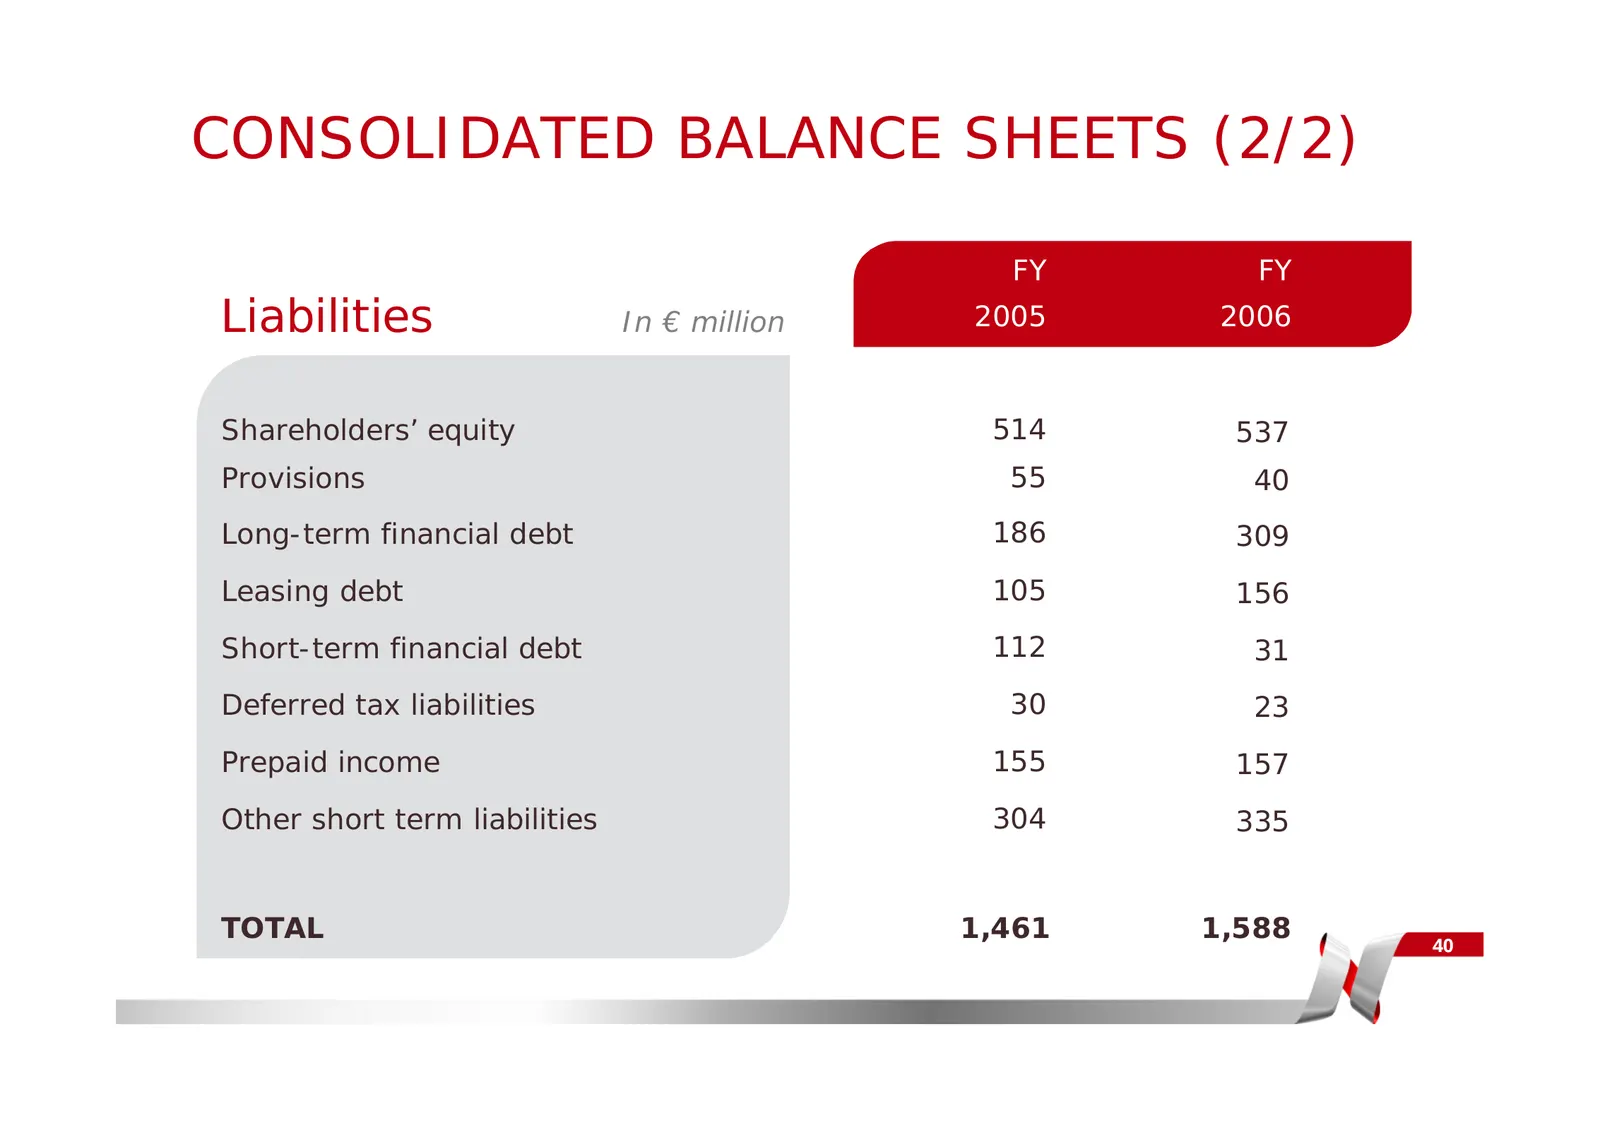
CONSOLIDATED BALANCE SHEETS (2/2) FY FY Liabilities In € million 2005 2006 Shareholders’ equity 514 537 Provisions 55 40 Long-term financial debt 186 309 Leasing debt 105 156 Short-term financial debt 112 31 Deferred tax liabilities 30 23 Prepaid income 155 157 Other short term liabilities 304 335 T
Source: Internet Archive copy of resources.quadient.com
More decks from Quadient SA
 H1 2026 Earnings Presentation43 slides · Sep 23, 2026
 Shareholder Meeting (June 2026)41 slides · Jun 18, 2026
 FY2025 Earnings Presentation52 slides · Mar 25, 2026
 Q3 2025 Earnings Presentation31 slides · Dec 2, 2025
 H1 2025 Earnings Presentation40 slides · Sep 24, 2025
 Shareholder Meeting (June 2025)35 slides · Jun 13, 2025