Energysouth — AG Edwards conference, New York, May 2007
30 slides from Energysouth's conference presentation, May 15, 2007
Slide 1: EnergySouth, Inc. AG Edwards New York, May 2007
EnergySouth, Inc. AG Edwards New York, New York May 2007
Slide 2: Forward-Looking Statements
Forward-Looking Statements Statements contained in this report, which are not historical in nature, are forward-looking statements within the meaning of the Private Securities Litigation Reform Act of 1995. Such forward-looking statements are made as of the date of this report and involve known and
Slide 3: Charlie Huffman, Senior Vice President & CFO
Charlie Huffman Senior Vice President & CFO
Slide 4: EnergySouth Business Segments
EnergySouth Business Segments Natural Gas Distribution - Mobile Gas Natural Gas Storage - Bay Gas
Slide 5: EnergySouth Complementary Businesses
EnergySouth Complementary Businesses Mobile Gas - Good regulatory environment - Consistently strong earnings/cash flow Bay Gas Storage - Strong earnings and cash flow - Excellent prospects for investing in growth assets
Slide 6: Mobile Gas
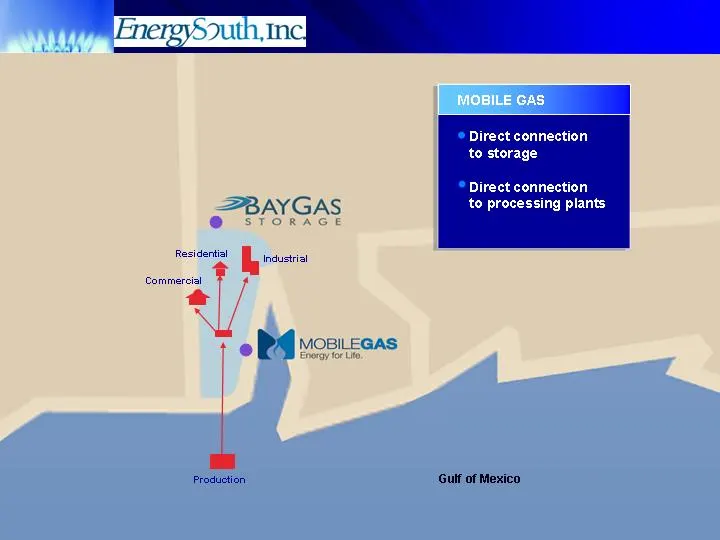
Gulf of Mexico Direct connection to storage Direct connection to processing plants MOBILE GAS Production Commercial Residential Industrial
Slide 7: Mobile Gas RSE
Mobile Gas RSE Return on equity range Annual adjustment to rates based on budget Quarterly review Extended to September 30, 2009
Slide 8: Salt Dome Storage
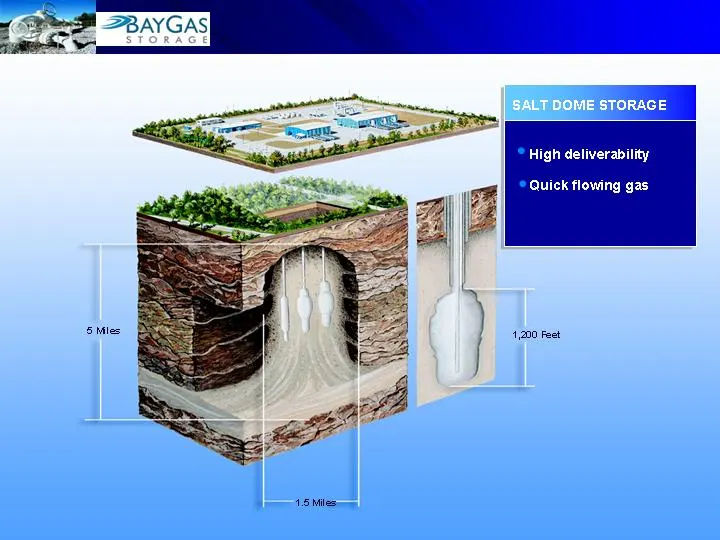
1.5 Miles High deliverability Quick flowing gas 5 Miles 1,200 Feet SALT DOME STORAGE
Slide 9: Solution Mining Well
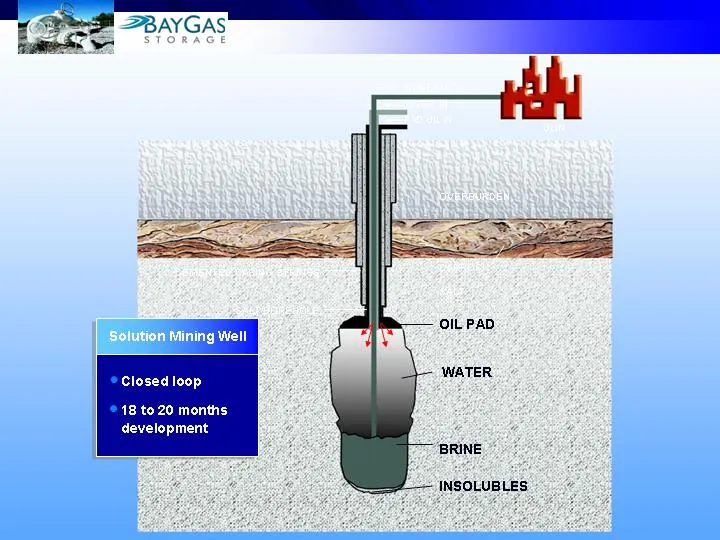
BRINE OUT WATER IN PAD OIL IN OVERBURDEN CAPROCK SALT CEMENTED CASING STRINGS SALT BOREHOLE OIL PAD WATER BRINE INSOLUBLES OLIN Closed loop 18 to 20 months development Solution Mining Well
Slide 10: Caverns
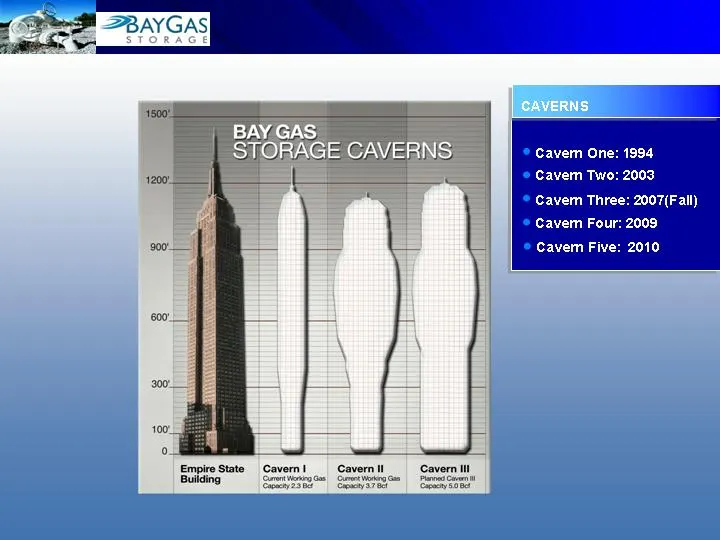
Cavern One: 1994 Cavern Two: 2003 Cavern Three: 2007(Fall) Cavern Four: 2009 Cavern Five: 2010 CAVERNS
Slide 11: Bay Gas Regulation
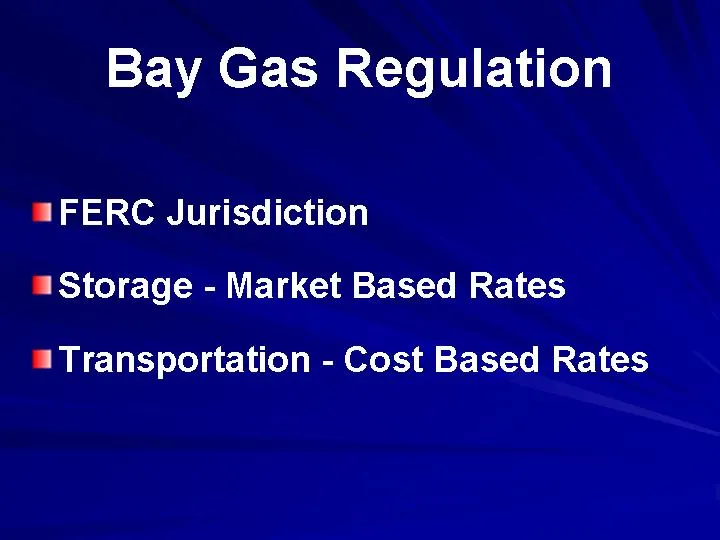
Bay Gas Regulation FERC Jurisdiction Storage - Market Based Rates Transportation - Cost Based Rates
Slide 12: Bay Gas Storage Capacity
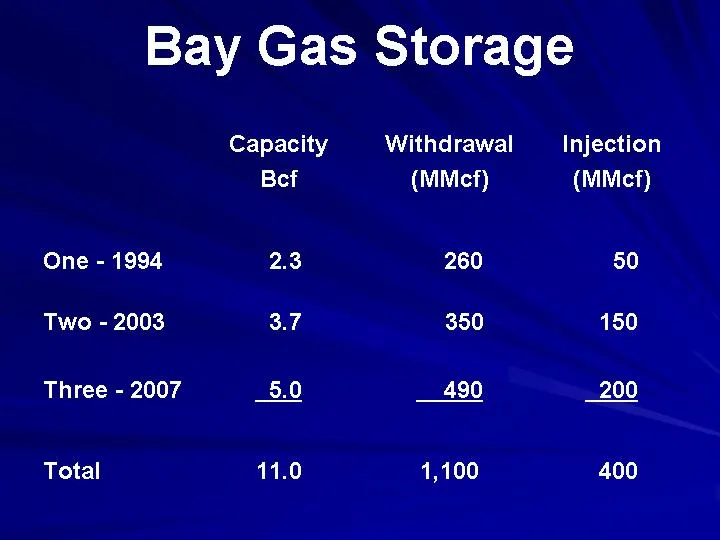
Bay Gas Storage Capacity Bcf Withdrawal (MMcf) Withdrawal (MMcf) Injection (MMcf) One - 1994 2.3 260 260 50 Two - 2003 3.7 3.7 350 150 Three - 2007 5.0 490 490 200 Total 11.0 1,100 1,100 400
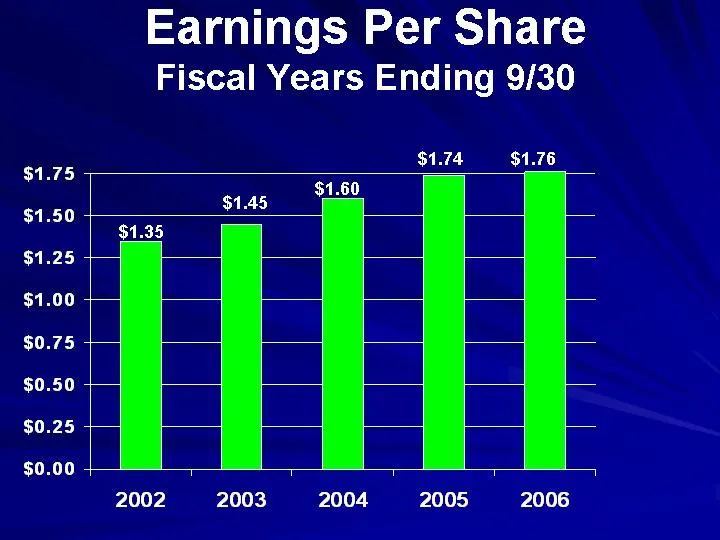
Slide 13: Earnings Per Share, Fiscal Years Ending 9/30
Earnings Per Share Fiscal Years Ending 9/30 2002 2003 2004 2005 2006 1.35 1.45 1.6 1.74 1.76 $1.35 $1.45 $1.60 $1.76 $1.74
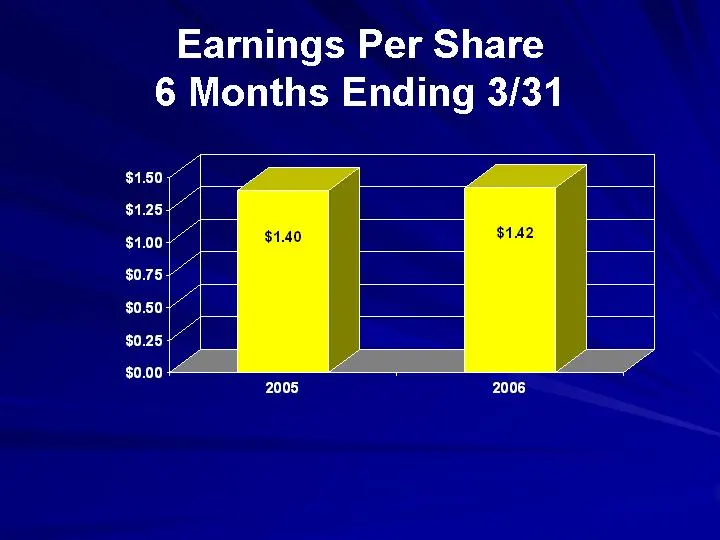
Slide 14: Earnings Per Share, Months Ending 3/31
Earnings Per Share 6 Months Ending 3/31 2005 2006 0.56 0.57 2005 2006 East 1.4 1.42
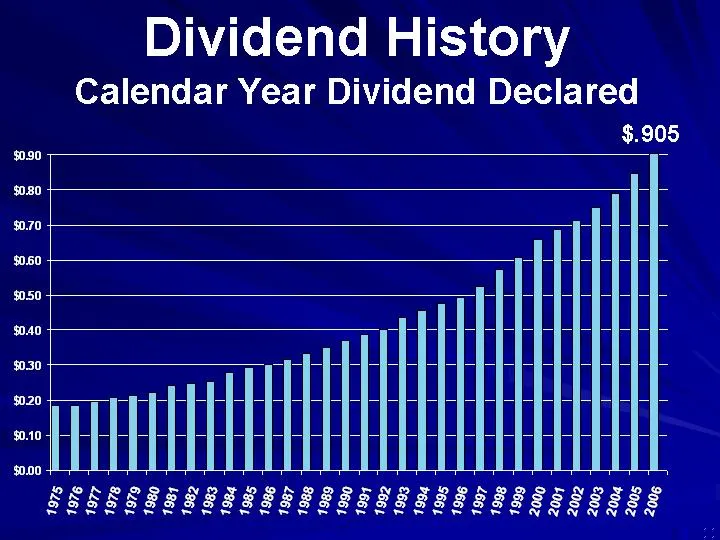
Slide 15: Dividend History
1975 1976 1977 1978 1979 1980 1981 1982 1983 1984 1985 1986 1987 1988 1989 1990 1991 1992 1993 1994 1995 1996 1997 1998 1999 2000 2001 2002 2003 2004 2005 2006 East 0.184 0.185 0.196 0.206 0.213 0.222 0.243 0.249 0.255 0.279 0.293 0.302 0.317 0.333 0.351 0.369 0.387 0.404 0.436 0.458 0.476 0.493 0.5
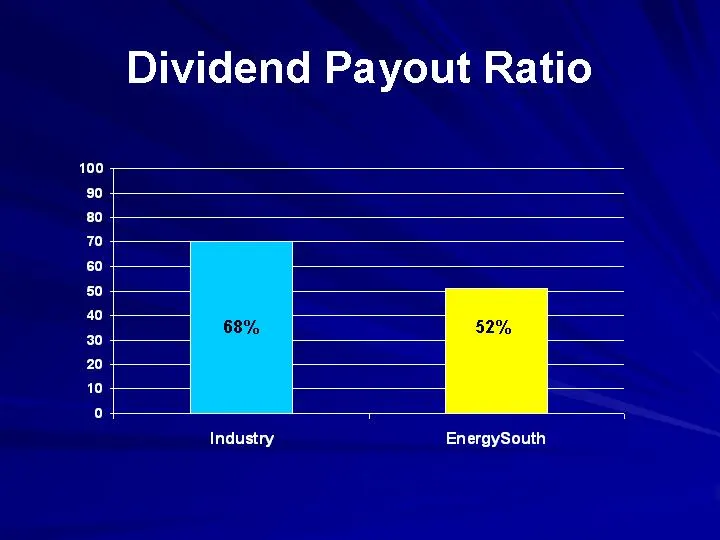
Slide 16: Dividend Payout Ratio
Dividend Payout Ratio 1st Qtr 2nd Qtr 3rd Qtr 4th Qtr East 20.4 27.4 90 20.4 West 30.6 38.6 34.6 31.6 North 45.9 46.9 45 43.9 Industry EnergySouth 70 51 68% 52%
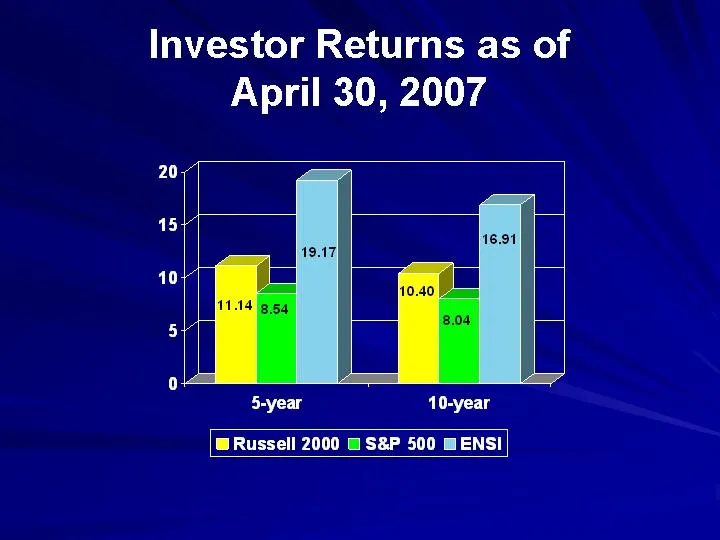
Slide 17: Investor Returns as of April 30, 2007
Investor Returns as of April 30, 2007 5-year 10-year Russell 2000 11.14 10.4 S&P 500 8.54 8.04 ENSI 19.17 16.91
Slide 18: Dean Liollio, President & CEO
Dean Liollio President & CEO
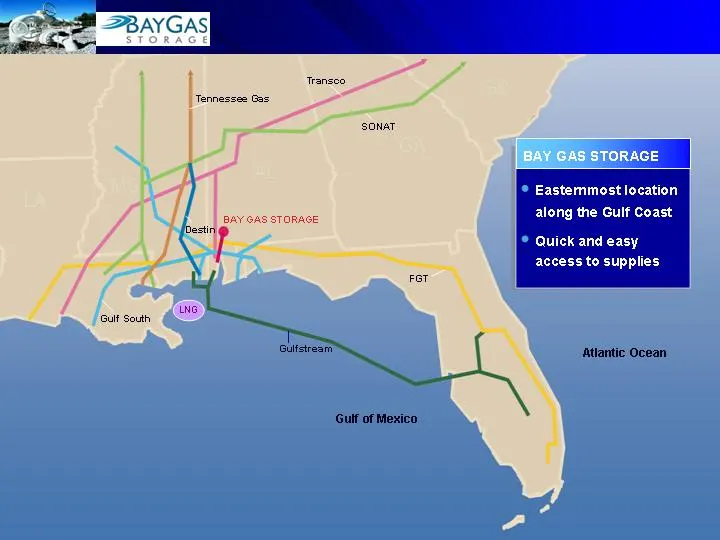
Slide 19: Bay Gas Storage Location
Gulfstream BAY GAS STORAGE Easternmost location along the Gulf Coast Quick and easy access to supplies SONAT Transco Gulf South Tennessee Gas Destin Gulf of Mexico FGT Atlantic Ocean BAY GAS STORAGE LNG
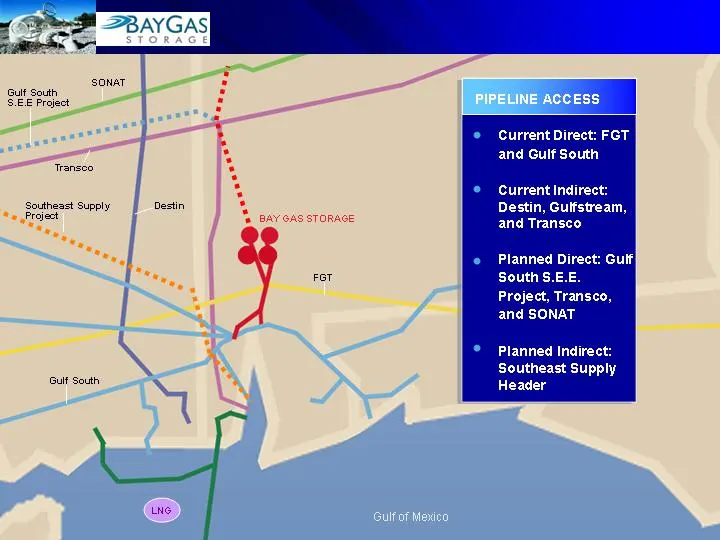
Slide 20: Pipeline Access
Gulf of Mexico LNG BAY GAS STORAGE Destin FGT Gulf South SONAT Gulf South S.E.E Project Transco Southeast Supply Project Current Direct: FGT and Gulf South Current Indirect: Destin, Gulfstream, and Transco Planned Direct: Gulf South S.E.E. Project, Transco, and SONAT Planned Indirect: Southeast Supp
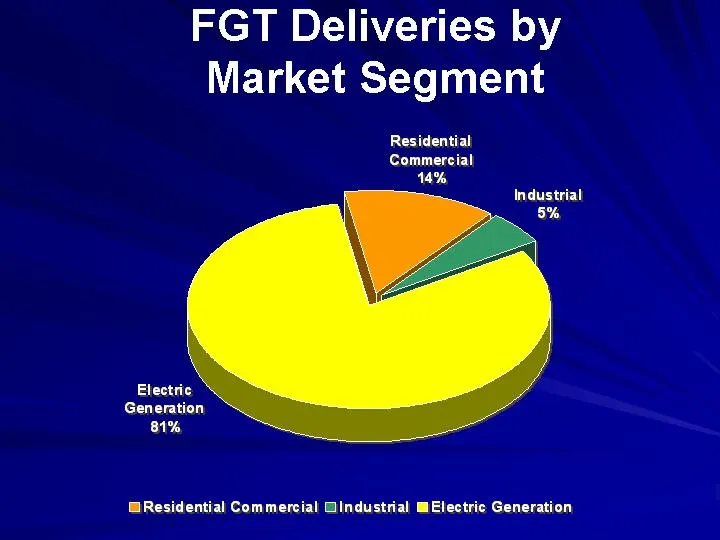
Slide 21: FGT Deliveries by Market Segment
FGT Deliveries by Market Segment Residential Commercial Industrial Electric Generation East 245 95 1470
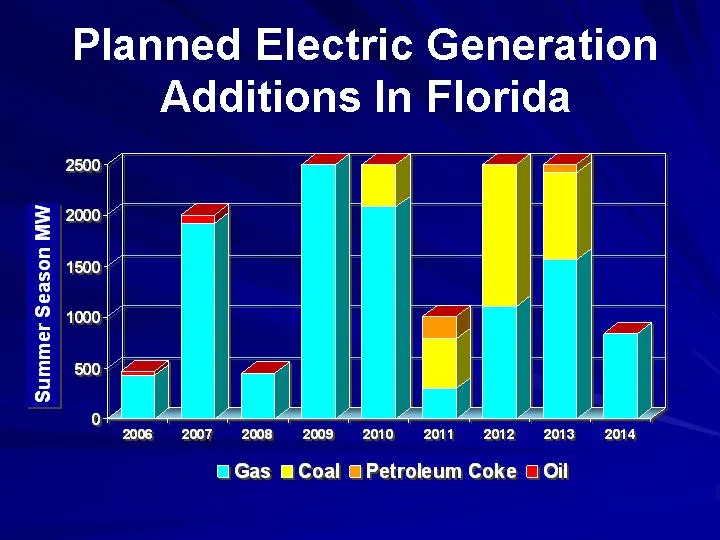
Slide 22: Planned Electric Generation Additions in Florida
Planned Electric Generation Additions In Florida 2006 2007 2008 2009 2010 2011 2012 2013 2014 Gas 430 1918 449 2508 2081 300 1103 1565 836 Coal 0 0 0 0 526 486 1600 850 0 Petroleum Coke 0 0 0 0 0 220 0 250 0 Oil 42 84 0 0 0 0 0 0 0
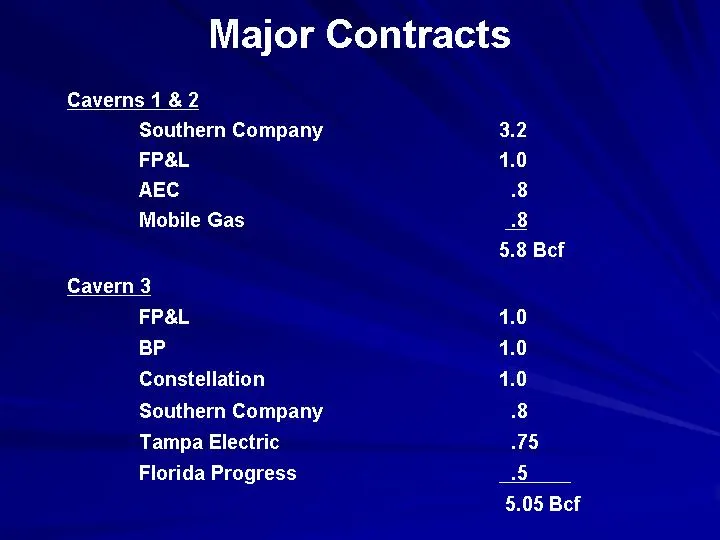
Slide 23: Major Contracts
Major Contracts Caverns 1 & 2 Southern Company 3.2 FP&L 1.0 AEC .8 Mobile Gas .8 5.8 Bcf Cavern 3 FP&L 1.0 BP 1.0 Constellation 1.0 Southern Company .8 Tampa Electric .75 Florida Progress .5 5.05 Bcf
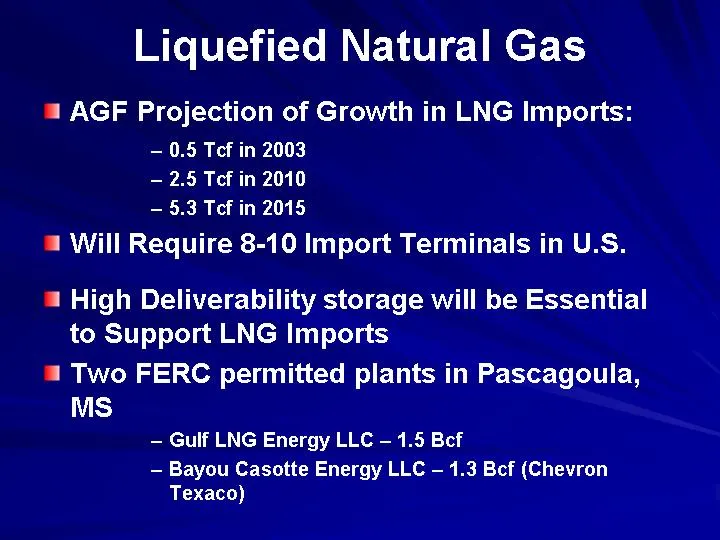
Slide 24: Liquefied Natural Gas
Liquefied Natural Gas AGF Projection of Growth in LNG Imports: 0.5 Tcf in 2003 2.5 Tcf in 2010 5.3 Tcf in 2015 Will Require 8-10 Import Terminals in U.S. High Deliverability storage will be Essential to Support LNG Imports Two FERC permitted plants in Pascagoula, MS Gulf LNG Energy LLC - 1.5 Bcf Bay
Slide 25: New Supply
New Supply Major Onshore Pipelines Barnett Shale Fayetteville Shale Pipelines Access Florida Markets at Mobile Bay Eastern Gulf Drilling Likely to "Land" at Mobile Bay
Slide 26: Recent Open Season
Recent Open Season Project Parameters: 2 New 5.0 Bcf. Caverns (10 Bcf. Total) New Interconnects with Sonat & Transco First Cavern In-Service, 2010 Open Season: Ended 11-3-06 22.0 Bcf. of Interest Expressed
Slide 27: Caverns
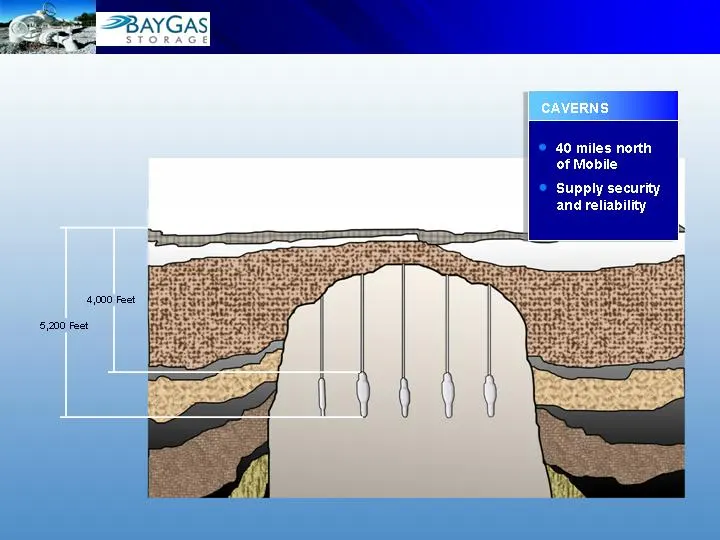
40 miles north of Mobile Supply security and reliability CAVERNS 5,200 Feet 4,000 Feet
Slide 28: What Will Set EnergySouth Apart?
WHAT WILL SET ENERGYSOUTH APART?
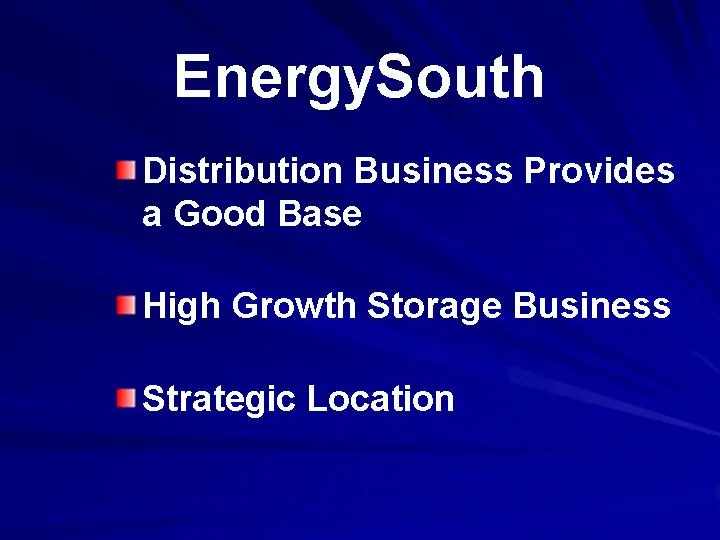
Slide 29: Distribution Provides a Good Base; High Growth Storage Business
EnergySouth Distribution Business Provides a Good Base High Growth Storage Business Strategic Location
Slide 30: EnergySouth, Inc. AG Edwards New York, May 2007
EnergySouth, Inc. AG Edwards New York, New York May 2007
Source: SEC EDGAR · 8-K filed May 15, 2007