Civitas Resources — Bonanza Creek Energy — Merger or Acquisition (November 2017)
21 slides from Civitas Resources's merger presentation, Nov 15, 2017

Slide 1: Cautionary Statements
Cautionary Statements This presentation may contain certain “forward-looking statements” within the meaning of Section 27A of the Securities Act of 1933, Section 21E of the Securities and Exchange Act of 1934 and the Private Securities Litigation Reform Act of 1995. These include statements regardin
Slide 2: Other Information
Other Information This communication does not constitute an offer to sell or the solicitation of an offer to buy any securities or a solicitation of any vote or approval. In connection with the proposed merger, SandRidge will file with the SEC a registration statement on Form S-4, which will include
Slide 3: SandRidge Acquisition of Bonanza Creek
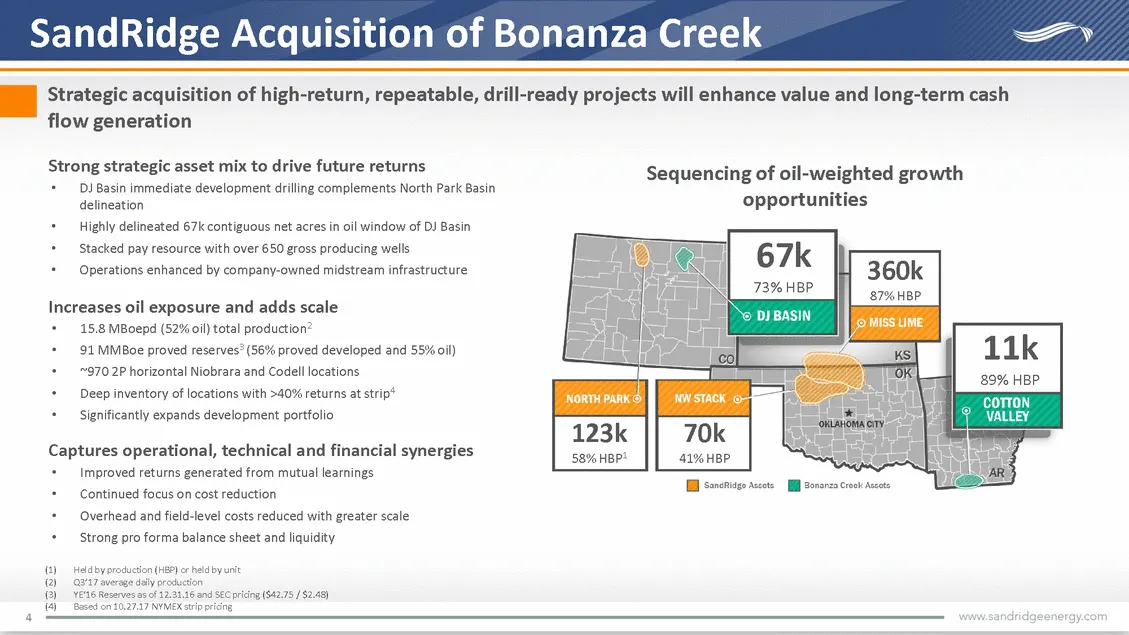
SandRidge Acquisition of Bonanza Creek Strategic acquisition of high-return, repeatable, drill-ready projects will enhance value and long-term cash flow generation Strong strategic asset mix to drive future returns 4 DJ Basin immediate development drilling complements North Park Basin delineation Hi
Slide 4: Pro Forma SandRidge Energy
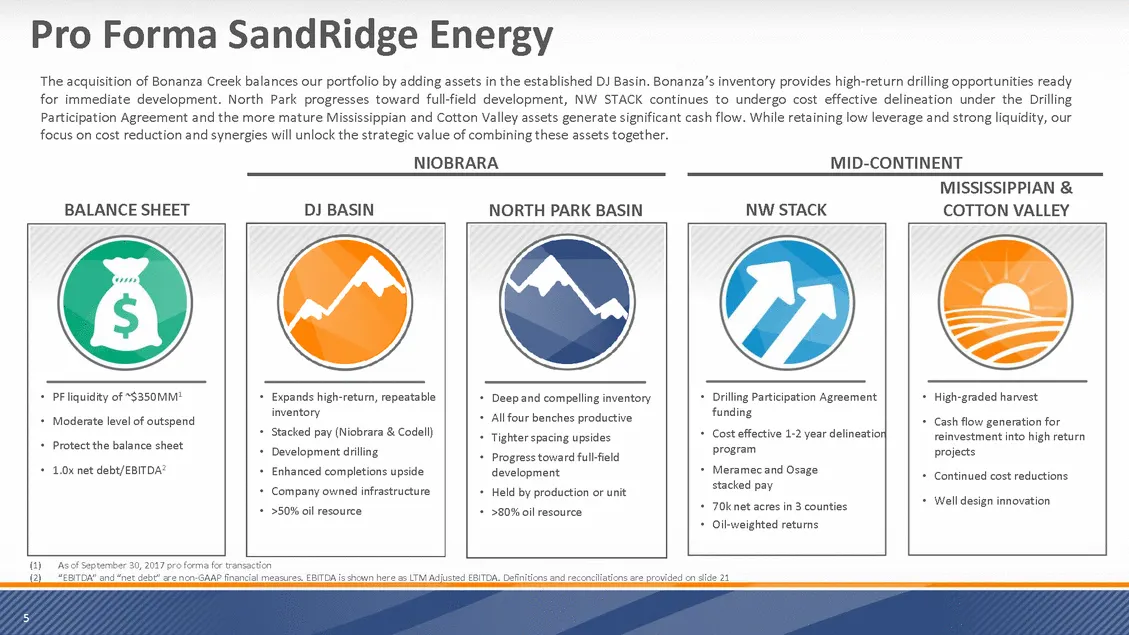
5 Pro Forma SandRidge Energy The acquisition of Bonanza Creek balances our portfolio by adding assets in the established DJ Basin. Bonanza’s inventory provides high-return drilling opportunities ready for immediate development. North Park progresses toward full-field development, NW STACK continues
Slide 5: Strategic Niobrara Addition
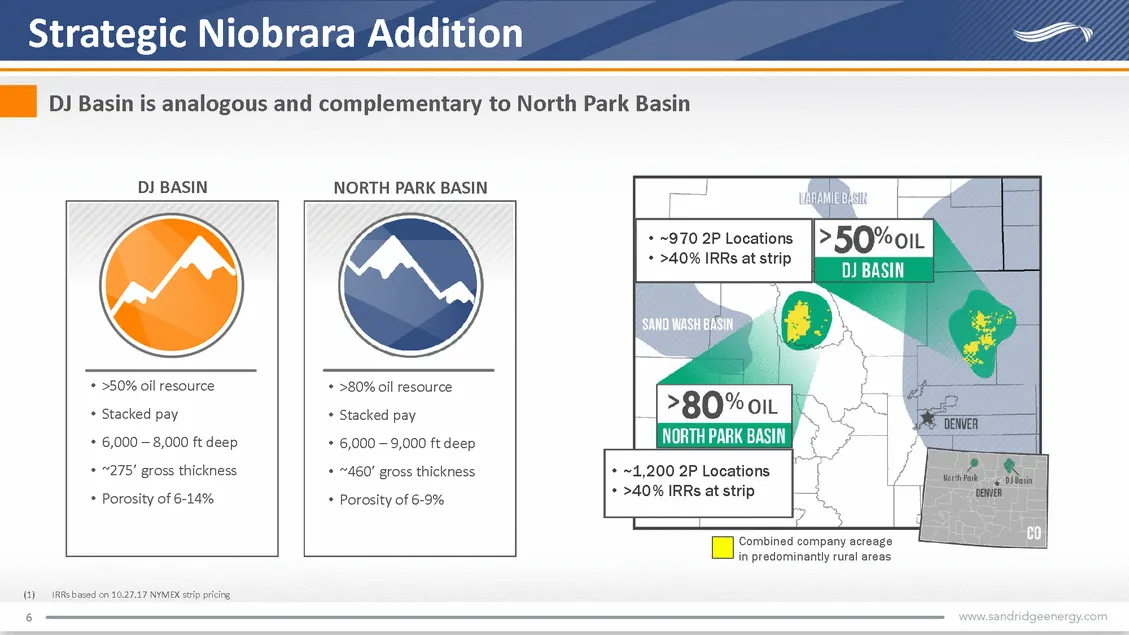
Strategic Niobrara Addition DJ Basin is analogous and complementary to North Park Basin 6 ~1,200 2P Locations >40% IRRs at strip ~970 2P Locations >40% IRRs at strip NORTH PARK BASIN DJ BASIN >80% oil resource Stacked pay 6,000 – 9,000 ft deep ~460’ gross thickness Porosity of 6-9% >50% oil resource
Slide 6: Terms
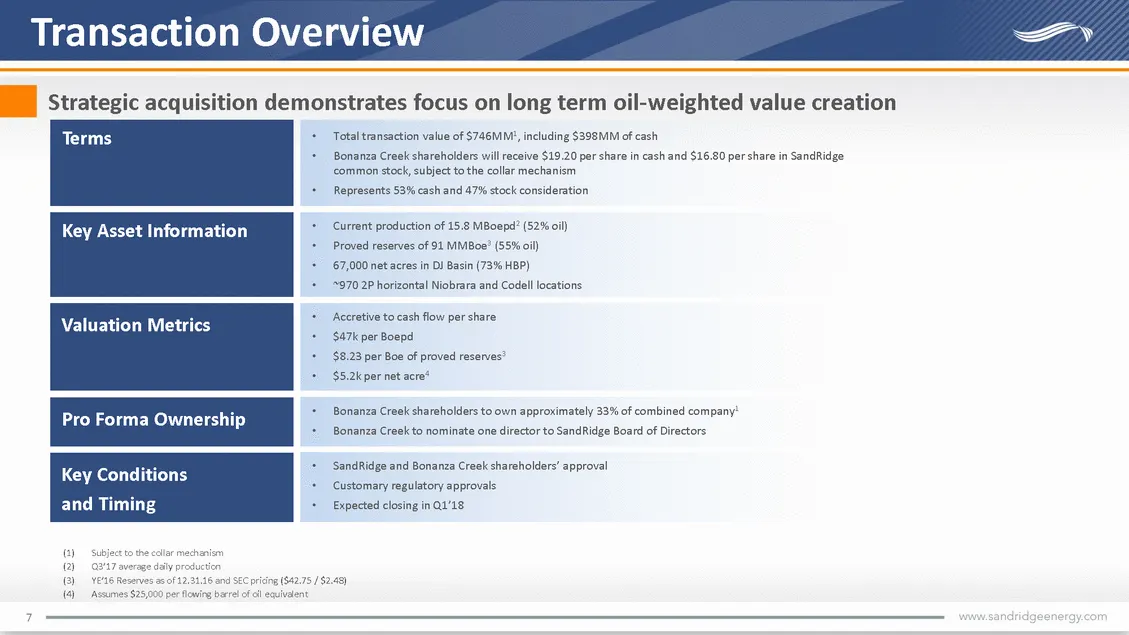
7 Terms Total transaction value of $746MM1, including $398MM of cash Bonanza Creek shareholders will receive $19.20 per share in cash and $16.80 per share in SandRidge common stock, subject to the collar mechanism Represents 53% cash and 47% stock consideration Current production of 15.8 MBoepd2 (52
Slide 7: Strong Strategic Fit
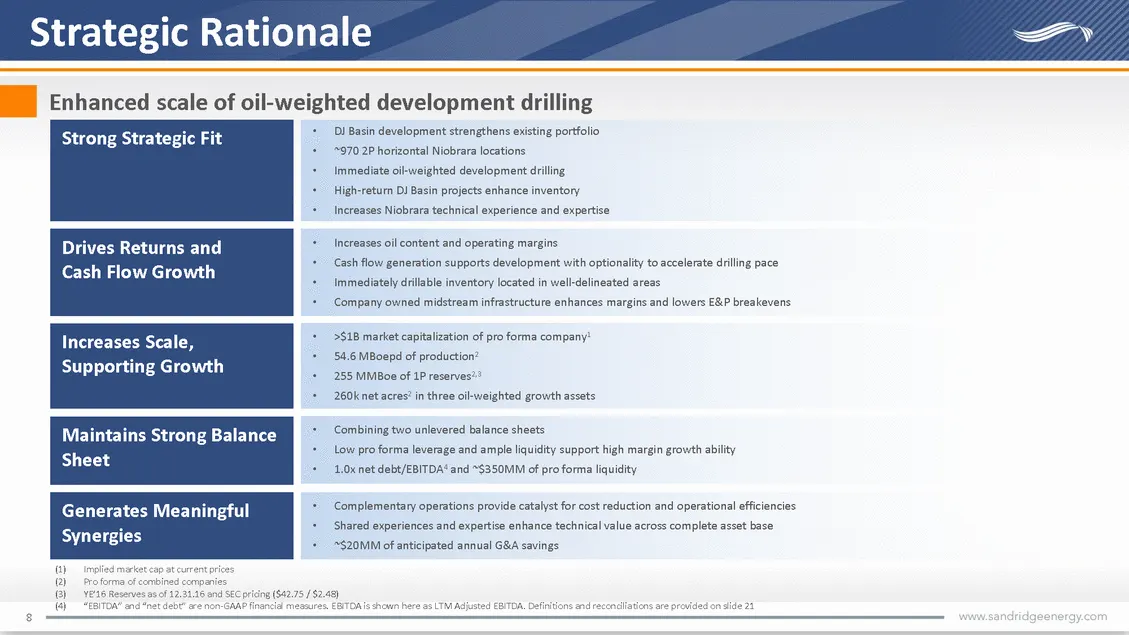
8 Strong Strategic Fit DJ Basin development strengthens existing portfolio ~970 2P horizontal Niobrara locations Immediate oil-weighted development drilling High-return DJ Basin projects enhance inventory Increases Niobrara technical experience and expertise Drives Returns and Cash Flow Growth Incre
Slide 8: SandRidge maintains low leverage with enhanced liquidity
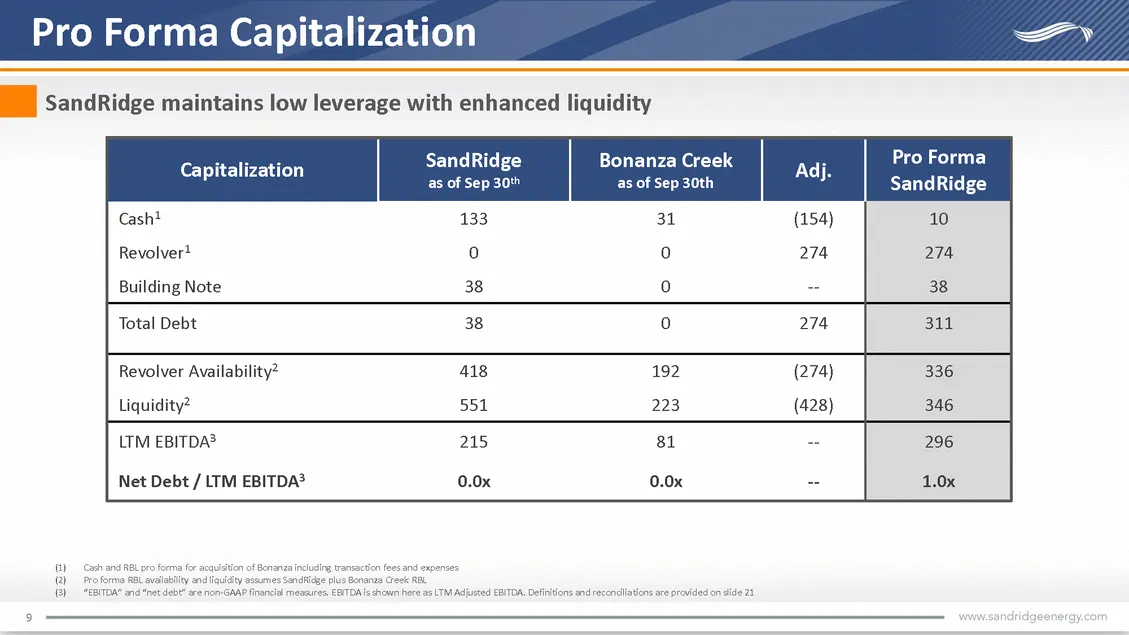
9 SandRidge maintains low leverage with enhanced liquidity Pro Forma Capitalization Cash and RBL pro forma for acquisition of Bonanza including transaction fees and expenses Pro forma RBL availability and liquidity assumes SandRidge plus Bonanza Creek RBL “EBITDA” and “net debt” are non-GAAP financi
Slide 9: Increased oil production, cash flow and locations while maintaining low leverage
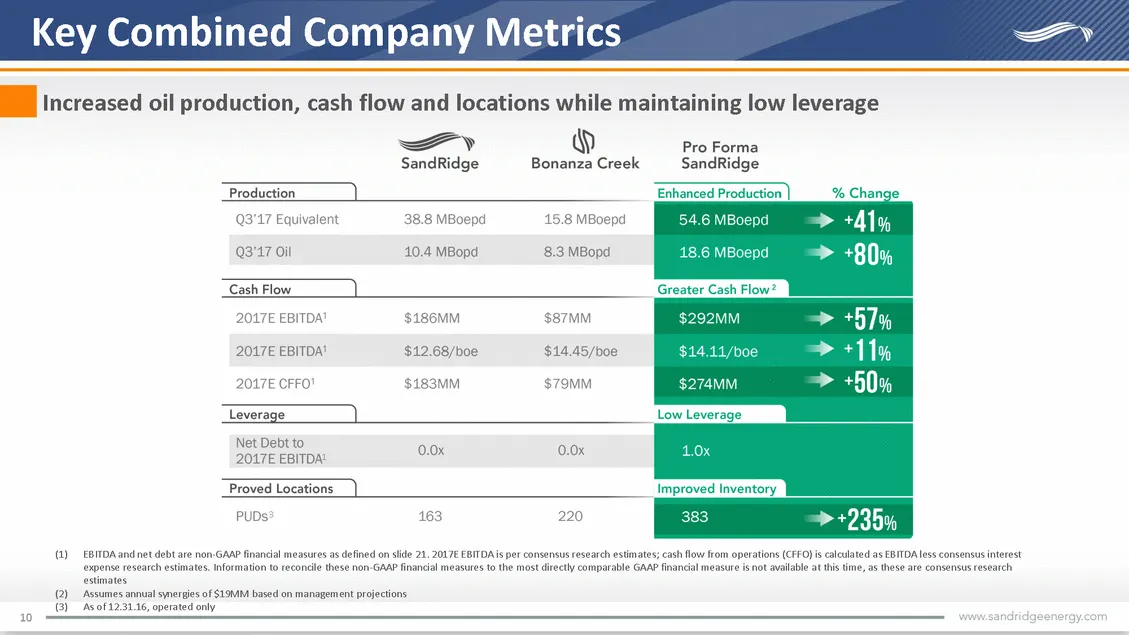
10 Increased oil production, cash flow and locations while maintaining low leverage Key Combined Company Metrics EBITDA and net debt are non-GAAP financial measures as defined on slide 21. 2017E EBITDA is per consensus research estimates; cash flow from operations (CFFO) is calculated as EBITDA less
Slide 10: Development Drilling Strengthens Capital Allocation
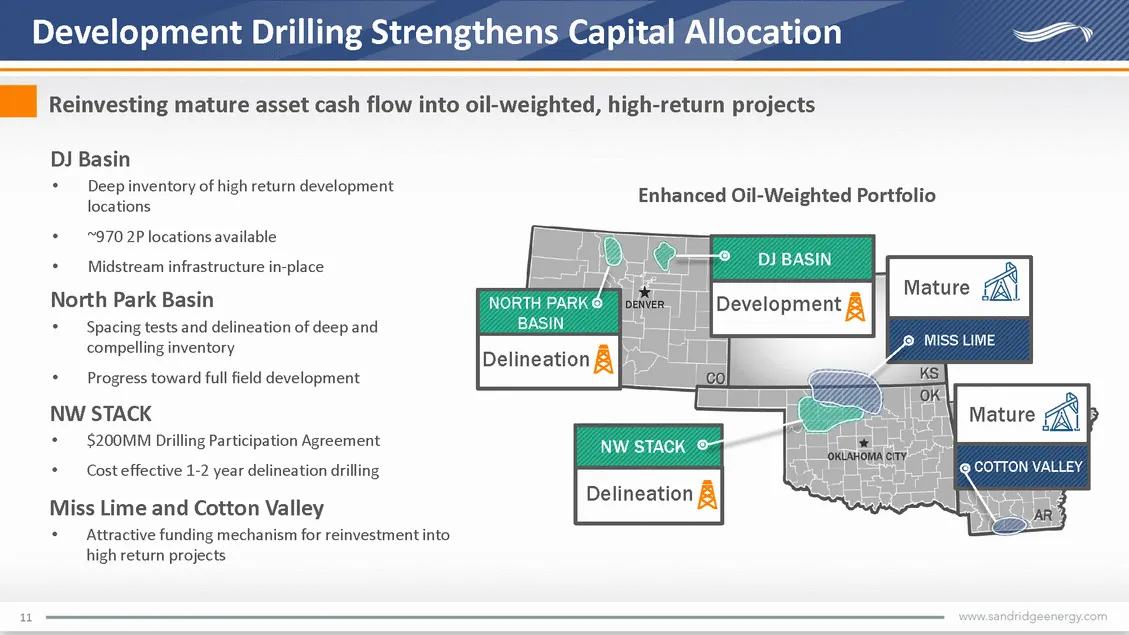
11 Development Drilling Strengthens Capital Allocation Reinvesting mature asset cash flow into oil-weighted, high-return projects MISS LIME COTTON VALLEY DENVER DJ BASIN NORTH PARK BASIN Mature Mature DJ Basin Deep inventory of high return development locations ~970 2P locations available Midstream
Slide 11: Located in Oil Window of DJ Basin
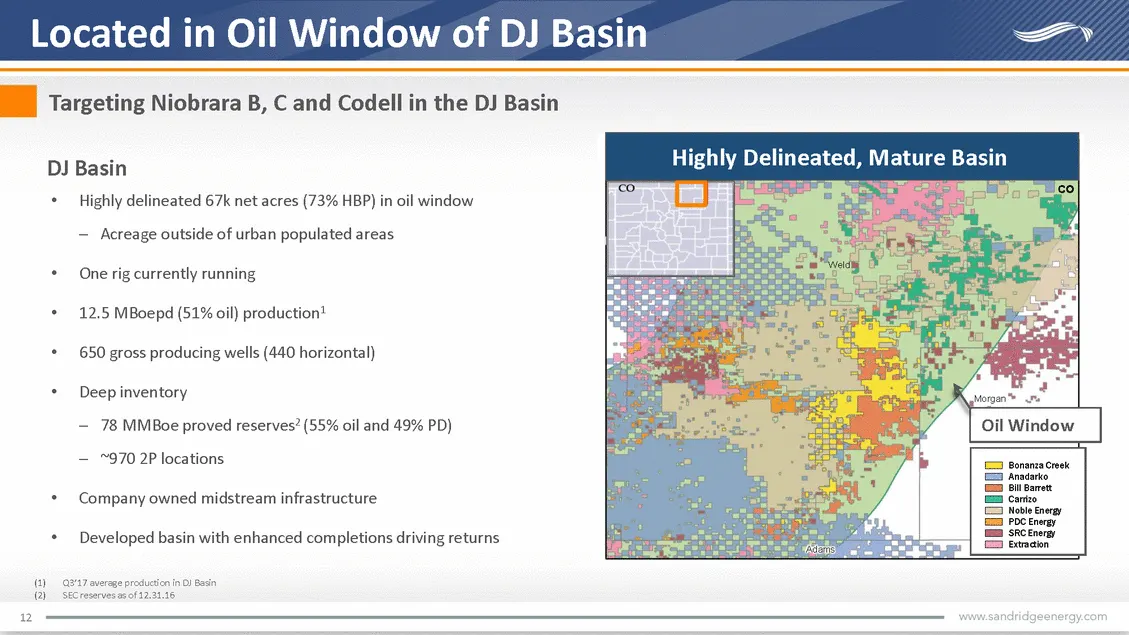
Located in Oil Window of DJ Basin Targeting Niobrara B, C and Codell in the DJ Basin 12 Highly delineated 67k net acres (73% HBP) in oil window Acreage outside of urban populated areas One rig currently running 12.5 MBoepd (51% oil) production1 650 gross producing wells (440 horizontal) Deep invento
Slide 12: Bonanza Creek 2017 Capital Program
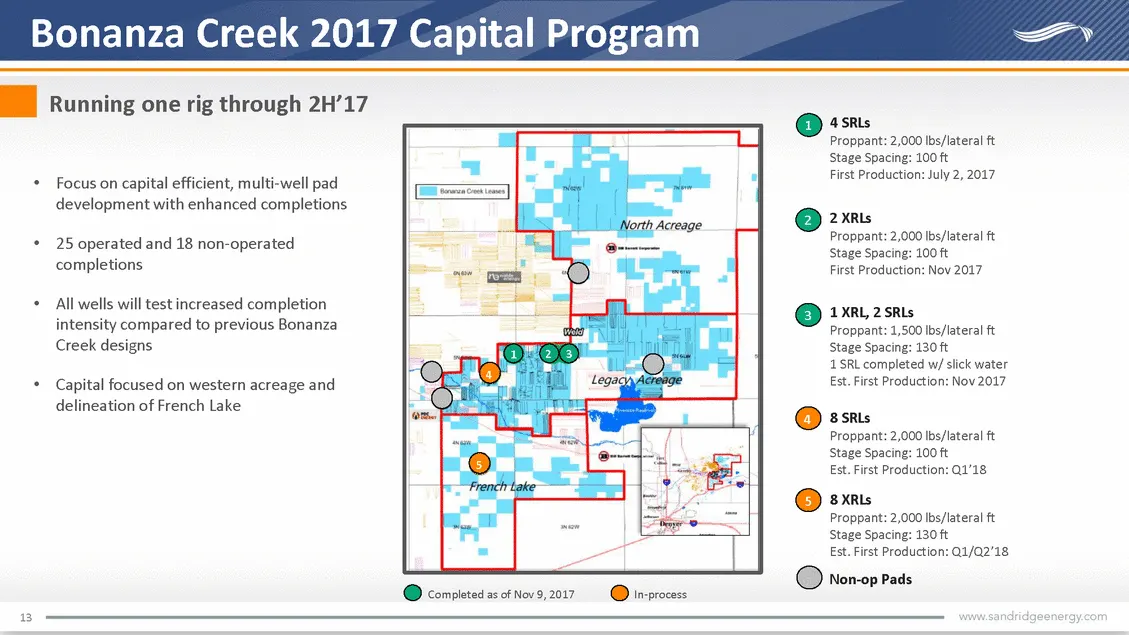
13 1 XRL, 2 SRLs Proppant: 1,500 lbs/lateral ft Stage Spacing: 130 ft 1 SRL completed w/ slick water Est. First Production: Nov 2017 2 XRLs Proppant: 2,000 lbs/lateral ft Stage Spacing: 100 ft First Production: Nov 2017 4 SRLs Proppant: 2,000 lbs/lateral ft Stage Spacing: 100 ft First Production: Ju
Slide 13: Completion Design Evolution
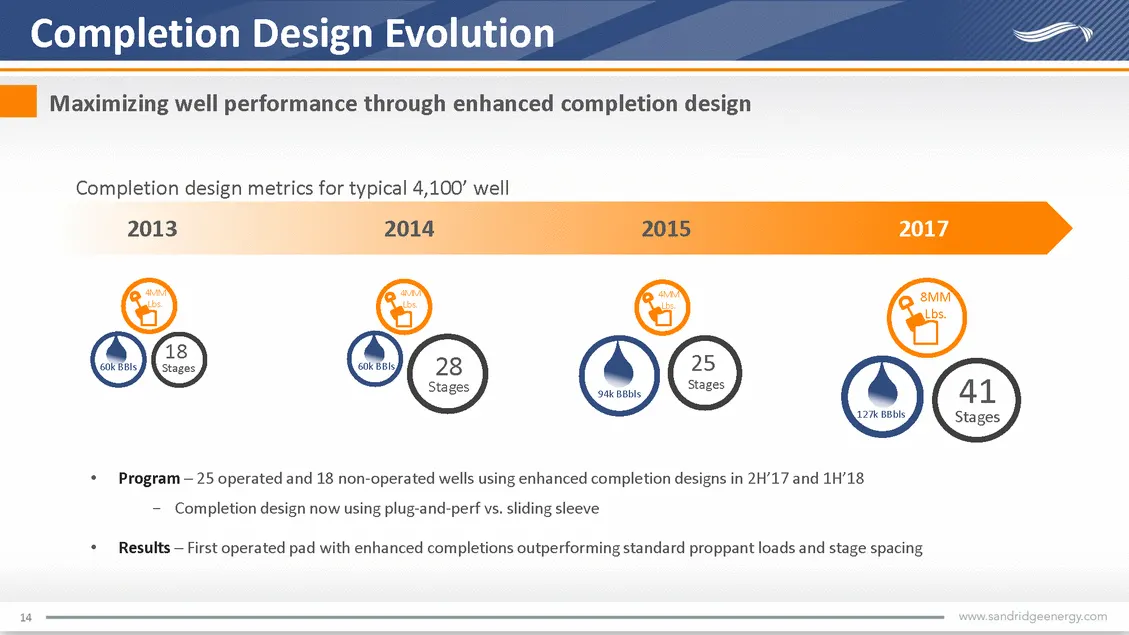
14 Completion Design Evolution Maximizing well performance through enhanced completion design 2013 2014 2015 2017 Program – 25 operated and 18 non-operated wells using enhanced completion designs in 2H’17 and 1H’18 Completion design now using plug-and-perf vs. sliding sleeve Results – First operated
Slide 14: Enhanced Completion Results
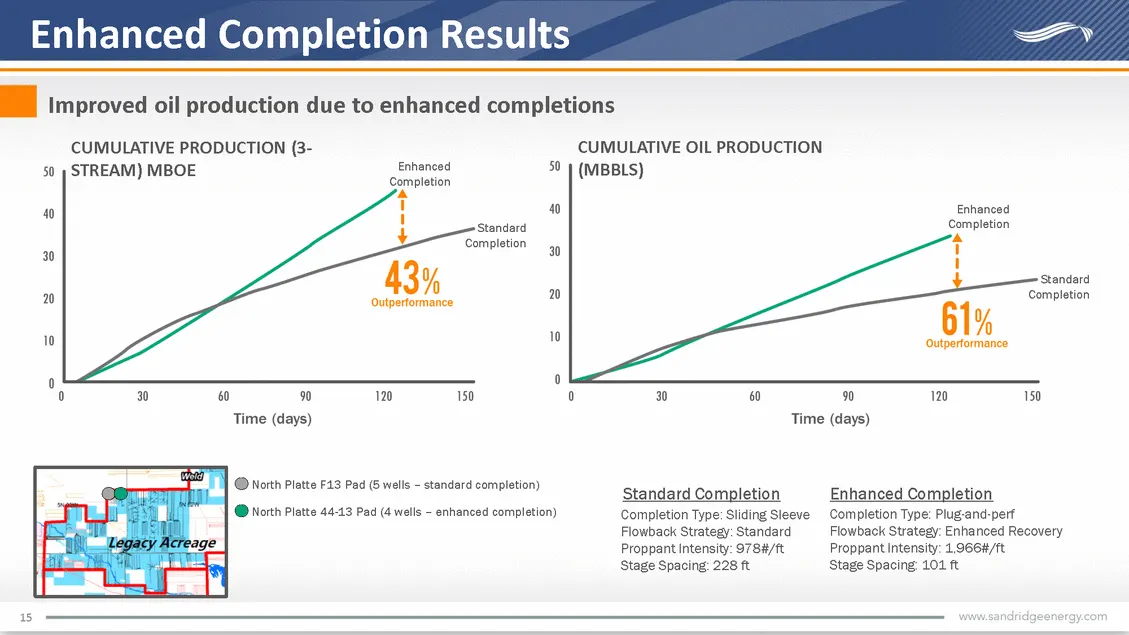
Enhanced Completion Results Completion Type: Sliding Sleeve Flowback Strategy: Standard Proppant Intensity: 978#/ft Stage Spacing: 228 ft Completion Type: Plug-and-perf Flowback Strategy: Enhanced Recovery Proppant Intensity: 1,966#/ft Stage Spacing: 101 ft CUMULATIVE PRODUCTION (3-STREAM) MBOE CUMU
Slide 15: Midstream and Marketing
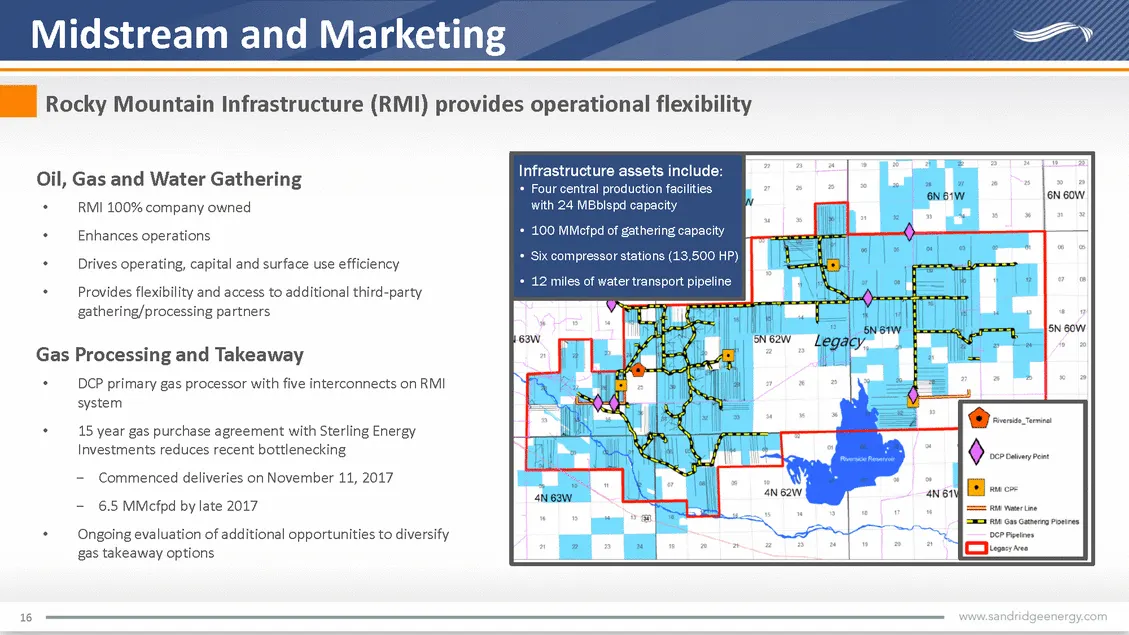
16 Midstream and Marketing Oil, Gas and Water Gathering RMI 100% company owned Enhances operations Drives operating, capital and surface use efficiency Provides flexibility and access to additional third-party gathering/processing partners Rocky Mountain Infrastructure (RMI) provides operational fle
Slide 16: Strong Strategic Fit
17 7 Strong Strategic Fit DJ Basin development strengthens existing portfolio ~970 2P horizontal Niobrara locations Immediate oil-weighted development drilling High-return DJ Basin projects enhance inventory Increases Niobrara technical experience and expertise Drives Returns and Cash Flow Growth In
Slide 17: Strategic Rationale
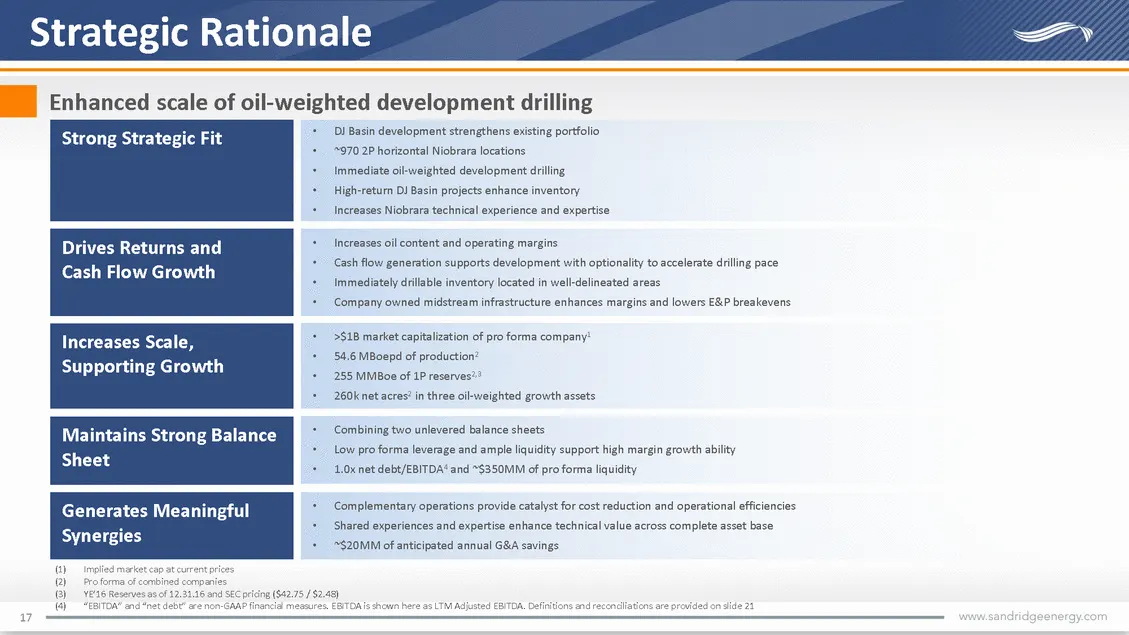
trategic Rationale Enhanced scale of oil-weighted development drilling Strong Strategic Fit + D1 Basin development strengthens existing portfolio + >9702P horizontal Niobrara locations + Immediate oll-weighted development drilling + High-return Di Basin projects enhance inventory + Increases Niobrar
Slide 18: Pro Forma Derivatives
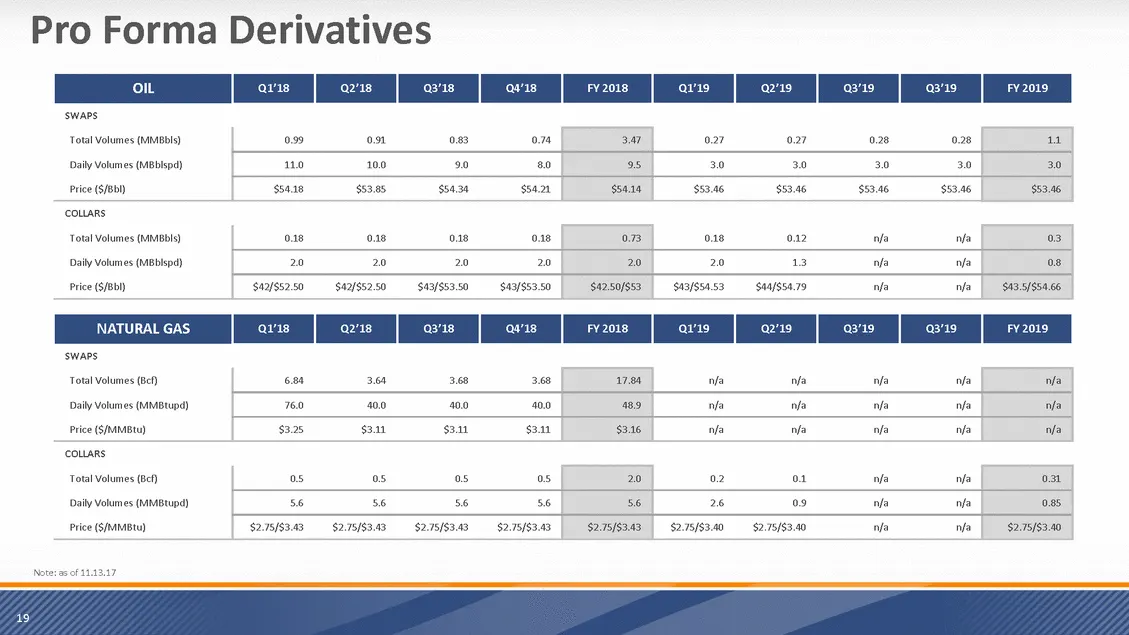
Pro Forma Derivatives OIL Q1’18 Q2’18 Q3’18 Q4’18 FY 2018 Q1’19 Q2’19 Q3’19 Q3’19 FY 2019 SWAPS Total Volumes (MMBbls) 0.99 0.91 0.83 0.74 3.47 0.27 0.27 0.28 0.28 1.1 Daily Volumes (MBblspd) 11.0 10.0 9.0 8.0 9.5 3.0 3.0 3.0 3.0 3.0 Price ($/Bbl) $54.18 $53.85 $54.34 $54.21 $54.14 $53.46 $53.46 $53
Slide 19: Project EURs, Economics and Inventory
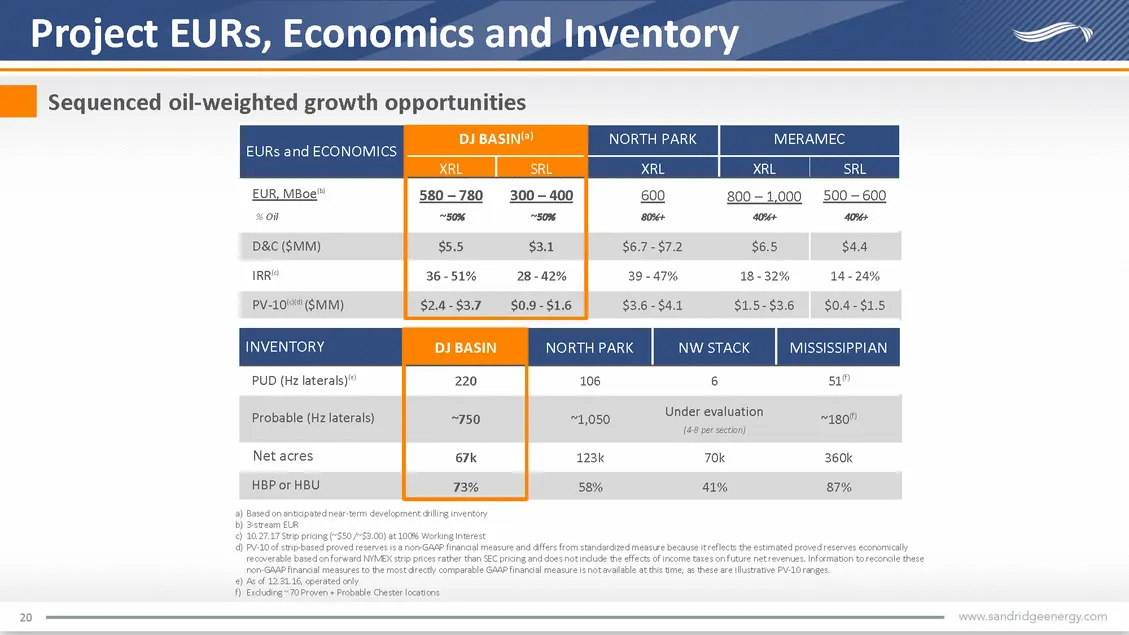
Project EURs, Economics and Inventory Based on anticipated near-term development drilling inventory 3-stream EUR 10.27.17 Strip pricing (~$50 /~$3.00) at 100% Working Interest PV-10 of strip-based proved reserves is a non-GAAP financial measure and differs from standardized measure because it reflec
Slide 20: Non-GAAP Financial Measures
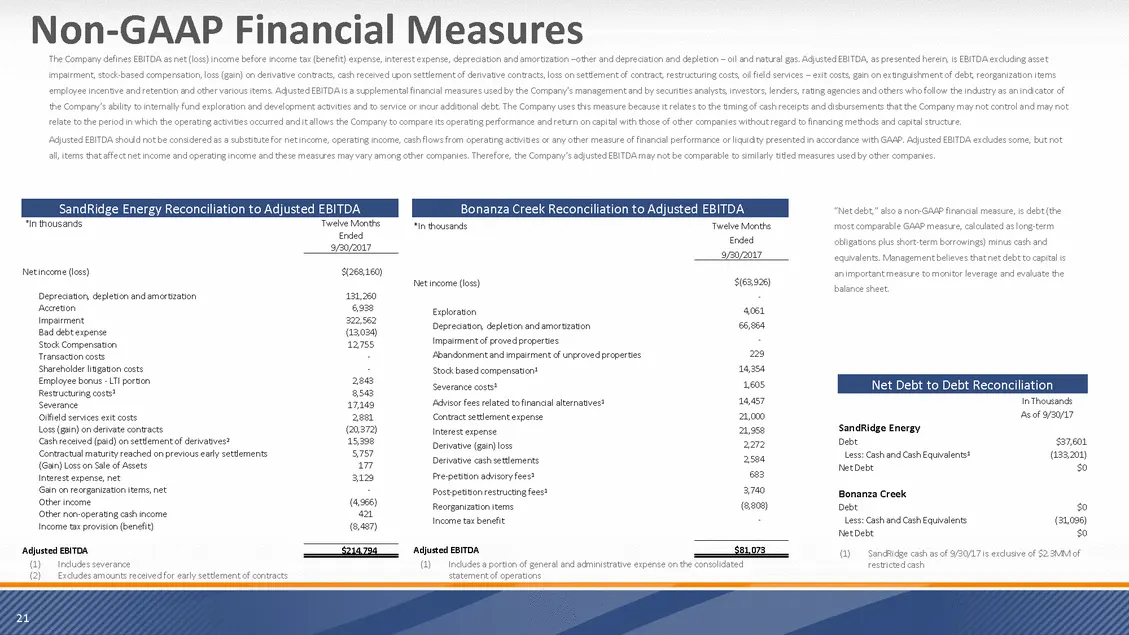
Non-GAAP Financial Measures 21 The Company defines EBITDA as net (loss) income before income tax (benefit) expense, interest expense, depreciation and amortization –other and depreciation and depletion – oil and natural gas. Adjusted EBITDA, as presented herein, is EBITDA excluding asset impairment,
Slide 21: Non-GAAP Financial Measures
Non-GAAP Financial Measures The Company defines Ea esnet(os) ince before come tx (bene expense, nterstexpense, deprecation sadomer baton ther and deprestien and degleven~cll and rata gs. Adjusted EBITOA as peeseted here is MTOM excudegasset inpatment, stodbasedcompersaton, es (gr) en denvabve contac
Source: SEC EDGAR · 425 filed Nov 15, 2017
More decks from Civitas Resources Inc
 Merger or Acquisition (November 2025)14 slides · Nov 17, 2025
 Merger or Acquisition (November 2025)14 slides · Nov 3, 2025
 Merger or Acquisition (November 2025)10 slides · Nov 3, 2025
 Q2 2025 Earnings Presentation22 slides · Aug 7, 2025
 Q4 2024 Earnings Presentation31 slides · February 2025
 Q3 2024 Earnings Presentation27 slides · Nov 8, 2024