PT Sarana Menara Nusantara Tbk · IDX:TOWR
PT Sarana Menara Nusantara Tbk — Q1 2017 Earnings Presentation
23 slides from PT Sarana Menara Nusantara Tbk's earnings presentation, 2017
Slide 1: Indonesia's Premier Tower Company: 1Q 2017 Results Presentation
PROTELINDO PT. SARANA MENARA NUSANTARA, TBK. (TOWR) Indonesia’s Premier Tower Company 1Q 2017 Results Presentation
Slide 2: Disclaimer
Disclaimer These materials have been prepared by PT Sarana Menara Nusantara, Tbk. (the “Company”) and have not been independently verified. No representation or warranty, expressed or implied, is made and no reliance should be placed on the accuracy, fairness or completeness of the information prese
Slide 3: Agenda
Agenda Market Overview Summary Financial Results Strategy 2
Slide 4: Indonesia Macro Economy – Key Indicators
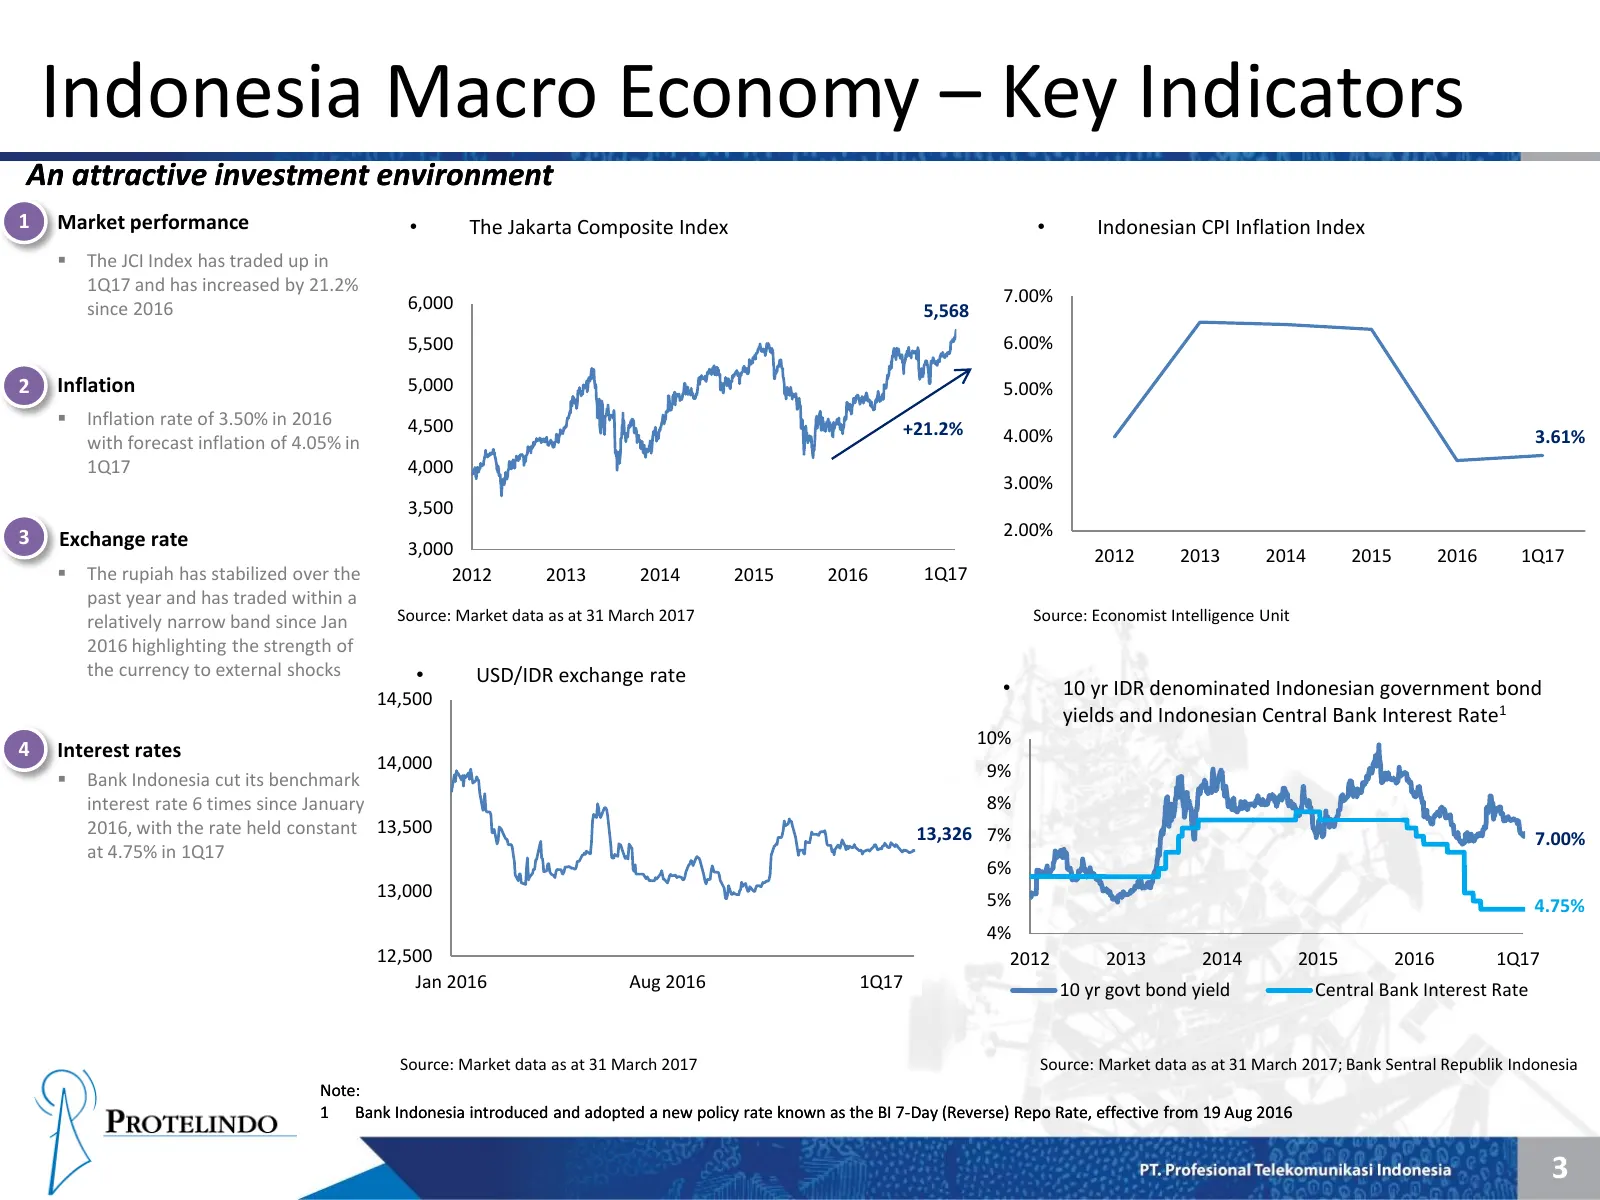
Indonesia Macro Economy – Key Indicators An attractive investment environment 1 Market performance • The Jakarta Composite Index • Indonesian CPI Inflation Index The JCI Index has traded up in 1Q17 and has increased by 21.2% 6,000 7.00% since 2016 5,568 5,500 6.00% 2 Inflation 5,000 5.00% Inflat
Slide 5: Indonesia Telecom Industry – Outlook
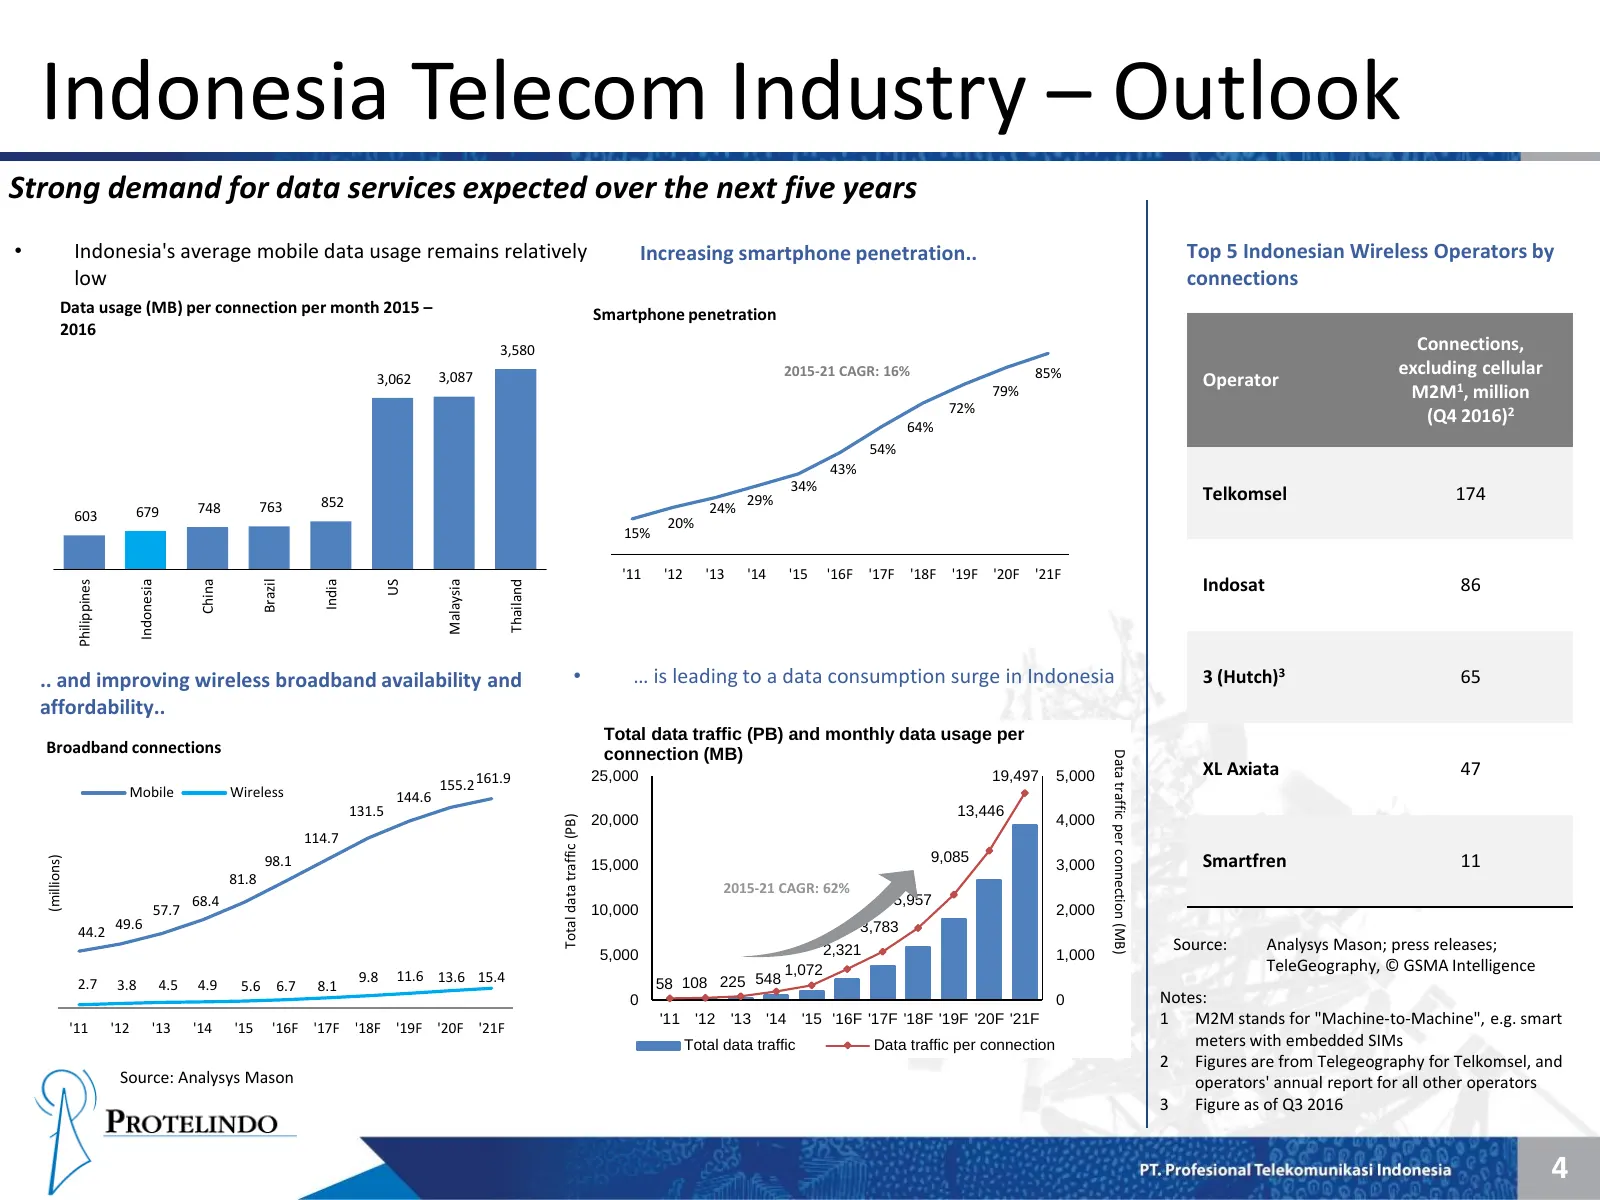
Indonesia Telecom Industry – Outlook Strong demand for data services expected over the next five years • Indonesia's average mobile data usage remains relatively Increasing smartphone penetration.. Top 5 Indonesian Wireless Operators by low connections Data usage (MB) per connection per month 2015 –
Slide 6: Indonesian Tower Industry – Key Growth Drivers
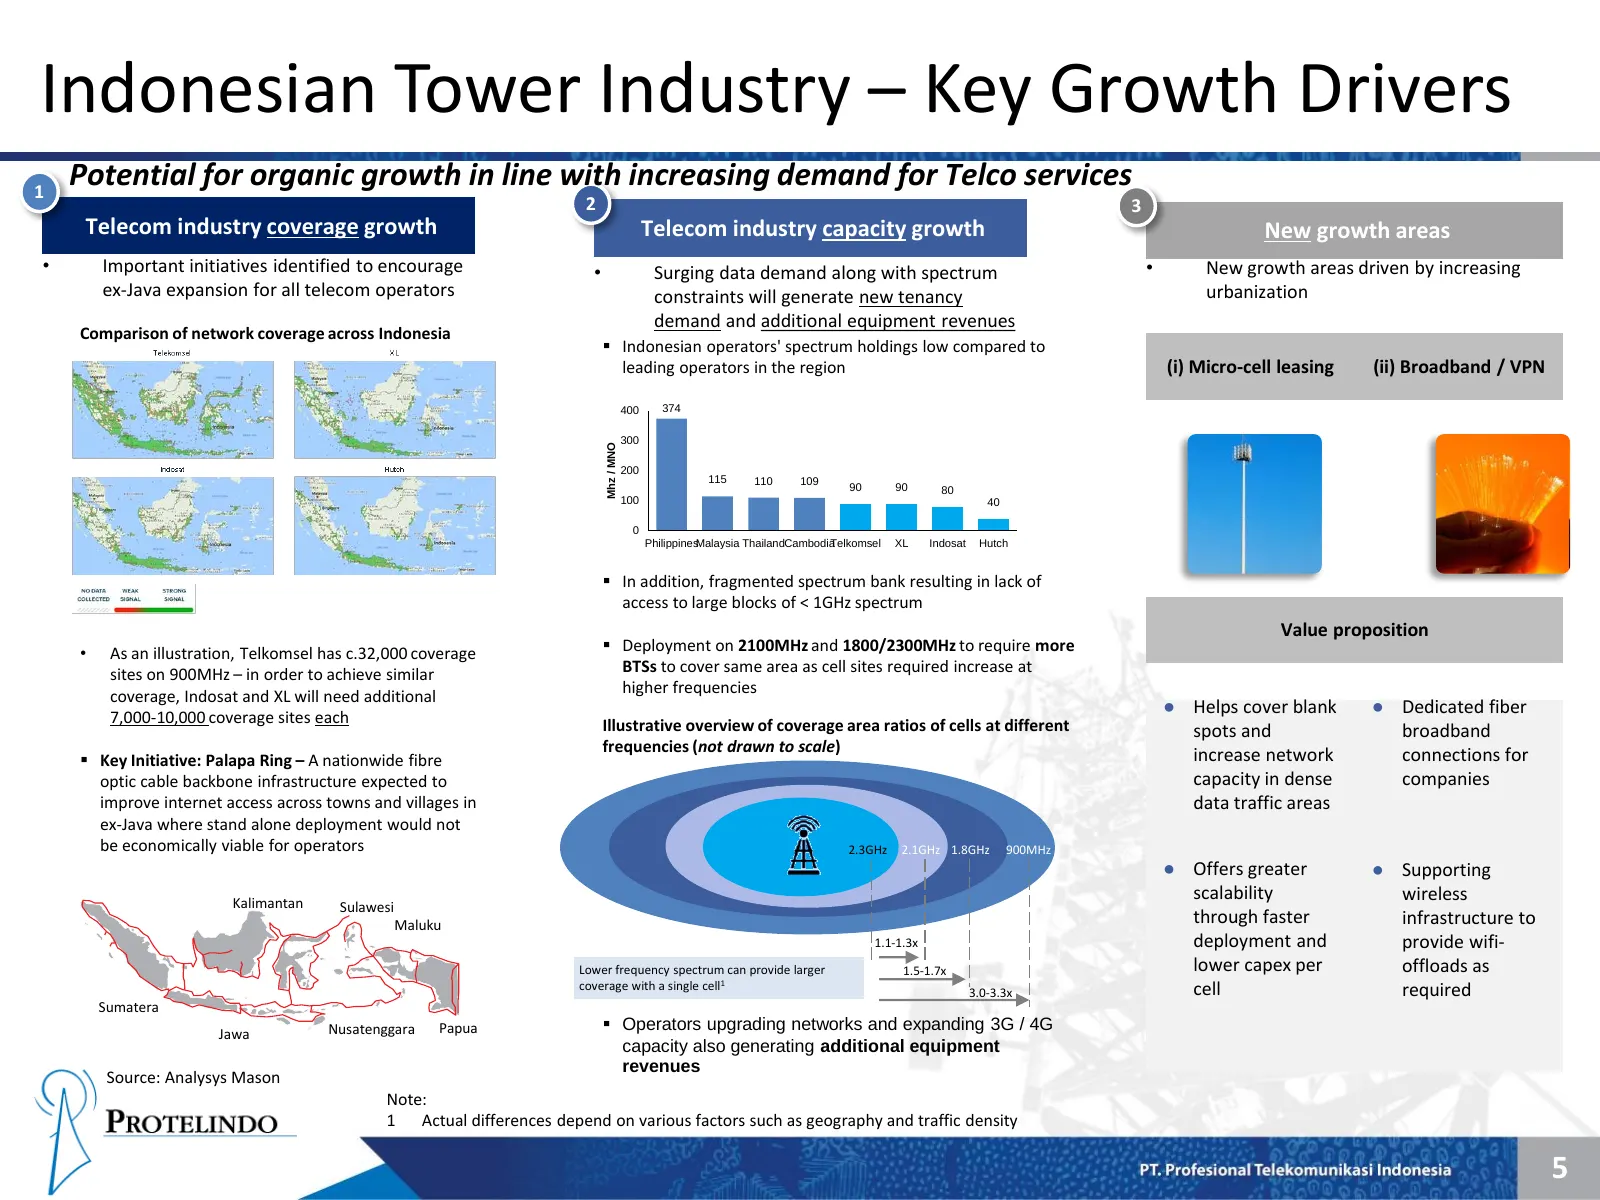
Indonesian Tower Industry – Key Growth Drivers 1 Potential for organic growth in line with increasing demand for Telco services 2 3 Telecom industry coverage growth Telecom industry capacity growth New growth areas • Important initiatives identified to encourage • Surging data demand along with spec
Slide 7: Indonesian Tower Industry – Key Growth Drivers
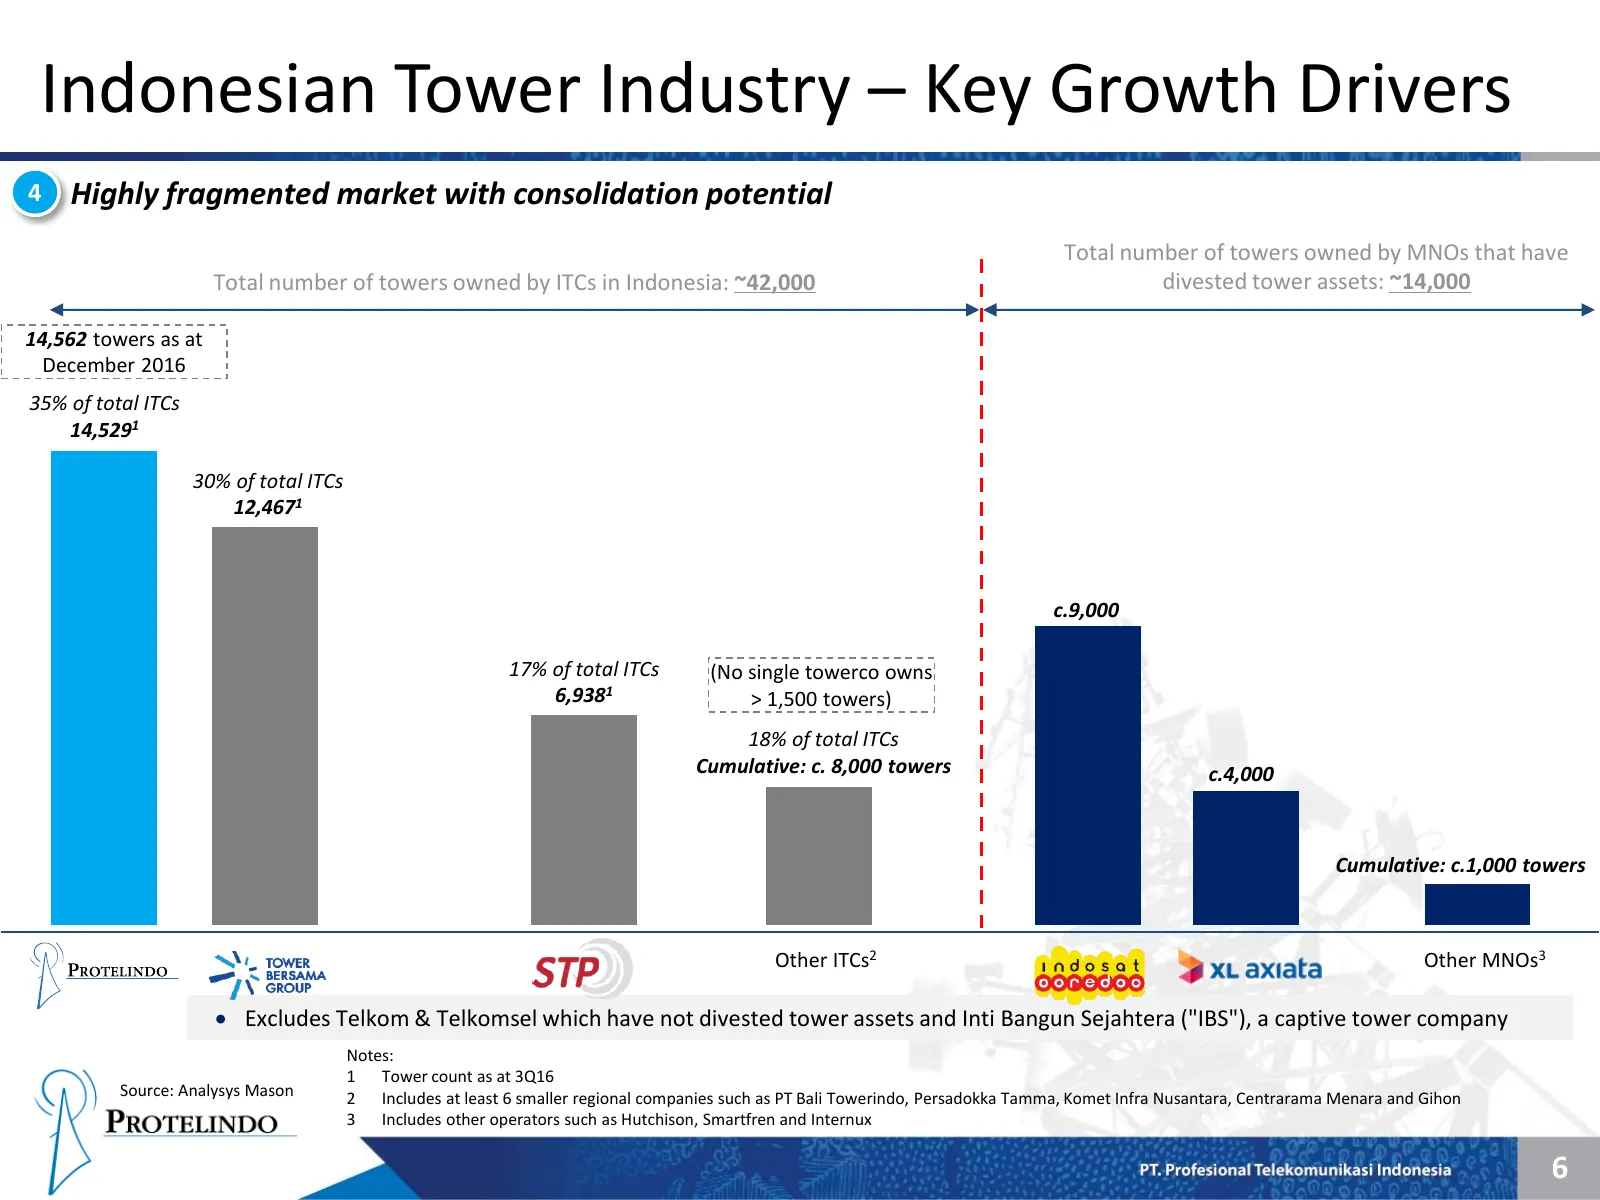
Indonesian Tower Industry – Key Growth Drivers 4 Highly fragmented market with consolidation potential Total number of towers owned by MNOs that have Total number of towers owned by ITCs in Indonesia: ~42,000 divested tower assets: ~14,000 14,562 towers as at December 2016 35% of total ITCs 14,5291
Slide 8: Leading Tower Company Globally
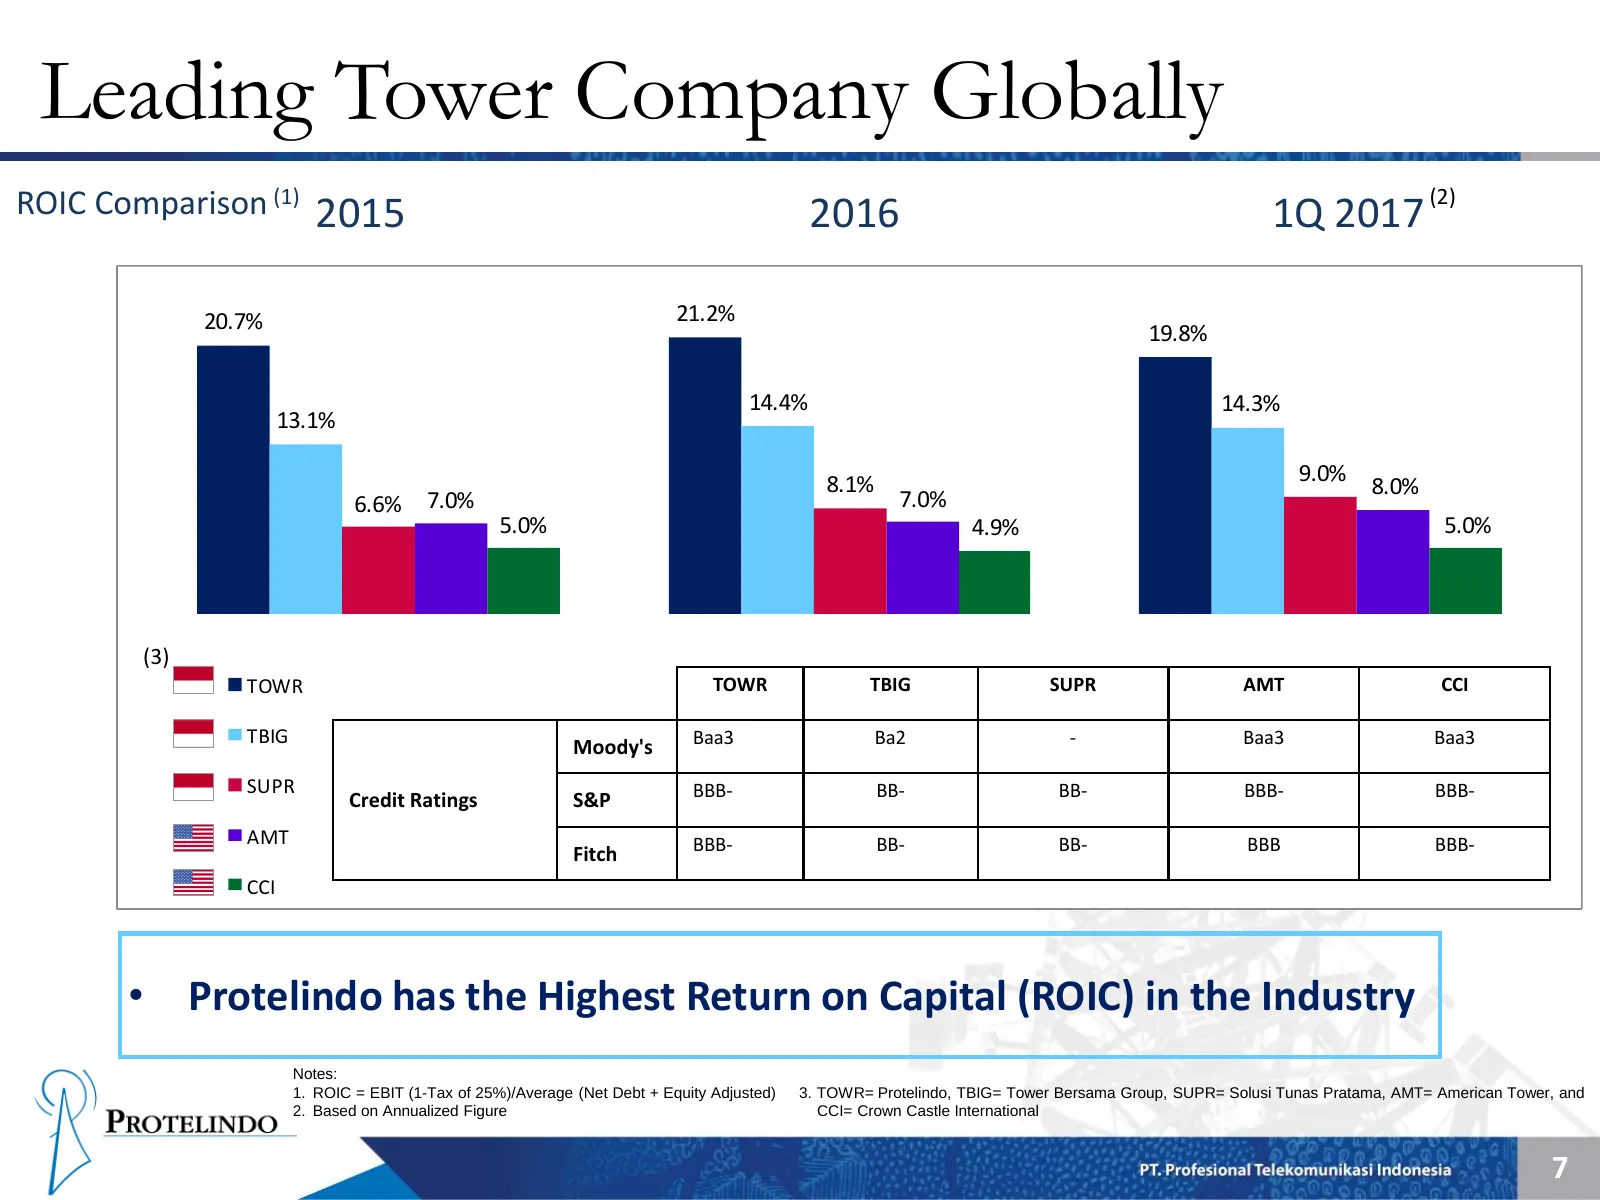
Leading Tower Company Globally ROIC Comparison (1) 2015 2016 1Q 2017 (2) 20.7% 21.2% 19.8% 14.4% 14.3% 13.1% 8.1% 9.0% 8.0% 6.6% 7.0% 7.0% 5.0% 4.9% 5.0% (3) TOWR TOWR TBIG SUPR AMT CCI TBIG Moody's Baa3 Ba2 - Baa3 Baa3 SUPR BBB- BB- BB- BBB- BBB- Credit Ratings S&P AMT BBB- BB- BB- BBB BBB- Fitch C
Slide 9: Indonesia's Tower Company Comparison
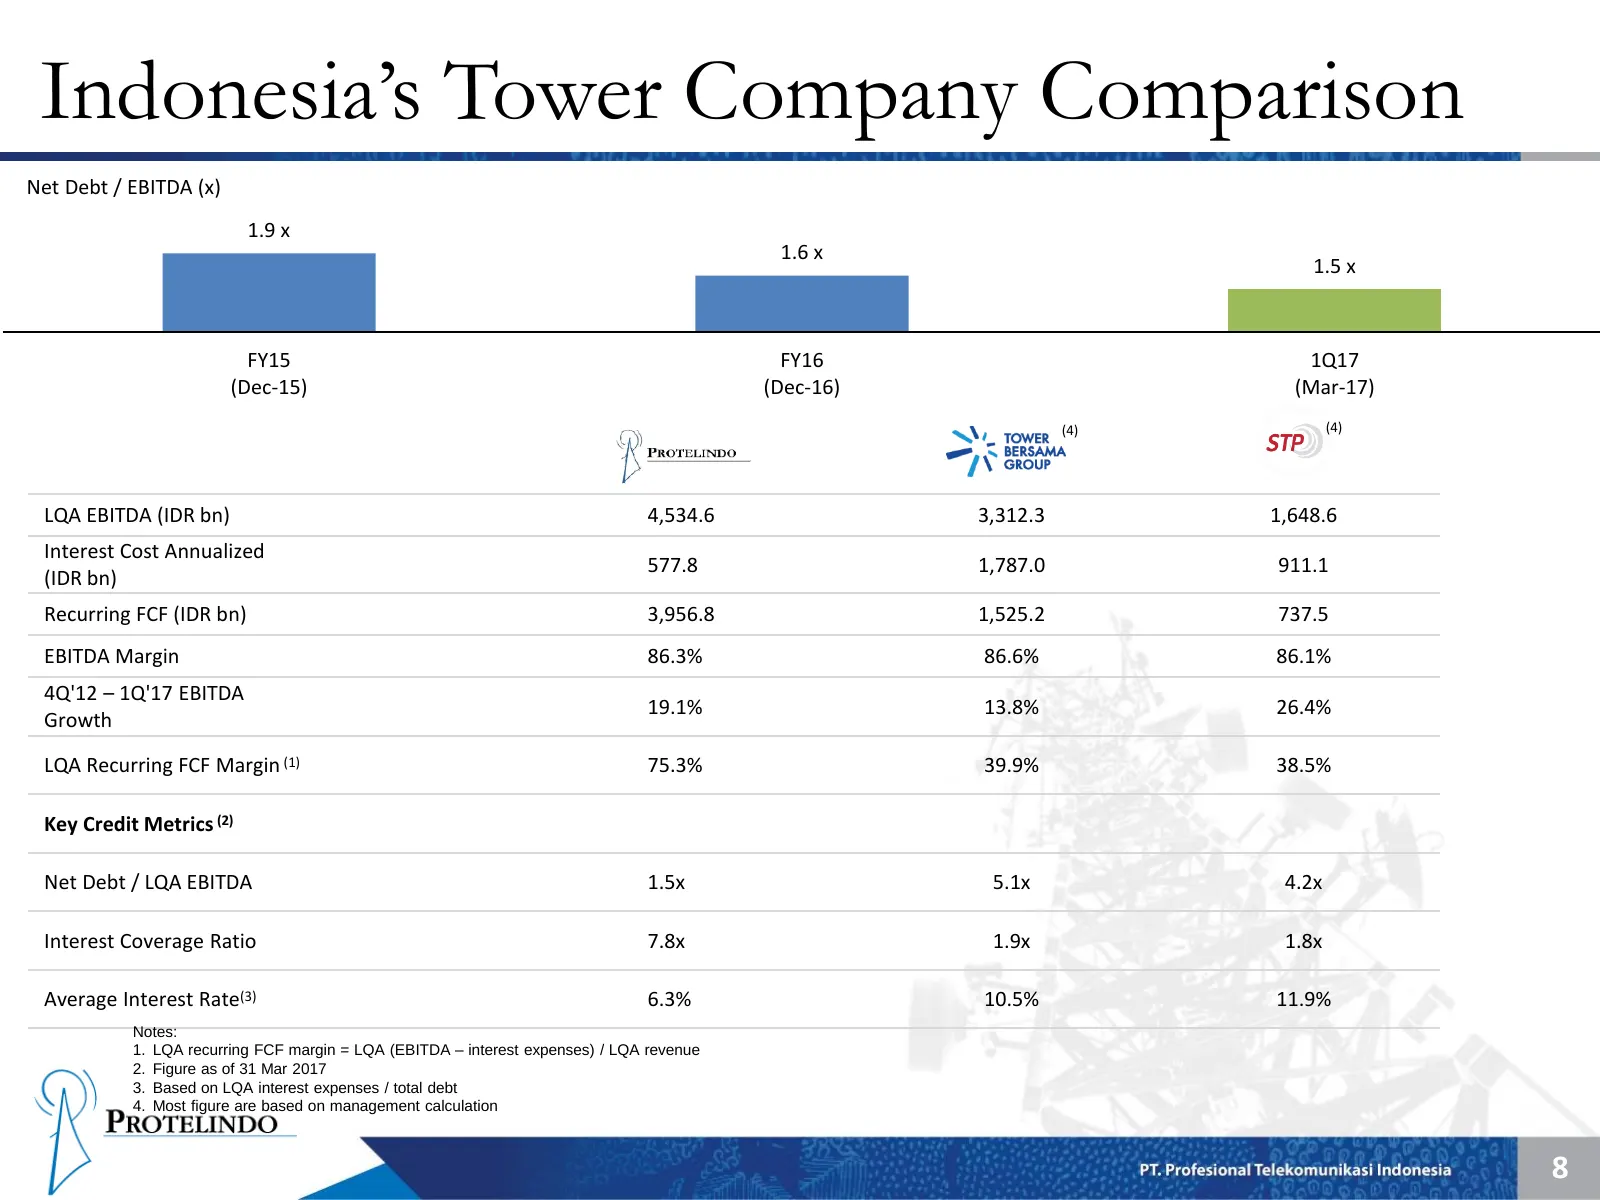
Indonesia’s Tower Company Comparison Net Debt / EBITDA (x) 1.9 x 1.6 x 1.5 x FY15 FY16 1Q17 (Dec-15) (Dec-16) (Mar-17) (4) (4) LQA EBITDA (IDR bn) 4,534.6 3,312.3 1,648.6 Interest Cost Annualized 577.8 1,787.0 911.1 (IDR bn) Recurring FCF (IDR bn) 3,956.8 1,525.2 737.5 EBITDA Margin 86.3% 86.6% 86.1
Slide 10: And History of Strong Growth
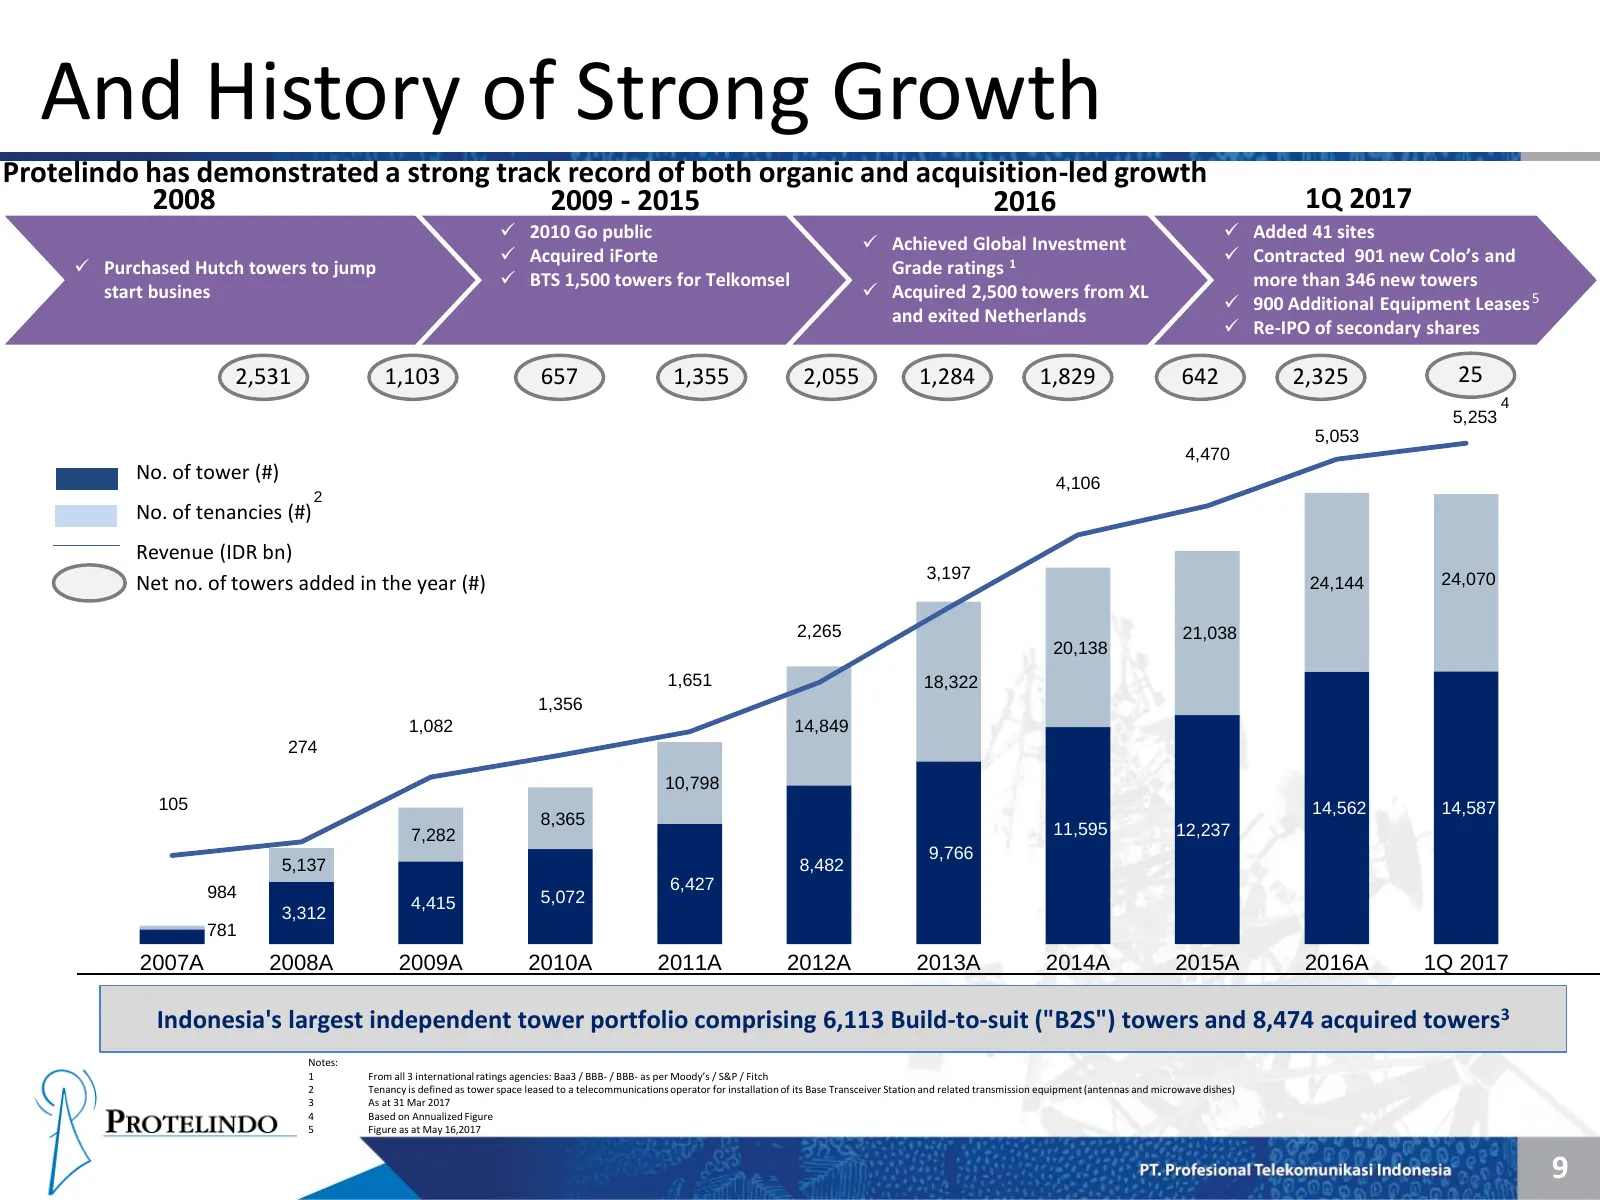
And History of Strong Growth Protelindo has demonstrated a strong track record of both organic and acquisition-led growth 2008 2009 - 2015 2016 1Q 2017 2010 Go public Added 41 sites Achieved Global Investment Acquired iForte Contracted 901 new Colo’s and Purchased Hutch towers to jump Gr
Slide 11: Protelindo Snapshot
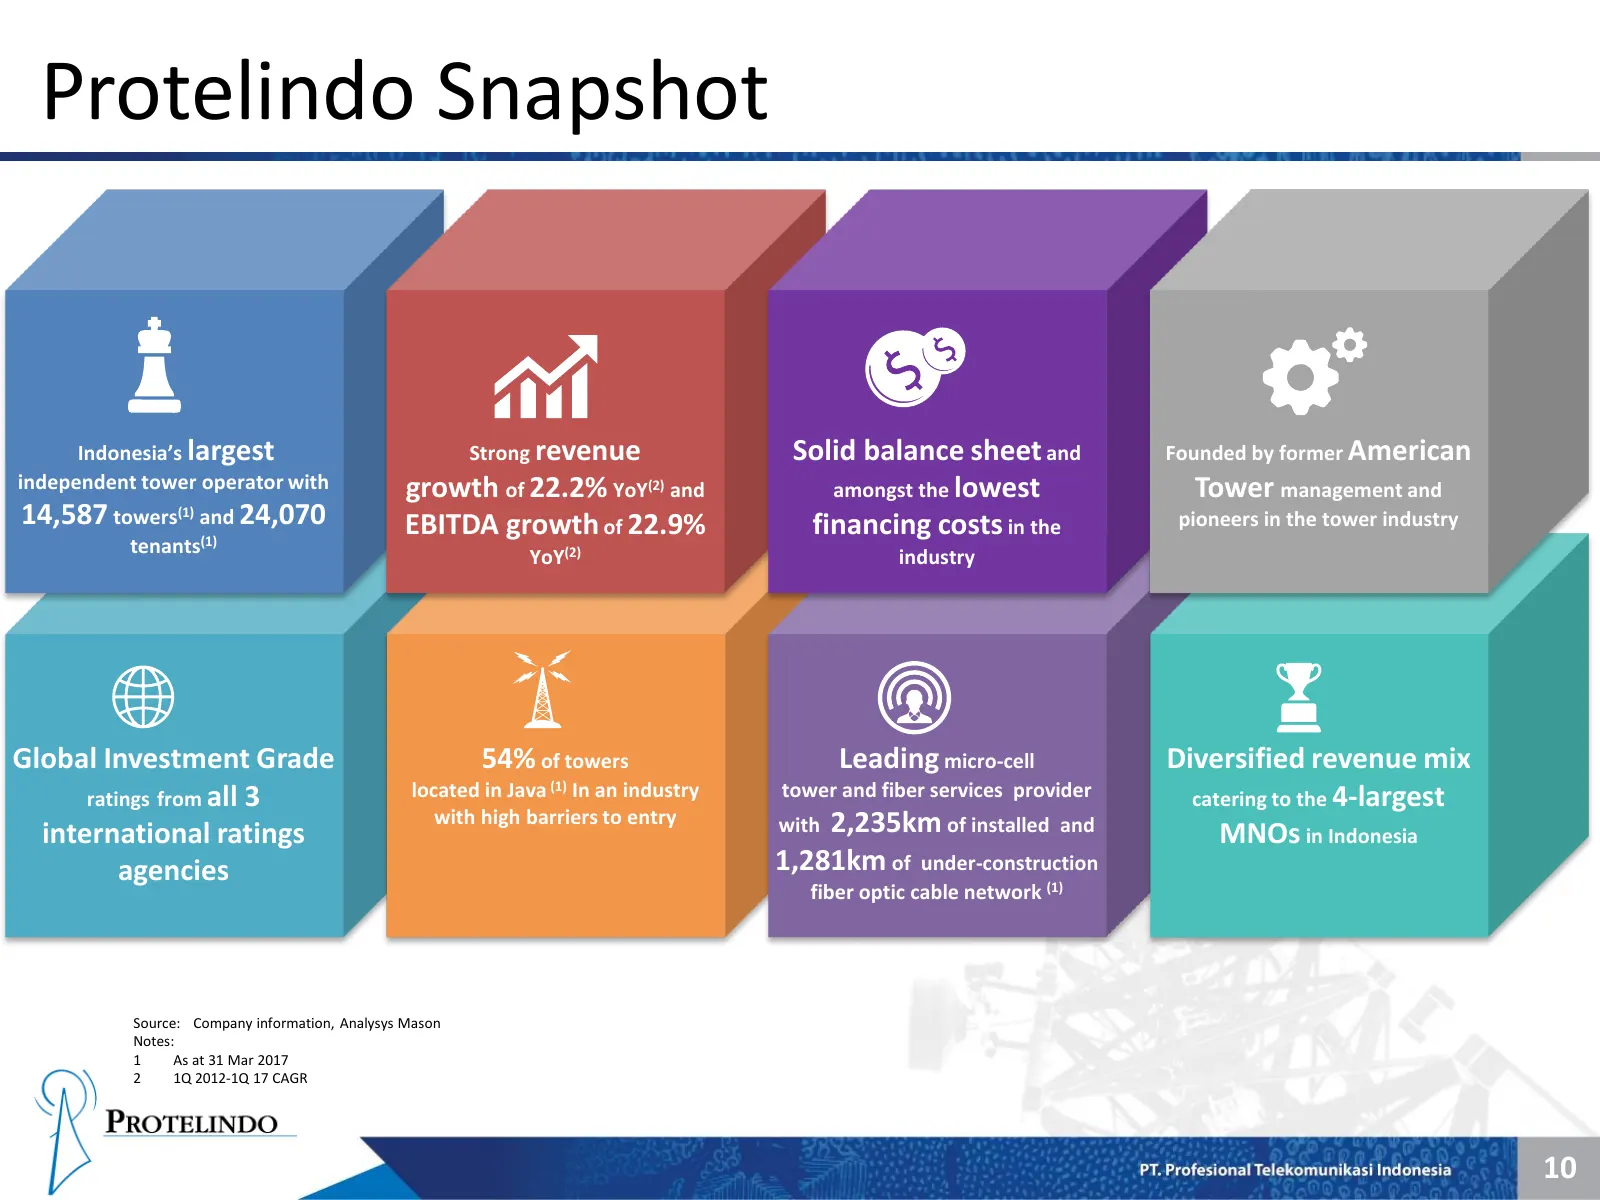
Protelindo Snapshot Indonesia’s largest Strong revenue Solid balance sheet and Founded by former American independent tower operator with growth of 22.2% YoY(2) and amongst the lowest Tower management and 14,587 towers(1) and 24,070 EBITDA growth of 22.9% financing costs in the pioneers in the tower
Slide 12: Summary Financial Results
Summary Financial Results h PROTELINDO
Slide 13: 1Q 2017 Financial Results
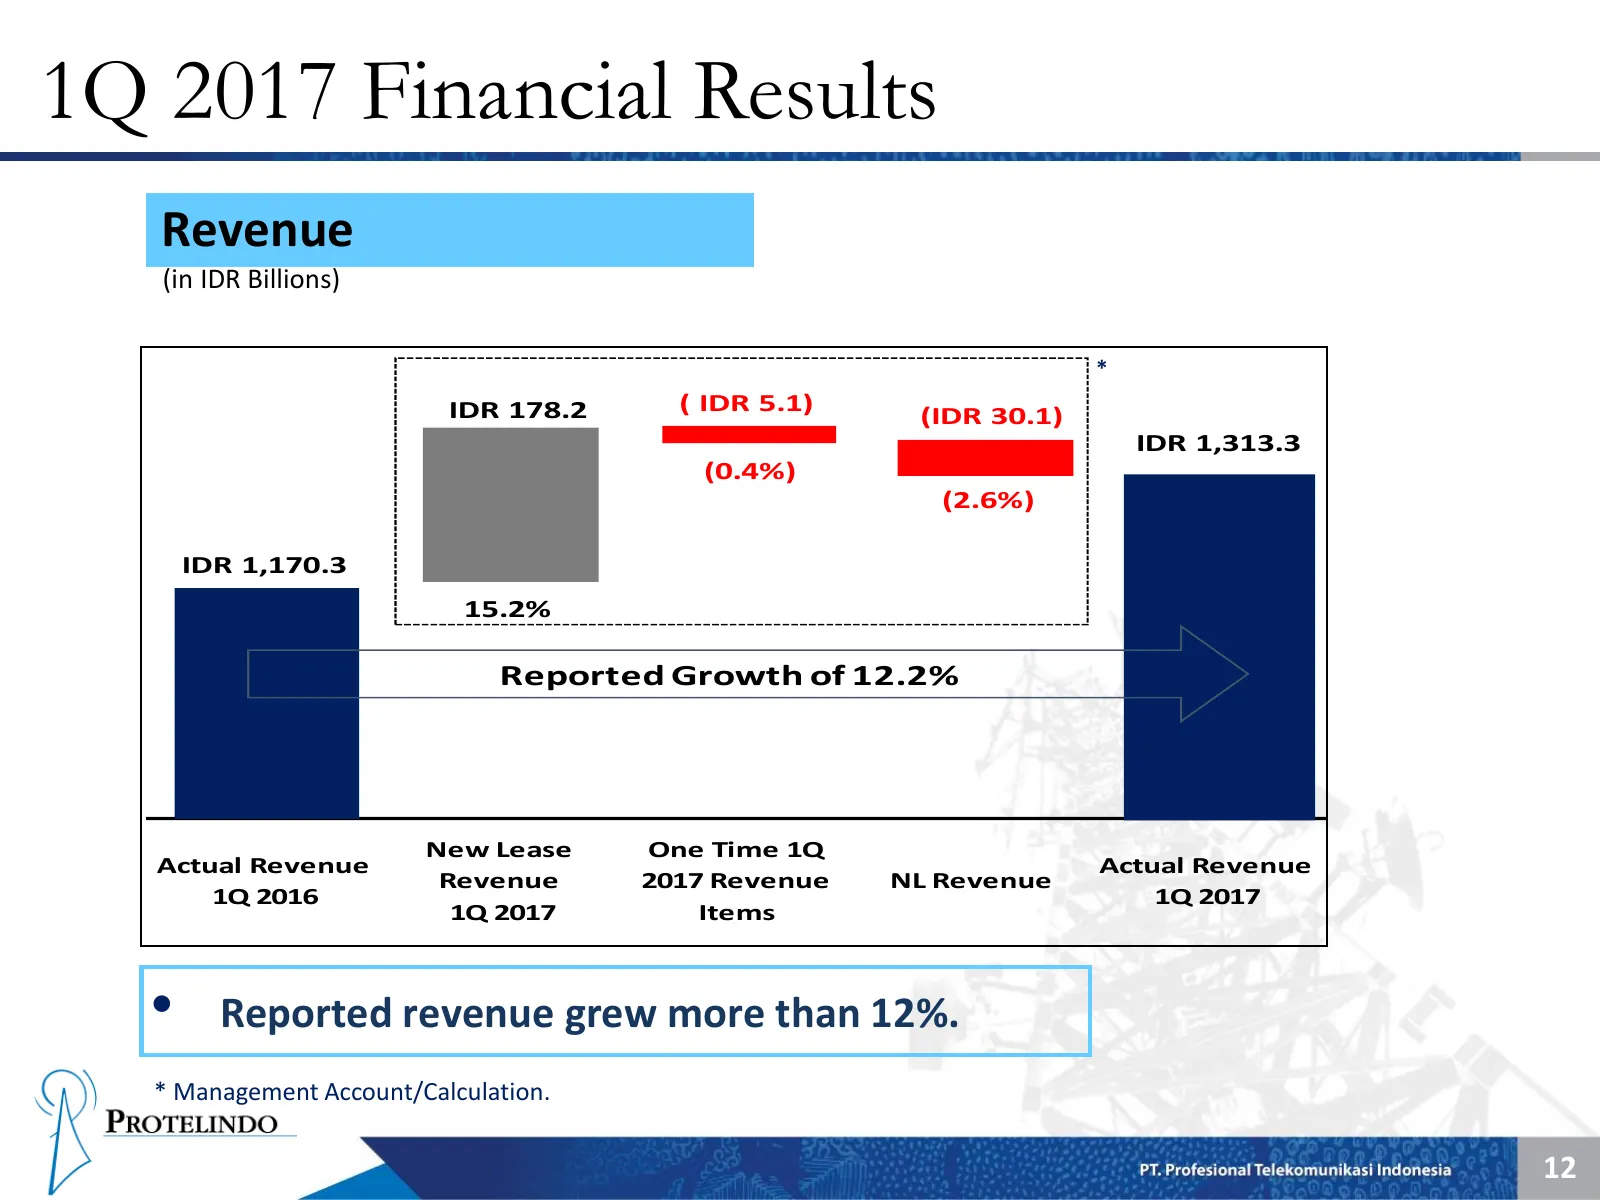
1Q 2017 Financial Results Revenue (in IDR Billions) * IDR 178.2 ( IDR 5.1) (IDR 30.1) IDR 1,313.3 (0.4%) (2.6%) IDR 1,170.3 15.2% Reported Growth of 12.2% New Lease One Time 1Q Actual Revenue Actual Revenue Revenue 2017 Revenue NL Revenue 1Q 2016 1Q 2017 1Q 2017 Items • Reported revenue grew more th
Slide 14: 1Q 2017 Financial Results
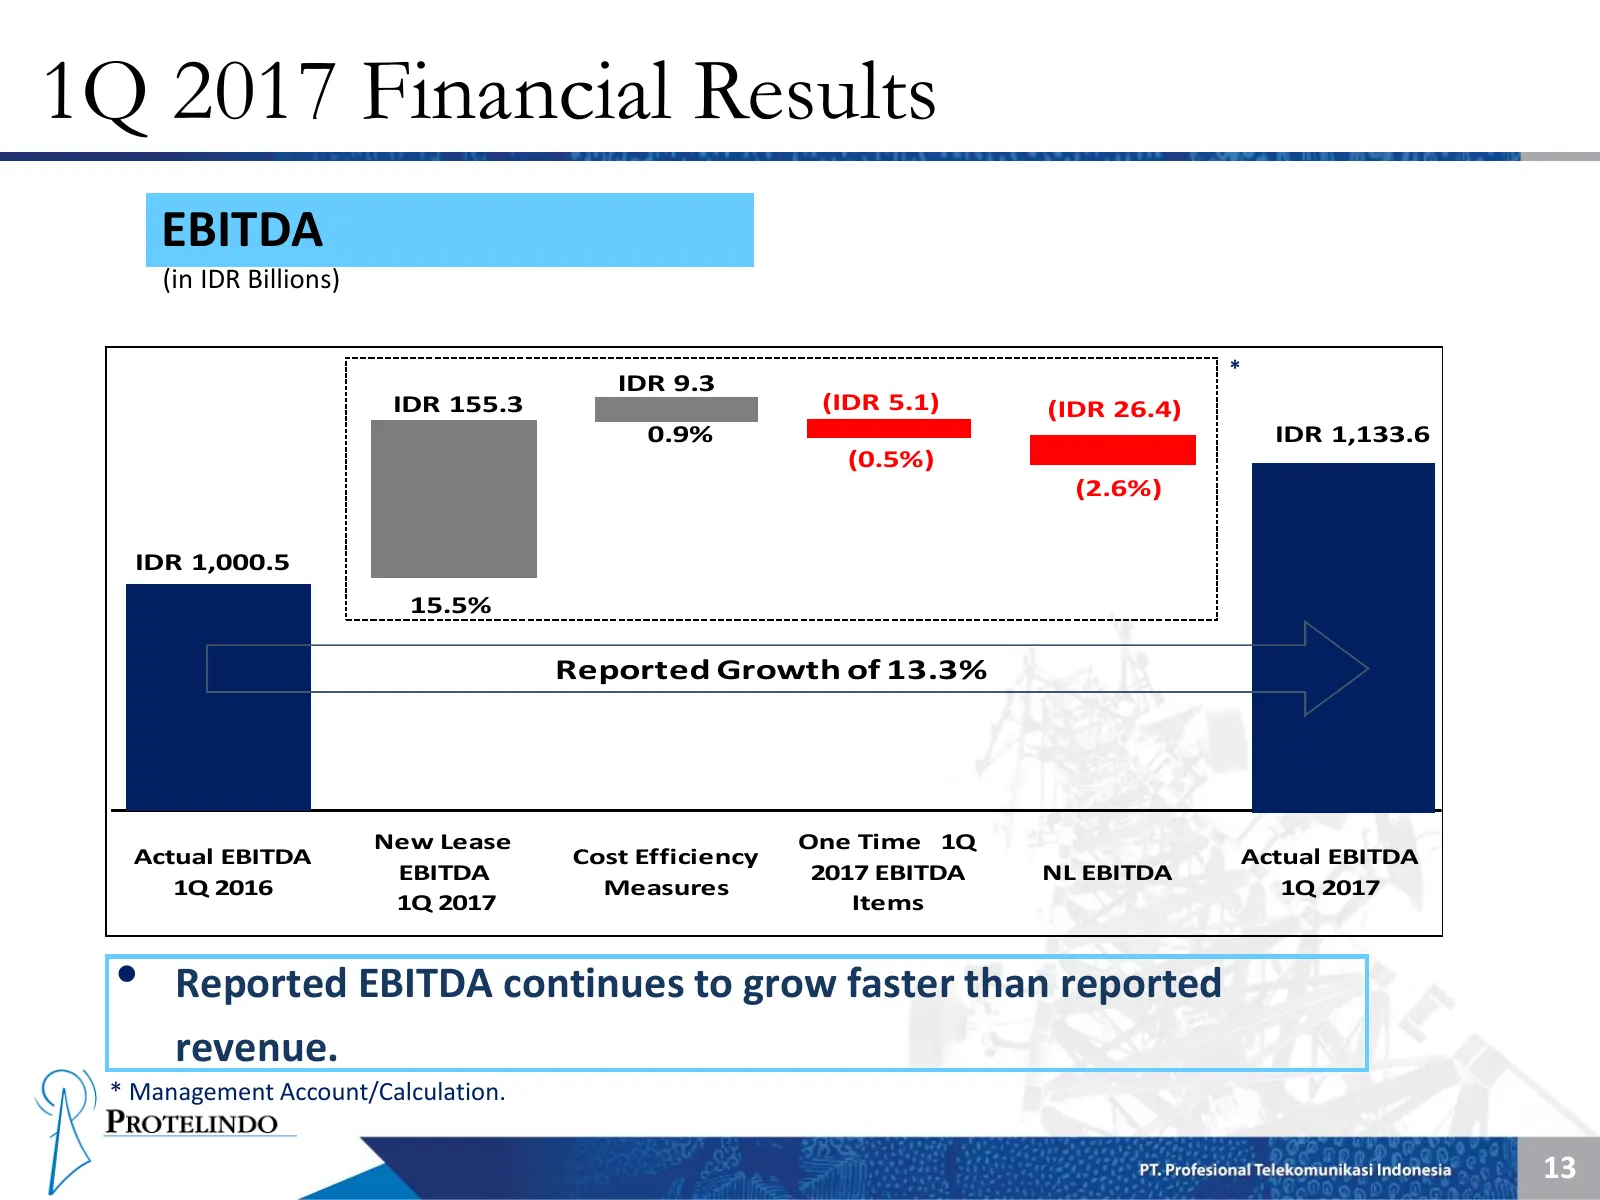
1Q 2017 Financial Results EBITDA (in IDR Billions) * IDR 9.3 IDR 155.3 (IDR 5.1) (IDR 26.4) 0.9% IDR 1,133.6 (0.5%) (2.6%) IDR 1,000.5 15.5% Reported Growth of 13.3% New Lease One Time 1Q Actual EBITDA Cost Efficiency Actual EBITDA EBITDA 2017 EBITDA NL EBITDA 1Q 2016 Measures 1Q 2017 1Q 2017 Items
Slide 15: Tower Growth
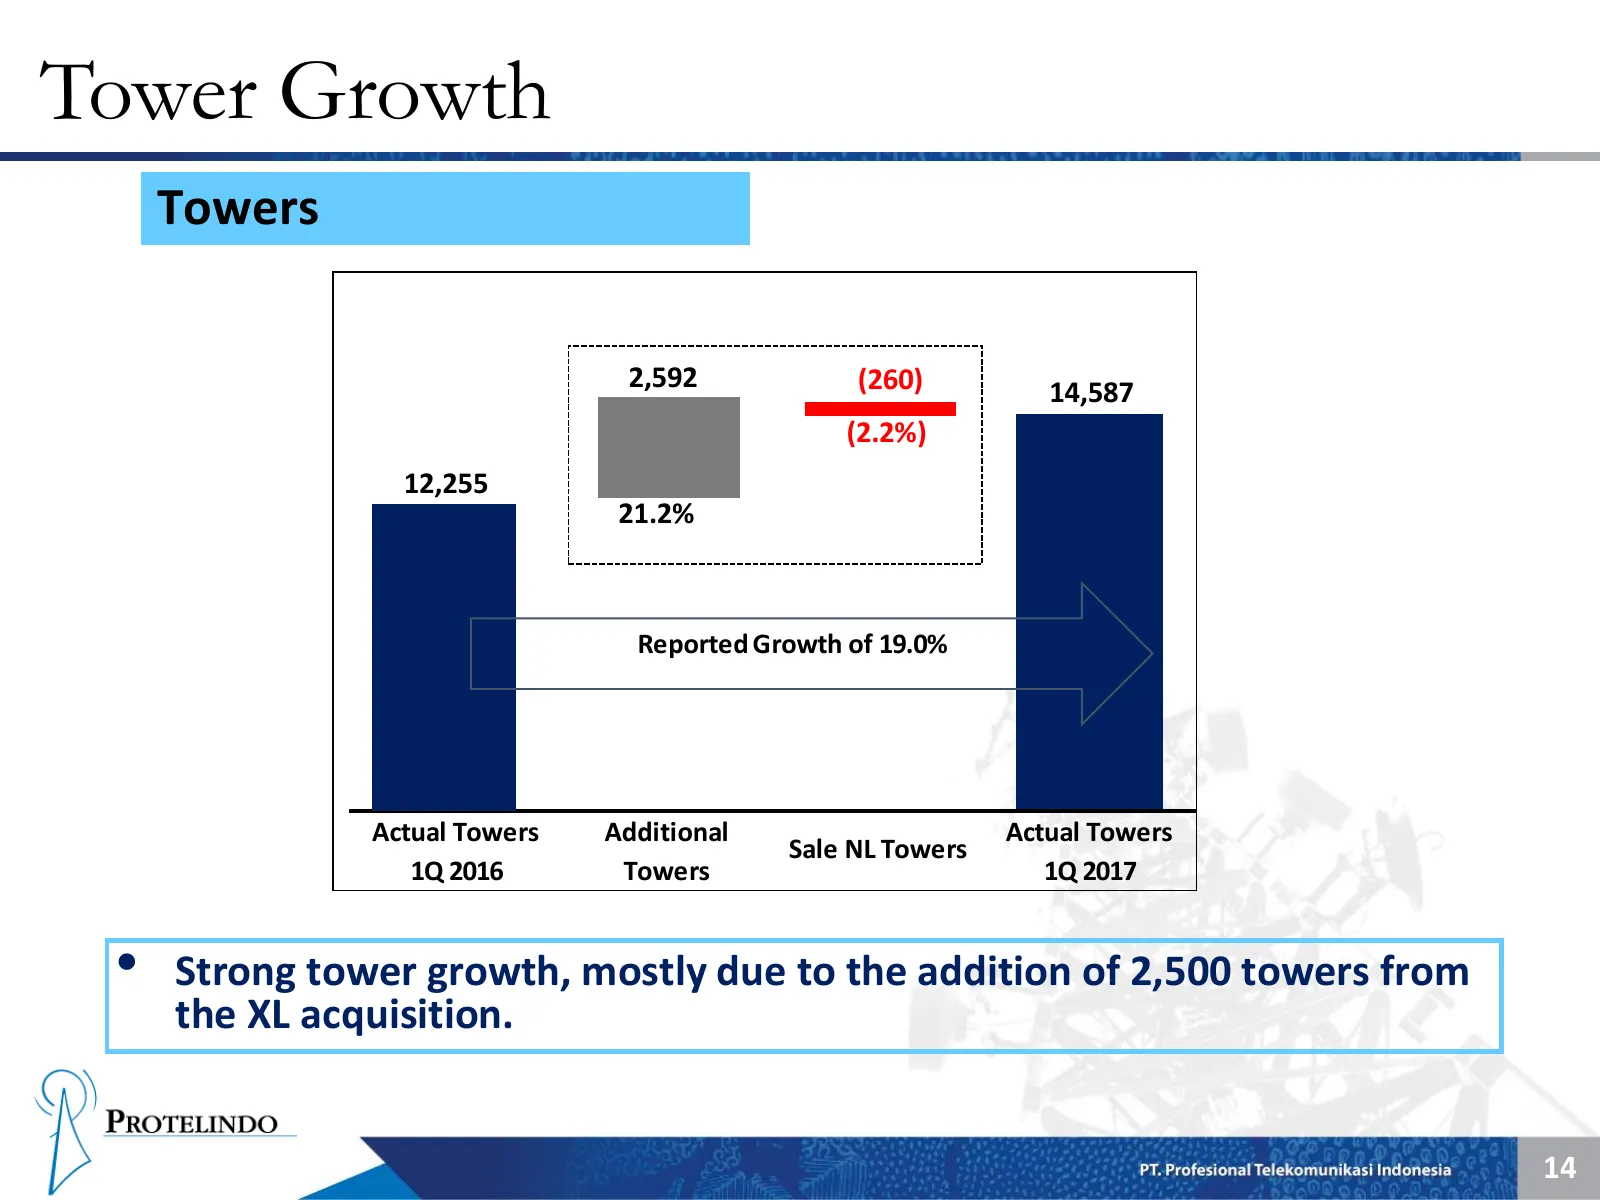
Tower Growth Towers 2,592 (260) 14,587 (2.2%) 12,255 21.2% Reported Growth of 19.0% Actual Towers Additional Actual Towers Sale NL Towers 1Q 2016 Towers 1Q 2017 • Strong tower growth, mostly due to the addition of 2,500 towers from the XL acquisition. 14
Slide 16: Tenant Growth
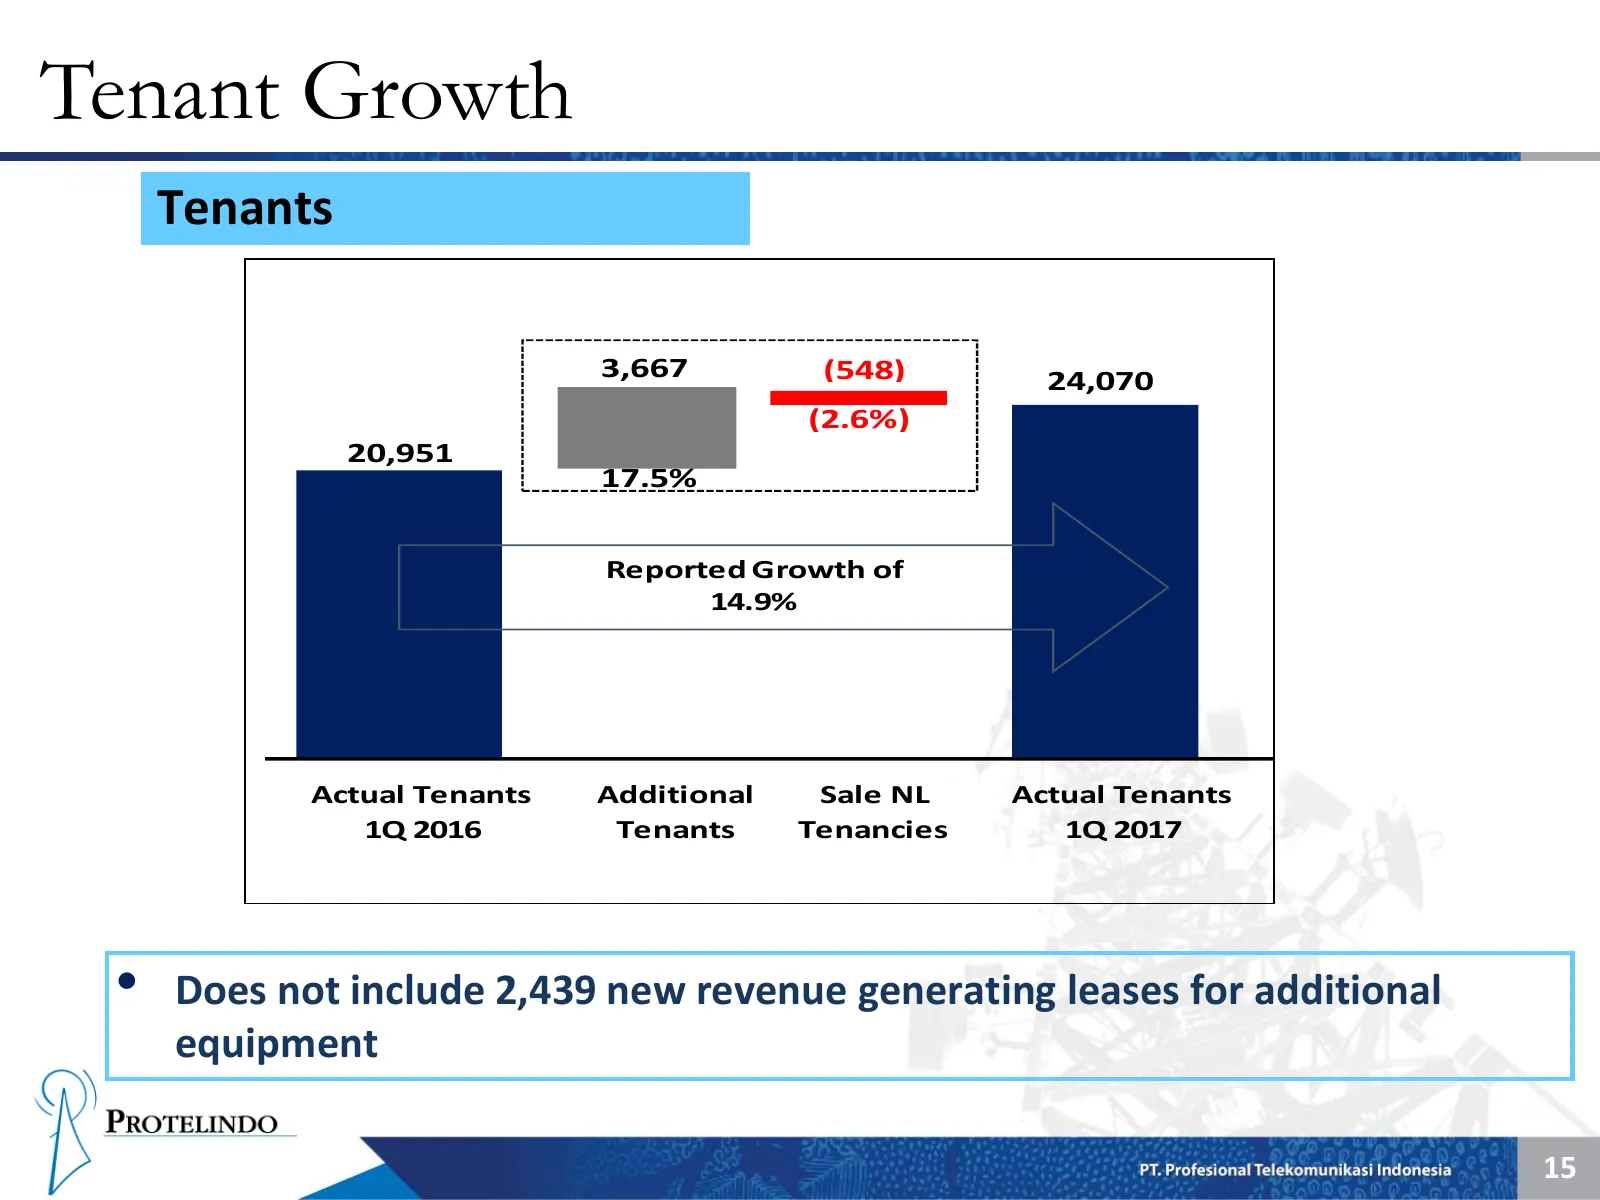
Tenant Growth Tenants 3,667 (548) 24,070 (2.6%) 20,951 17.5% Reported Growth of 14.9% Actual Tenants Additional Sale NL Actual Tenants 1Q 2016 Tenants Tenancies 1Q 2017 • Does not include 2,439 new revenue generating leases for additional equipment 15
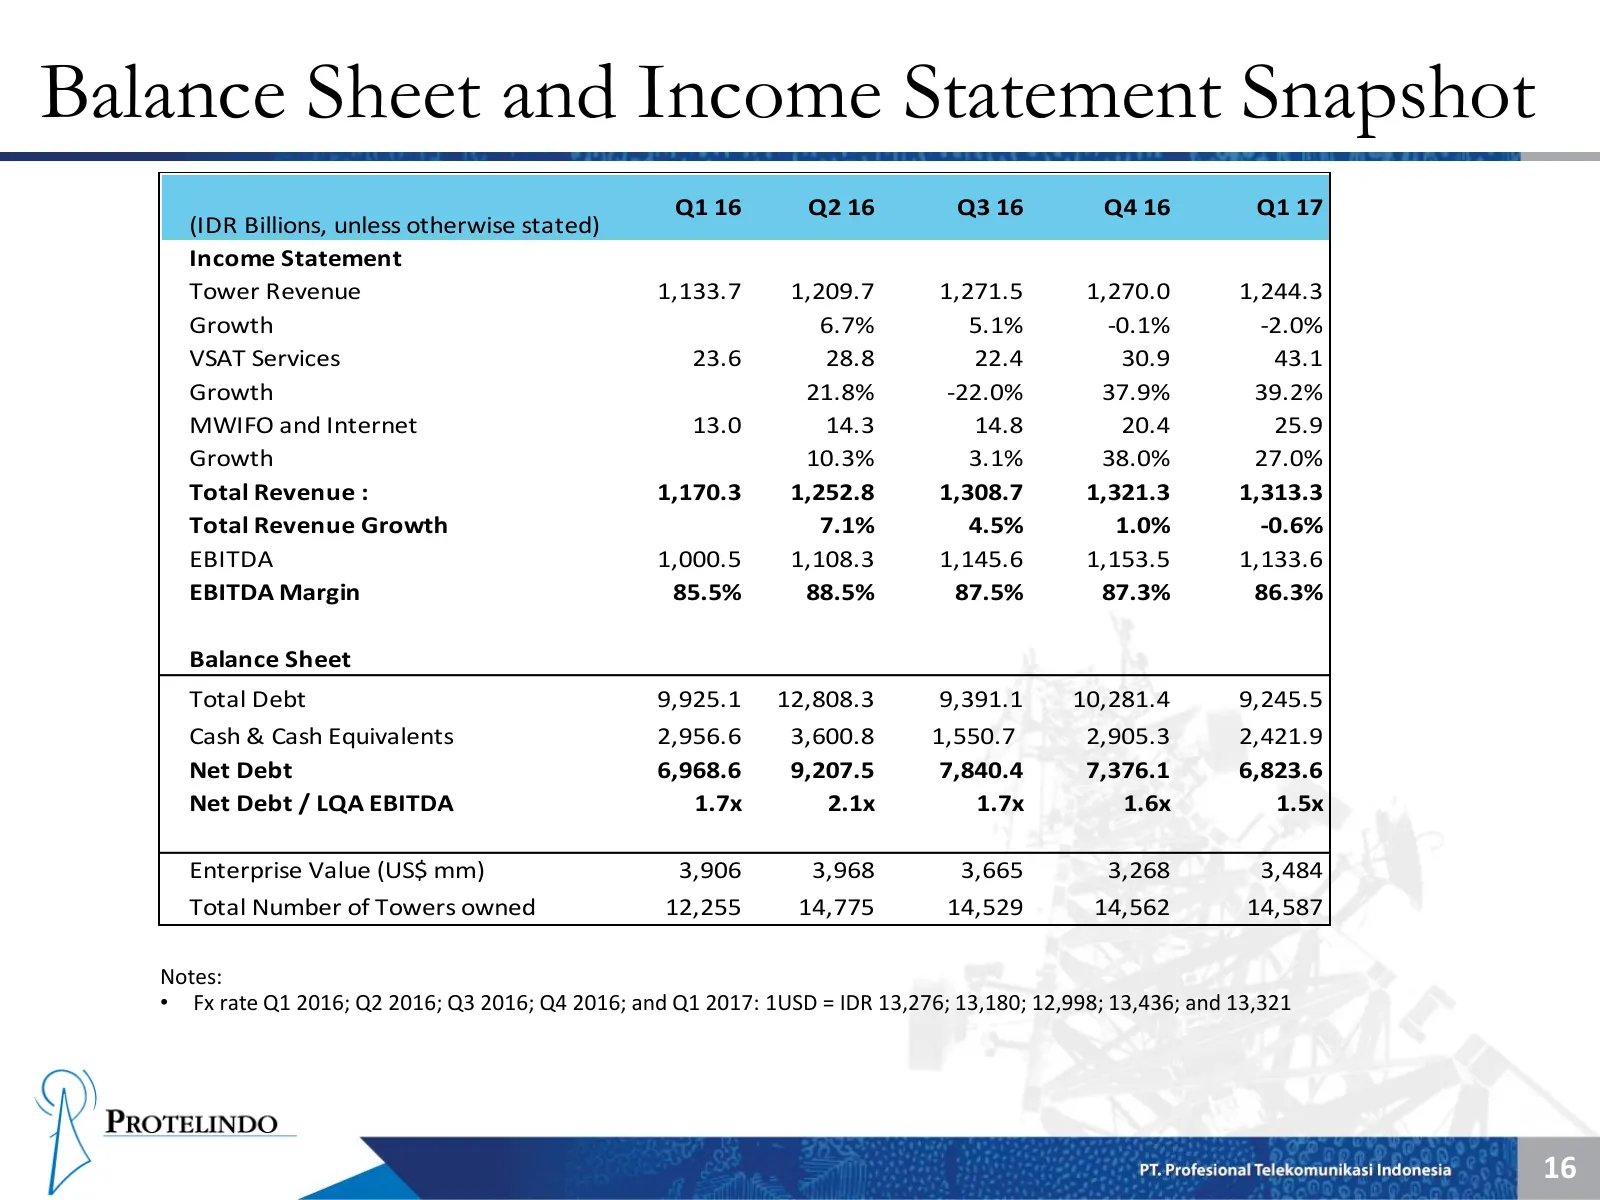
Slide 17: Balance Sheet and Income Statement Snapshot
Balance Sheet and Income Statement Snapshot Q1 16 Q2 16 Q3 16 Q4 16 Q1 17 (IDR Billions, unless otherwise stated) Income Statement Tower Revenue 1,133.7 1,209.7 1,271.5 1,270.0 1,244.3 Growth 6.7% 5.1% -0.1% -2.0% VSAT Services 23.6 28.8 22.4 30.9 43.1 Growth 21.8% -22.0% 37.9% 39.2% MWIFO and Inter
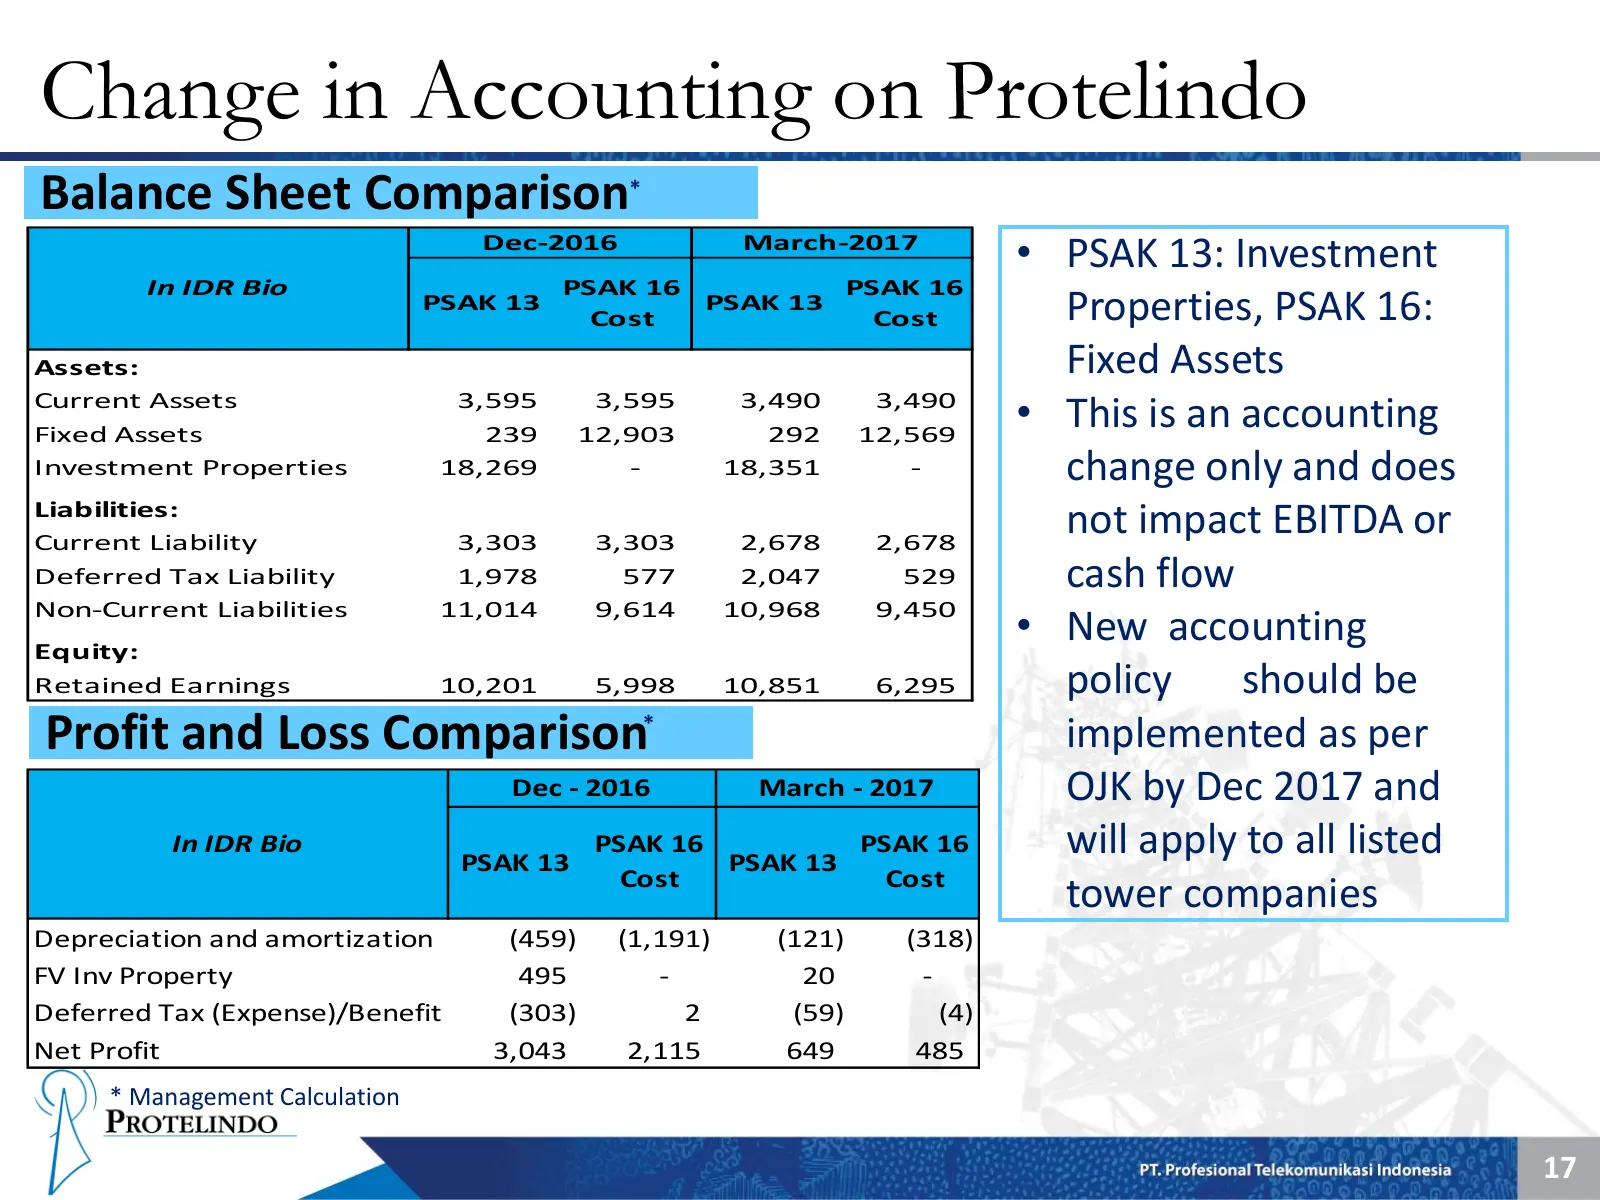
Slide 18: Change in Accounting on Protelindo
Change in Accounting on Protelindo Balance Sheet Comparison* Dec-2016 March-2017 • PSAK 13: Investment In IDR Bio PSAK 16 PSAK 16 PSAK 13 Cost PSAK 13 Cost Properties, PSAK 16: Assets: Fixed Assets Current Assets Fixed Assets 3,595 239 3,595 12,903 3,490 292 3,490 12,569 • This is an accounting Inve
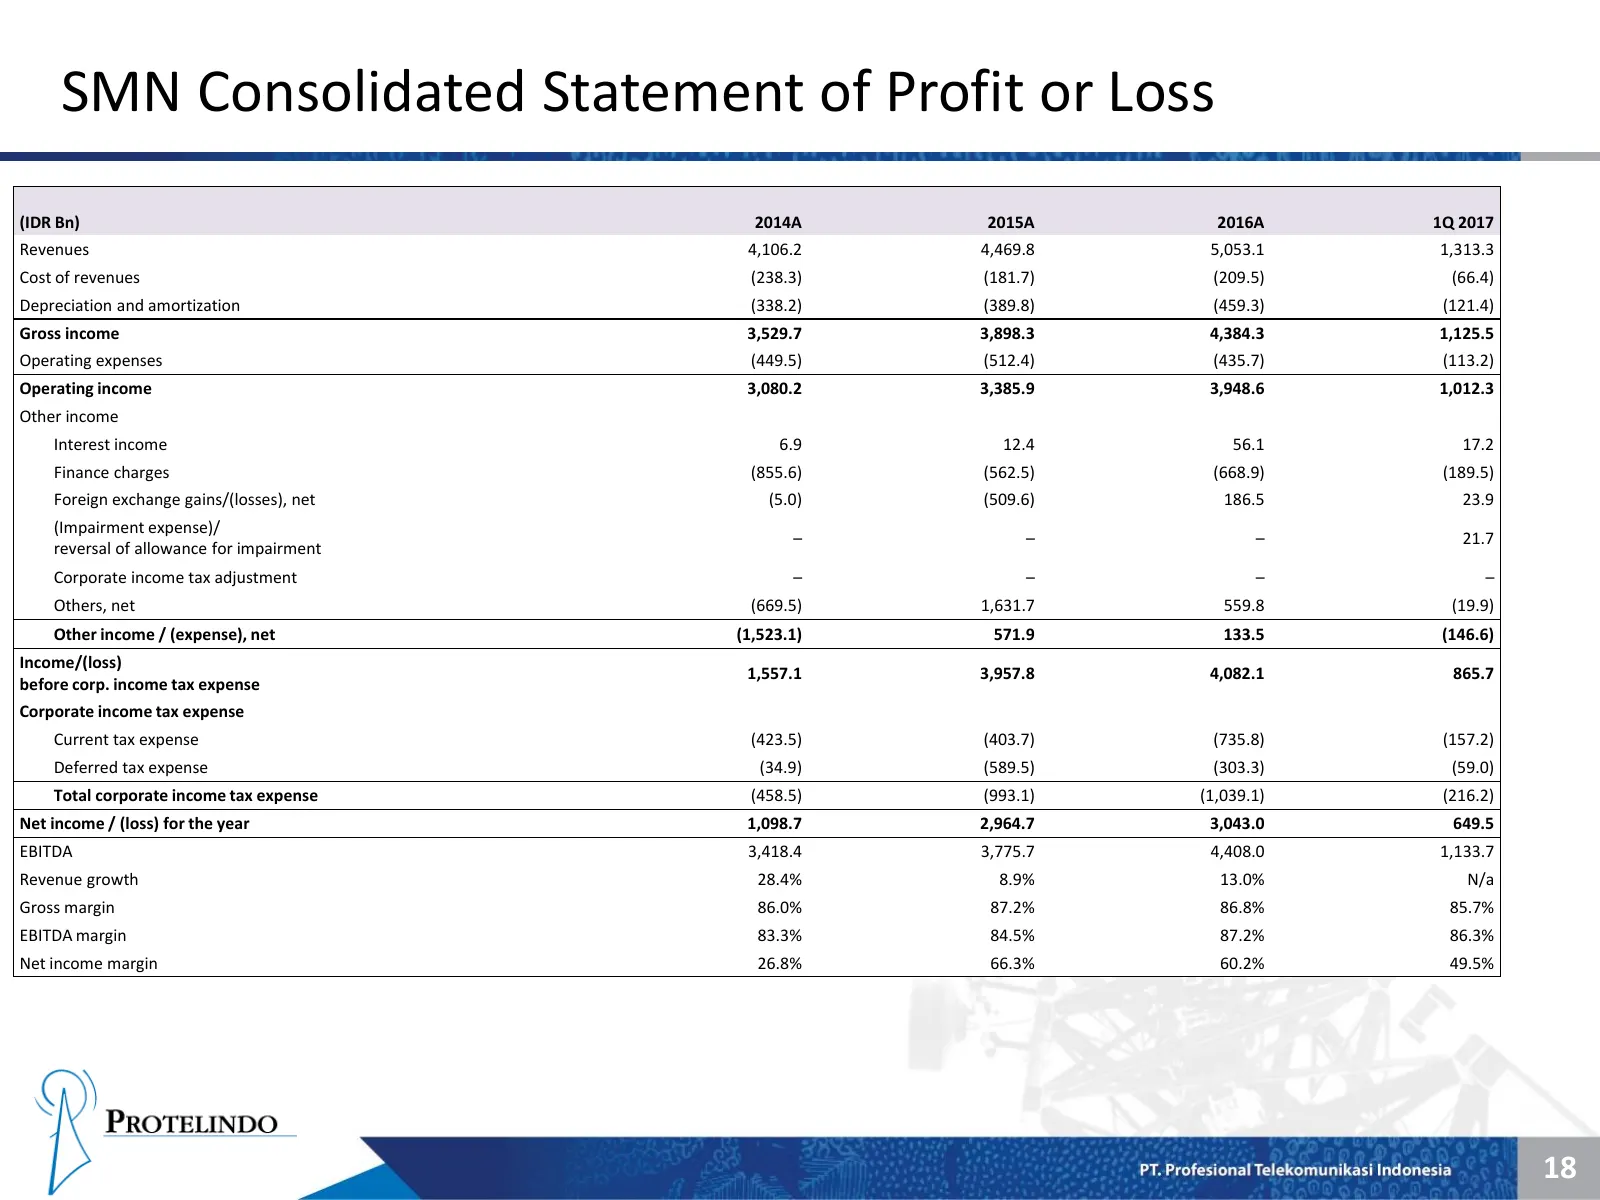
Slide 19: SMN Consolidated Statement of Profit or Loss
SMN Consolidated Statement of Profit or Loss (IDR Bn) 2014A 2015A 2016A 1Q 2017 Revenues 4,106.2 4,469.8 5,053.1 1,313.3 Cost of revenues (238.3) (181.7) (209.5) (66.4) Depreciation and amortization (338.2) (389.8) (459.3) (121.4) Gross income 3,529.7 3,898.3 4,384.3 1,125.5 Operating expenses (449.
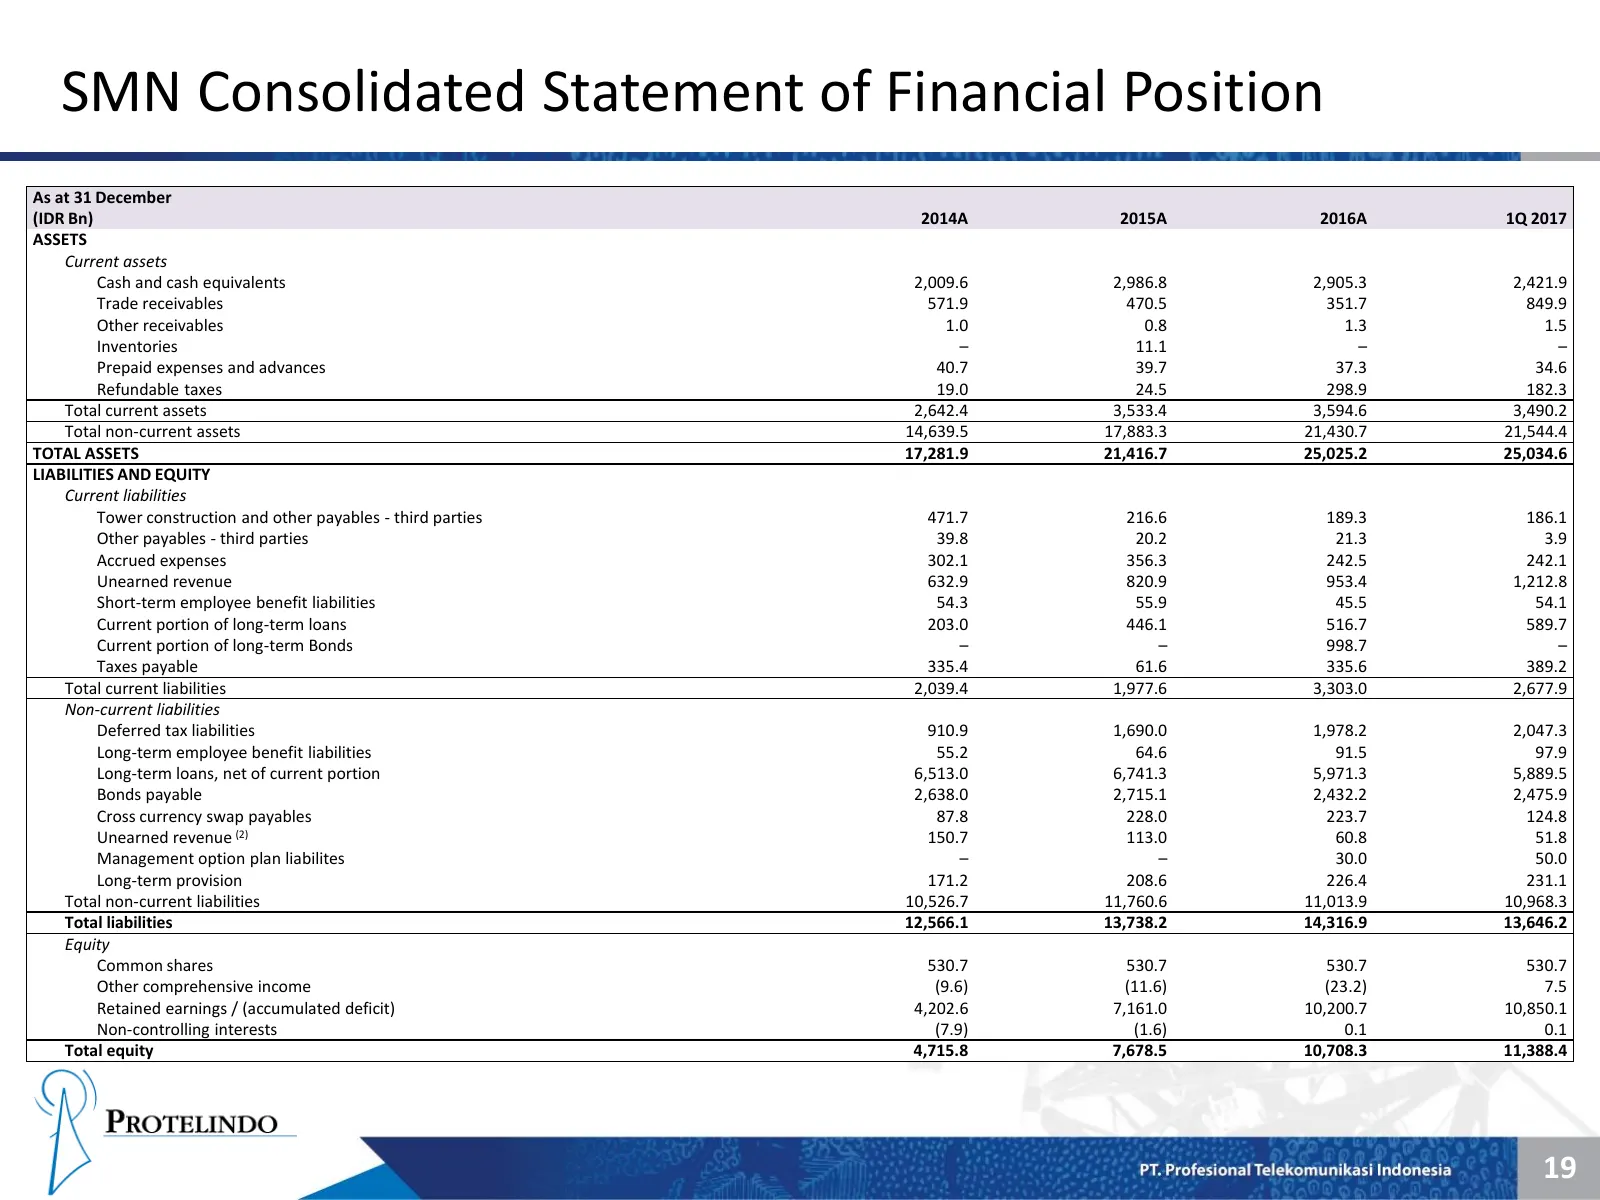
Slide 20: SMN Consolidated Statement of Financial Position
SMN Consolidated Statement of Financial Position As at 31 December (IDR Bn) 2014A 2015A 2016A 1Q 2017 ASSETS Current assets Cash and cash equivalents 2,009.6 2,986.8 2,905.3 2,421.9 Trade receivables 571.9 470.5 351.7 849.9 Other receivables 1.0 0.8 1.3 1.5 Inventories – 11.1 – – Prepaid expenses an
Slide 21: Debt Profile
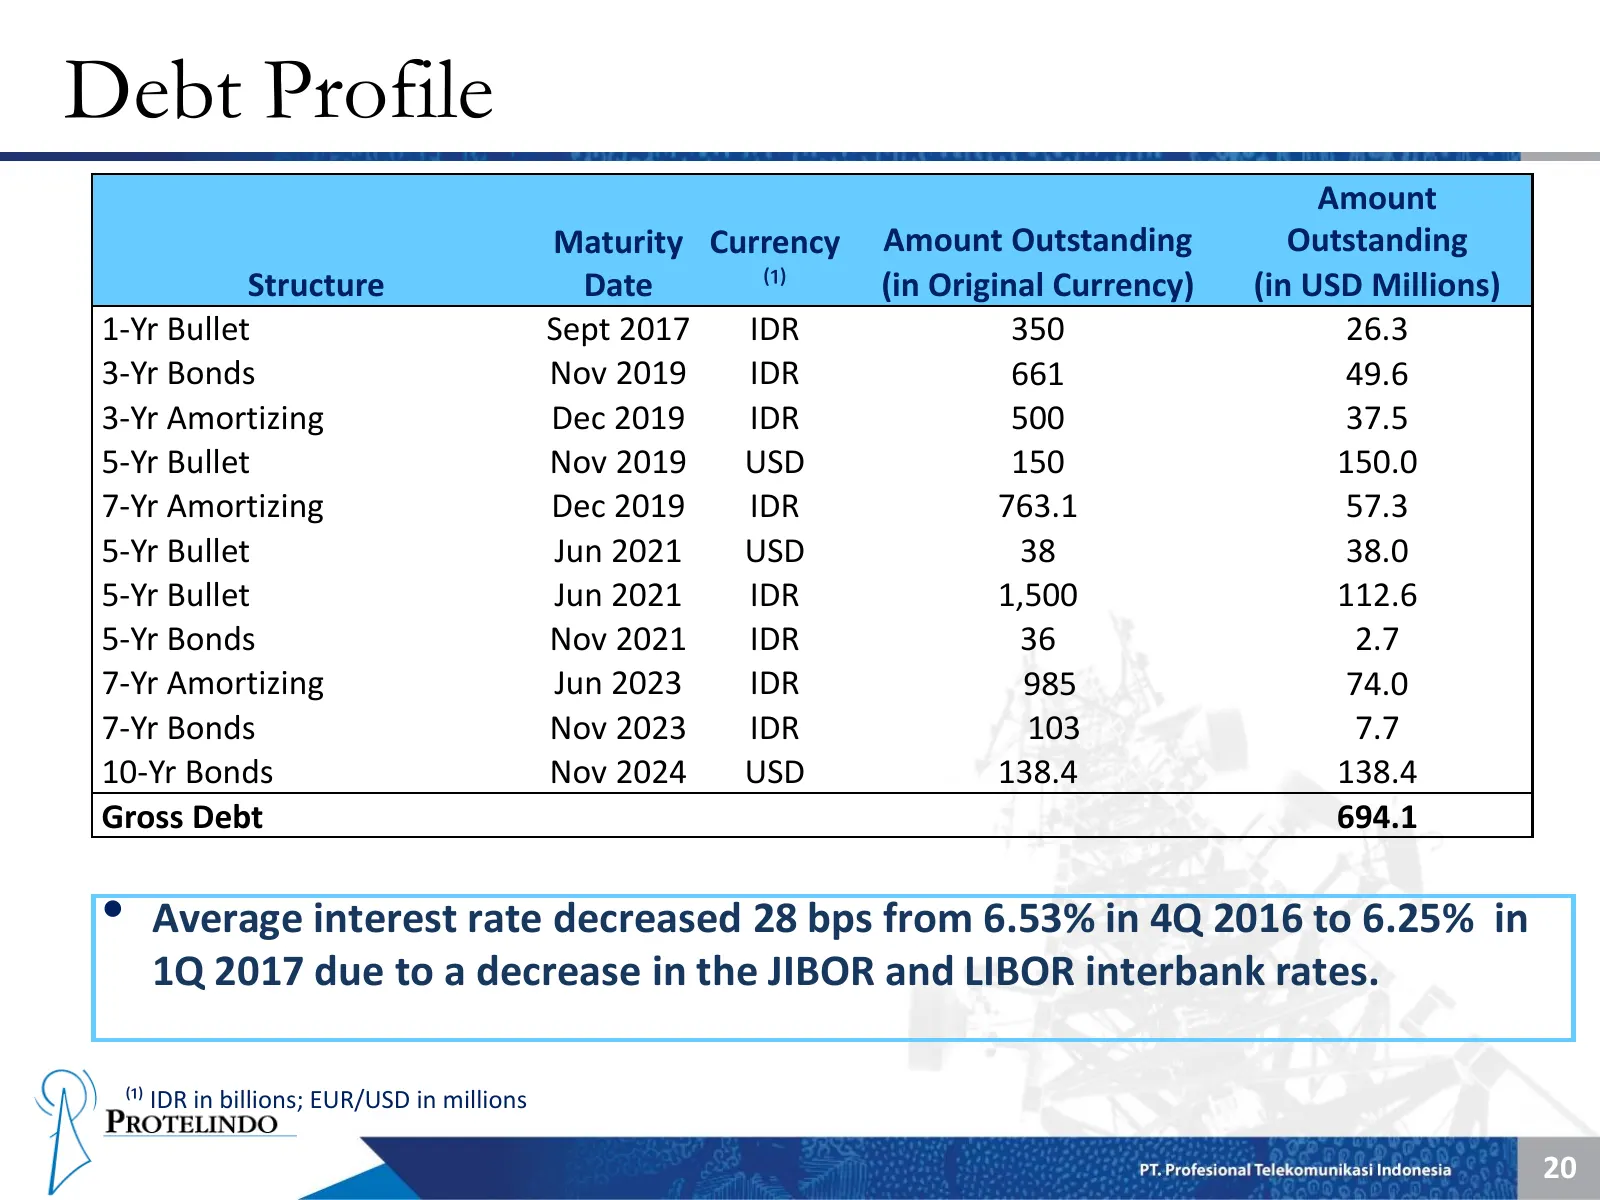
Debt Profile Amount Maturity Currency Amount Outstanding Outstanding Structure Date ⁽¹⁾ (in Original Currency) (in USD Millions) 1-Yr Bullet Sept 2017 IDR 350 26.3 3-Yr Bonds Nov 2019 IDR 661 49.6 3-Yr Amortizing Dec 2019 IDR 500 37.5 5-Yr Bullet Nov 2019 USD 150 150.0 7-Yr Amortizing Dec 2019 IDR 7
Slide 22: Strategy
Strategy q)) PROTELINDO
Slide 23: Enhancing Shareholder Value - Build, Buy, Return
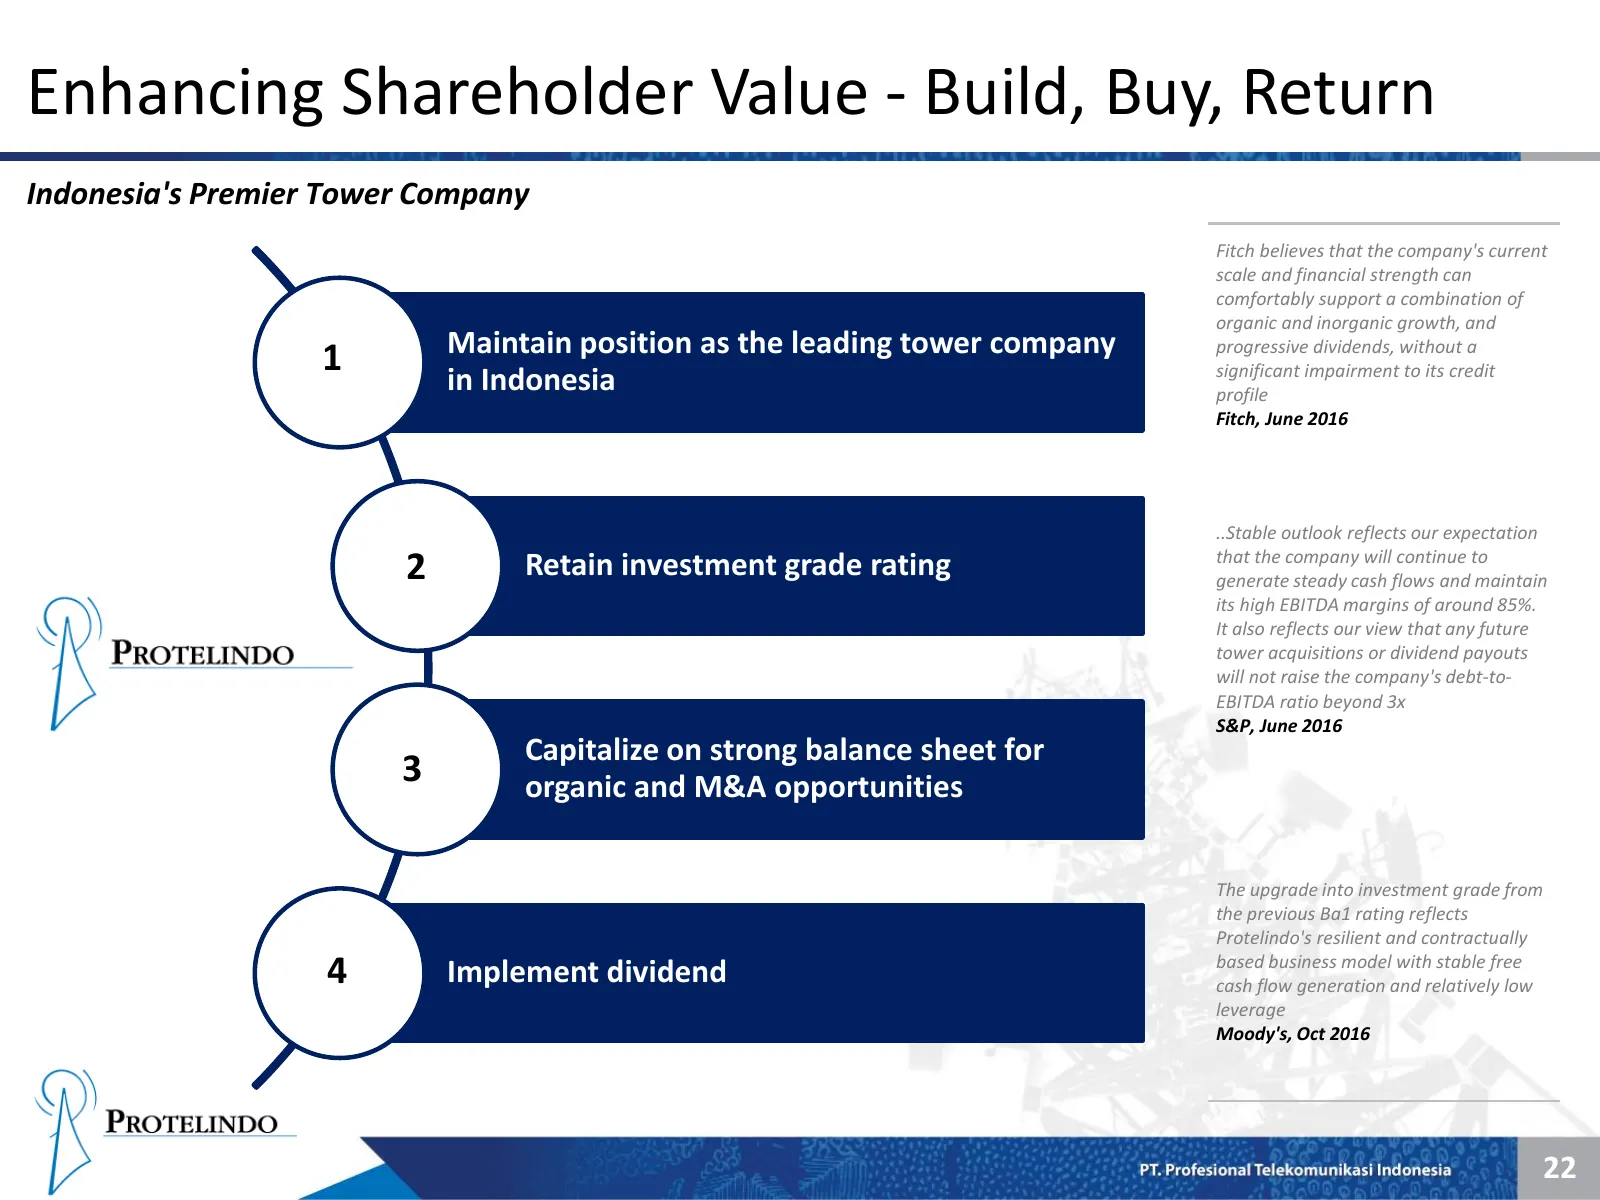
Enhancing Shareholder Value - Build, Buy, Return Indonesia's Premier Tower Company Fitch believes that the company's current scale and financial strength can comfortably support a combination of organic and inorganic growth, and Maintain position as the leading tower company progressive dividends, w
Source: Internet Archive copy of media.ptsmn.co.id
More decks from PT Sarana Menara Nusantara Tbk
 Q2 2026 Earnings Presentation25 slides · Aug 14, 2026
 Q1 2026 Earnings Presentation25 slides · Jun 3, 2026
 Q4 2025 Earnings Presentation24 slides · Apr 6, 2026
 Q2 2023 Earnings Presentation26 slides · Sep 28, 2023
 Q1 2023 Earnings Presentation26 slides · May 2023
 FY2022 Earnings Presentation26 slides · Apr 6, 2023