Maire S.p.A. · MIL:MAIRE
Maire — Maire Tecnimont — Investor Presentation (March 2017)
32 slides from Maire's investor presentation, March 2017
Slide 1: Maire Tecnimont Group Overview March 2017
MAIRE TECNIMONT GROUP OVERVIEW MARCH 2017 CORPORATE PROFILE | MAY 2016
Slide 2: Disclaimer
DISCLAIMER This document has been prepared by Maire Tecnimont S.p.A. (the “Company”) solely for use in the presentation of the Maire Tecnimont Group (the “Group”). This document does not constitute or form part of any offer or invitation to sell, or any solicitation to purchase any security issued b
Slide 3: Summary
SUMMARY 1. Group Overview 2. Strategy and Competitive Positioning 3. Operations 4. Financial Data 5. Conclusions
Slide 4: Maire Tecnimont Group
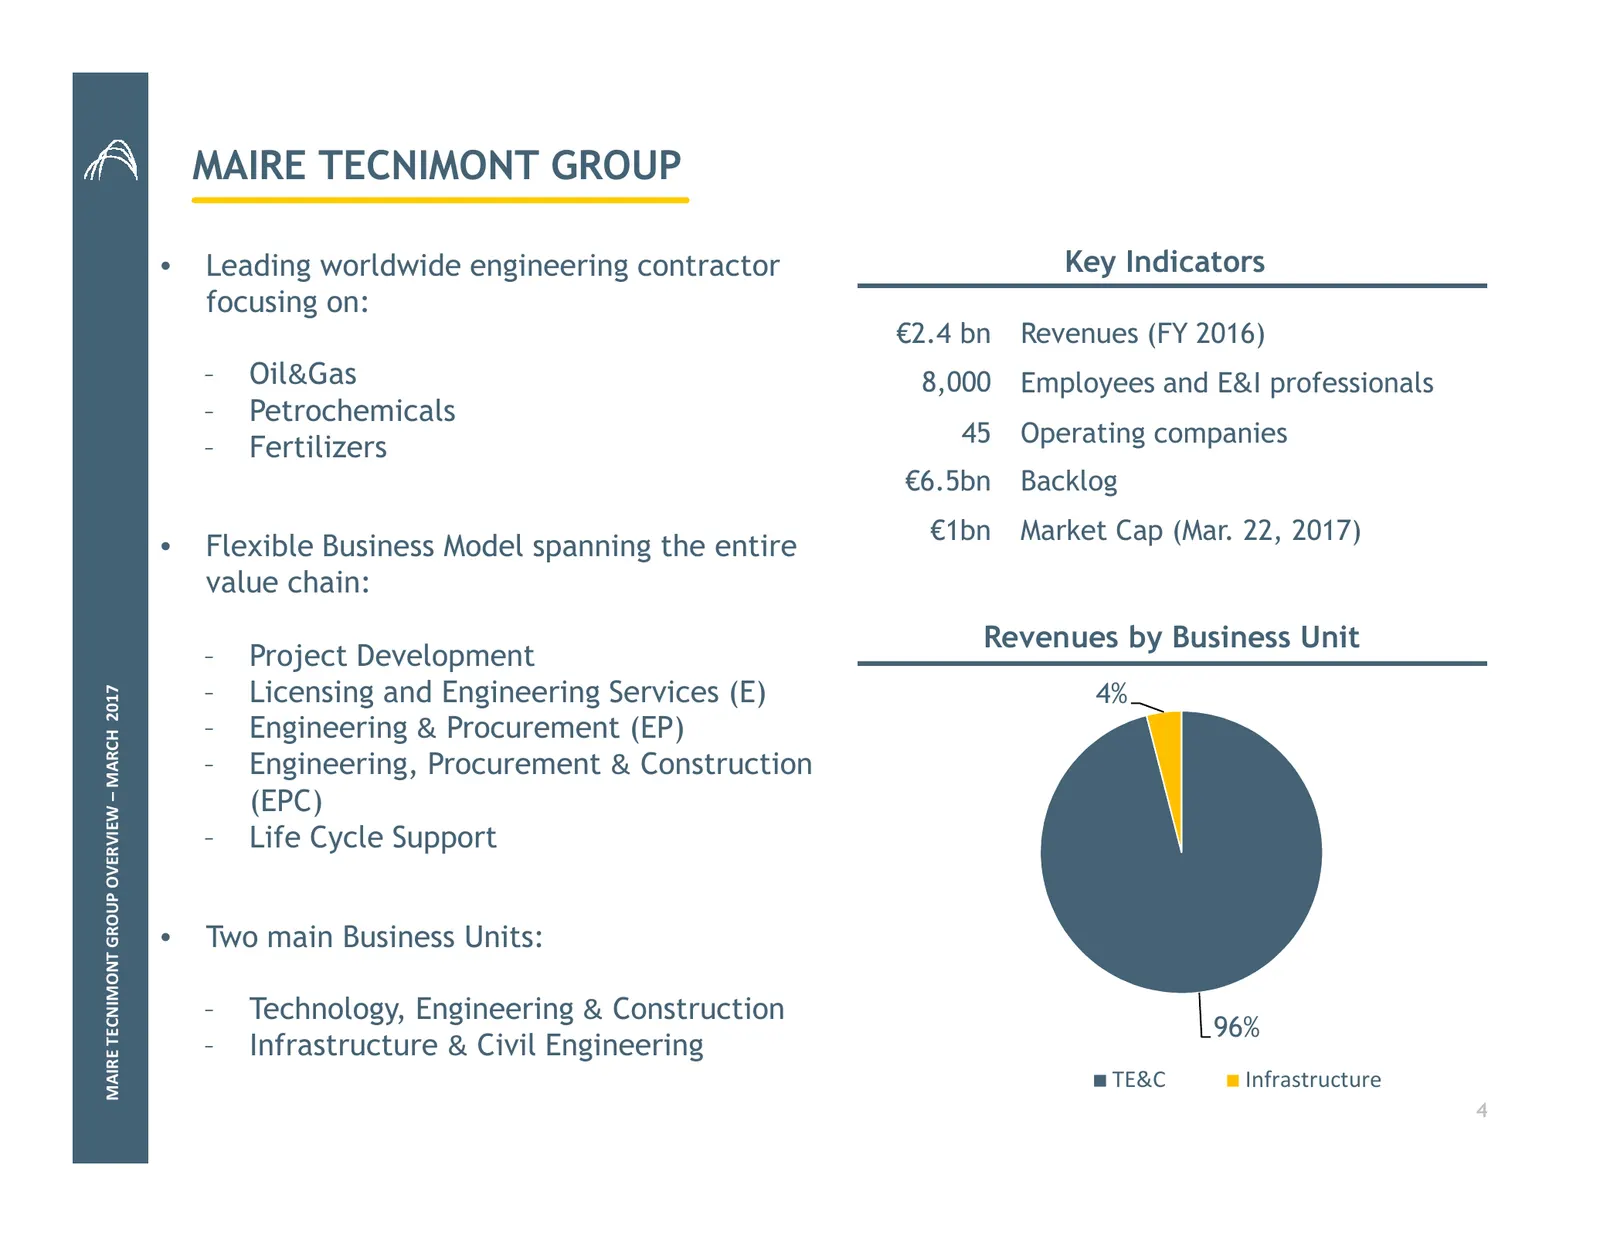
MAIRE TECNIMONT GROUP • Leading worldwide engineering contractor Key Indicators focusing on: €2.4 bn Revenues (FY 2016) – Oil&Gas 8,000 Employees and E&I professionals – Petrochemicals 45 Operating companies – Fertilizers €6.5bn Backlog €1bn Market Cap (Mar. 22, 2017) • Flexible Business Model spann
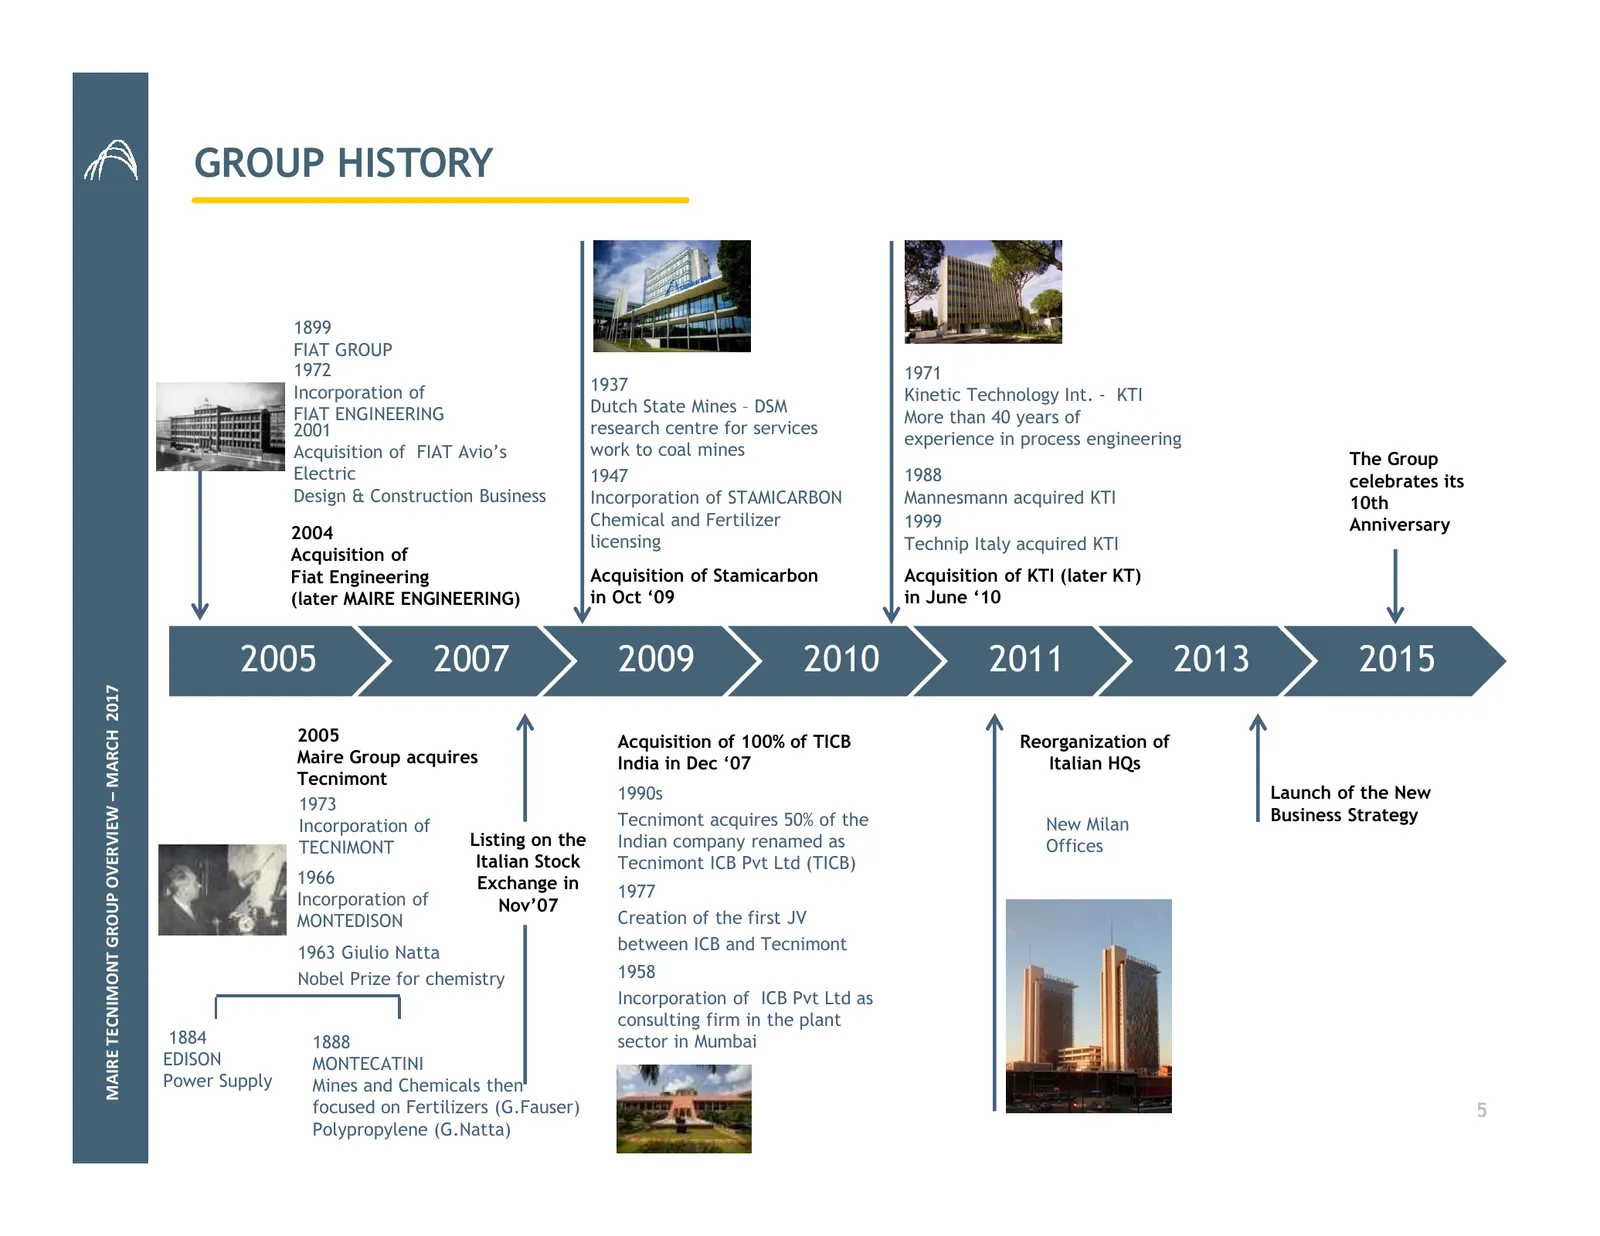
Slide 5: Group History
GROUP HISTORY 1899 FIAT GROUP 1972 1971 Incorporation of 1937 Kinetic Technology Int. - KTI FIAT ENGINEERING Dutch State Mines – DSM More than 40 years of 2001 research centre for services experience in process engineering Acquisition of FIAT Avio’s work to coal mines The Group Electric 1947 1988 ce
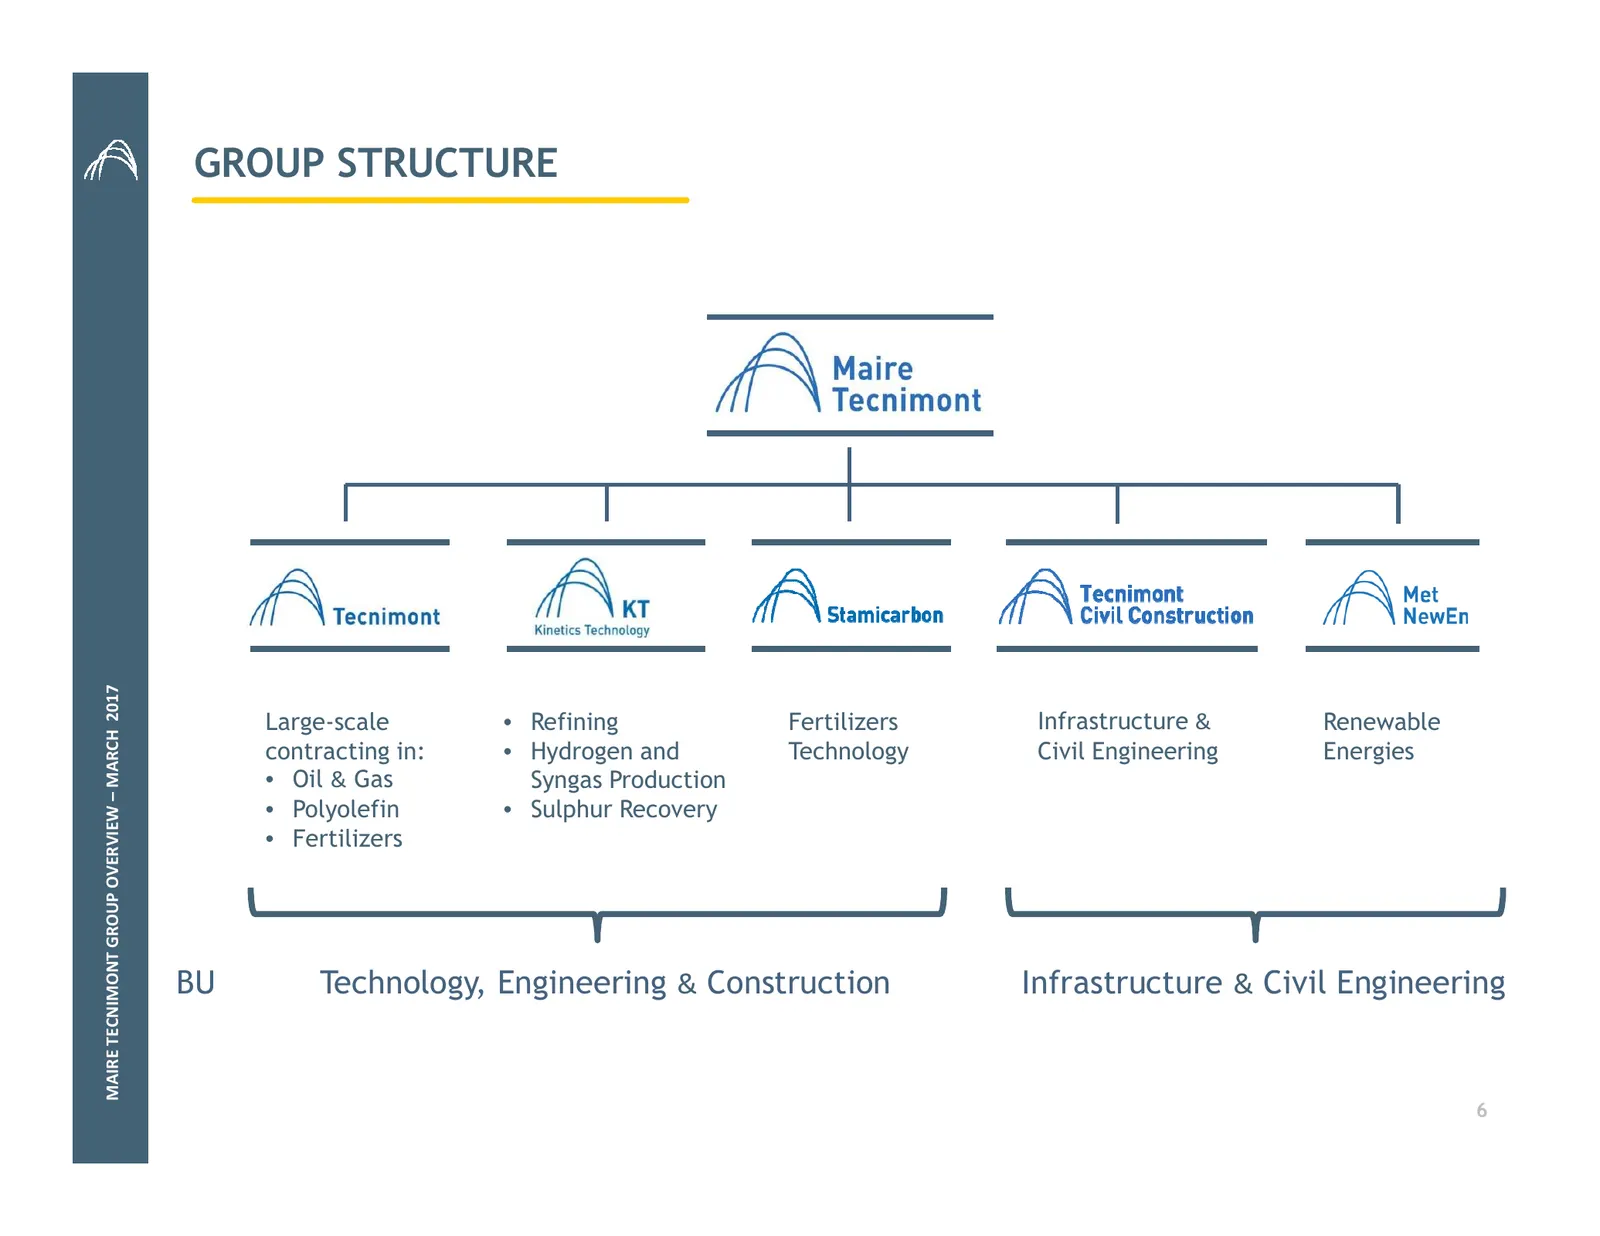
Slide 6: Group Structure
GROUP STRUCTURE MAIRE TECNIMONT GROUP OVERVIEW – MARCH 2017 Large-scale • Refining Fertilizers Infrastructure & Renewable contracting in: • Hydrogen and Technology Civil Engineering Energies • Oil & Gas Syngas Production • Polyolefin • Sulphur Recovery • Fertilizers BU Technology, Engineering & Cons
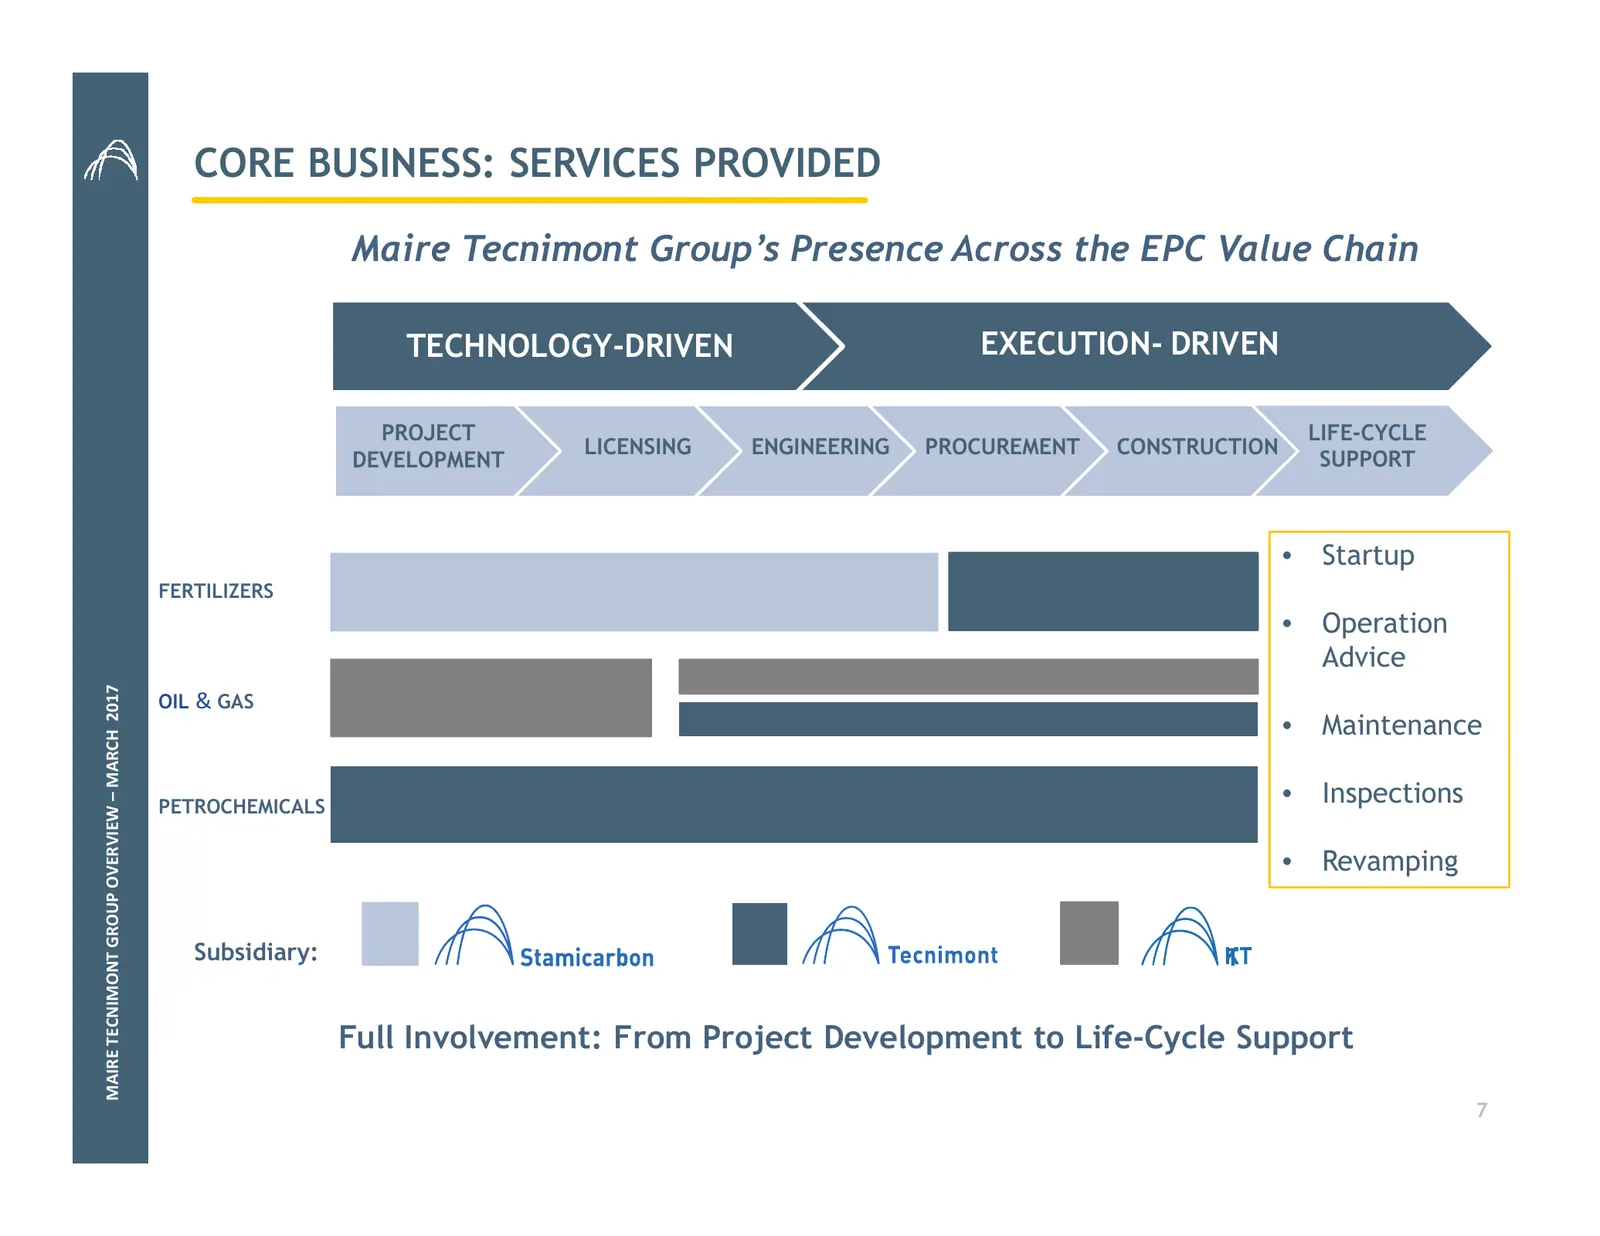
Slide 7: Core Business: Services Provided
CORE BUSINESS: SERVICES PROVIDED Maire Tecnimont Group’s Presence Across the EPC Value Chain TECHNOLOGY-DRIVEN EXECUTION- DRIVEN PROJECT LIFE-CYCLE LICENSING ENGINEERING PROCUREMENT CONSTRUCTION DEVELOPMENT SUPPORT • Startup FERTILIZERS • Operation Advice MAIRE TECNIMONT GROUP OVERVIEW – MARCH 2017
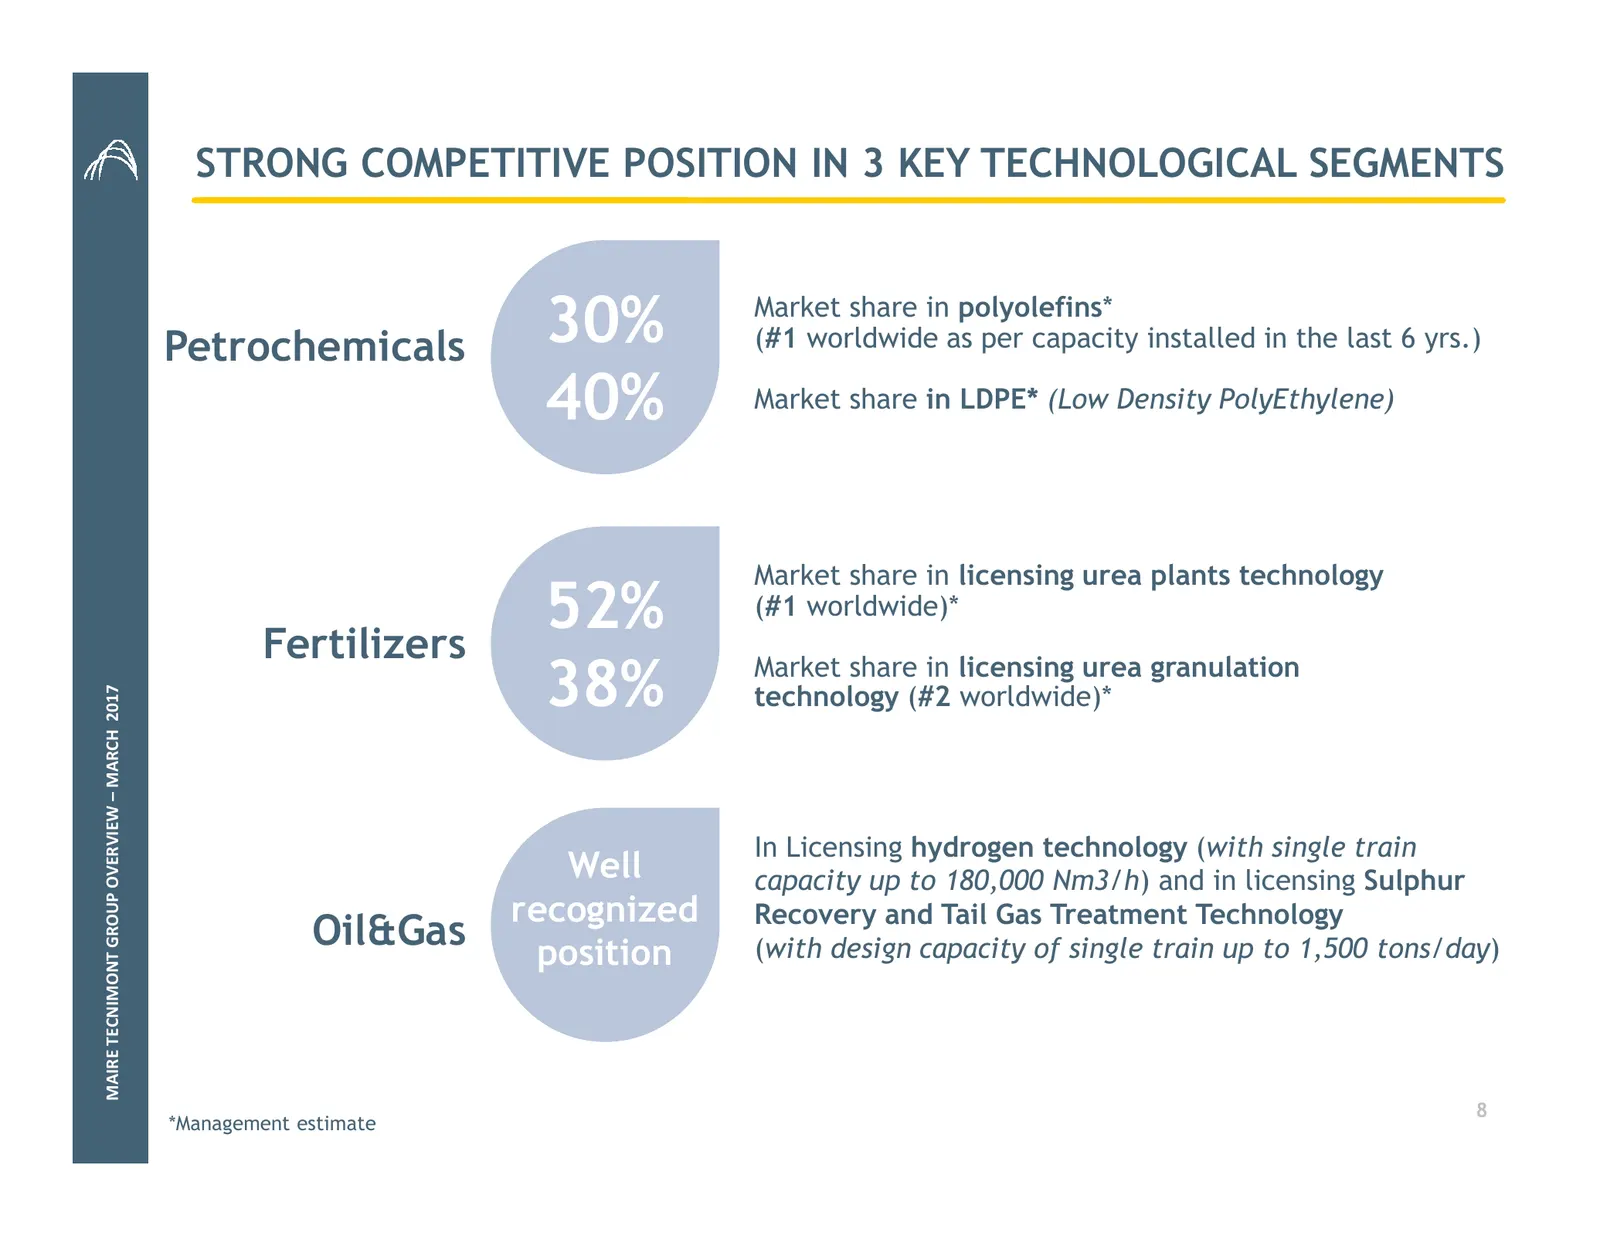
Slide 8: Strong Competitive Position in Key Technological Segments
STRONG COMPETITIVE POSITION IN 3 KEY TECHNOLOGICAL SEGMENTS Petrochemicals 30% Market share in polyolefins* (#1 worldwide as per capacity installed in the last 6 yrs.) 40% Market share in LDPE* (Low Density PolyEthylene) Market share in licensing urea plants technology Fertilizers 52% (#1 worldwide)
Slide 9: Extensive International Presence
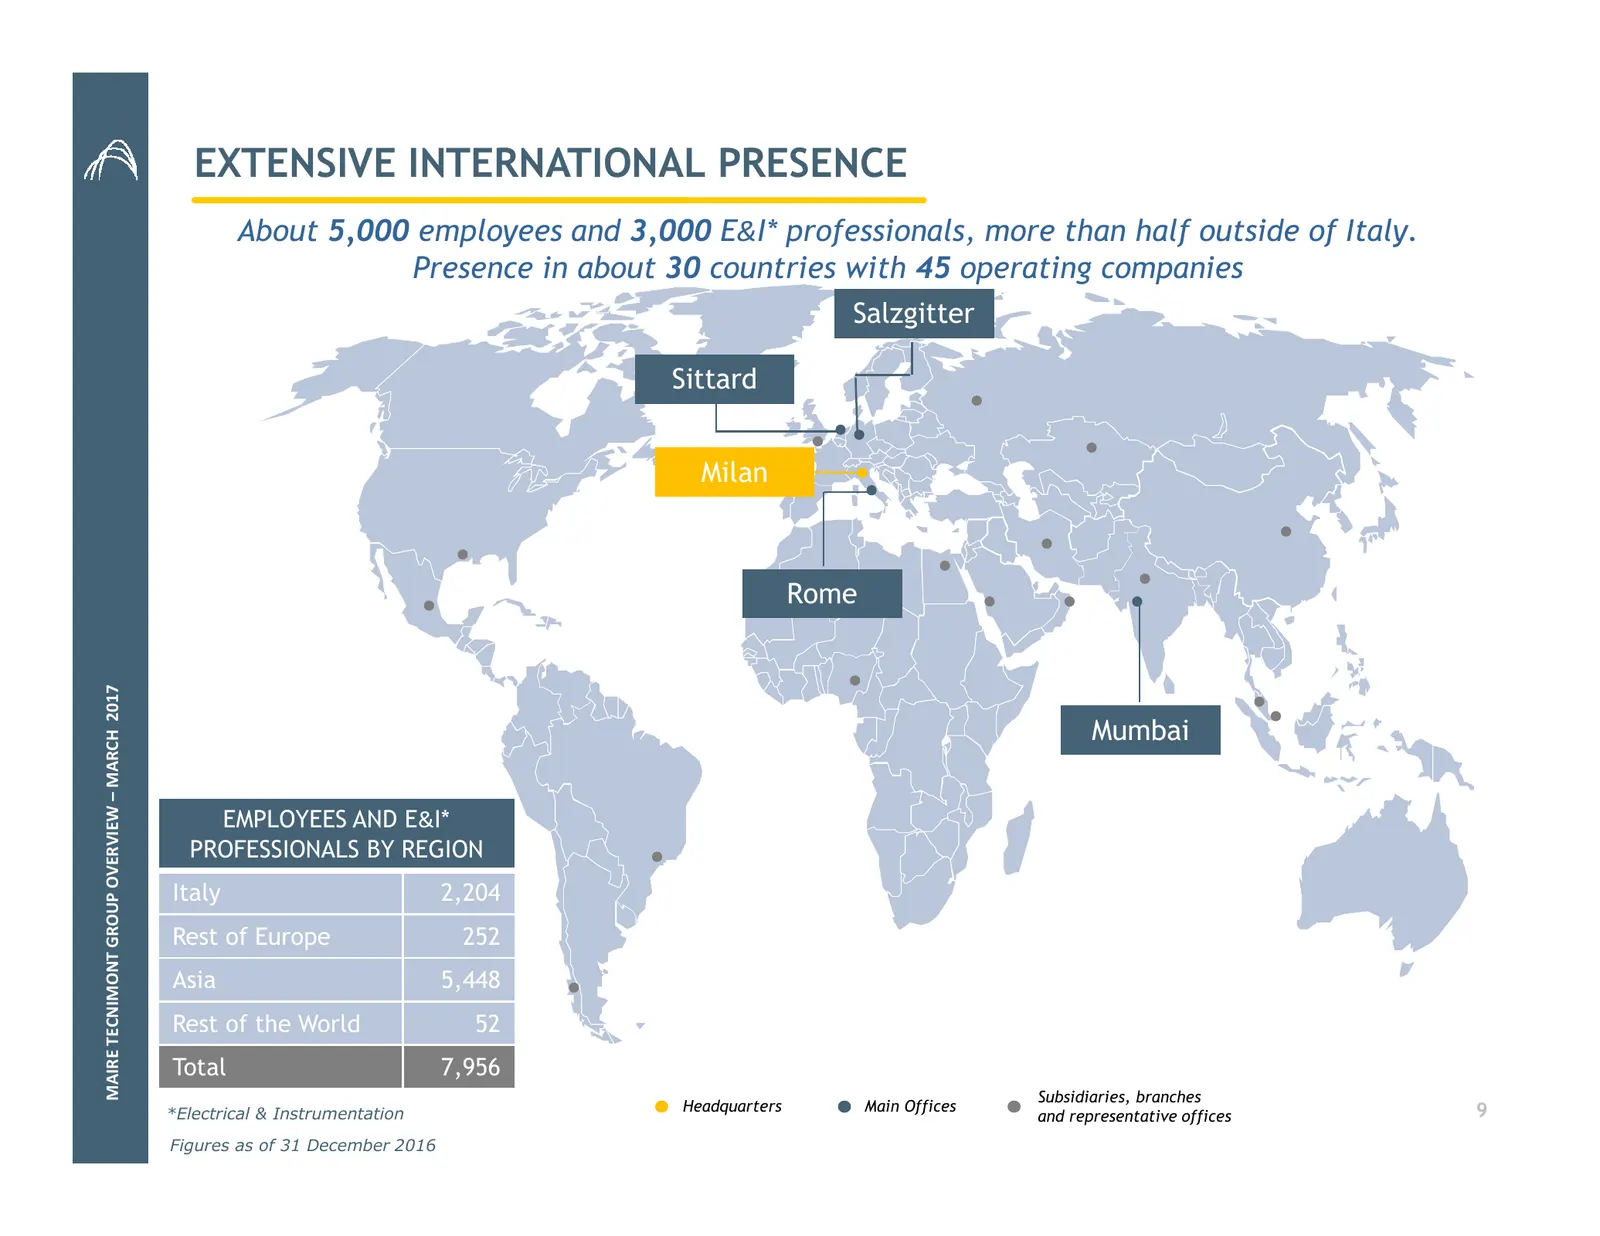
EXTENSIVE INTERNATIONAL PRESENCE About 5,000 employees and 3,000 E&I* professionals, more than half outside of Italy. Presence in about 30 countries with 45 operating companies Salzgitter Sittard Milan Rome MAIRE TECNIMONT GROUP OVERVIEW – MARCH 2017 Mumbai EMPLOYEES AND E&I* PROFESSIONALS BY REGION
Slide 10: Summary
SUMMARY 1. Group Overview 2. Strategy and Competitive Positioning 3. Operations 4. Financial Data 5. Conclusions
Slide 11: Maire Tecnimont's Strategic Priorities
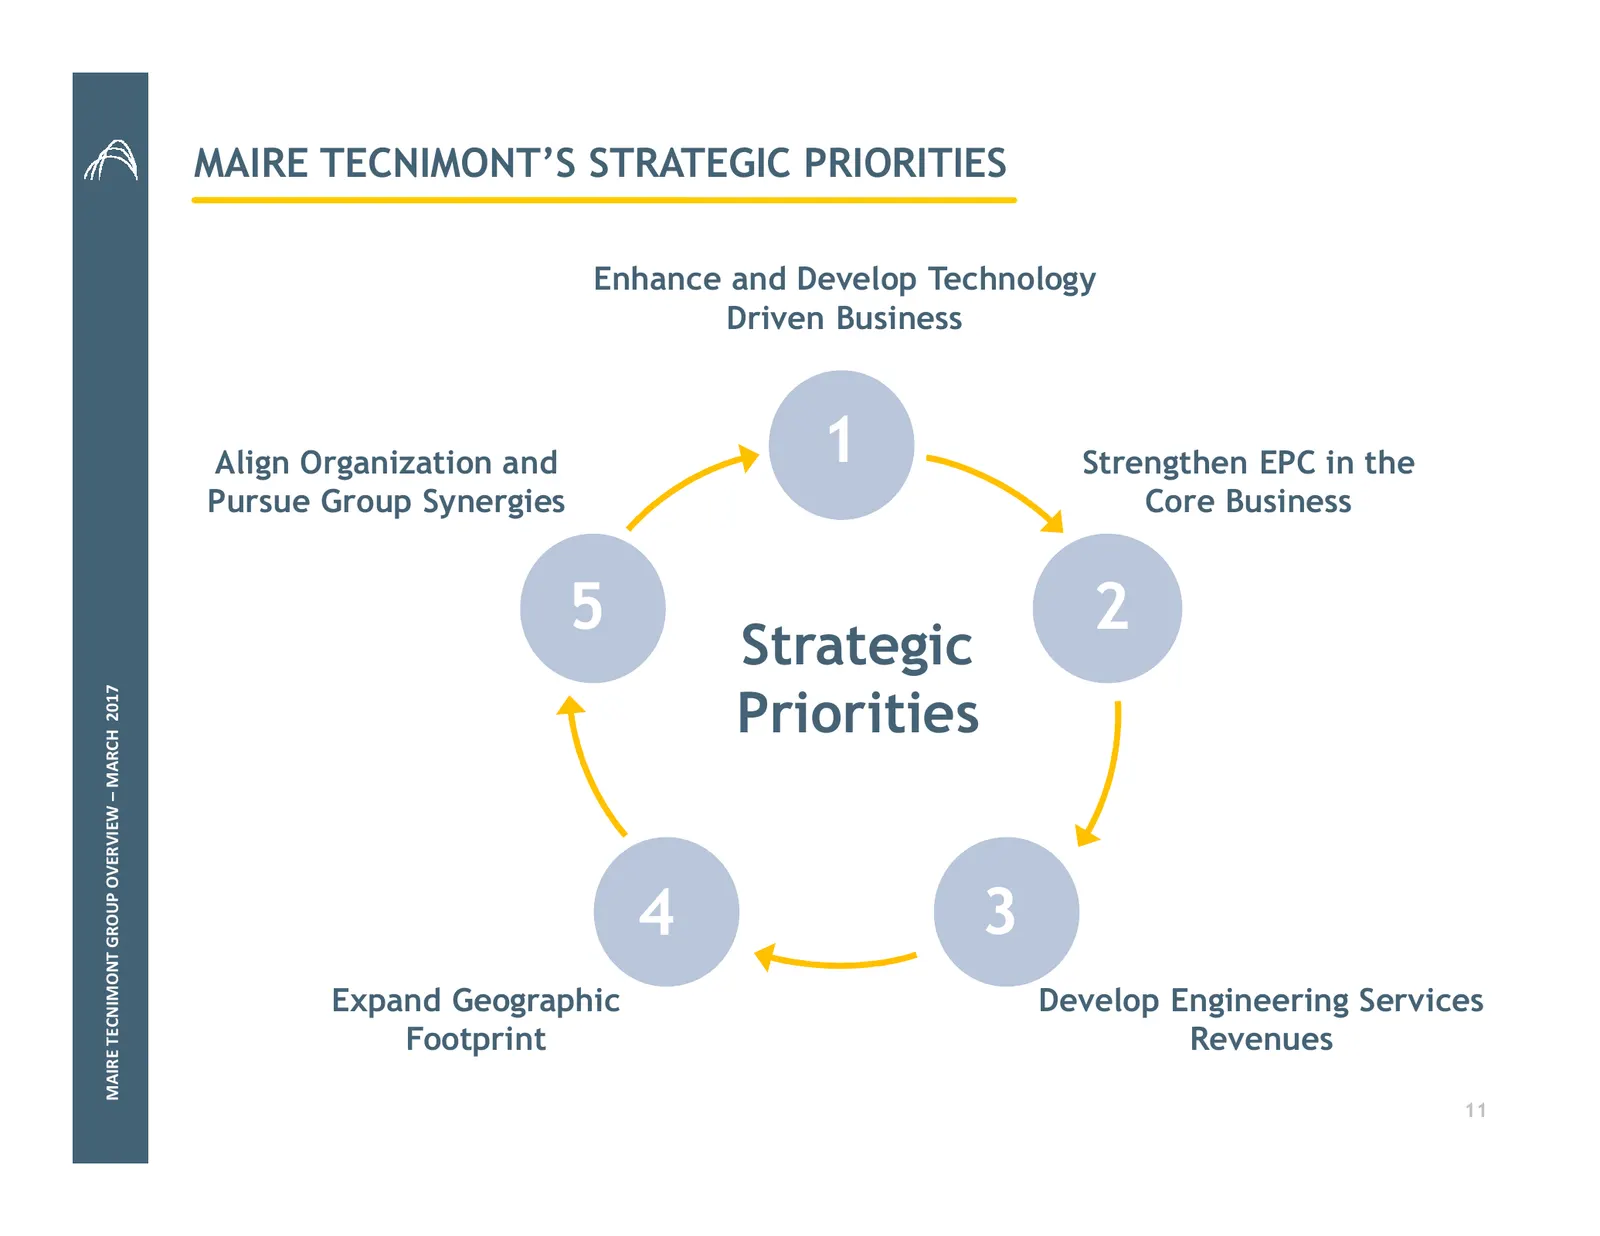
MAIRE TECNIMONT’S STRATEGIC PRIORITIES Enhance and Develop Technology Driven Business Align Organization and 1 Strengthen EPC in the Pursue Group Synergies Core Business 5 2 Strategic MAIRE TECNIMONT GROUP OVERVIEW – MARCH 2017 Priorities 4 3 Expand Geographic Develop Engineering Services Footprint
Slide 12: Strategy Implementation
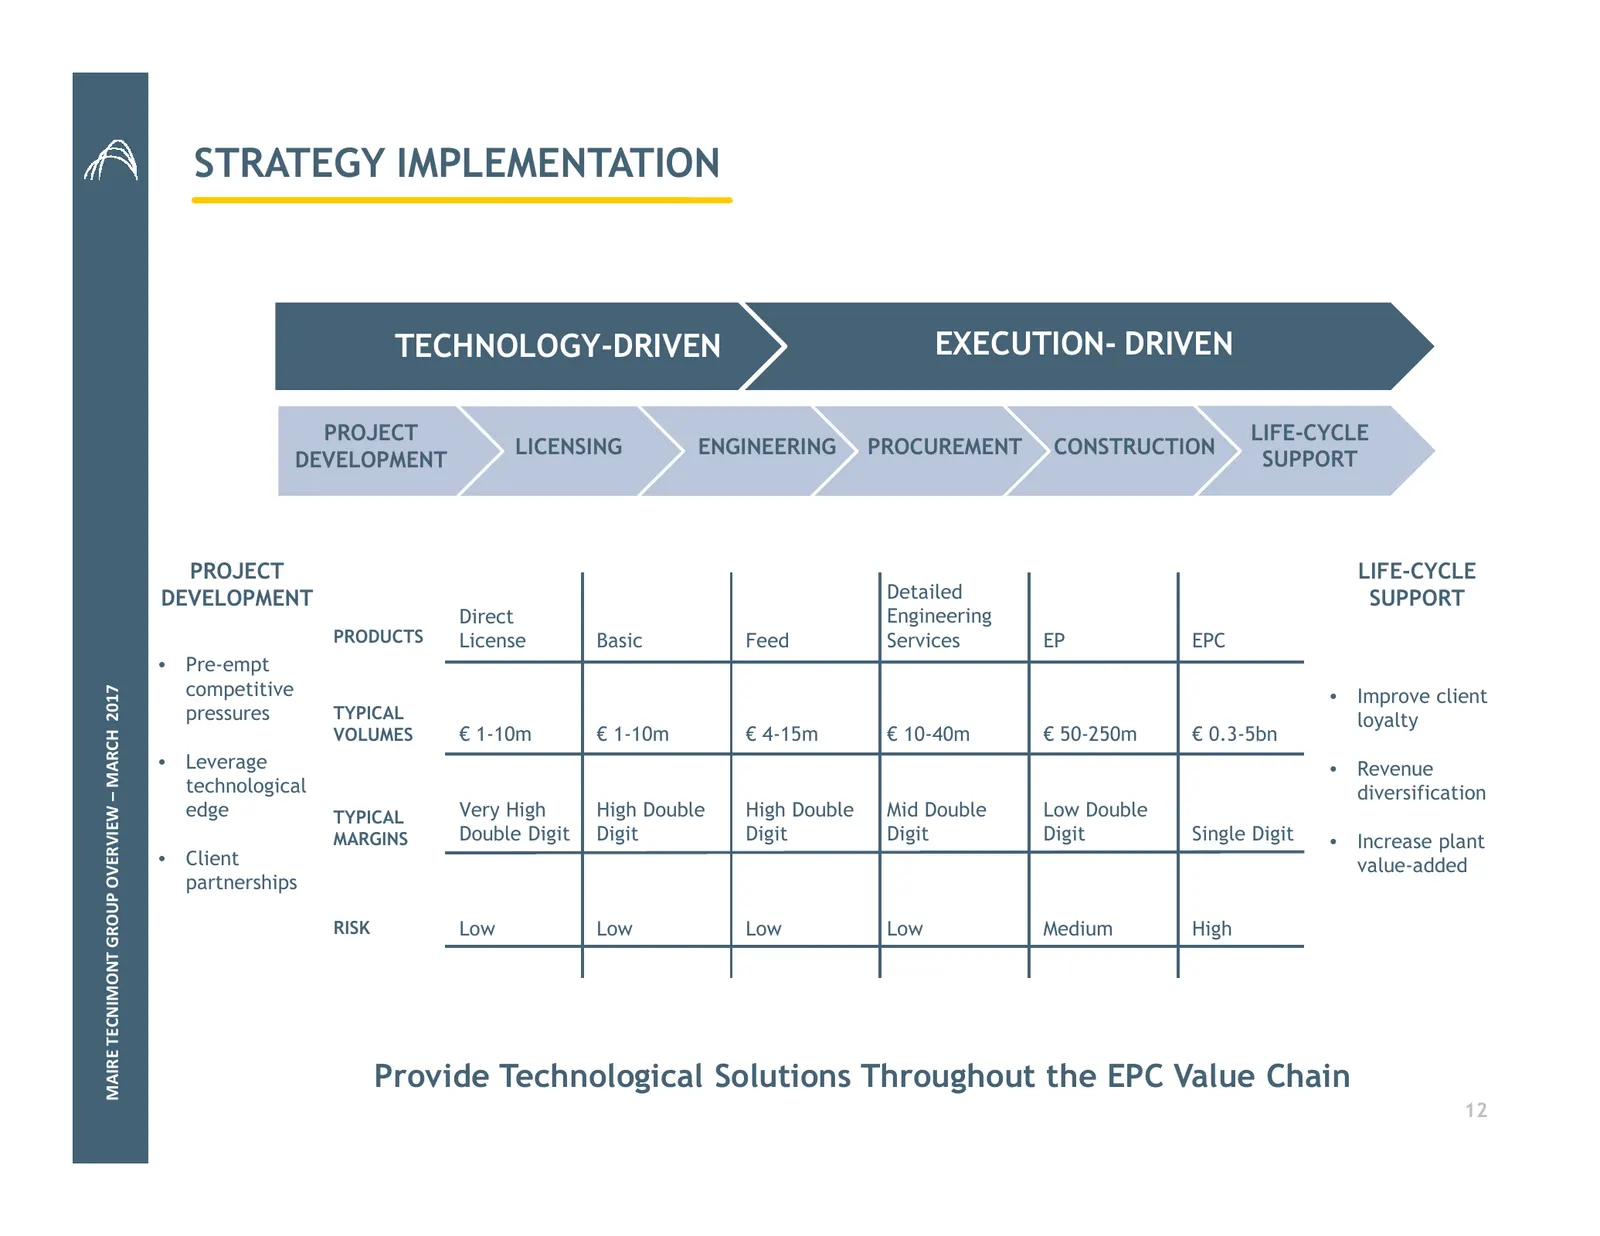
STRATEGY IMPLEMENTATION TECHNOLOGY-DRIVEN EXECUTION- DRIVEN PROJECT LIFE-CYCLE LICENSING ENGINEERING PROCUREMENT CONSTRUCTION DEVELOPMENT SUPPORT PROJECT LIFE-CYCLE DEVELOPMENT Detailed SUPPORT Direct Engineering PRODUCTS License Basic Feed Services EP EPC • Pre-empt competitive MAIRE TECNIMONT GROU
Slide 13: Our Operations Are Driven by Positive Business Trends
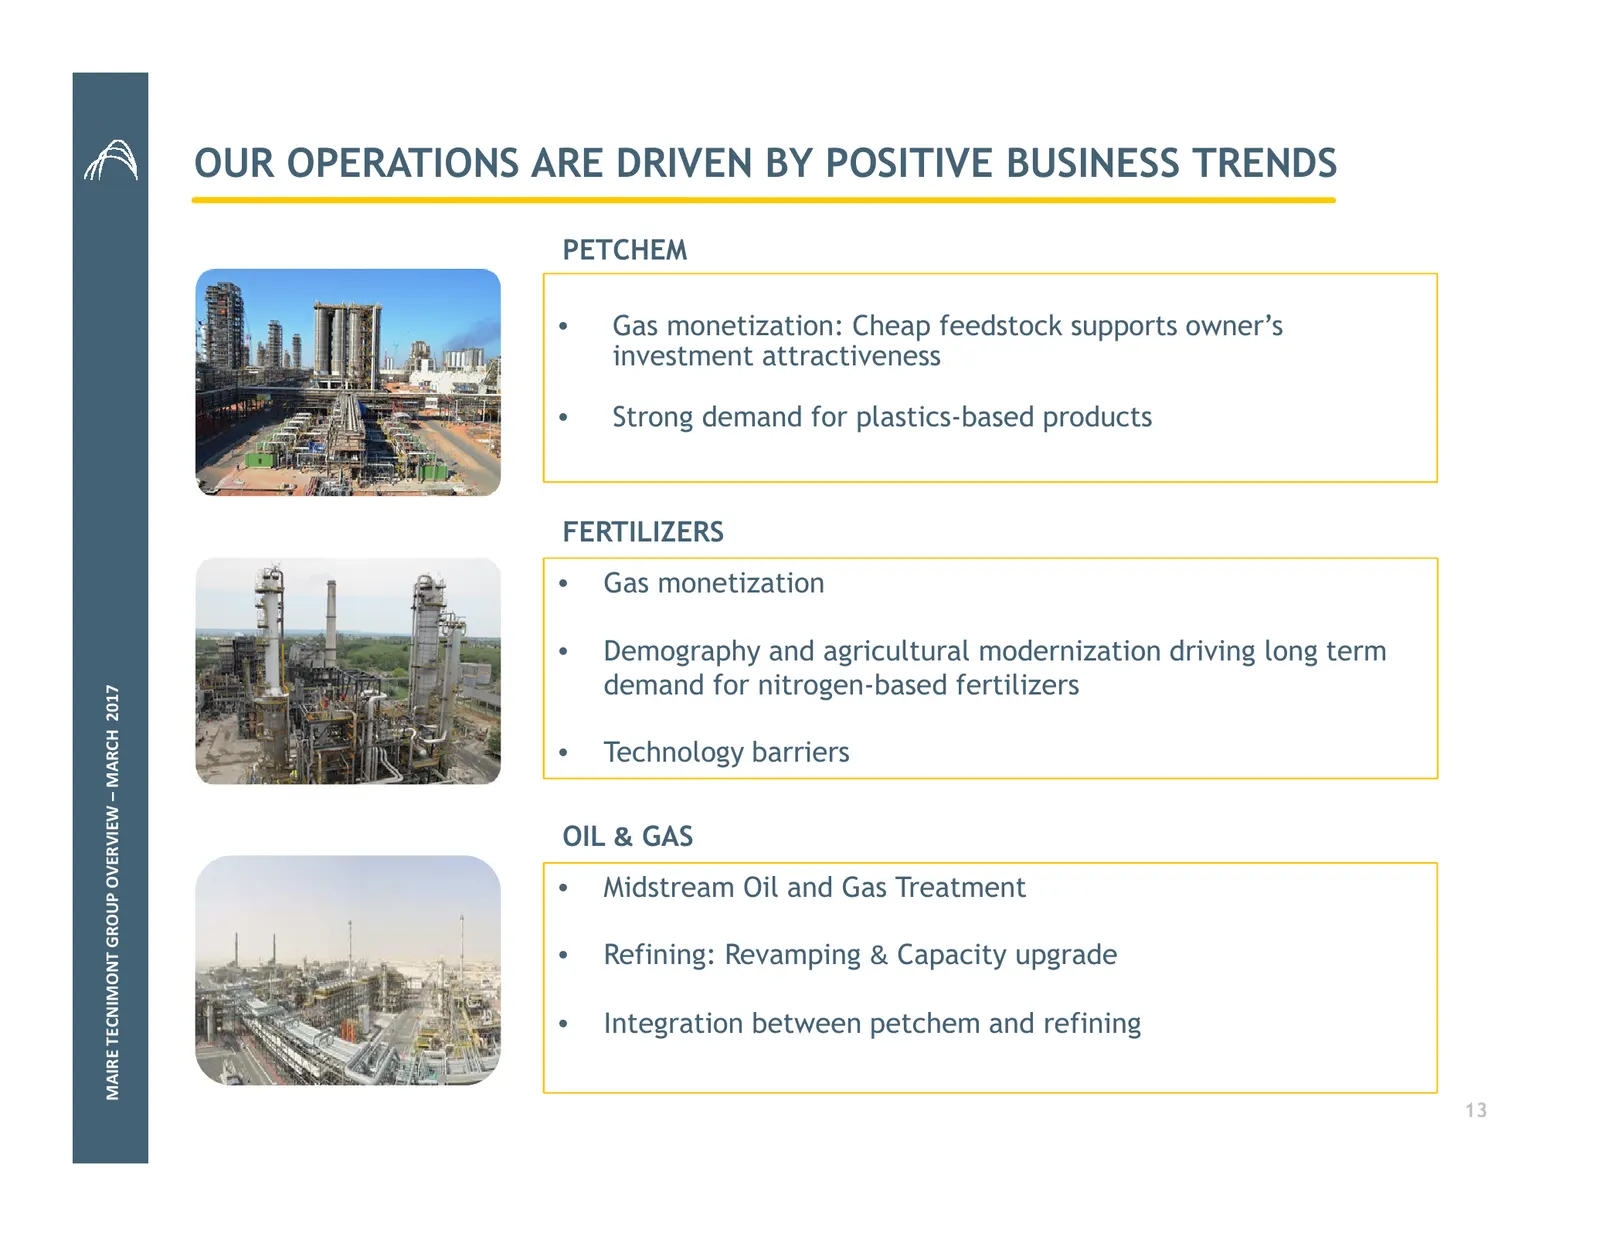
OUR OPERATIONS ARE DRIVEN BY POSITIVE BUSINESS TRENDS PETCHEM • Gas monetization: Cheap feedstock supports owner’s investment attractiveness • Strong demand for plastics-based products FERTILIZERS • Gas monetization • Demography and agricultural modernization driving long term demand for nitrogen-ba
Slide 14: Differentiating Factors vs. Our Competitors
DIFFERENTIATING FACTORS VS. OUR COMPETITORS • Our focus is Downstream and Gas Transformation, not Upstream • Flexible business model • Asset light: no idleness • Leverage on our strong technological IPs MAIRE TECNIMONT GROUP OVERVIEW – MARCH 2017 • Client diversification (NOCs vs. IOCs) • Global app
Slide 15: Maire Tecnimont Has Been Outperforming the Sector
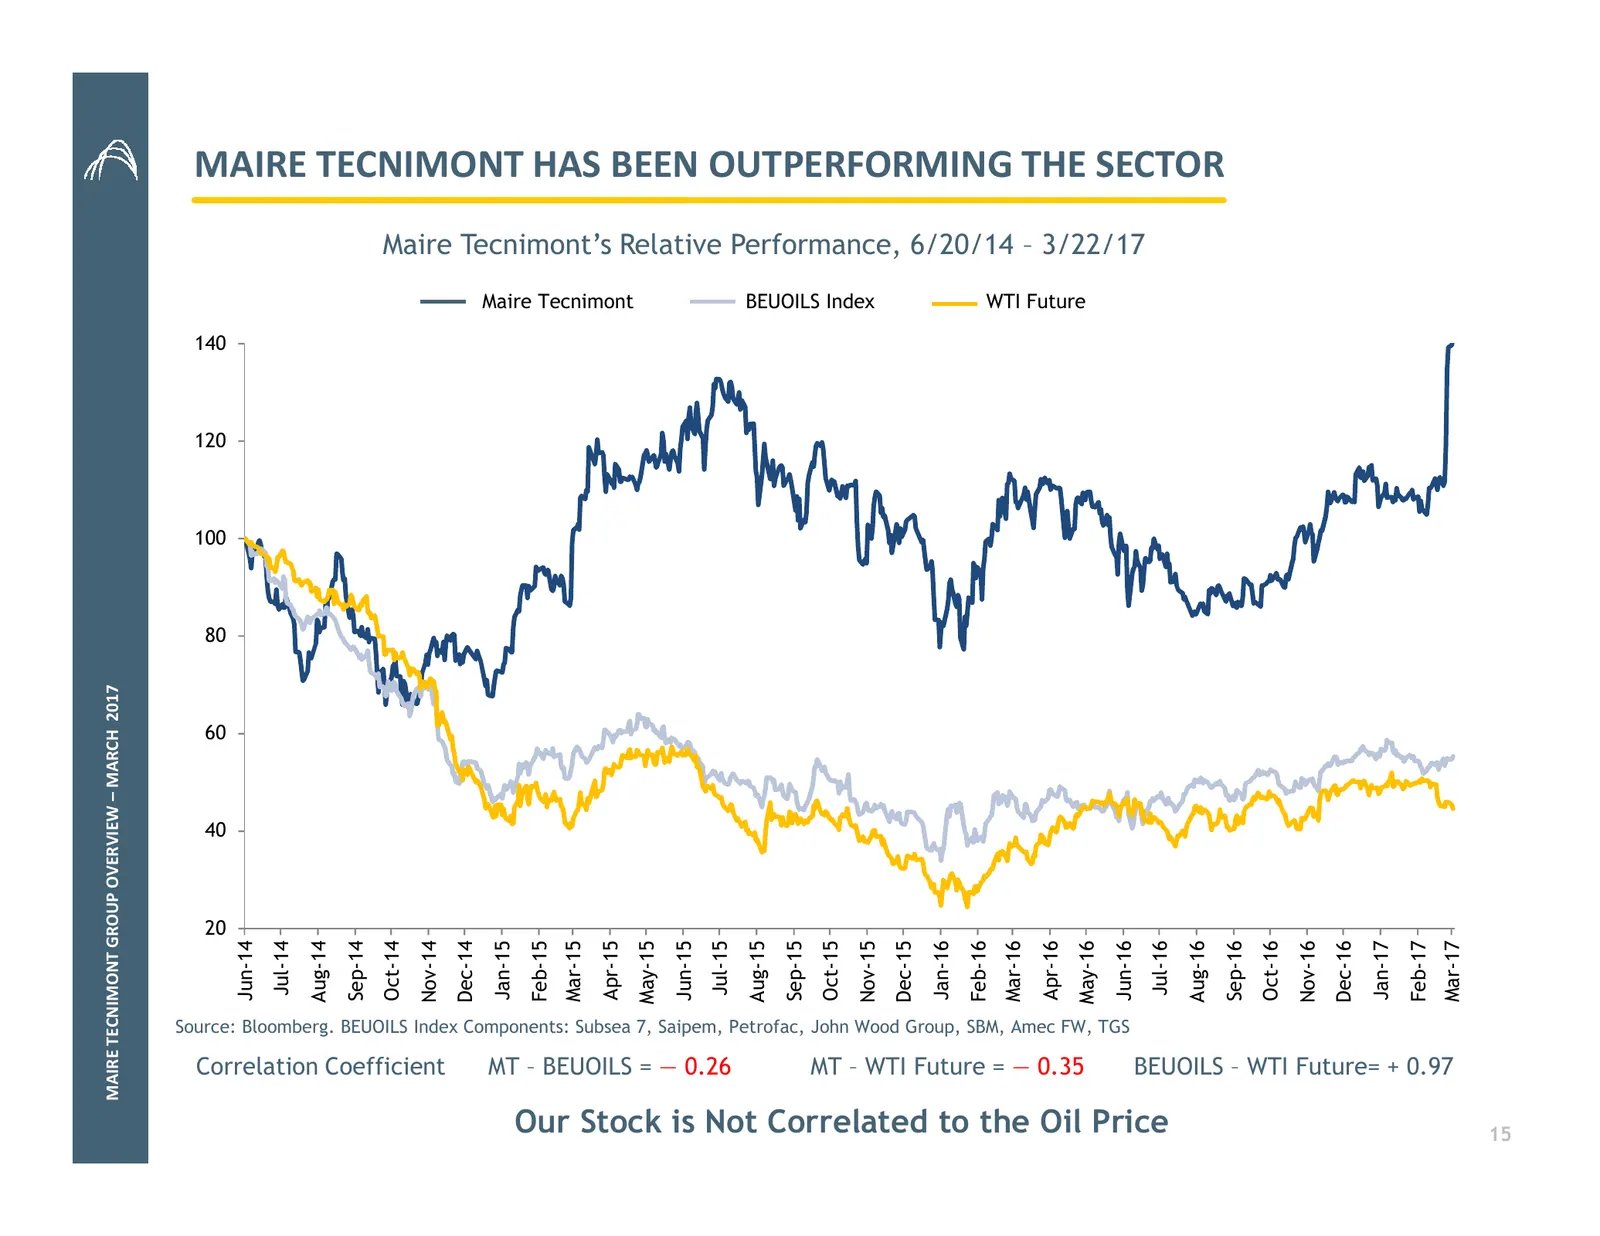
MAIRE TECNIMONT HAS BEEN OUTPERFORMING THE SECTOR Maire Tecnimont’s Relative Performance, 6/20/14 – 3/22/17 Maire Tecnimont BEUOILS Index WTI Future 140 120 100 80 MAIRE TECNIMONT GROUP OVERVIEW – MARCH 2017 60 40 20 Jun-14 Jul-14 Aug-14 Sep-14 Oct-14 Nov-14 Dec-14 Jan-15 Feb-15 Mar-15 Apr-15 May-15
Slide 16: Group's Responsiveness to Current Market Discontinuity
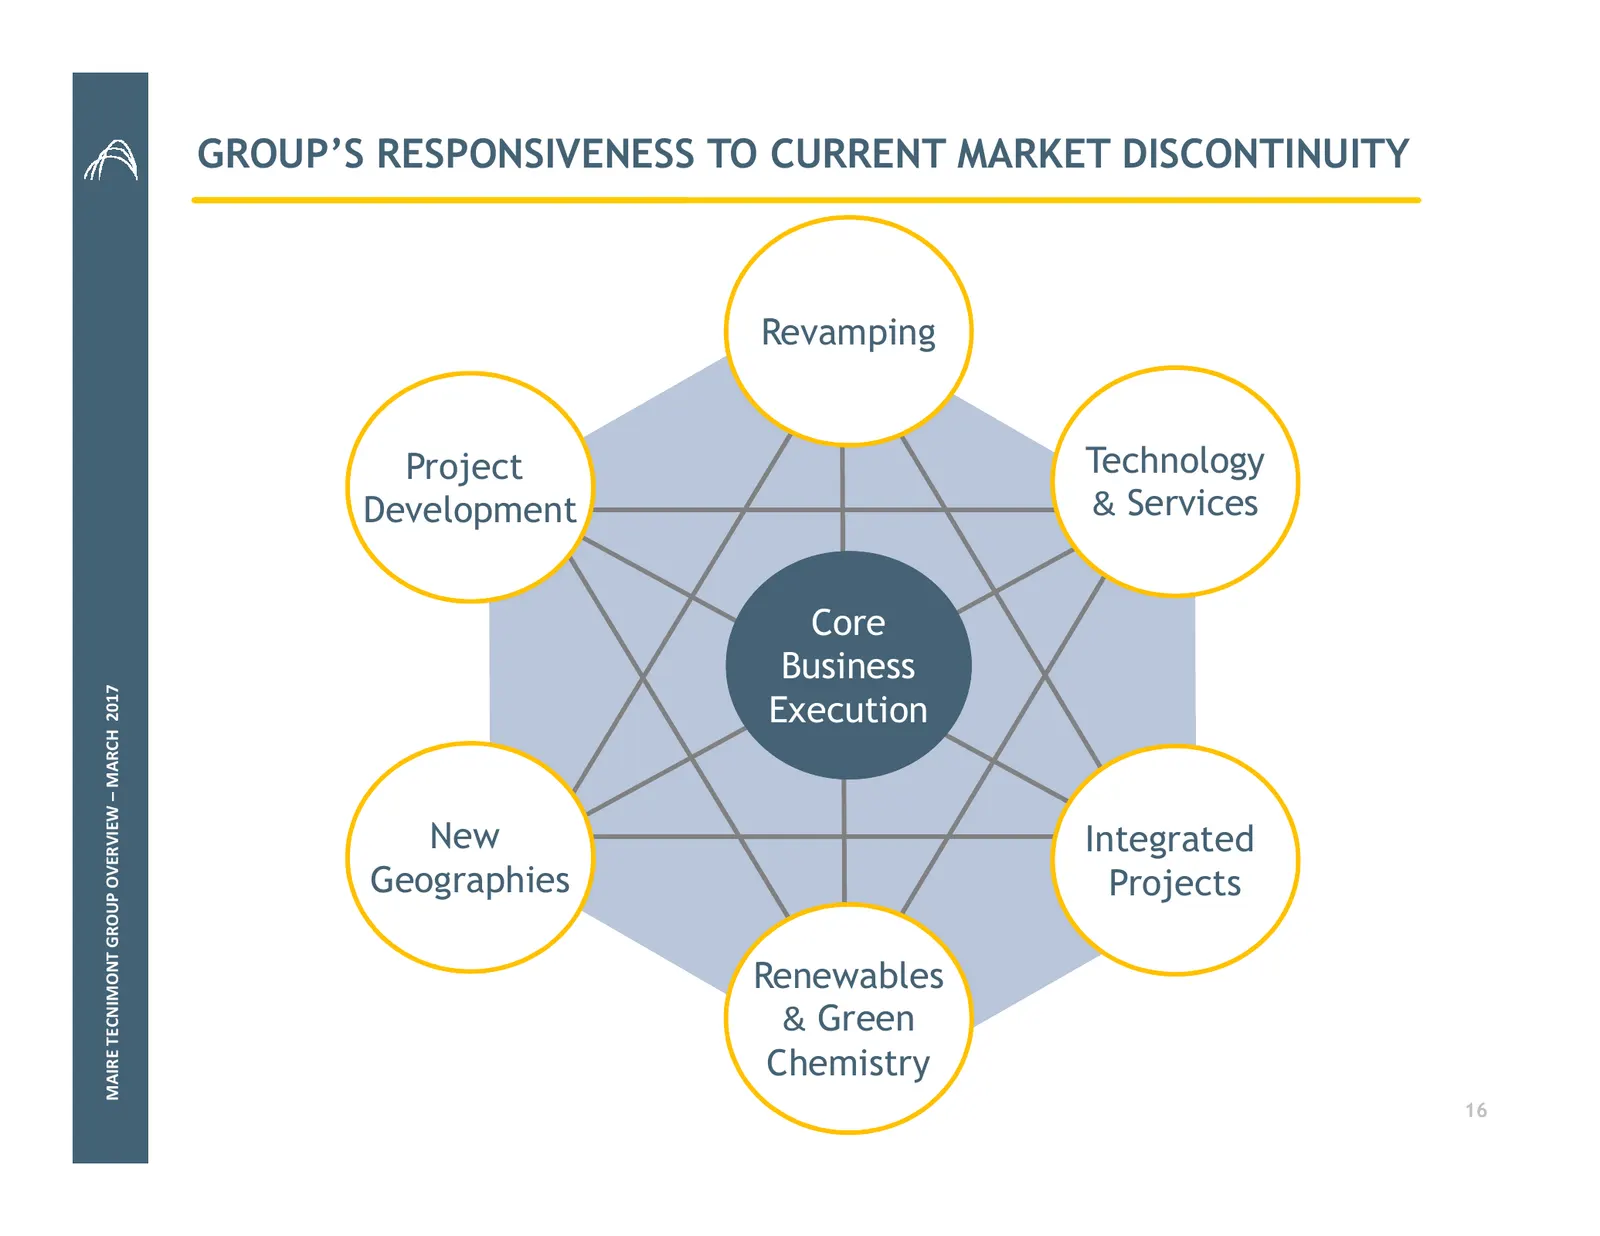
GROUP’S RESPONSIVENESS TO CURRENT MARKET DISCONTINUITY Revamping Project Technology Development & Services Core Business MAIRE TECNIMONT GROUP OVERVIEW – MARCH 2017 Execution New Integrated Geographies Projects Renewables & Green Chemistry 16
Slide 17: Summary
SUMMARY 1. Group Overview 2. Strategy and Competitive Positioning 3. Operations 4. Financial Data 5. Conclusions
Slide 18: Main Projects Under Execution
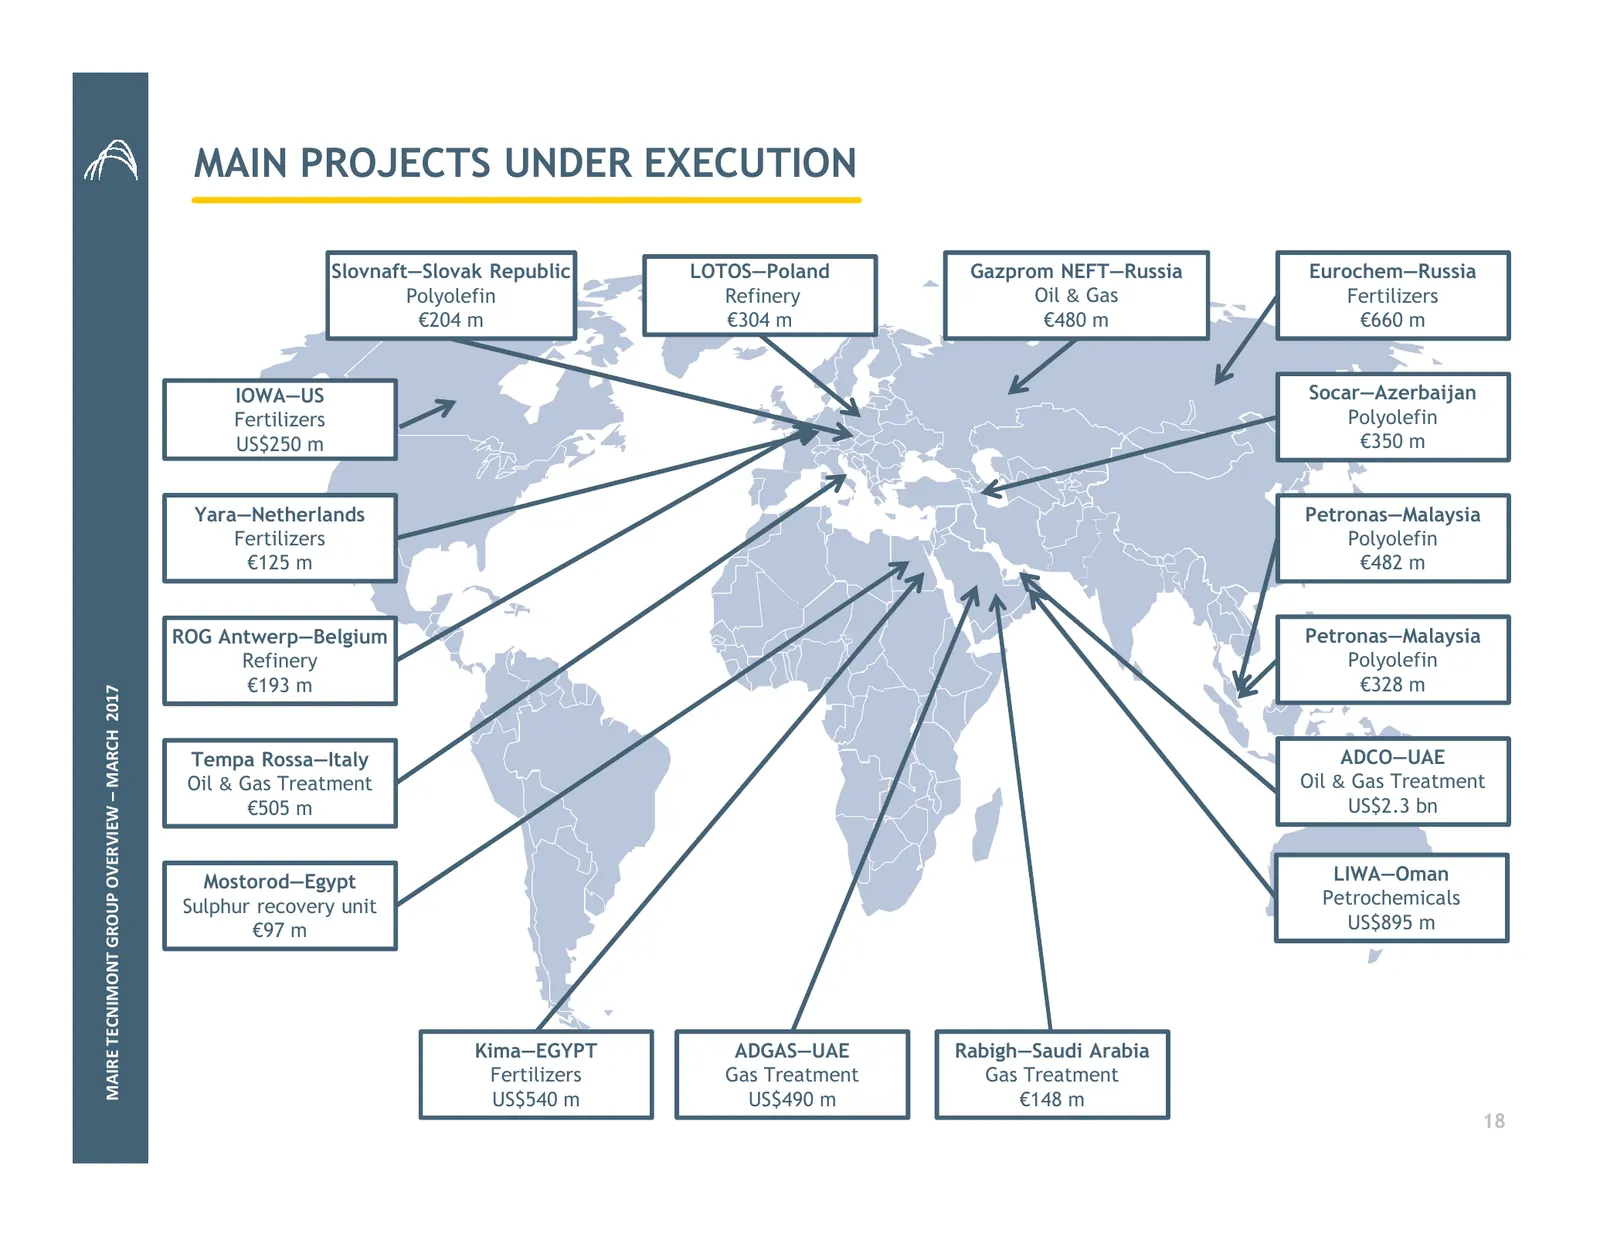
MAIN PROJECTS UNDER EXECUTION Slovnaft—Slovak Republic LOTOS—Poland Gazprom NEFT—Russia Eurochem—Russia Polyolefin Refinery Oil & Gas Fertilizers €204 m €304 m €480 m €660 m IOWA—US Socar—Azerbaijan Fertilizers Polyolefin US$250 m €350 m Yara—Netherlands Petronas—Malaysia Fertilizers Polyolefin €125
Slide 19: Main Completed Projects
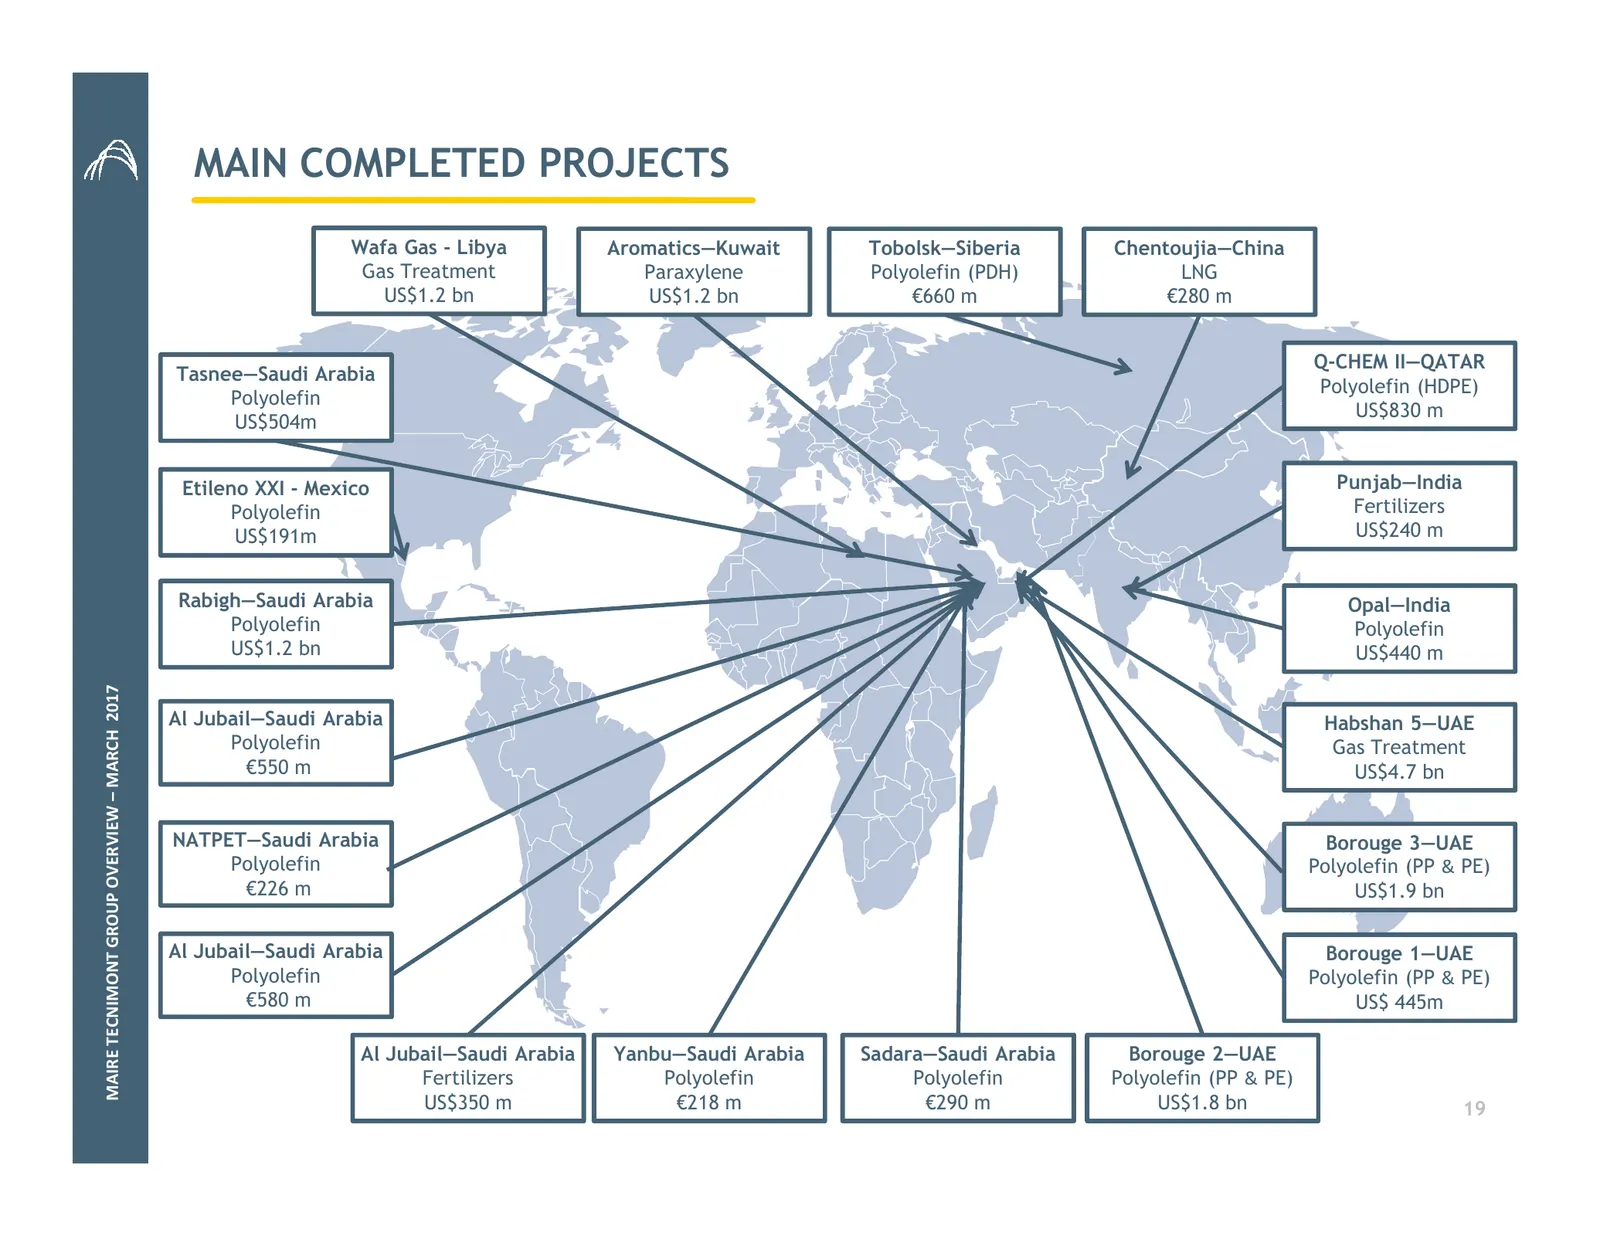
MAIN COMPLETED PROJECTS Wafa Gas - Libya Aromatics—Kuwait Tobolsk—Siberia Chentoujia—China Gas Treatment Paraxylene Polyolefin (PDH) LNG US$1.2 bn US$1.2 bn €660 m €280 m Q-CHEM II—QATAR Tasnee—Saudi Arabia Polyolefin (HDPE) Polyolefin US$830 m US$504m Etileno XXI - Mexico Punjab—India Polyolefin Fe
Slide 20: Flagship Projects
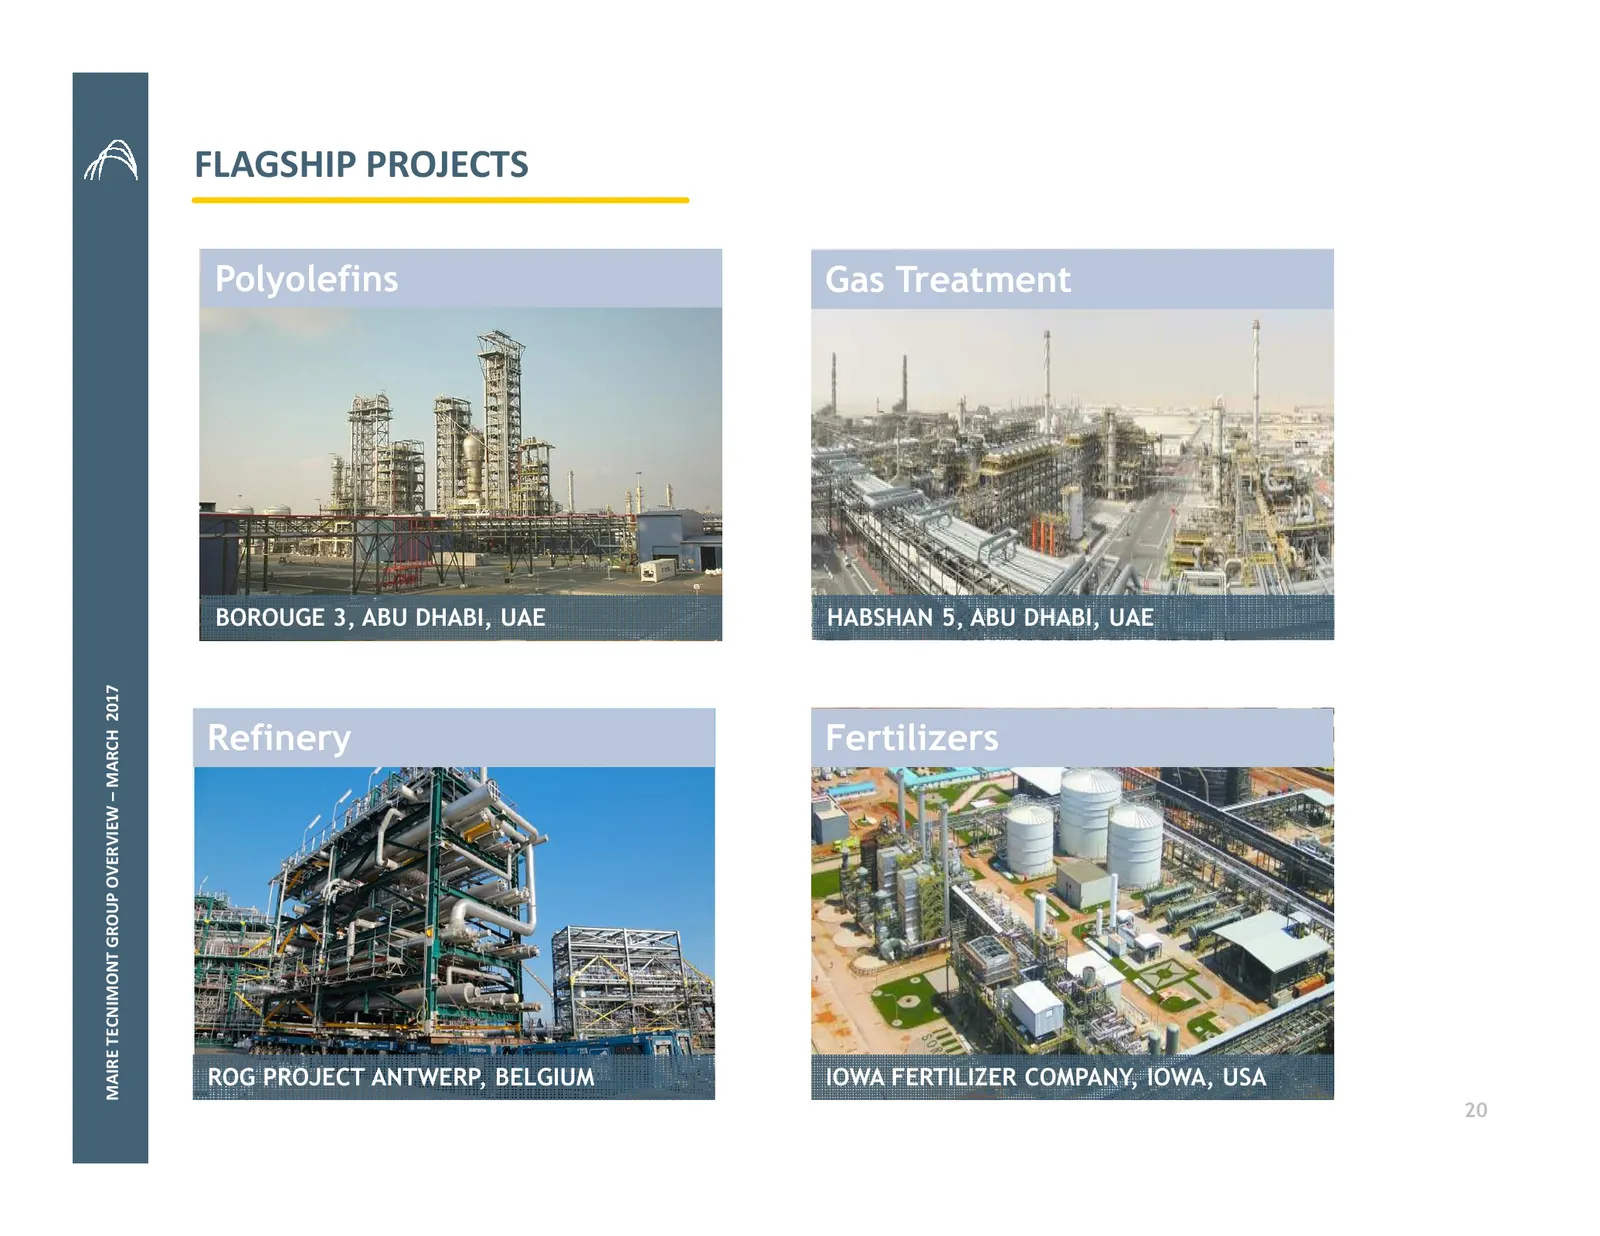
FLAGSHIP PROJECTS Polyolefins Gas Treatment BOROUGE 3, ABU DHABI, UAE HABSHAN 5, ABU DHABI, UAE MAIRE TECNIMONT GROUP OVERVIEW – MARCH 2017 Refinery Fertilizers ROG PROJECT ANTWERP, BELGIUM IOWA FERTILIZER COMPANY, IOWA, USA 20
Slide 21: 2016 Order Intake
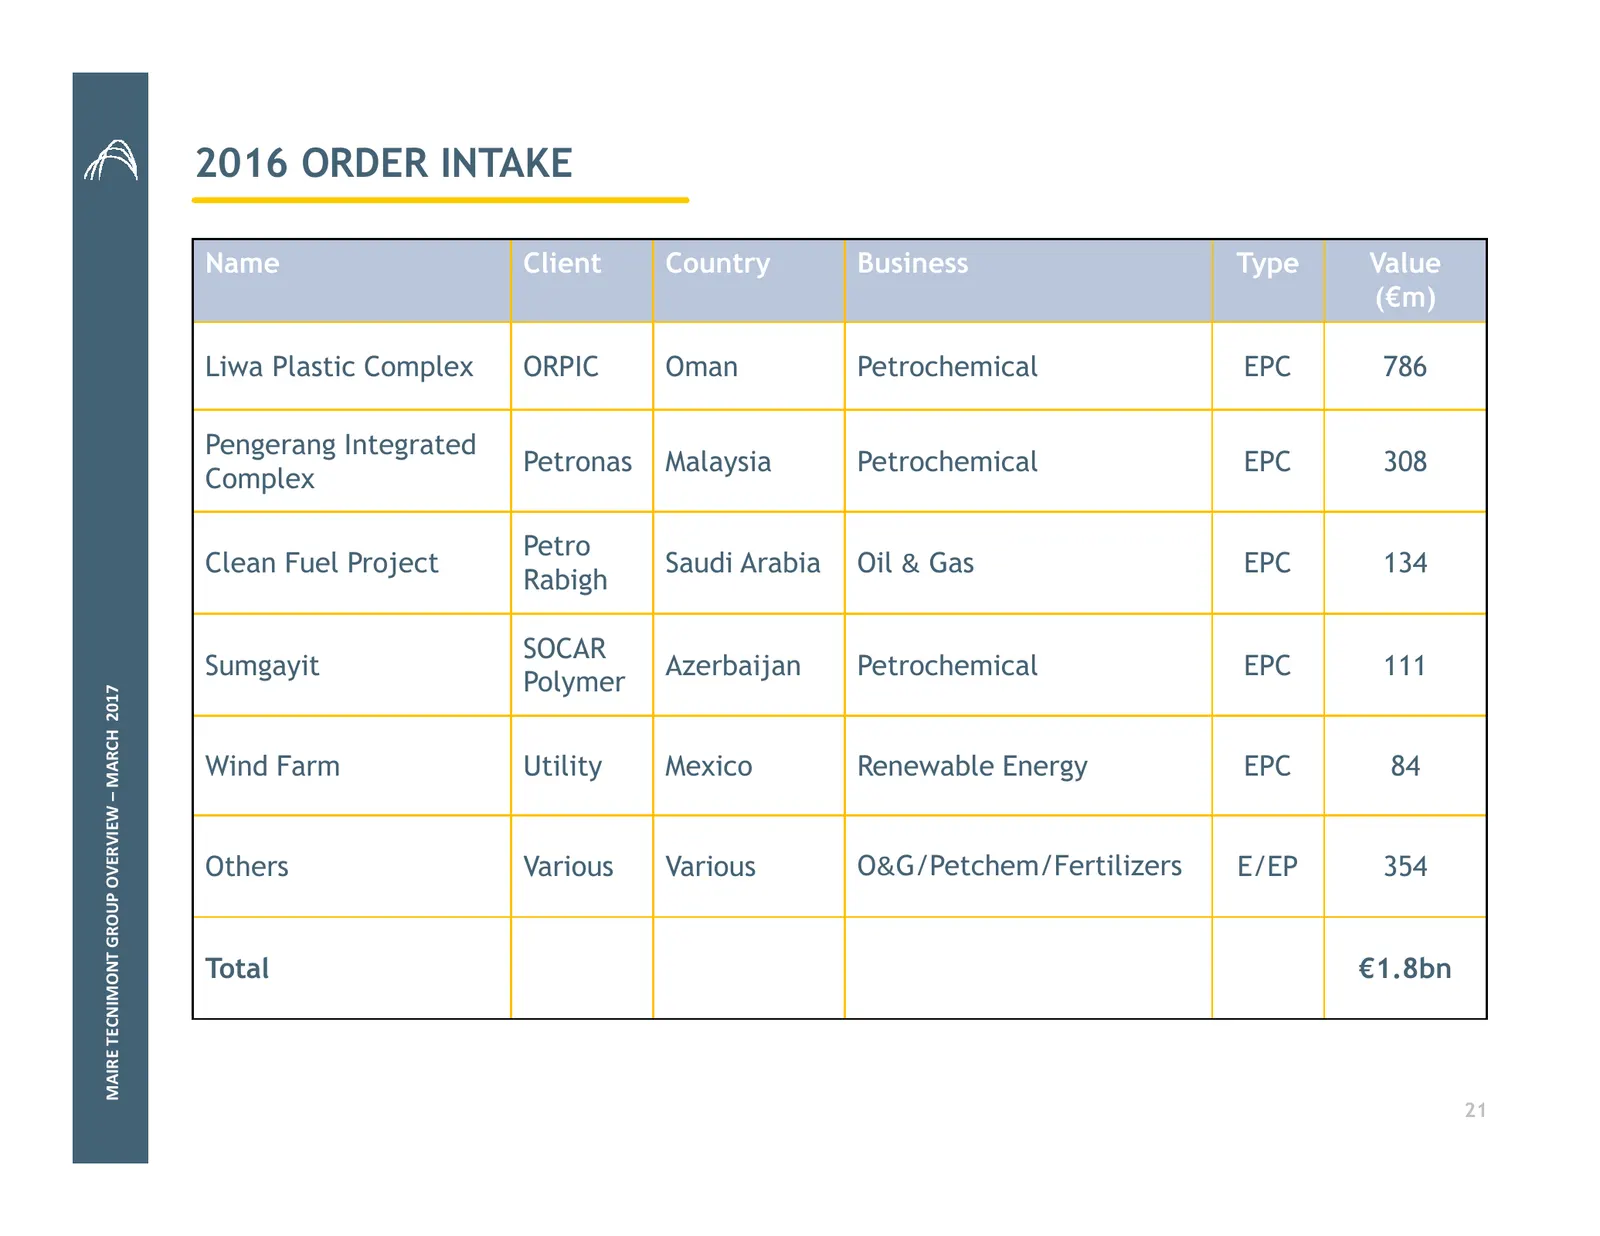
2016 ORDER INTAKE Name Client Country Business Type Value (€m) Liwa Plastic Complex ORPIC Oman Petrochemical EPC 786 Pengerang Integrated Petronas Malaysia Petrochemical EPC 308 Complex Petro Clean Fuel Project Saudi Arabia Oil & Gas EPC 134 Rabigh SOCAR Sumgayit Azerbaijan Petrochemical EPC 111 Pol
Slide 22: Backlog
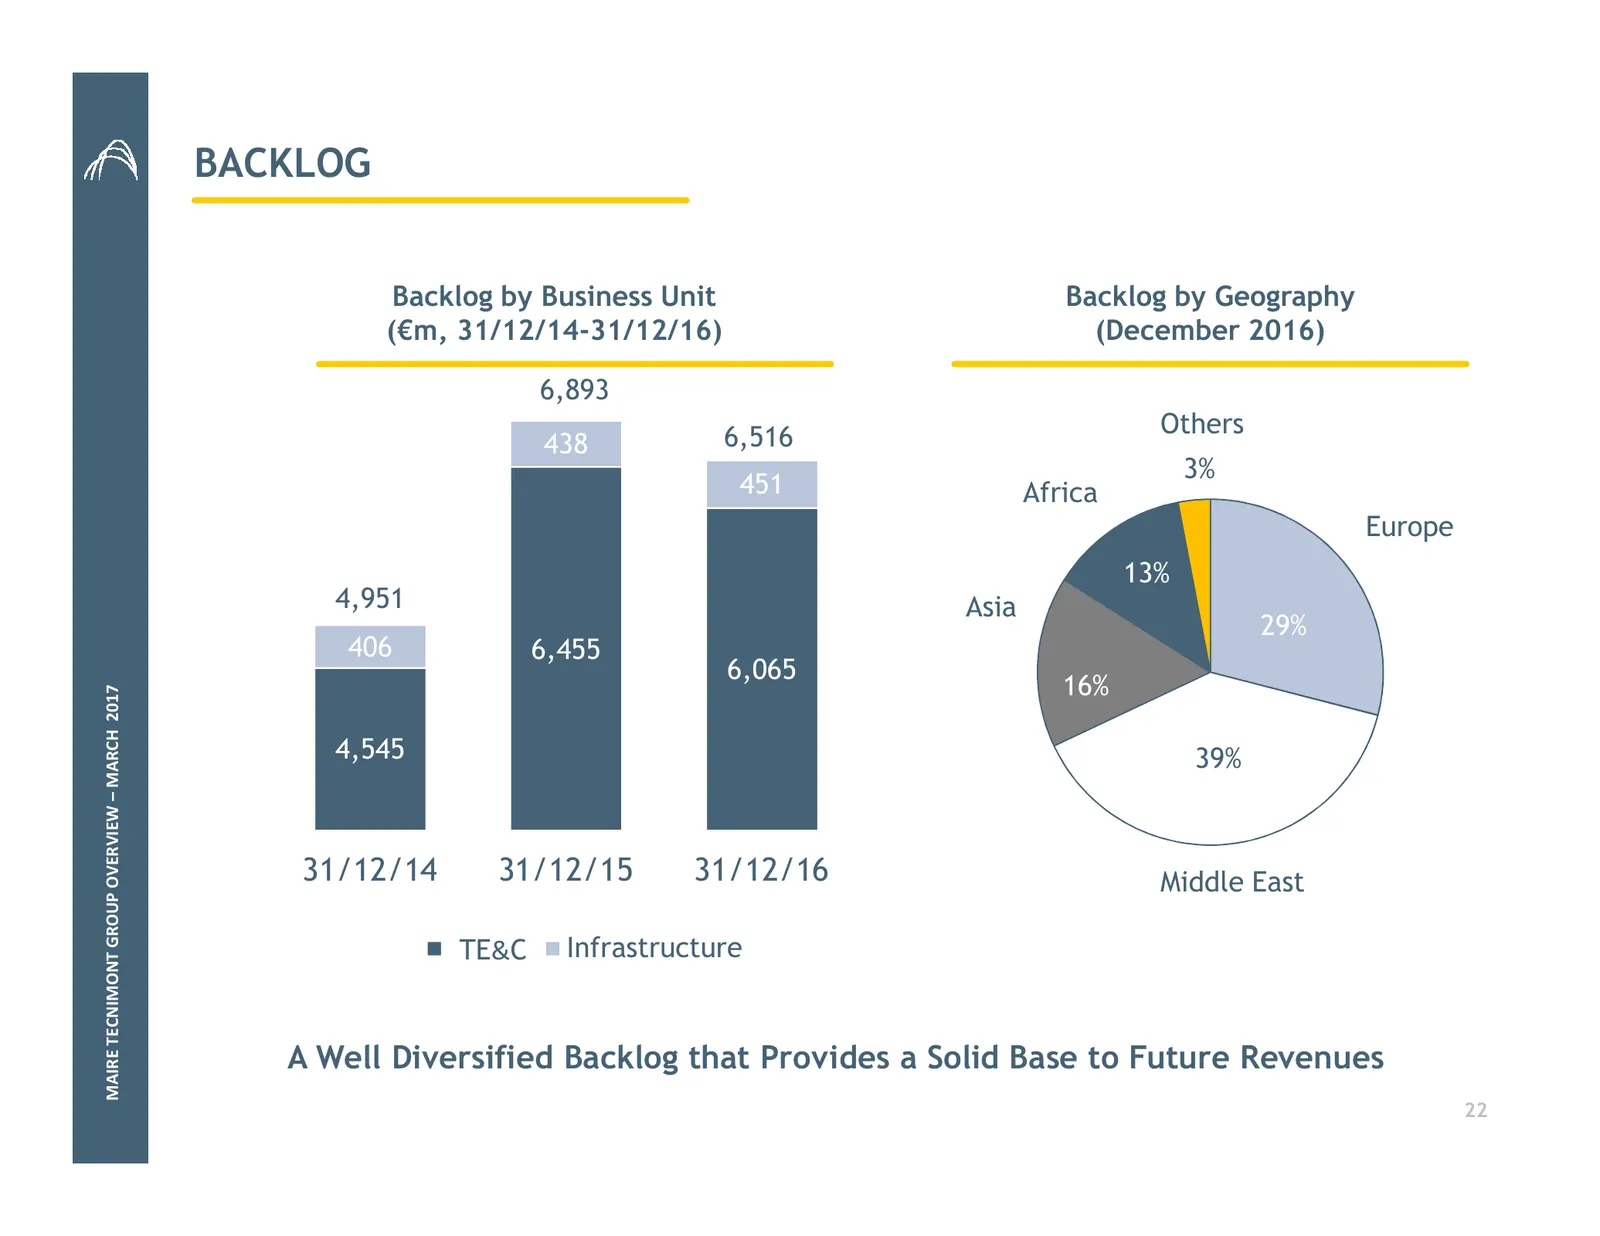
BACKLOG Backlog by Business Unit Backlog by Geography (€m, 31/12/14-31/12/16) (December 2016) 6,893 6,516 Others 438 3% 451 Africa Europe 13% 4,951 Asia 29% 406 6,455 6,065 16% MAIRE TECNIMONT GROUP OVERVIEW – MARCH 2017 4,545 39% 31/12/14 31/12/15 31/12/16 Middle East TE&C TE&C Infrastructure A Wel
Slide 23: Backlog Analysis – TE&C Business Unit
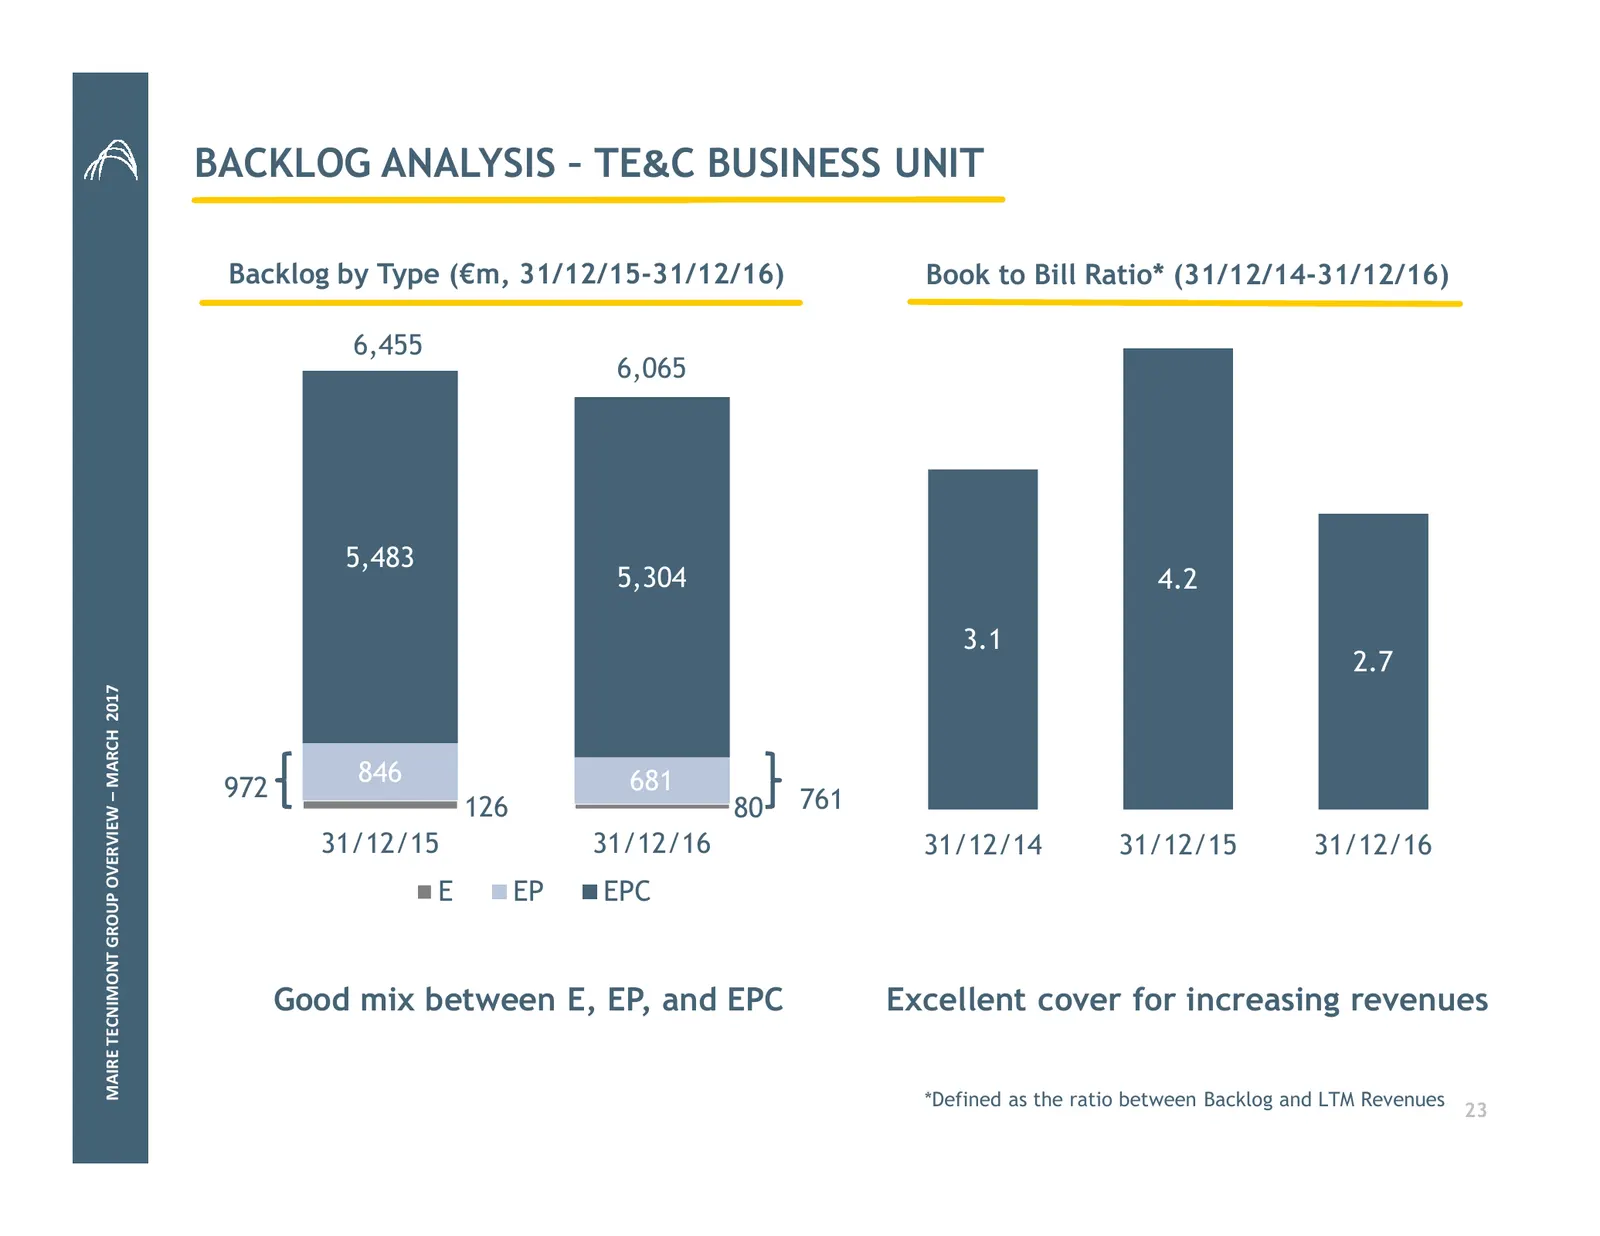
BACKLOG ANALYSIS – TE&C BUSINESS UNIT Backlog by Type (€m, 31/12/15-31/12/16) Book to Bill Ratio* (31/12/14-31/12/16) 6,455 6,065 5,483 5,304 4.2 3.1 2.7 MAIRE TECNIMONT GROUP OVERVIEW – MARCH 2017 846 681 972 761 126 80 31/12/15 31/12/16 31/12/14 31/12/15 31/12/16 E EP EPC Good mix between E, EP, a
Slide 24: Outlook on Commercial Activity (TE&C)
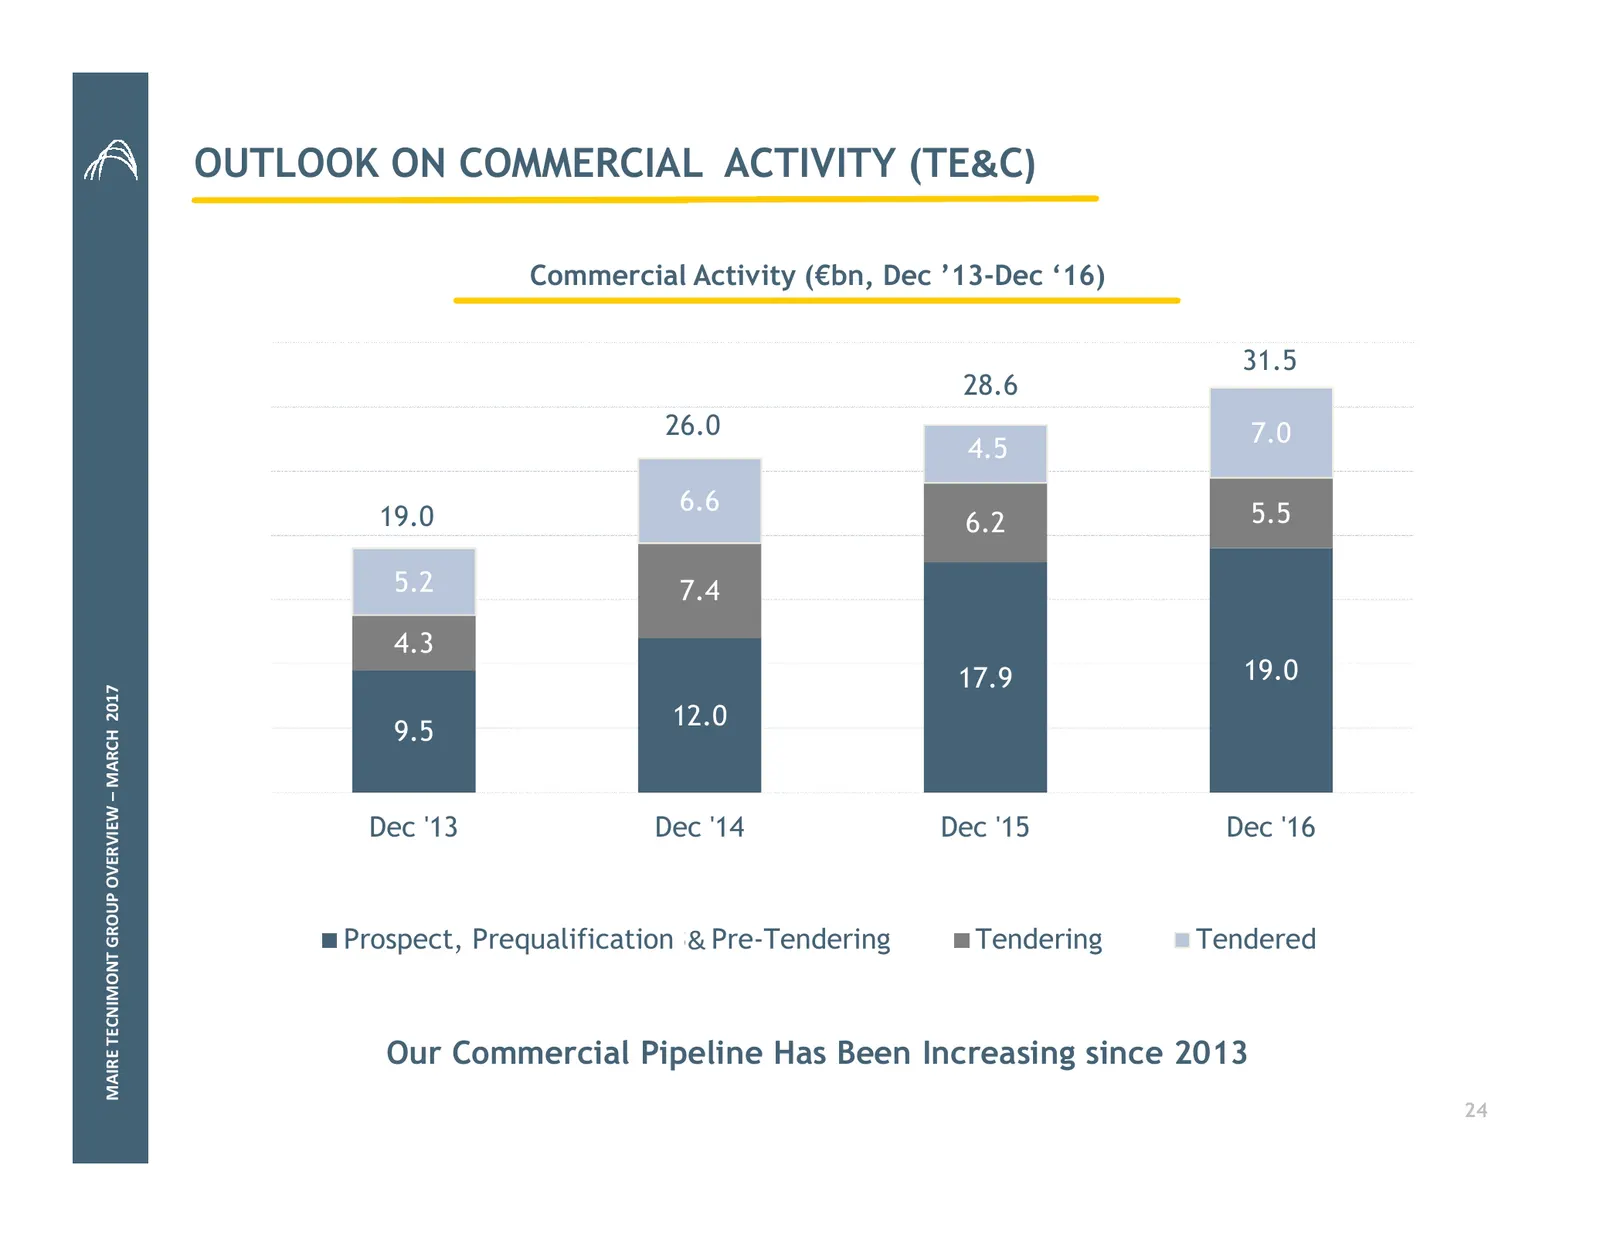
OUTLOOK ON COMMERCIAL ACTIVITY (TE&C) Commercial Activity (€bn, Dec ’13-Dec ‘16) 31.5 28.6 26.0 7.0 4.5 6.6 5.5 19.0 6.2 5.2 7.4 4.3 17.9 19.0 MAIRE TECNIMONT GROUP OVERVIEW – MARCH 2017 12.0 9.5 Dec '13 Dec '14 Dec '15 Dec '16 Prospect, Prequalification & & Pre-Tendering Tendering Tendered Our Comm
Slide 25: Commercial Activity's Geographical Breakdown (TE&C)
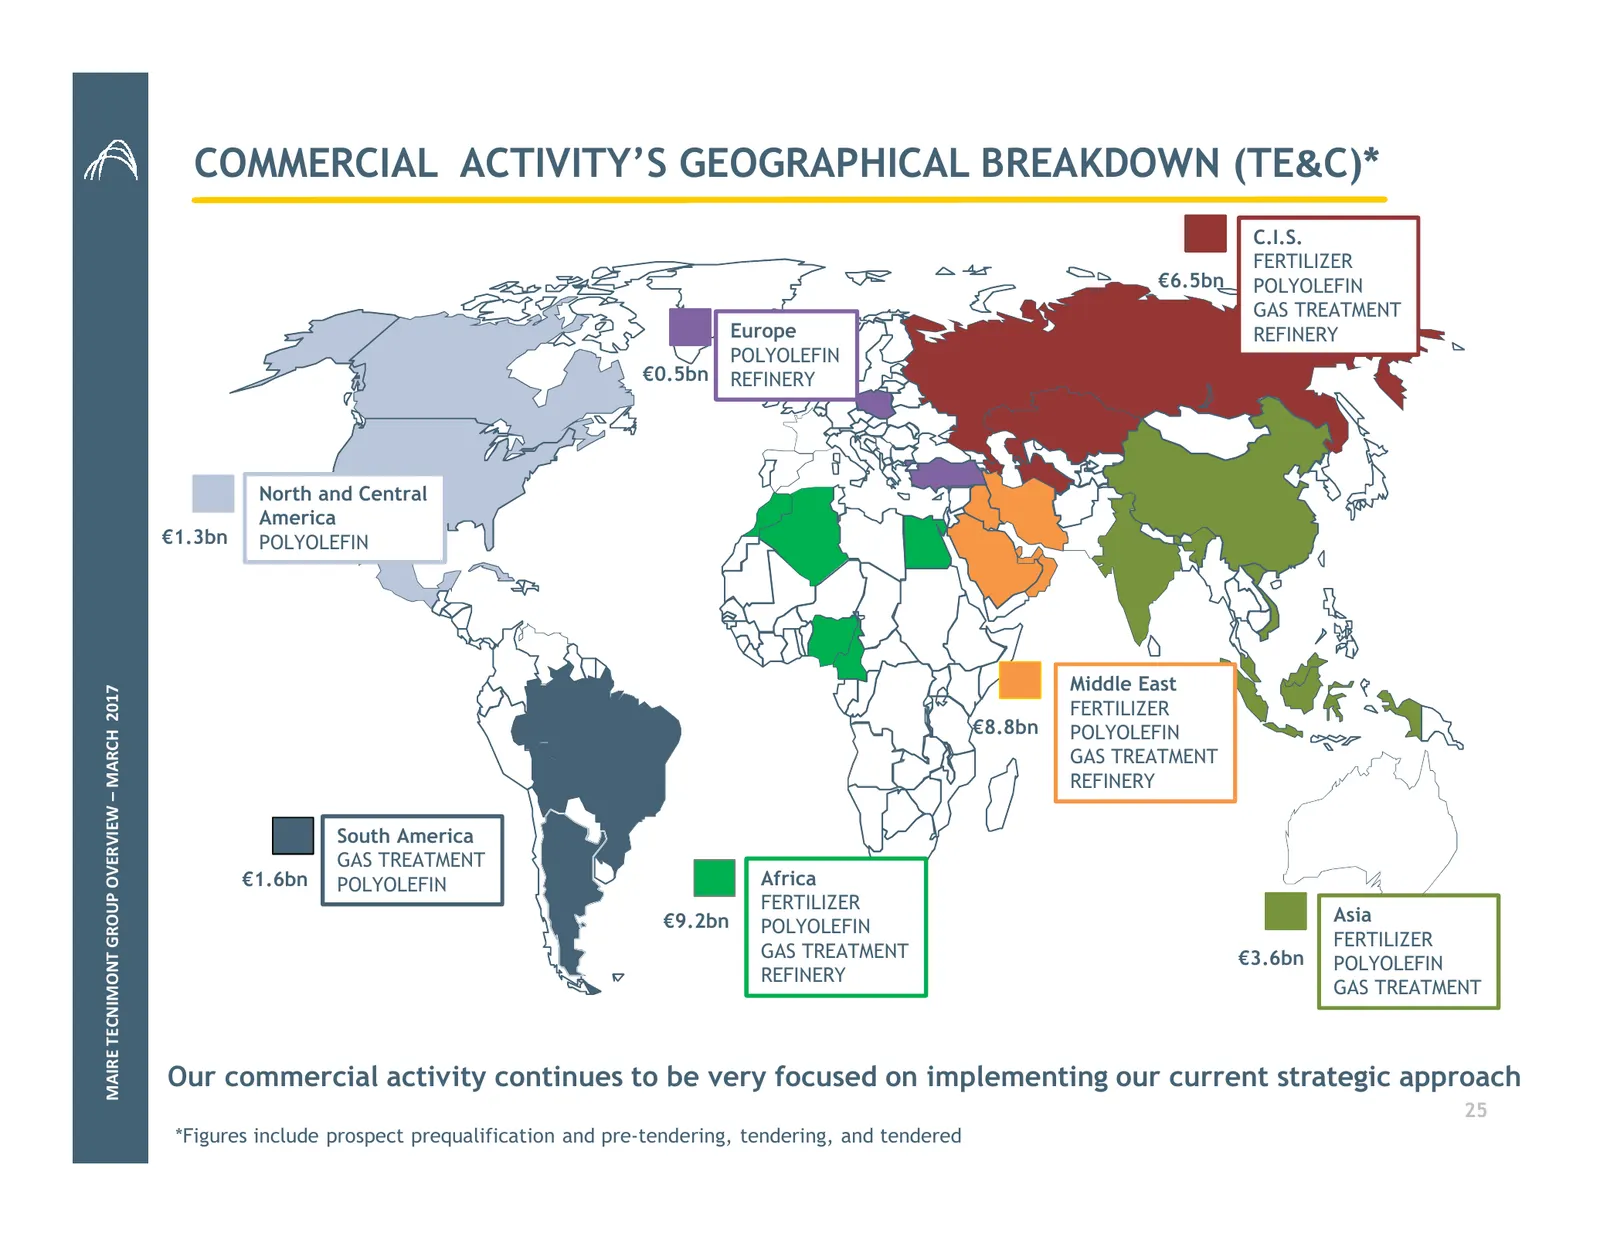
COMMERCIAL ACTIVITY’S GEOGRAPHICAL BREAKDOWN (TE&C)* C.I.S. FERTILIZER €6.5bn POLYOLEFIN GAS TREATMENT Europe REFINERY POLYOLEFIN €0.5bn REFINERY North and Central America €1.3bn POLYOLEFIN Middle East MAIRE TECNIMONT GROUP OVERVIEW – MARCH 2017 FERTILIZER €8.8bn POLYOLEFIN GAS TREATMENT REFINERY So
Slide 26: Summary
SUMMARY 1. Group Overview 2. Strategy and Competitive Positioning 3. Operations 4. Financial Data 5. Conclusions
Slide 27: Consolidated Income Statement & Balance Sheet
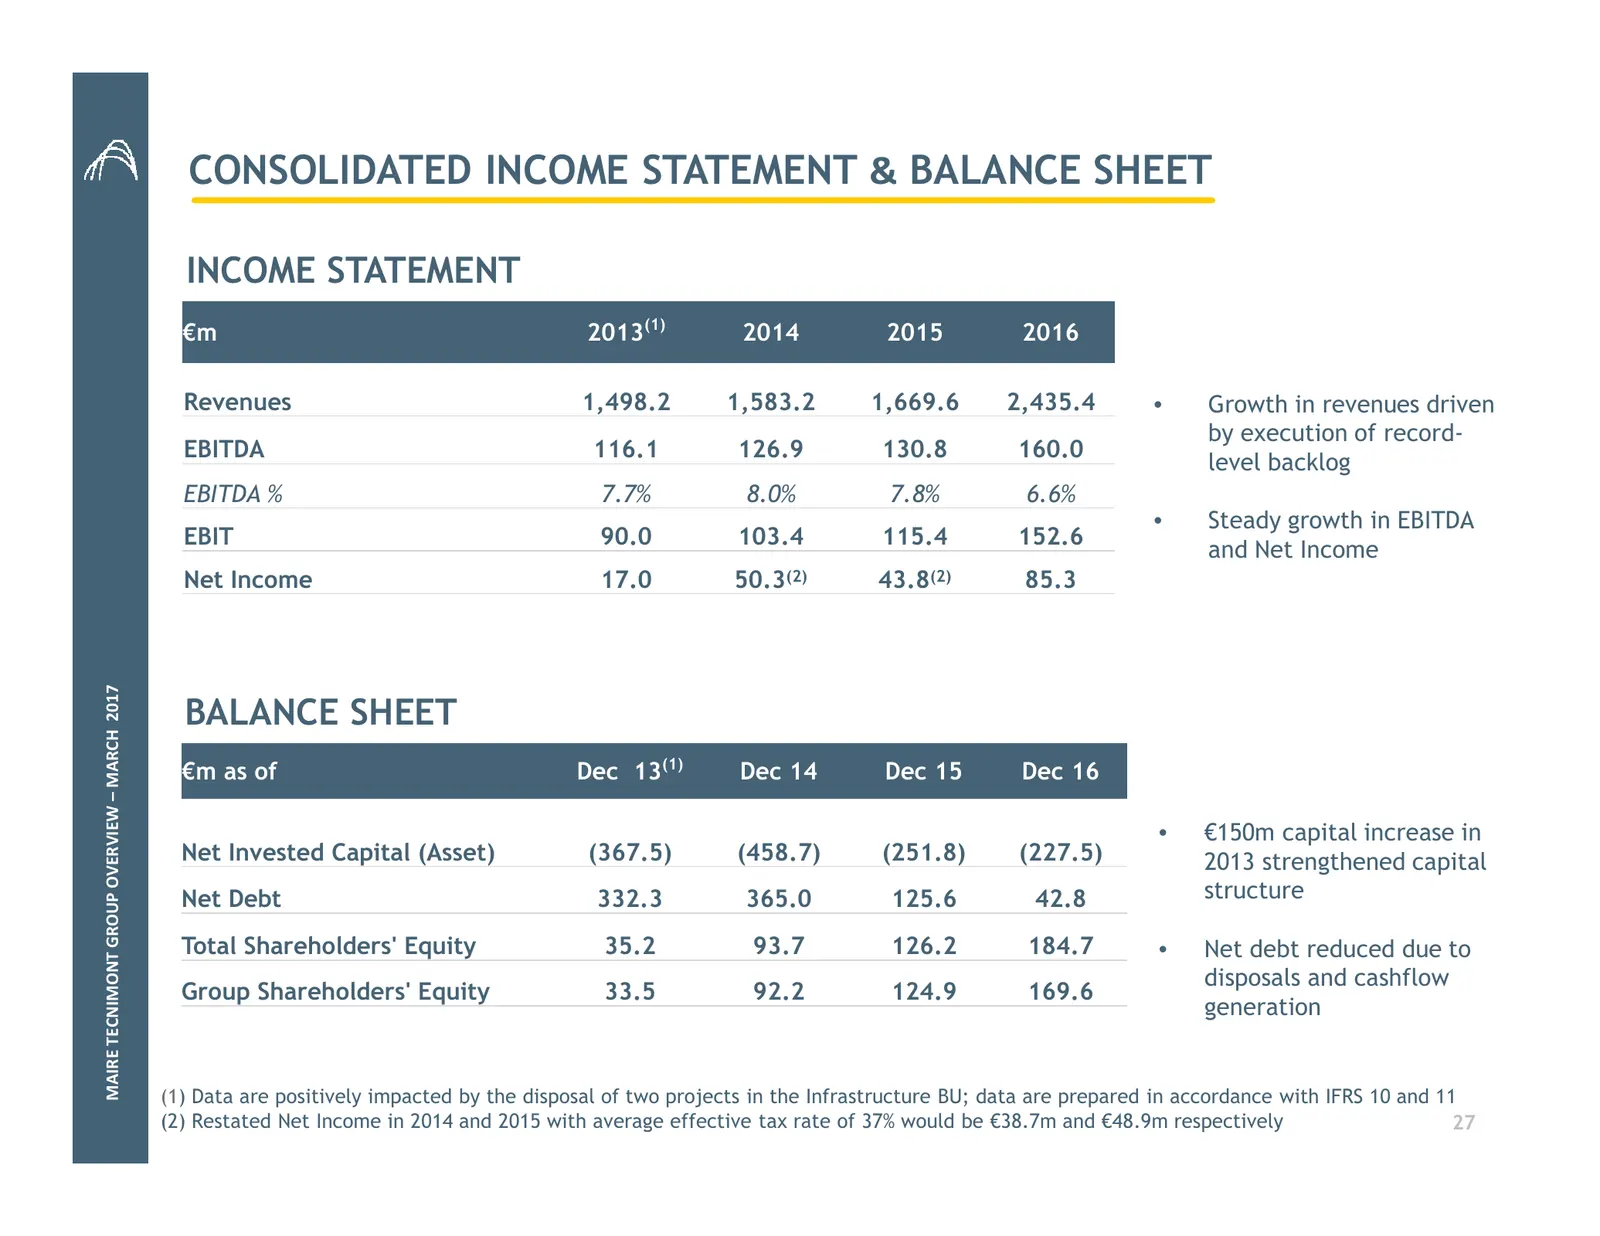
CONSOLIDATED INCOME STATEMENT & BALANCE SHEET INCOME STATEMENT €m 2013(1) 2014 2015 2016 • Revenues’ Revenues 1,498.2 1,583.2 1,669.6 2,435.4 • Growth in revenues driven by execution of record- EBITDA 116.1 126.9 130.8 160.0 level backlog EBITDA % 7.7% 8.0% 7.8% 6.6% • Steady growth in EBITDA EBIT 9
Slide 28: Net Financial Position and Cash Flow Bridge
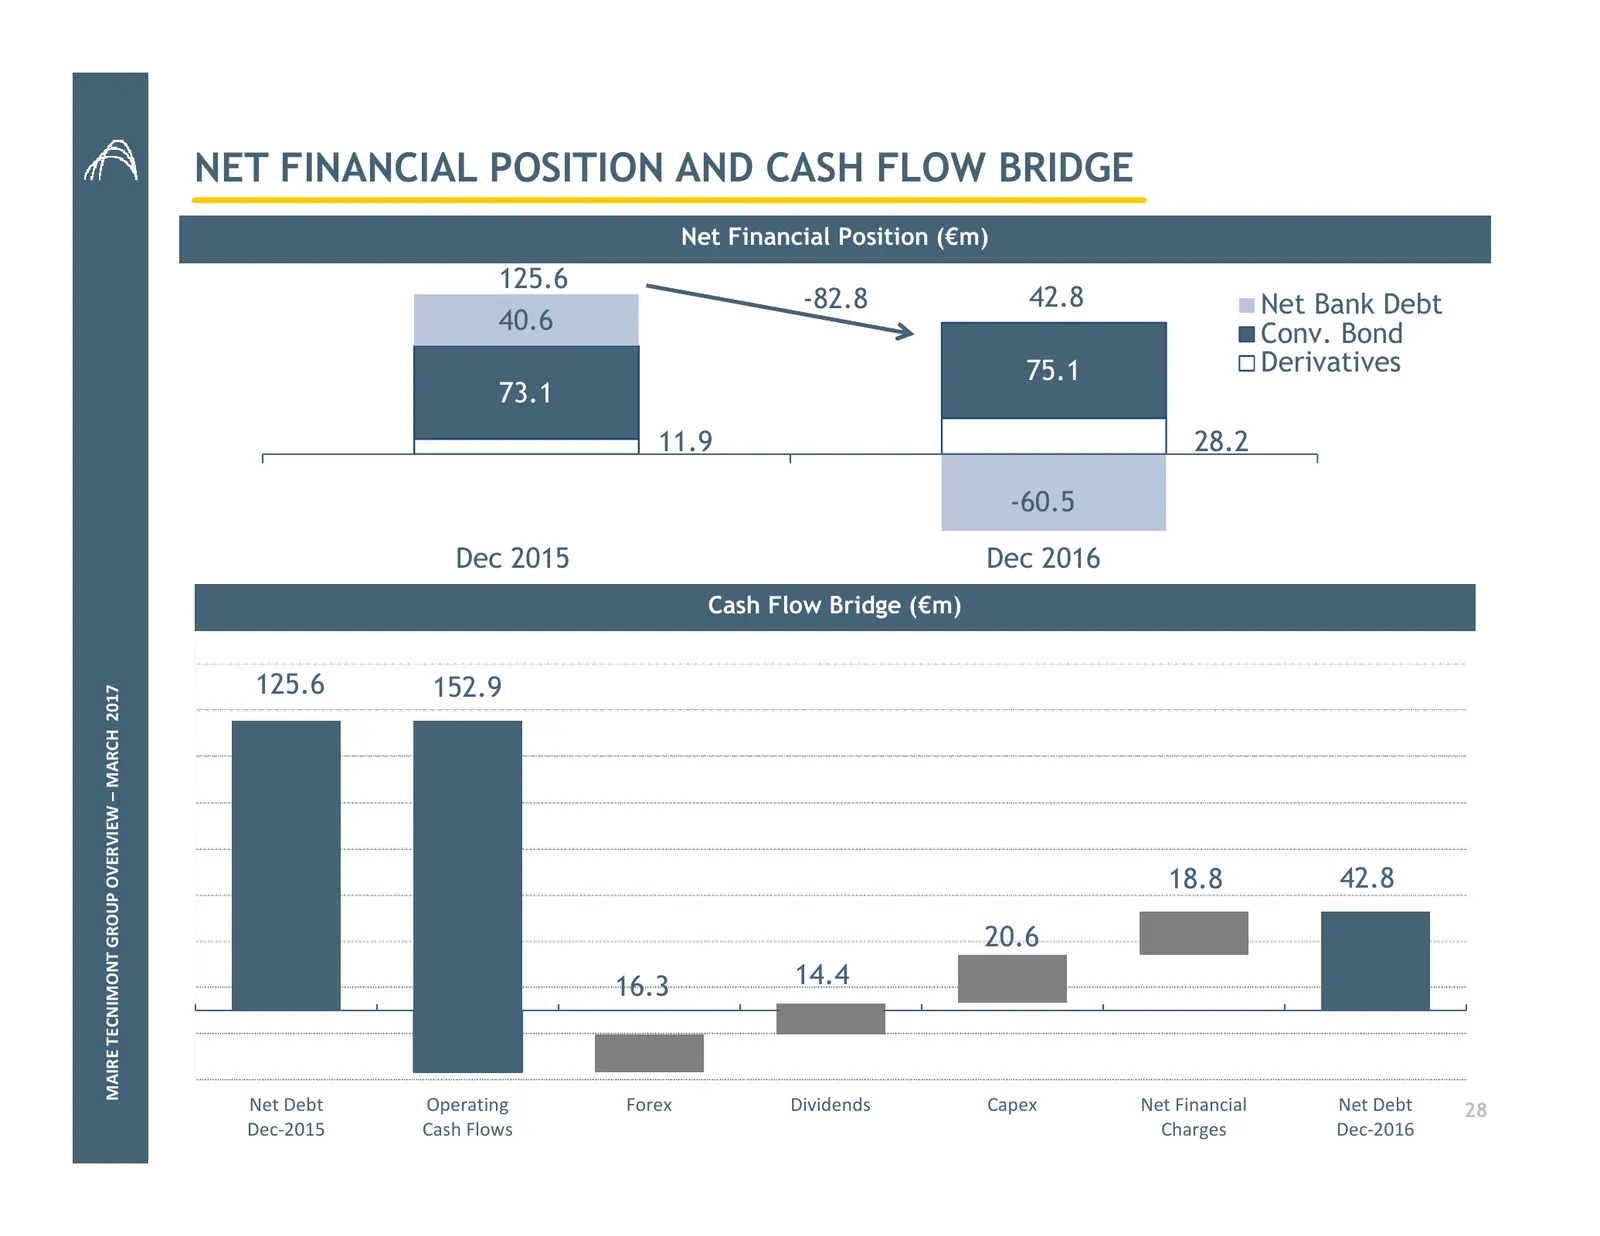
NET FINANCIAL POSITION AND CASH FLOW BRIDGE Net Financial Position (€m) 125.6 -82.8 42.8 Net Bank Debt 40.6 Conv. Bond 75.1 Derivatives 73.1 11.9 28.2 -60.5 Dec 2015 Dec 2016 Cash Flow Bridge (€m) 125.6 152.9 MAIRE TECNIMONT GROUP OVERVIEW – MARCH 2017 18.8 42.8 20.6 16.3 14.4 Net Debt Operating For
Slide 29: Spread of Bank Debt Refinancings, 2013-2015
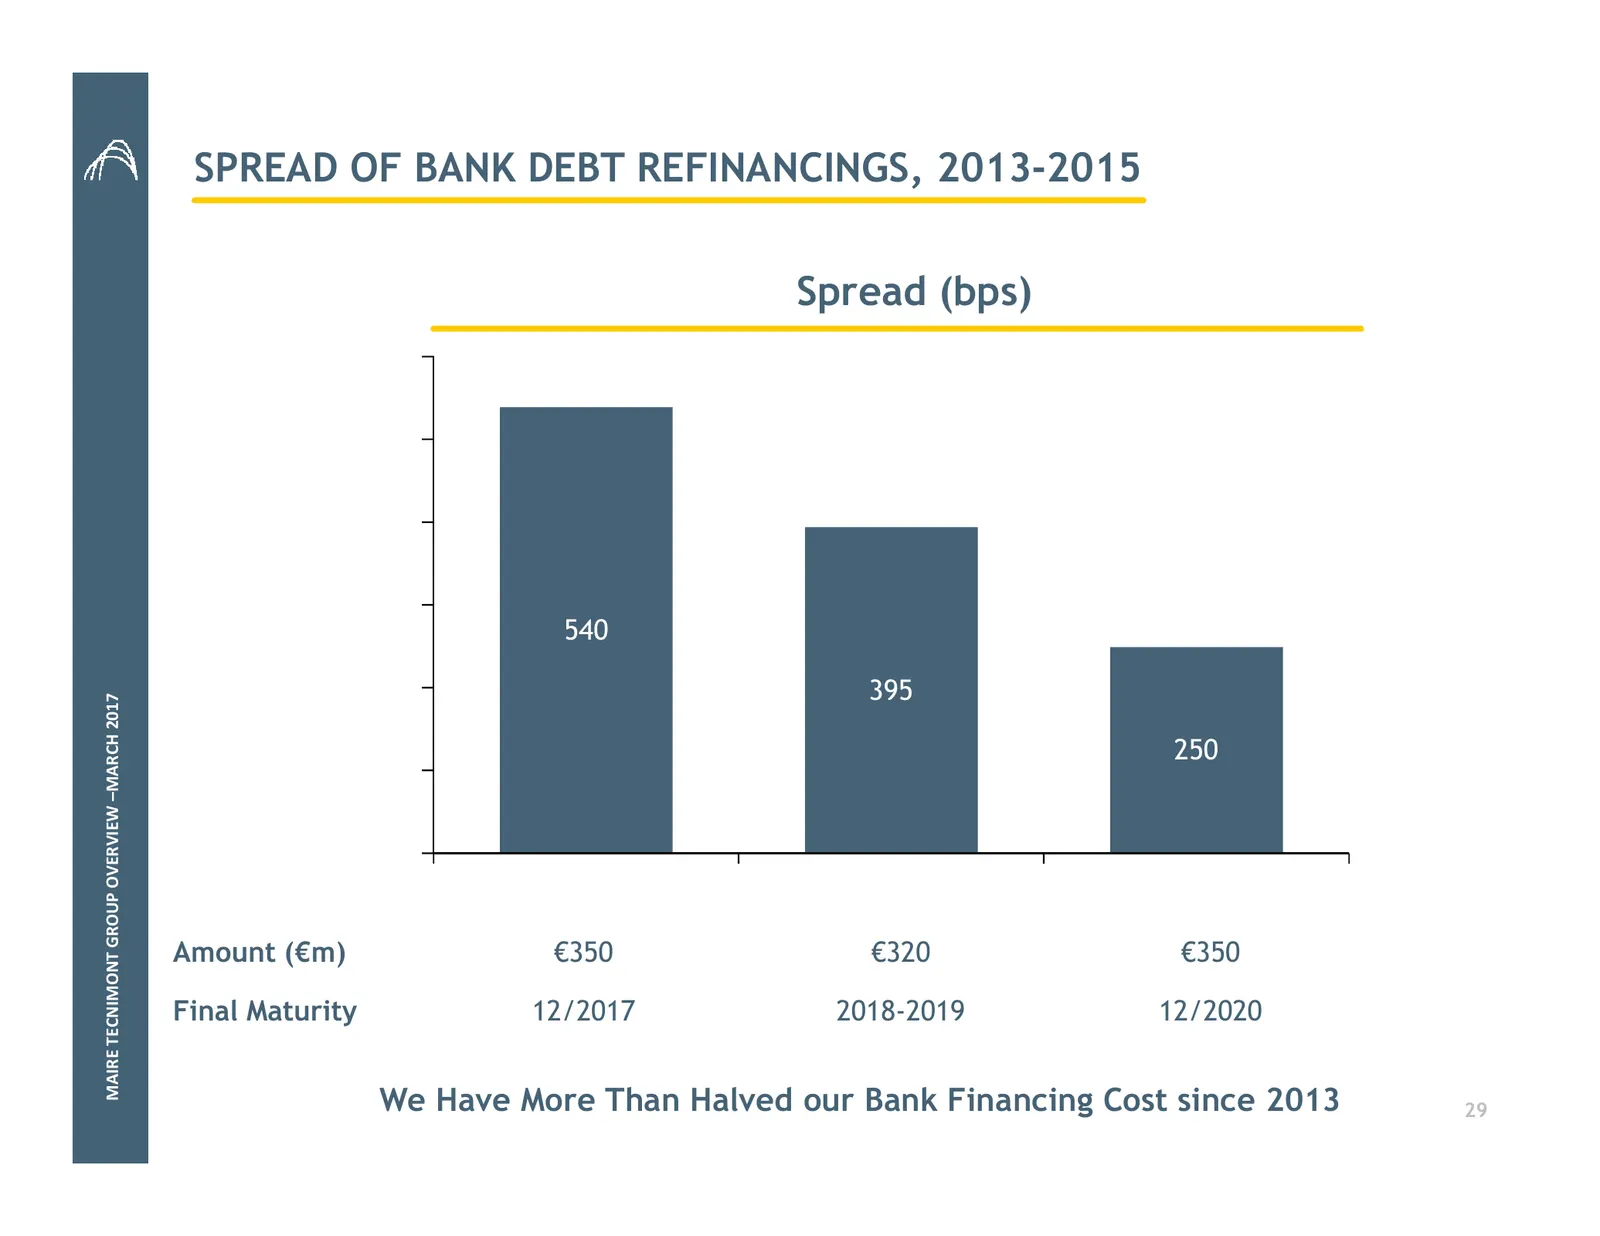
SPREAD OF BANK DEBT REFINANCINGS, 2013-2015 Spread (bps) 600 500 400 300 540 200 395 MAIRE TECNIMONT GROUP OVERVIEW –MARCH 2017 250 100 0 May 2013 Apr 2015 Dec 2015 Amount (€m) €350 €320 €350 Final Maturity 12/2017 2018-2019 12/2020 We Have More Than Halved our Bank Financing Cost since 2013 29
Slide 30: Summary
SUMMARY 1. Group Overview 2. Strategy and Competitive Positioning 3. Operations MAIRE TECNIMONT GROUP OVERVIEW – FEBRUARY 2017 4. Financial Data 5. Conclusions
Slide 31: Conclusions
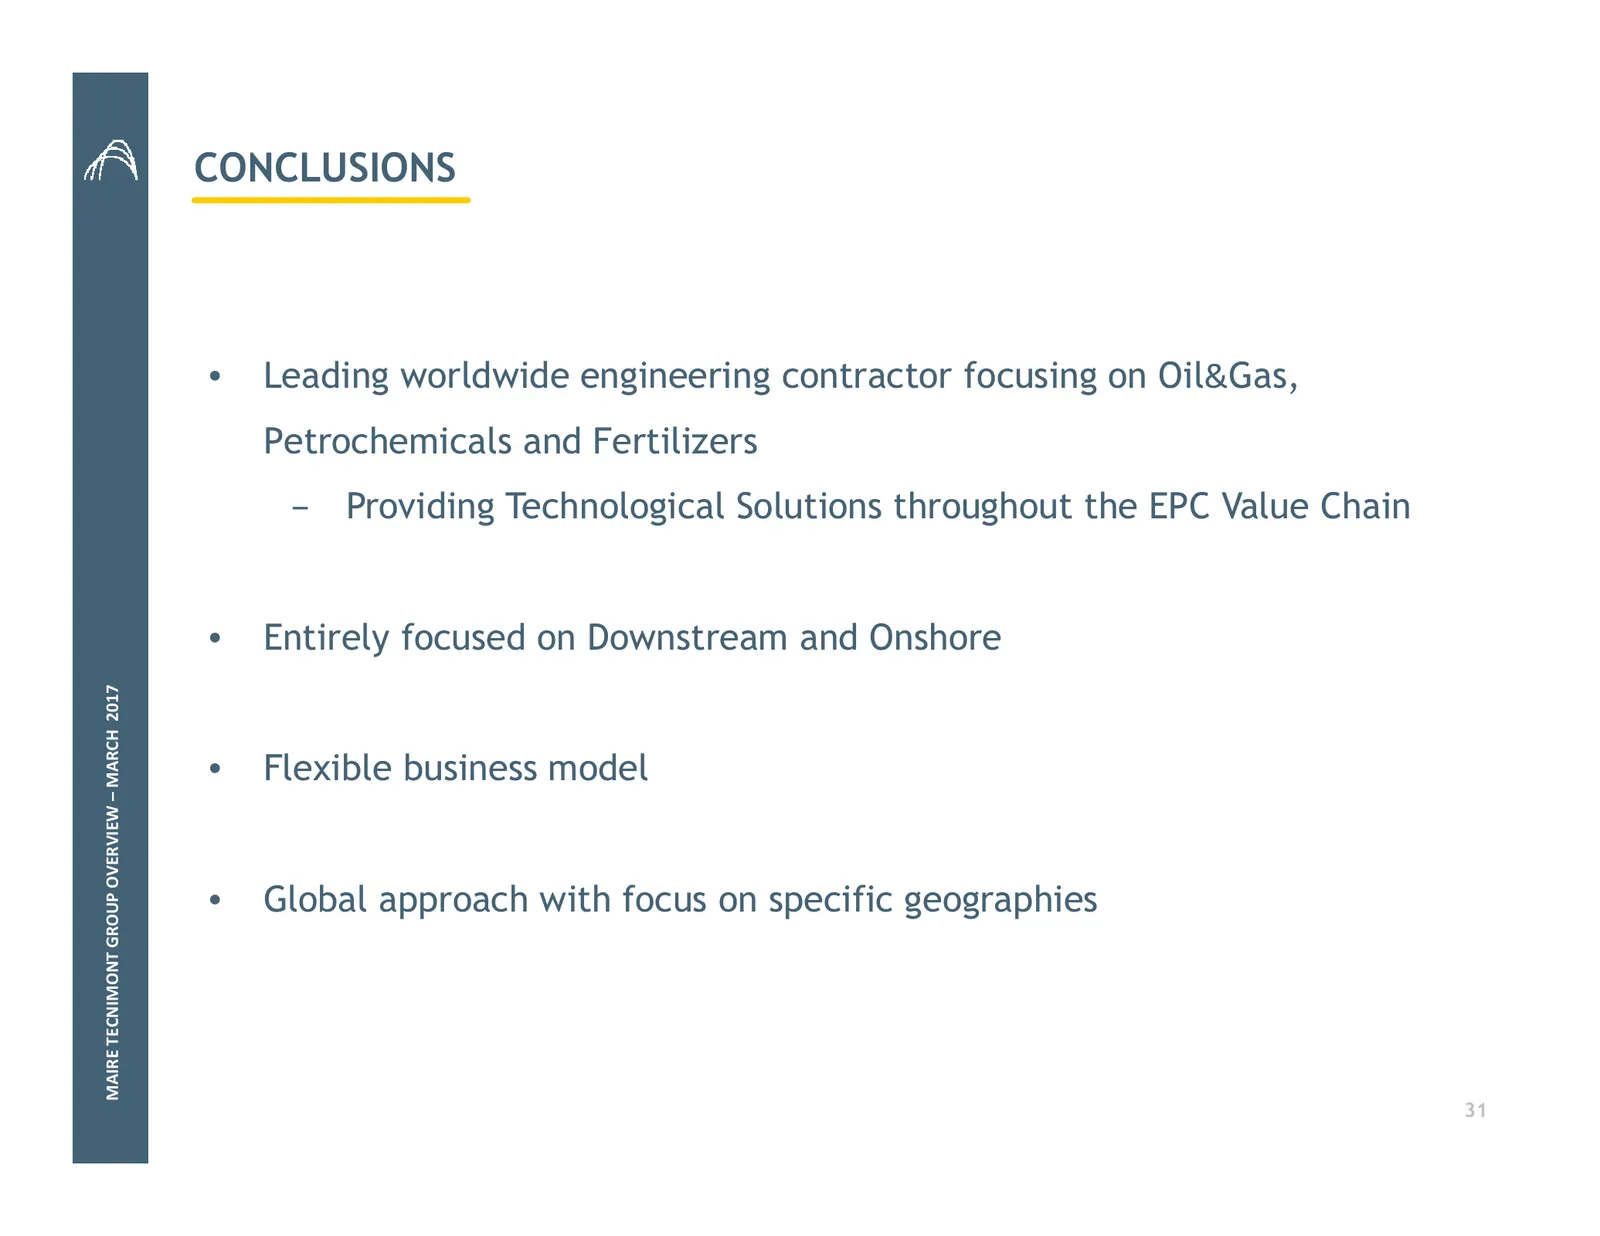
CONCLUSIONS • Leading worldwide engineering contractor focusing on Oil&Gas, Petrochemicals and Fertilizers − Providing Technological Solutions throughout the EPC Value Chain • Entirely focused on Downstream and Onshore MAIRE TECNIMONT GROUP OVERVIEW – MARCH 2017 • Flexible business model • Global ap
Slide 32: Headquarters and Investor Relations contacts
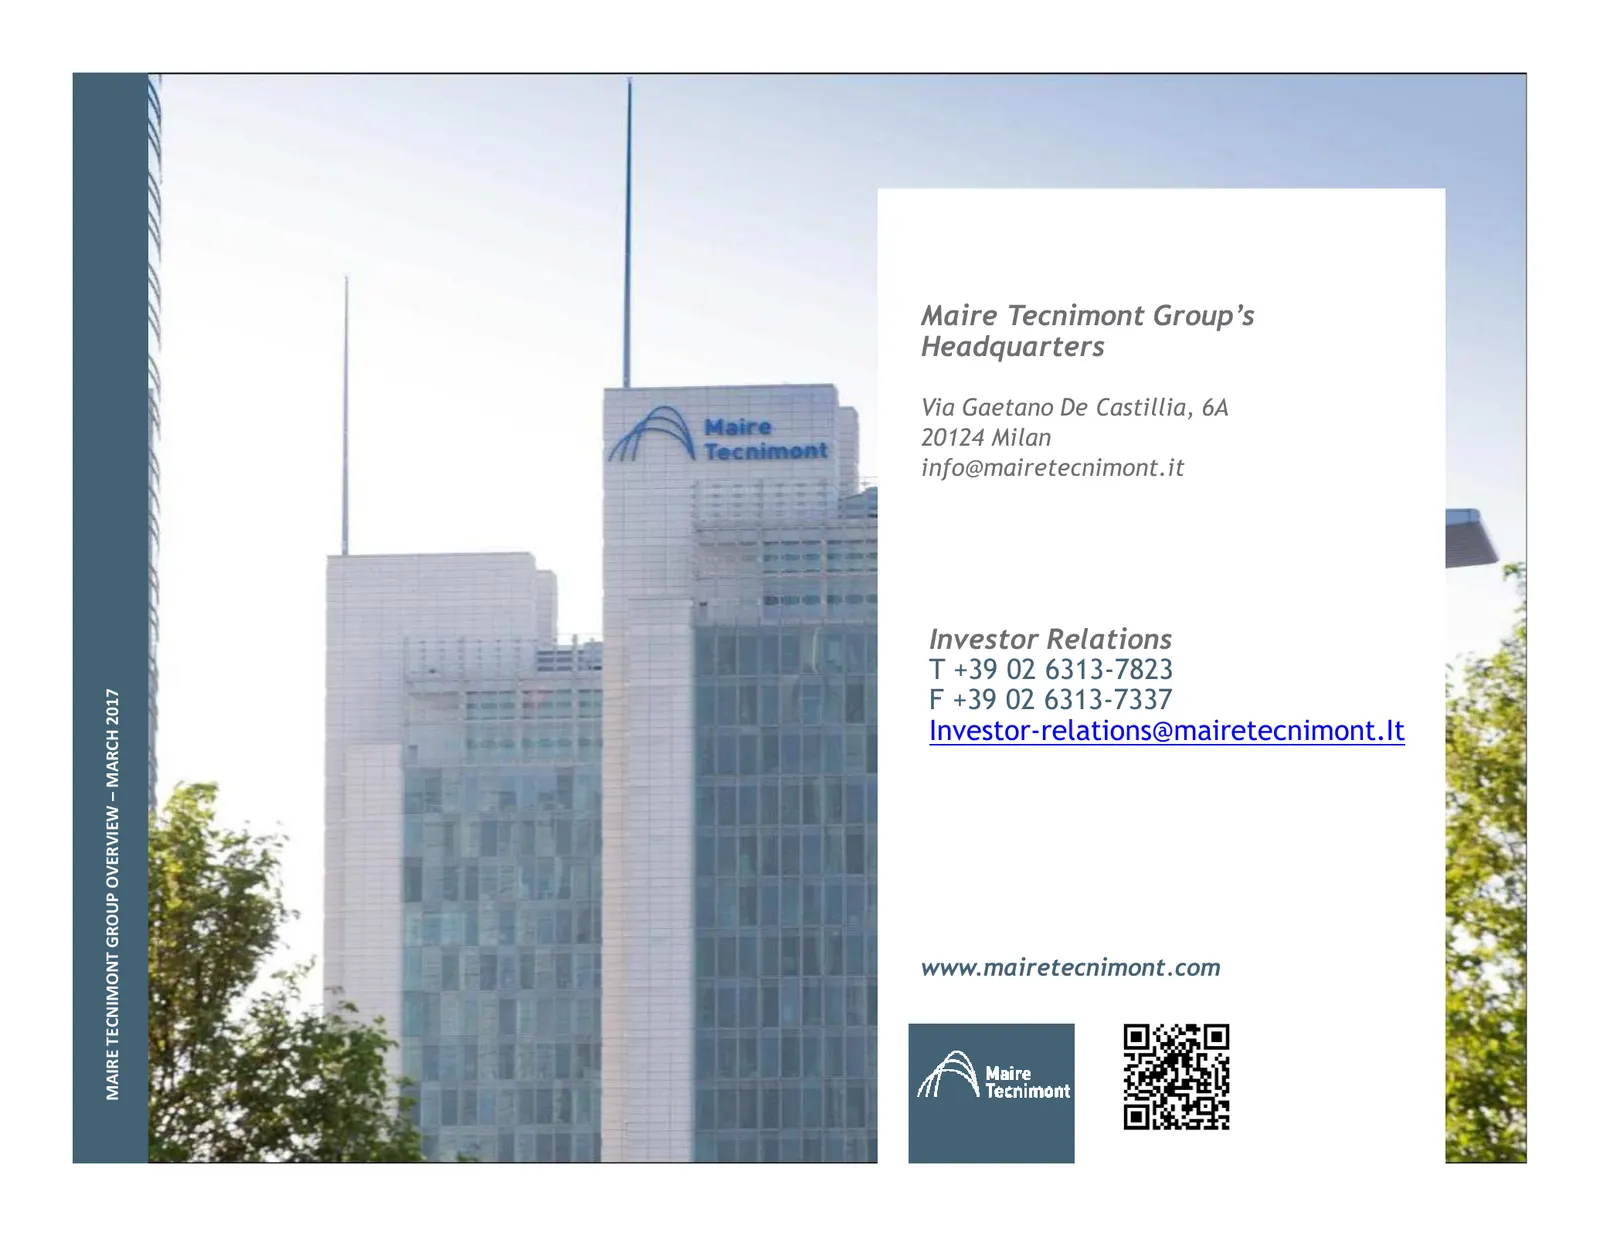
Maire Tecnimont Group’s Headquarters Via Gaetano De Castillia, 6A 20124 Milan info@mairetecnimont.it Investor Relations T +39 02 6313-7823 F +39 02 6313-733702 6313-7823 MAIRE TECNIMONT GROUP OVERVIEW – MARCH 2017 Investor-relations@mairetecnimont.It www.mairetecnimont.com
Source: Internet Archive copy of mairetecnimont.com
More decks from Maire S.p.A.
 Maire Tecnimont — 9M 2026 Earnings Presentation33 slides · Oct 27, 2026
 H1 2026 Earnings Presentation70 slides · August 2026
 H1 2026 Earnings Presentation31 slides · Jul 30, 2026
 Q1 2026 Earnings Presentation63 slides · May 2026
 Q1 2026 Earnings Presentation27 slides · Apr 29, 2026
 Investor Presentation (March 2026)58 slides · March 2026