Walgreens Boots Alliance — Q1 2022 Earnings Presentation
34 slides from Walgreens Boots Alliance's earnings presentation, Jan 6, 2022
Slide 1: Fiscal 2022 First Quarter Results
Fiscal 2022 First Quarter Results January 6, 2022 © 2022 Walgreens Boots Alliance, Inc. All rights reserved. 1
Slide 2: Safe Harbor and Non-GAAP
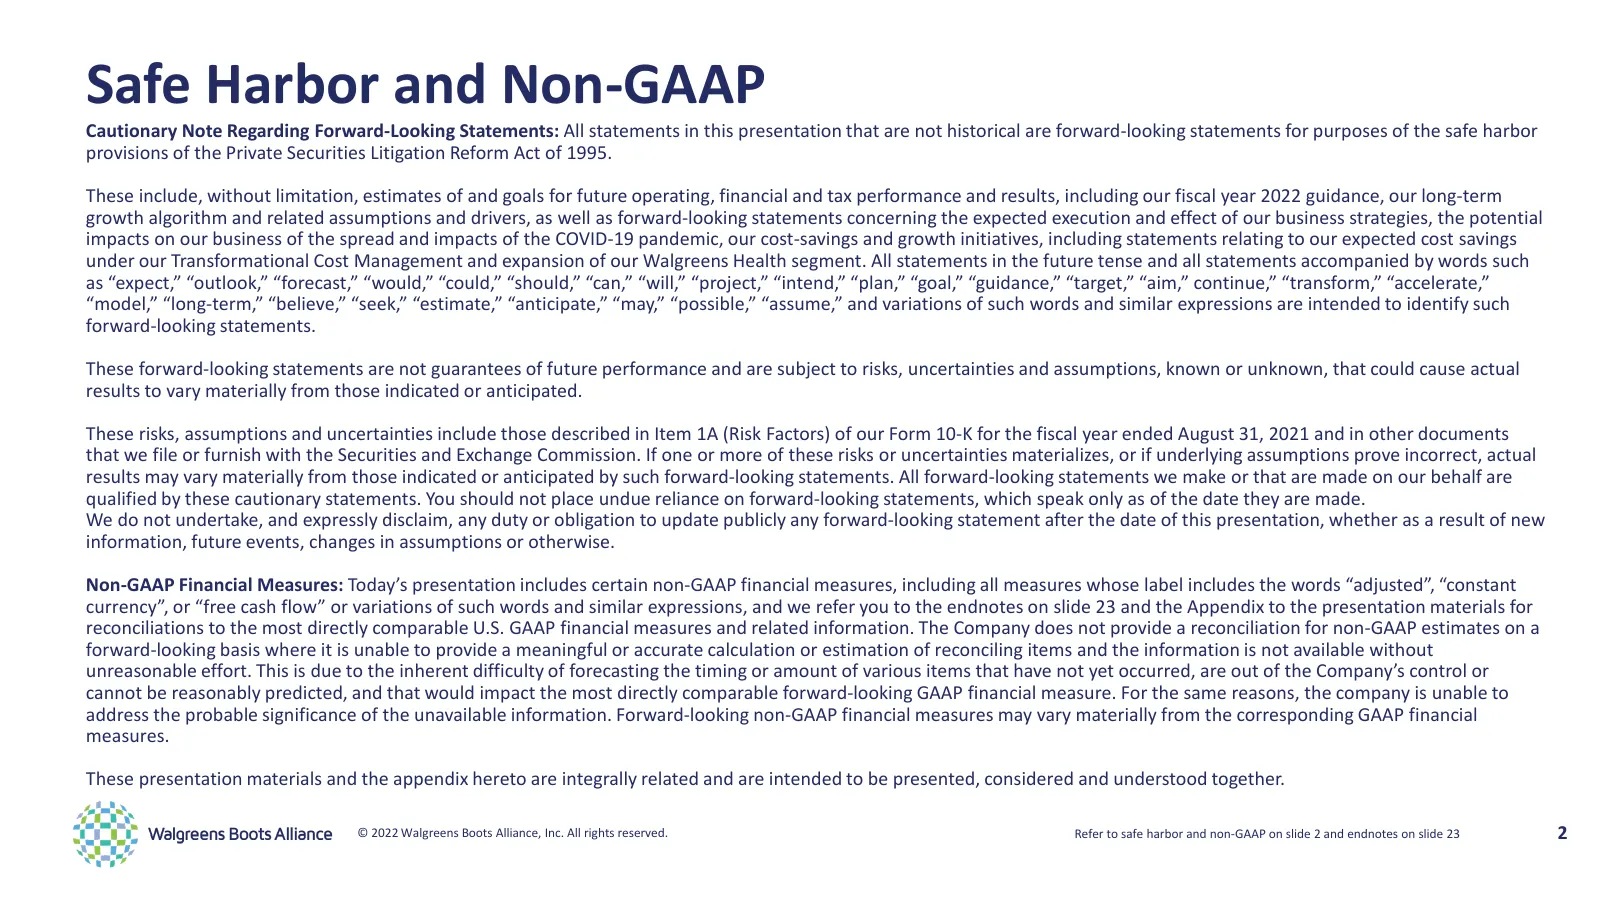
Safe Harbor and Non-GAAP Cautionary Note Regarding Forward-Looking Statements: All statements in this presentation that are not historical are forward-looking statements for purposes of the safe harbor provisions of the Private Securities Litigation Reform Act of 1995. These include, without limitat
Slide 3: Takeaways
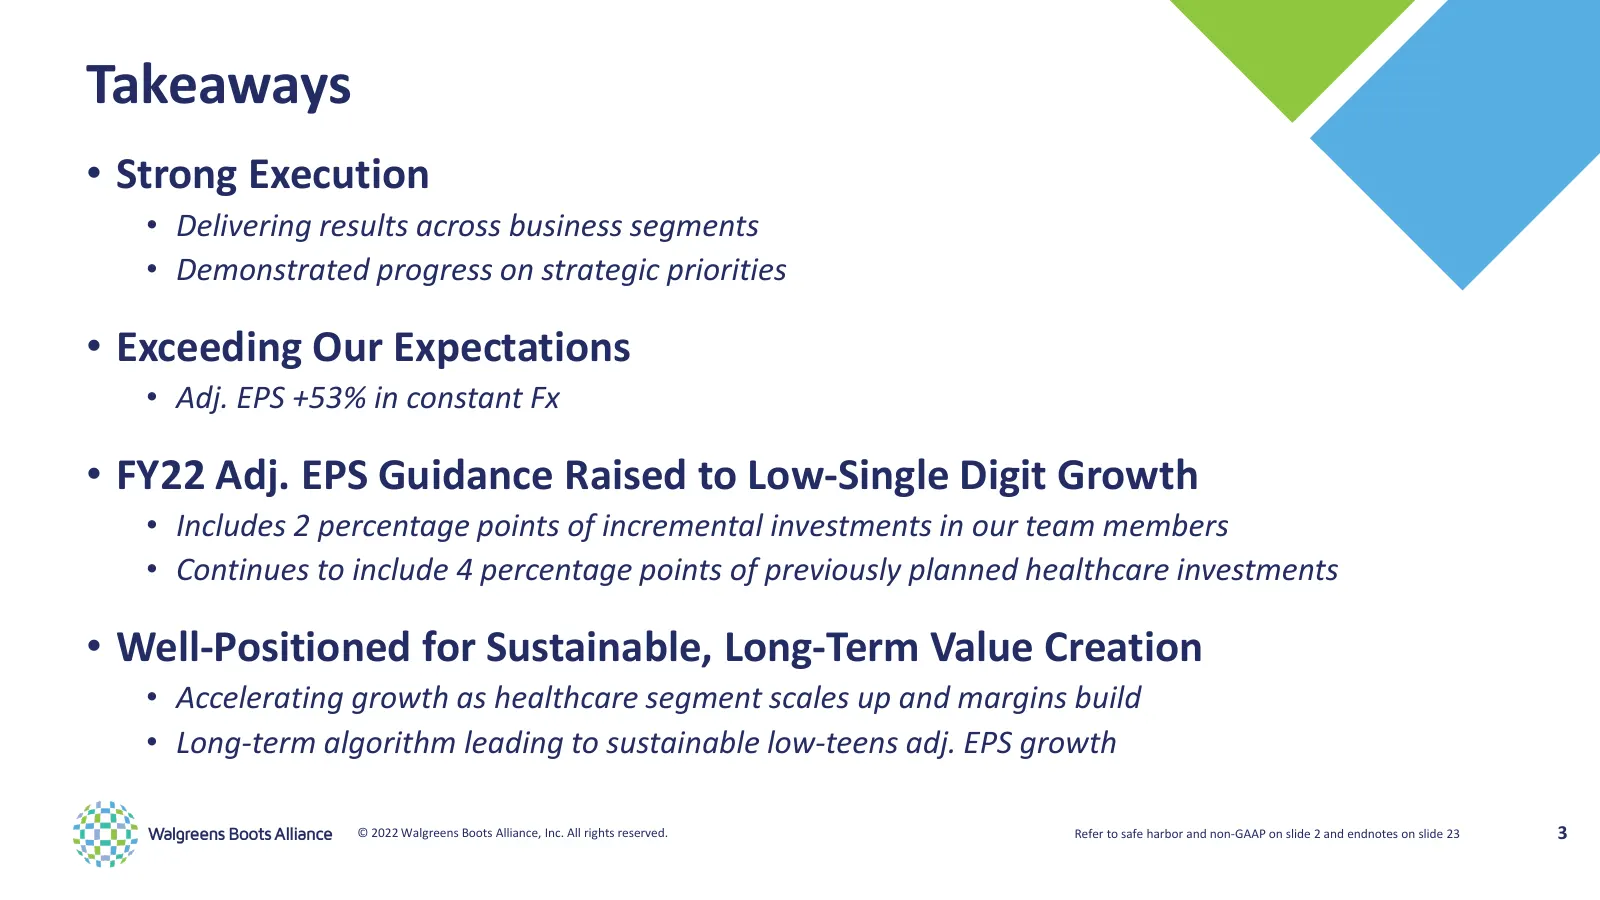
Takeaways • Strong Execution • Delivering results across business segments • Demonstrated progress on strategic priorities • Exceeding Our Expectations • Adj. EPS +53% in constant Fx • FY22 Adj. EPS Guidance Raised to Low-Single Digit Growth • Includes 2 percentage points of incremental investments
Slide 4: Leading the Fight Against the Pandemic
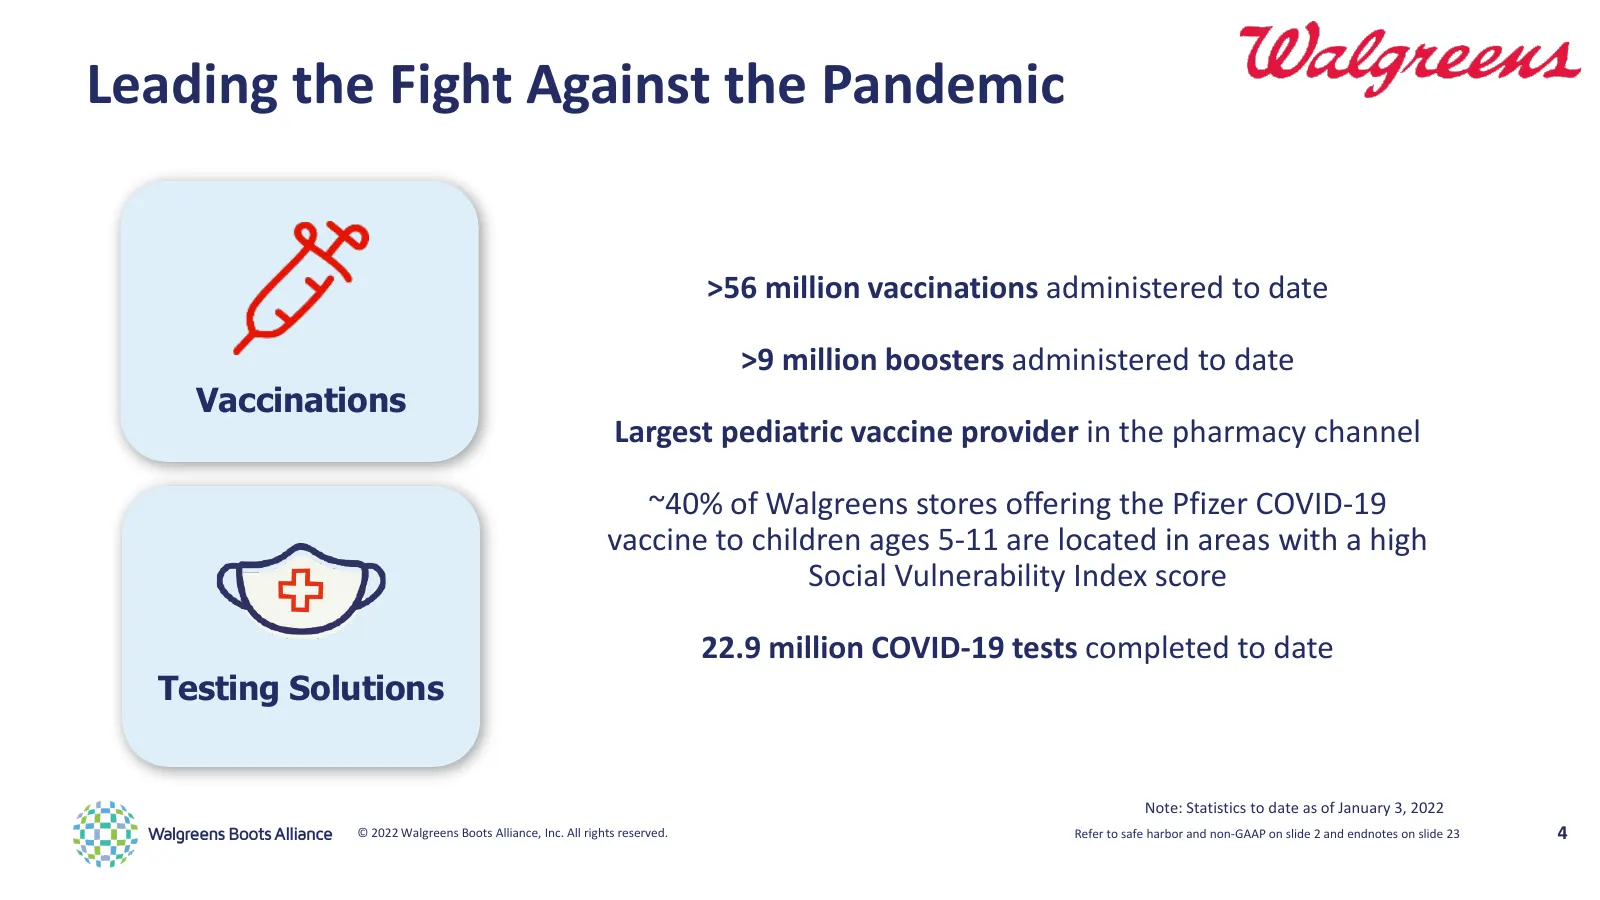
Leading the Fight Against the Pandemic >56 million vaccinations administered to date >9 million boosters administered to date Vaccinations Largest pediatric vaccine provider in the pharmacy channel ~40% of Walgreens stores offering the Pfizer COVID-19 vaccine to children ages 5-11 are located in are
Slide 5: To Be the Leading Partner in Reimagining Local Healthcare and Wellbeing for All
To Be the Leading Partner in Reimagining Local Healthcare and Wellbeing for All Strategic Priorities: 1. Transform and Align the Core 2. Build Our Next Growth Engine with Consumer-Centric Healthcare Solutions 3. Focus the Portfolio; Optimize Capital Allocation 4. Build a High-Performance Culture and
Slide 6: Recent Progress on Strategic Priorities
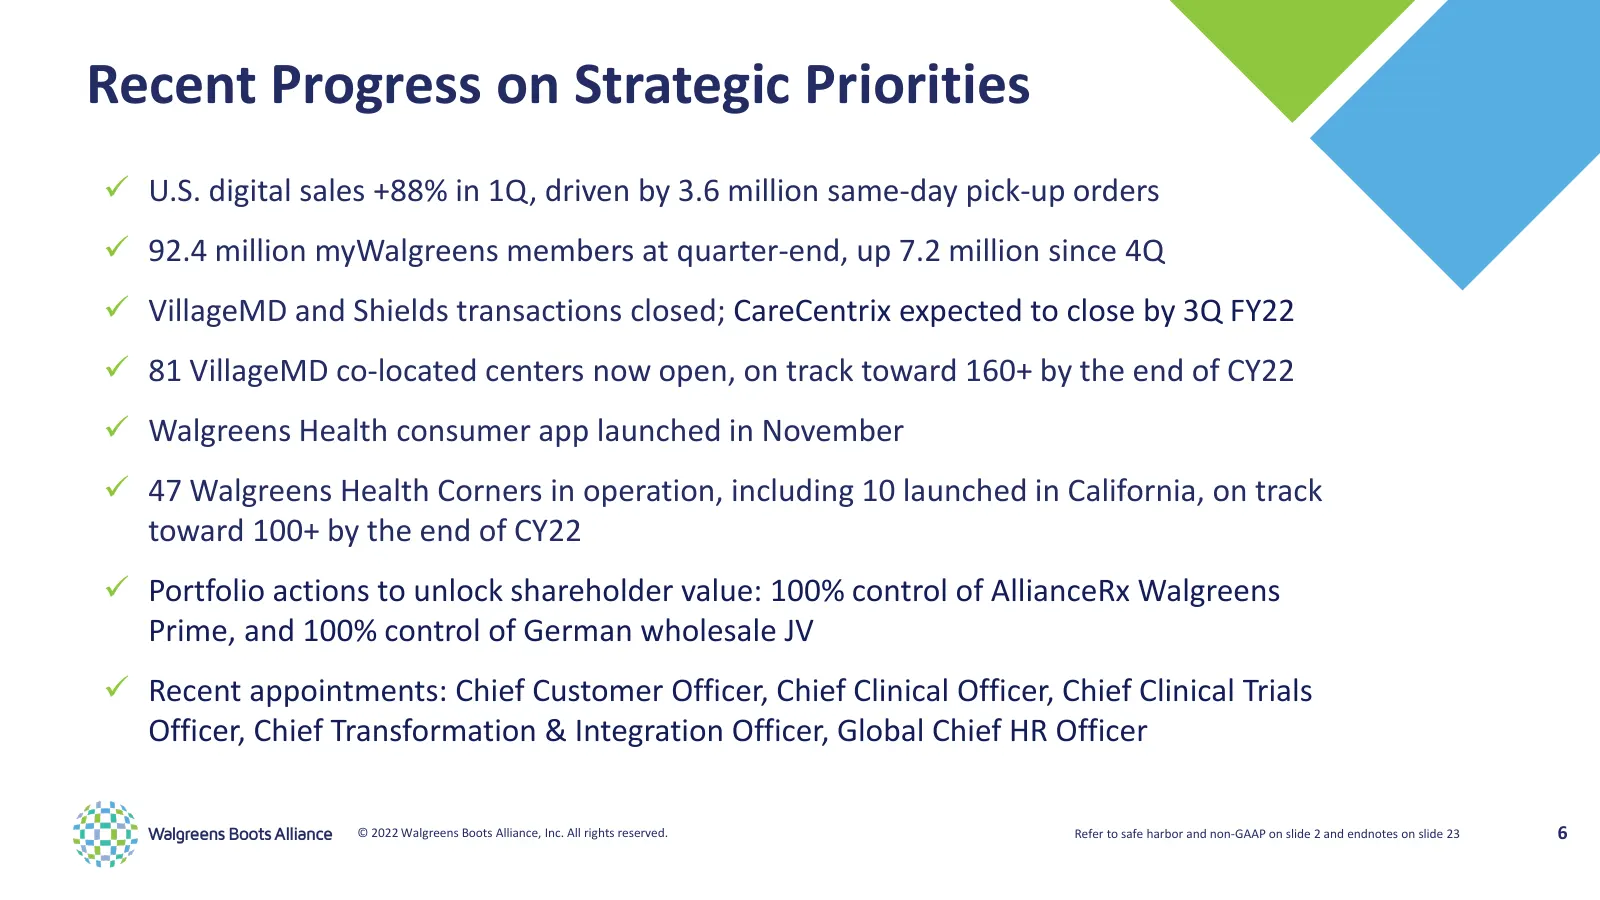
Recent Progress on Strategic Priorities U.S. digital sales +88% in 1Q, driven by 3.6 million same-day pick-up orders 92.4 million myWalgreens members at quarter-end, up 7.2 million since 4Q VillageMD and Shields transactions closed; CareCentrix expected to close by 3Q FY22 81 VillageMD co-lo
Slide 7: Building Community Engagement Today
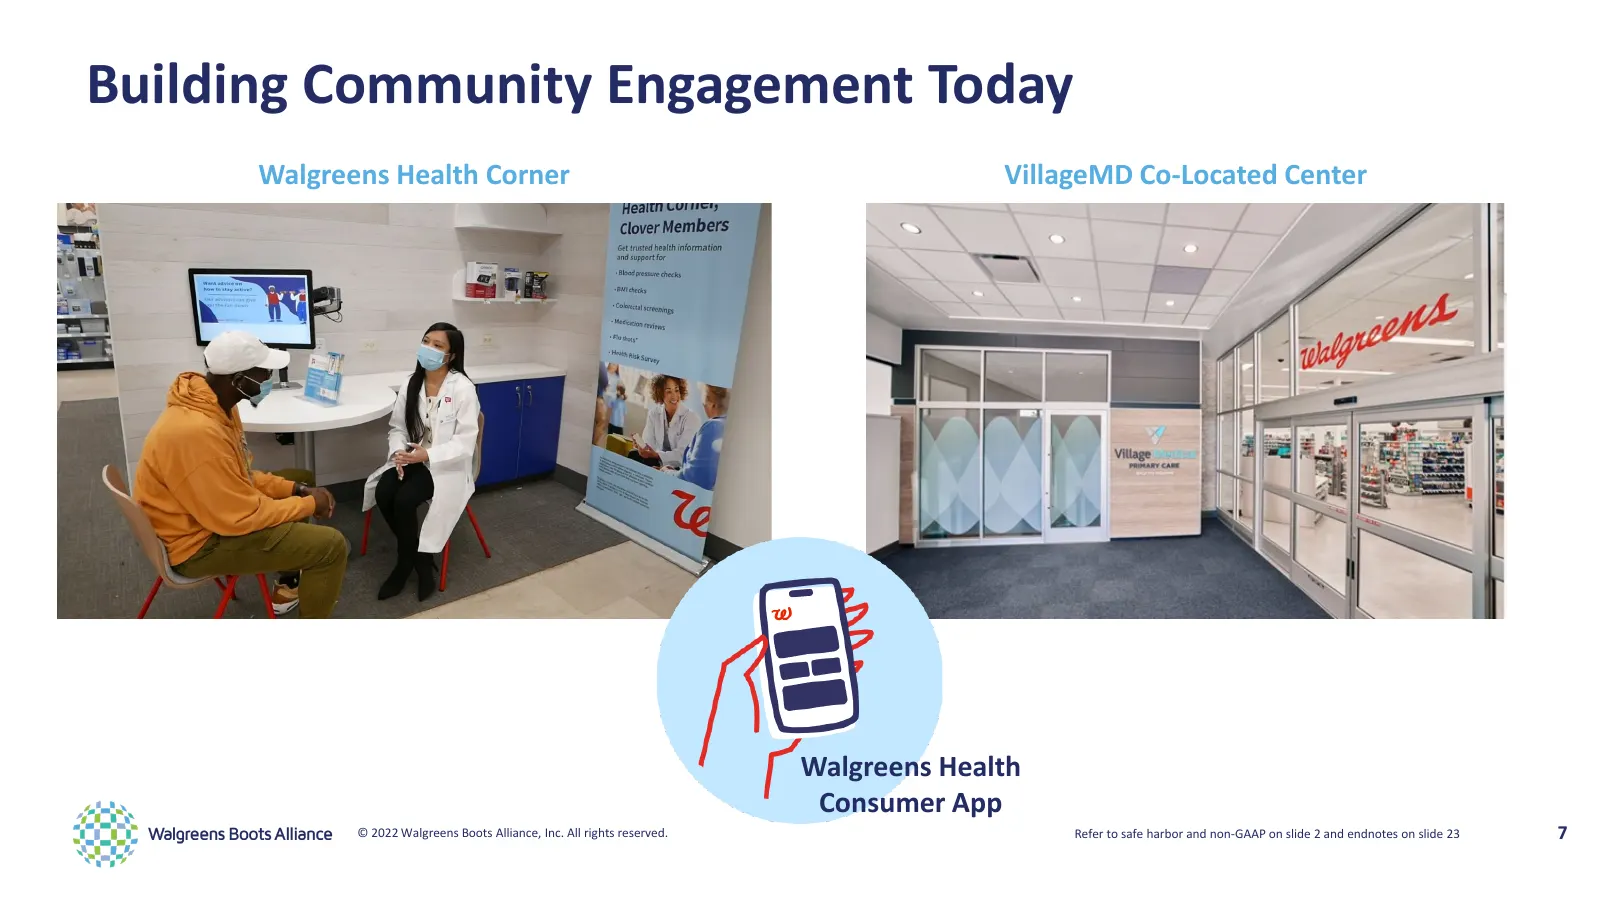
Building Community Engagement Today Walgreens Health Corner VillageMD Co-Located Center Walgreens Health Consumer App © 2022 Walgreens Boots Alliance, Inc. All rights reserved. Refer to safe harbor and non-GAAP on slide 2 and endnotes on slide 23 7

Slide 8: WBA Financial Performance
WBA Financial Performance © 2022 Walgreens Boots Alliance, Inc. All rights reserved. 8
Slide 9: 1Q 2022 Financial Highlights
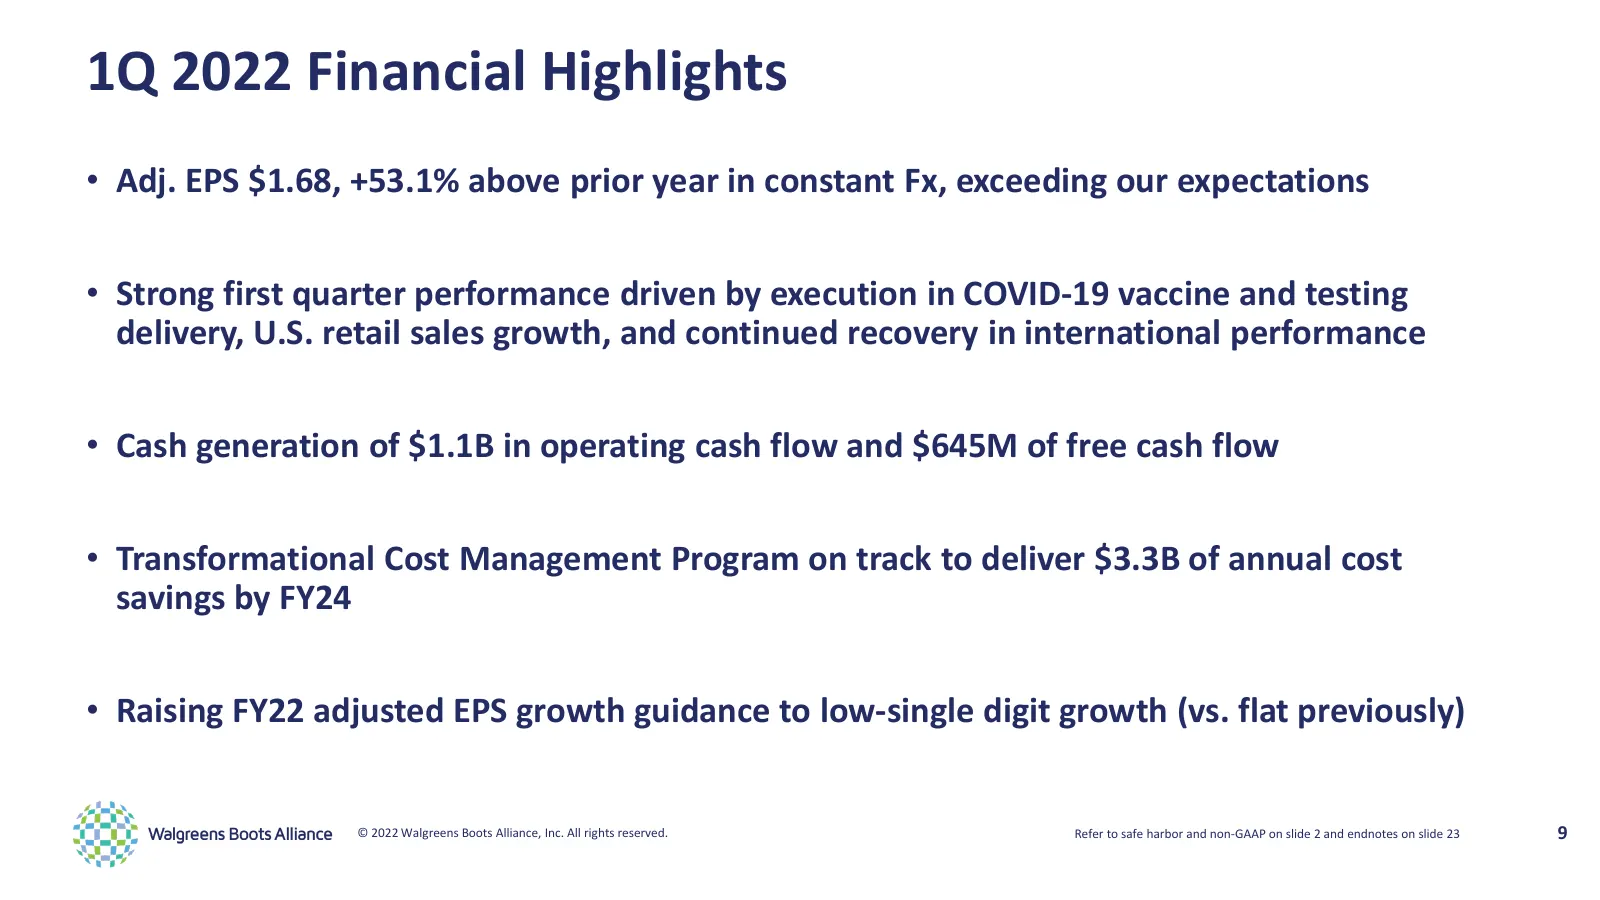
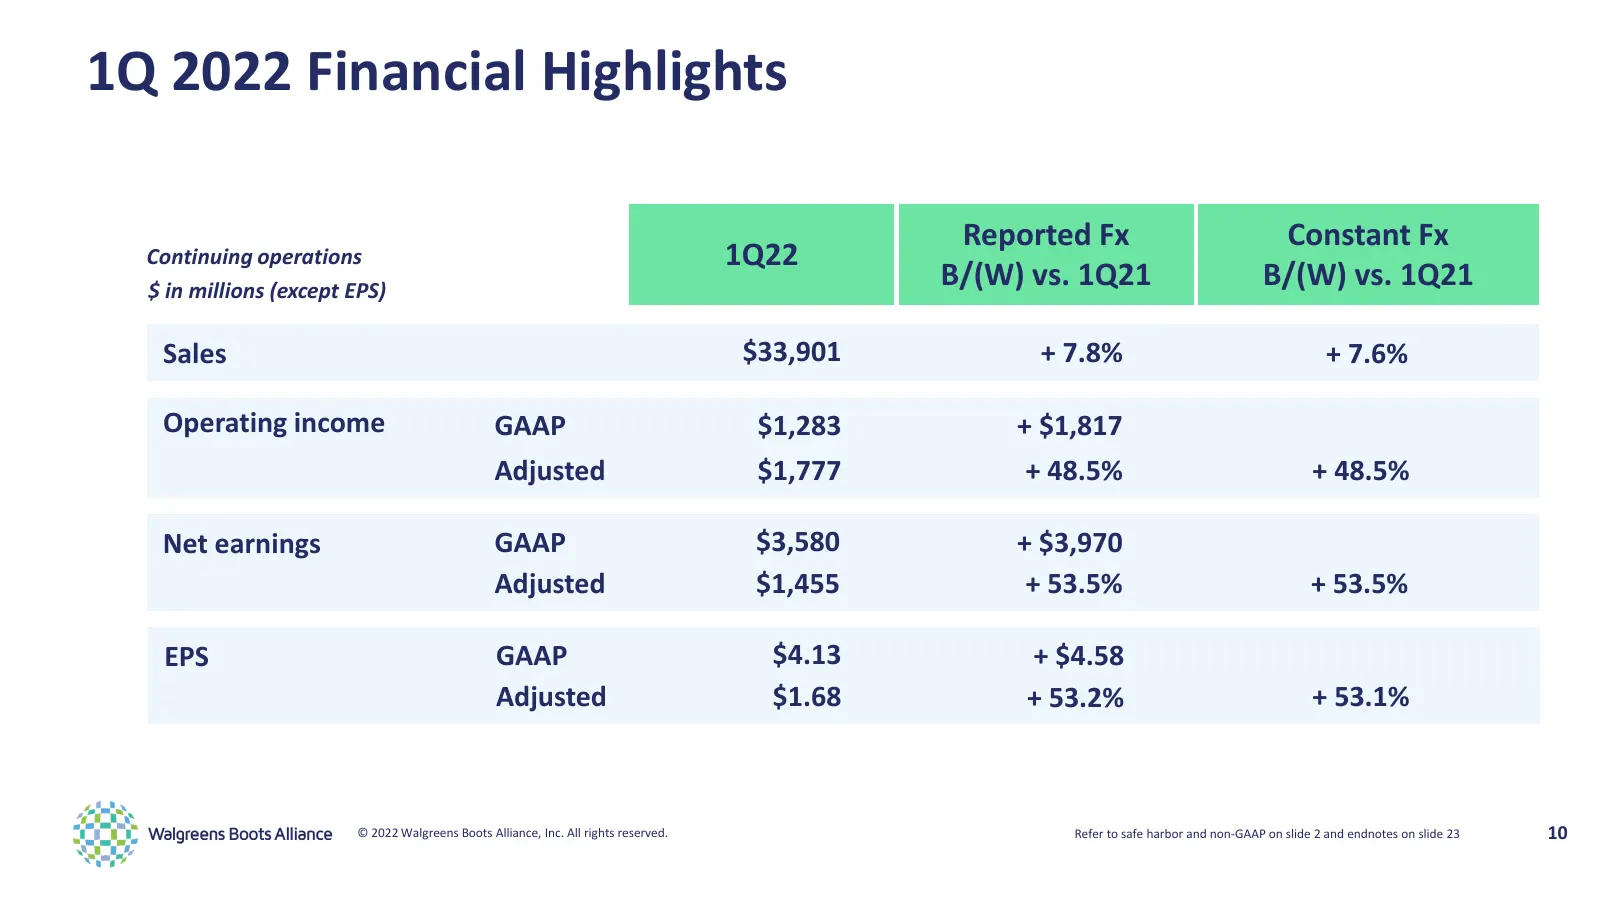
1Q 2022 Financial Highlights • Adj. EPS $1.68, +53.1% above prior year in constant Fx, exceeding our expectations • Strong first quarter performance driven by execution in COVID-19 vaccine and testing delivery, U.S. retail sales growth, and continued recovery in international performance • Cash gene
Slide 10: 1Q 2022 Financial Highlights
1Q 2022 Financial Highlights Reported Fx Constant Fx Continuing operations 1Q22 $ in millions (except EPS) B/(W) vs. 1Q21 B/(W) vs. 1Q21 Sales $33,901 + 7.8% + 7.6% Operating income GAAP $1,283 + $1,817 Adjusted $1,777 + 48.5% + 48.5% Net earnings GAAP $3,580 + $3,970 Adjusted $1,455 + 53.5% + 53.5%
Slide 11: United States – Financials
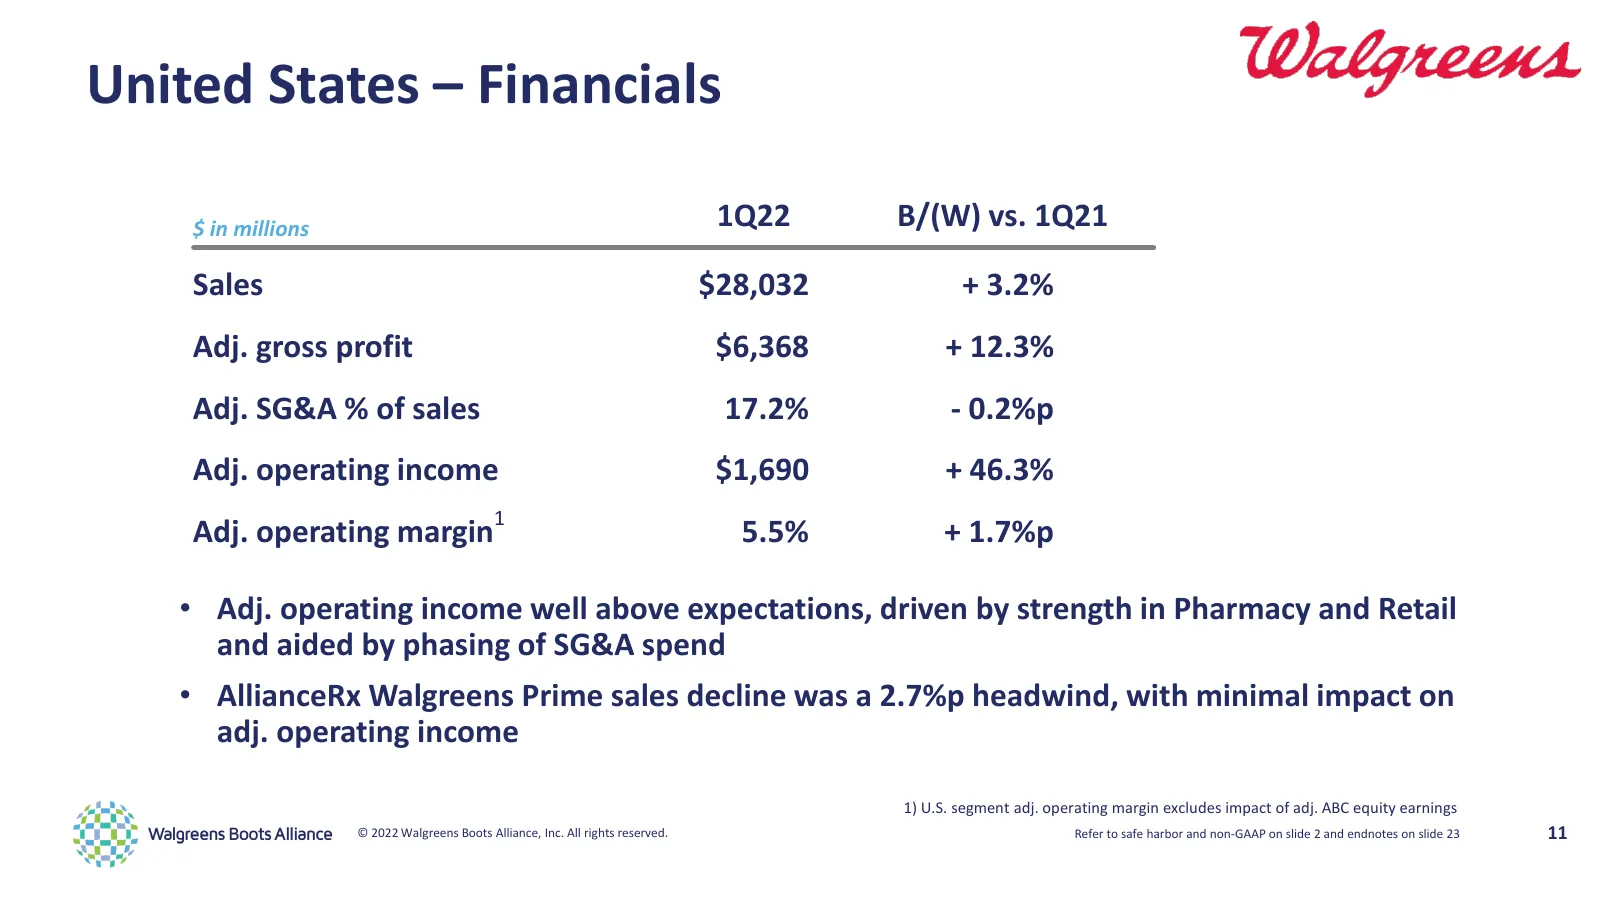
United States – Financials $ in millions 1Q22 B/(W) vs. 1Q21 Sales $28,032 + 3.2% Adj. gross profit $6,368 + 12.3% Adj. SG&A % of sales 17.2% - 0.2%p Adj. operating income $1,690 + 46.3% Adj. operating margin1 5.5% + 1.7%p • Adj. operating income well above expectations, driven by strength in Pharma
Slide 12: United States – Pharmacy
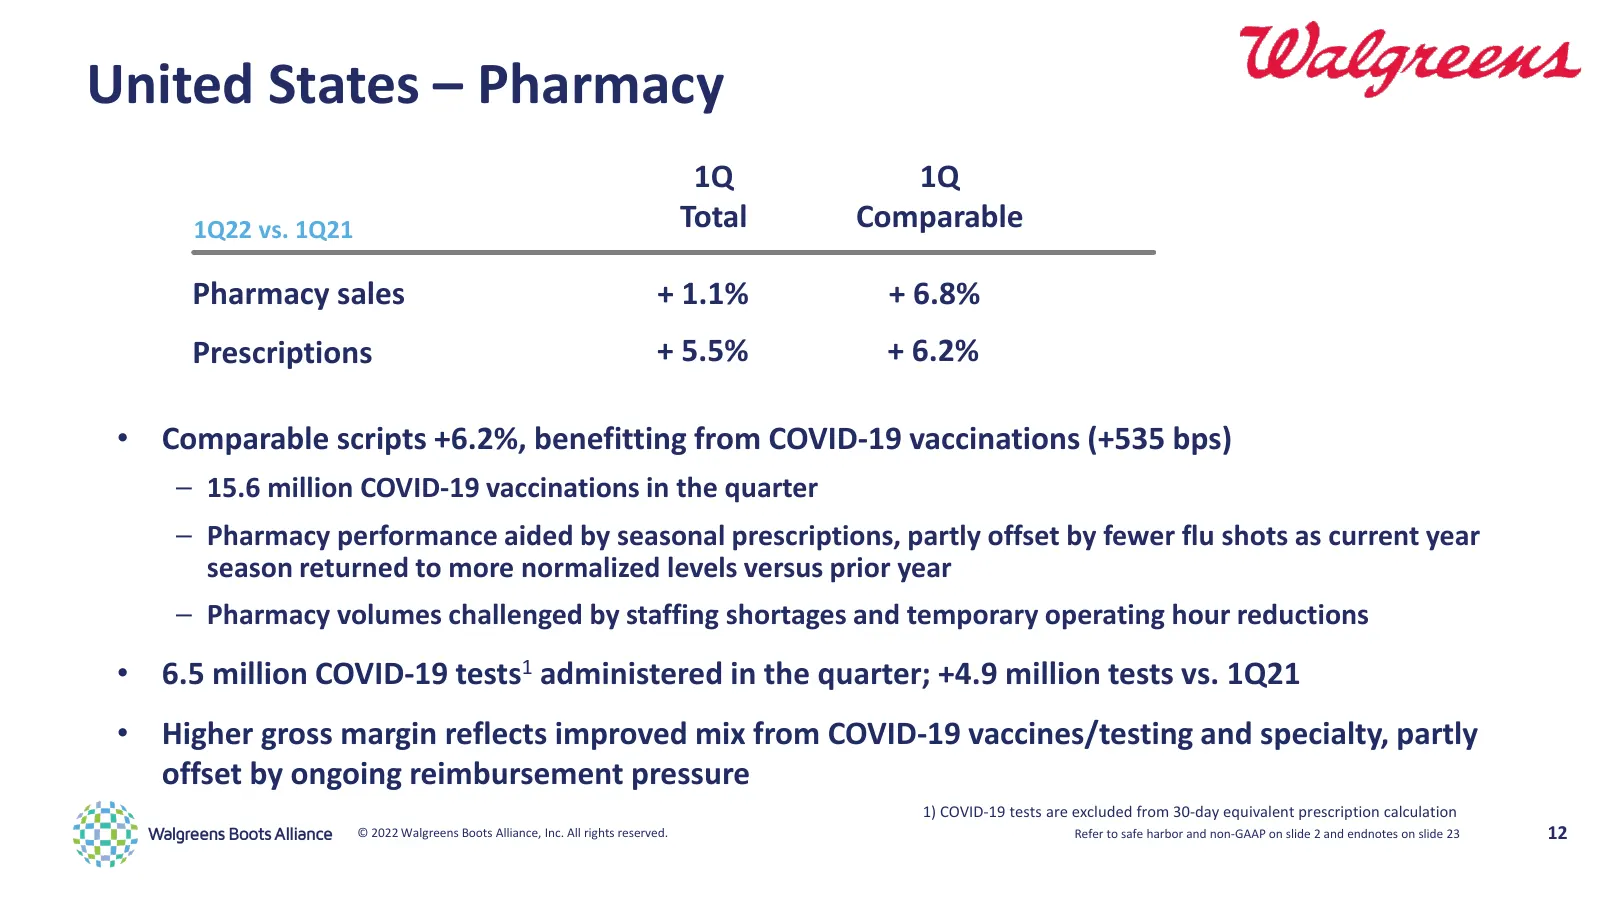
United States – Pharmacy 1Q 1Q 1Q22 vs. 1Q21 Total Comparable Pharmacy sales + 1.1% + 6.8% Prescriptions + 5.5% + 6.2% • Comparable scripts +6.2%, benefitting from COVID-19 vaccinations (+535 bps) ⎯ 15.6 million COVID-19 vaccinations in the quarter ⎯ Pharmacy performance aided by seasonal prescripti
Slide 13: United States – Retail
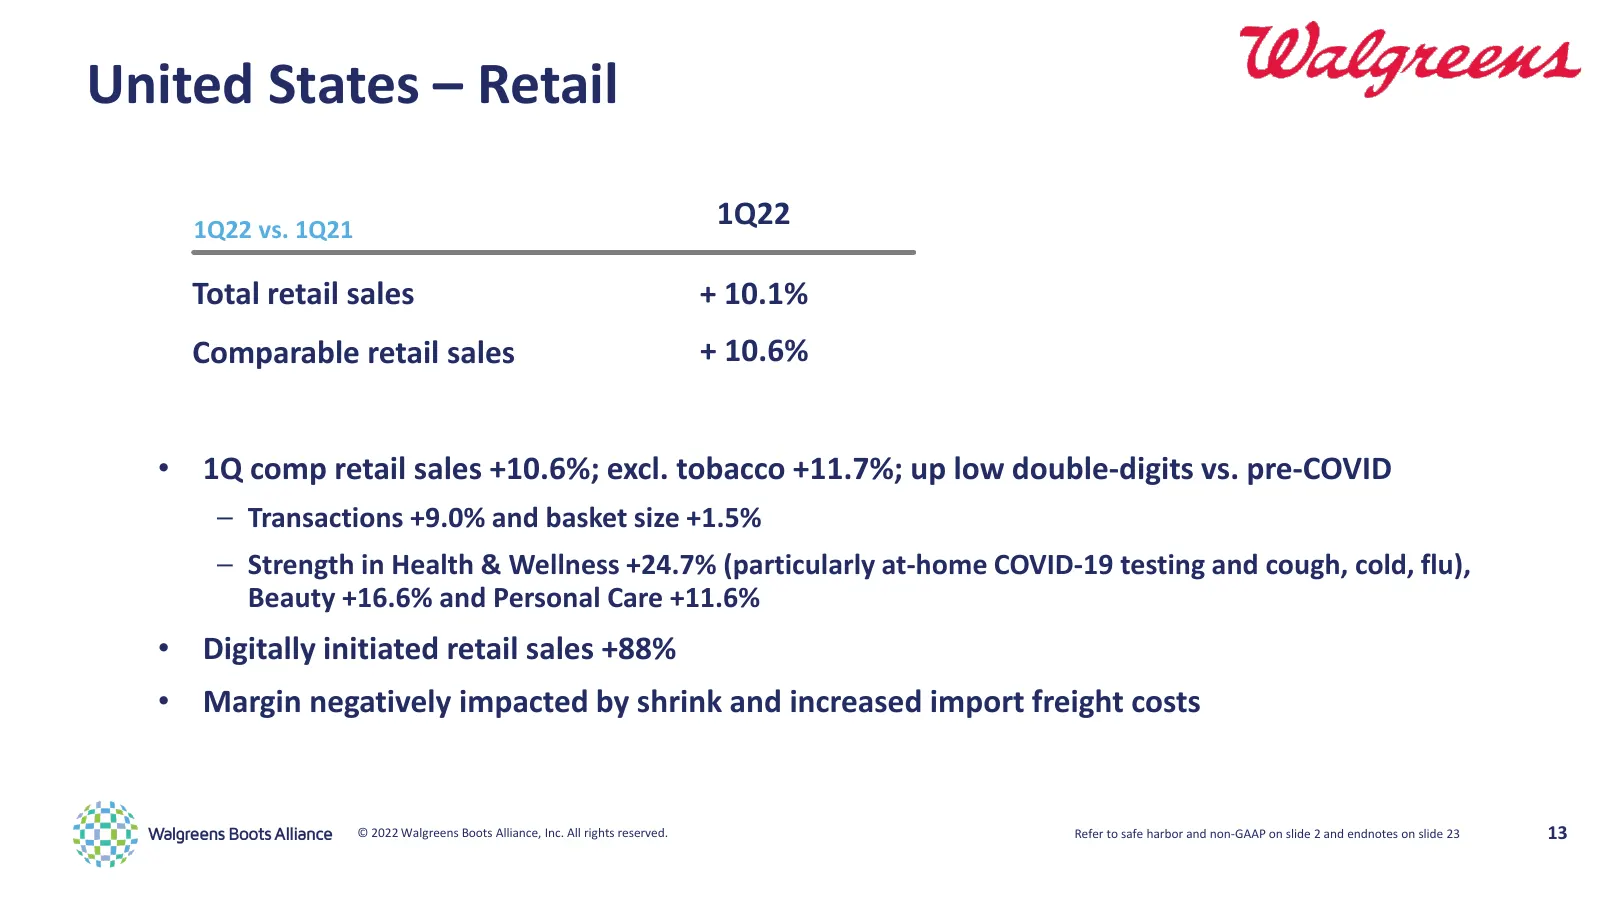
United States – Retail 1Q22 vs. 1Q21 1Q22 Total retail sales + 10.1% Comparable retail sales + 10.6% • 1Q comp retail sales +10.6%; excl. tobacco +11.7%; up low double-digits vs. pre-COVID ⎯ Transactions +9.0% and basket size +1.5% ⎯ Strength in Health & Wellness +24.7% (particularly at-home COVID-1
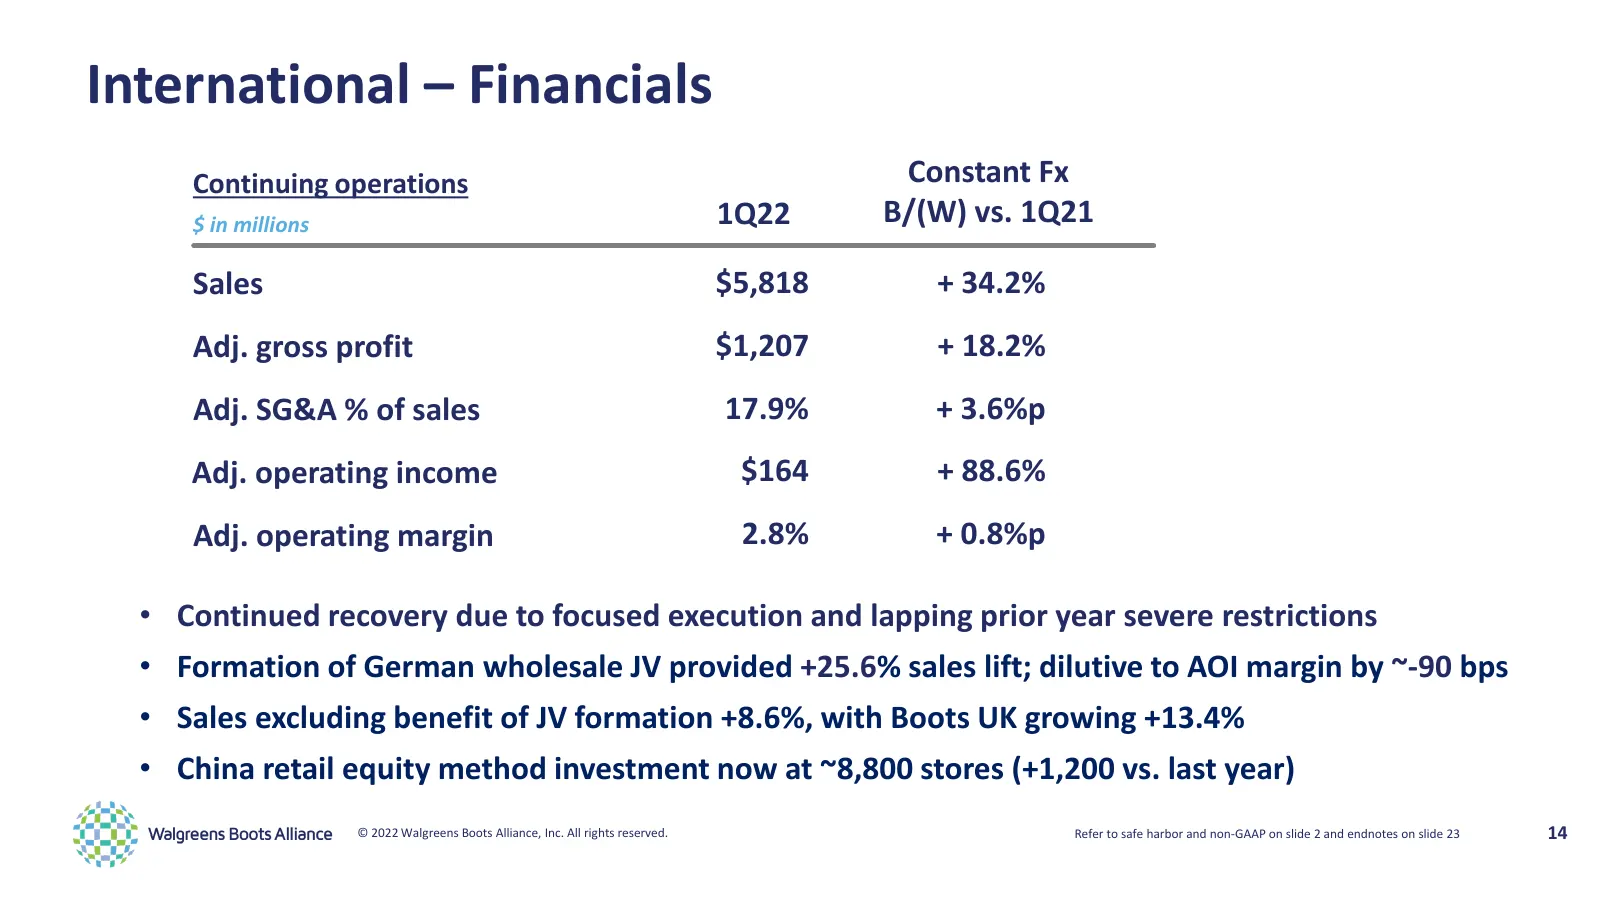
Slide 14: International – Financials
International – Financials Continuing operations Constant Fx $ in millions 1Q22 B/(W) vs. 1Q21 Sales $5,818 + 34.2% Adj. gross profit $1,207 + 18.2% Adj. SG&A % of sales 17.9% + 3.6%p Adj. operating income $164 + 88.6% Adj. operating margin 2.8% + 0.8%p • Continued recovery due to focused execution
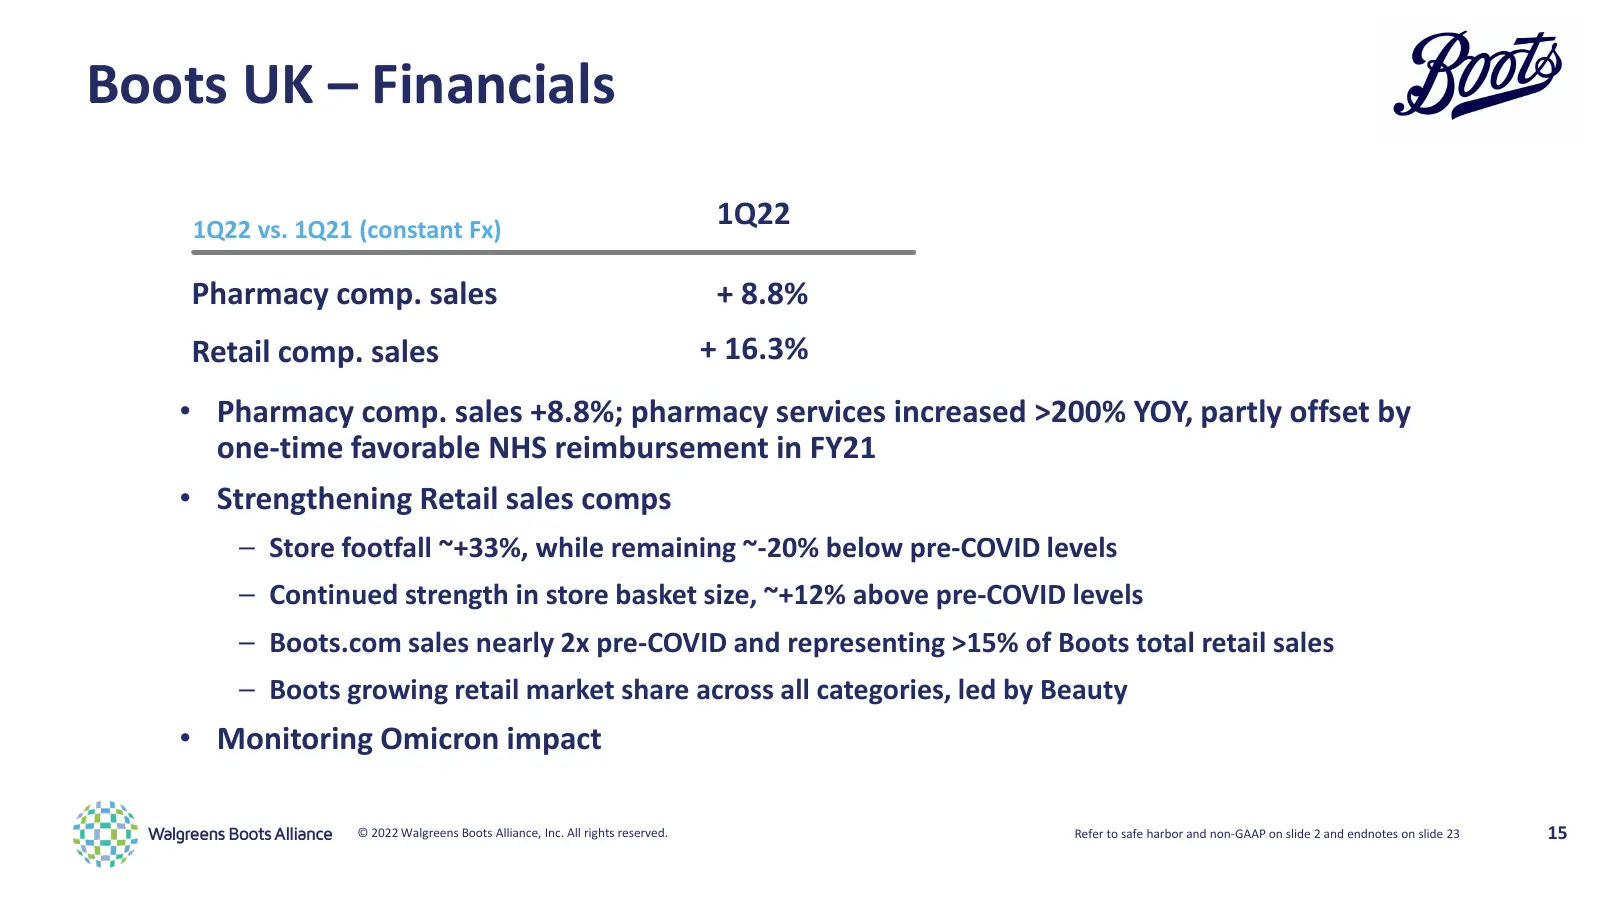
Slide 15: Boots UK – Financials
Boots UK – Financials 1Q22 vs. 1Q21 (constant Fx) 1Q22 Pharmacy comp. sales + 8.8% Retail comp. sales + 16.3% • Pharmacy comp. sales +8.8%; pharmacy services increased >200% YOY, partly offset by one-time favorable NHS reimbursement in FY21 • Strengthening Retail sales comps ⎯ Store footfall ~+33%,
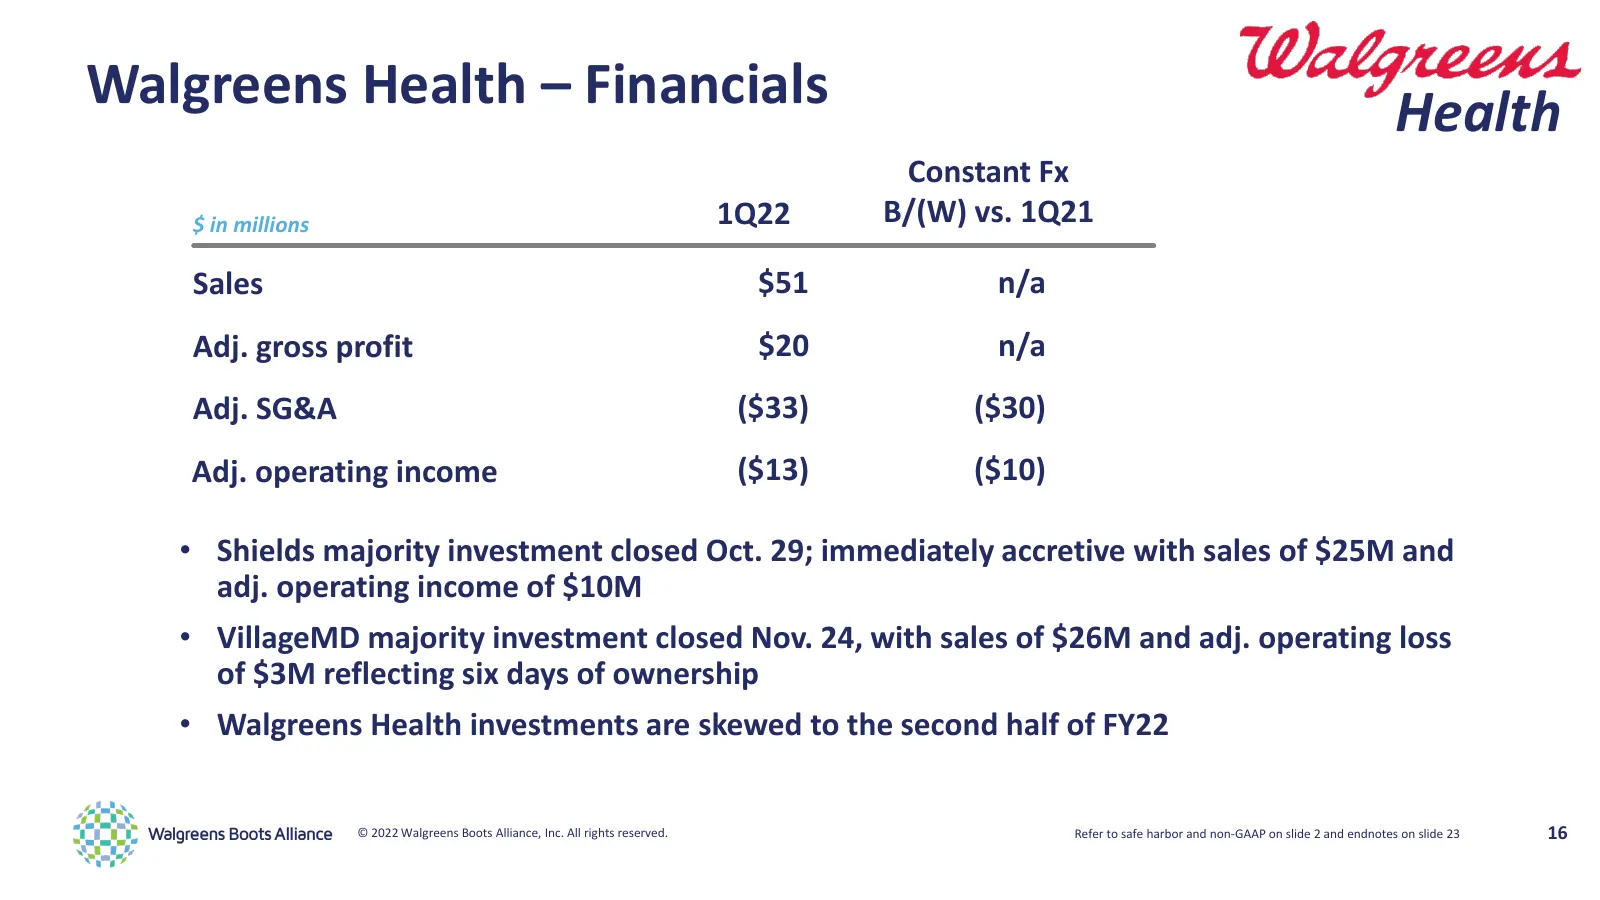
Slide 16: Walgreens Health – Financials
Walgreens Health – Financials Health Constant Fx $ in millions 1Q22 B/(W) vs. 1Q21 Sales $51 n/a Adj. gross profit $20 n/a Adj. SG&A ($33) ($30) Adj. operating income ($13) ($10) • Shields majority investment closed Oct. 29; immediately accretive with sales of $25M and adj. operating income of $10M
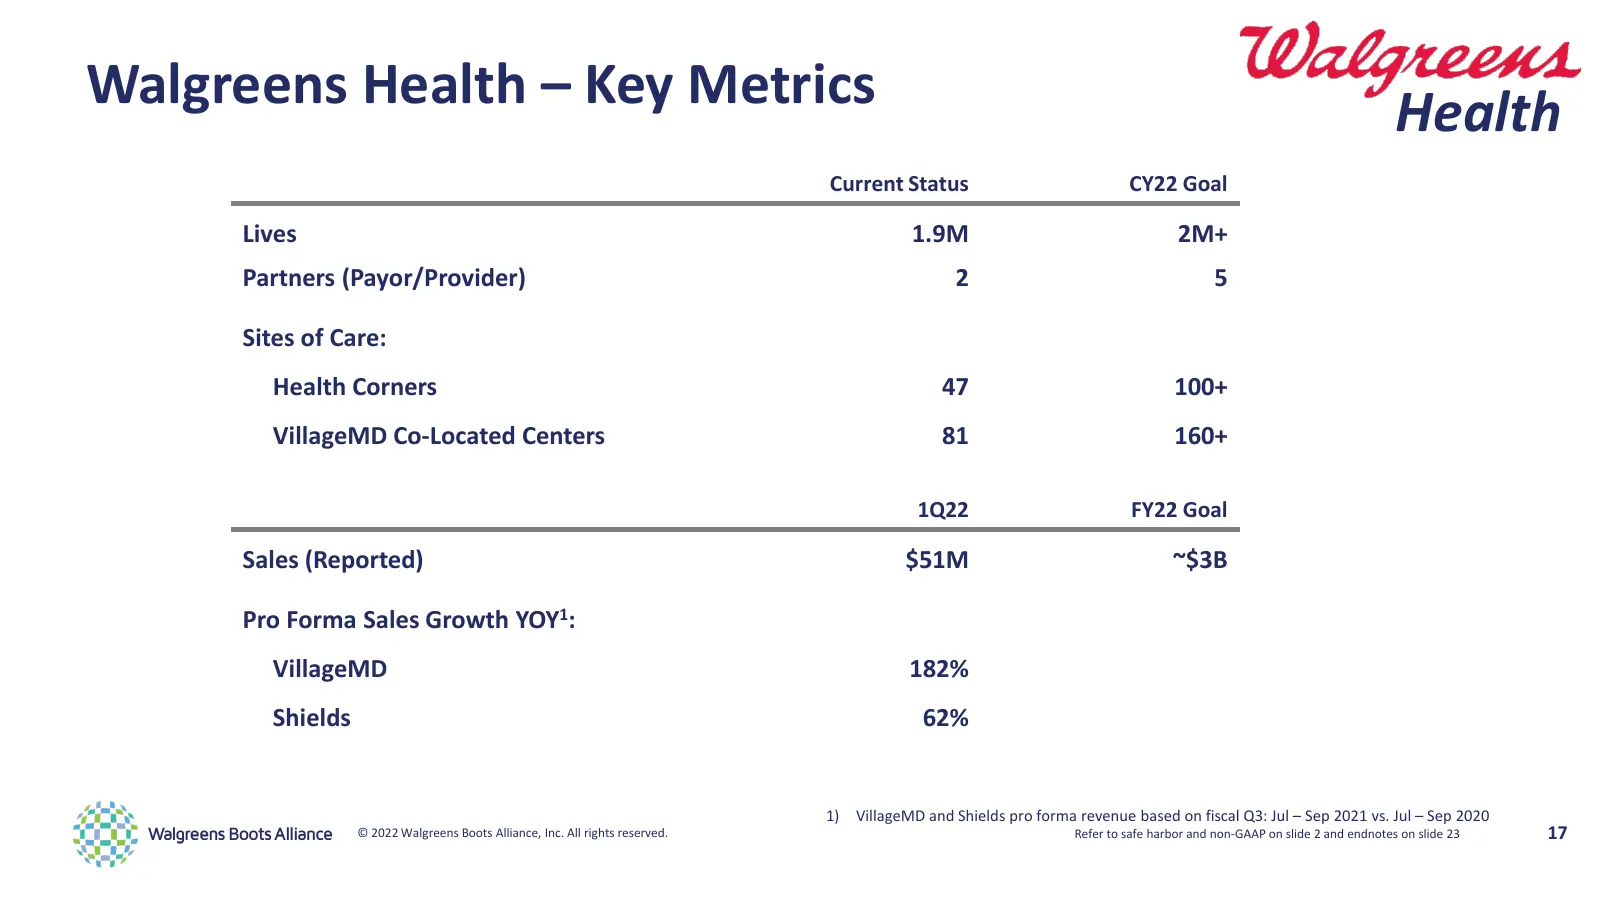
Slide 17: Walgreens Health – Key Metrics
Walgreens Health – Key Metrics Health Current Status CY22 Goal Lives 1.9M 2M+ Partners (Payor/Provider) 2 5 Sites of Care: Health Corners 47 100+ VillageMD Co-Located Centers 81 160+ 1Q22 FY22 Goal Sales (Reported) $51M ~$3B Pro Forma Sales Growth YOY1: VillageMD 182% Shields 62% 1) VillageMD and Sh
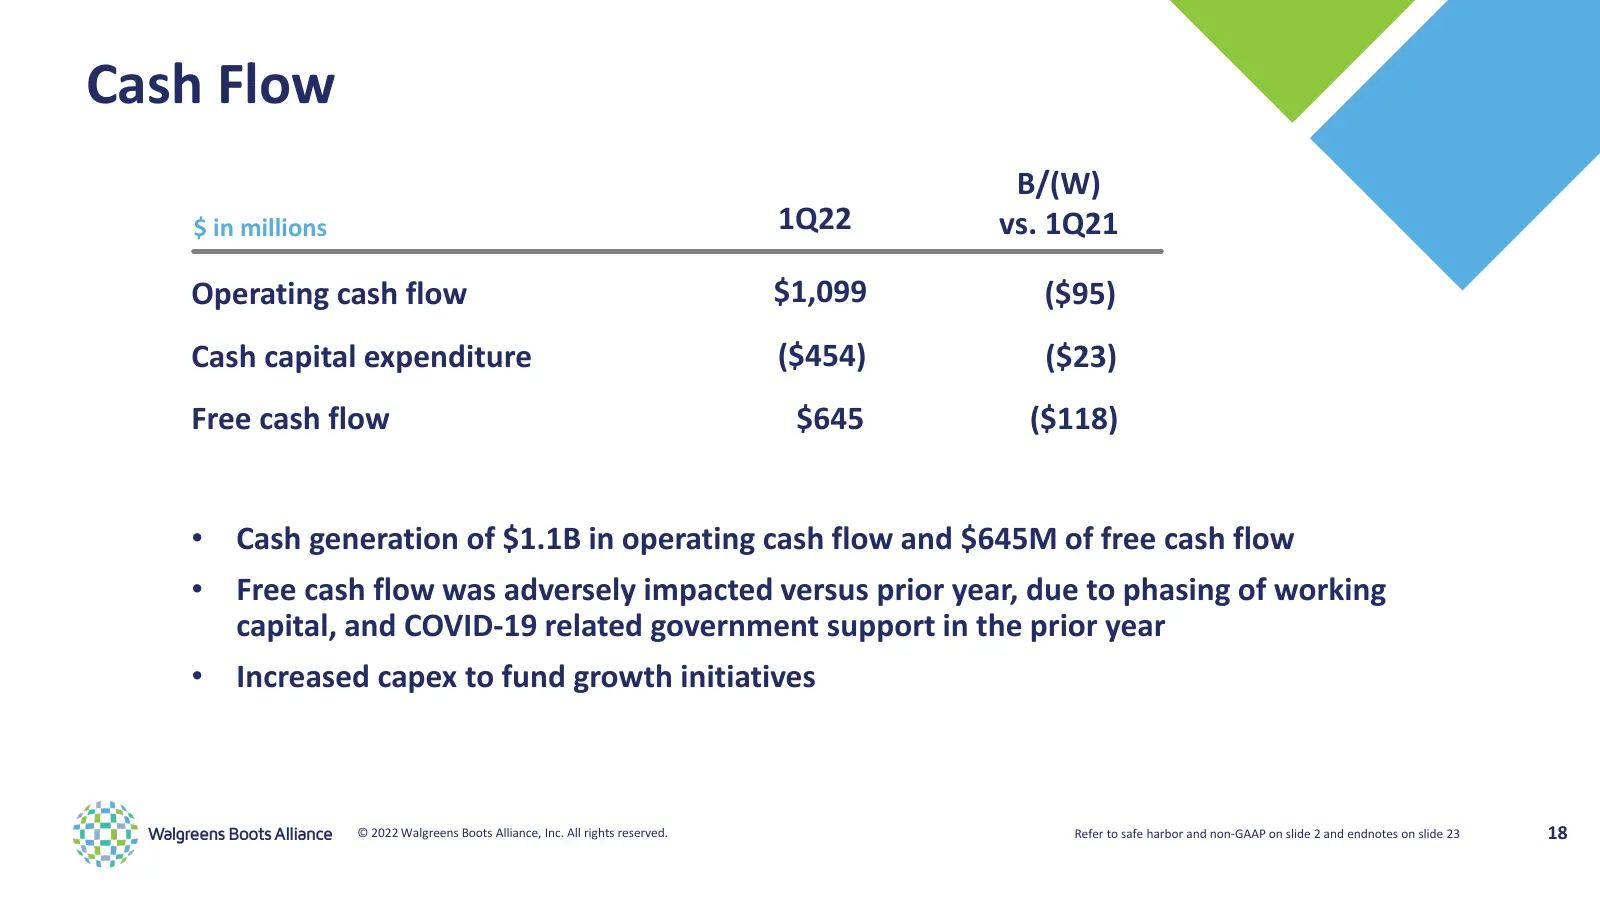
Slide 18: Cash Flow
Cash Flow B/(W) $ in millions 1Q22 vs. 1Q21 Operating cash flow $1,099 ($95) Cash capital expenditure ($454) ($23) Free cash flow $645 ($118) • Cash generation of $1.1B in operating cash flow and $645M of free cash flow • Free cash flow was adversely impacted versus prior year, due to phasing of wor
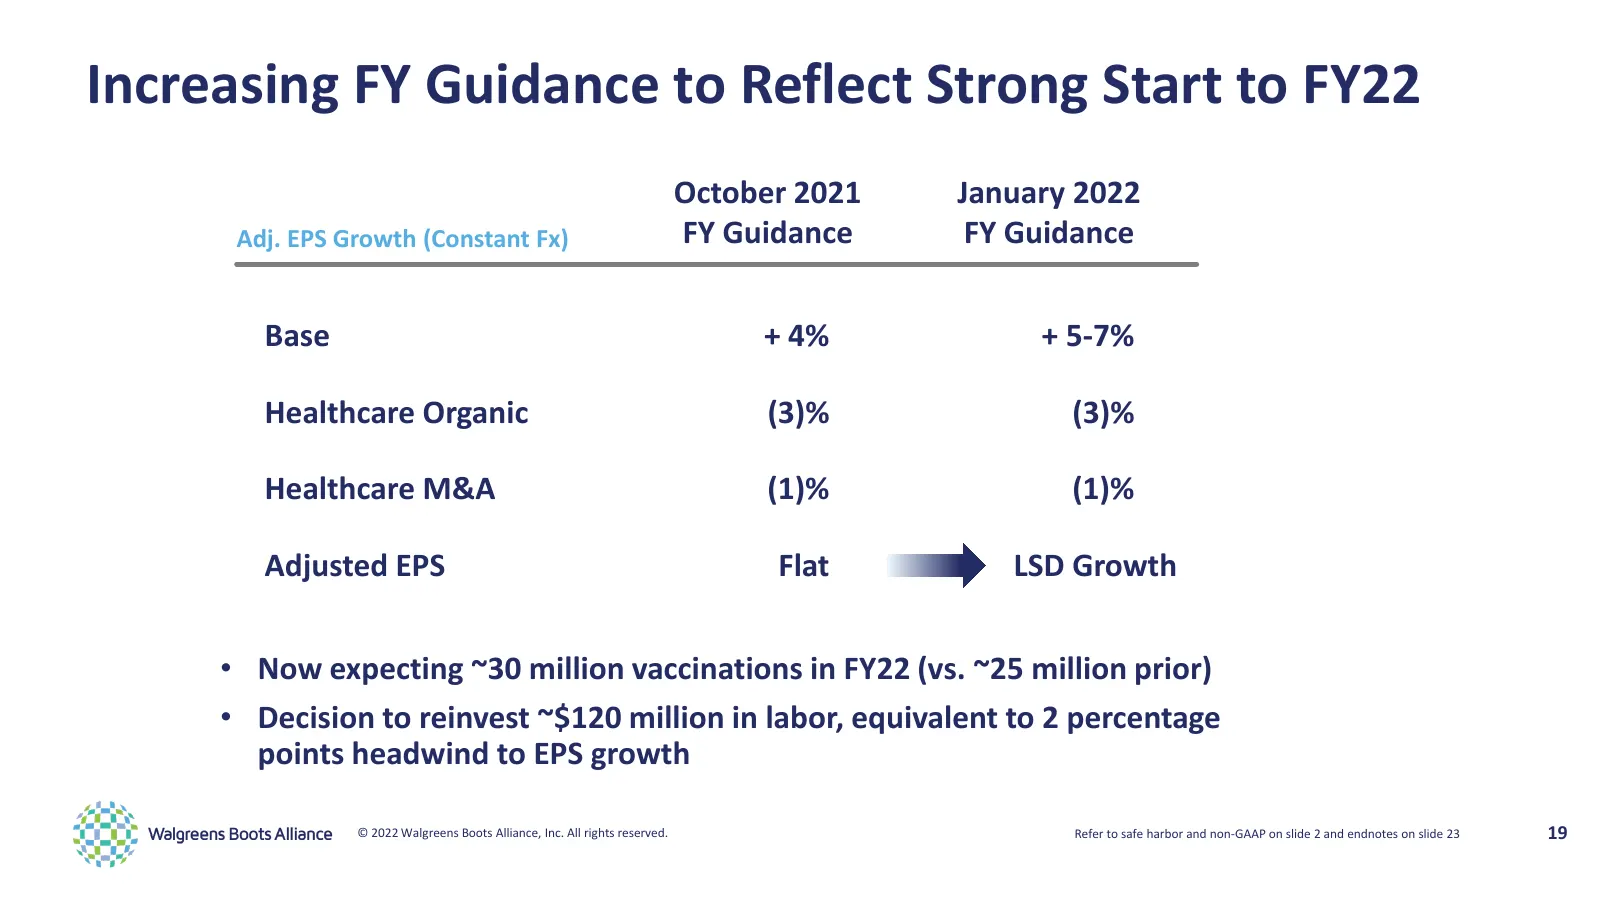
Slide 19: Increasing FY Guidance to Reflect Strong Start to FY22
Increasing FY Guidance to Reflect Strong Start to FY22 October 2021 January 2022 Adj. EPS Growth (Constant Fx) FY Guidance FY Guidance Base + 4% + 5-7% Healthcare Organic (3)% (3)% Healthcare M&A (1)% (1)% Adjusted EPS Flat LSD Growth • Now expecting ~30 million vaccinations in FY22 (vs. ~25 million
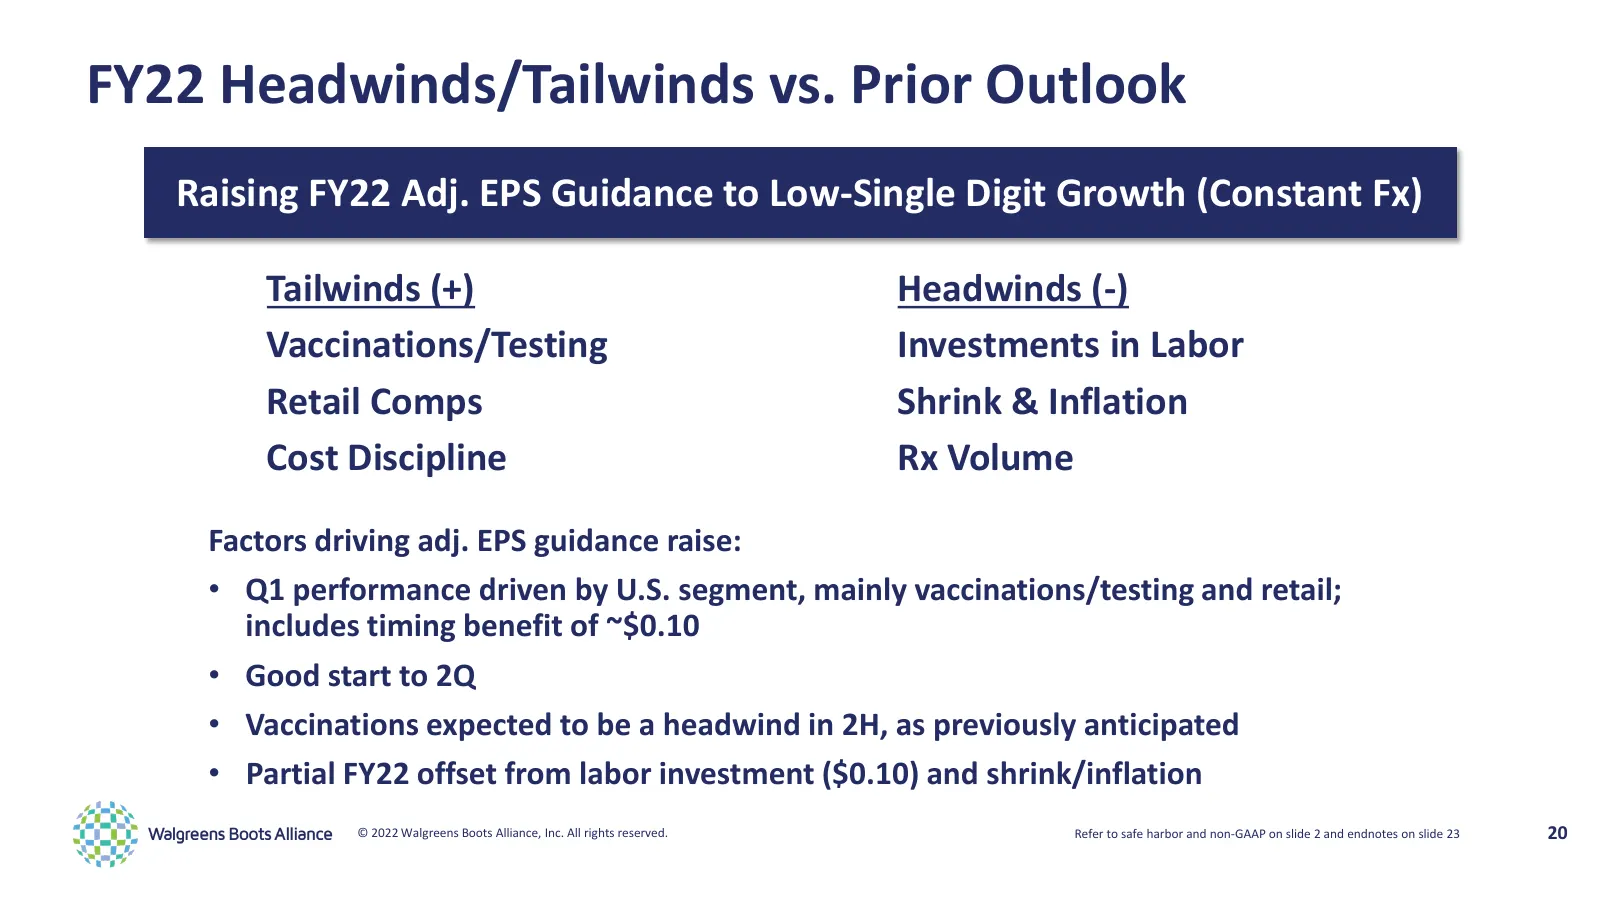
Slide 20: FY22 Headwinds/Tailwinds vs. Prior Outlook
FY22 Headwinds/Tailwinds vs. Prior Outlook Raising FY22 Adj. EPS Guidance to Low-Single Digit Growth (Constant Fx) Tailwinds (+) Headwinds (-) Vaccinations/Testing Investments in Labor Retail Comps Shrink & Inflation Cost Discipline Rx Volume Factors driving adj. EPS guidance raise: • Q1 performance
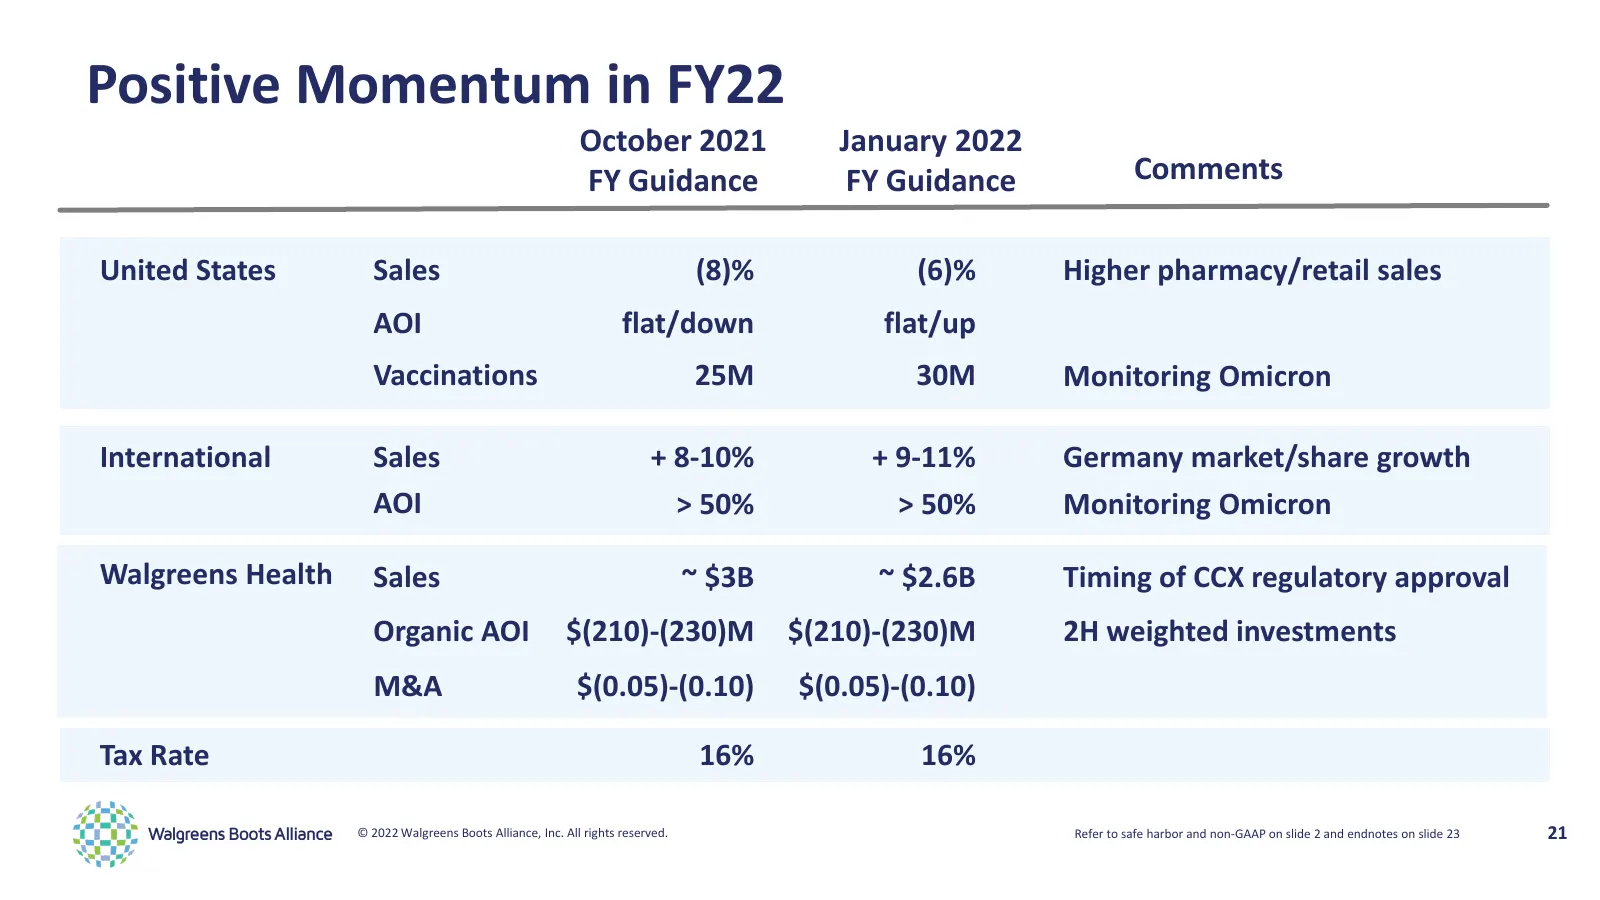
Slide 21: Positive Momentum in FY22
Positive Momentum in FY22 October 2021 January 2022 FY Guidance FY Guidance Comments United States Sales (8)% (6)% Higher pharmacy/retail sales AOI flat/down flat/up Vaccinations 25M 30M Monitoring Omicron International Sales + 8-10% + 9-11% Germany market/share growth AOI > 50% > 50% Monitoring Omi
Slide 22: Takeaways
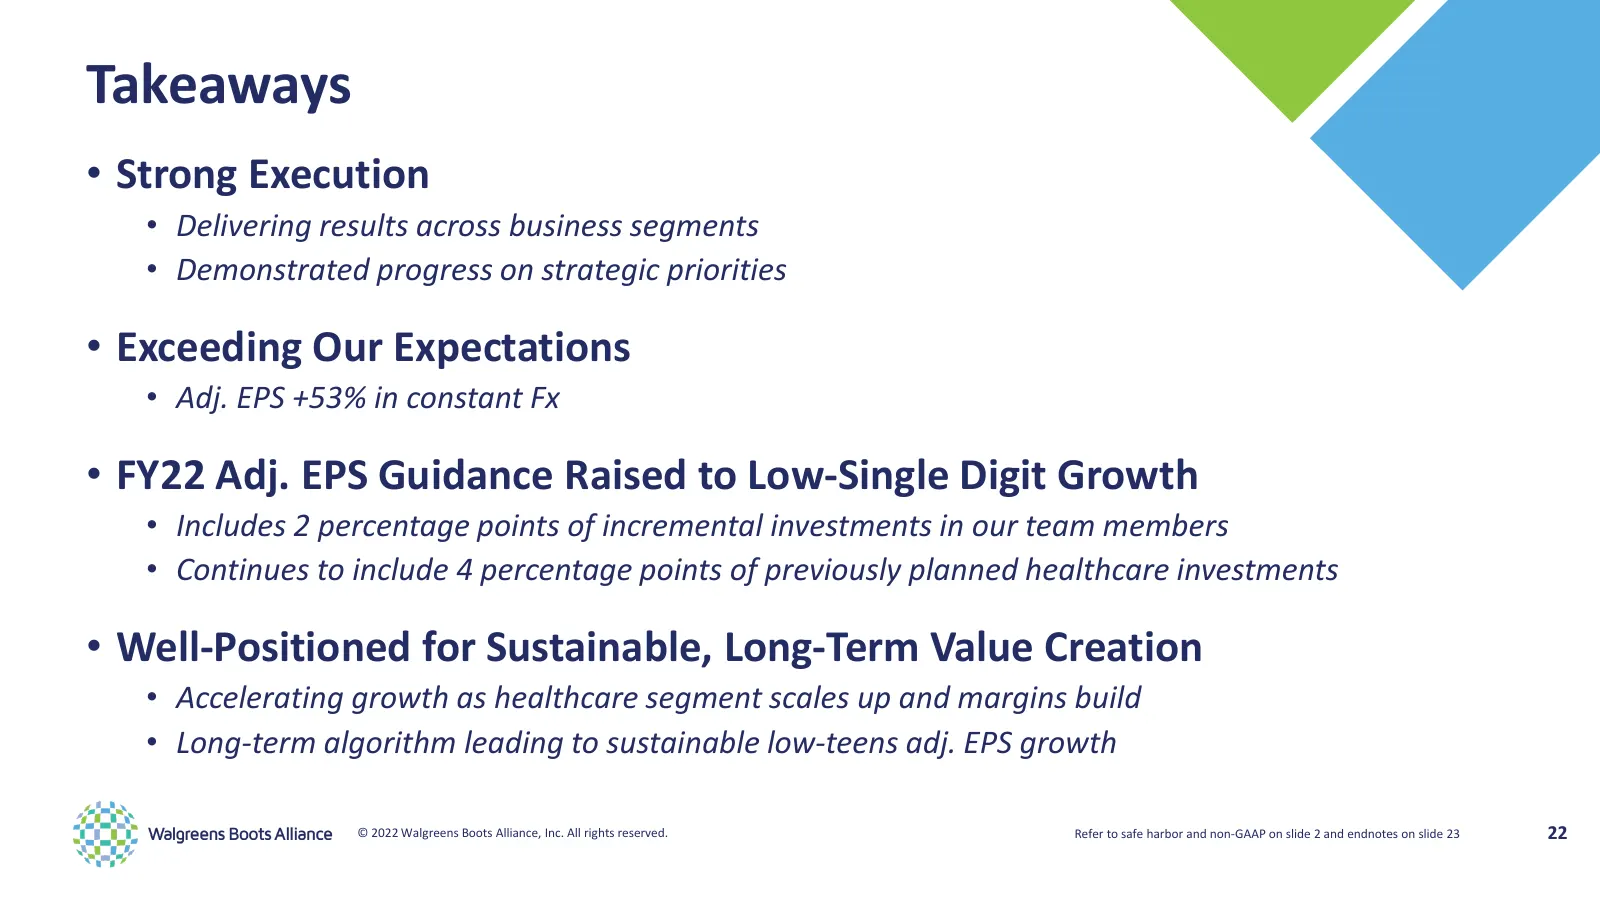
Takeaways • Strong Execution • Delivering results across business segments • Demonstrated progress on strategic priorities • Exceeding Our Expectations • Adj. EPS +53% in constant Fx • FY22 Adj. EPS Guidance Raised to Low-Single Digit Growth • Includes 2 percentage points of incremental investments
Slide 23: Endnotes
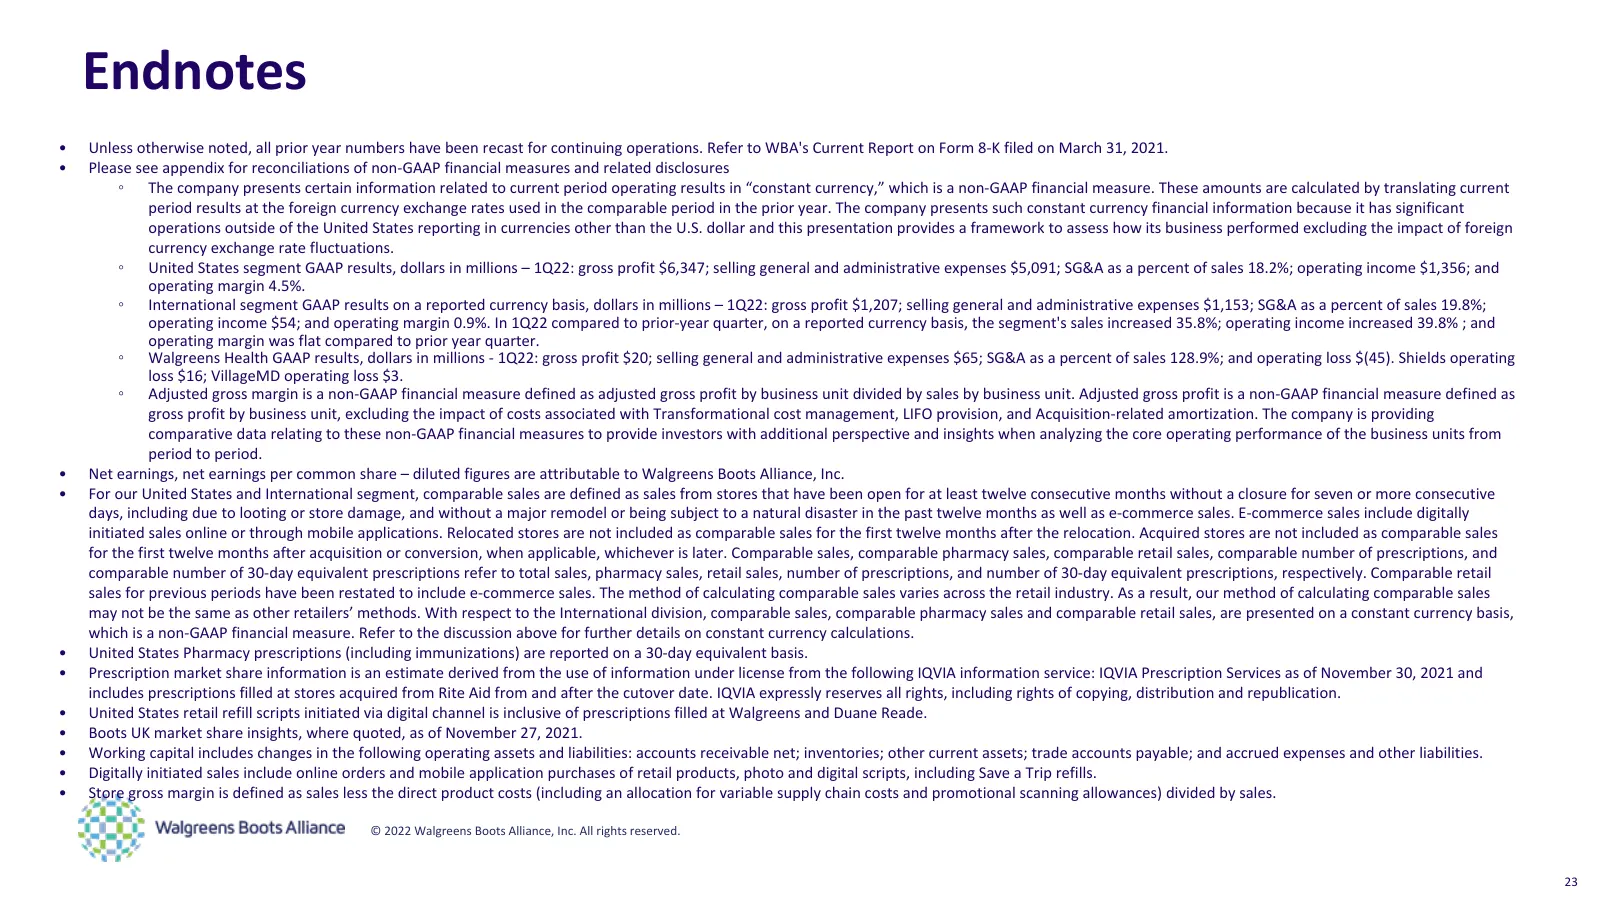
Endnotes • Unless otherwise noted, all prior year numbers have been recast for continuing operations. Refer to WBA's Current Report on Form 8-K filed on March 31, 2021. • Please see appendix for reconciliations of non-GAAP financial measures and related disclosures ◦ The company presents certain inf
Slide 24: Appendix
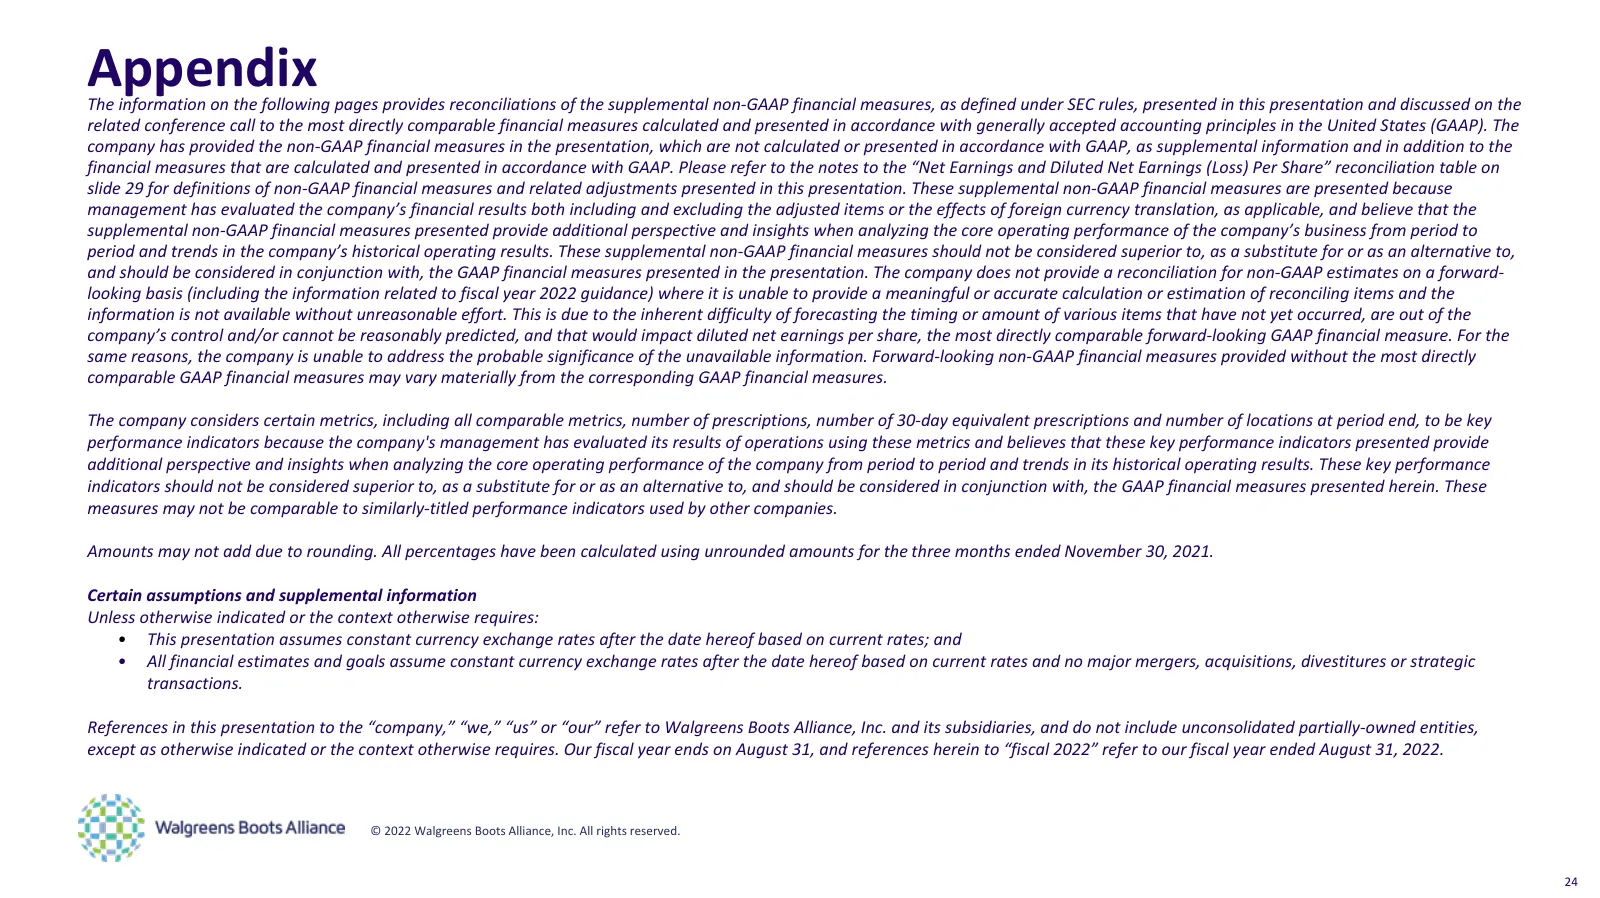
Appendix The information on the following pages provides reconciliations of the supplemental non-GAAP financial measures, as defined under SEC rules, presented in this presentation and discussed on the related conference call to the most directly comparable financial measures calculated and presente
Slide 25: Reconciliation of Non-GAAP financial measures
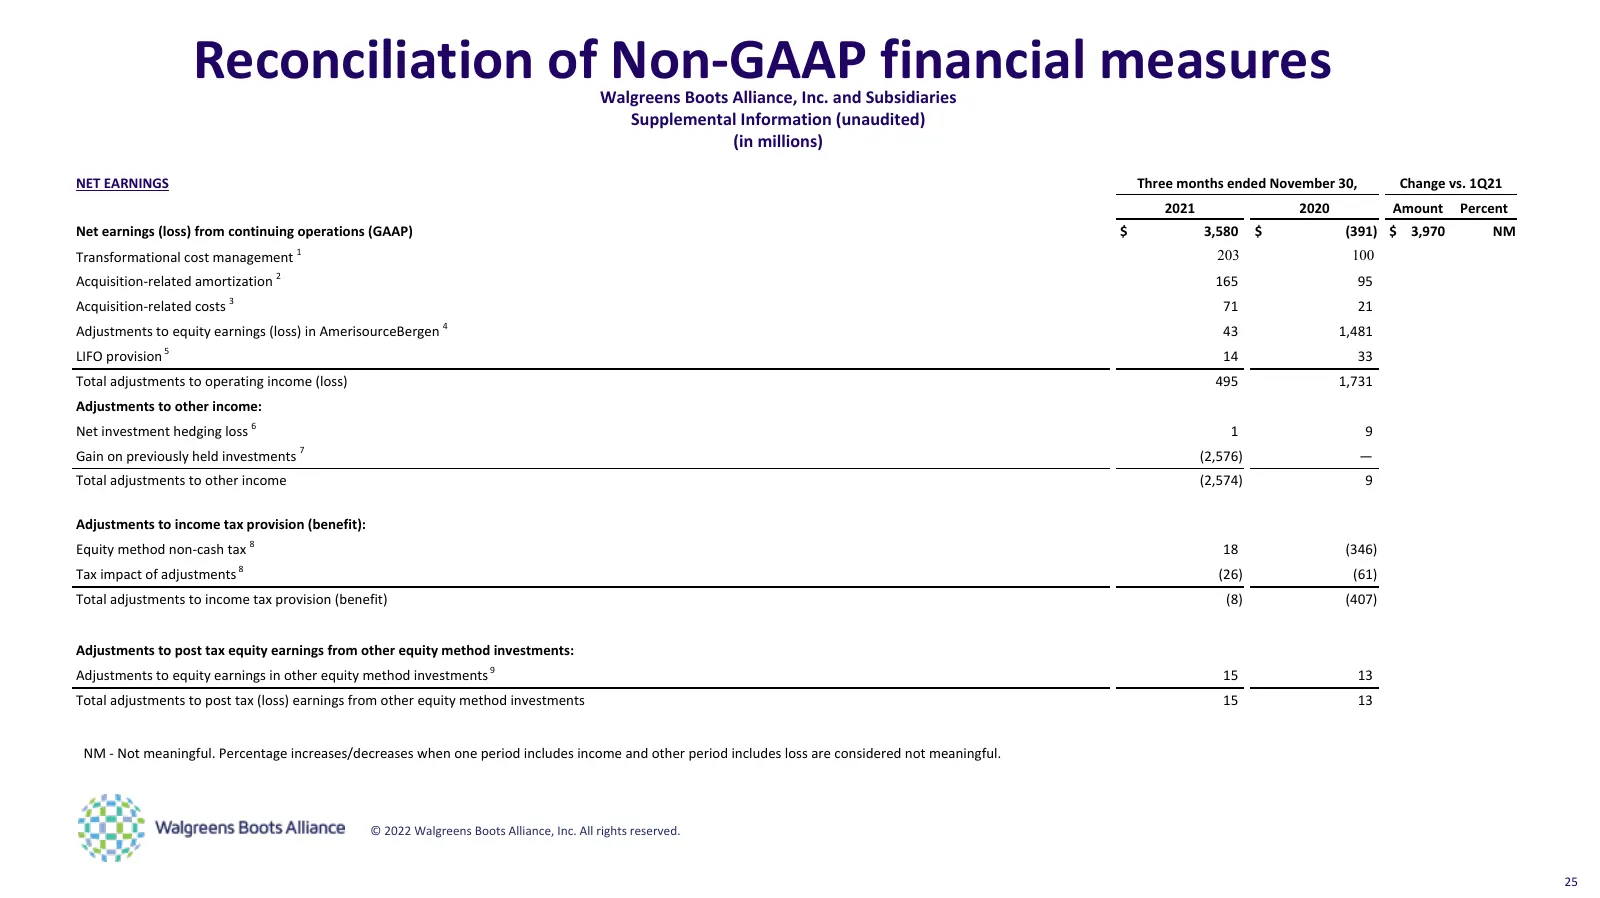
Reconciliation of Non-GAAP financial measures Walgreens Boots Alliance, Inc. and Subsidiaries Supplemental Information (unaudited) (in millions) NET EARNINGS Three months ended November 30, Change vs. 1Q21 2021 2020 Amount Percent Net earnings (loss) from continuing operations (GAAP) $ 3,580 $ (391)
Slide 26: Reconciliation of Non-GAAP financial measures
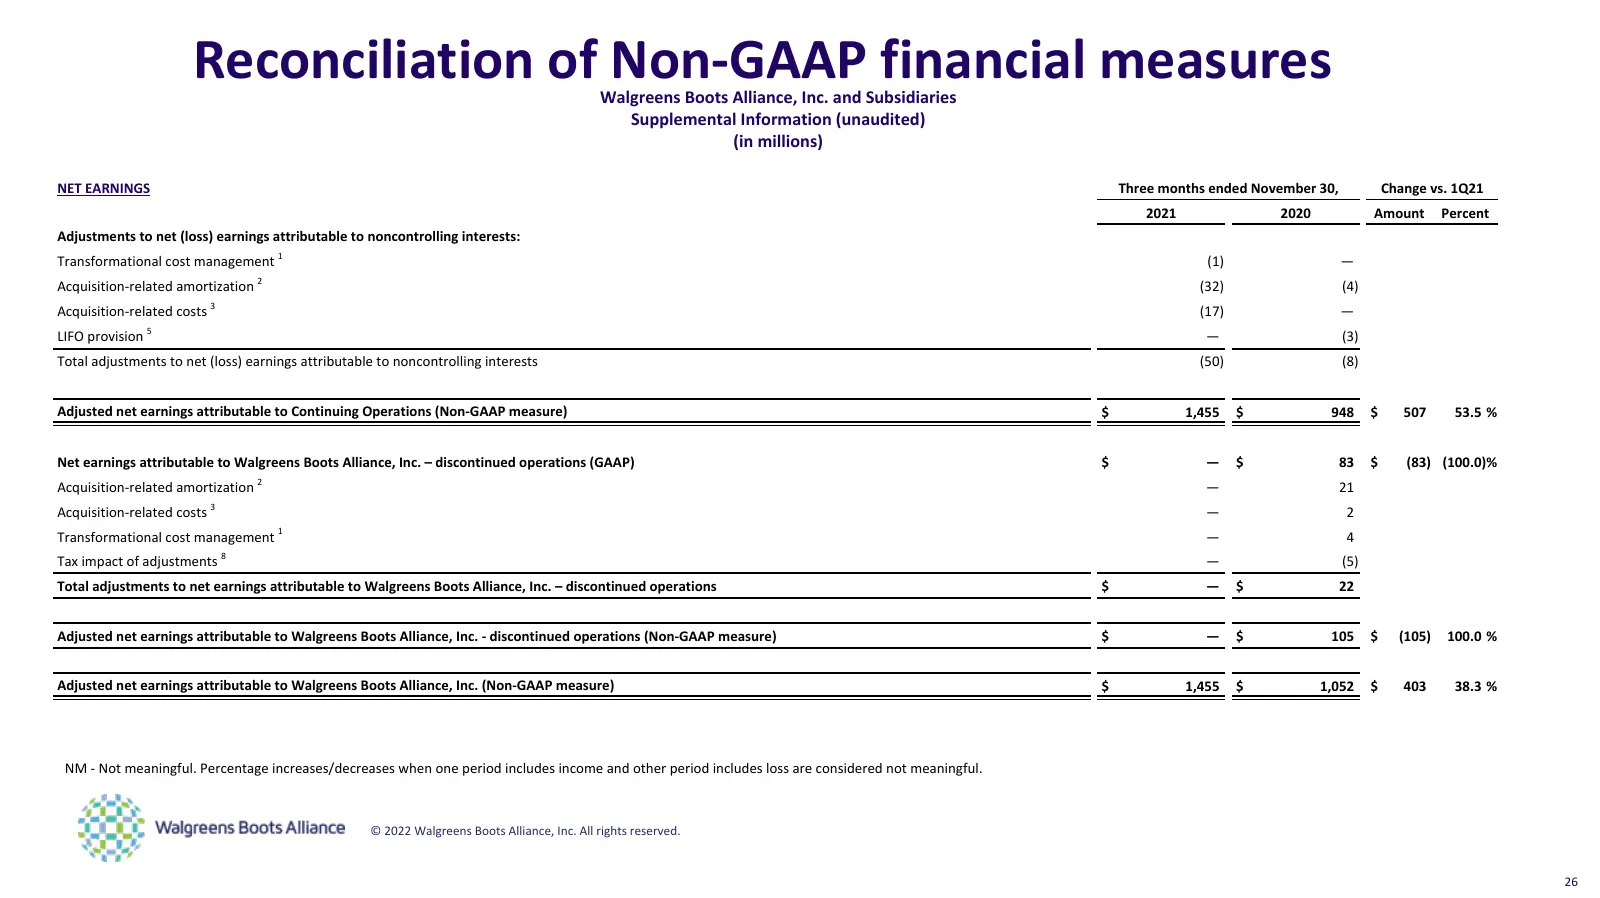
Reconciliation of Non-GAAP financial measures Walgreens Boots Alliance, Inc. and Subsidiaries Supplemental Information (unaudited) (in millions) NET EARNINGS Three months ended November 30, Change vs. 1Q21 2021 2020 Amount Percent Adjustments to net (loss) earnings attributable to noncontrolling int
Slide 27: Reconciliation of Non-GAAP financial measures
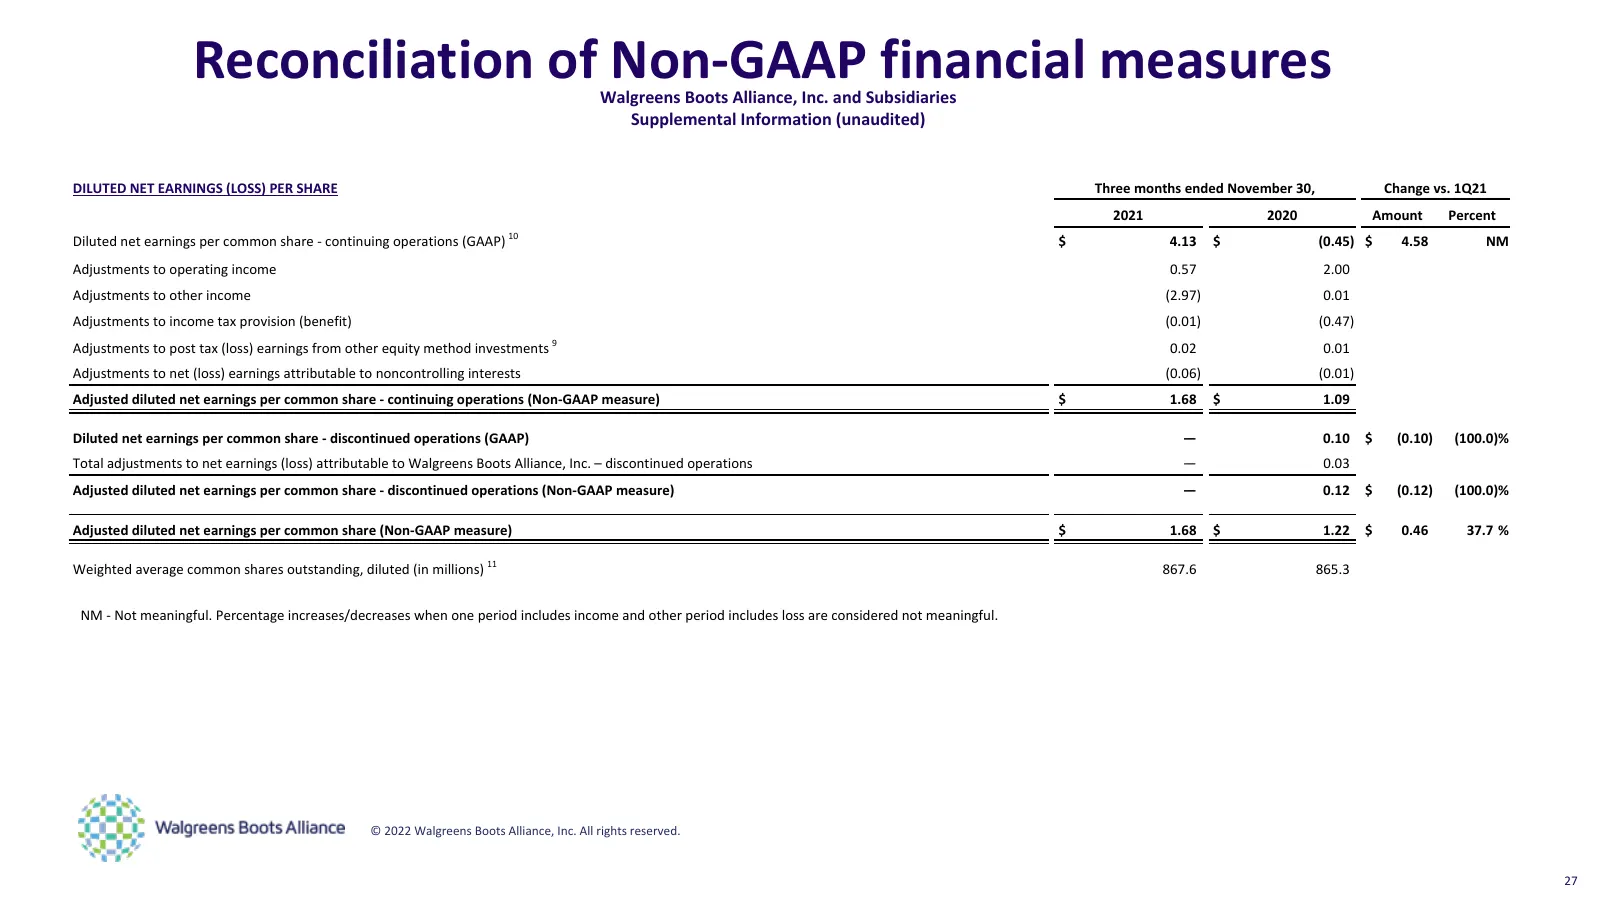
Reconciliation of Non-GAAP financial measures Walgreens Boots Alliance, Inc. and Subsidiaries Supplemental Information (unaudited) DILUTED NET EARNINGS (LOSS) PER SHARE Three months ended November 30, Change vs. 1Q21 2021 2020 Amount Percent 10 Diluted net earnings per common share - continuing oper
Slide 28: Reconciliation of Non-GAAP financial measures
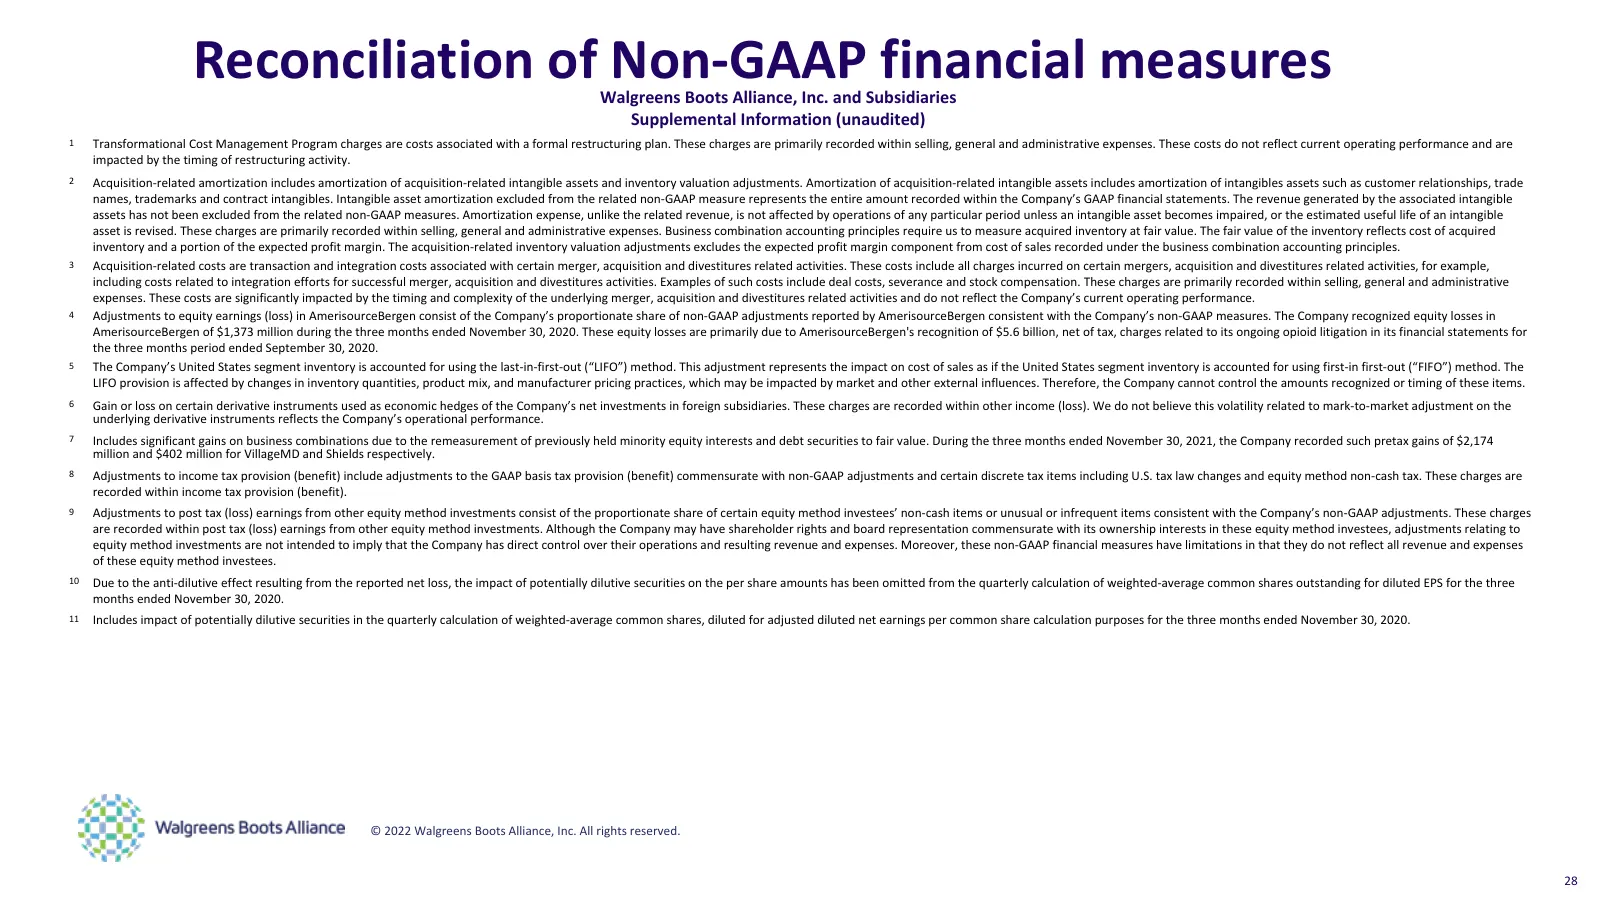
Reconciliation of Non-GAAP financial measures Walgreens Boots Alliance, Inc. and Subsidiaries Supplemental Information (unaudited) 1 Transformational Cost Management Program charges are costs associated with a formal restructuring plan. These charges are primarily recorded within selling, general an
Slide 29: Reconciliation of Non-GAAP financial measures
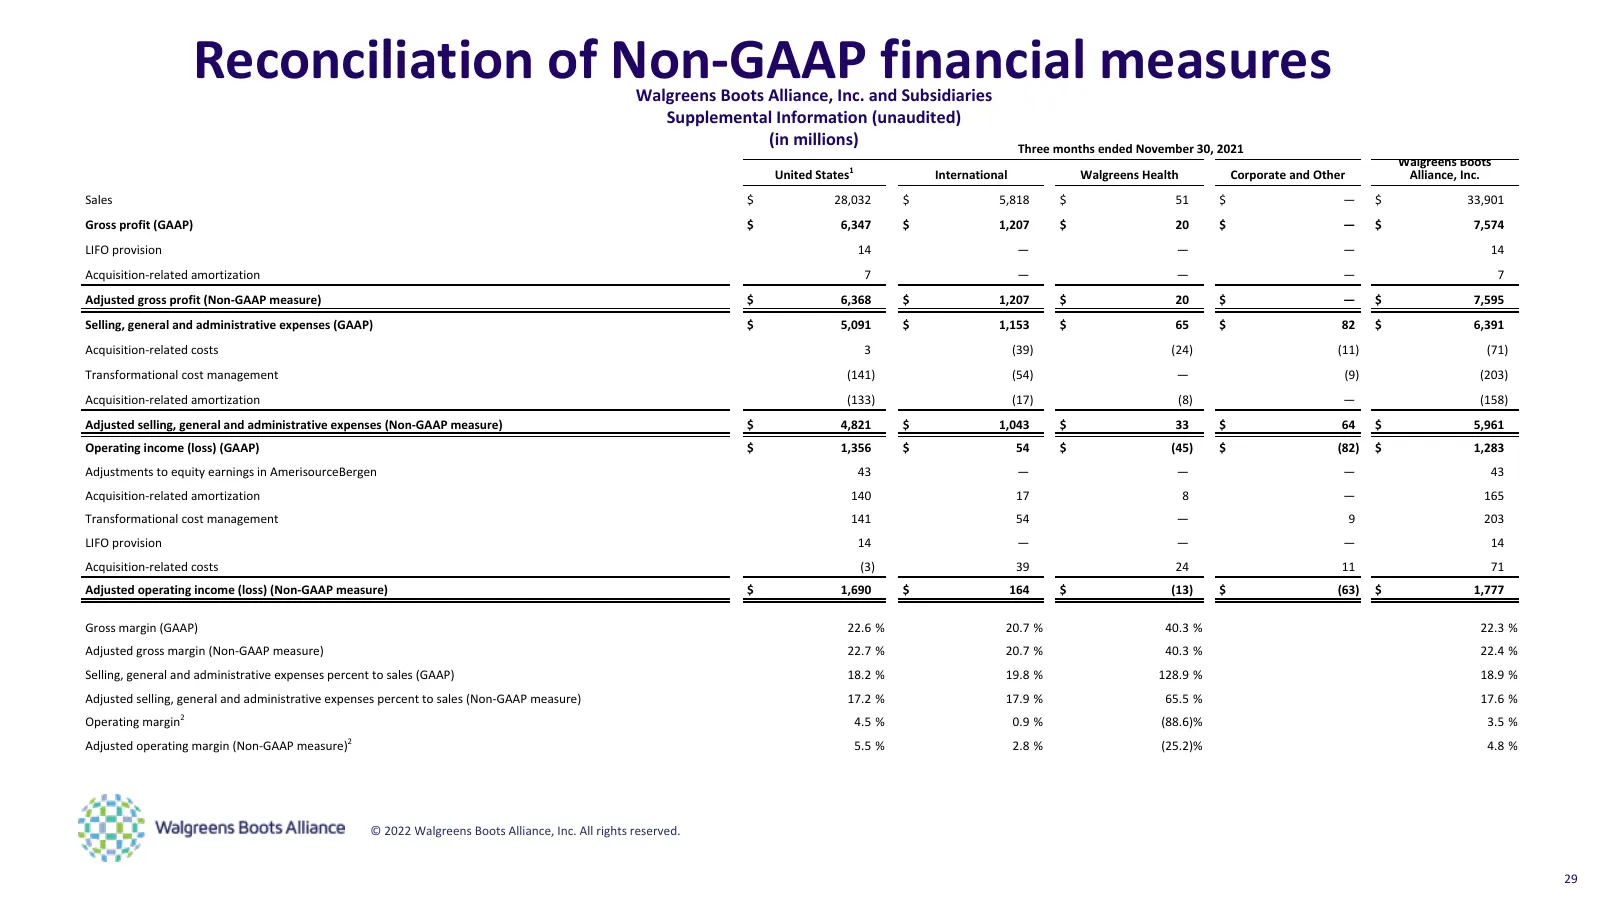
Reconciliation of Non-GAAP financial measures Walgreens Boots Alliance, Inc. and Subsidiaries Supplemental Information (unaudited) (in millions) Three months ended November 30, 2021 Walgreens Boots 1 United States International Walgreens Health Corporate and Other Alliance, Inc. Sales $ 28,032 $ 5,8
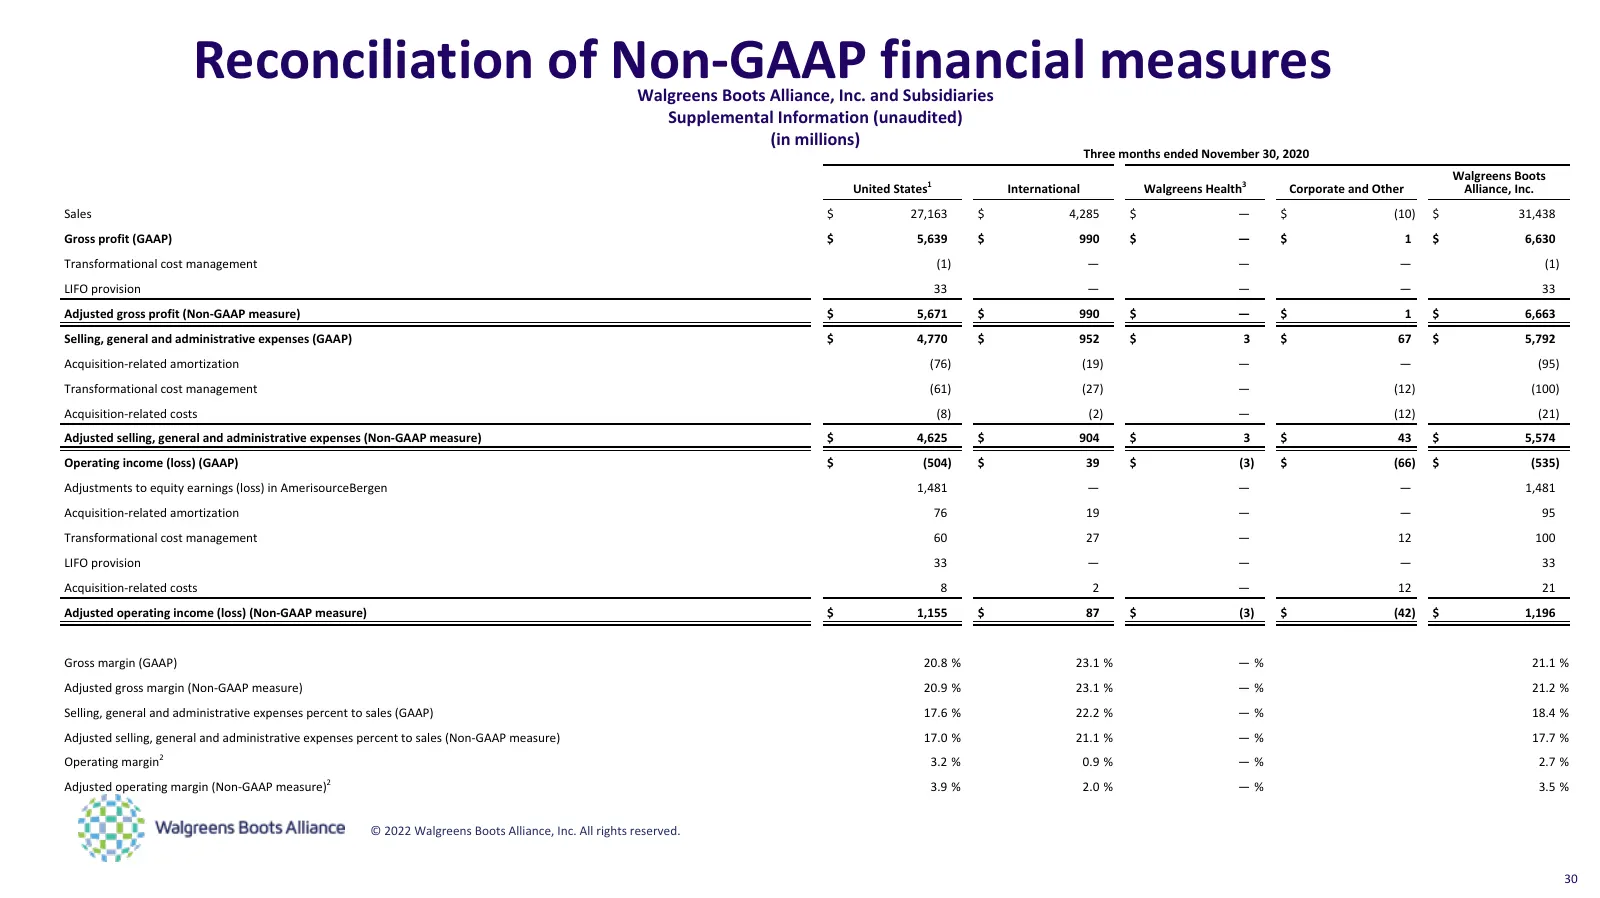
Slide 30: Reconciliation of Non-GAAP financial measures
Reconciliation of Non-GAAP financial measures Walgreens Boots Alliance, Inc. and Subsidiaries Supplemental Information (unaudited) (in millions) Three months ended November 30, 2020 Walgreens Boots United States1 International Walgreens Health3 Corporate and Other Alliance, Inc. Sales $ 27,163 $ 4,2
Slide 31: Reconciliation of Non-GAAP financial measures
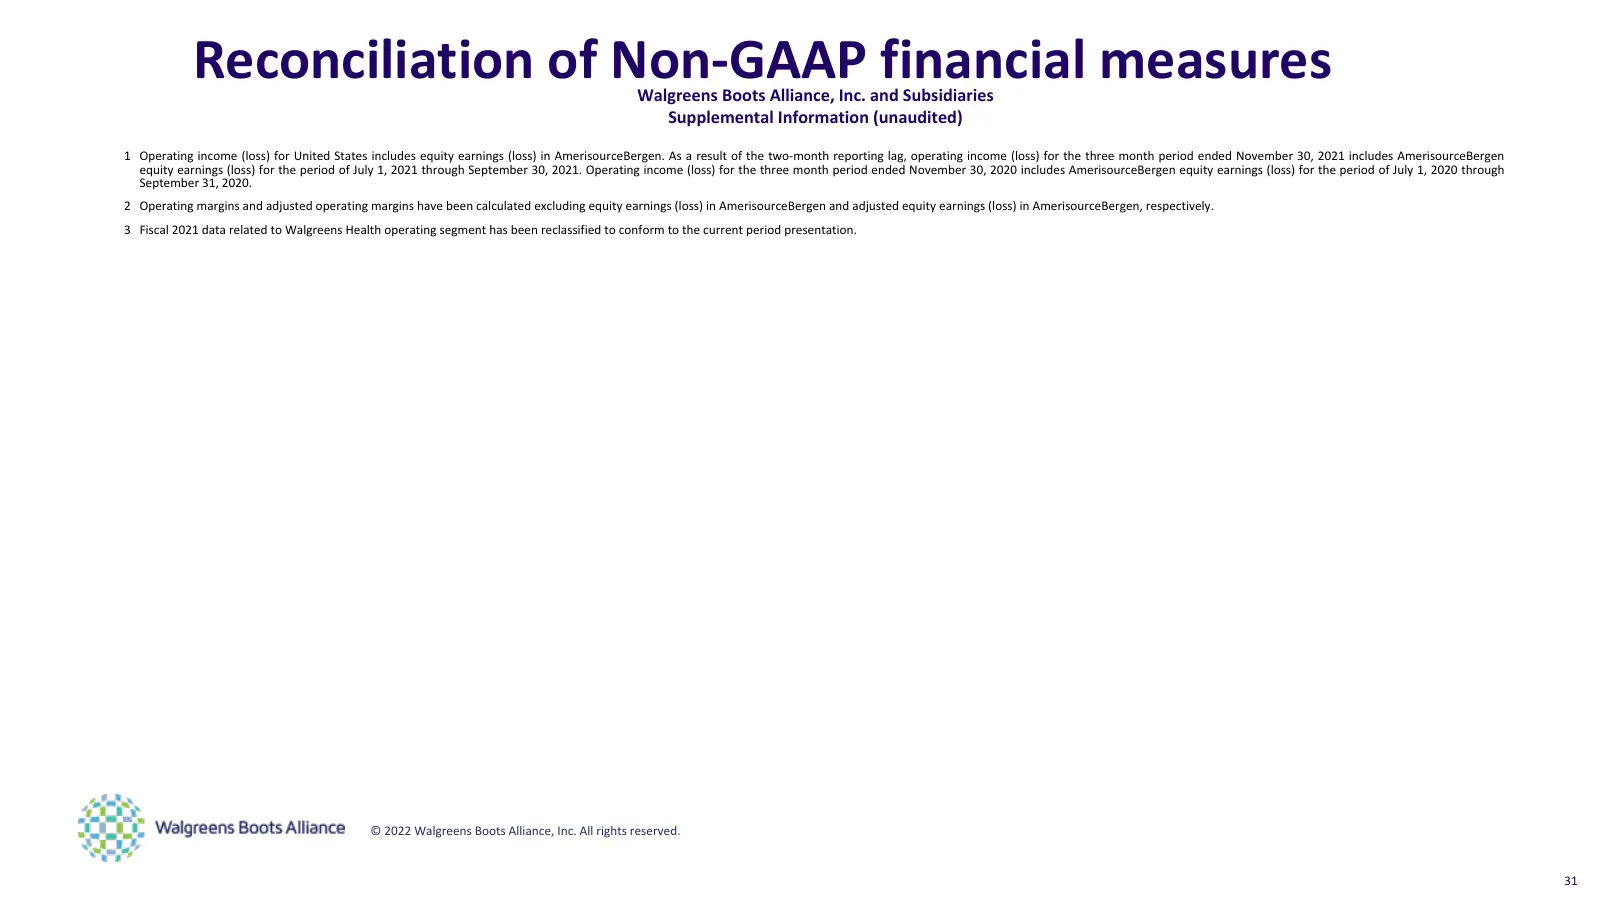
Reconciliation of Non-GAAP financial measures Walgreens Boots Alliance, Inc. and Subsidiaries Supplemental Information (unaudited) 1 Operating income (loss) for United States includes equity earnings (loss) in AmerisourceBergen. As a result of the two-month reporting lag, operating income (loss) for
Slide 32: Reconciliation of Non-GAAP financial measures
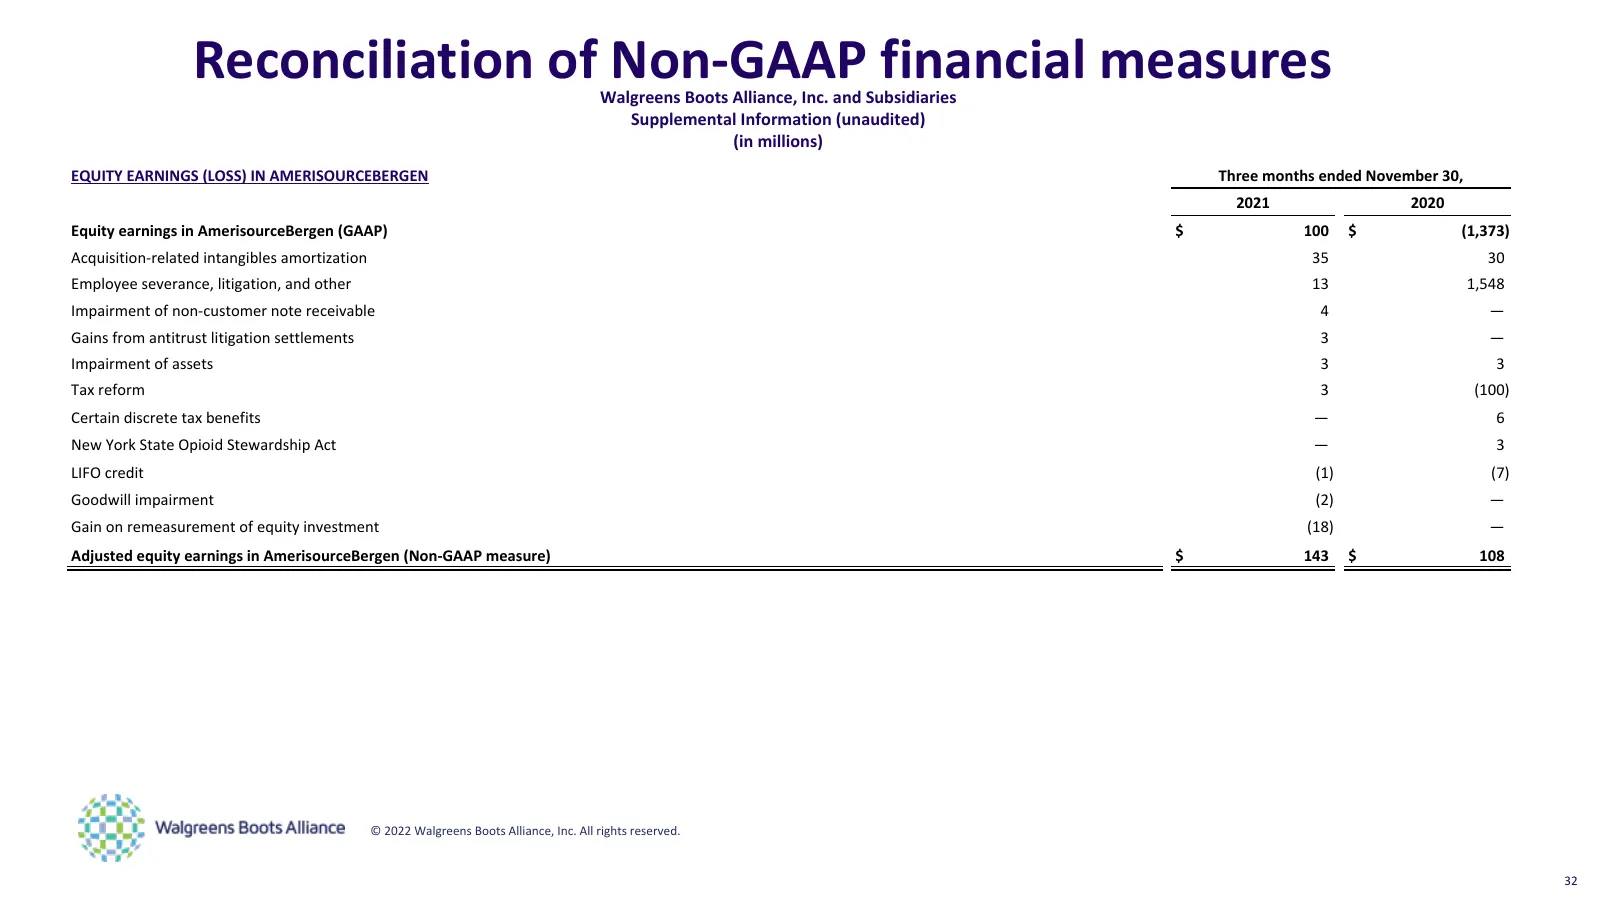
Reconciliation of Non-GAAP financial measures Walgreens Boots Alliance, Inc. and Subsidiaries Supplemental Information (unaudited) (in millions) EQUITY EARNINGS (LOSS) IN AMERISOURCEBERGEN Three months ended November 30, 2021 2020 Equity earnings in AmerisourceBergen (GAAP) $ 100 $ (1,373) Acquisiti
Slide 33: Reconciliation of Non-GAAP financial measures
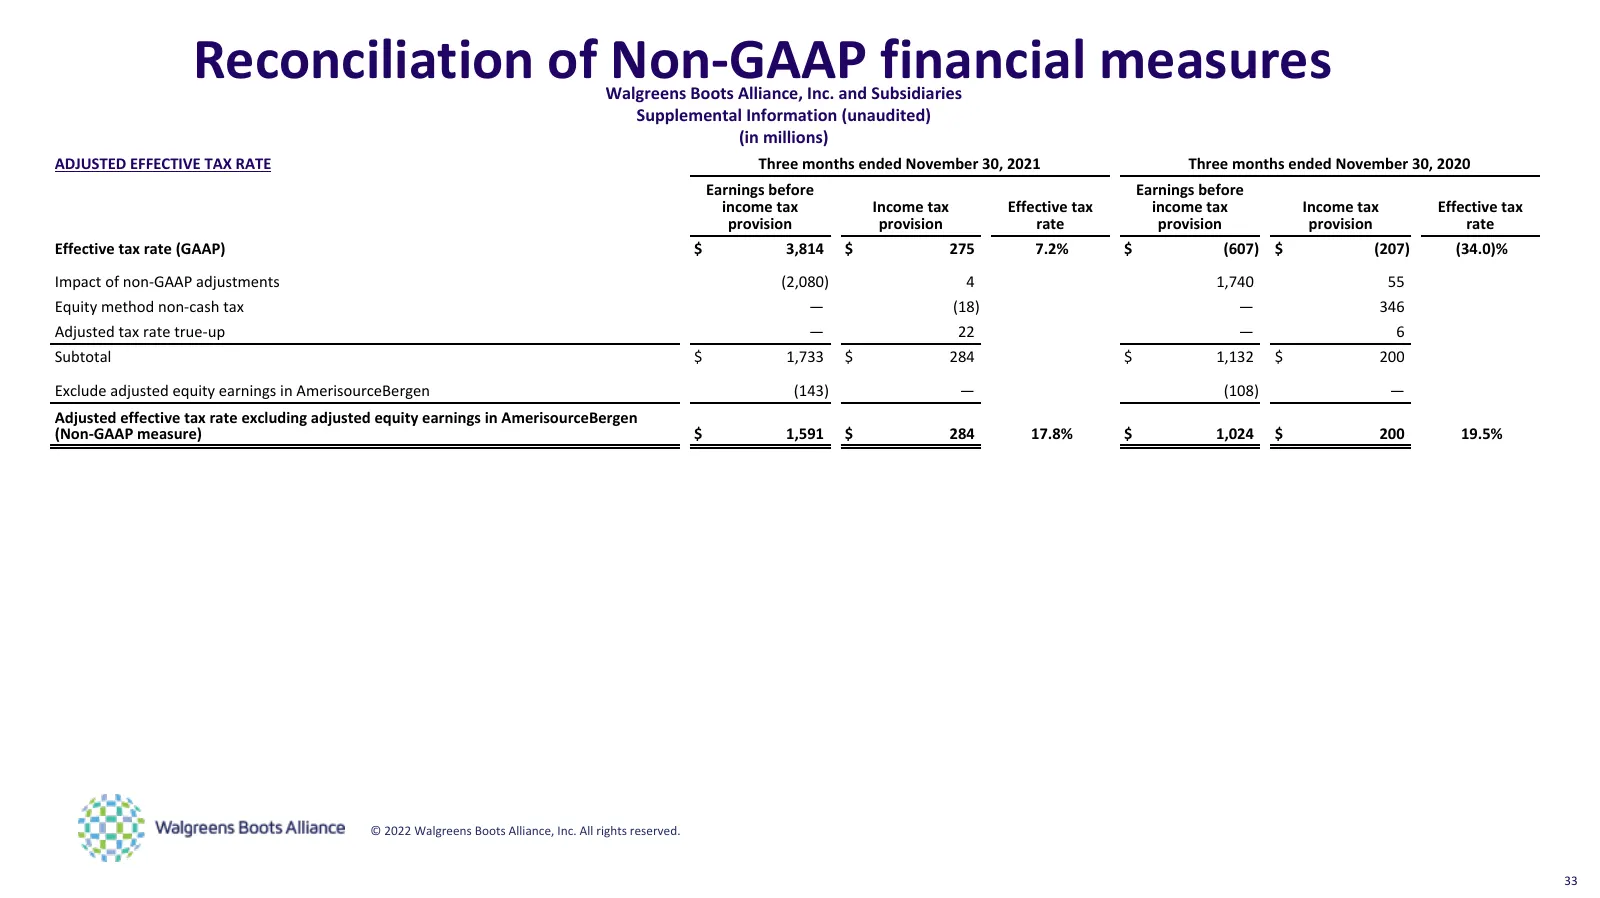
Reconciliation of Non-GAAP financial measures Walgreens Boots Alliance, Inc. and Subsidiaries Supplemental Information (unaudited) (in millions) ADJUSTED EFFECTIVE TAX RATE Three months ended November 30, 2021 Three months ended November 30, 2020 Earnings before Earnings before income tax Income tax
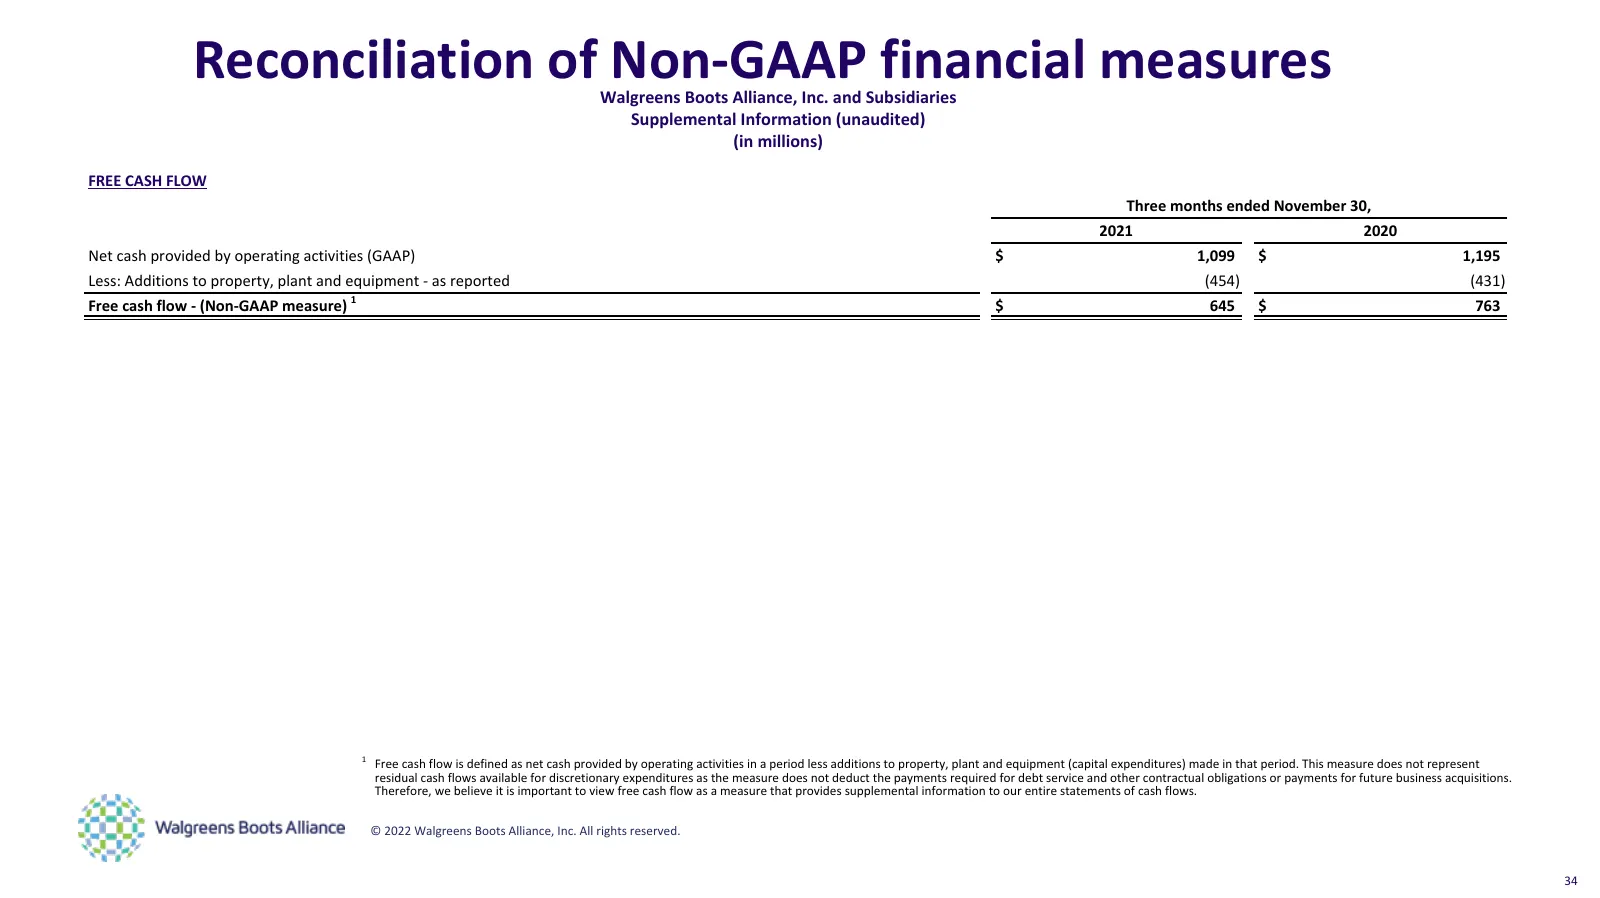
Slide 34: Reconciliation of Non-GAAP financial measures
Reconciliation of Non-GAAP financial measures Walgreens Boots Alliance, Inc. and Subsidiaries Supplemental Information (unaudited) (in millions) FREE CASH FLOW Three months ended November 30, 2021 2020 Net cash provided by operating activities (GAAP) $ 1,099 $ 1,195 Less: Additions to property, plan
Source: EarningsCall slides
More decks from Walgreens Boots Alliance Inc
 Merger or Acquisition (March 2025)10 slides · Mar 7, 2025
 Merger or Acquisition (March 2025)7 slides · Mar 7, 2025
 Merger or Acquisition (March 2025)10 slides · Mar 6, 2025
 Q1 2025 Earnings Presentation31 slides · Jan 10, 2025
 Q4 2024 Earnings Presentation43 slides · Oct 15, 2024
 Q3 2024 Earnings Presentation36 slides · Jun 27, 2024