CME Group Inc. · NASDAQ:CME
CME — Nymex Holdings — Merger or Acquisition (March 2008)
16 slides from CME's merger presentation, Mar 17, 2008

Slide 1: Filed by CME Group Inc. pursuant to Rule 425
Filed by CME Group Inc. pursuant to Rule 425 under the Securities Act of 1933, as amended, and deemed filed pursuant to Rule 14a-12 under the Securities Exchange Act of 1934, as amended. Subject Company: NYMEX Holdings, Inc. Subject Company’s Commission File No.: 001-33149
Slide 2: Investor Presentation
Investor Presentation March 17, 2008
Slide 3: Discussion of Forward-Looking Statements
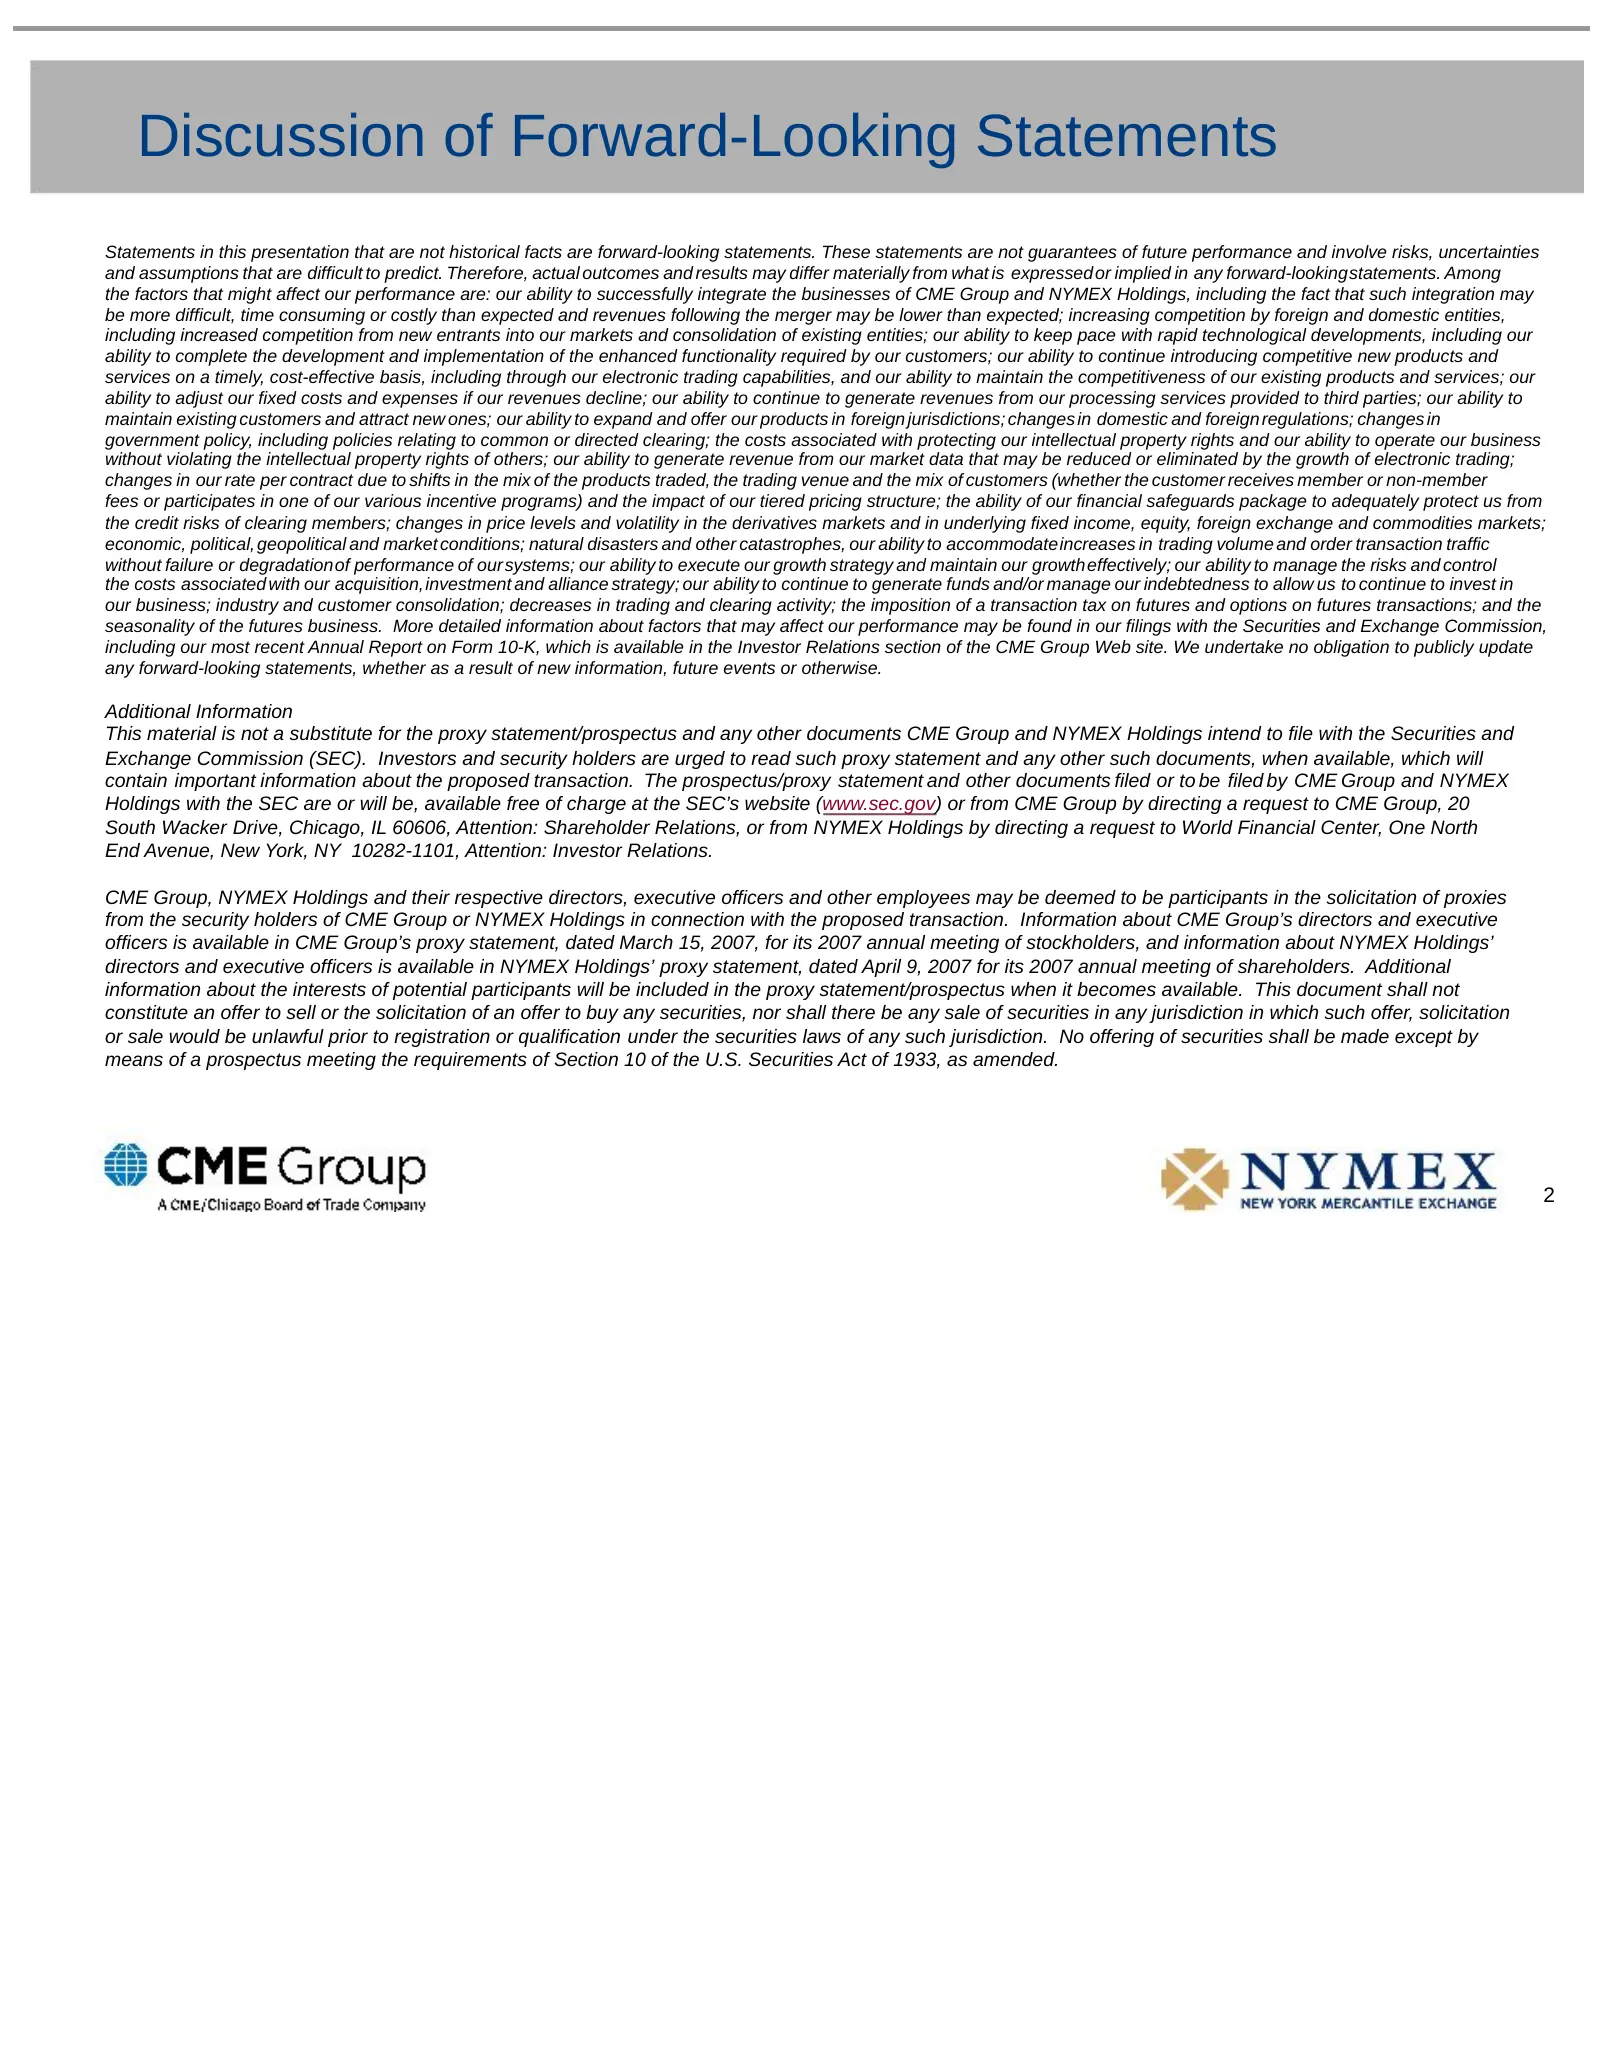
Discussion of Forward-Looking Statements Statements in this presentation that are not historical facts are forward-looking statements. These statements are not guarantees of future performance and involve risks, uncertainties and assumptions that are difficult to predict. Therefore, actual outcomes
Slide 4: Compelling Transaction
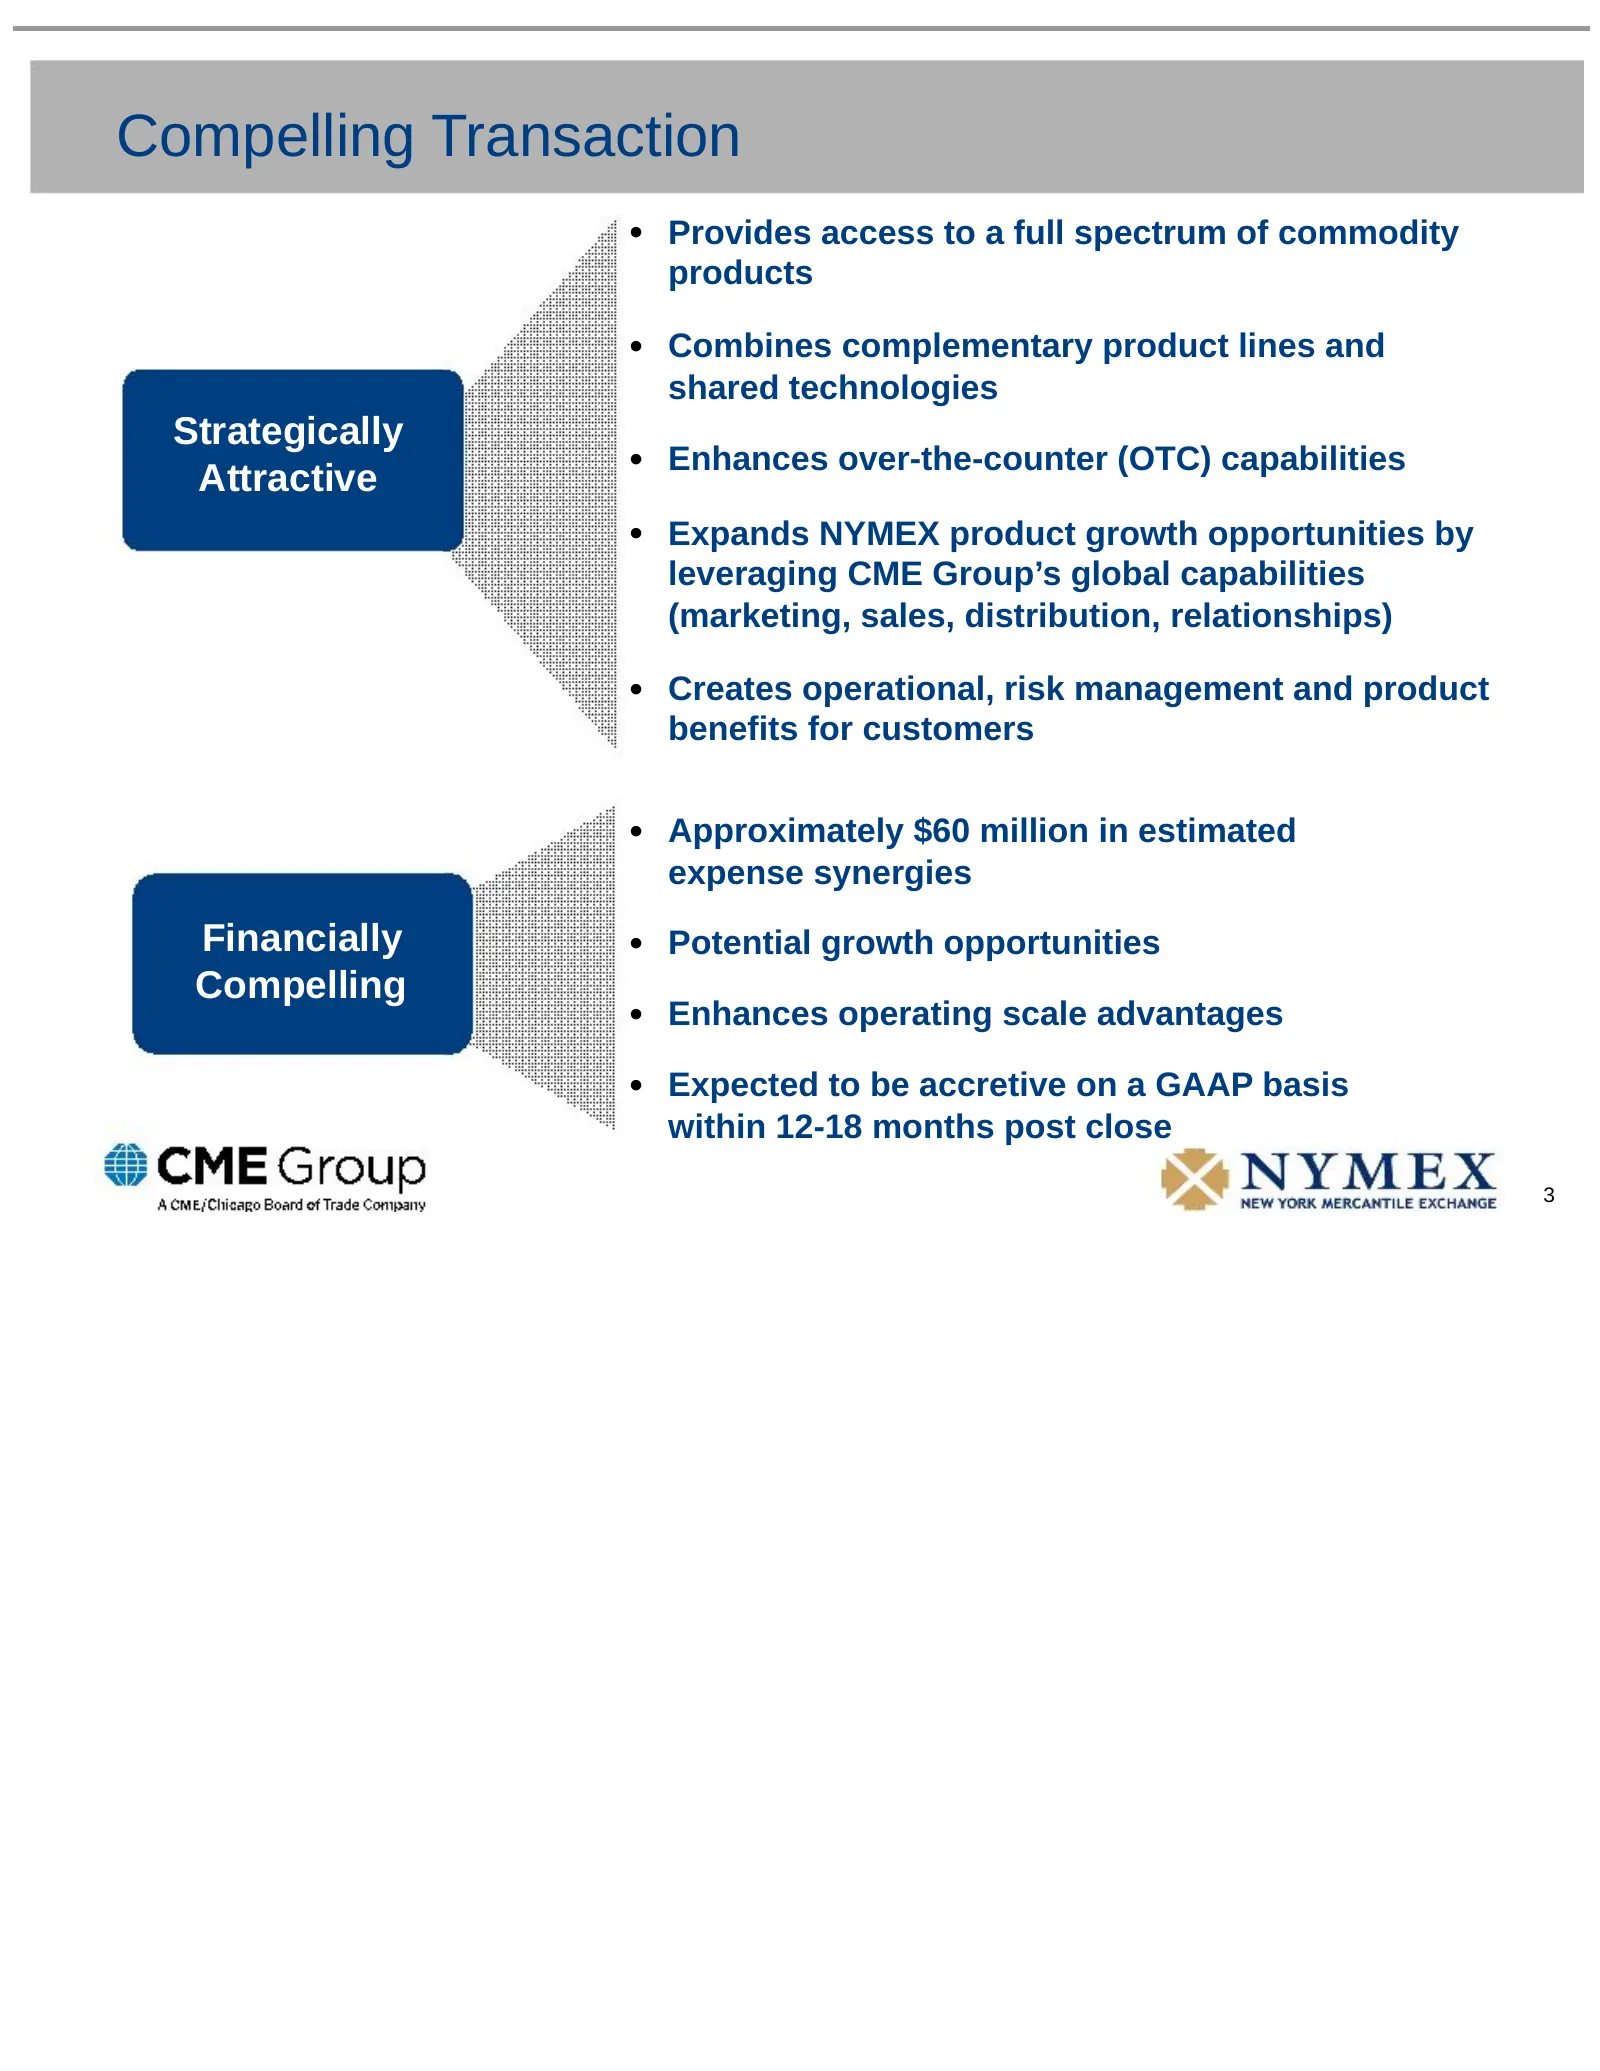
Compelling Transaction • Provides access to a full spectrum of commodity products • Combines complementary product lines and shared technologies Strategically Attractive • Enhances over-the-counter (OTC) capabilities • Expands NYMEX product growth opportunities by leveraging CME Group’s global capab
Slide 5: CME Group Is the Best Partner for NYMEX
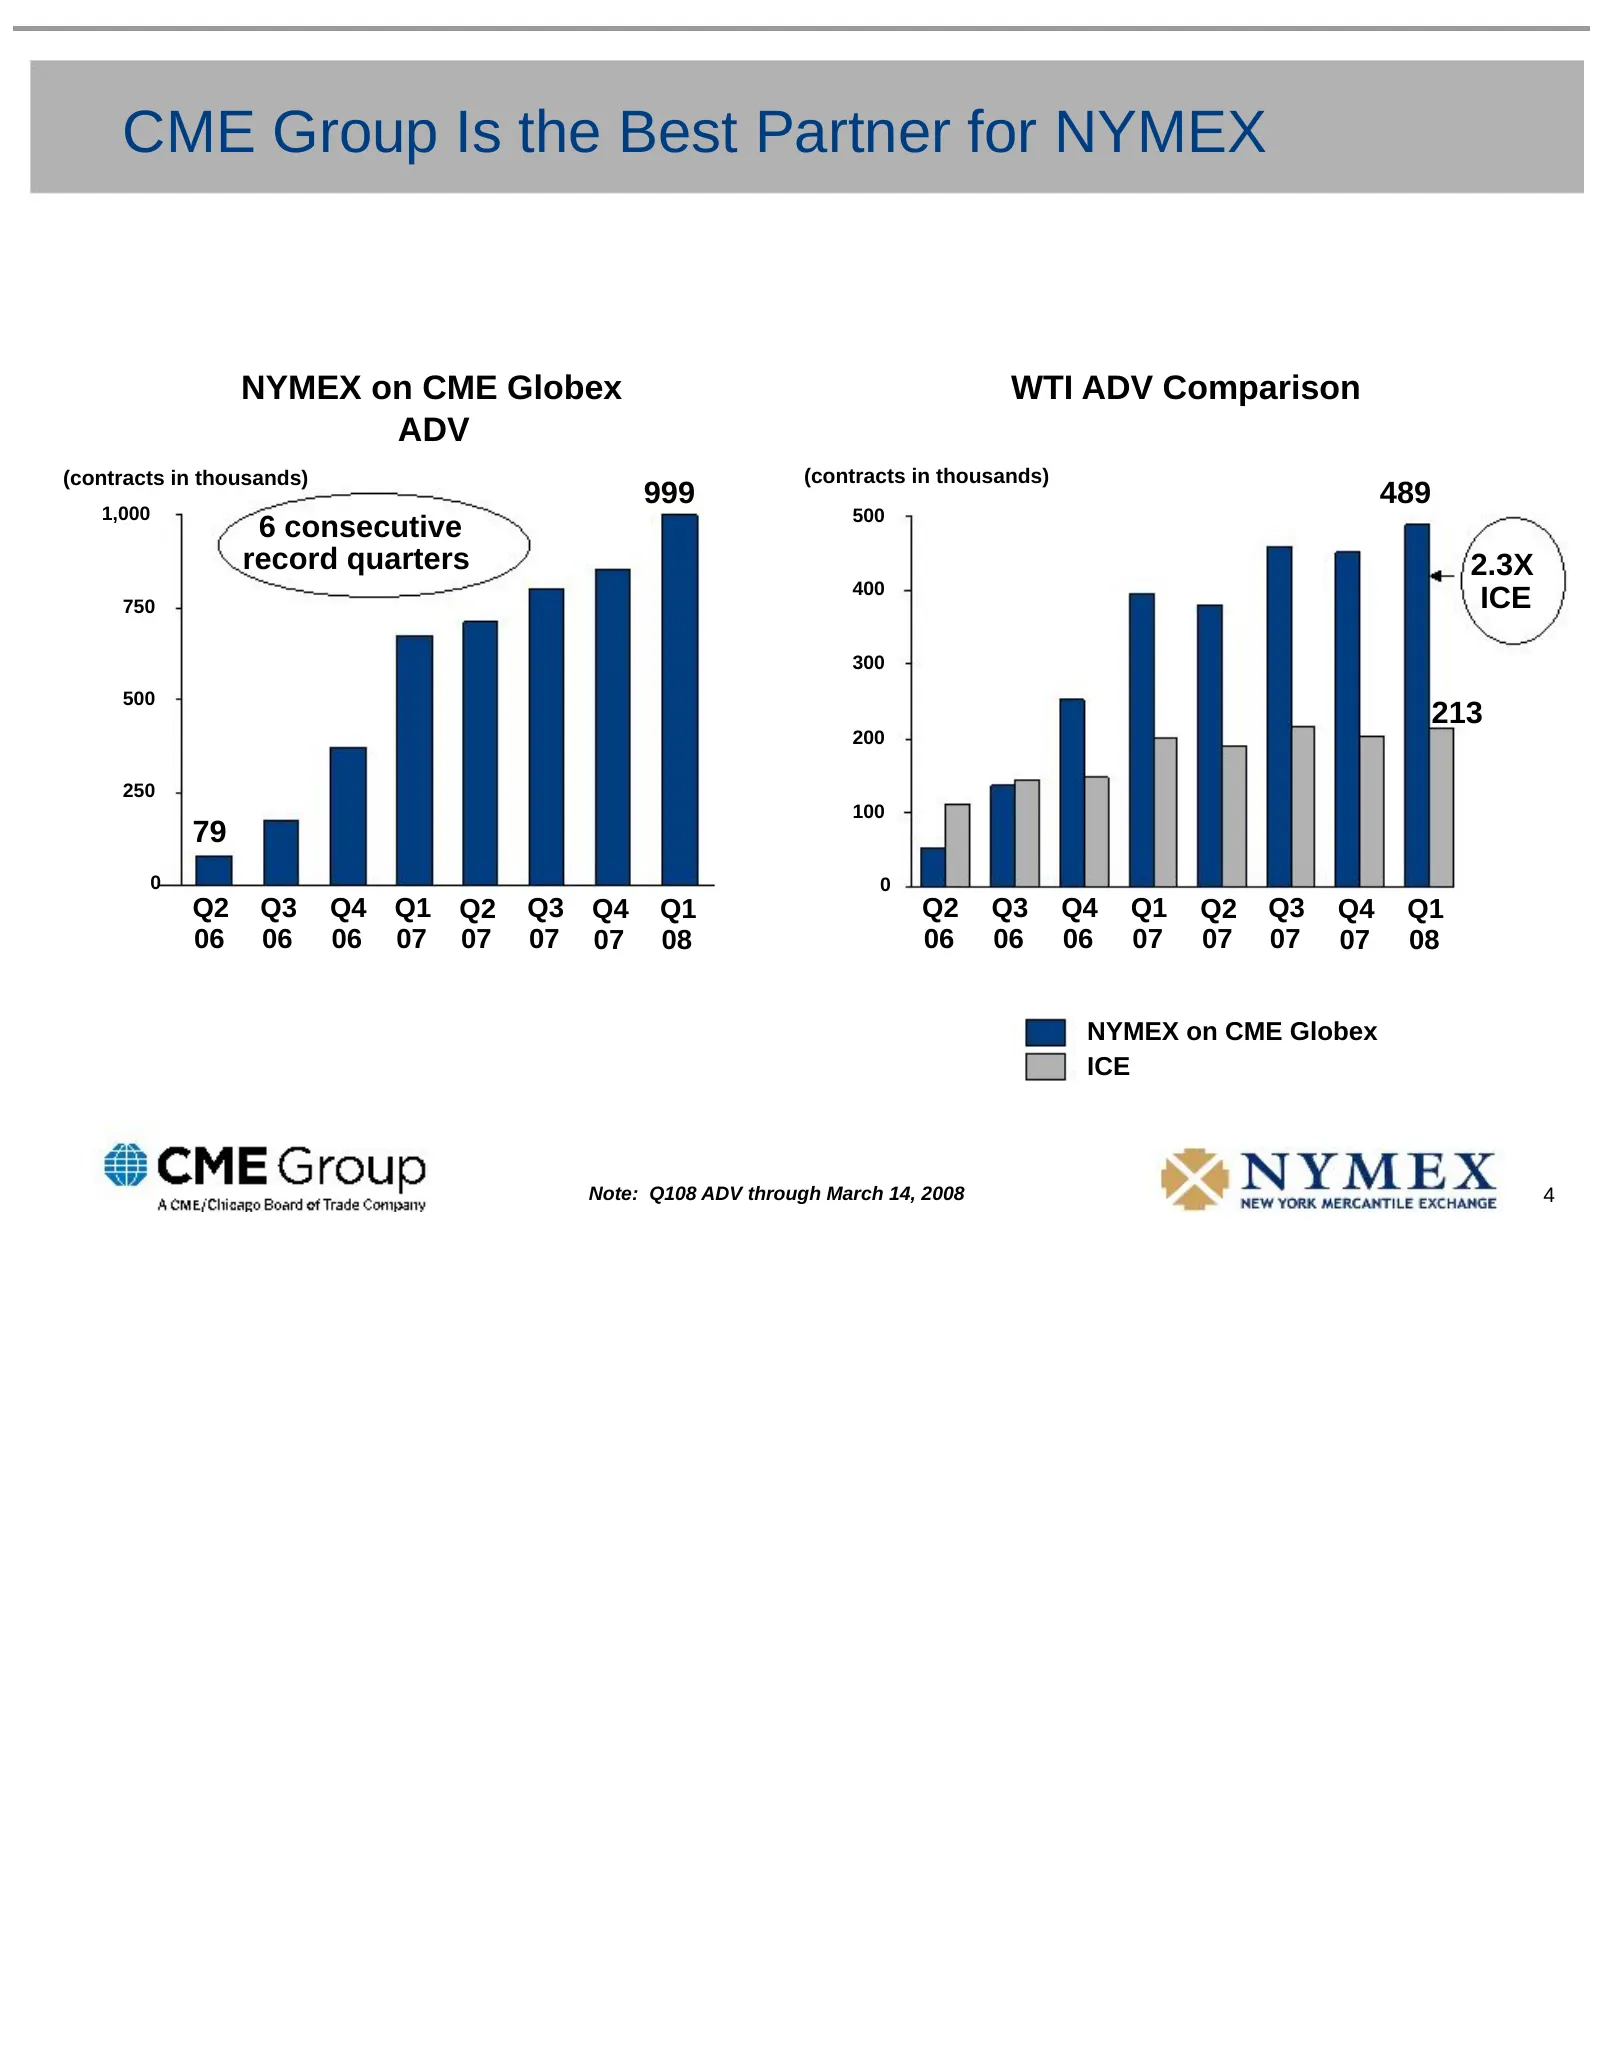
CME Group Is the Best Partner for NYMEX NYMEX on CME Globex WTI ADV Comparison ADV (contracts in thousands) (contracts in thousands) 999 489 1,000 500 6 consecutive record quarters 2.3X 400 750 ICE 300 500 213 200 250 100 79 0 0 Q2 Q3 Q4 Q1 Q2 Q3 Q4 Q1 Q2 Q3 Q4 Q1 Q2 Q3 Q4 Q1 06 06 06 07 07 07 07 08
Slide 6: Transaction Summary
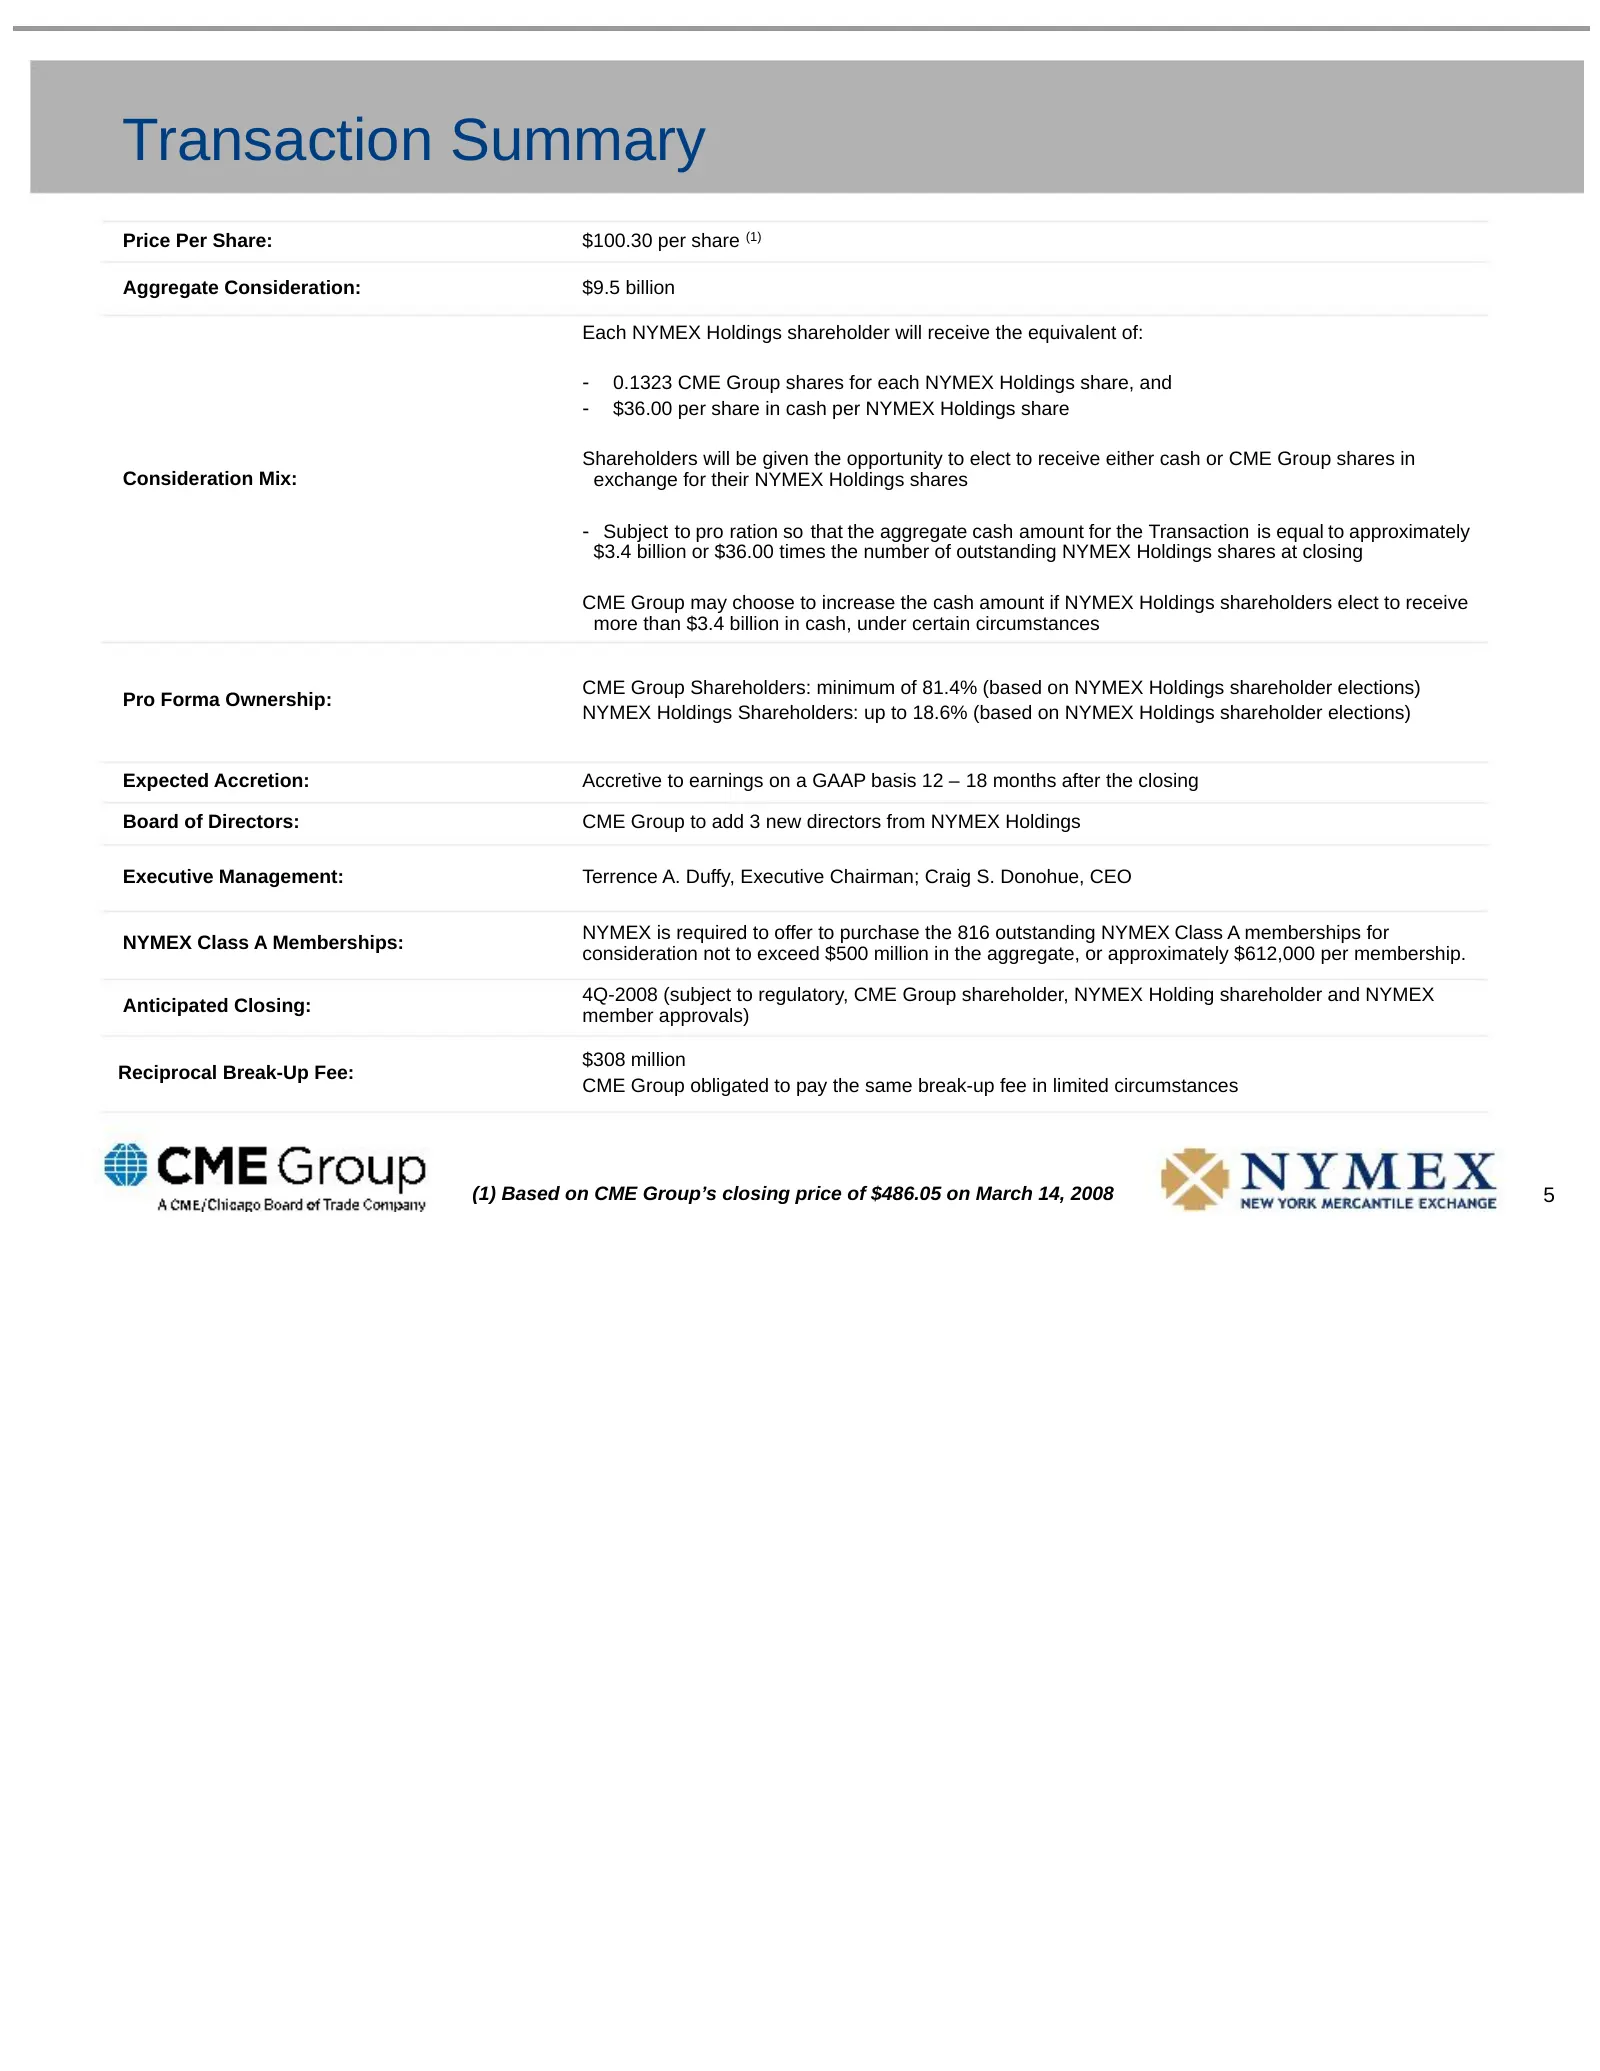
Transaction Summary Price Per Share: $100.30 per share (1) Aggregate Consideration: $9.5 billion Each NYMEX Holdings shareholder will receive the equivalent of: - 0.1323 CME Group shares for each NYMEX Holdings share, and - $36.00 per share in cash per NYMEX Holdings share Shareholders will be given
Slide 7: Expected Strategic Benefits
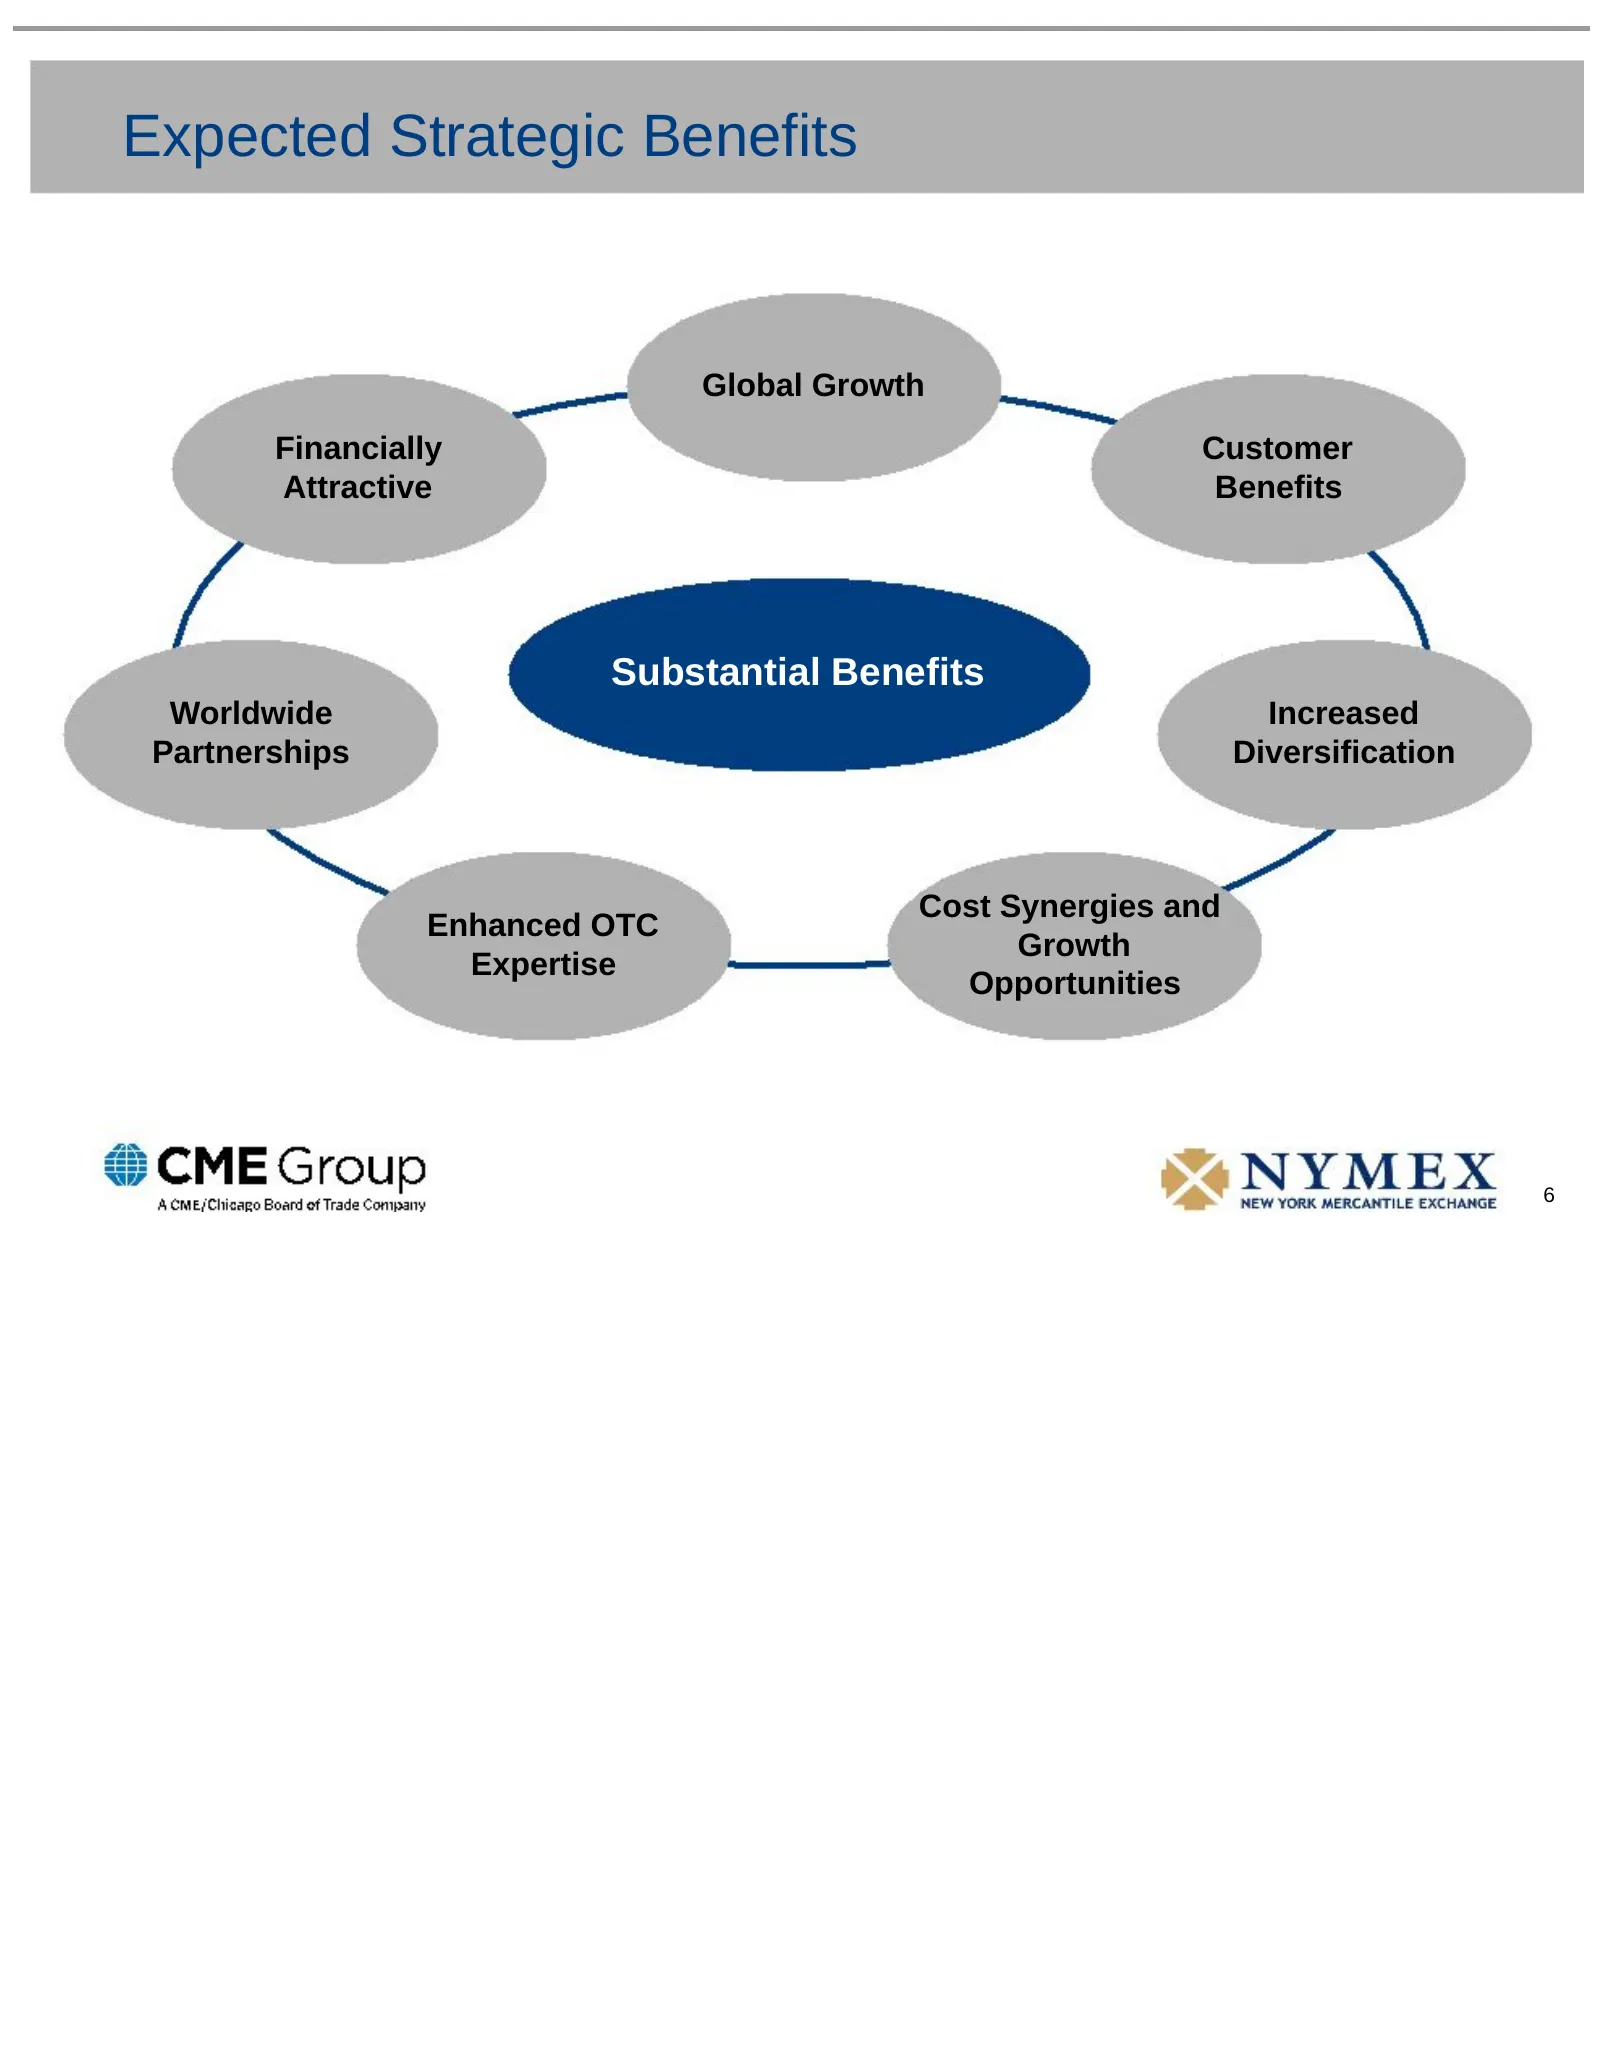
Expected Strategic Benefits Global Growth Financially Customer Attractive Benefits Substantial Benefits Worldwide Increased Partnerships Diversification Cost Synergies and Enhanced OTC Growth Expertise Opportunities 6
Slide 8: Positioned to Drive Global Growth
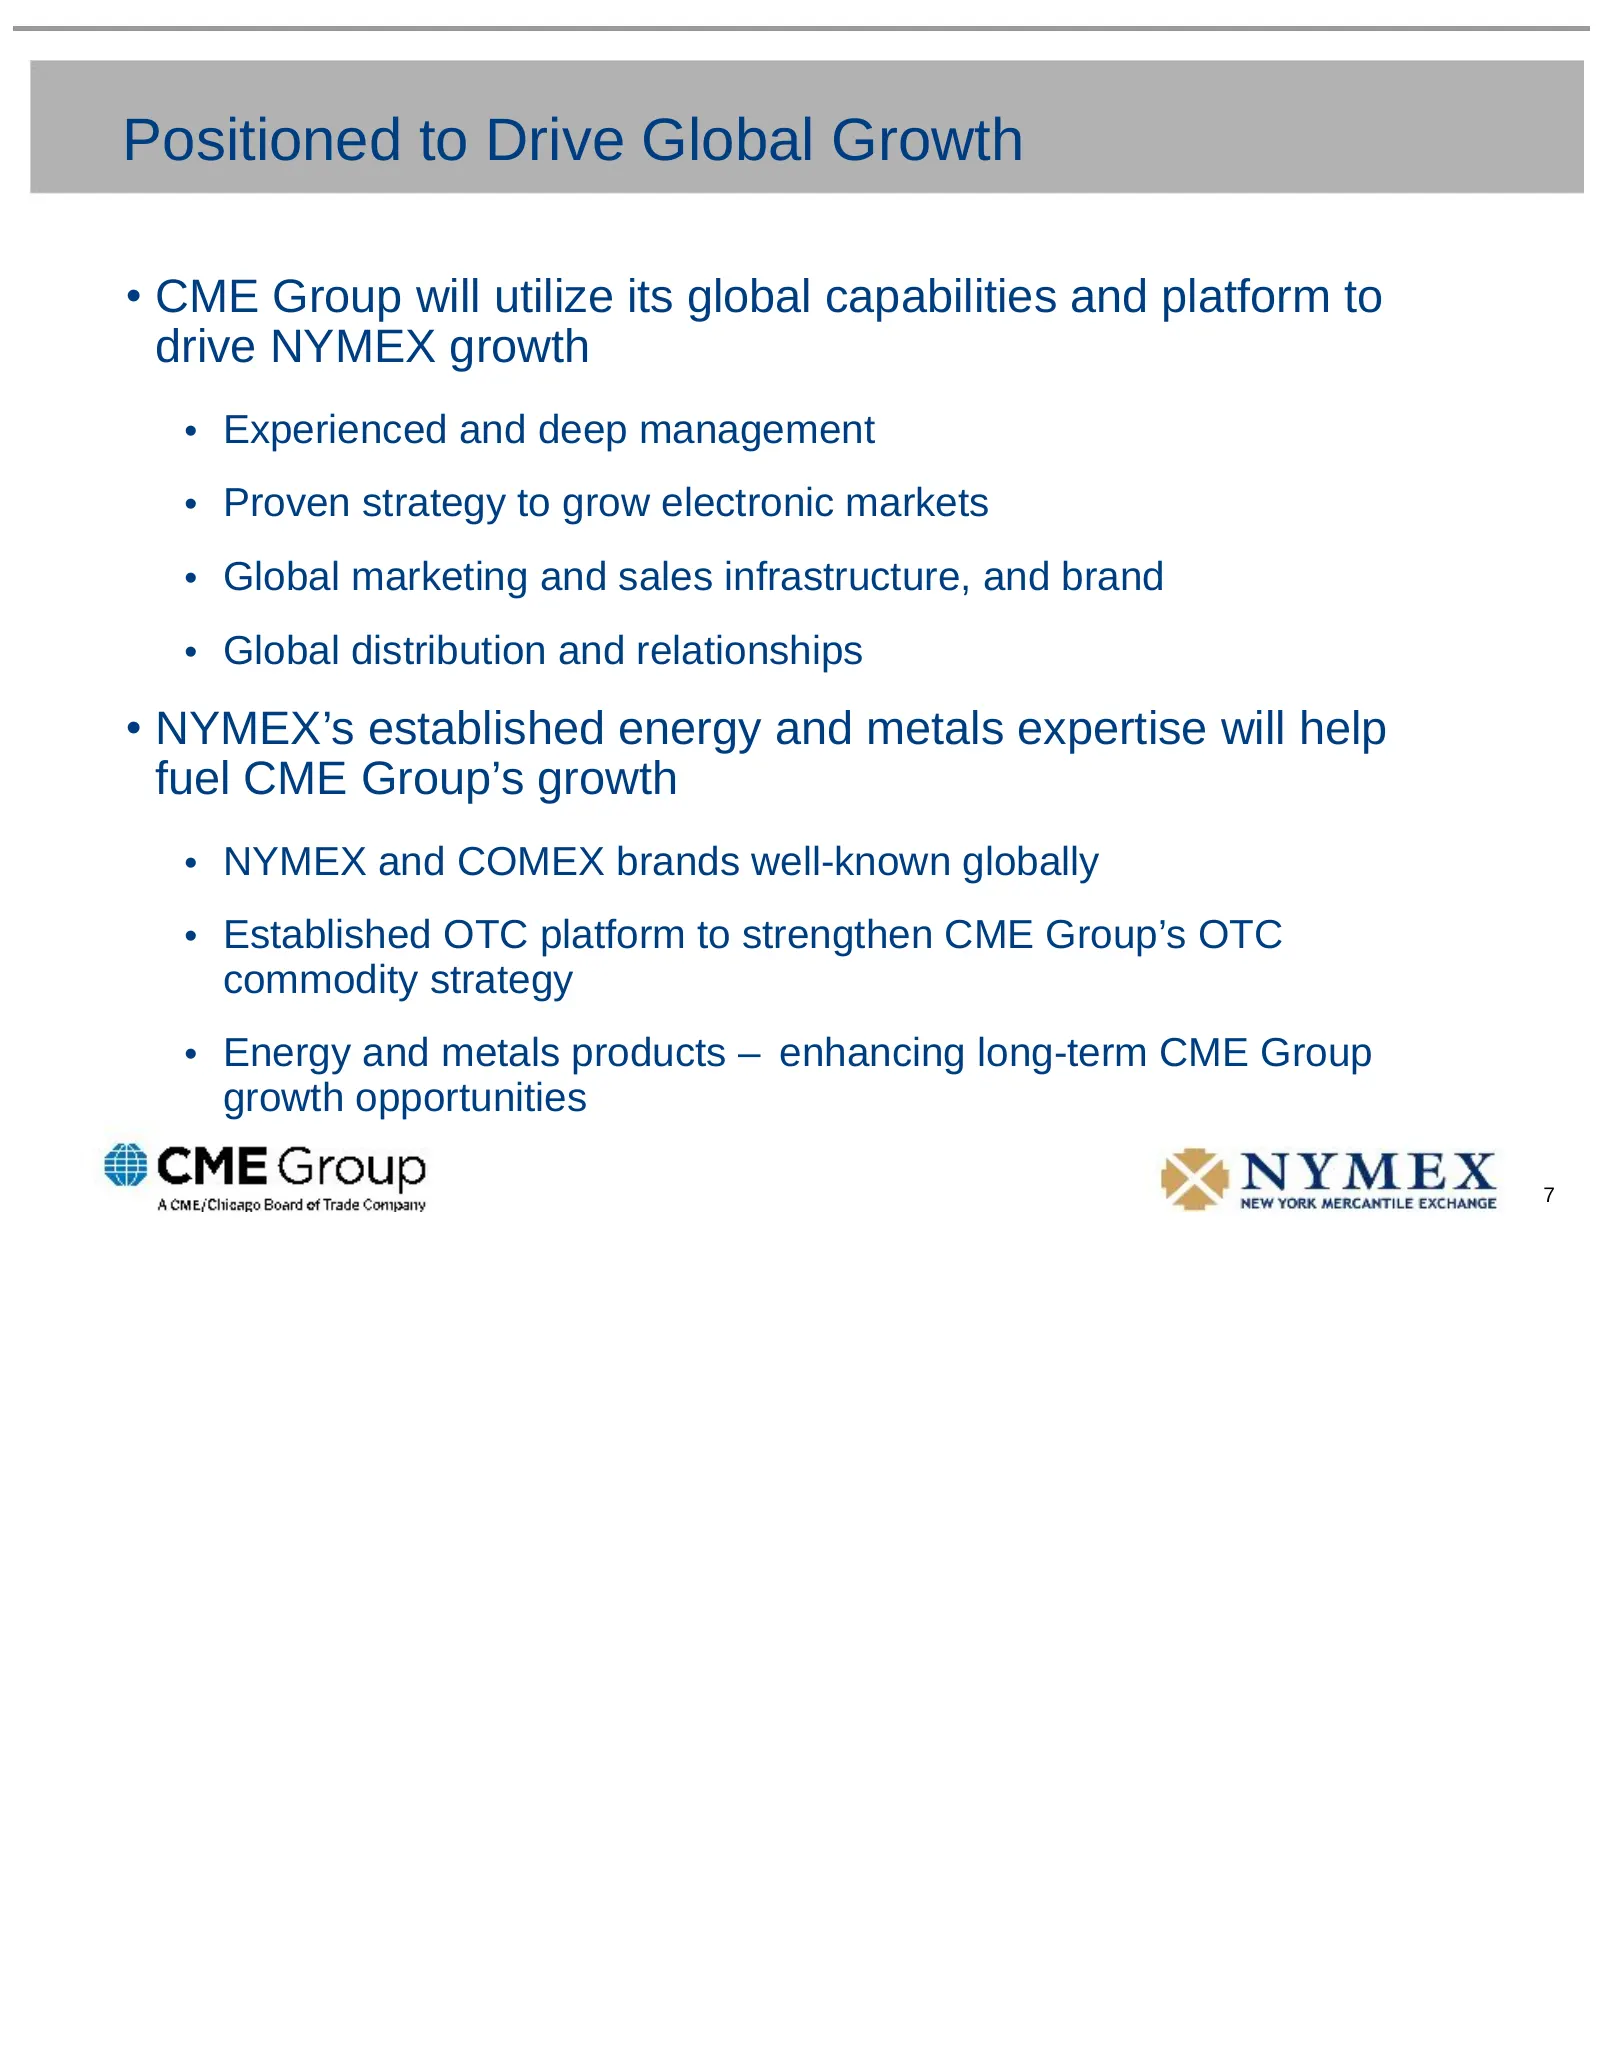
Positioned to Drive Global Growth • CME Group will utilize its global capabilities and platform to drive NYMEX growth • Experienced and deep management • Proven strategy to grow electronic markets • Global marketing and sales infrastructure, and brand • Global distribution and relationships • NYMEX’
Slide 9: Positioned to Drive Global Growth
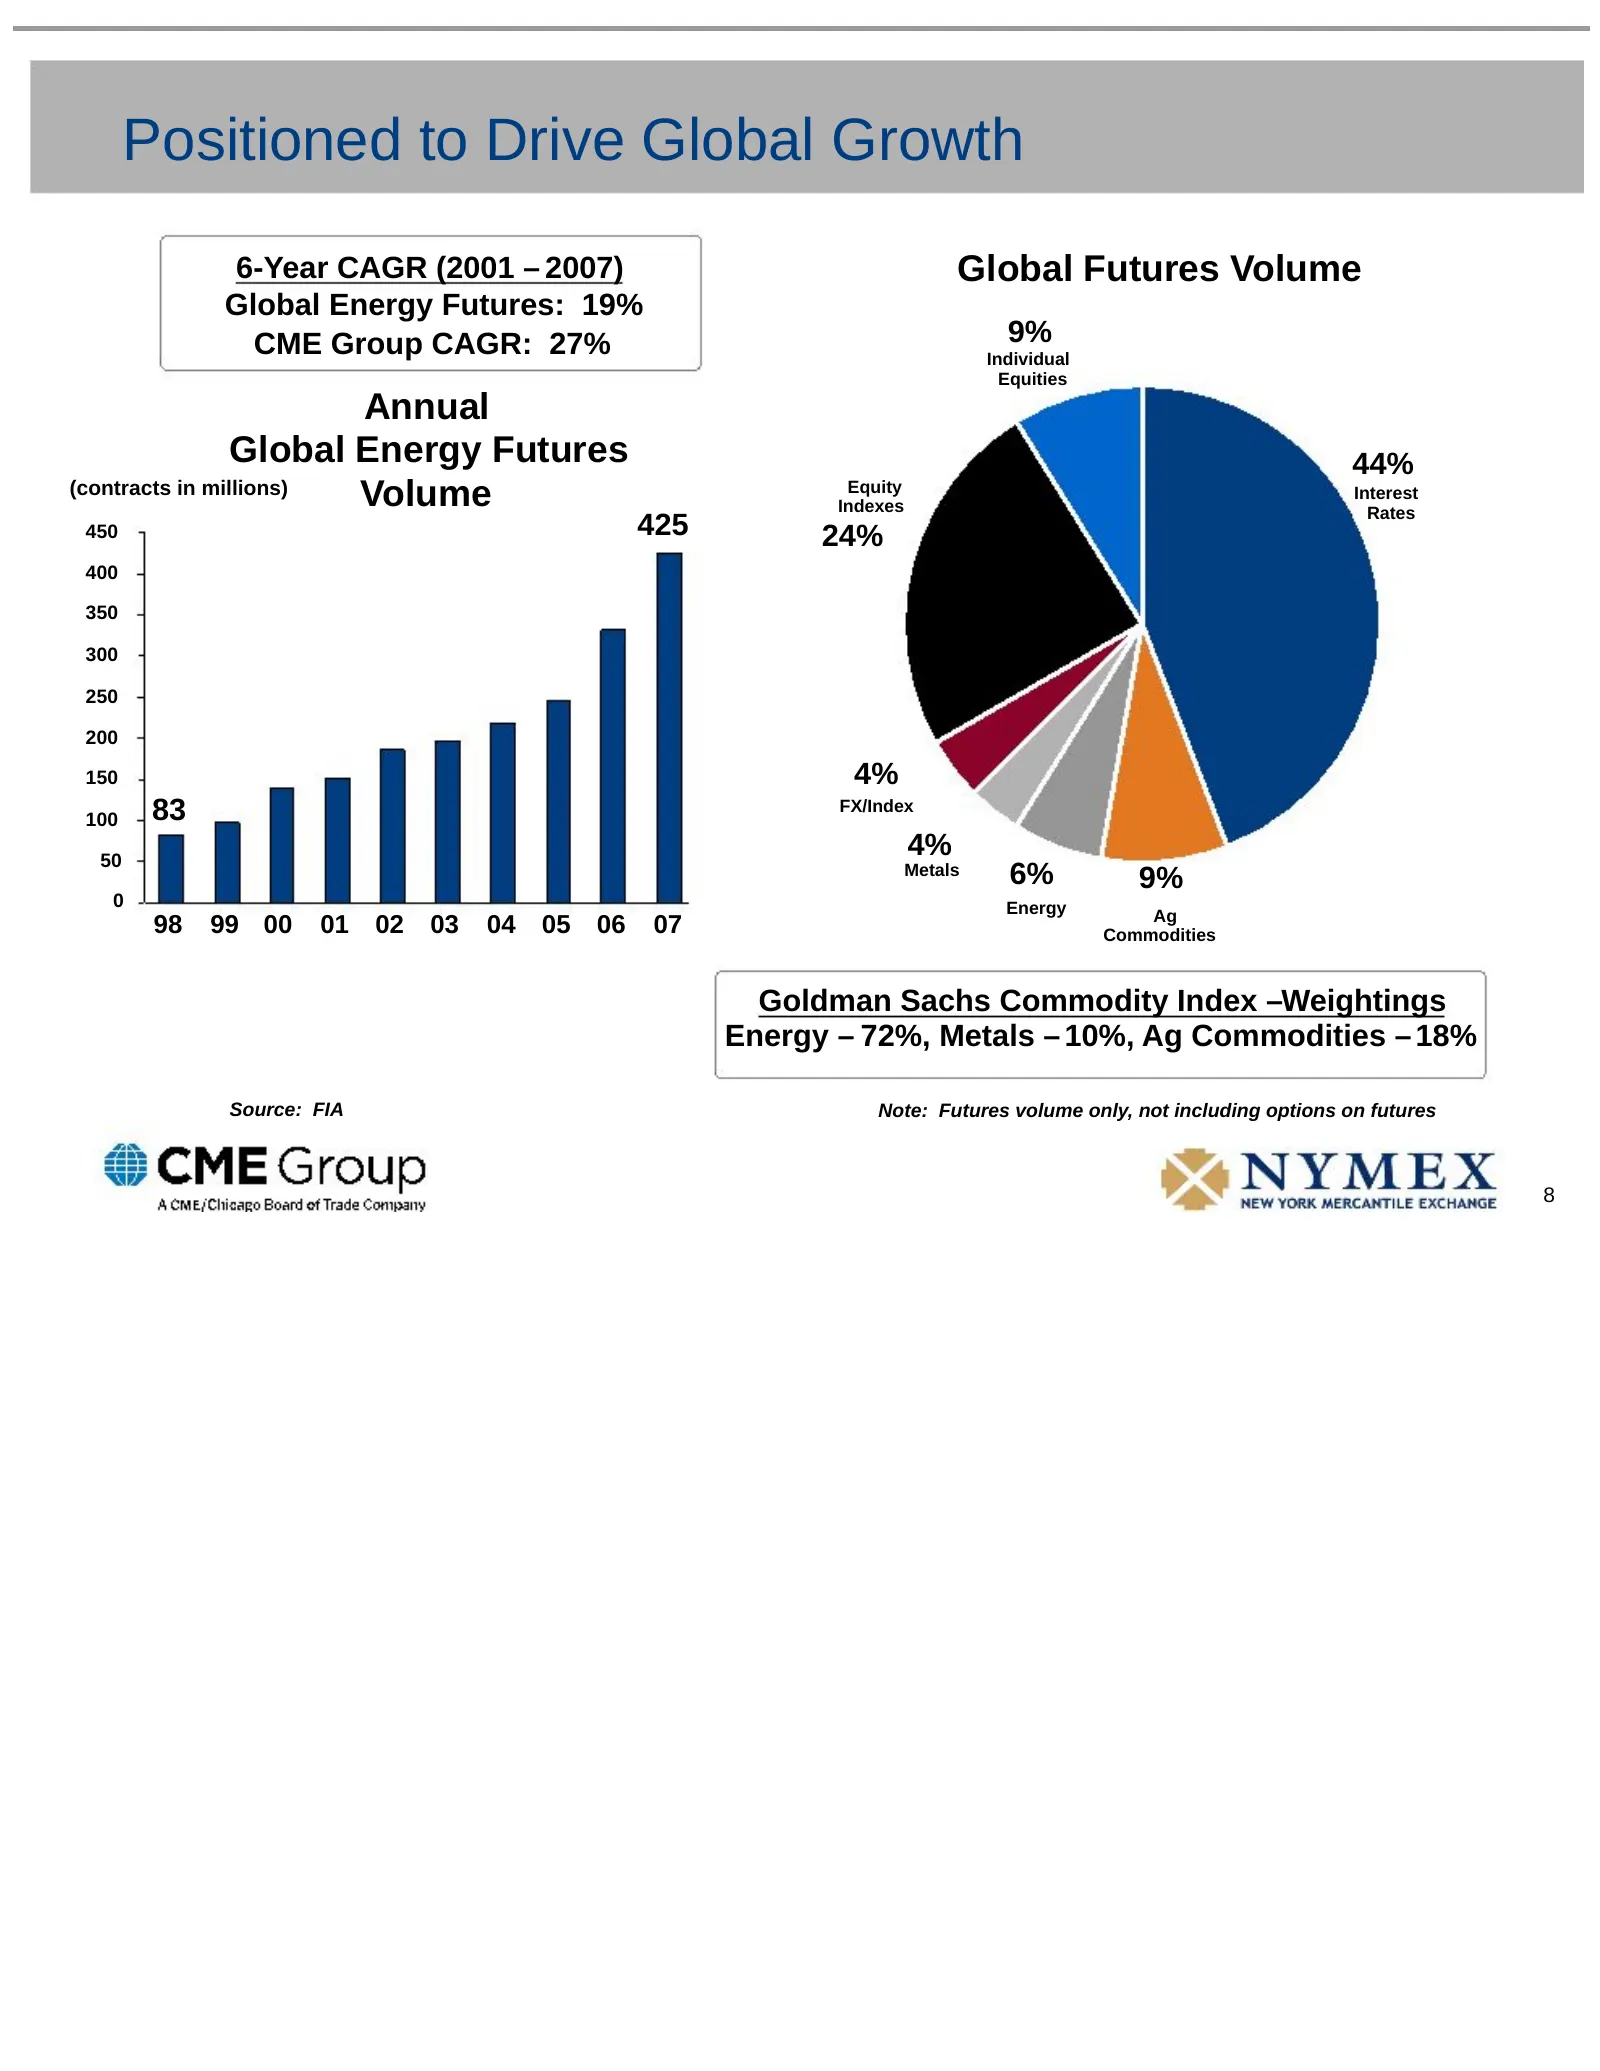
Positioned to Drive Global Growth 6-Year CAGR (2001 – 2007) Global Futures Volume Global Energy Futures: 19% CME Group CAGR: 27% 9% Individual Equities Annual Global Energy Futures 44% (contracts in millions) Volume Equity Indexes Interest Rates 450 425 24% 400 350 300 250 200 150 4% 100 83 FX/Index
Slide 10: Expected Customer Benefits
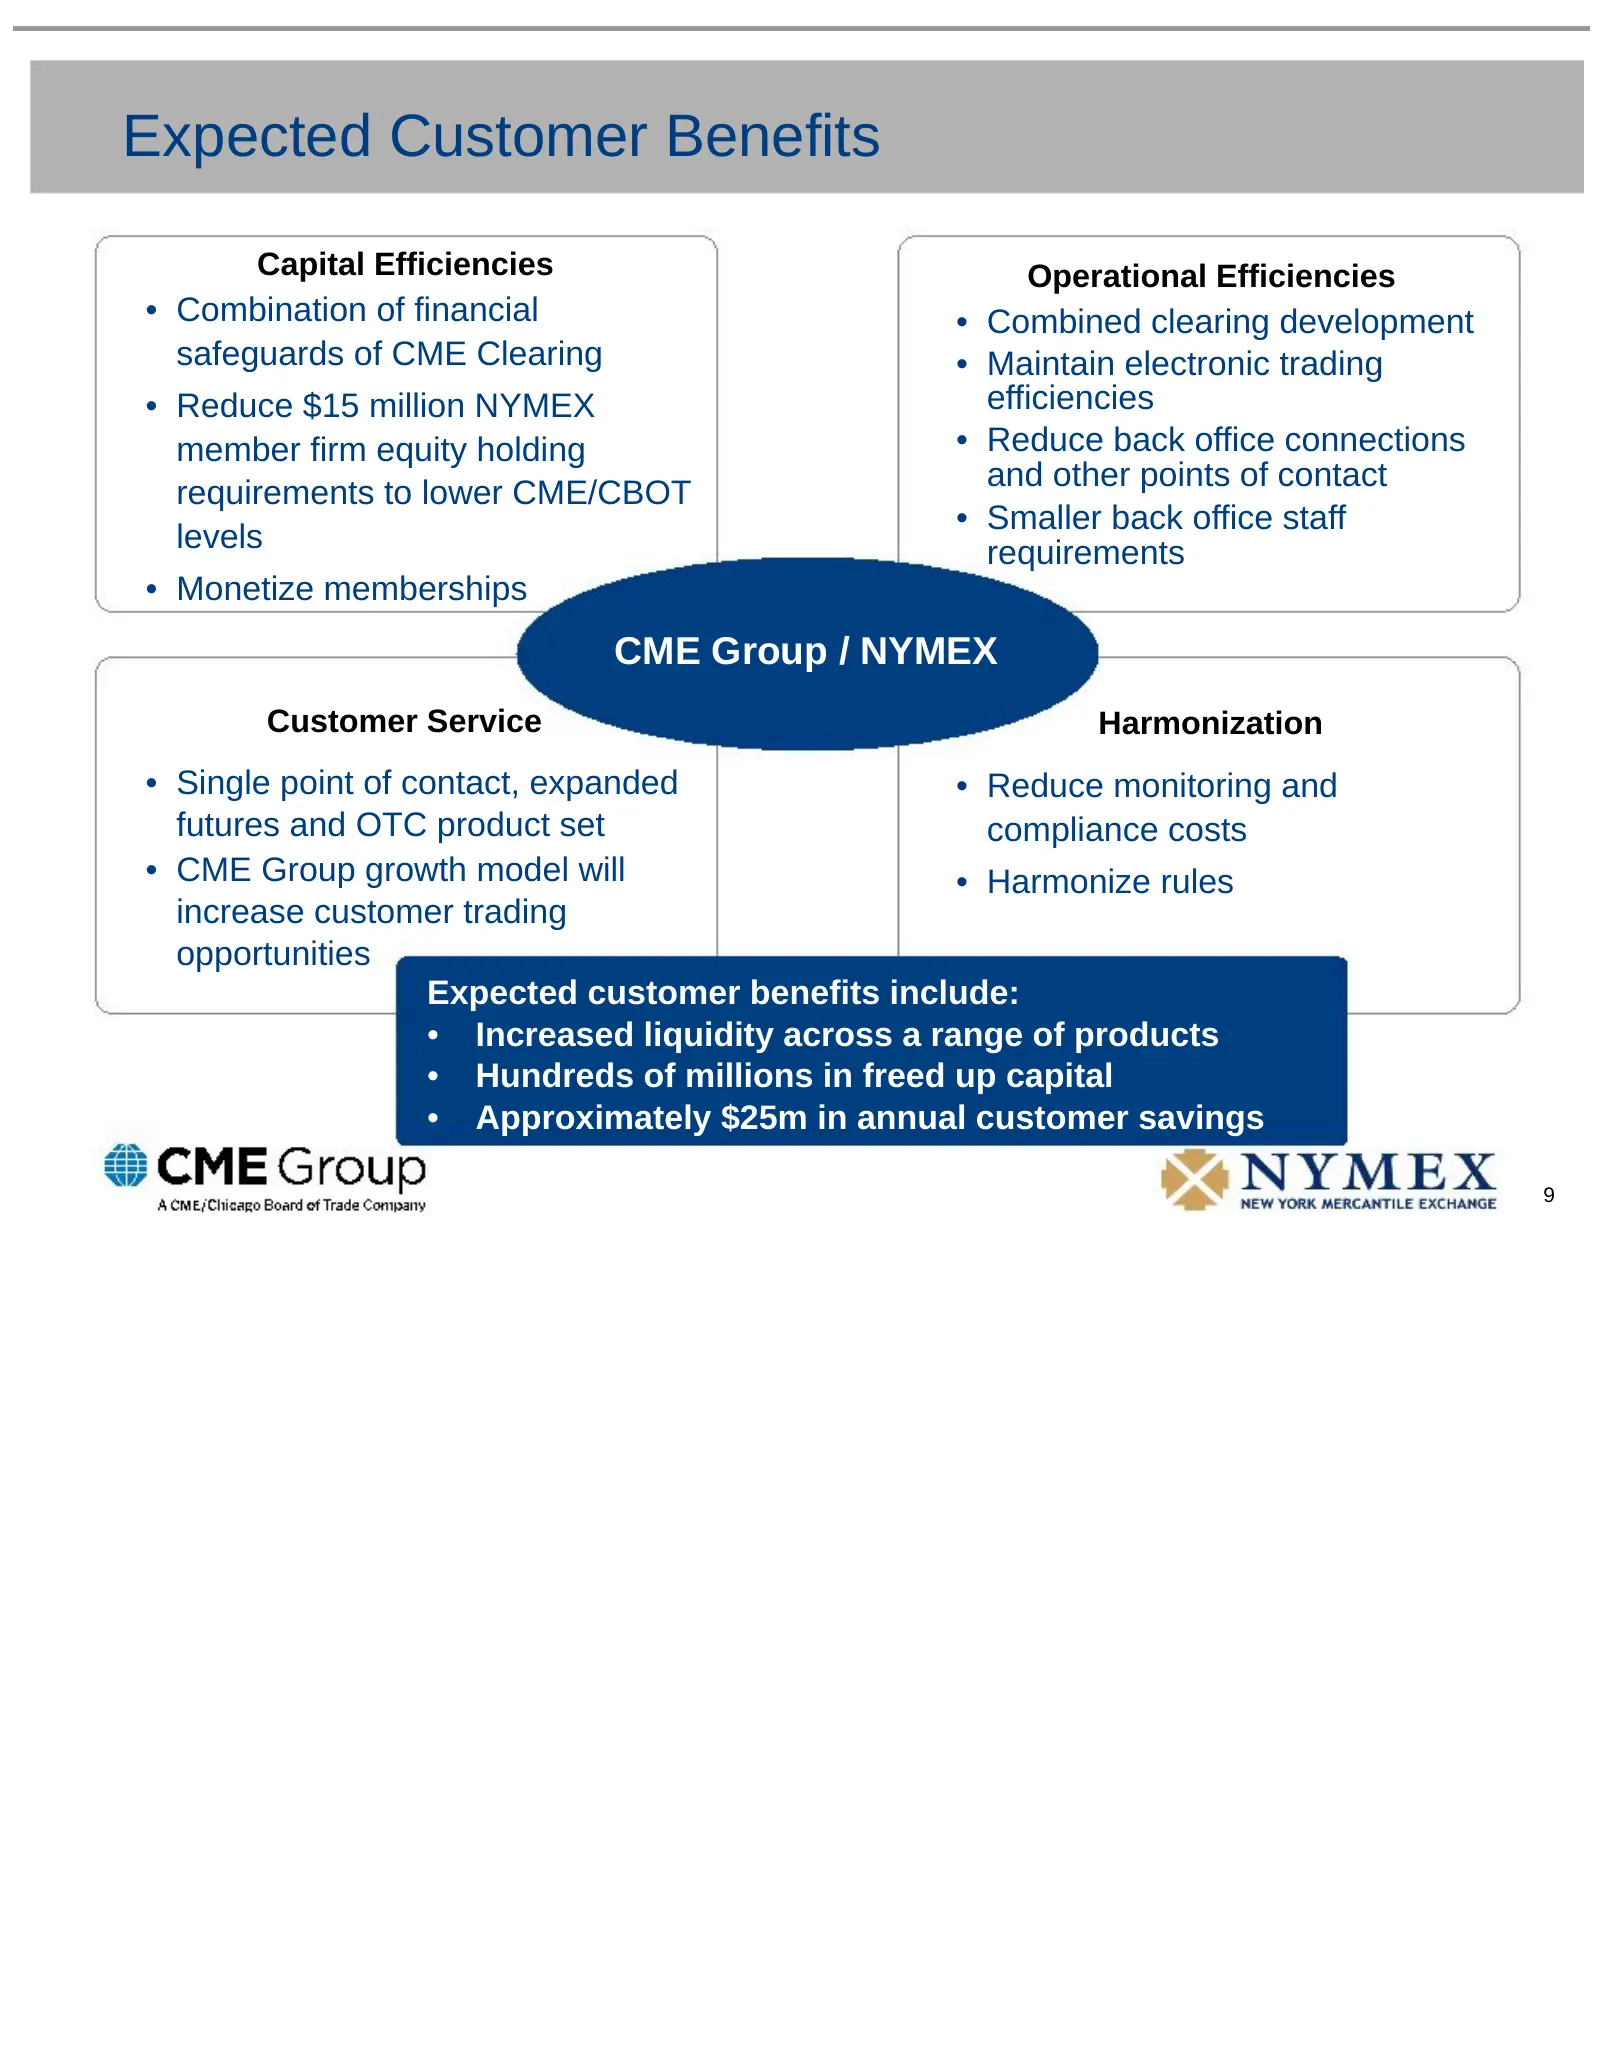
Expected Customer Benefits Capital Efficiencies Operational Efficiencies • Combination of financial • Combined clearing development safeguards of CME Clearing • Maintain electronic trading • Reduce $15 million NYMEX efficiencies member firm equity holding • Reduce back office connections and other p
Slide 11: Increased Diversification
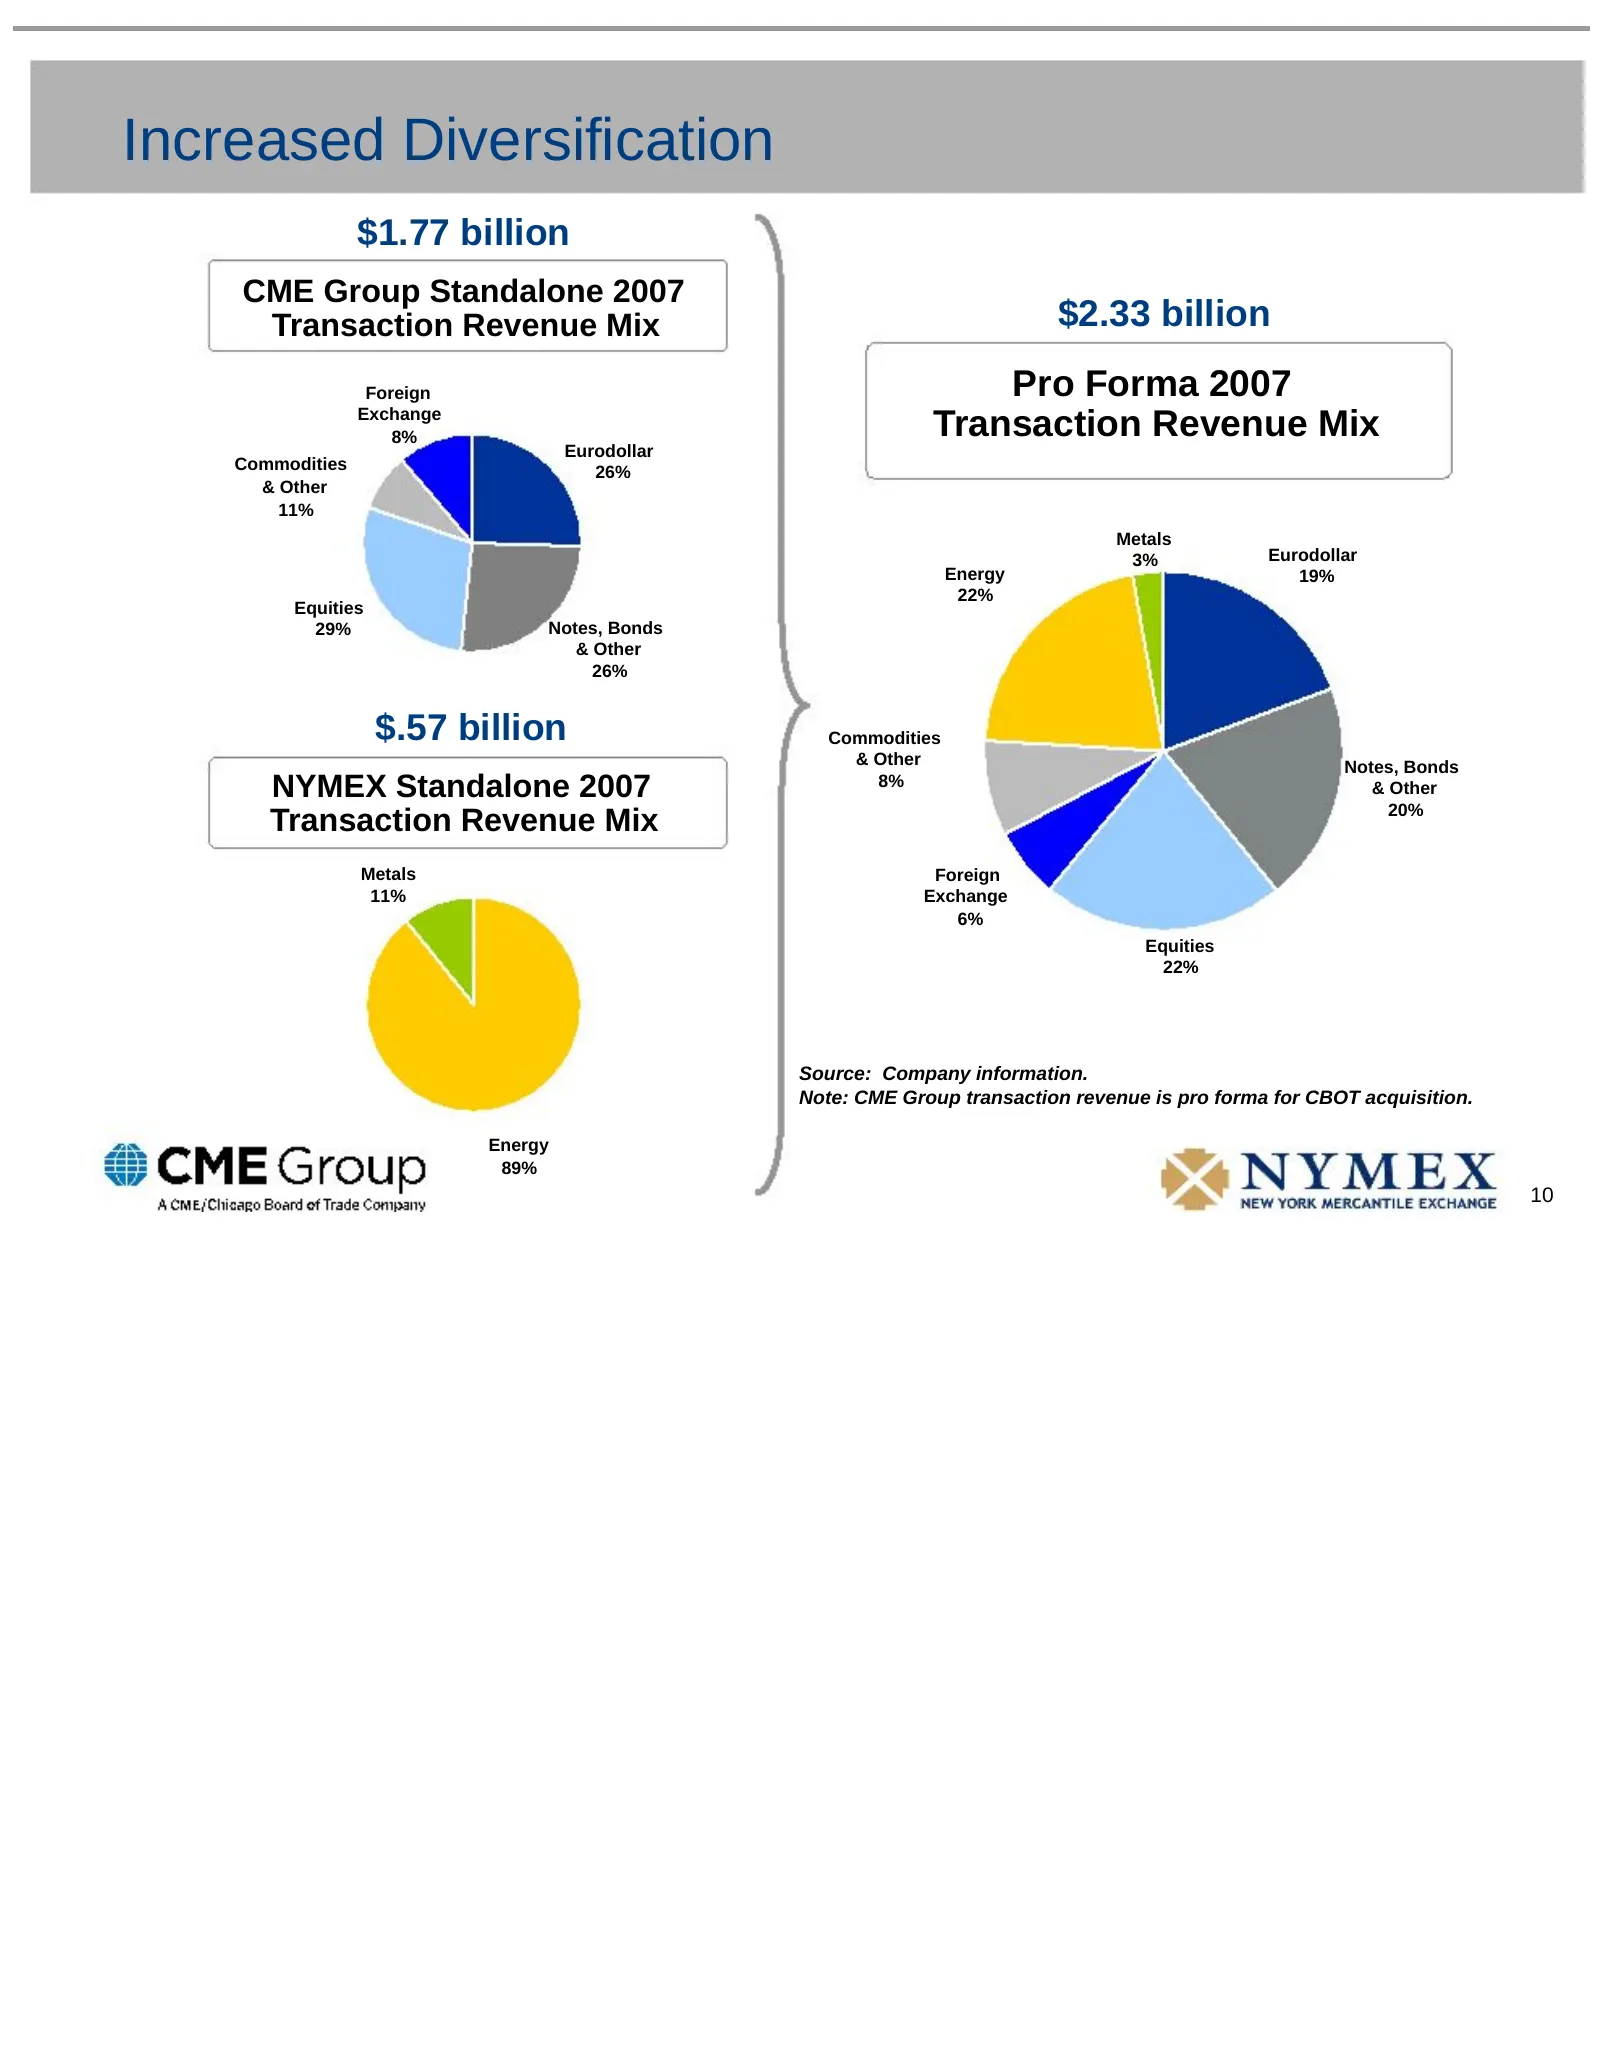
Increased Diversification $1.77 billion CME Group Standalone 2007 Transaction Revenue Mix $2.33 billion Foreign Pro Forma 2007 Exchange 8% Transaction Revenue Mix Eurodollar Commodities 26% & Other 11% Metals 3% Eurodollar Energy 19% 22% Equities 29% Notes, Bonds & Other 26% $.57 billion Commodities
Slide 12: Cost Synergy Opportunities
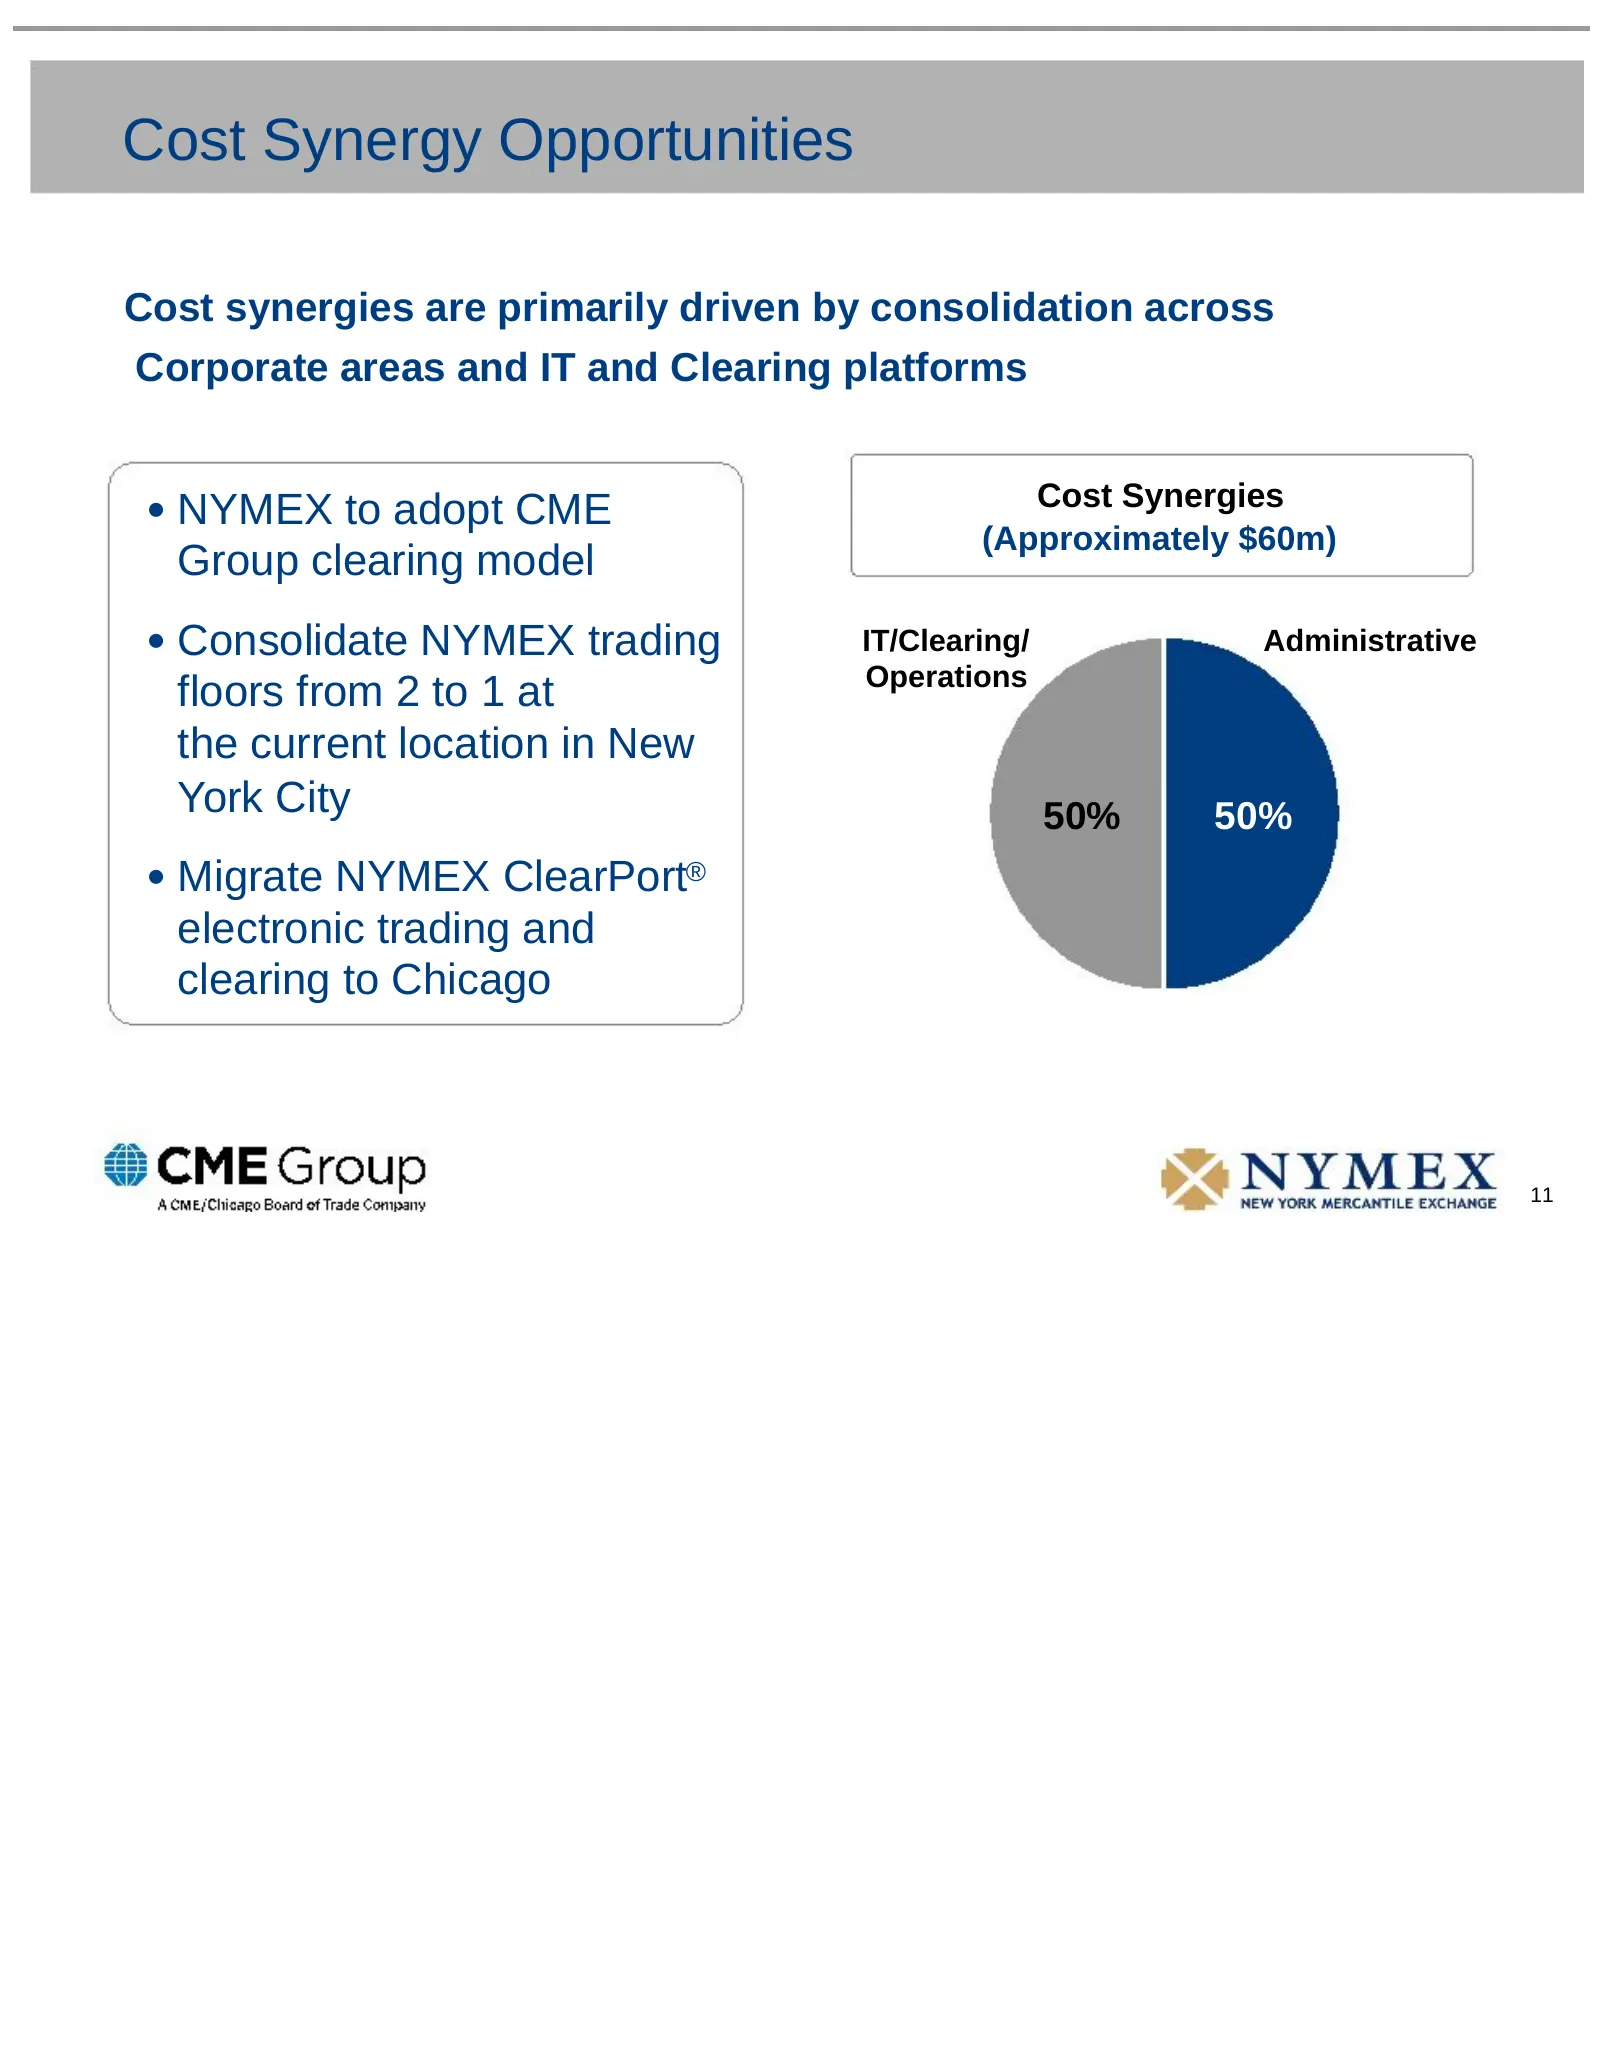
Cost Synergy Opportunities Cost synergies are primarily driven by consolidation across Corporate areas and IT and Clearing platforms Cost Synergies • NYMEX to adopt CME (Approximately $60m) Group clearing model • Consolidate NYMEX trading IT/Clearing/ Administrative Operations floors from 2 to 1 at
Slide 13: Business Opportunities
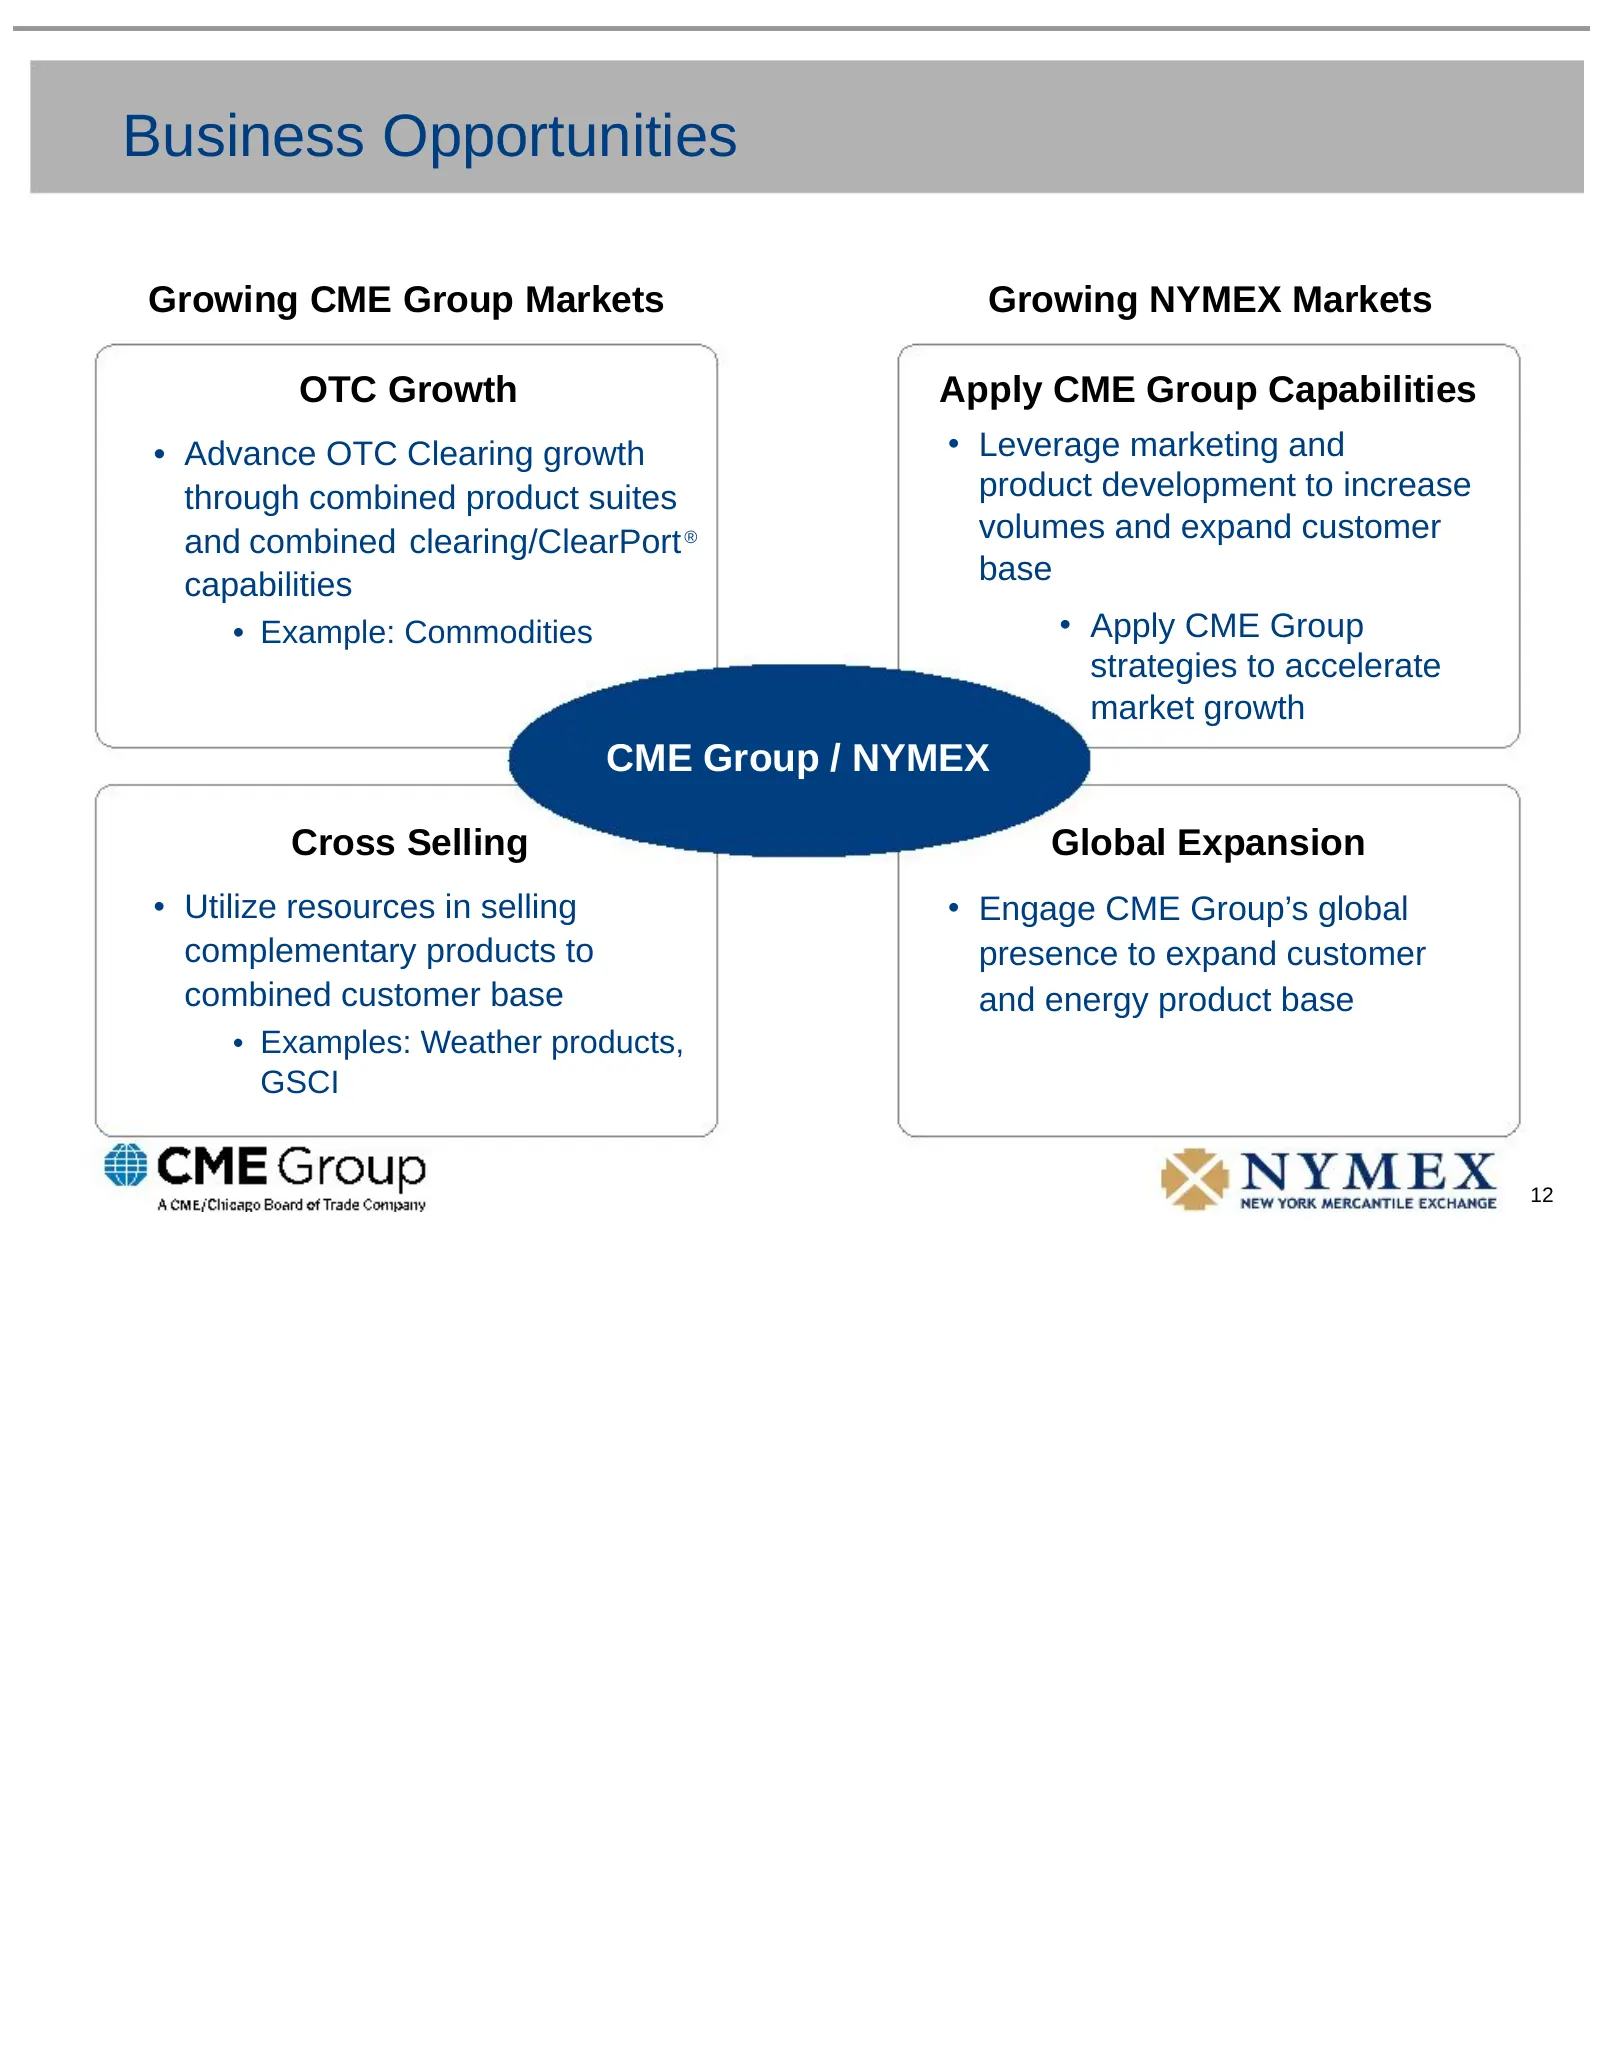
Business Opportunities Growing CME Group Markets Growing NYMEX Markets OTC Growth Apply CME Group Capabilities • Advance OTC Clearing growth • Leverage marketing and through combined product suites product development to increase and combined clearing/ClearPort ® volumes and expand customer capabili
Slide 14: Combined OTC Expertise
Combined OTC Expertise • With the addition of NYMEX, CME Group will have an expanded OTC presence in: • Energy – NYMEX ClearPort ® • Interest Rates – Swapstream, with cleared swaps to launch shortly • FX – FXMarketSpace ™ • The acquisition creates increased ability to serve OTC customers in the agri
Slide 15: Worldwide Partnerships
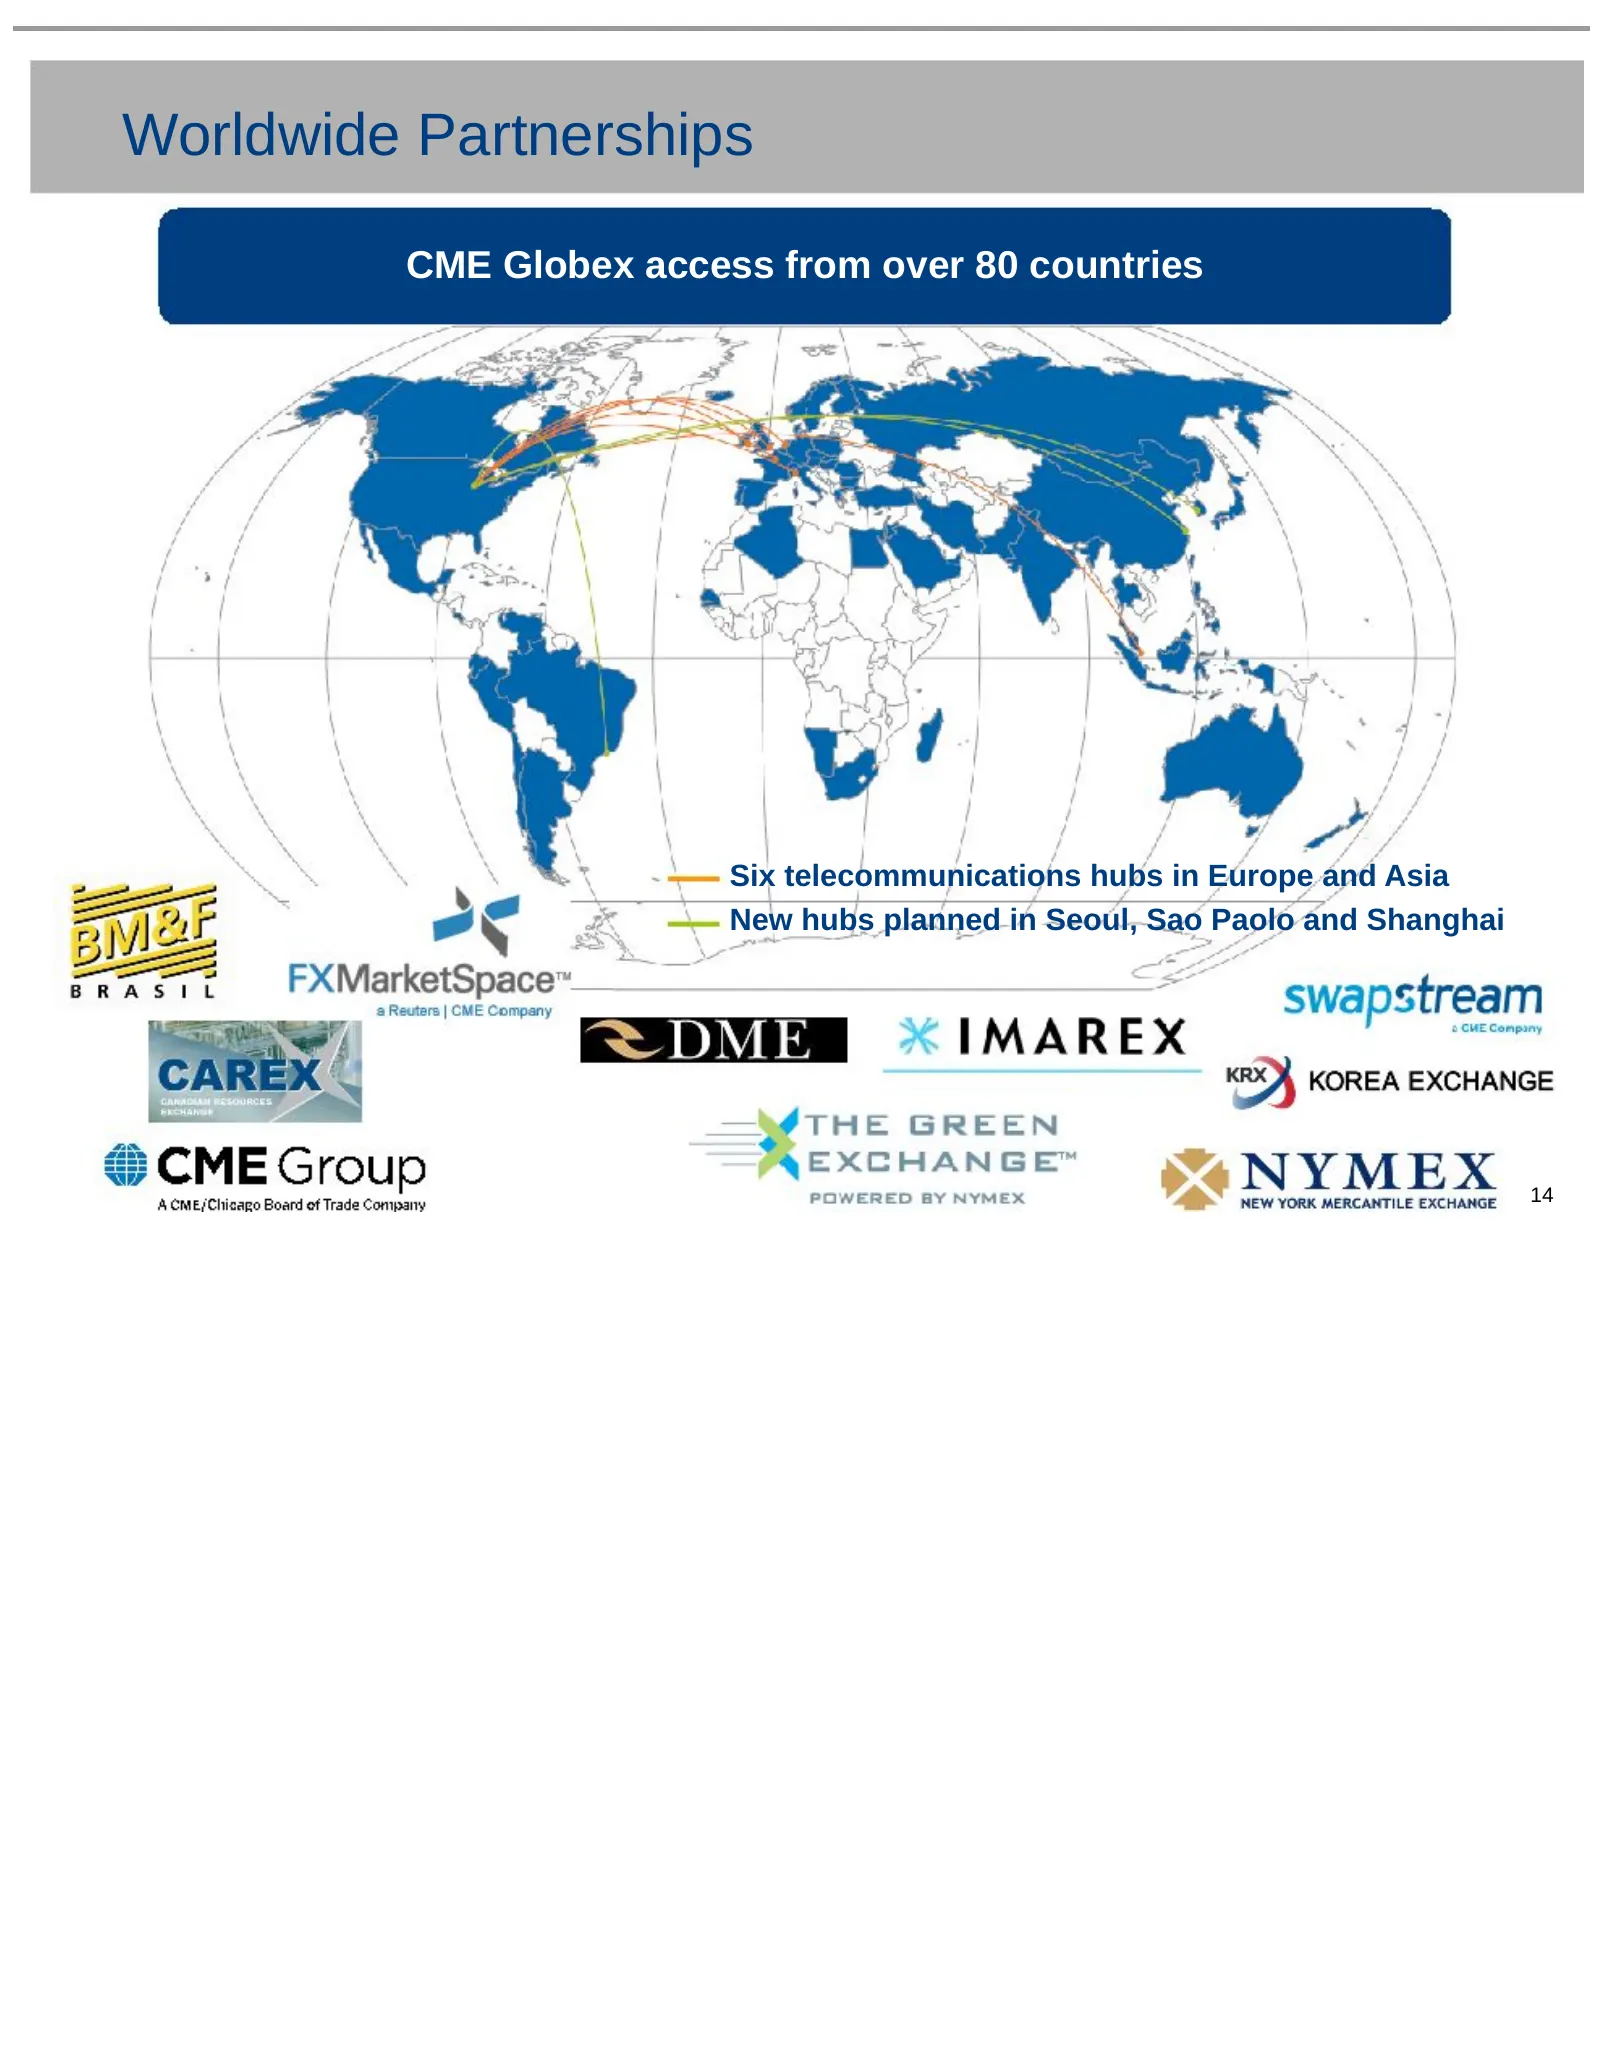
Worldwide Partnerships CME Globex access from over 80 countries Six telecommunications hubs in Europe and Asia New hubs planned in Seoul, Sao Paolo and Shanghai 14
Slide 16: Road Map to Completion
Road Map to Completion • File Joint Proxy Statement/Prospectus with SEC • CME Group shareholder vote, NYMEX Holdings shareholder vote and NYMEX member vote • Repurchase of at least 75 percent of NYMEX memberships • Regulatory approvals • Hart-Scott-Rodino (HSR) • Regulatory notifications • Commodity
Source: SEC EDGAR · 425 filed Mar 17, 2008
More decks from CME Group Inc.
 Q2 2026 Earnings Presentation12 slides · Jul 22, 2026
 Q1 2026 Earnings Presentation11 slides · Apr 22, 2026
 Q4 2025 Earnings Presentation11 slides · Feb 4, 2026
 Investor Presentation (December 2025)26 slides · December 2025
 Investor Presentation (November 2025)25 slides · November 2025
 Market Regulation Webinar, MENA Edition (September 2025)58 slides · Sep 10, 2025