PhilWeb Corporation · PSE:WEB
PhilWeb — H1 2014 Earnings Presentation
8 slides from PhilWeb's earnings presentation, 2014

Slide 1: Management Report 1st Half 2014
Management Report 1st Half 2014
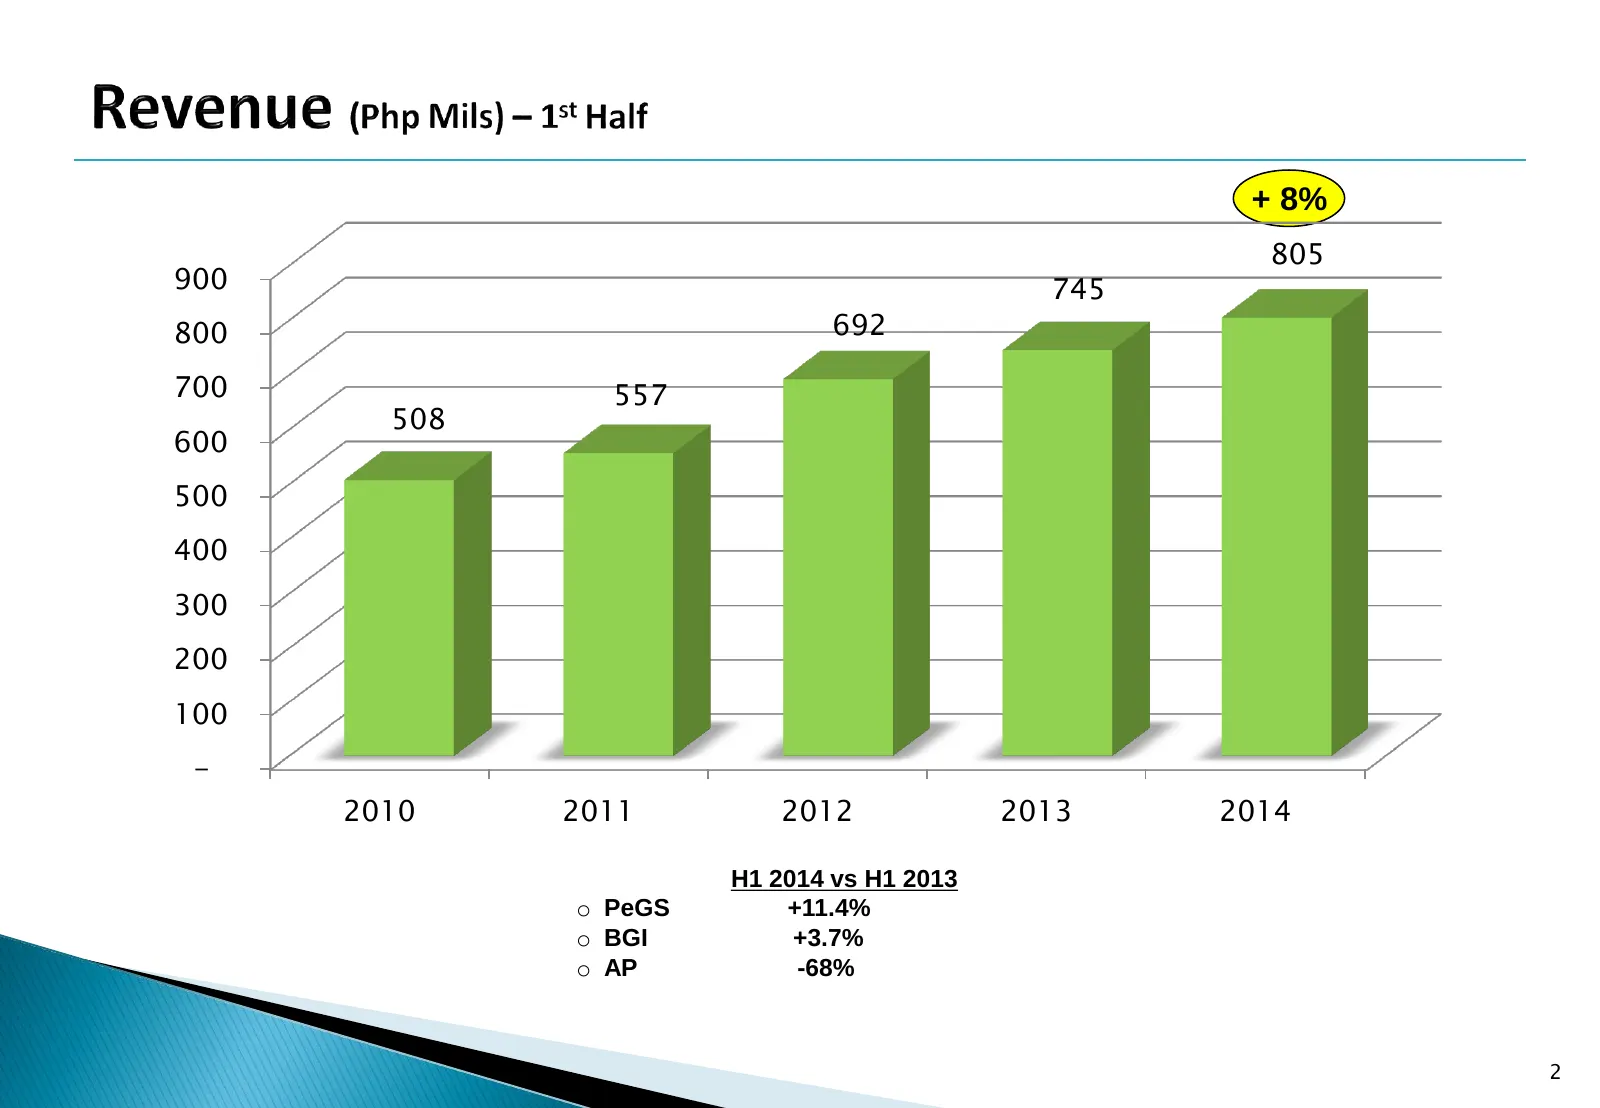
Slide 2: Revenue H1 2014 vs H1 2013 by segment
+ 8% 805 900 745 800 692 700 557 508 600 500 400 300 200 100 - 2010 2011 2012 2013 2014 H1 2014 vs H1 2013 o PeGS +11.4% o BGI +3.7% o AP -68% 2
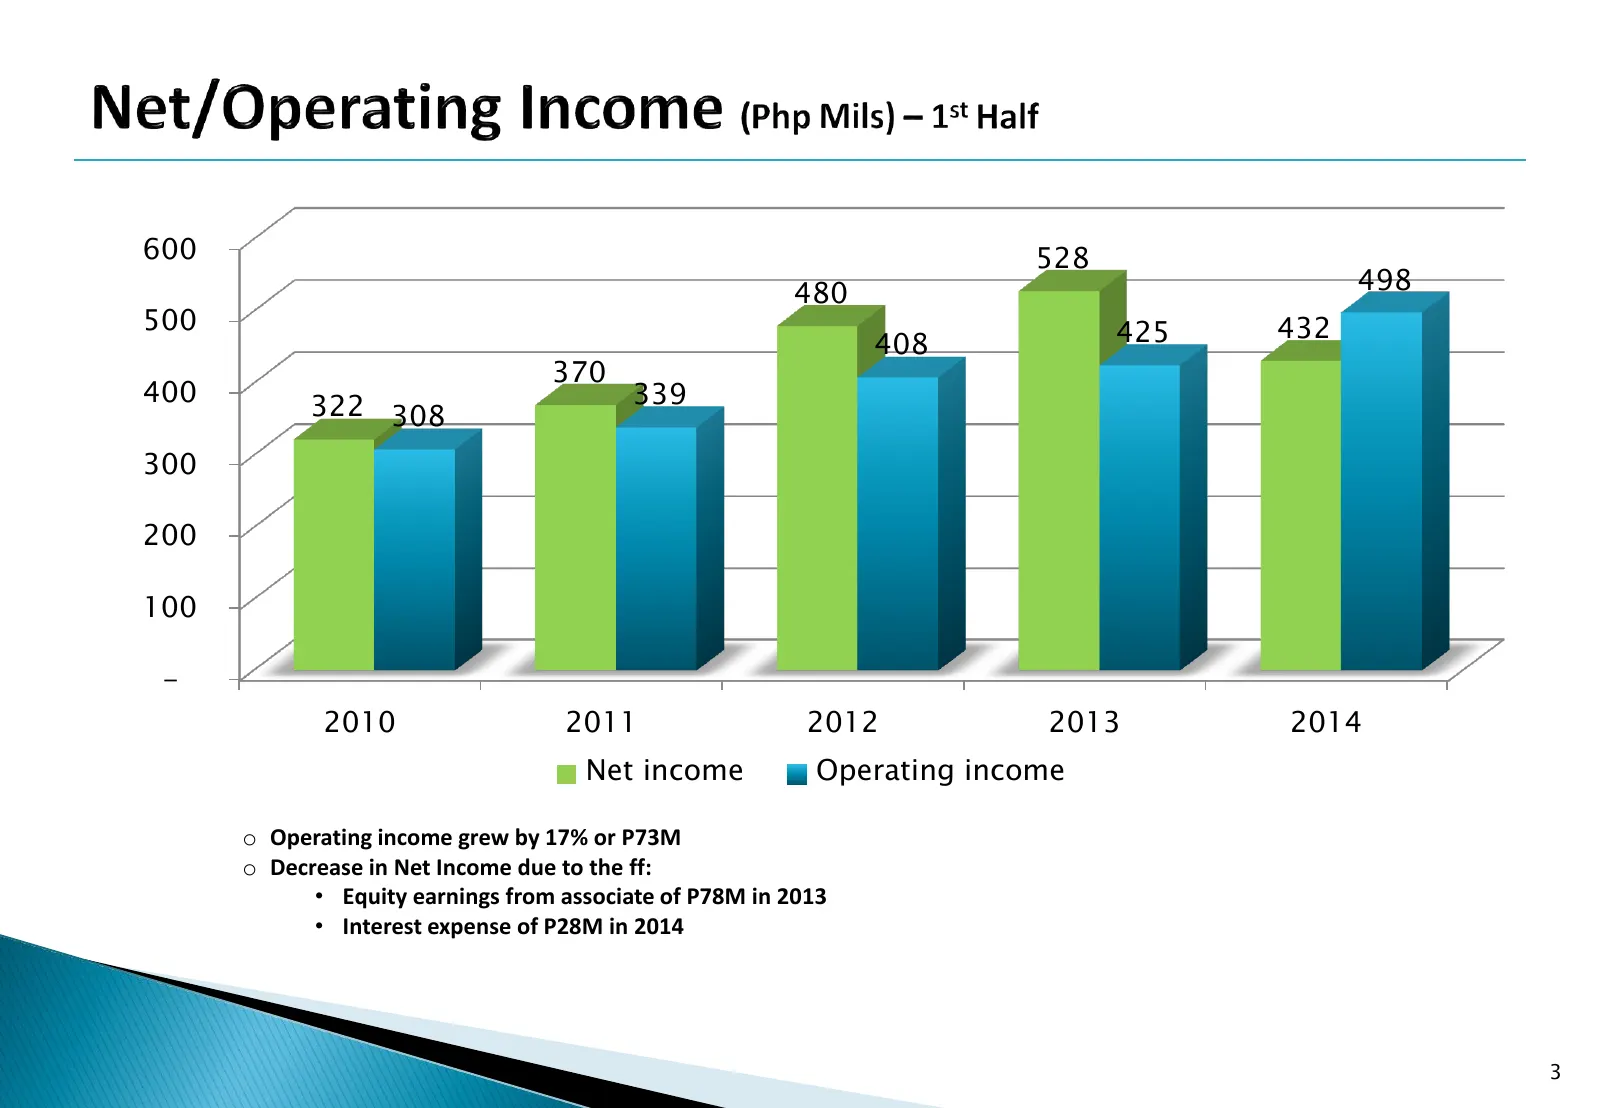
Slide 3: Net income and operating income
600 528 480 498 500 425 432 408 370 400 322 308 339 300 200 100 - 2010 2011 2012 2013 2014 Net income Operating income o Operating income grew by 17% or P73M o Decrease in Net Income due to the ff: • Equity earnings from associate of P78M in 2013 • Interest expense of P28M in 2014 3
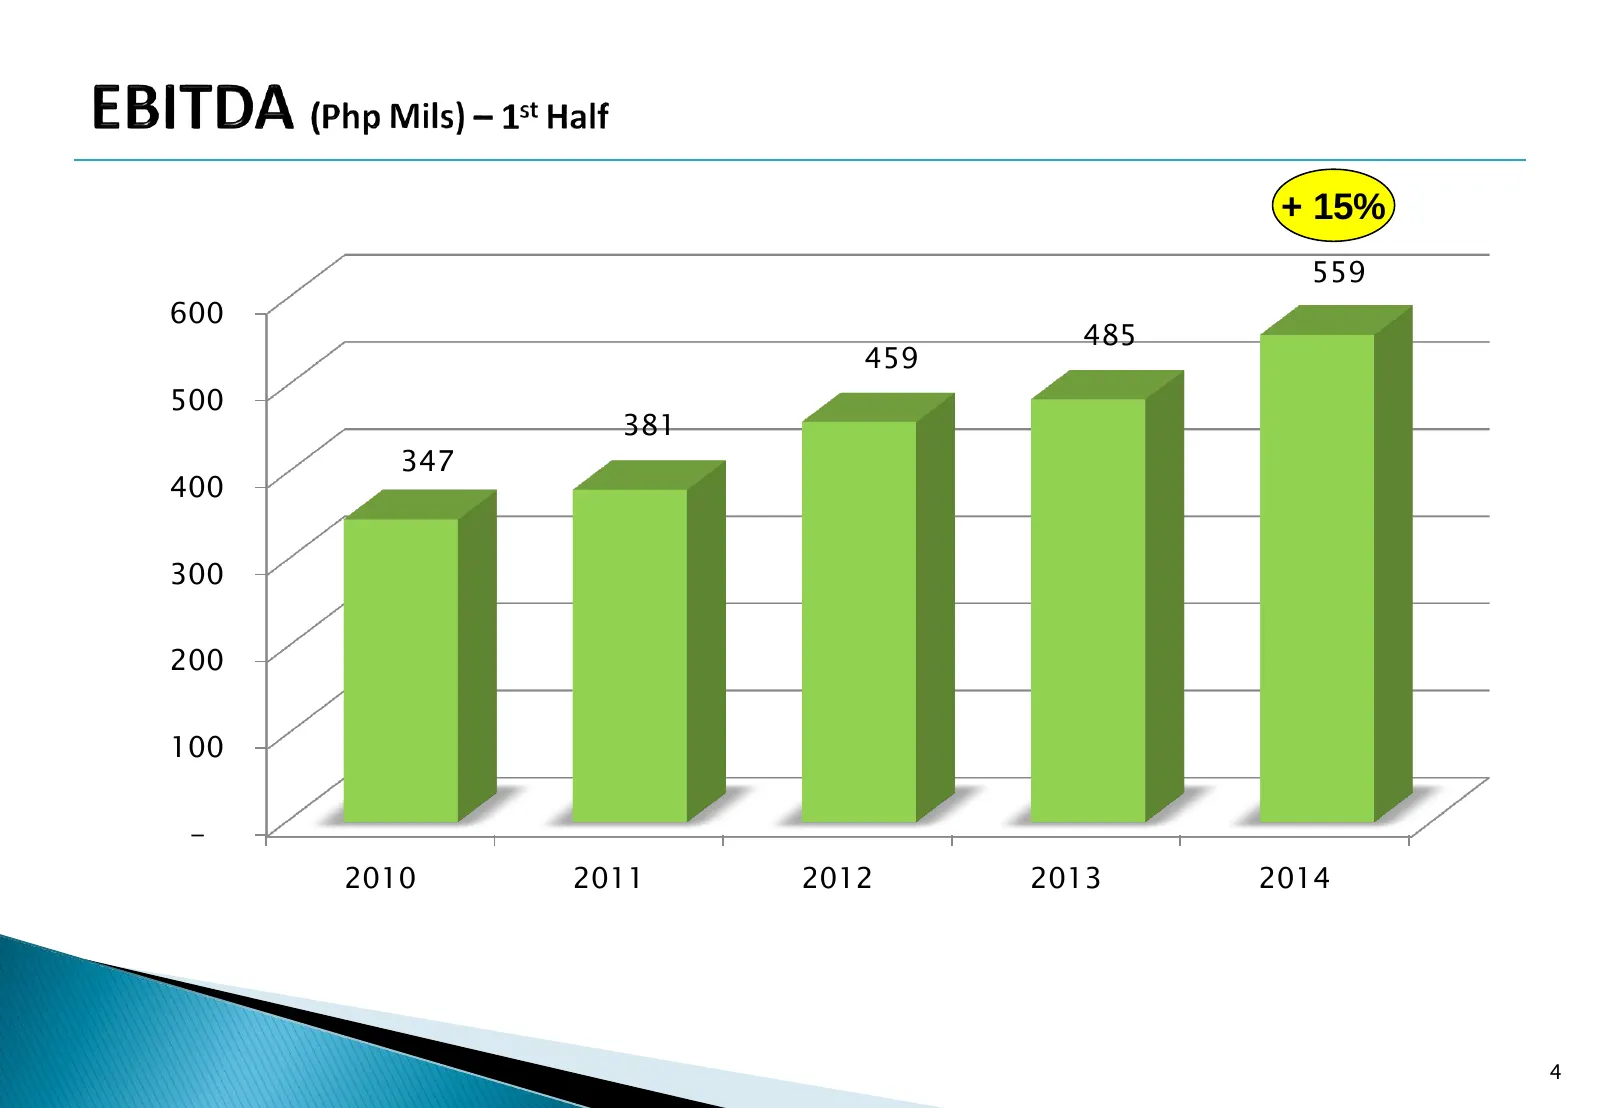
Slide 4: +15% growth
+ 15% 559 600 485 459 500 381 347 400 300 200 100 - 2010 2011 2012 2013 2014 4
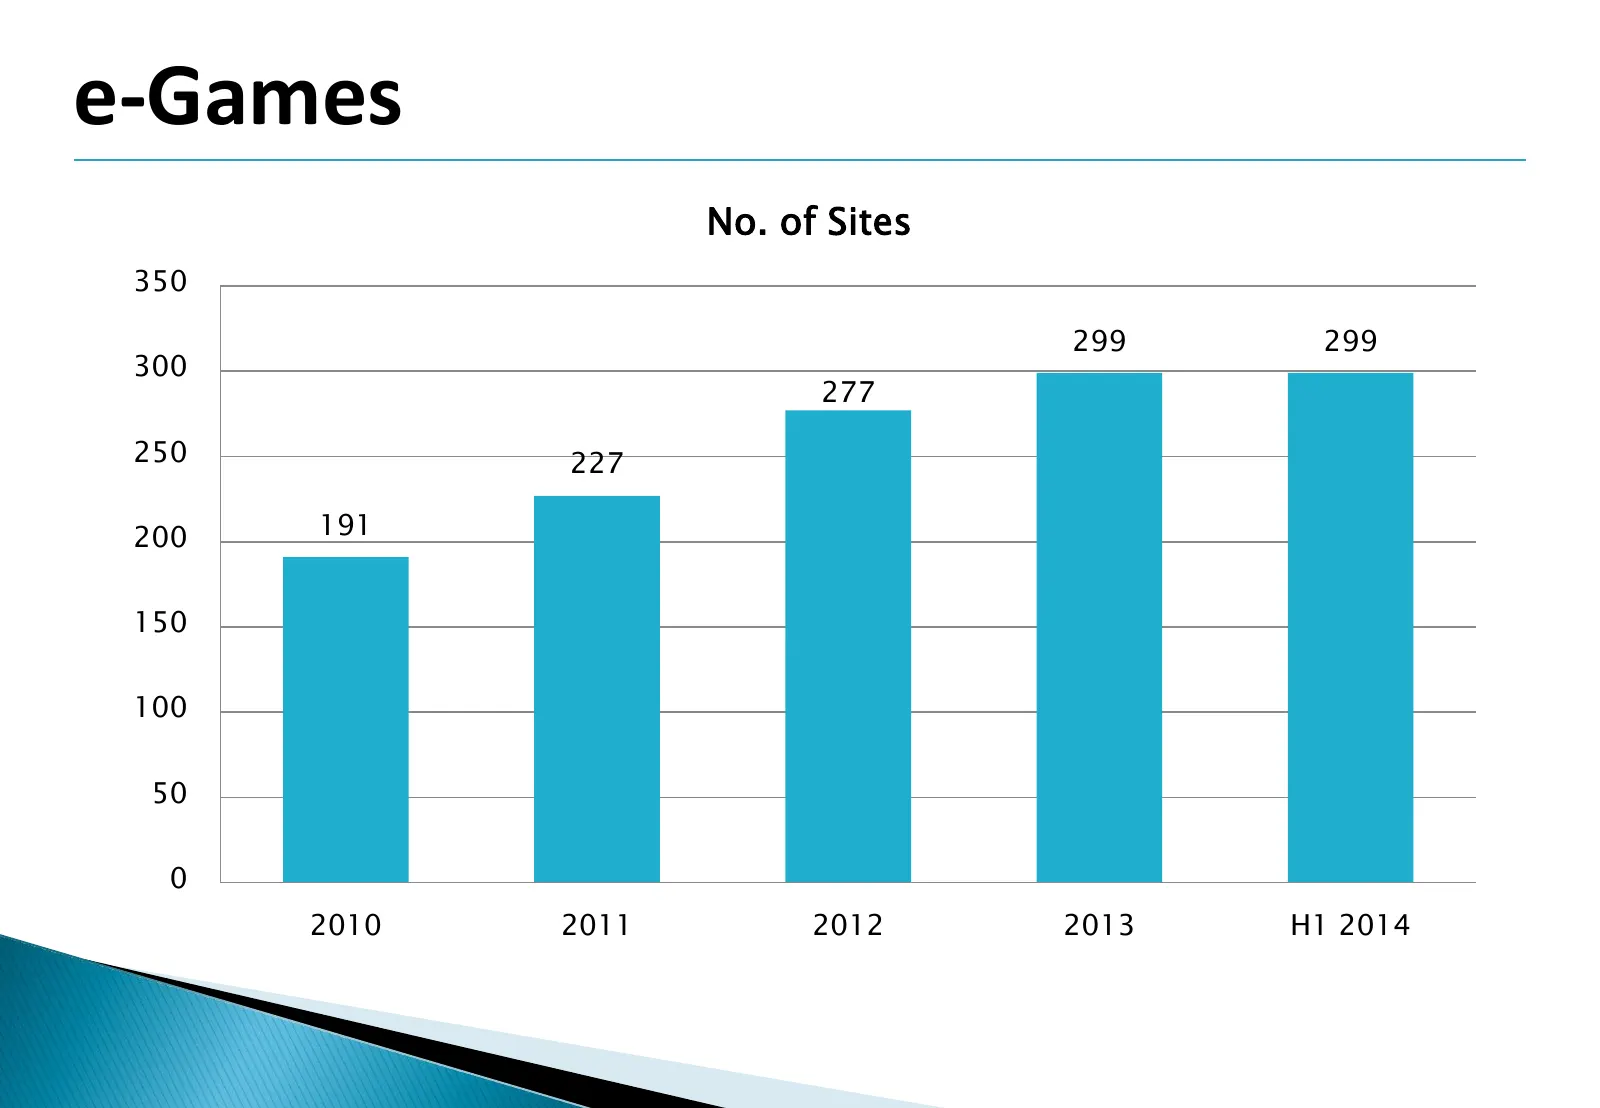
Slide 5: e-Games number of sites
e-Games No. of Sites 350 299 299 300 277 250 227 200 191 150 100 50 0 2010 2011 2012 2013 H1 2014
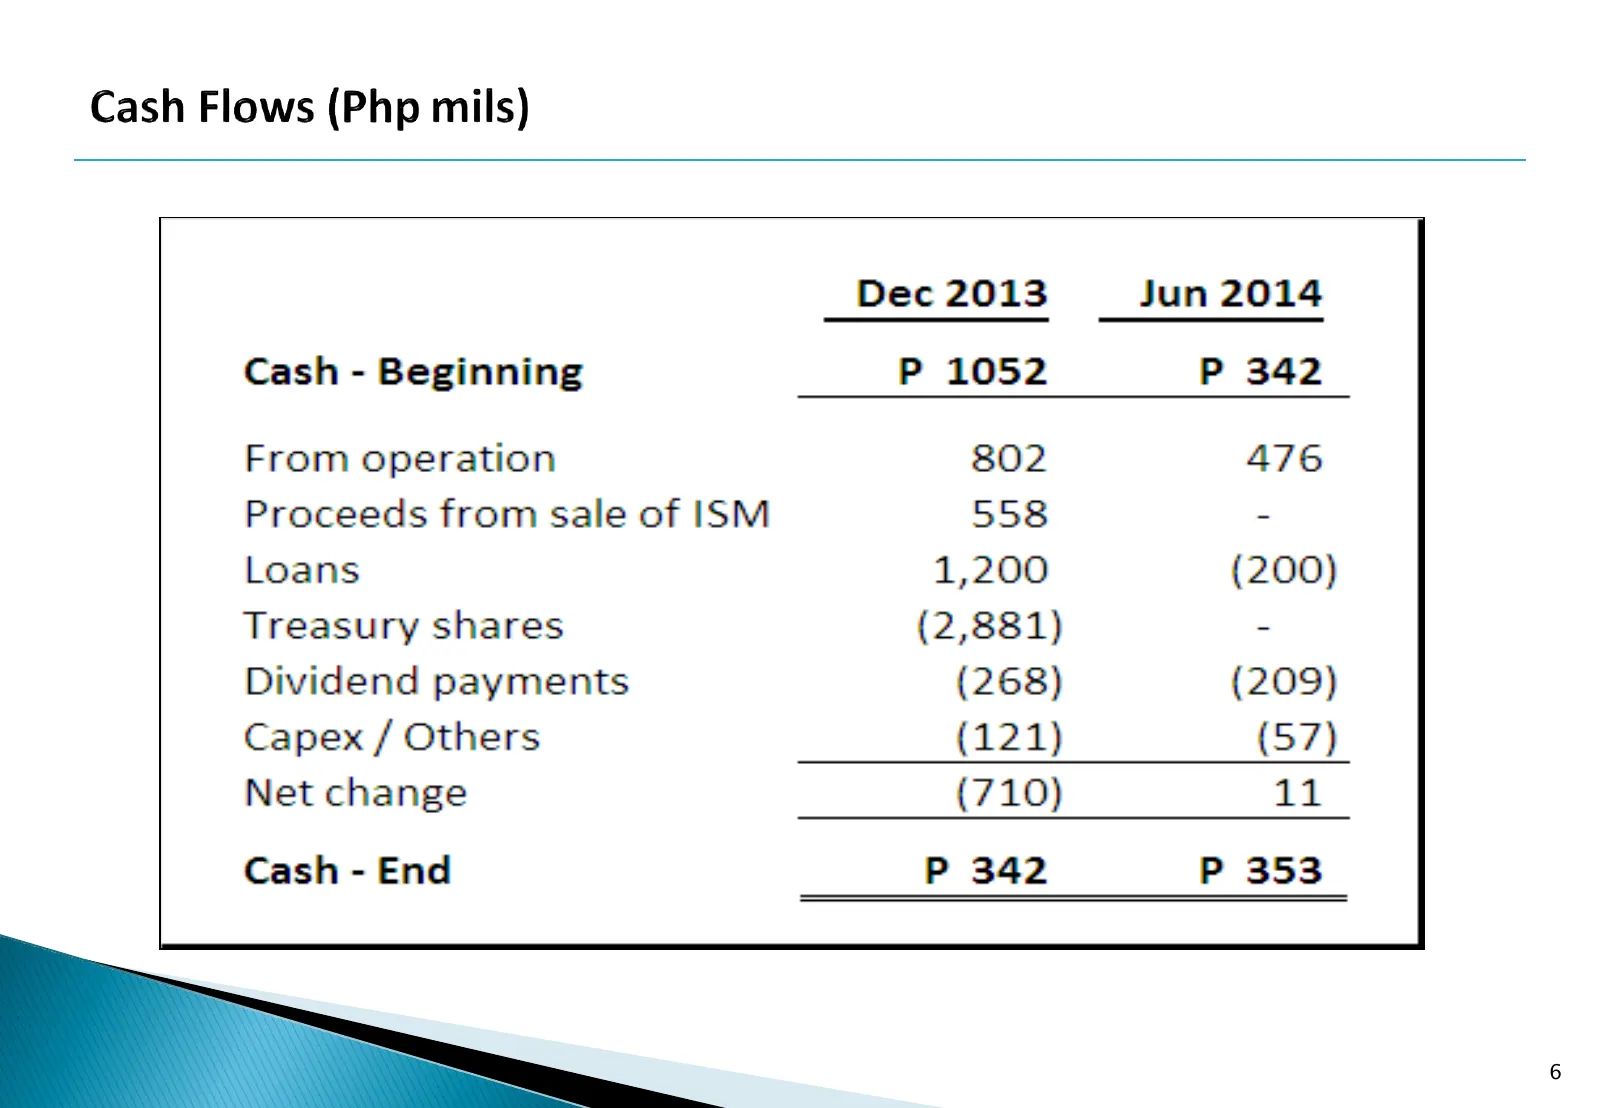
Slide 6: Cash Flows (Php mils)
Cash Flows (Php mils) Cash - Beginning From operation Proceeds from sale of ISM Loans Treasury shares Dividend payments Capex / Others Net change Cash - End Dec 2013 Jun 2014 P 1052 P 342 802 476 558 . 1,200 (200) (2,881) - (268) (209) (121) (57) (710) 11 P 342 P 353
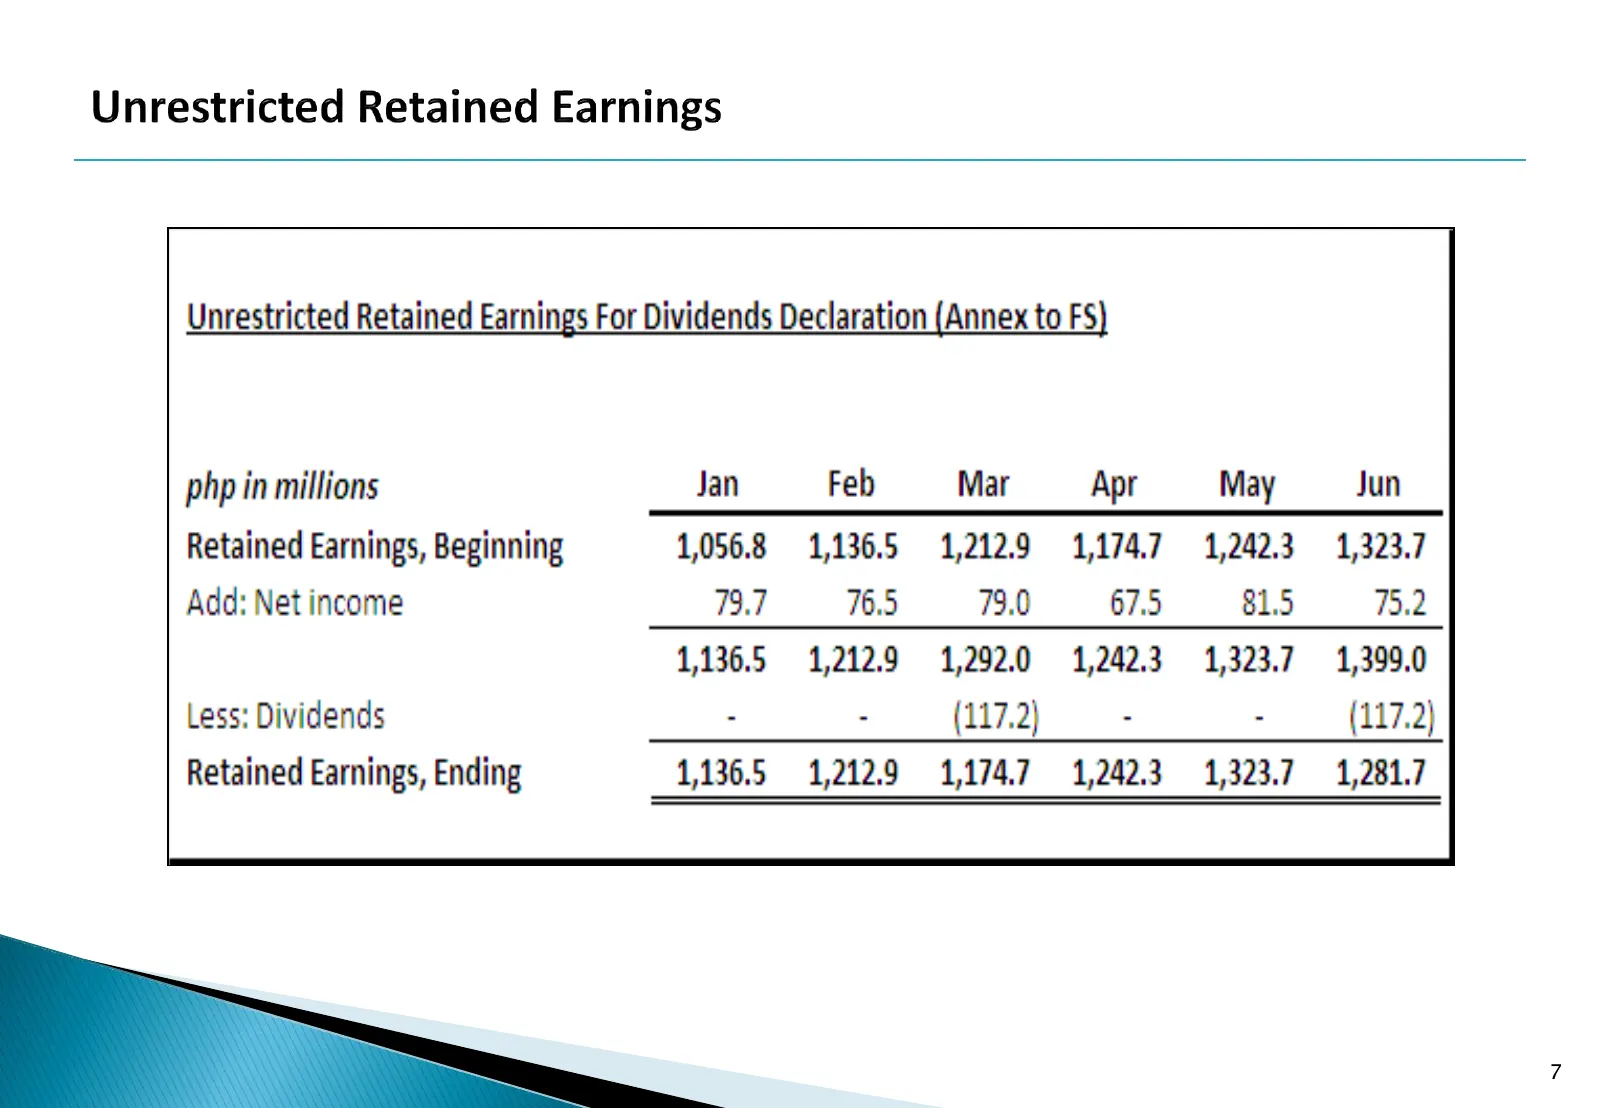
Slide 7: Unrestricted Retained Earnings
Unrestricted Retained Earnings Unrestricted Retained Earnings For Dividends Declaration (Annex to FS php in millions Jan Feb Mar Apr May Jun Retained Earnings, Beginning 1,056.8 1,136.5 1,212.9 1,174.7 1,242.3 1,323.7 Add: Net income 79.7 76.5 73.0 67.5 815 75.2 1,136.5 1,212.9 1,292.0 1,242.3 1,323

Slide 8: End
End
Source: Internet Archive copy of philweb.com.ph