Befesa SA · XETR:BFSA
Befesa SA — Santander Iberian Conference 2024
84 slides from Befesa SA's conference presentation, January 2024
Slide 1: Santander Iberian Conference 2024
2023 Santander Iberian Conference 2024 January 2024
Slide 2: Disclaimer
Disclaimer This presentation contains forward-looking statements and information relating to Befesa and its affiliates that are based on the beliefs of its management, including assumptions, opinions and views of Befesa and its affiliates as well as information cited from third party sources. Such s
Slide 3: Business update
01 Business update
Slide 4: Executive summary of Q3 2023
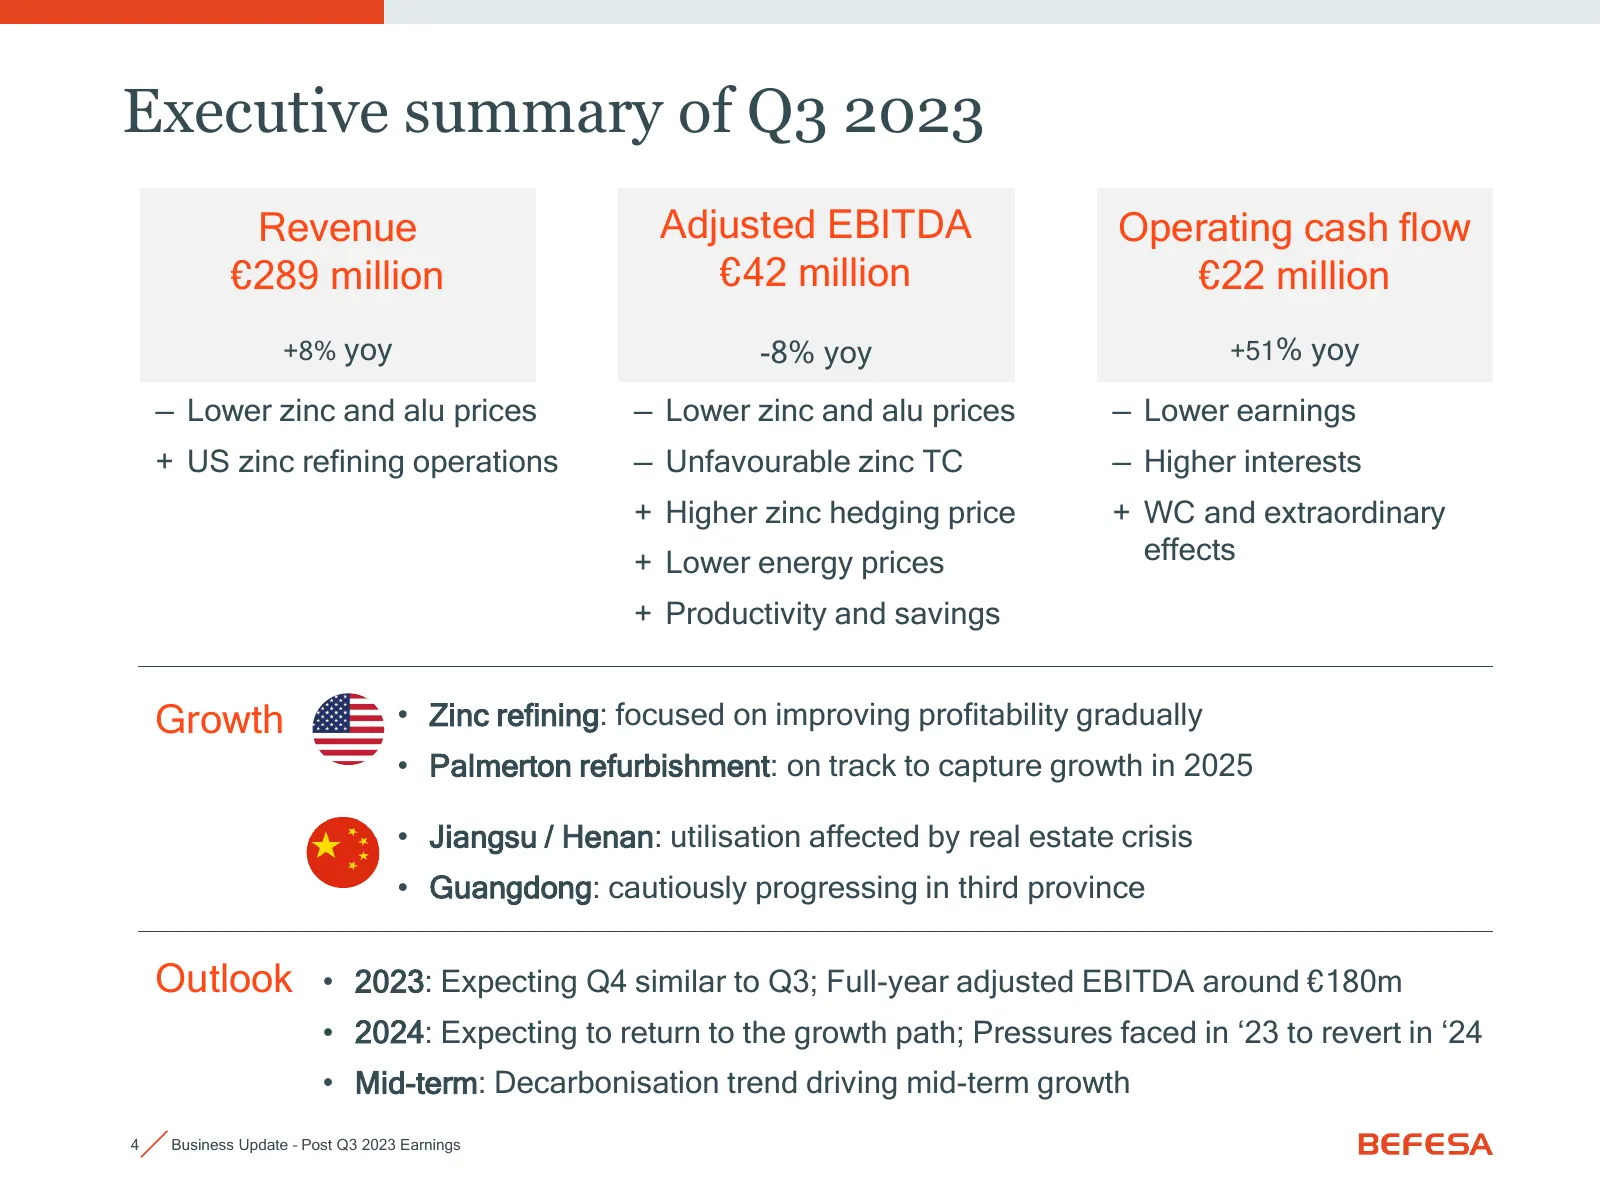
Executive summary of Q3 2023 Revenue Adjusted EBITDA Operating cash flow €289 million €42 million €22 million +8% yoy -8% yoy +51% yoy — Lower zinc and alu prices — Lower zinc and alu prices — Lower earnings + US zinc refining operations — Unfavourable zinc TC — Higher interests + Higher zinc hedgin
Slide 5: Consolidated key financials
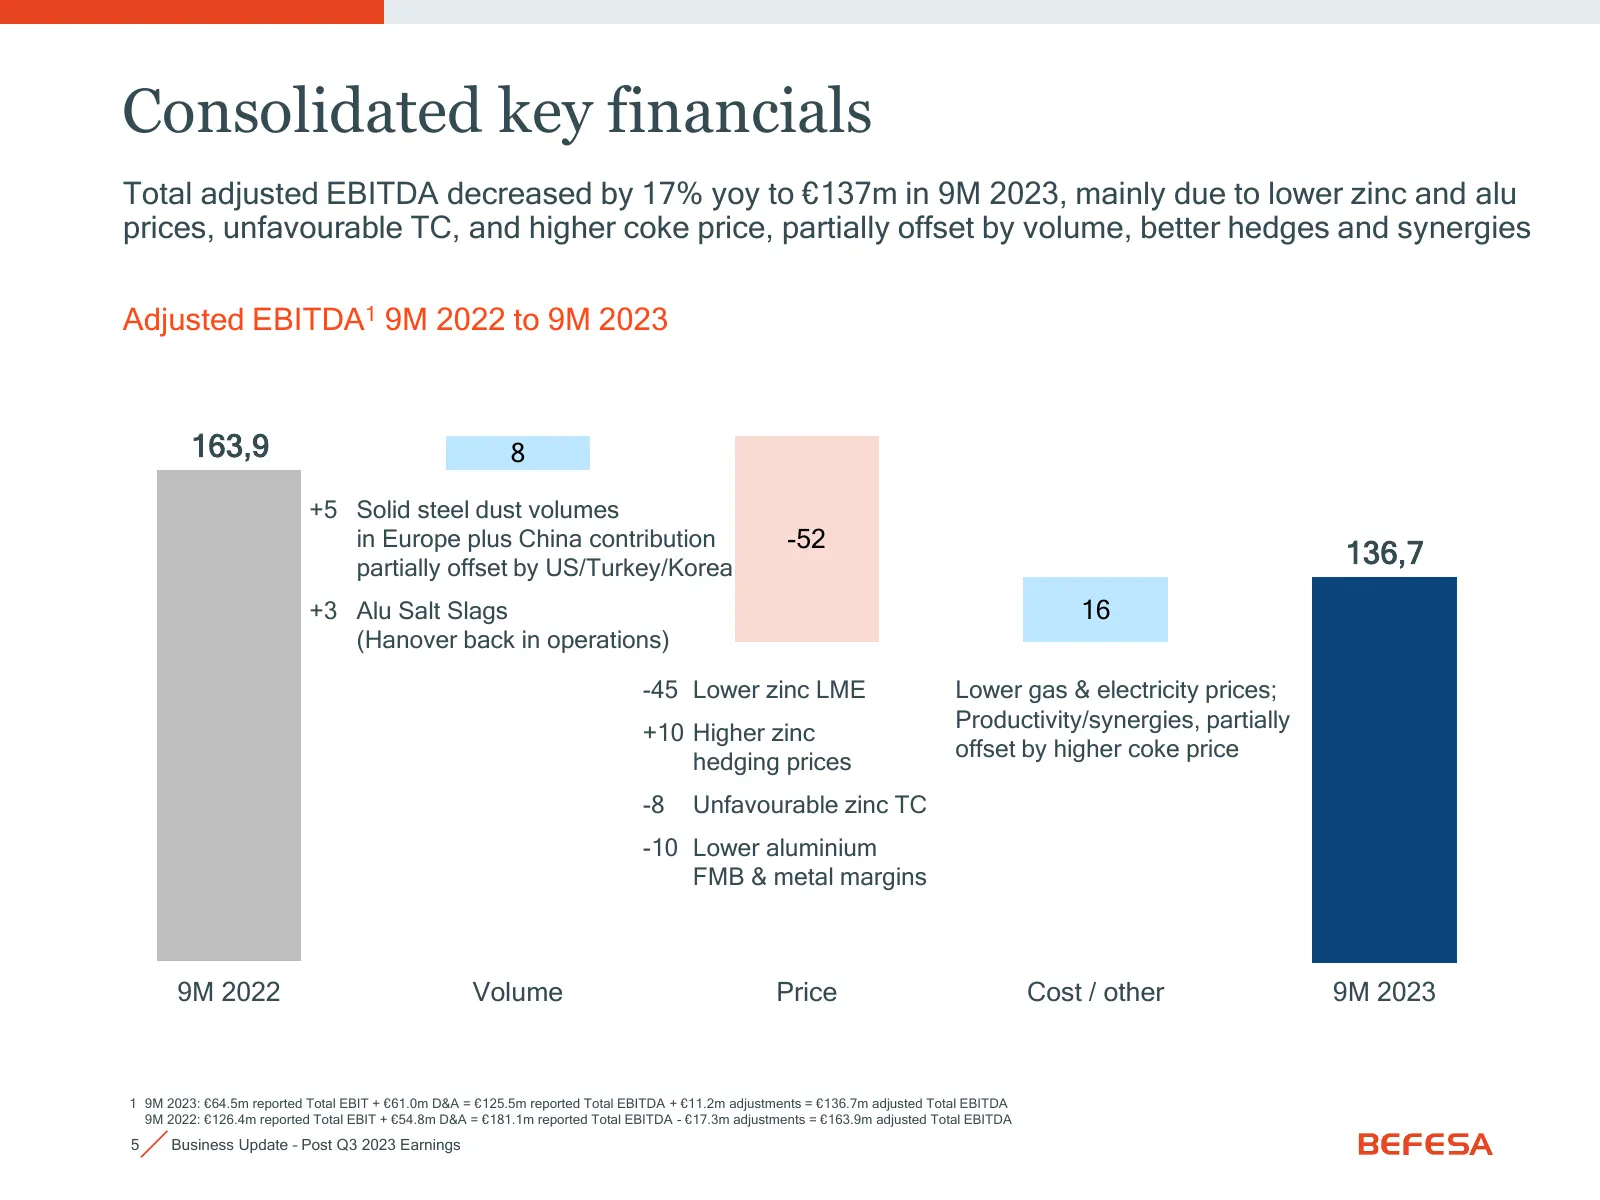
Consolidated key financials Total adjusted EBITDA decreased by 17% yoy to €137m in 9M 2023, mainly due to lower zinc and alu prices, unfavourable TC, and higher coke price, partially offset by volume, better hedges and synergies Adjusted EBITDA1 9M 2022 to 9M 2023 163,9 8 +5 Solid steel dust volumes
Slide 6: Key volume drivers and impact on Befesa 9M 2023
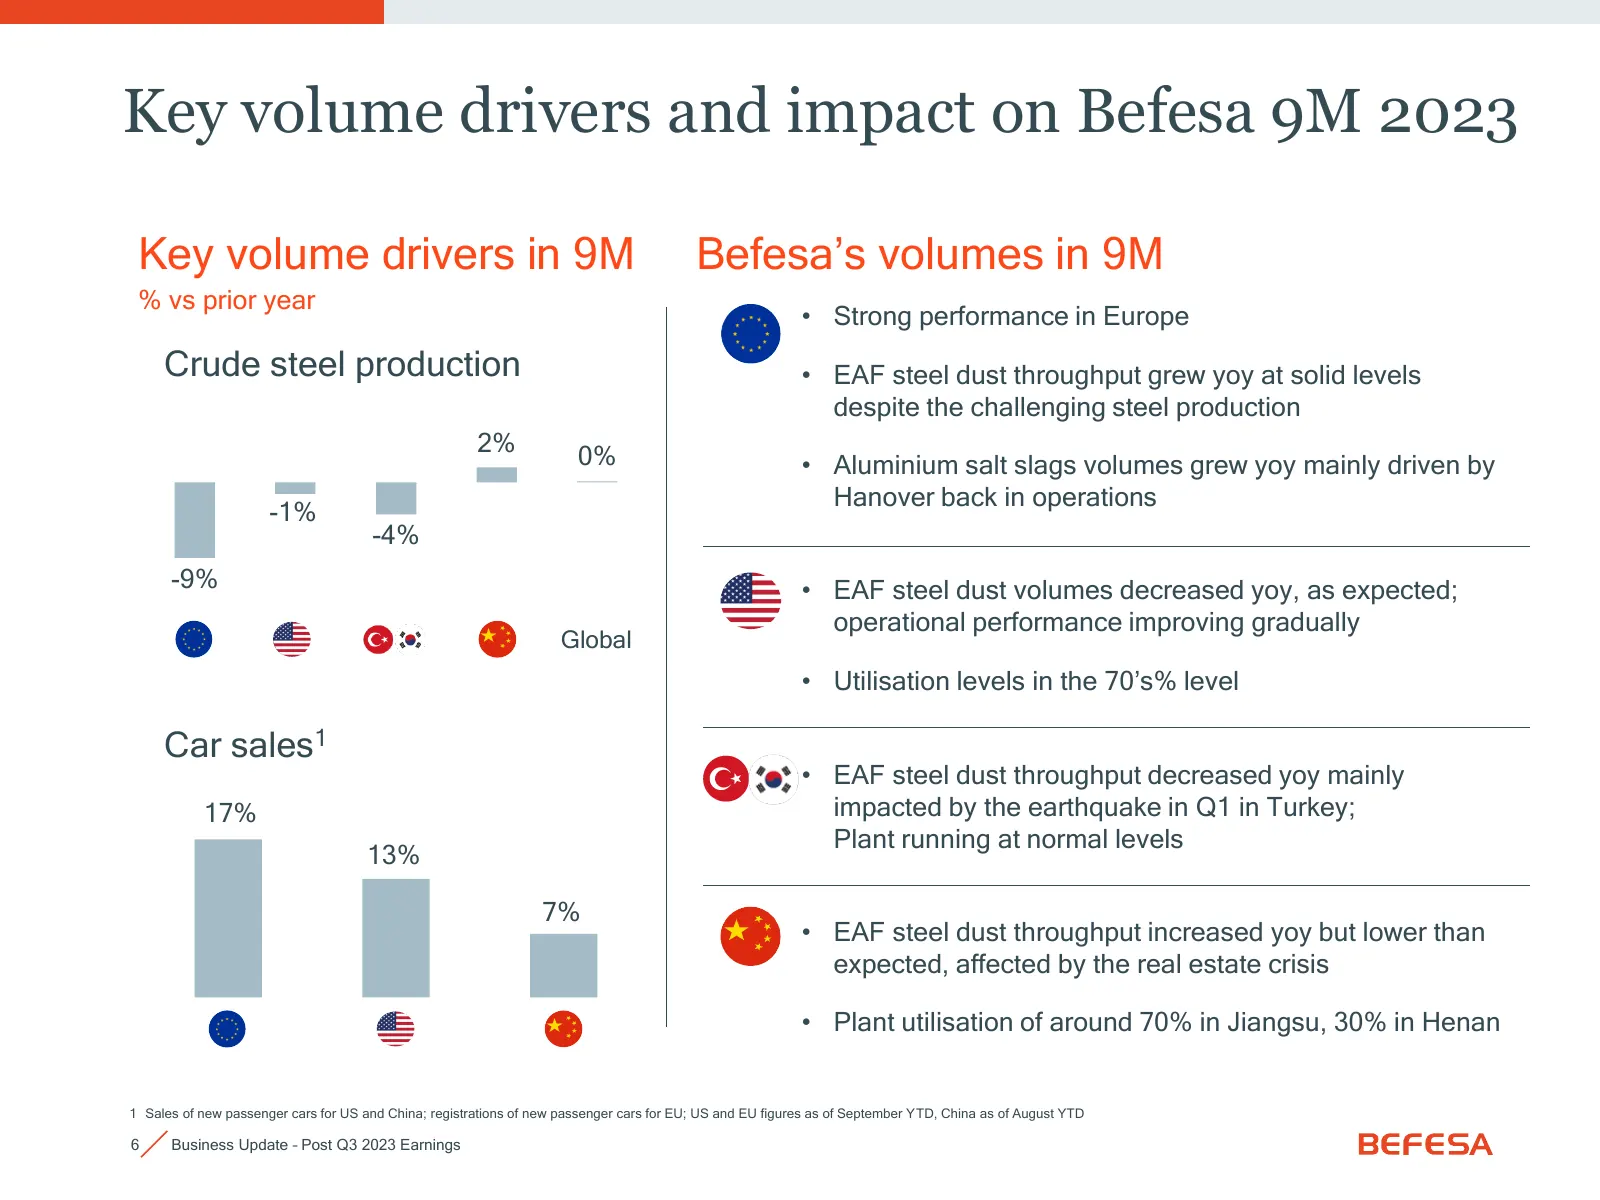
Key volume drivers and impact on Befesa 9M 2023 Key volume drivers in 9M Befesa’s volumes in 9M % vs prior year • Strong performance in Europe Crude steel production • EAF steel dust throughput grew yoy at solid levels despite the challenging steel production 2% 0% • Aluminium salt slags volumes gre
Slide 7: The current decrease in zinc prices is one of the largest in 15 years
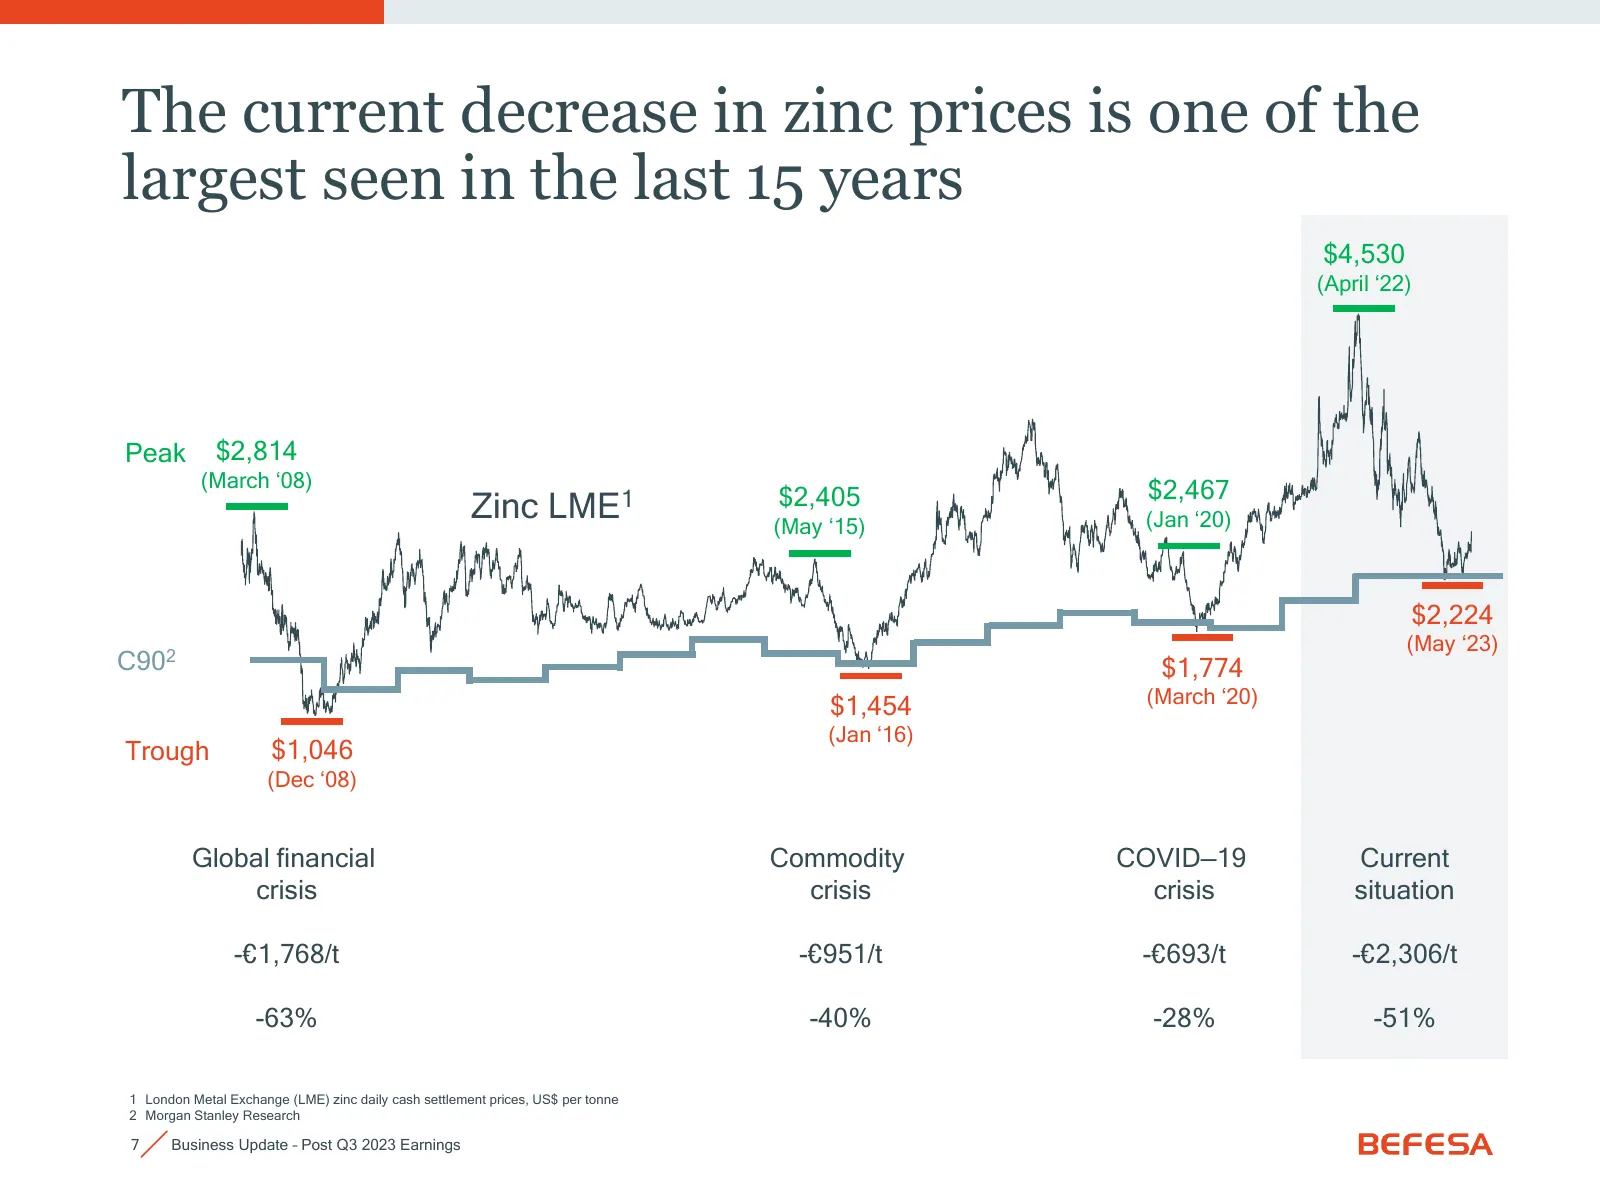
The current decrease in zinc prices is one of the largest seen in the last 15 years $4,530 (April ‘22) Peak $2,814 (March ‘08) $2,405 $2,467 Zinc LME1 (May ‘15) (Jan ‘20) $2,224 (May ‘23) C902 $1,774 $1,454 (March ‘20) (Jan ‘16) Trough $1,046 (Dec ‘08) Global financial Commodity COVID—19 Current cri
Slide 8: 2023 impacted by high TC in a very volatile zinc price environment
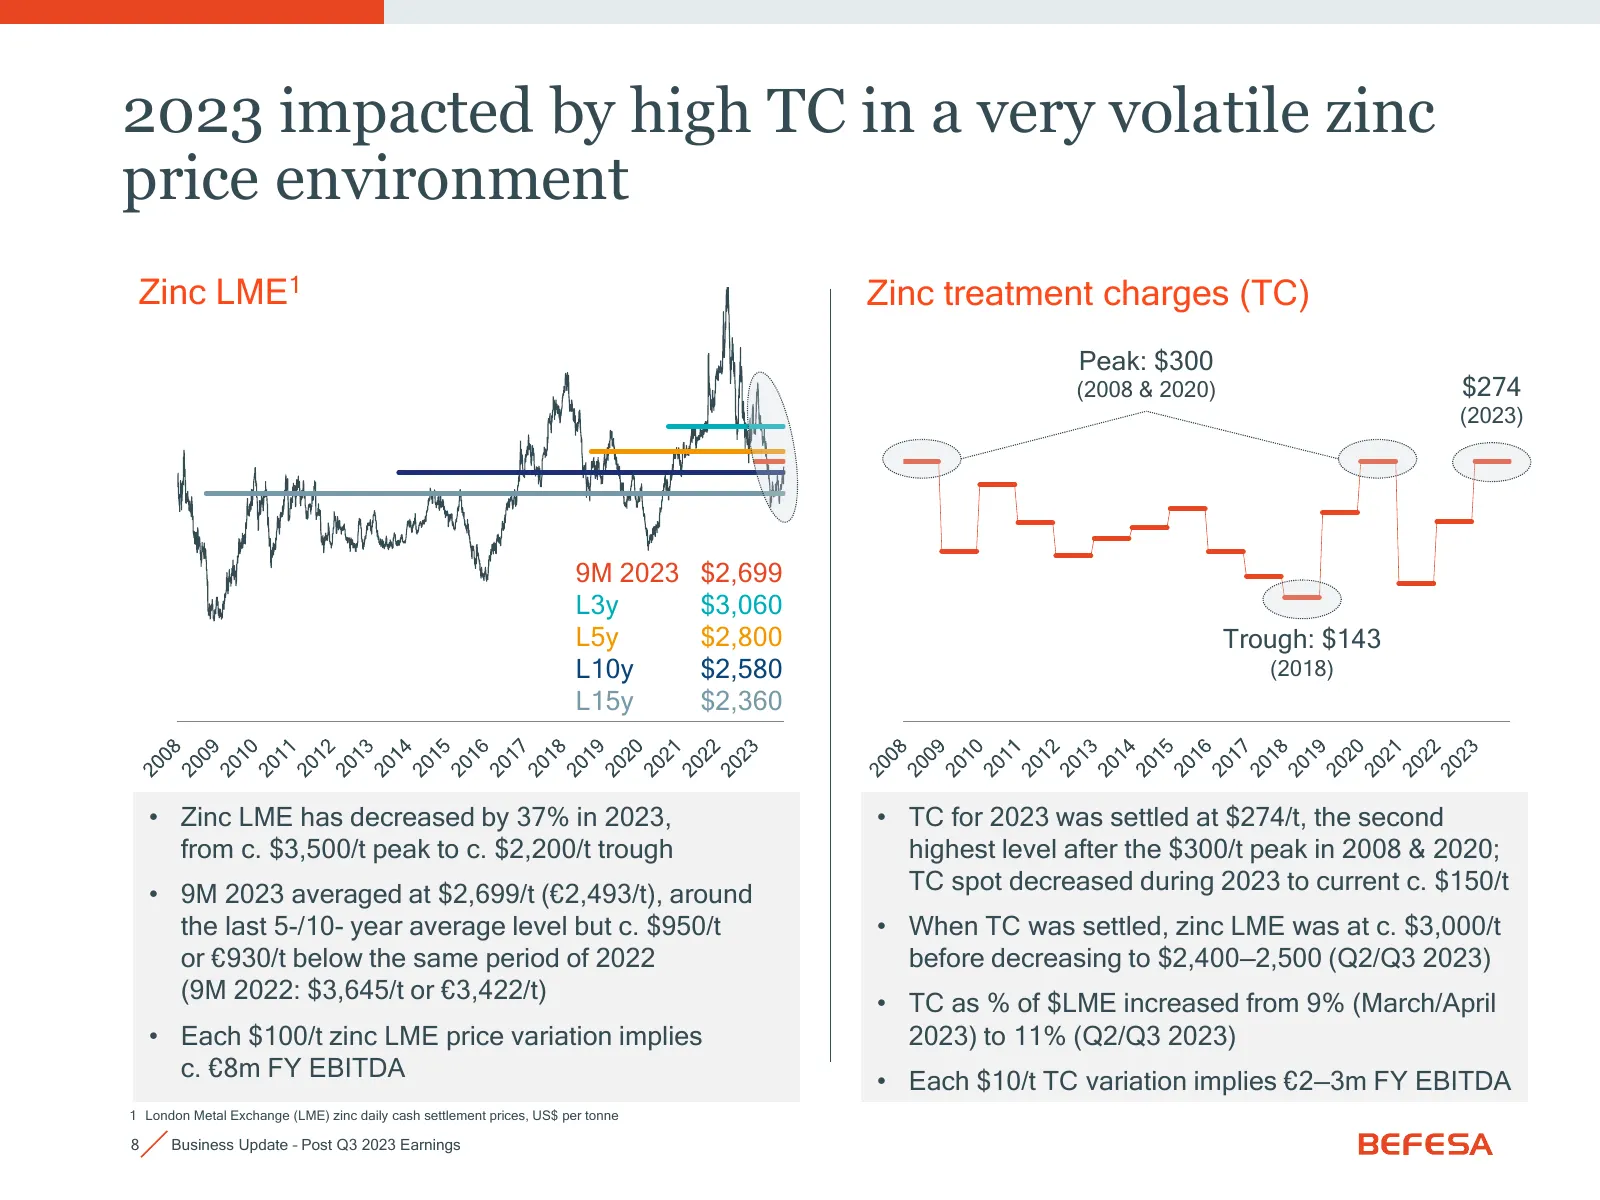
2023 impacted by high TC in a very volatile zinc price environment Zinc LME1 Zinc treatment charges (TC) Peak: $300 (2008 & 2020) $274 (2023) 9M 2023 $2,699 L3y $3,060 L5y $2,800 Trough: $143 L10y $2,580 (2018) L15y $2,360 • Zinc LME has decreased by 37% in 2023, • TC for 2023 was settled at $274/t,
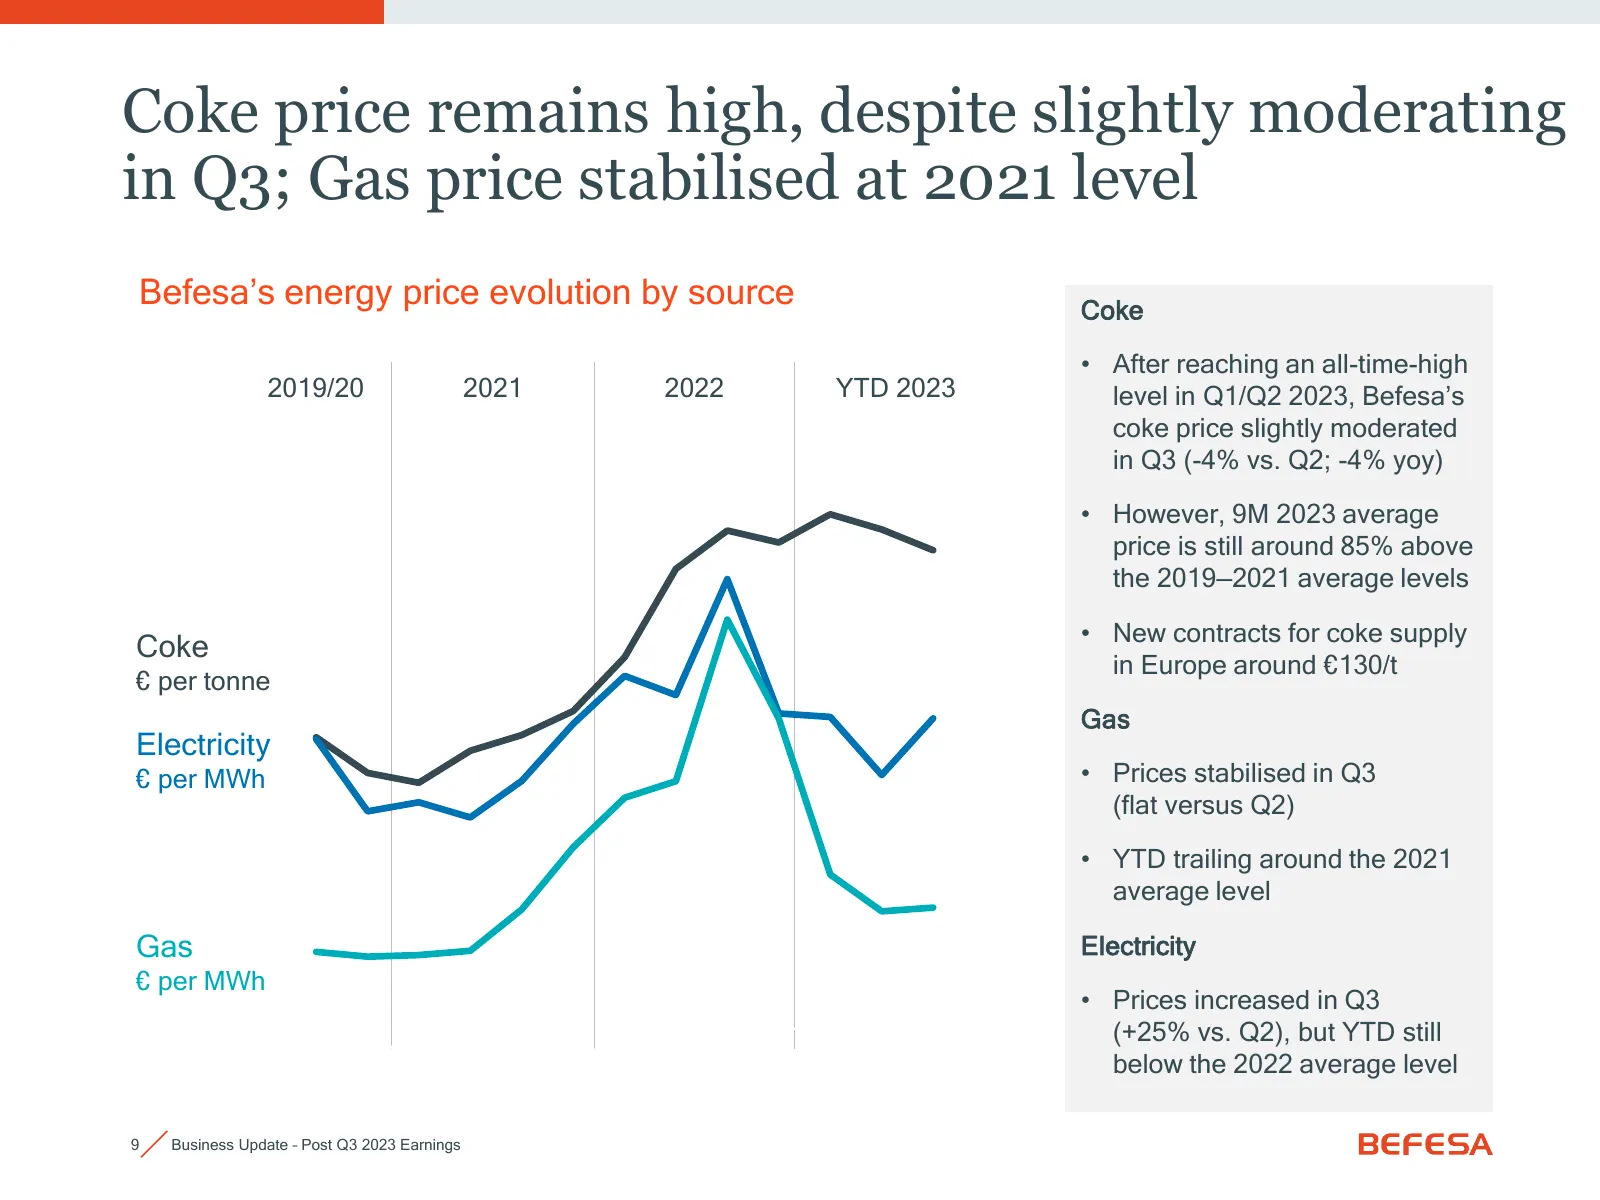
Slide 9: Coke price remains high; gas price stabilised at 2021 level
Coke price remains high, despite slightly moderating in Q3; Gas price stabilised at 2021 level Befesa’s energy price evolution by source Coke • After reaching an all-time-high 2019/20 2021 2022 YTD 2023 level in Q1/Q2 2023, Befesa’s coke price slightly moderated in Q3 (-4% vs. Q2; -4% yoy) 250 250 •
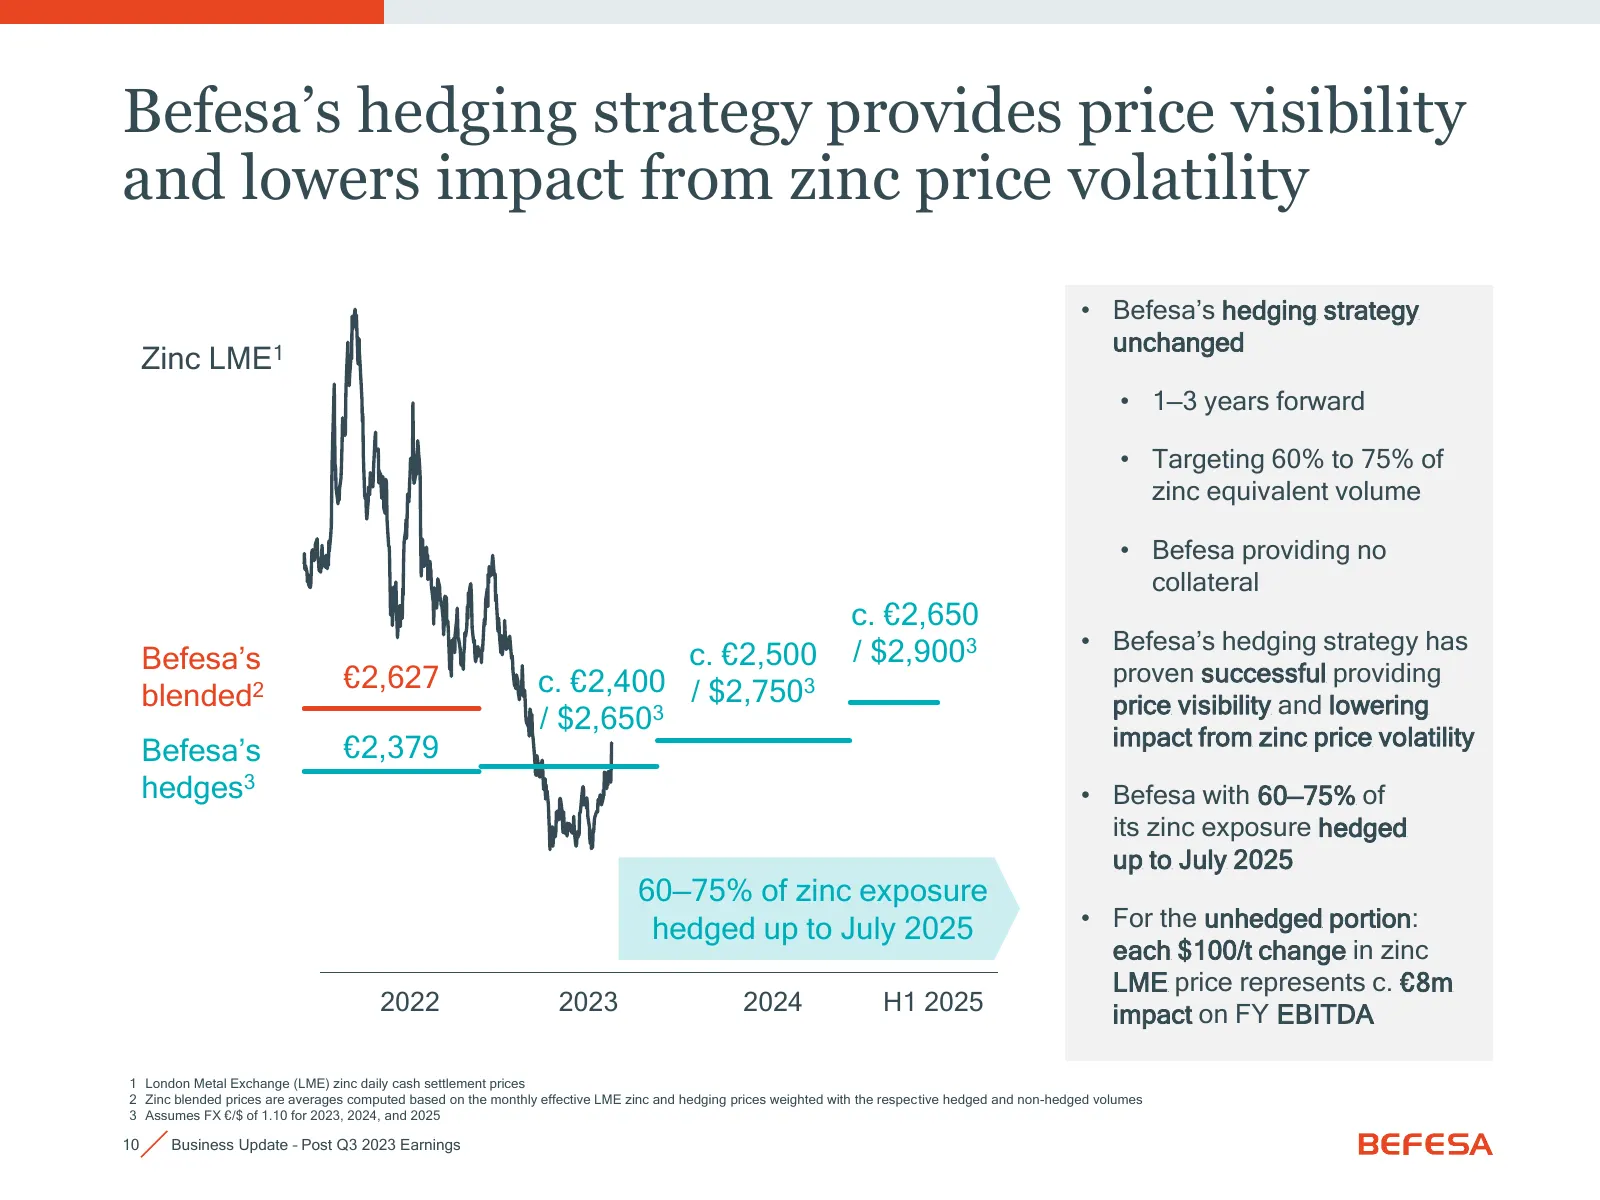
Slide 10: Befesa's hedging strategy provides price visibility
Befesa’s hedging strategy provides price visibility and lowers impact from zinc price volatility • Befesa’s hedging strategy unchanged Zinc LME1 • 1—3 years forward • Targeting 60% to 75% of zinc equivalent volume • Befesa providing no collateral c. €2,650 / $2,9003 • Befesa’s hedging strategy has B
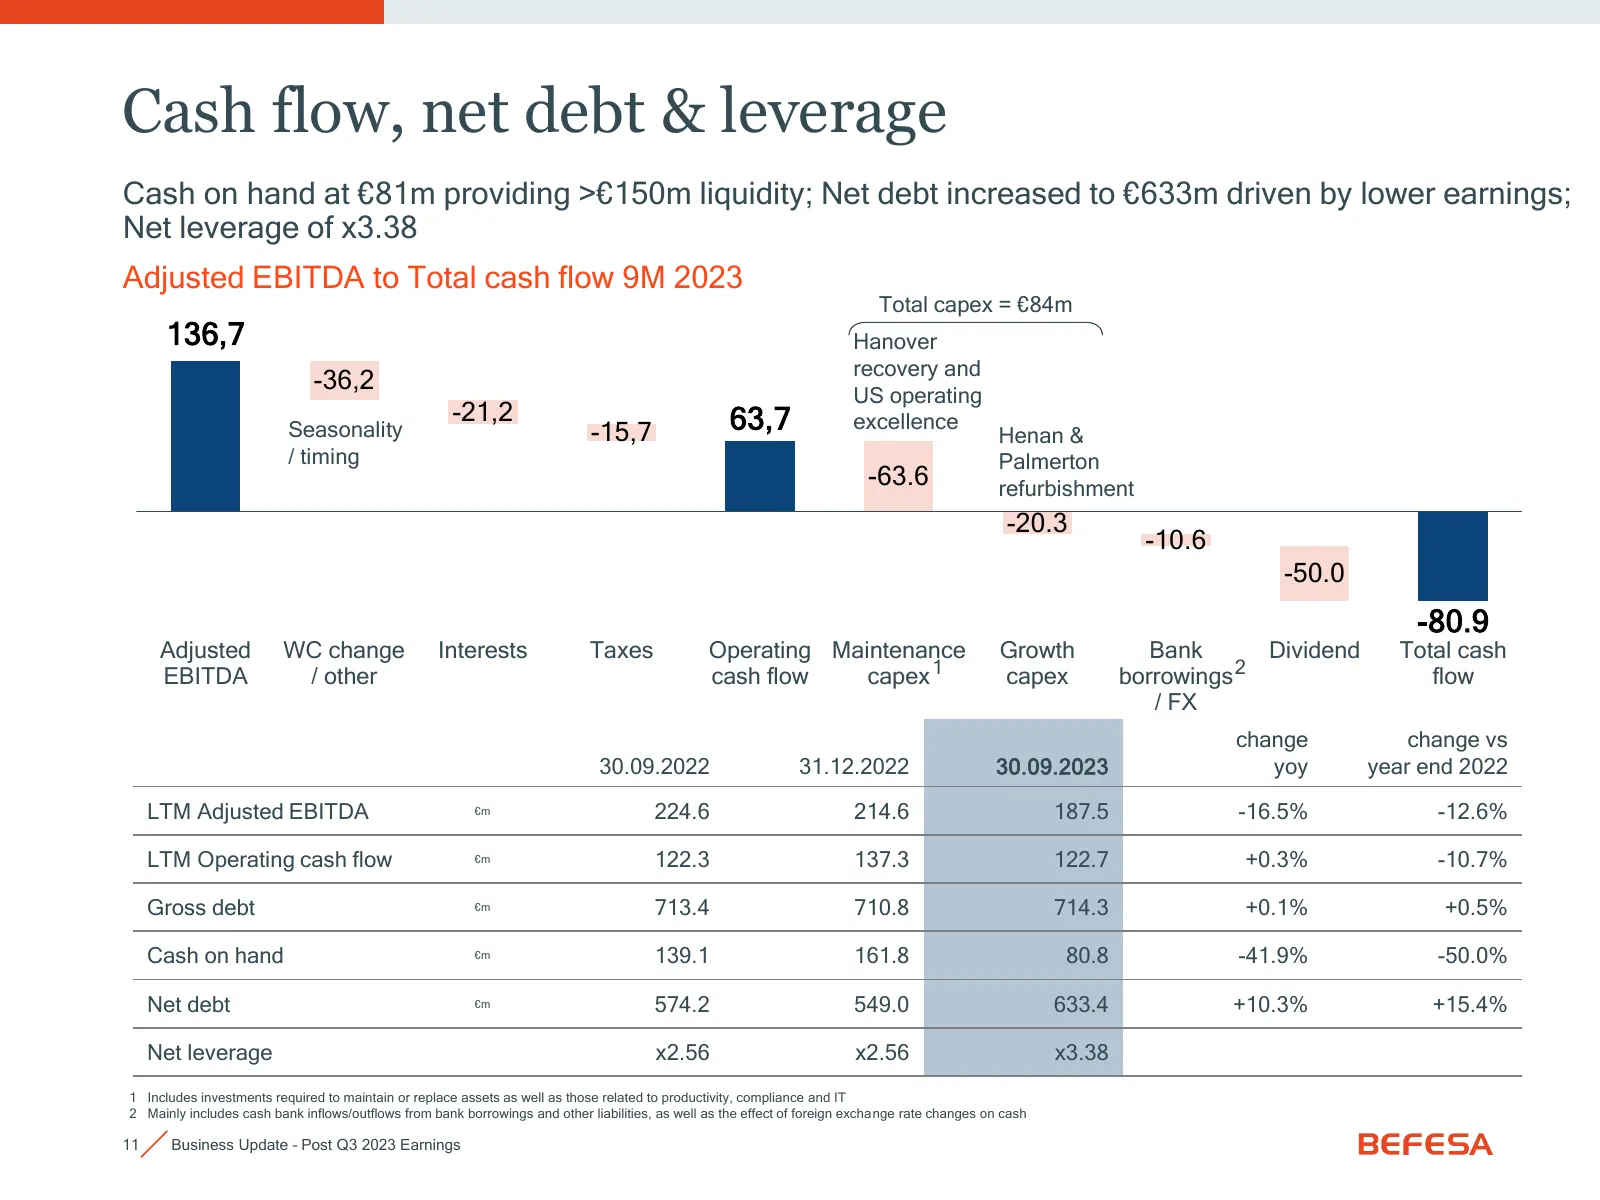
Slide 11: Cash flow, net debt & leverage
Cash flow, net debt & leverage Cash on hand at €81m providing >€150m liquidity; Net debt increased to €633m driven by lower earnings; Net leverage of x3.38 Adjusted EBITDA to Total cash flow 9M 2023 Total capex = €84m 136,7 Hanover recovery and -36,2 US operating -21,2 63,7 excellence Seasonality -1
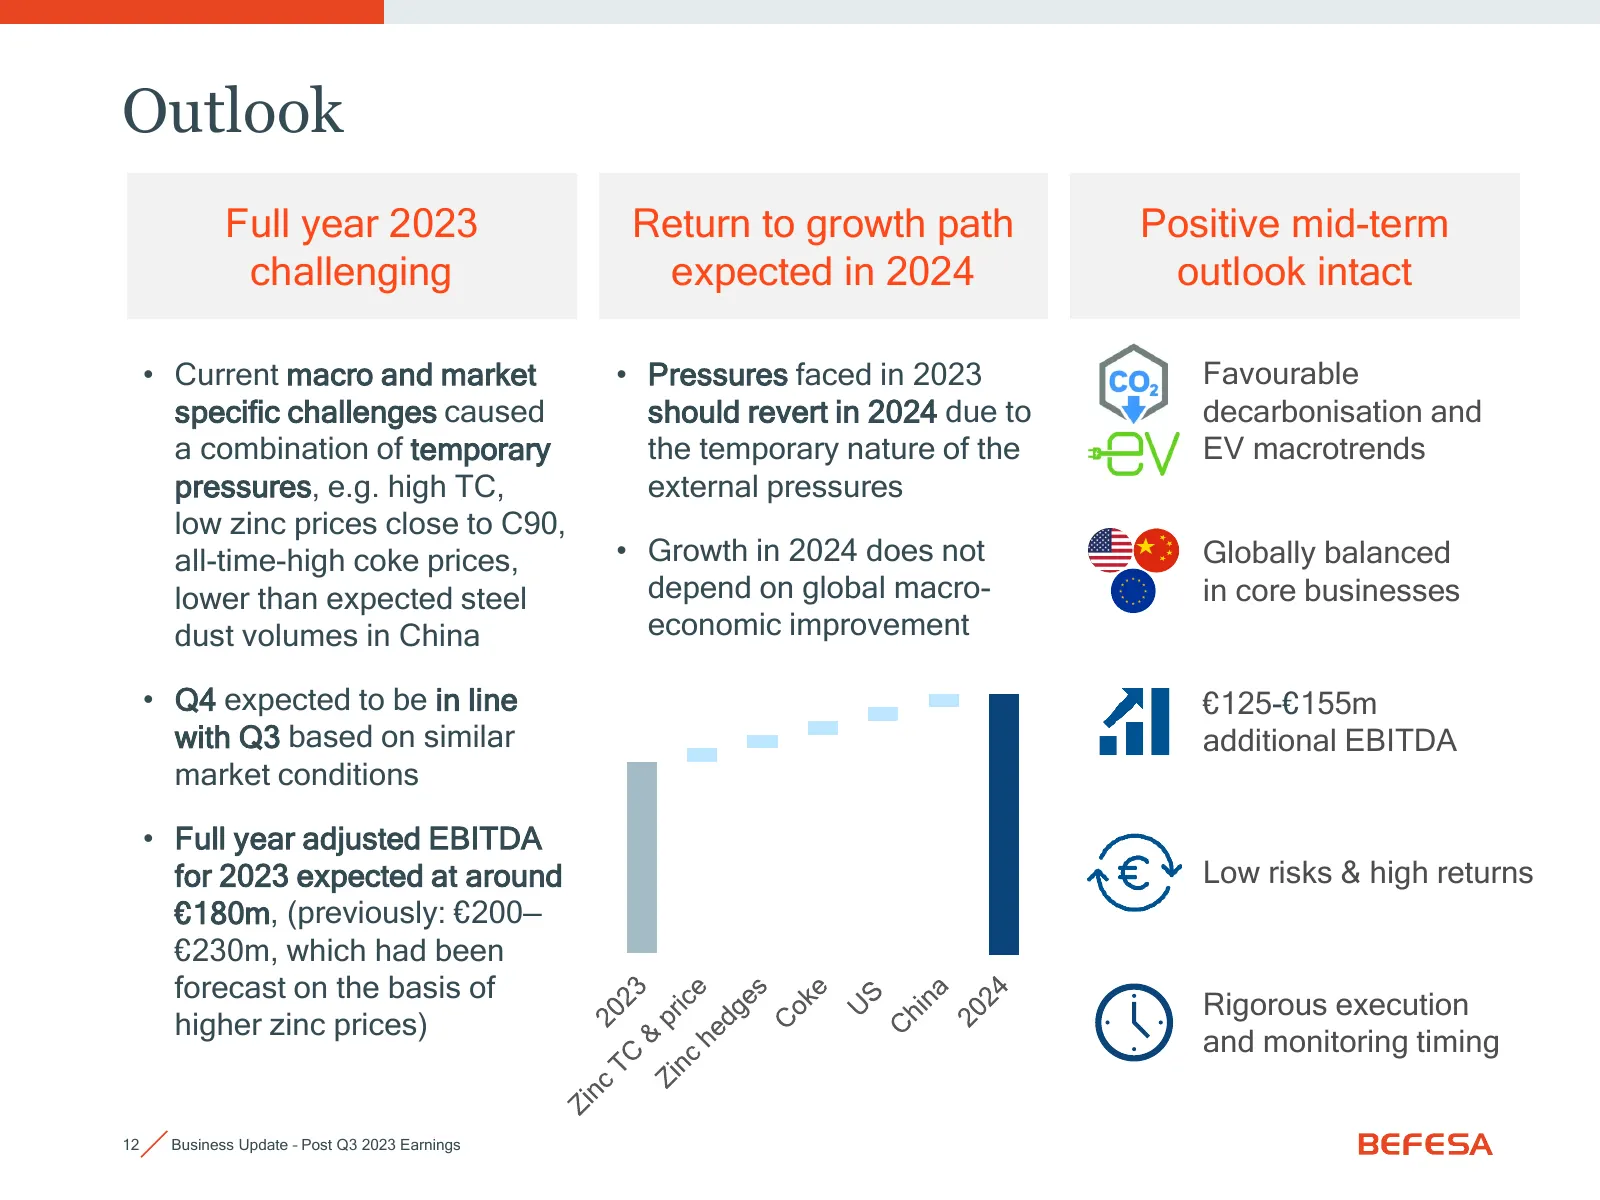
Slide 12: Outlook
Outlook Full year 2023 Return to growth path Positive mid-term challenging expected in 2024 outlook intact • Current macro and market • Pressures faced in 2023 Favourable specific challenges caused should revert in 2024 due to decarbonisation and a combination of temporary the temporary nature of th
Slide 13: Decarbonisation driving EAF steel production in key markets
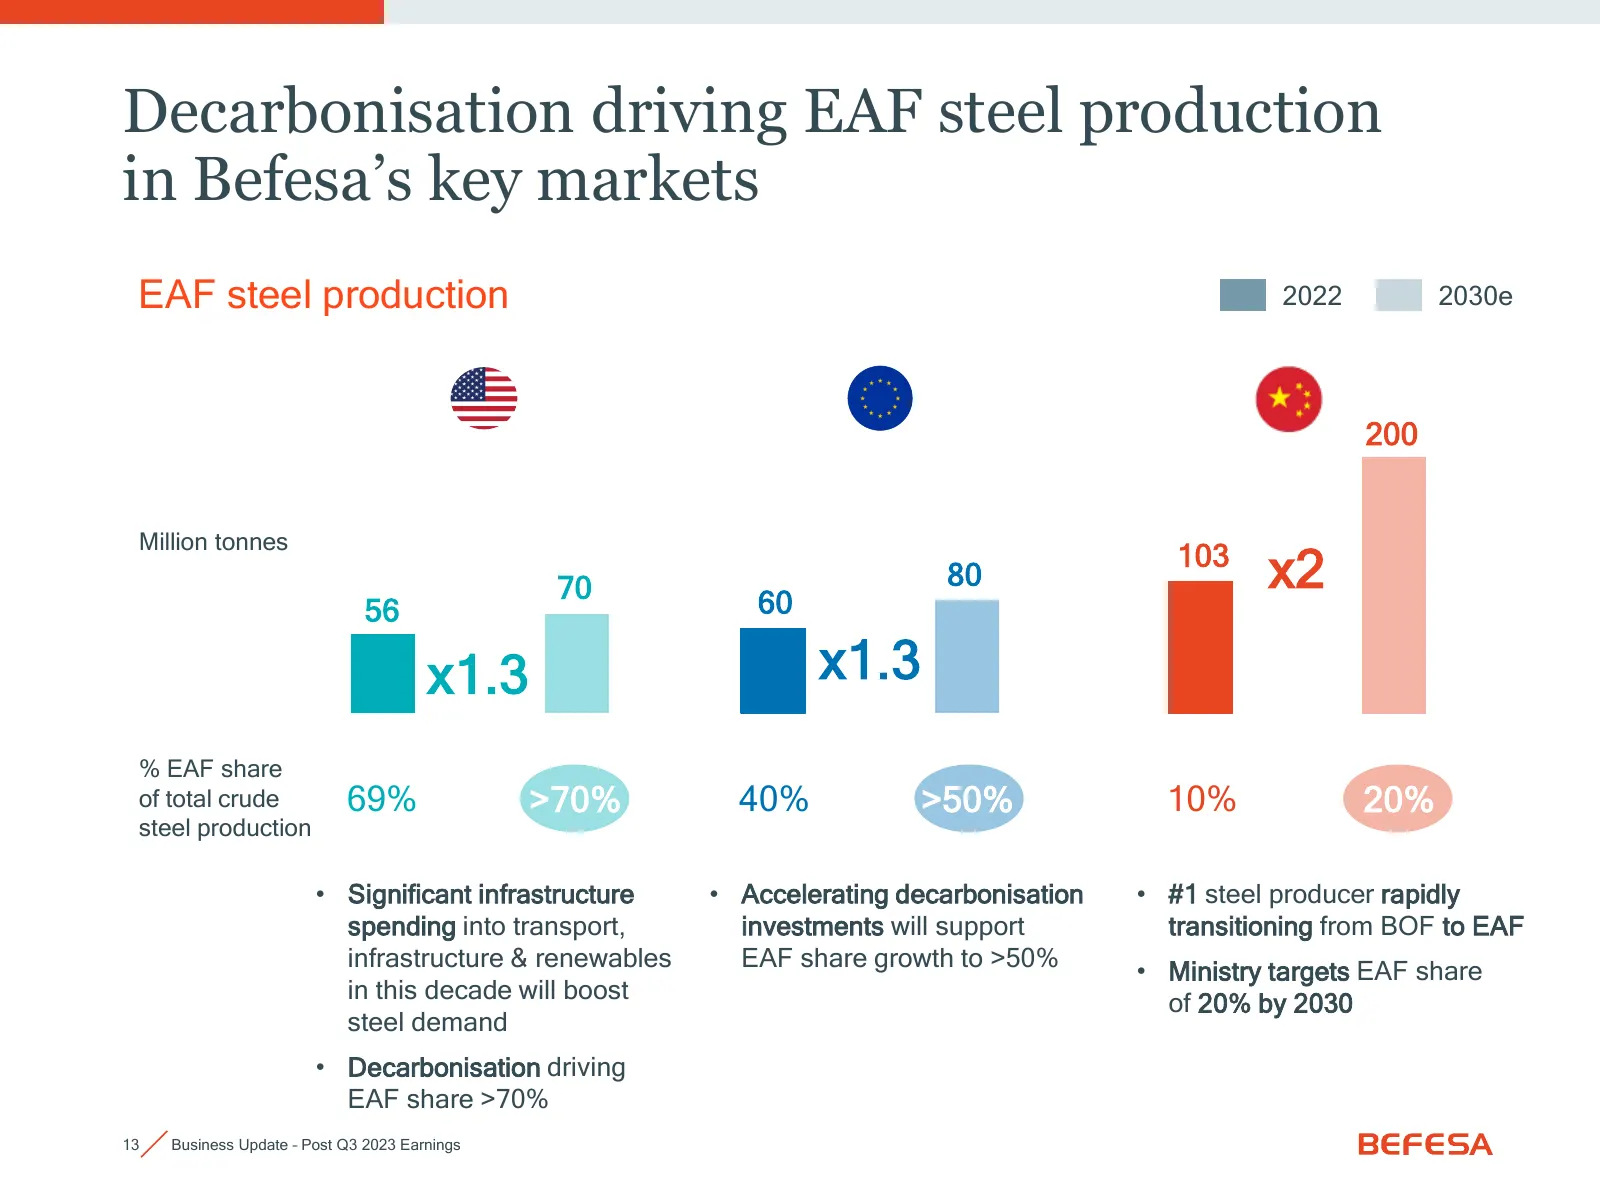
Decarbonisation driving EAF steel production in Befesa’s key markets EAF steel production 2022 2030e 200 Million tonnes 103 70 60 80 x2 56 x1.3 x1.3 % EAF share of total crude 69% >70% 40% >50% 10% 20% steel production • Significant infrastructure • Accelerating decarbonisation • #1 steel producer r
Slide 14: Decarbonisation and EV driving aluminium market growth in Europe
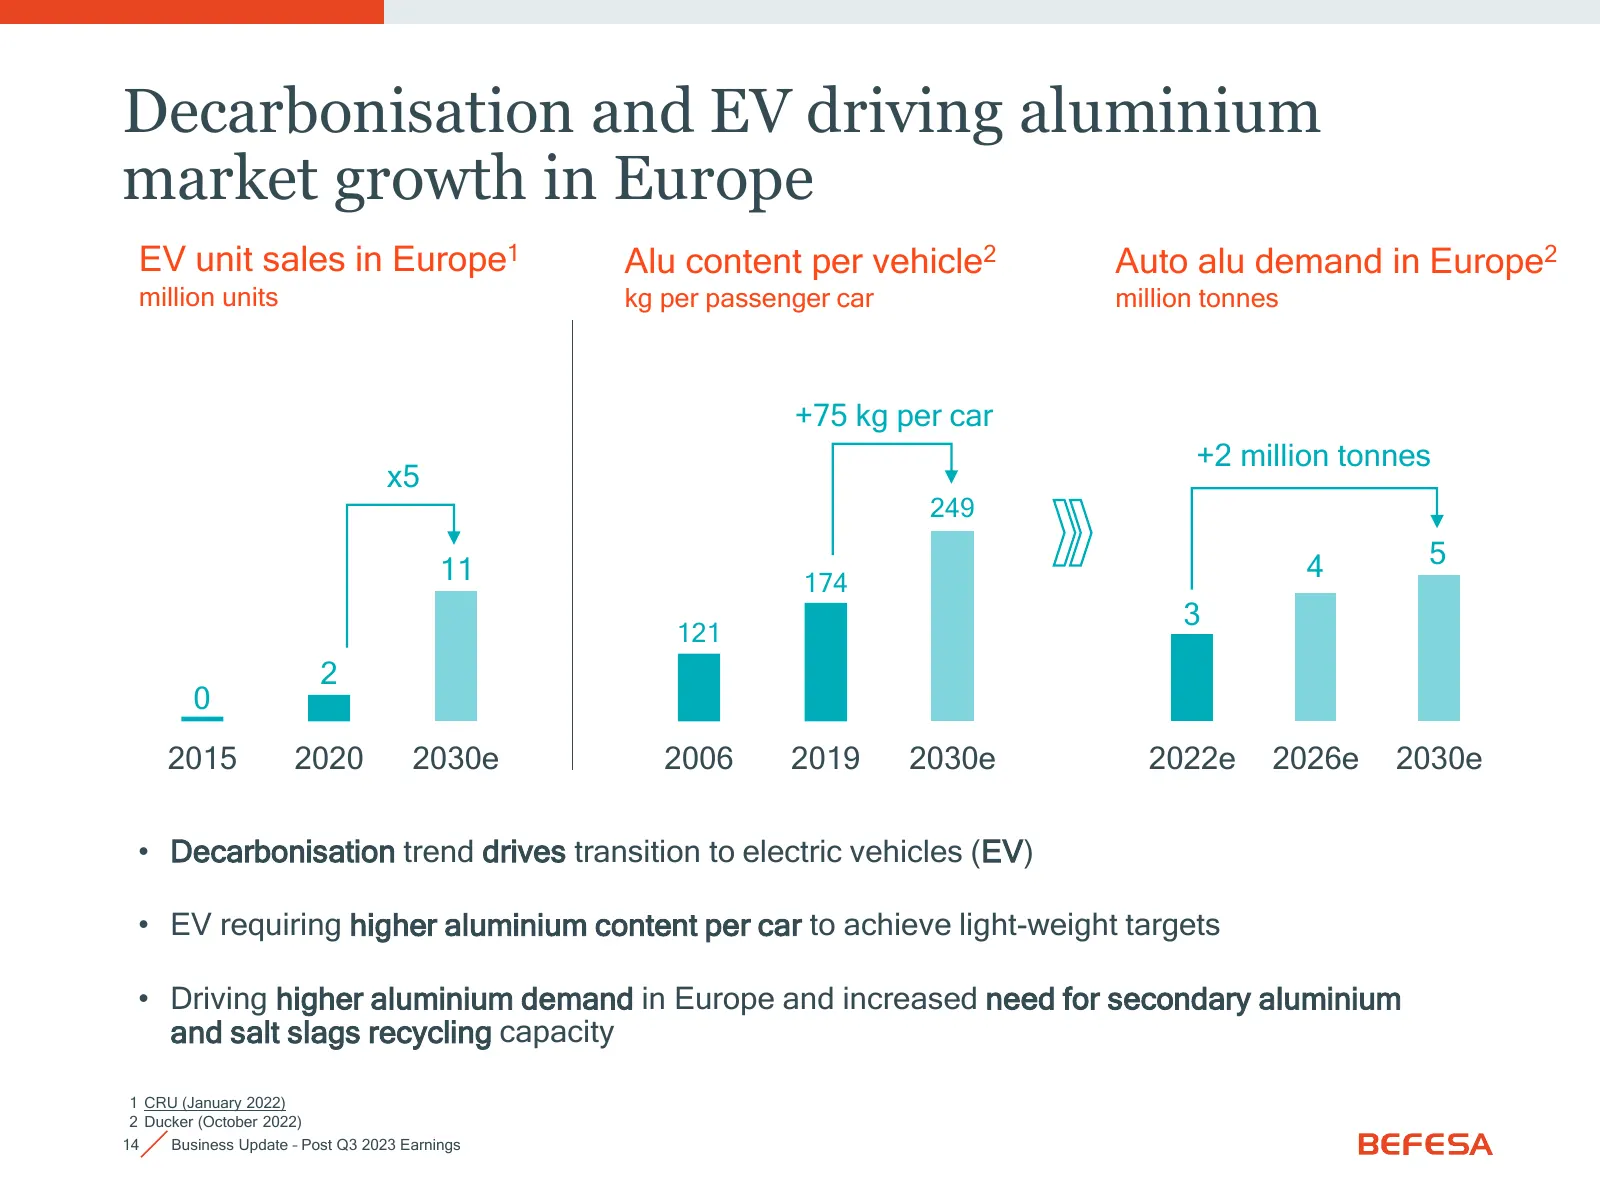
Decarbonisation and EV driving aluminium market growth in Europe EV unit sales in Europe1 Alu content per vehicle2 Auto alu demand in Europe2 million units kg per passenger car million tonnes +75 kg per car +2 million tonnes x5 249 4 5 11 174 3 121 2 0 2015 2020 2030e 2006 2019 2030e 2022e 2026e 203
Slide 15: Well defined growth roadmap in execution towards 2027
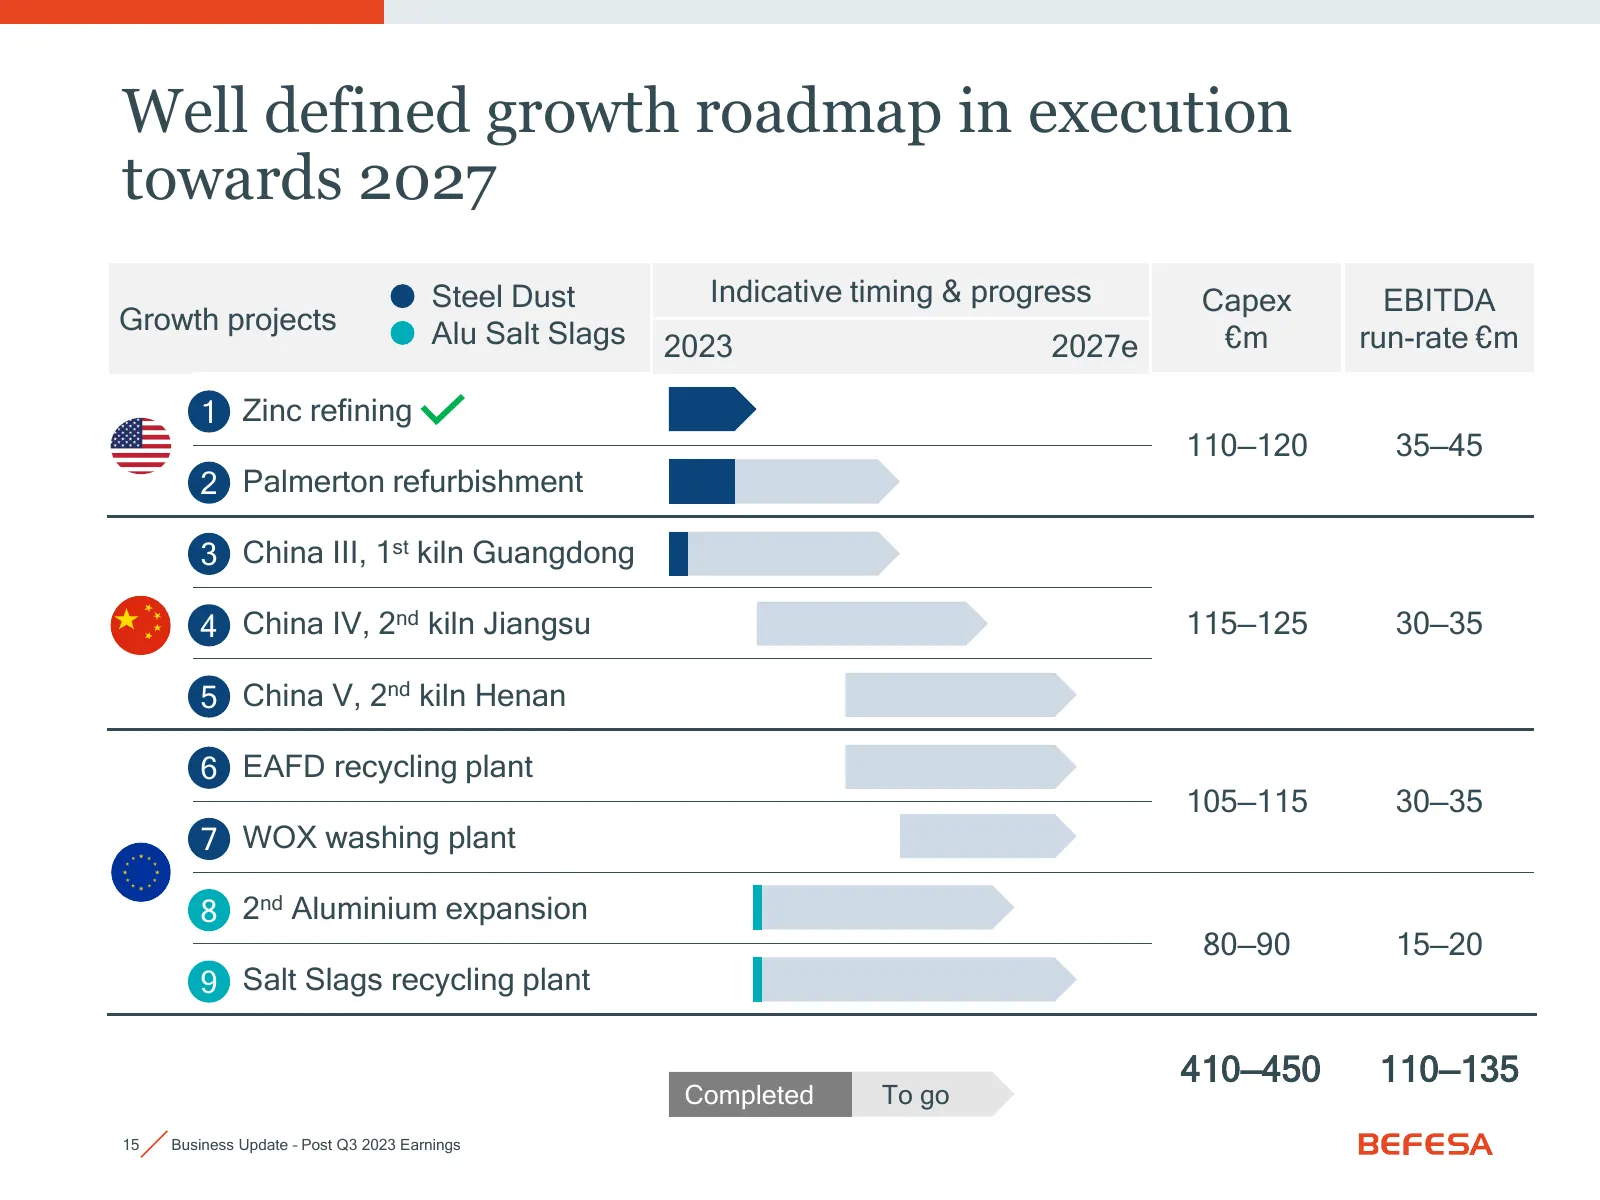
Well defined growth roadmap in execution towards 2027 Steel Dust Indicative timing & progress Capex EBITDA Growth projects Alu Salt Slags 2023 2027e €m run-rate €m 1 Zinc refining 110—120 35—45 2 Palmerton refurbishment 3 China III, 1st kiln Guangdong 4 China IV, 2nd kiln Jiangsu 115—125 30—35 5 Chi
Slide 16: Palmerton plant refurbishment progressing well
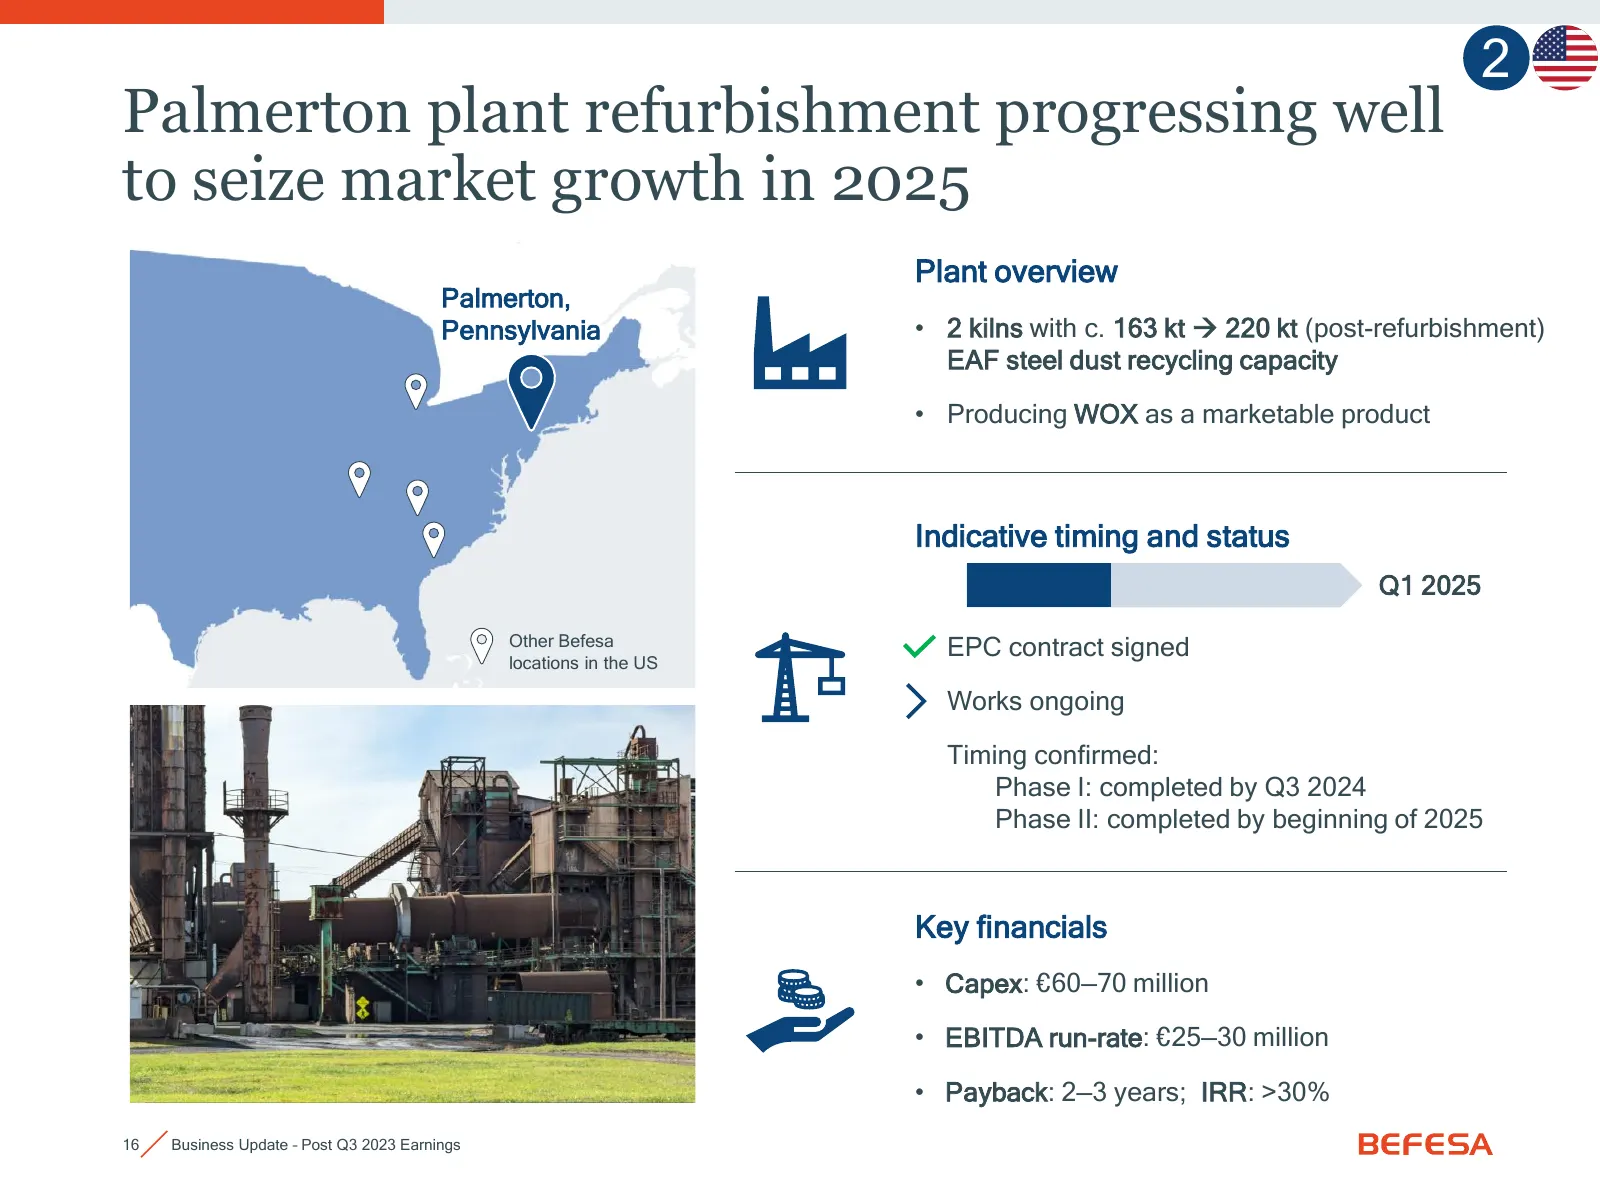
2 Palmerton plant refurbishment progressing well to seize market growth in 2025 Plant overview Palmerton, Pennsylvania • 2 kilns with c. 163 kt → 220 kt (post-refurbishment) EAF steel dust recycling capacity • Producing WOX as a marketable product Indicative timing and status Q1 2025 Other Befesa EP
Slide 17: Growth opportunity in China is attractive
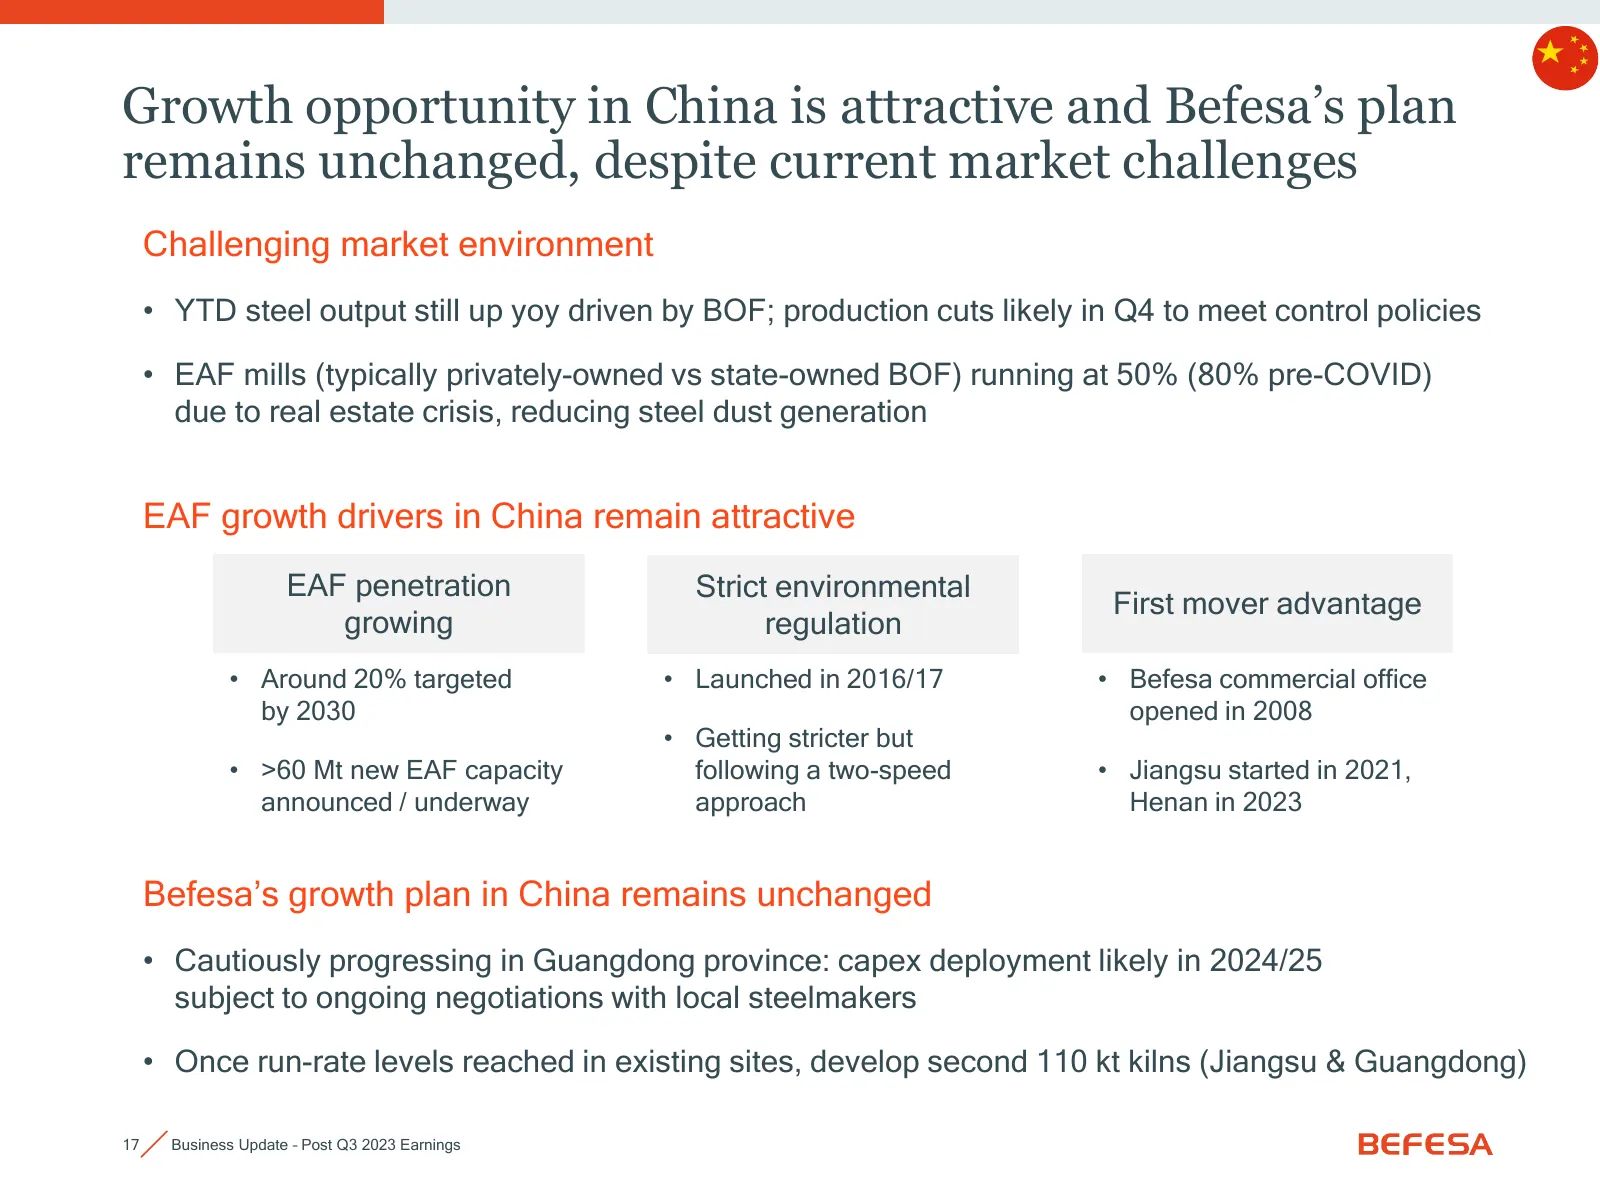
Growth opportunity in China is attractive and Befesa’s plan remains unchanged, despite current market challenges Challenging market environment • YTD steel output still up yoy driven by BOF; production cuts likely in Q4 to meet control policies • EAF mills (typically privately-owned vs state-owned B
Slide 18: Cautiously progressing in Guangdong province
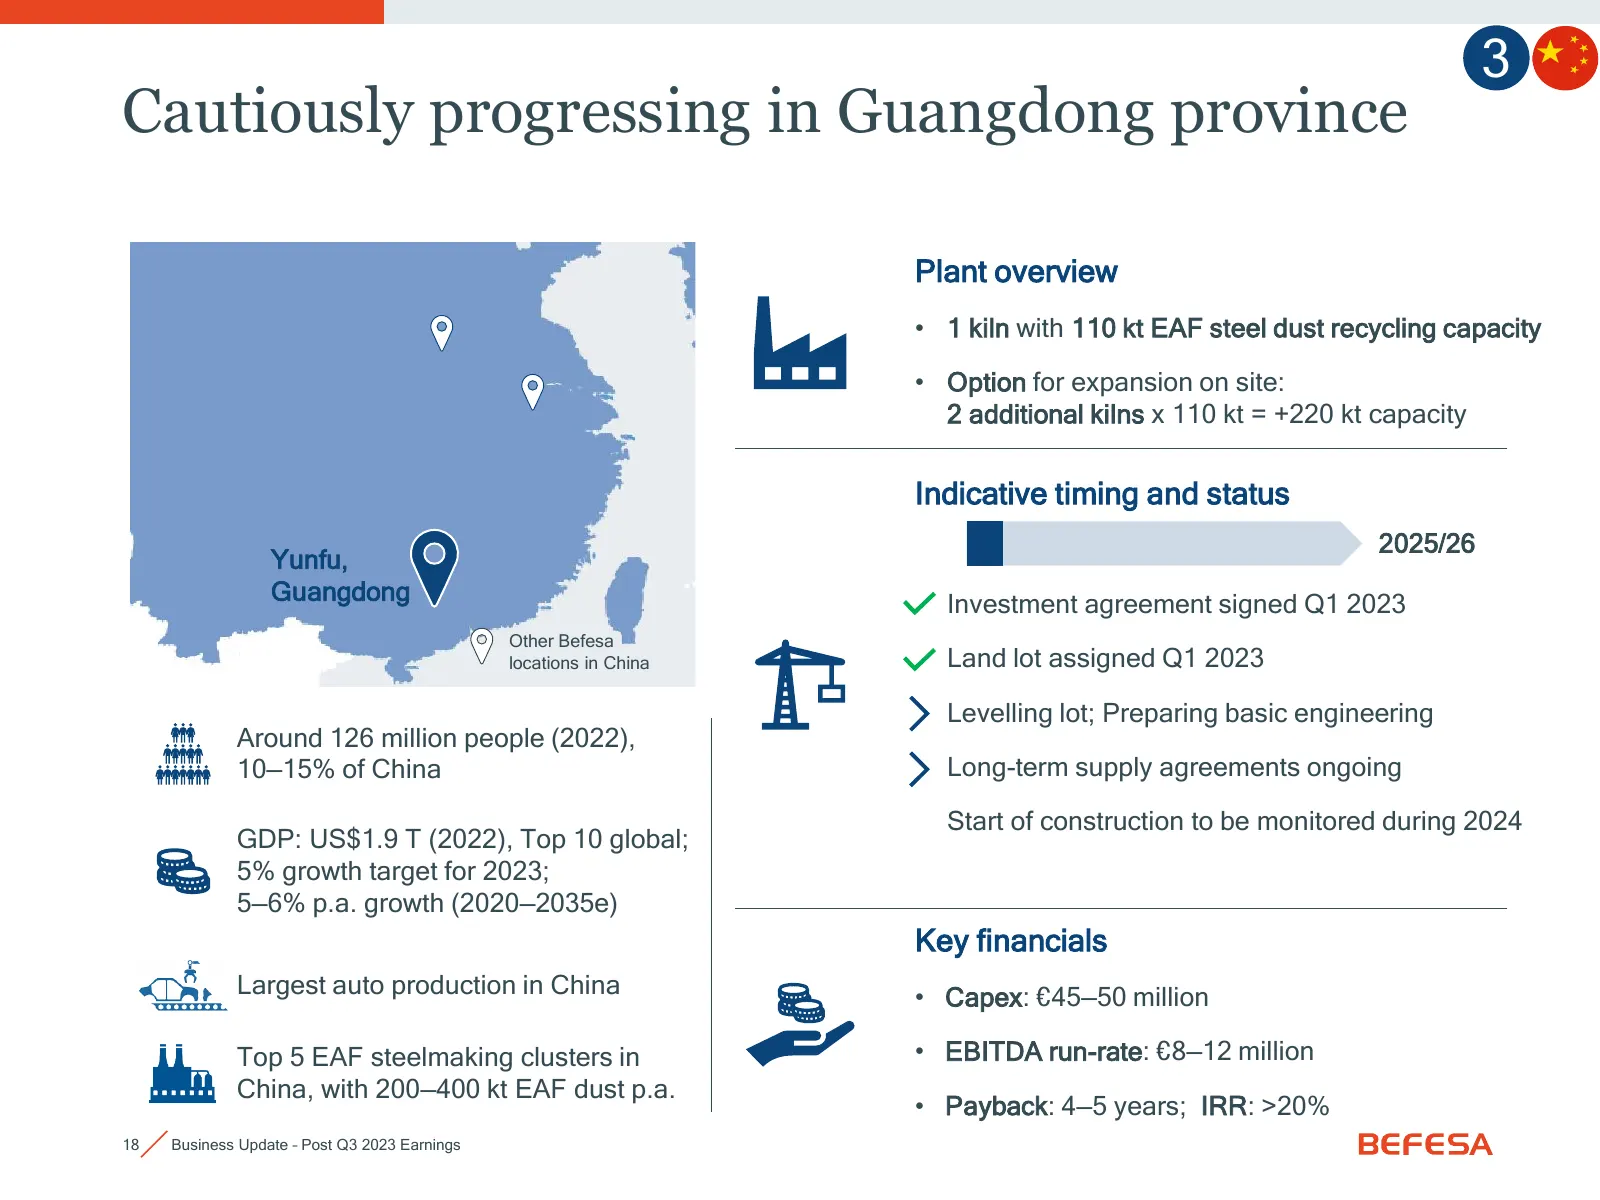
3 Cautiously progressing in Guangdong province Plant overview • 1 kiln with 110 kt EAF steel dust recycling capacity • Option for expansion on site: 2 additional kilns x 110 kt = +220 kt capacity Indicative timing and status 2025/26 Yunfu, Guangdong Investment agreement signed Q1 2023 Other Befesa l
Slide 19: Aluminium salt slags recycling in the US opportunity
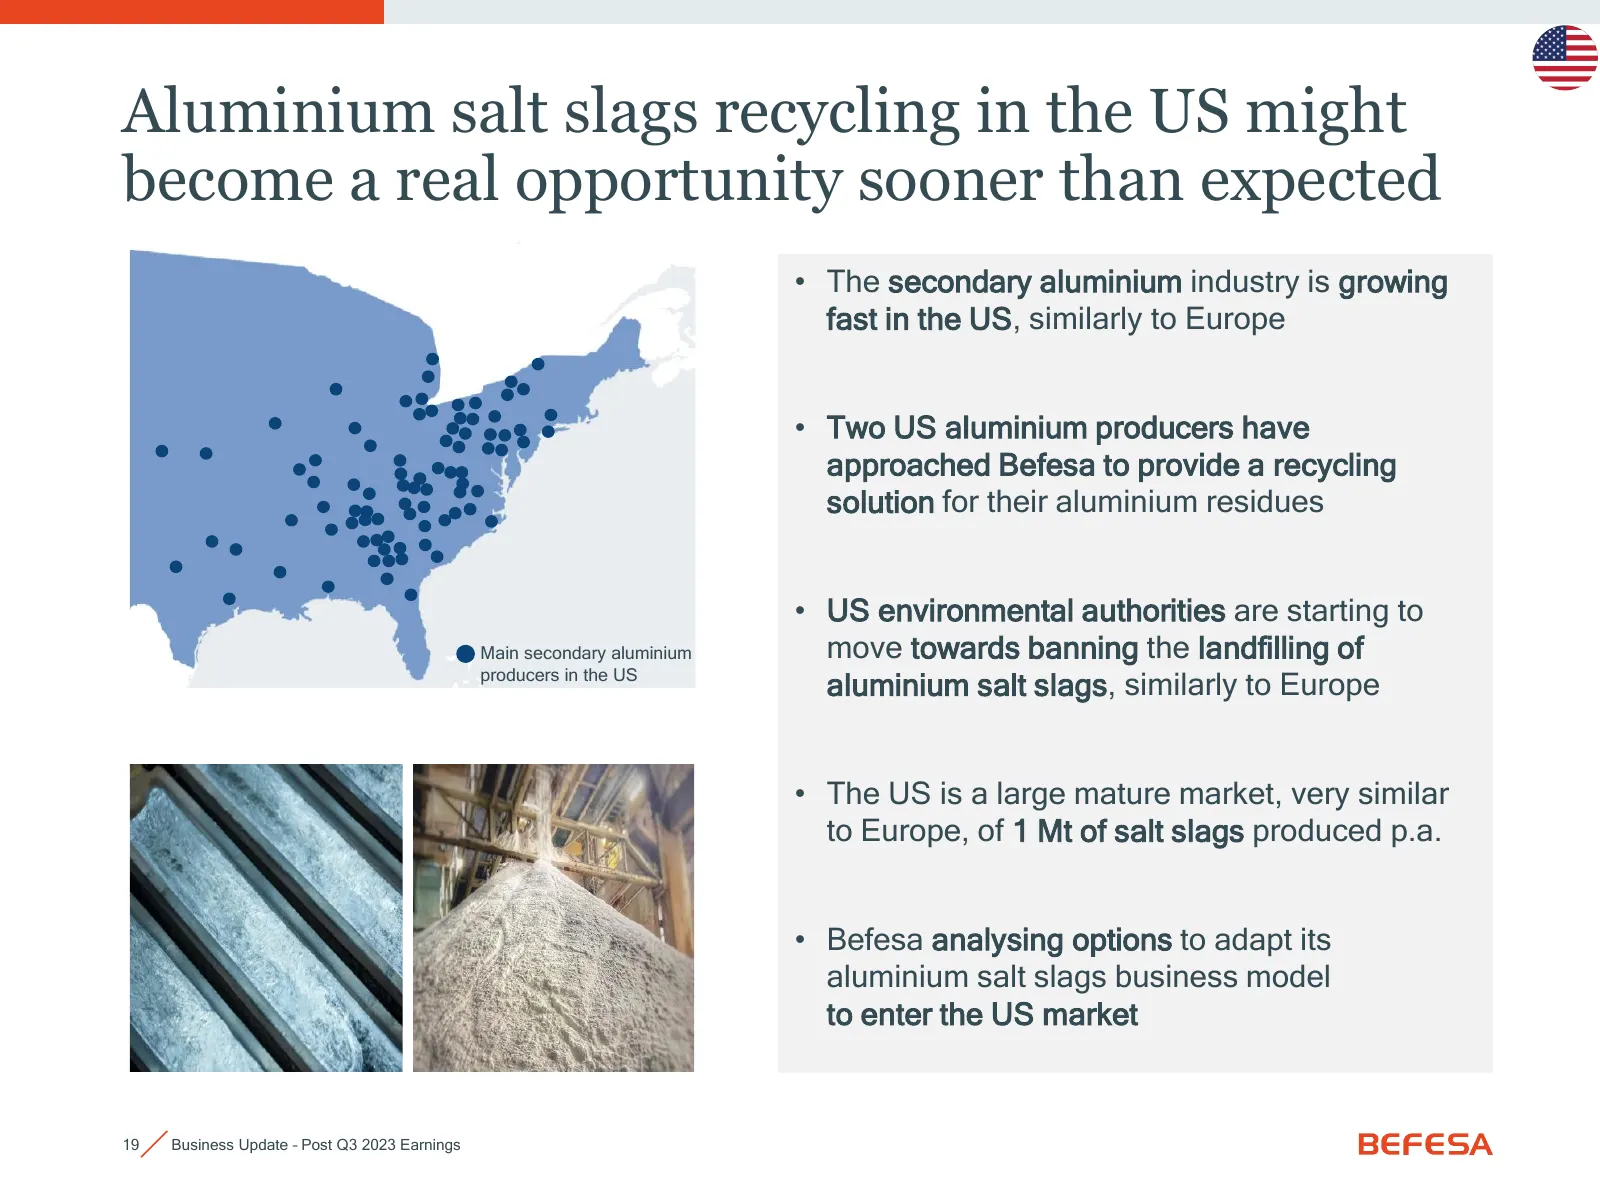
Aluminium salt slags recycling in the US might become a real opportunity sooner than expected • The secondary aluminium industry is growing fast in the US, similarly to Europe • Two US aluminium producers have approached Befesa to provide a recycling solution for their aluminium residues • US enviro
Slide 20: Sustainable Global Growth Plan (SGGP), 2022-2027
02 Sustainable Global Growth Plan (SGGP), 2022-2027
Slide 21: Proven track record since IPO; megatrends driving growth
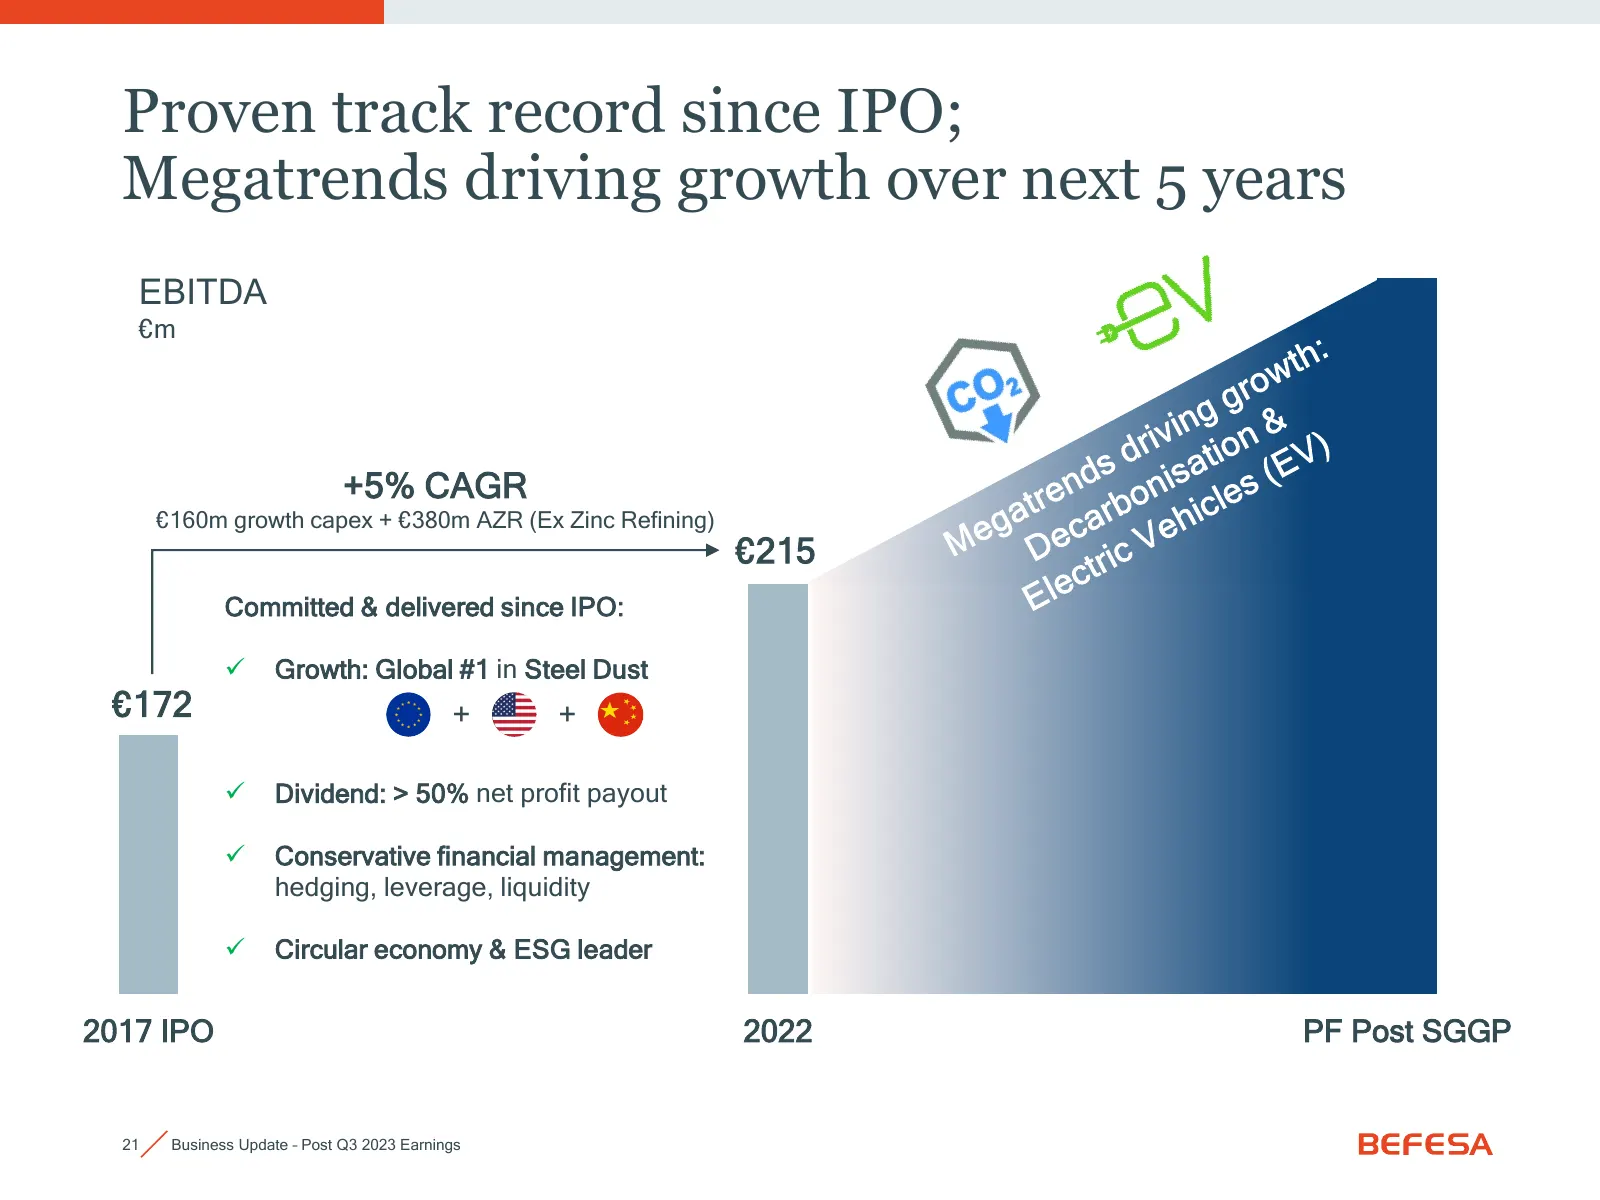
Proven track record since IPO; Megatrends driving growth over next 5 years EBITDA €m +5% CAGR €160m growth capex + €380m AZR (Ex Zinc Refining) €215 Committed & delivered since IPO: ✓ Growth: Global #1 in Steel Dust €172 + + ✓ Dividend: > 50% net profit payout ✓ Conservative financial management: he
Slide 22: Decarbonisation driving EAF steel production in key markets
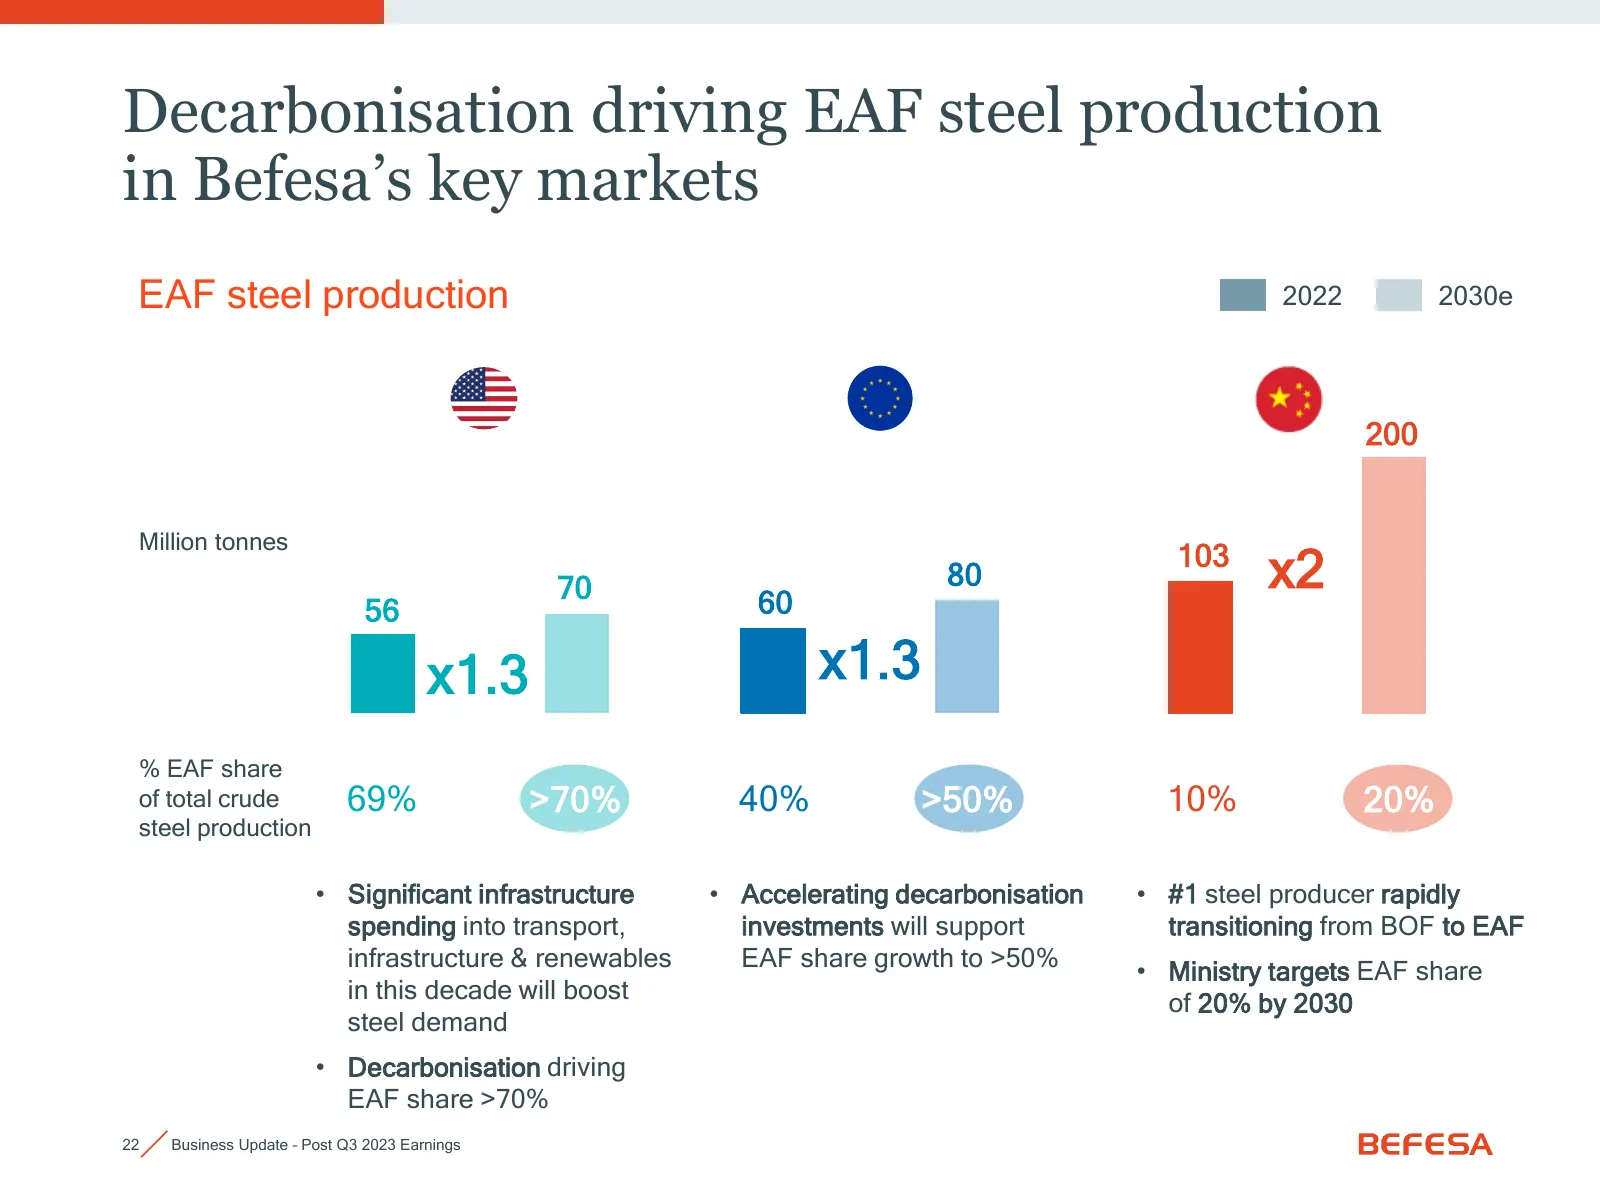
Decarbonisation driving EAF steel production in Befesa’s key markets EAF steel production 2022 2030e 200 Million tonnes 103 70 60 80 x2 56 x1.3 x1.3 % EAF share of total crude 69% >70% 40% >50% 10% 20% steel production • Significant infrastructure • Accelerating decarbonisation • #1 steel producer r
Slide 23: Well defined growth roadmap in execution towards 2027
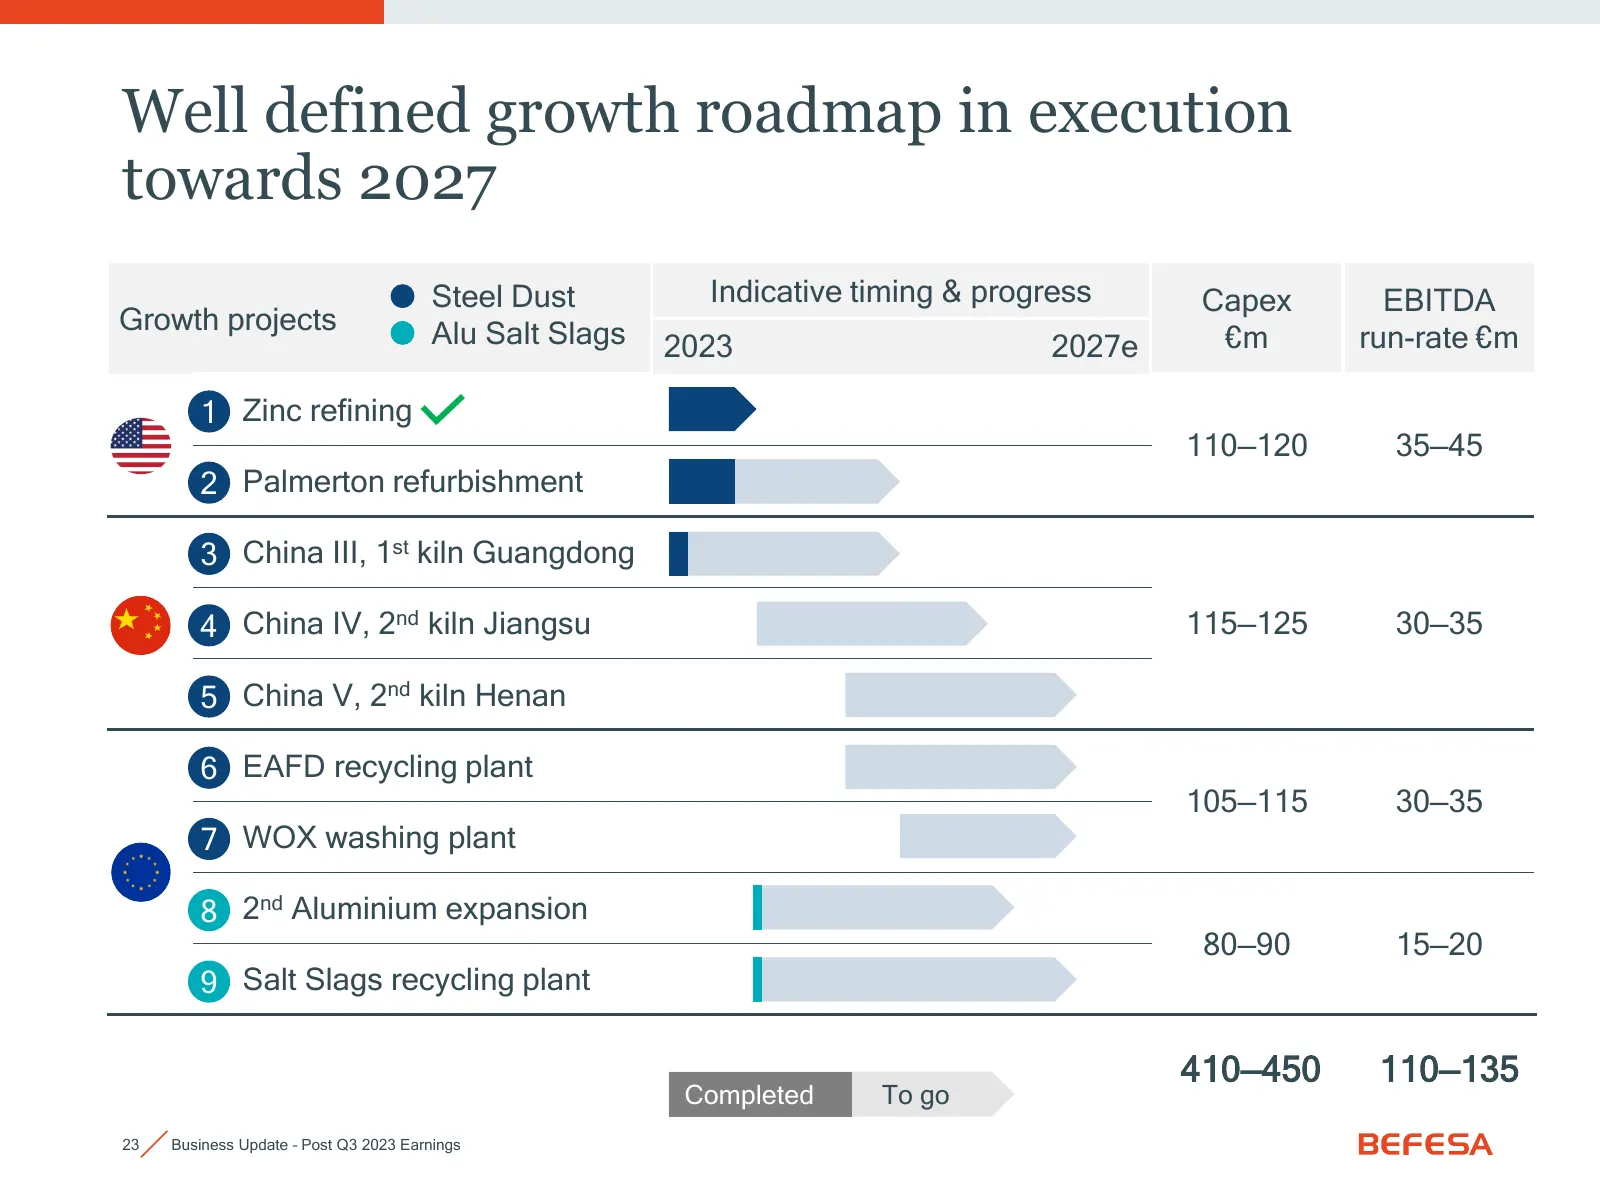
Well defined growth roadmap in execution towards 2027 Steel Dust Indicative timing & progress Capex EBITDA Growth projects Alu Salt Slags 2023 2027e €m run-rate €m 1 Zinc refining 110—120 35—45 2 Palmerton refurbishment 3 China III, 1st kiln Guangdong 4 China IV, 2nd kiln Jiangsu 115—125 30—35 5 Chi
Slide 24: Megatrends and Befesa's approach by market
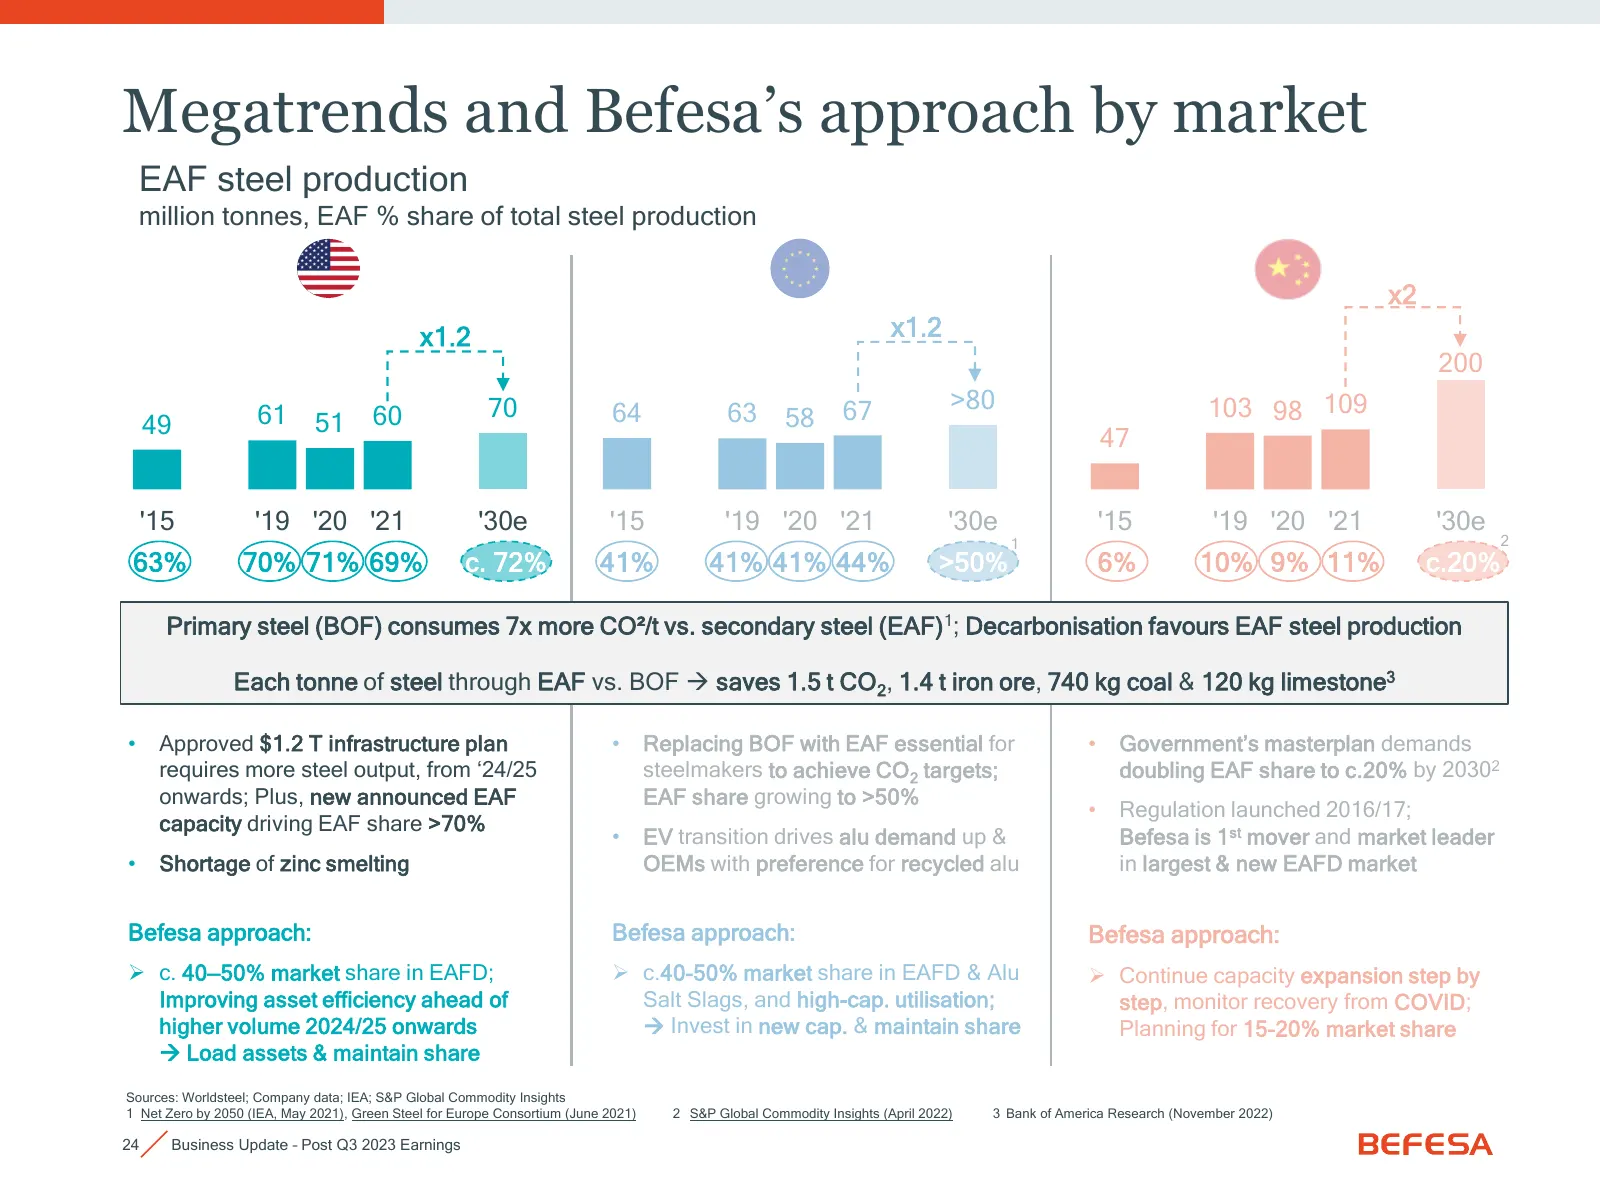
Megatrends and Befesa’s approach by market EAF steel production million tonnes, EAF % share of total steel production x2 x1.2 x1.2 200 70 64 67 >80 103 98 109 49 61 51 60 63 58 47 '15 '19 '20 '21 '30e '15 '19 '20 '21 '30e '15 '19 '20 '21 '30e 1 2 63% 70% 71% 69% c. 72% 41% 41% 41% 44% >50% 6% 10% 9%
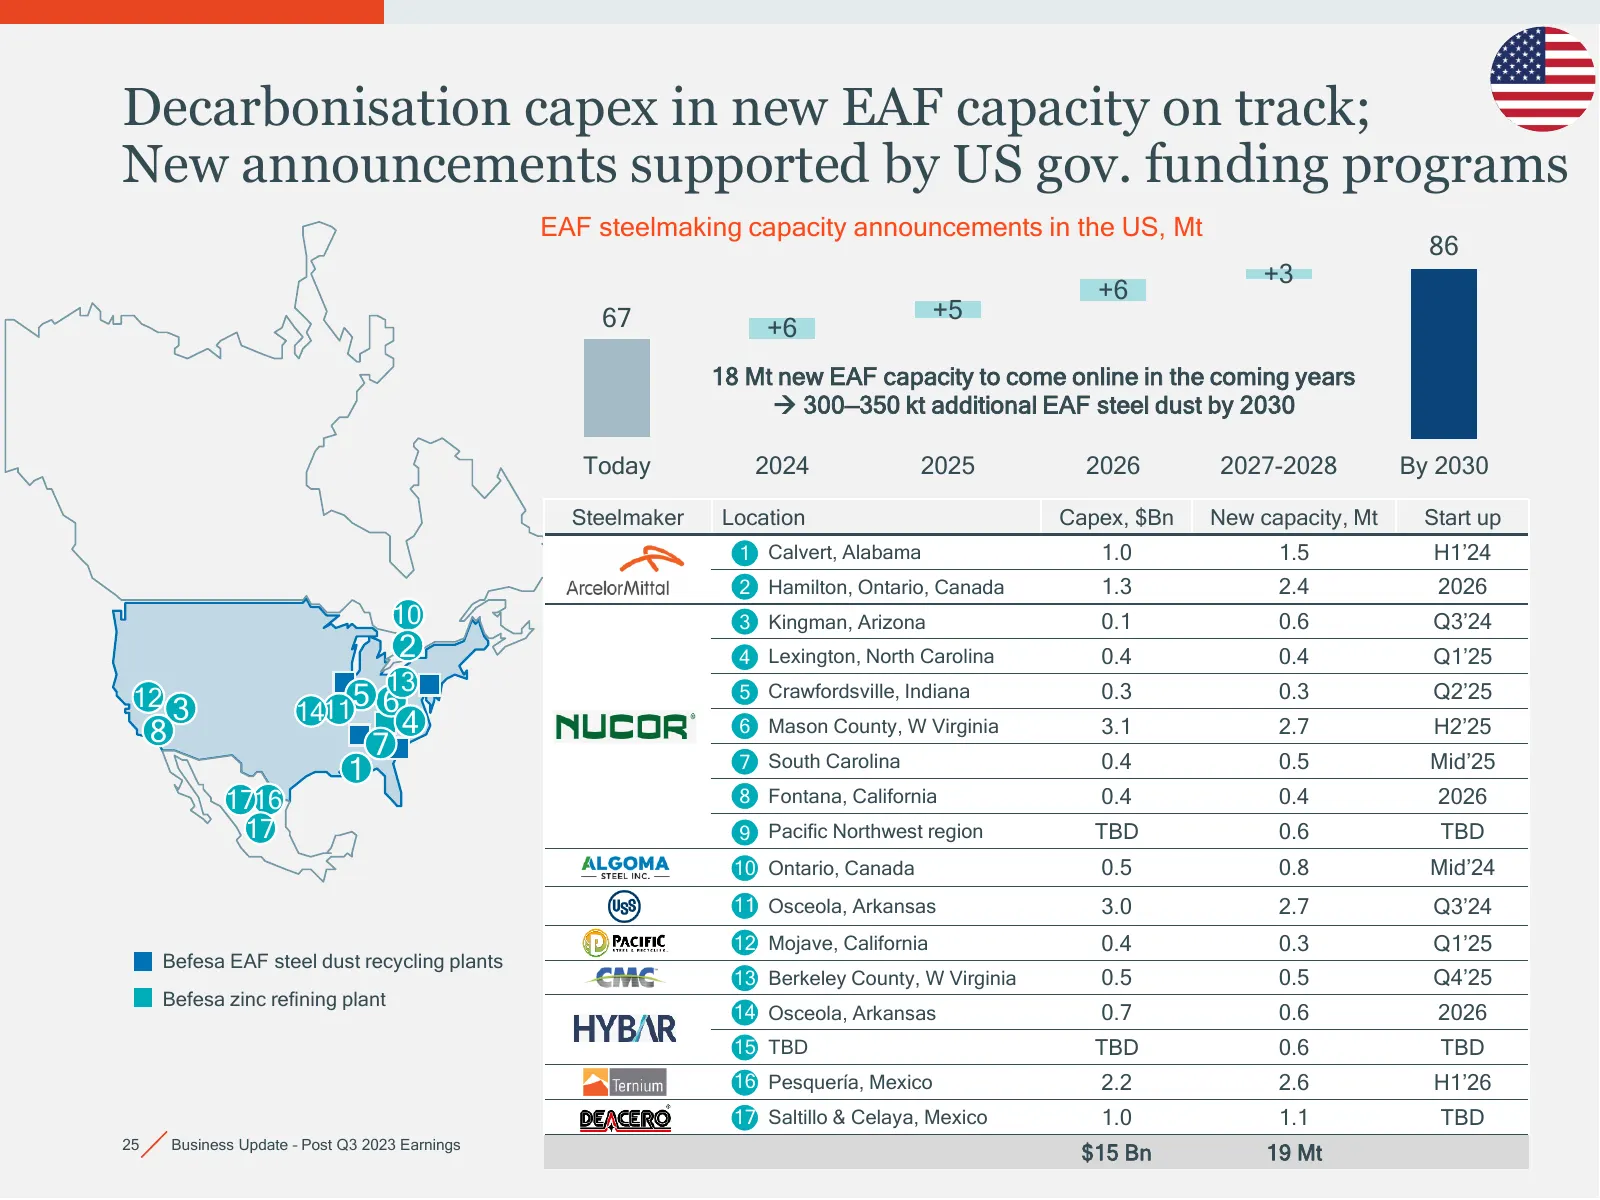
Slide 25: Decarbonisation capex in new EAF capacity on track in US
Decarbonisation capex in new EAF capacity on track; New announcements supported by US gov. funding programs EAF steelmaking capacity announcements in the US, Mt 86 +3 +6 67 +5 +6 18 Mt new EAF capacity to come online in the coming years → 300—350 kt additional EAF steel dust by 2030 Today 2024 2025
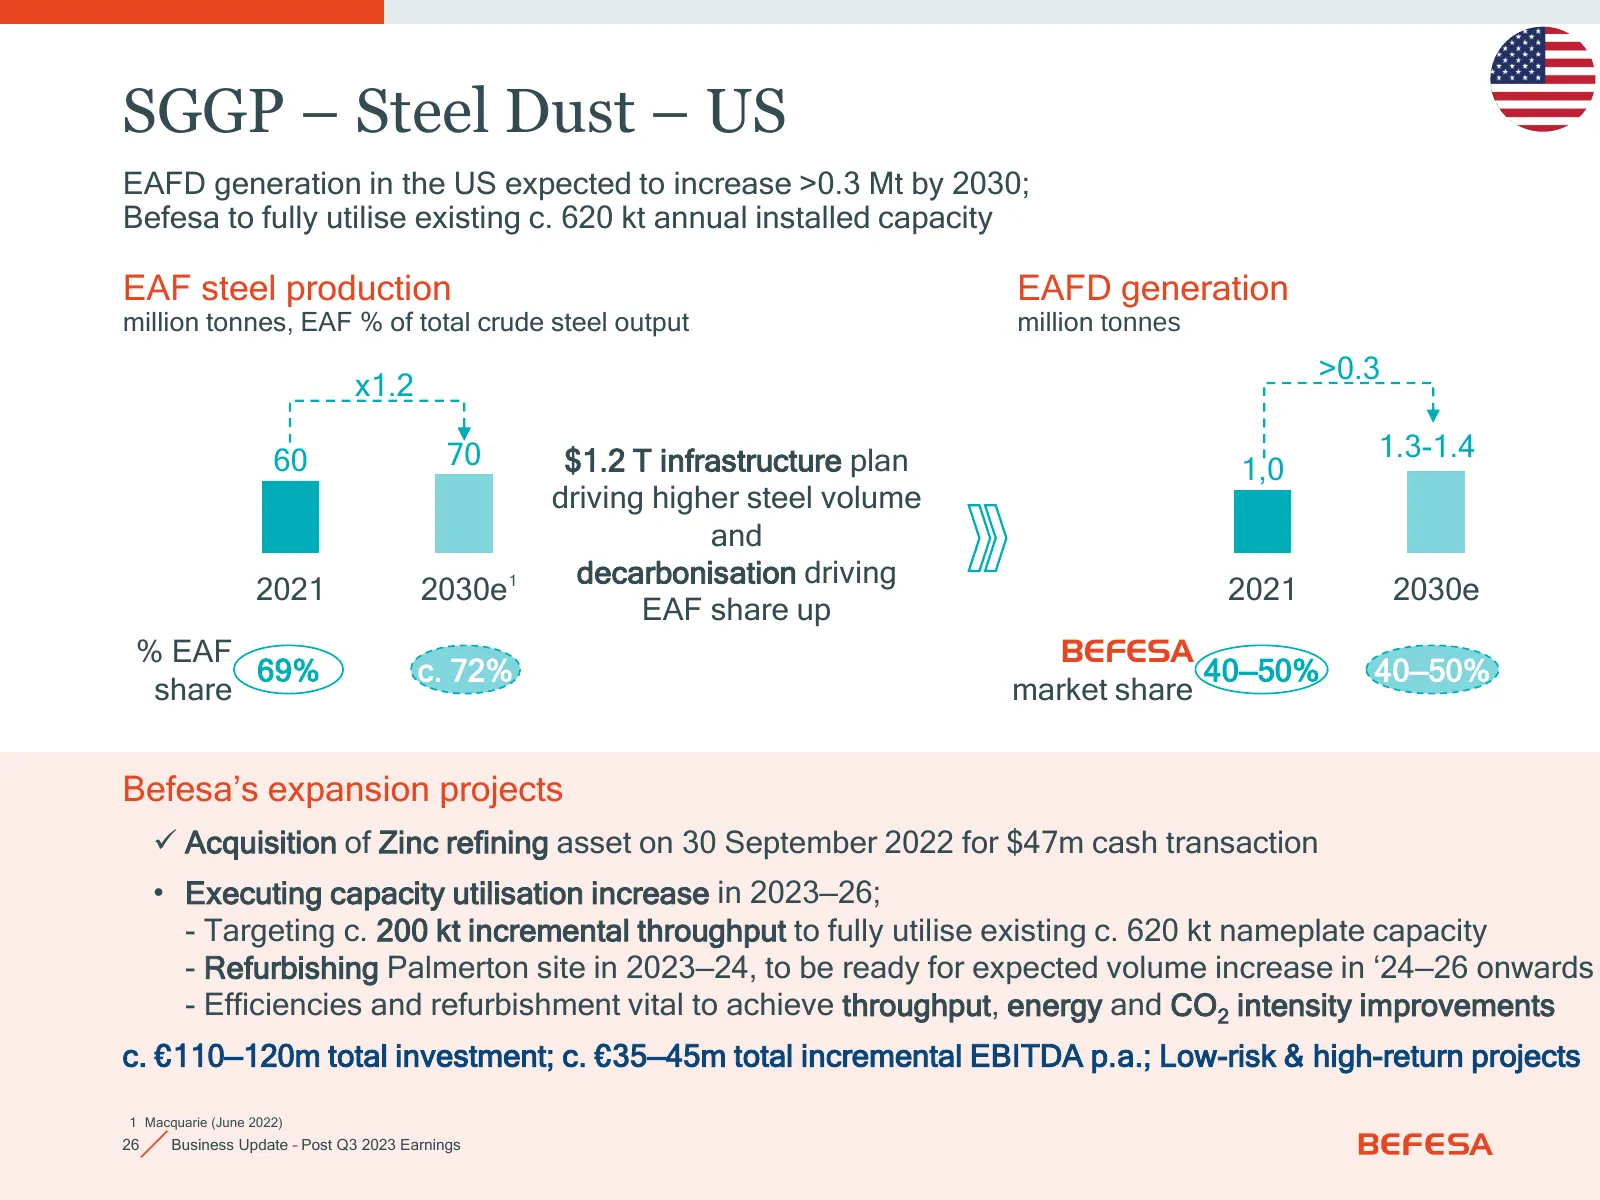
Slide 26: SGGP – Steel Dust – US
SGGP – Steel Dust – US EAFD generation in the US expected to increase >0.3 Mt by 2030; Befesa to fully utilise existing c. 620 kt annual installed capacity EAF steel production EAFD generation million tonnes, EAF % of total crude steel output million tonnes >0.3 x1.2 60 70 $1.2 T infrastructure plan
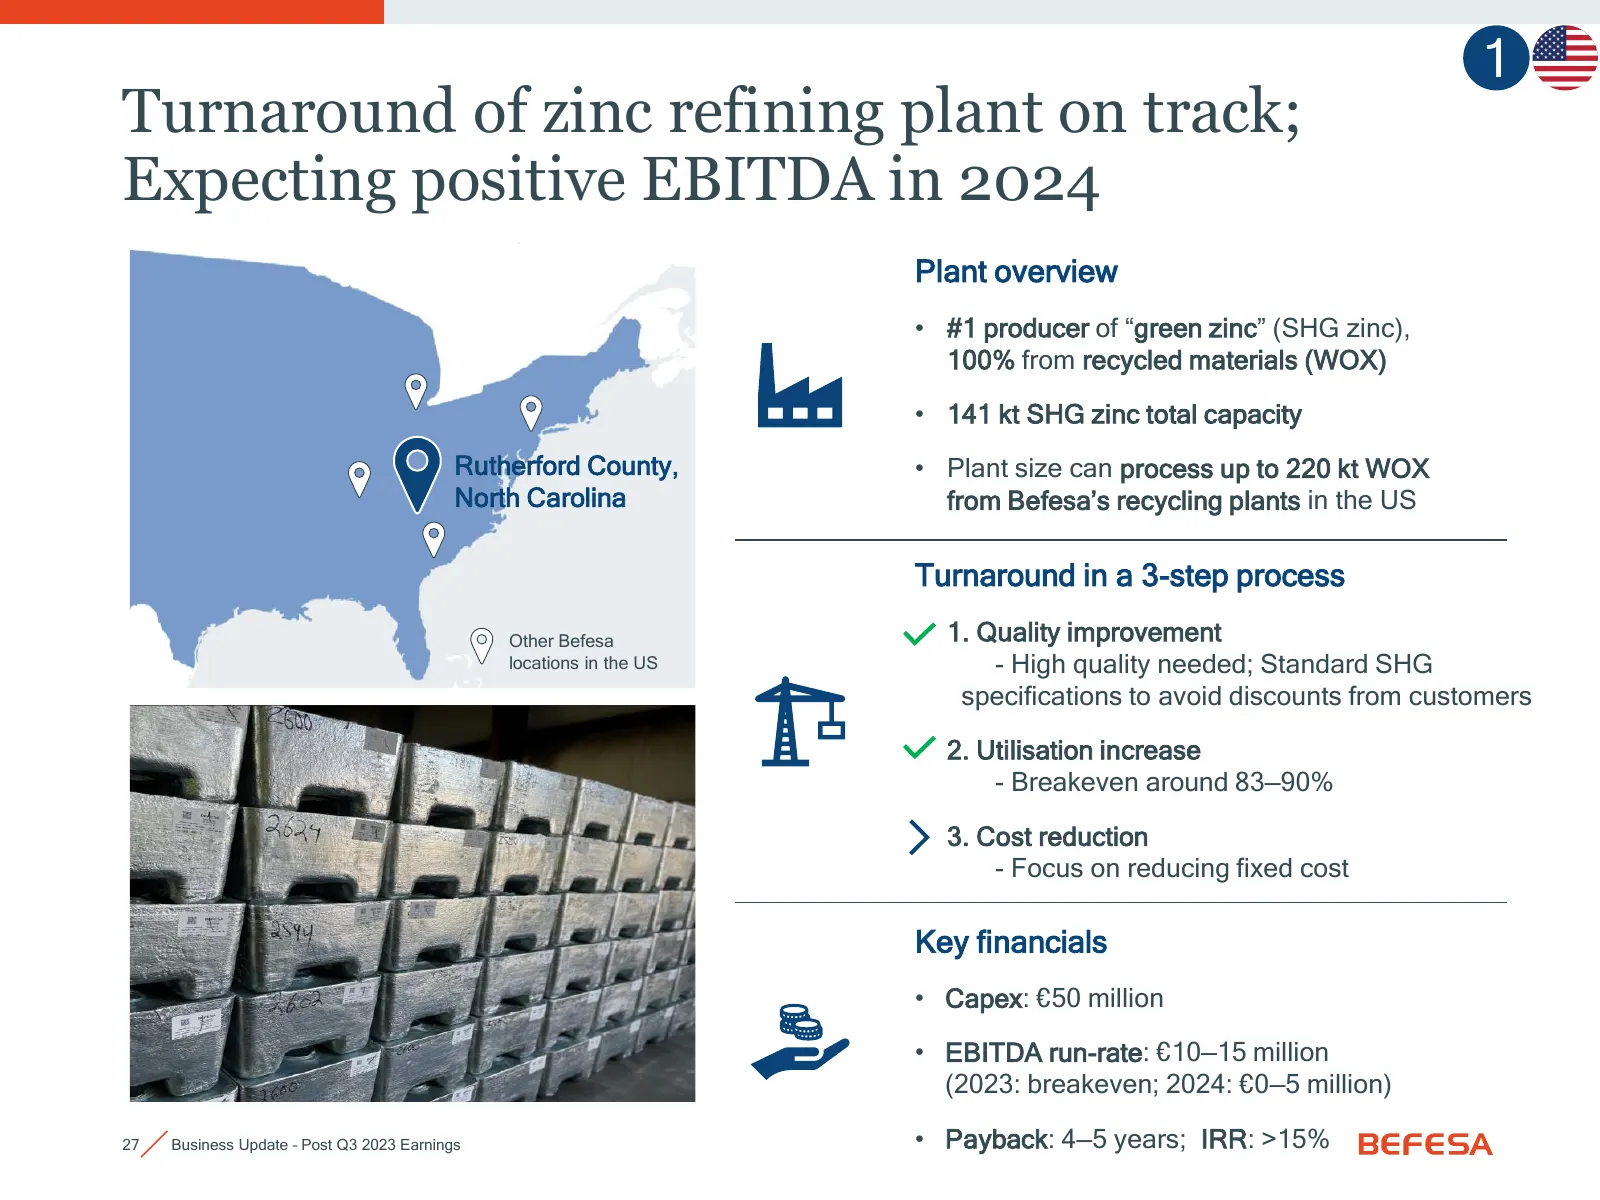
Slide 27: Turnaround of zinc refining plant on track
1 Turnaround of zinc refining plant on track; Expecting positive EBITDA in 2024 Plant overview • #1 producer of “green zinc” (SHG zinc), 100% from recycled materials (WOX) • 141 kt SHG zinc total capacity Rutherford County, • Plant size can process up to 220 kt WOX North Carolina from Befesa’s recyc
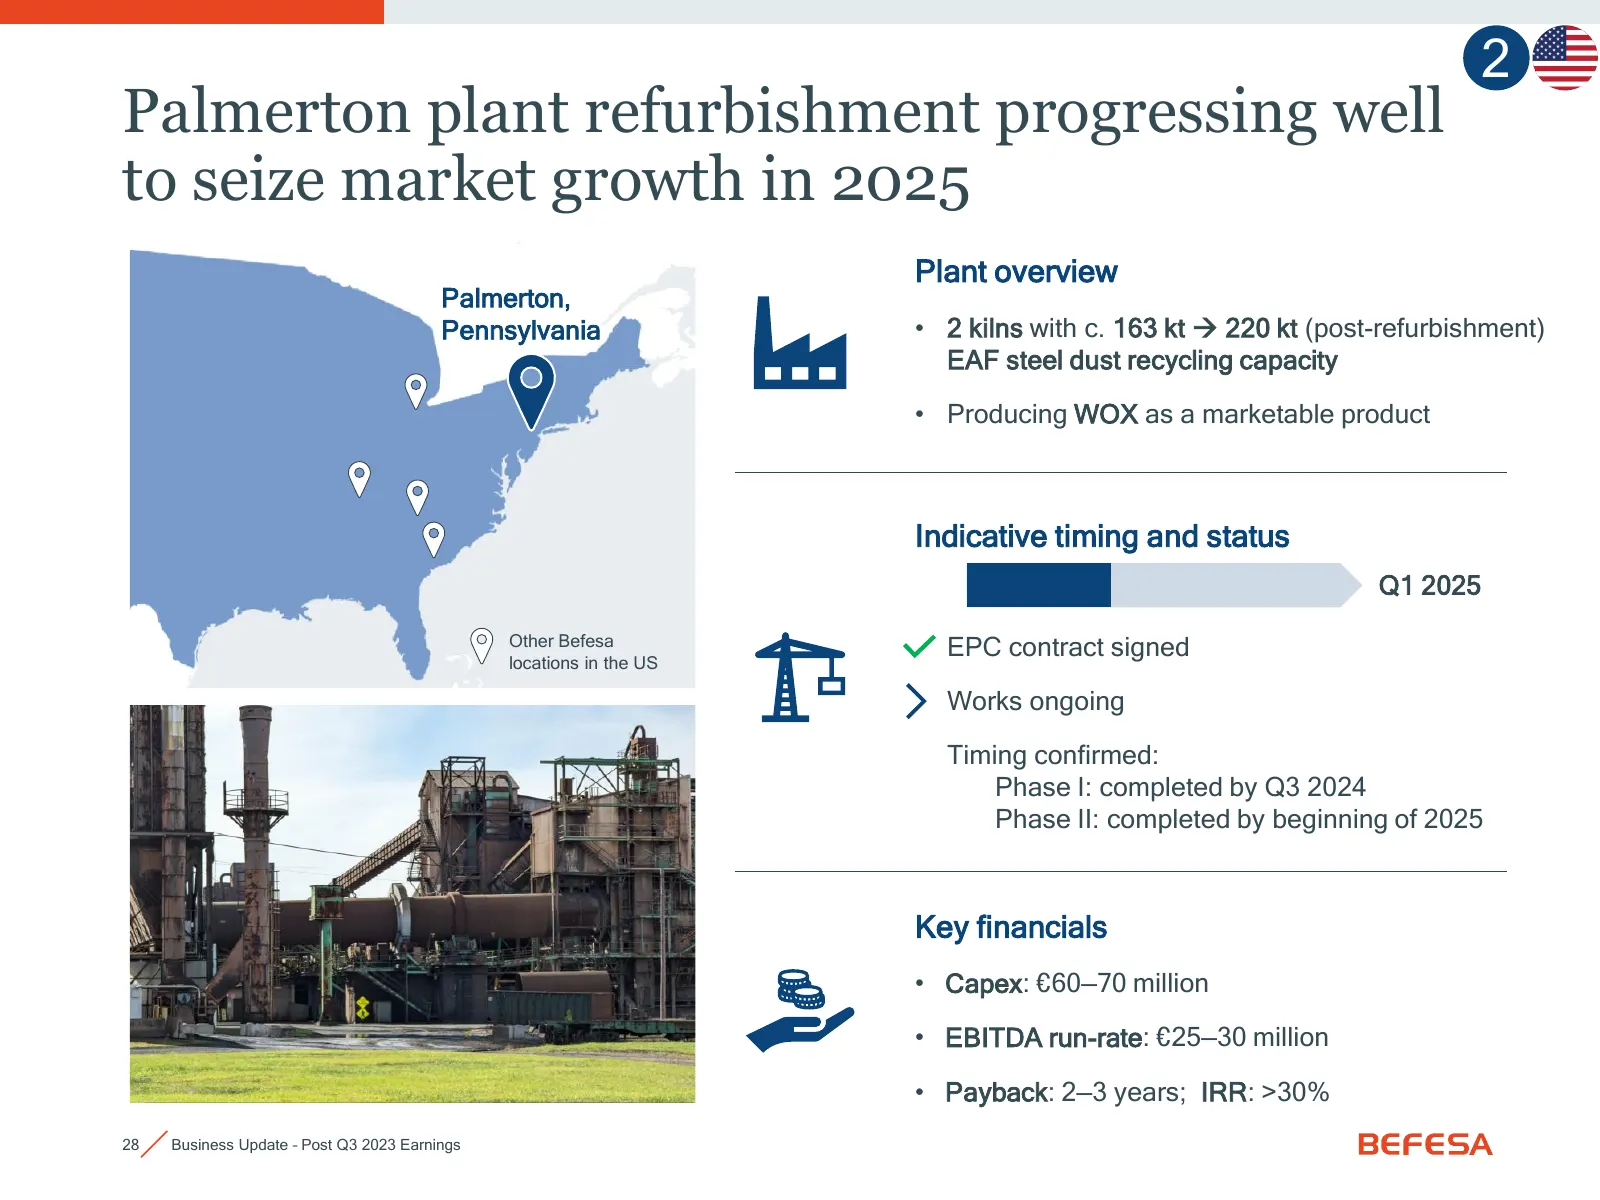
Slide 28: Palmerton plant refurbishment progressing well
2 Palmerton plant refurbishment progressing well to seize market growth in 2025 Plant overview Palmerton, Pennsylvania • 2 kilns with c. 163 kt → 220 kt (post-refurbishment) EAF steel dust recycling capacity • Producing WOX as a marketable product Indicative timing and status Q1 2025 Other Befesa EP
Slide 29: Megatrends and Befesa's approach by market
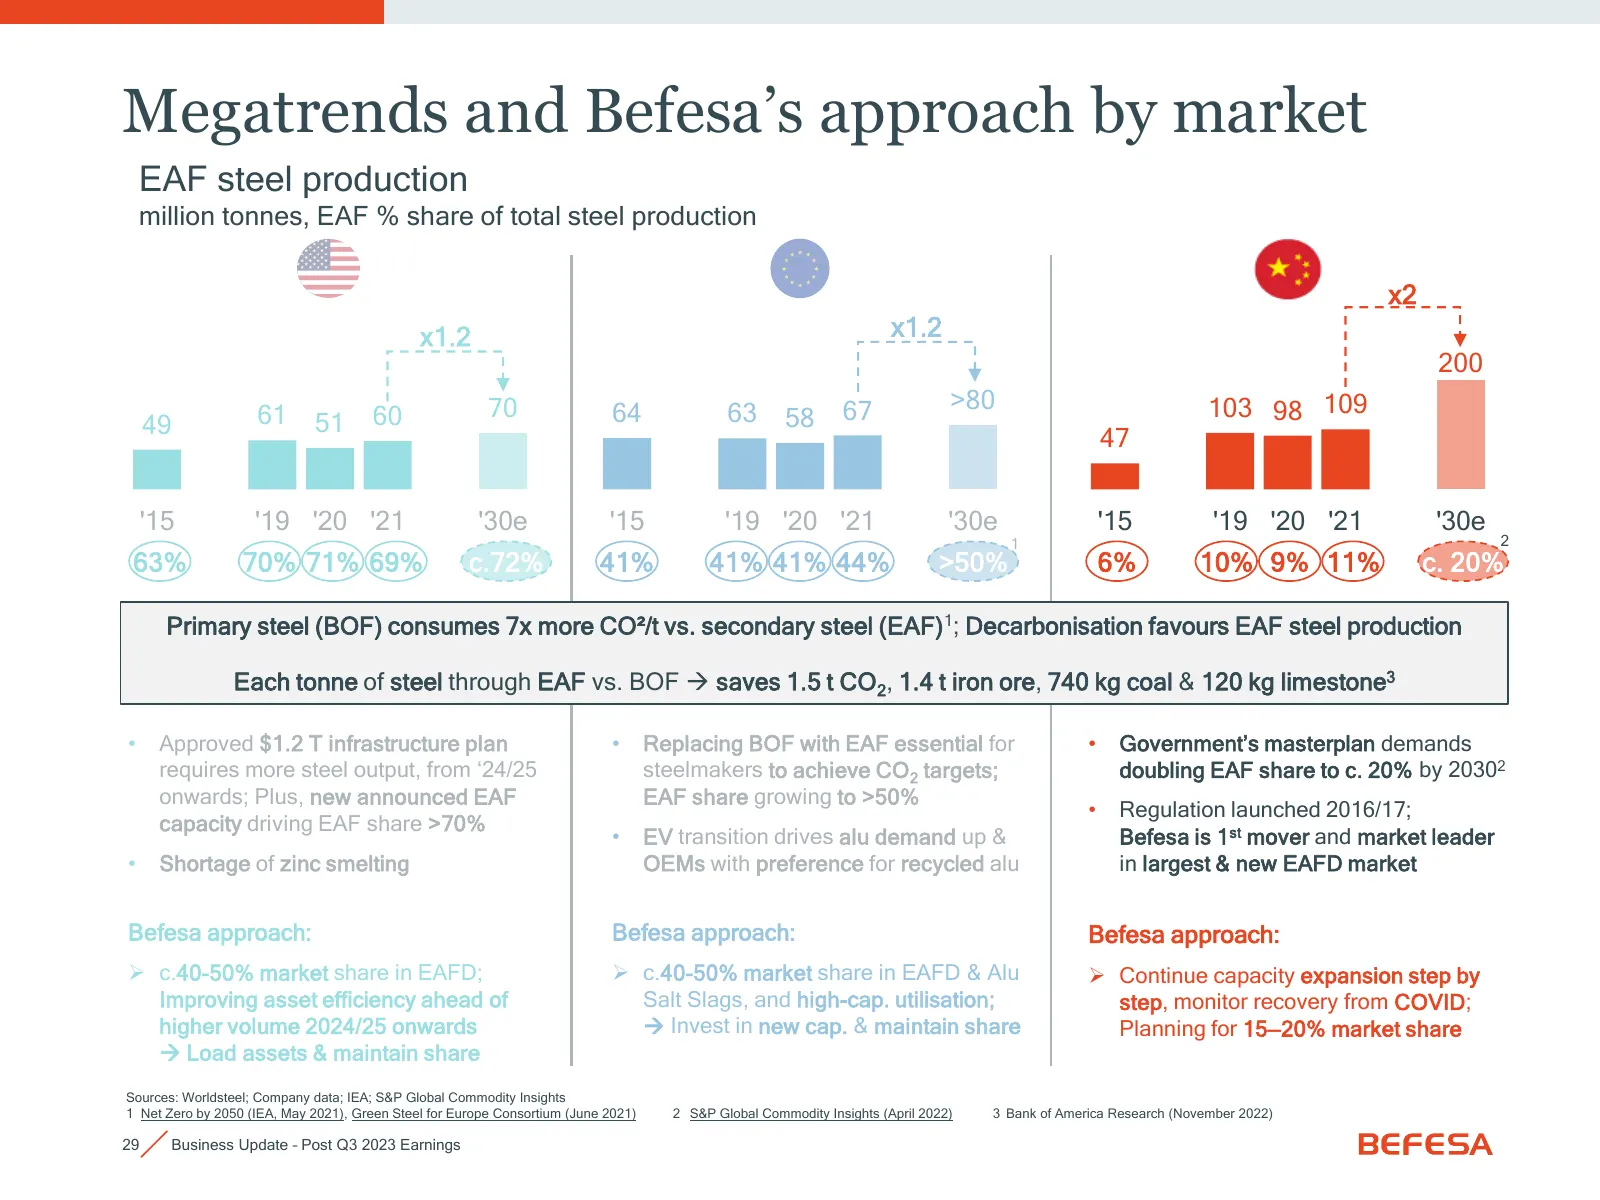
Megatrends and Befesa’s approach by market EAF steel production million tonnes, EAF % share of total steel production x2 x1.2 x1.2 200 70 64 67 >80 103 98 109 49 61 51 60 63 58 47 '15 '19 '20 '21 '30e '15 '19 '20 '21 '30e '15 '19 '20 '21 '30e 1 2 63% 70% 71% 69% c.72% 41% 41% 41% 44% >50% 6% 10% 9%
Slide 30: Largest producer of steel, transitioning from BOF to EAF
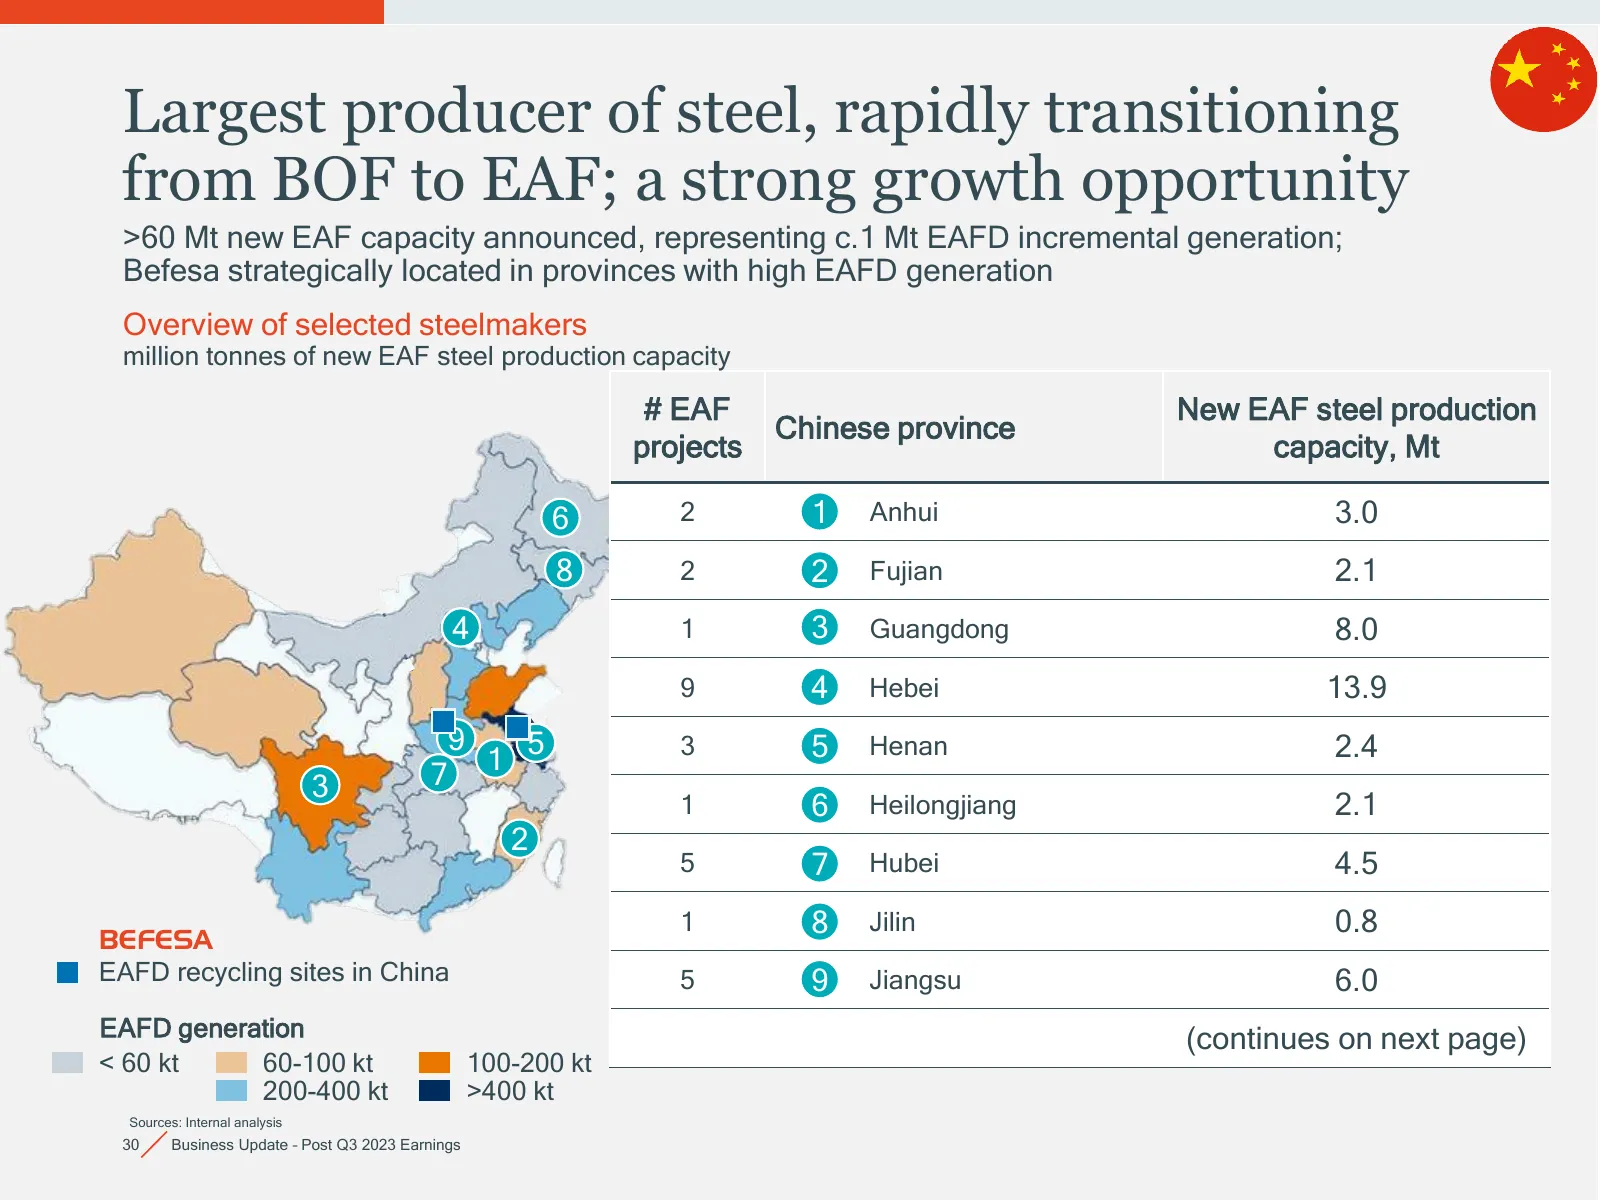
Largest producer of steel, rapidly transitioning from BOF to EAF; a strong growth opportunity >60 Mt new EAF capacity announced, representing c.1 Mt EAFD incremental generation; Befesa strategically located in provinces with high EAFD generation Overview of selected steelmakers million tonnes of new
Slide 31: Largest producer of steel, transitioning from BOF to EAF
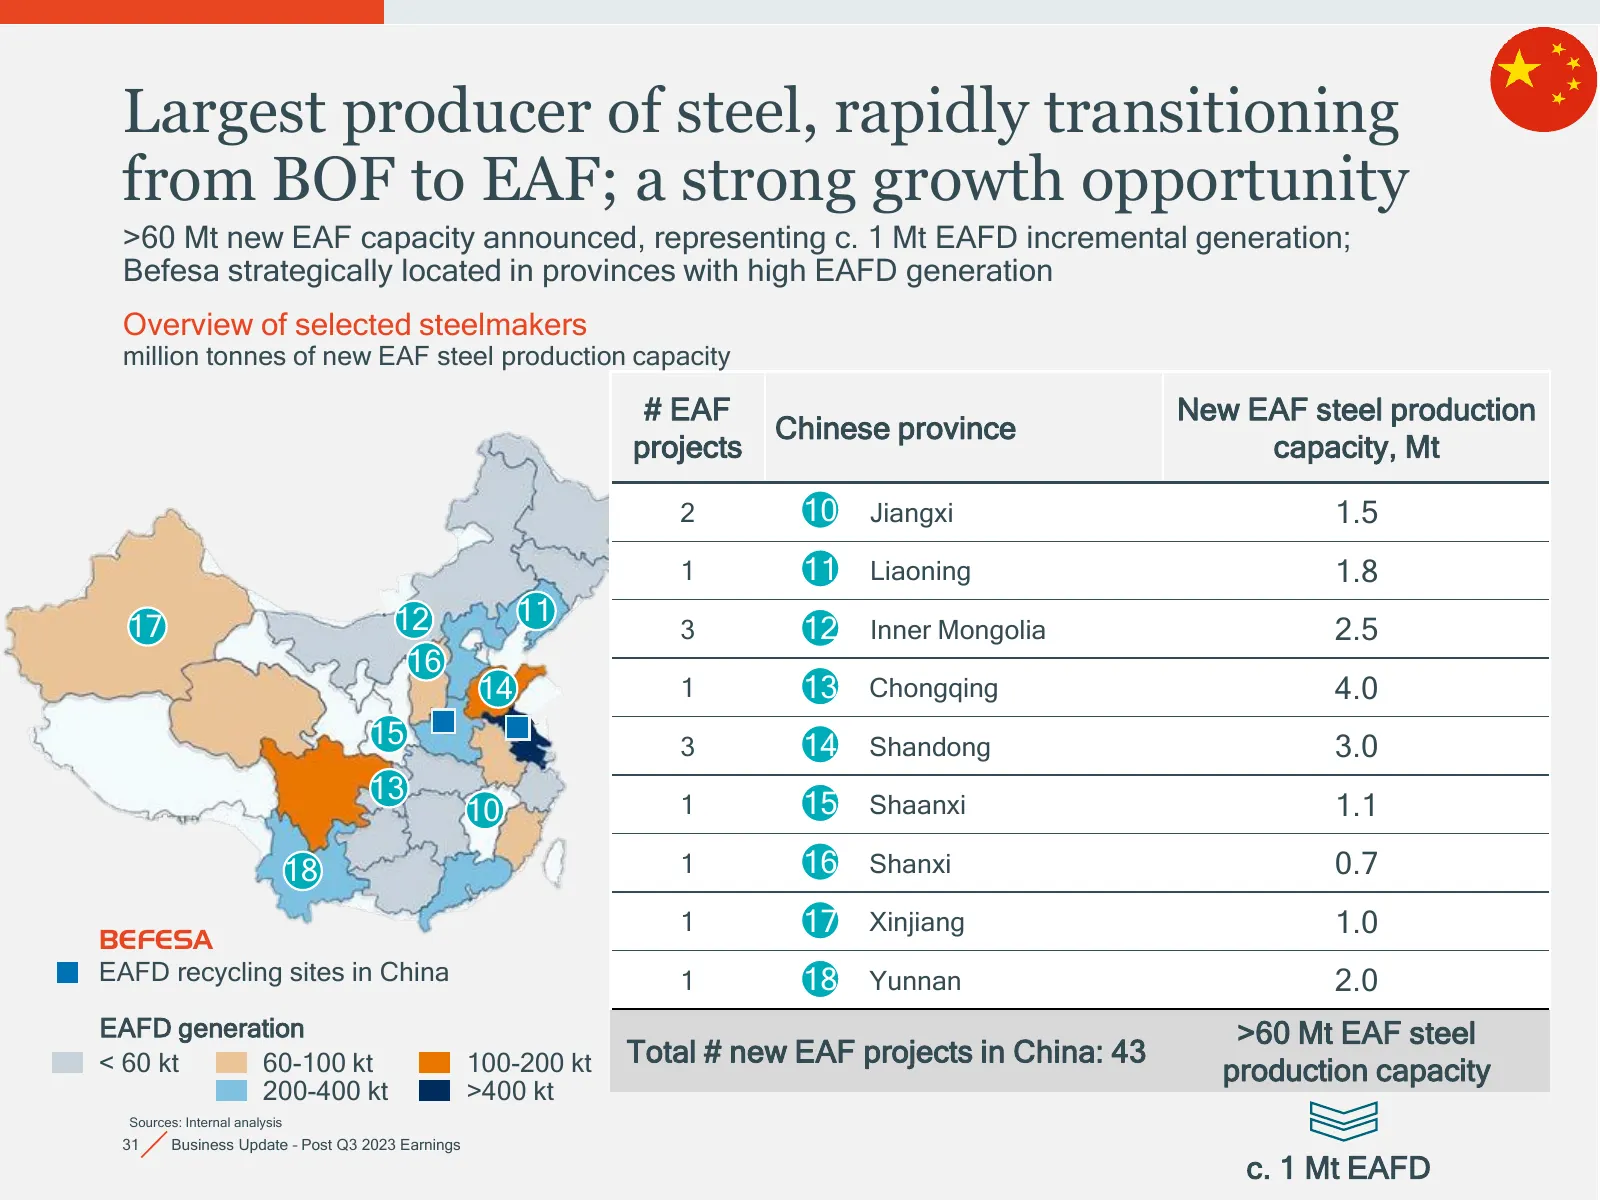
Largest producer of steel, rapidly transitioning from BOF to EAF; a strong growth opportunity >60 Mt new EAF capacity announced, representing c. 1 Mt EAFD incremental generation; Befesa strategically located in provinces with high EAFD generation Overview of selected steelmakers million tonnes of ne
Slide 32: SGGP – Steel Dust – China
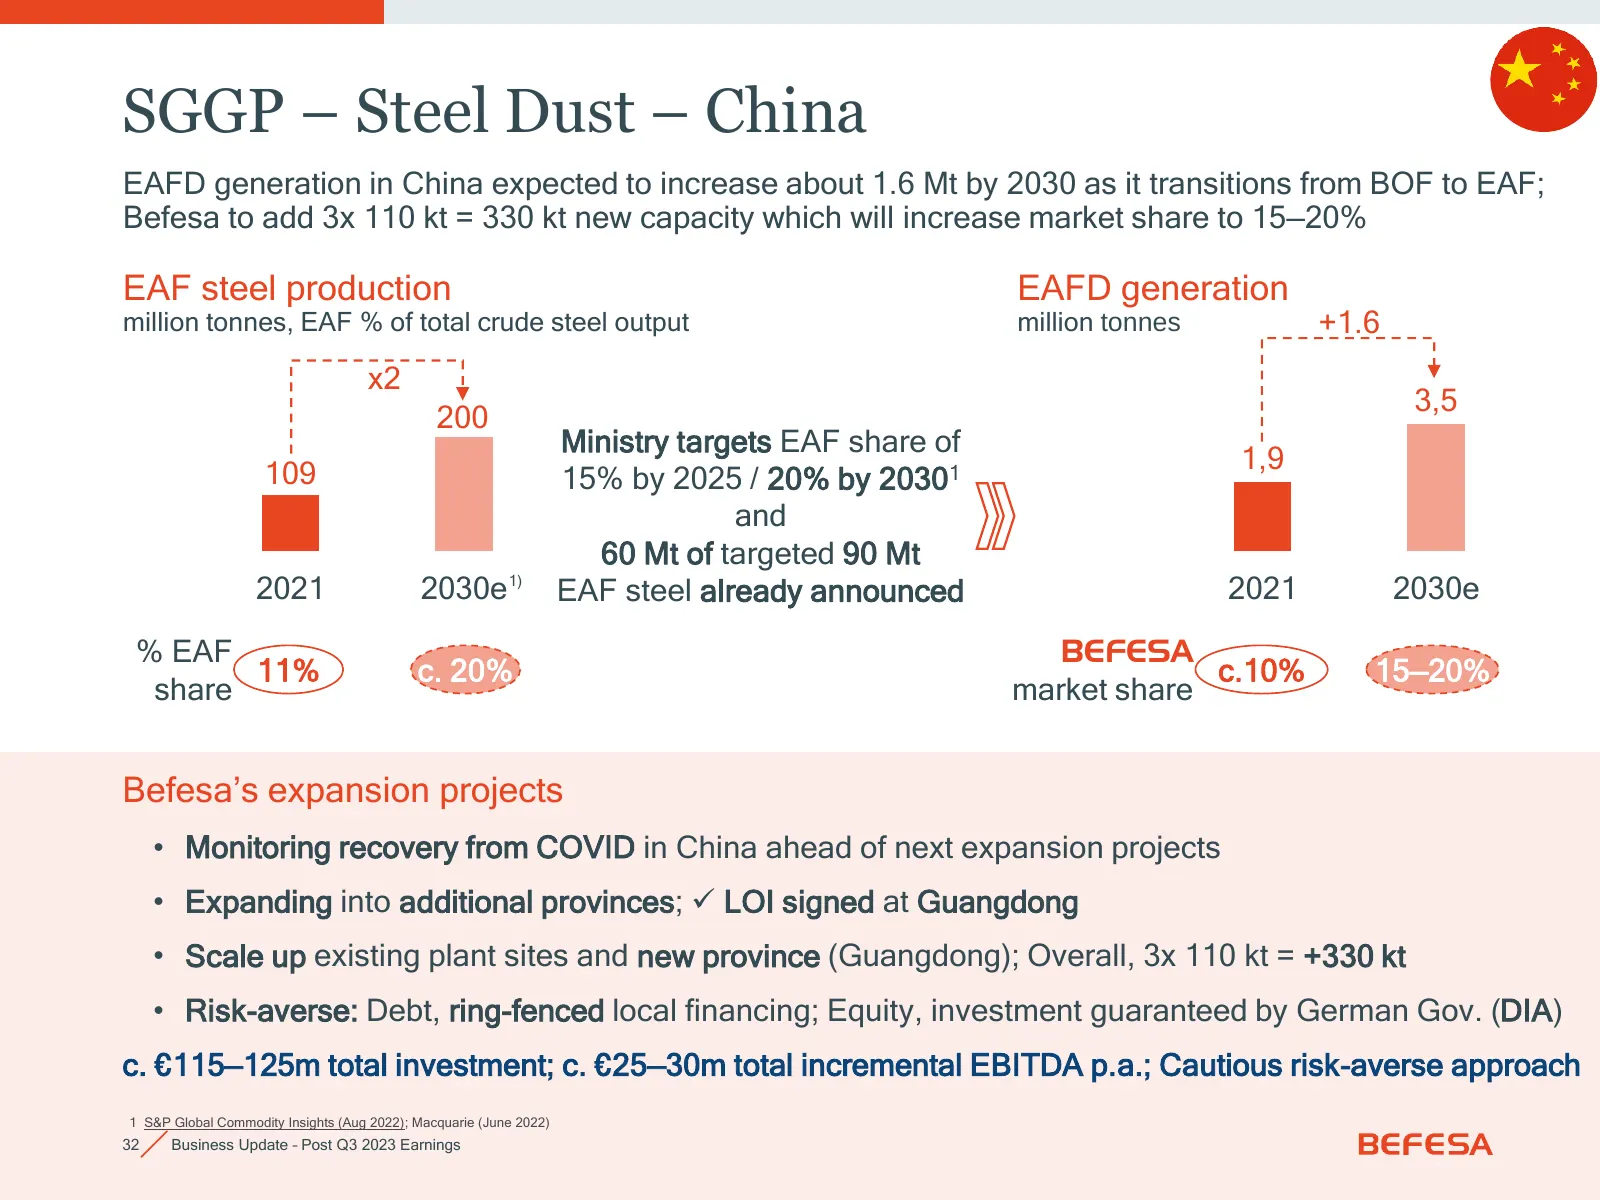
SGGP – Steel Dust – China EAFD generation in China expected to increase about 1.6 Mt by 2030 as it transitions from BOF to EAF; Befesa to add 3x 110 kt = 330 kt new capacity which will increase market share to 15—20% EAF steel production EAFD generation million tonnes, EAF % of total crude steel out
Slide 33: Cautiously progressing in Guangdong province
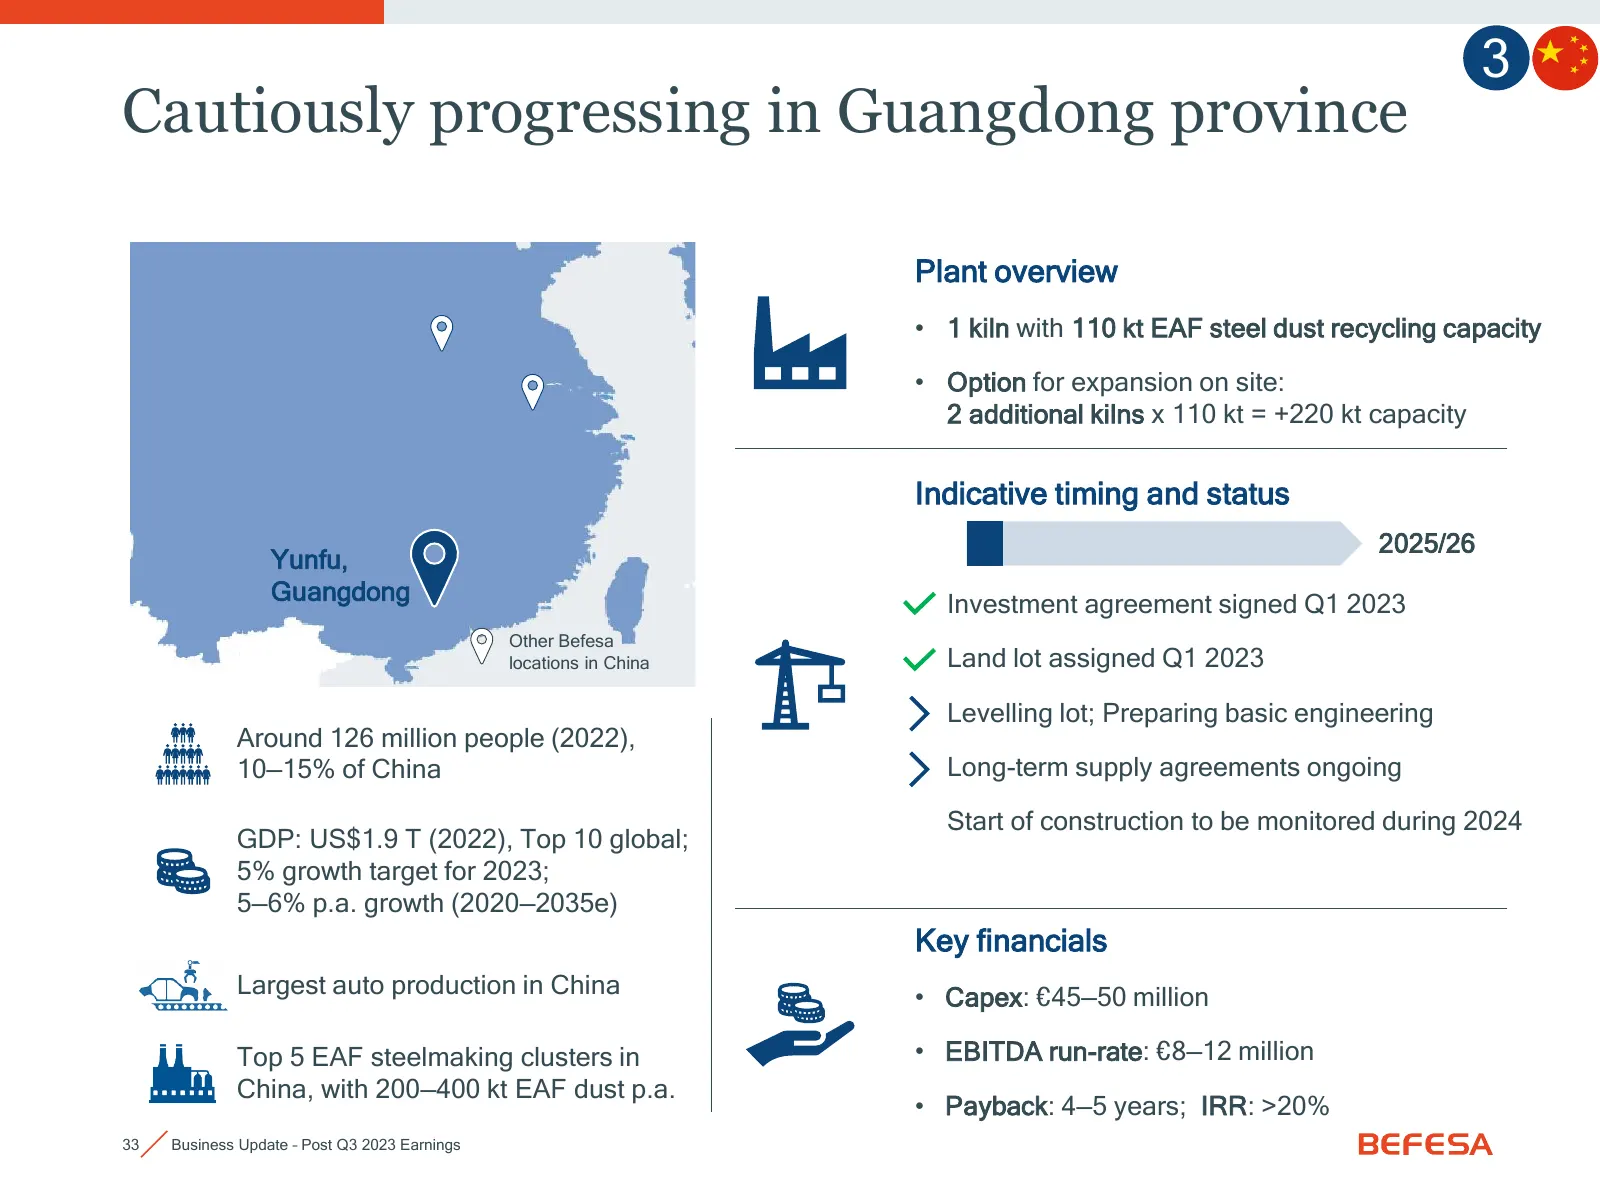
3 Cautiously progressing in Guangdong province Plant overview • 1 kiln with 110 kt EAF steel dust recycling capacity • Option for expansion on site: 2 additional kilns x 110 kt = +220 kt capacity Indicative timing and status 2025/26 Yunfu, Guangdong Investment agreement signed Q1 2023 Other Befesa l
Slide 34: Megatrends and Befesa's approach by market
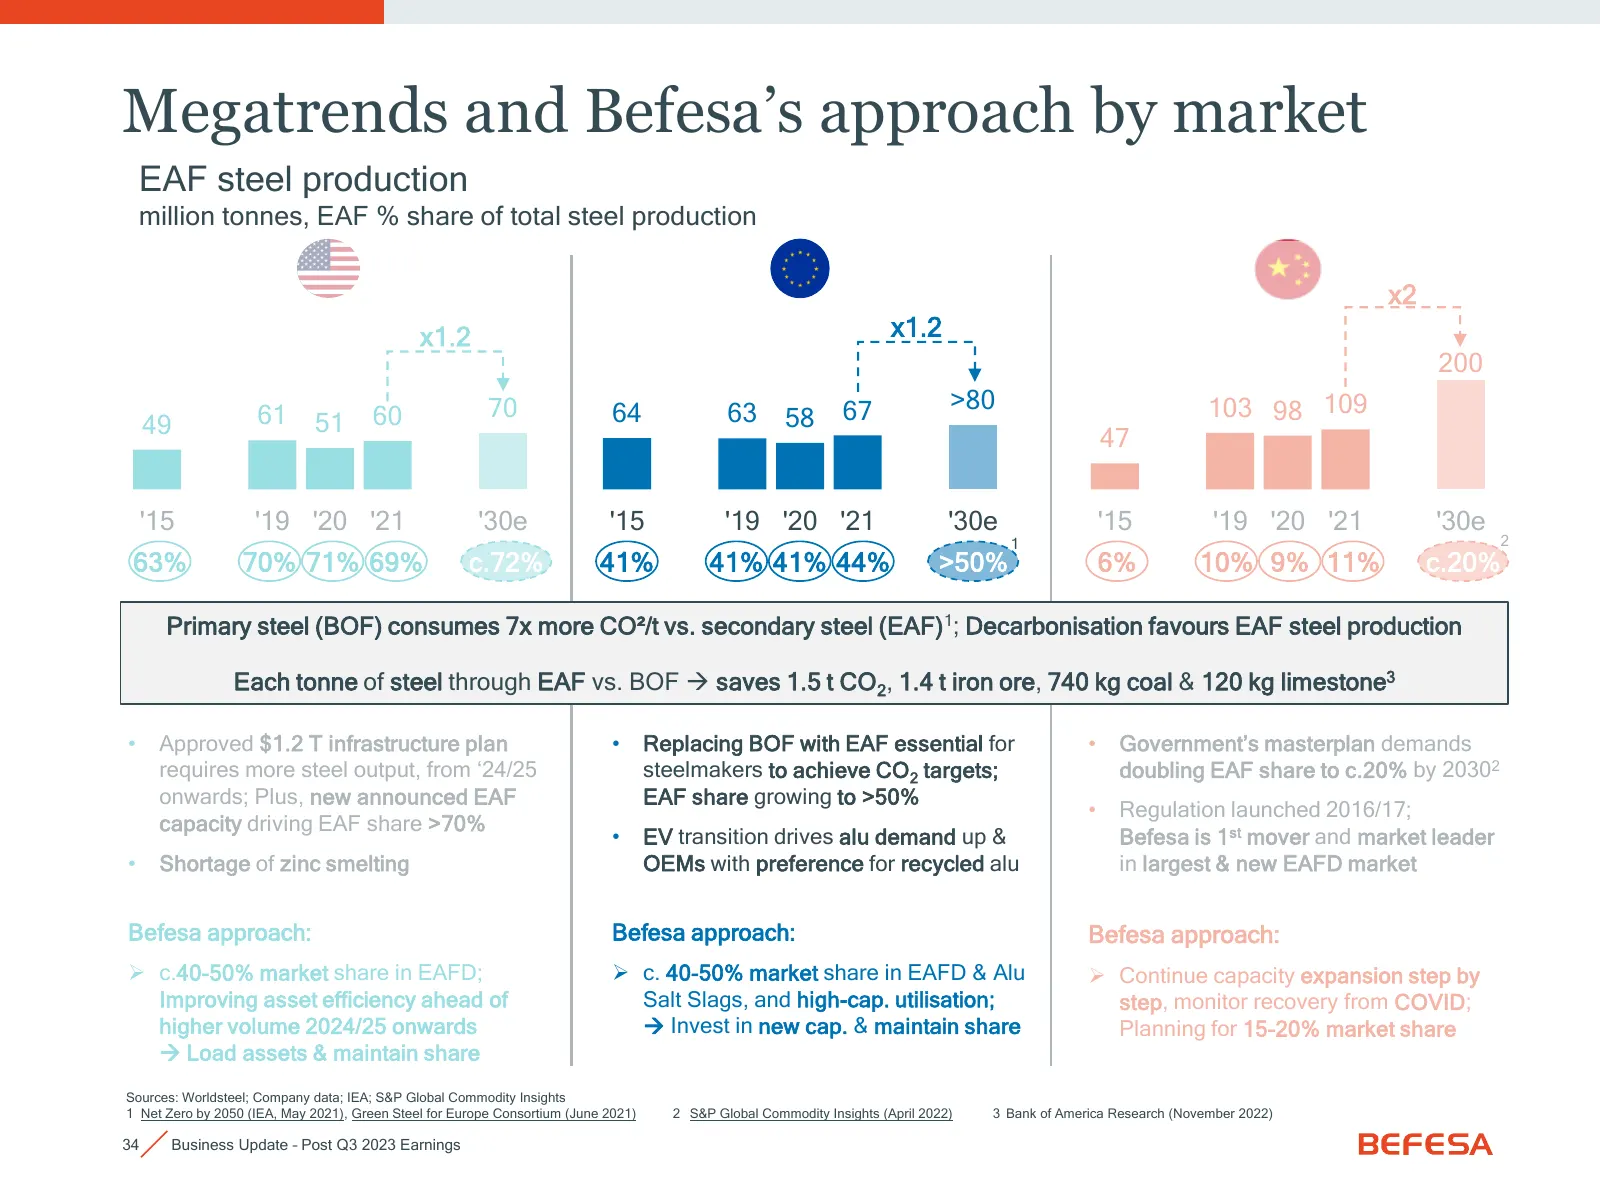
Megatrends and Befesa’s approach by market EAF steel production million tonnes, EAF % share of total steel production x2 x1.2 x1.2 200 70 64 67 >80 103 98 109 49 61 51 60 63 58 47 '15 '19 '20 '21 '30e '15 '19 '20 '21 '30e '15 '19 '20 '21 '30e 1 2 63% 70% 71% 69% c.72% 41% 41% 41% 44% >50% 6% 10% 9%
Slide 35: Decarbonisation investments in EU support EAF share growth
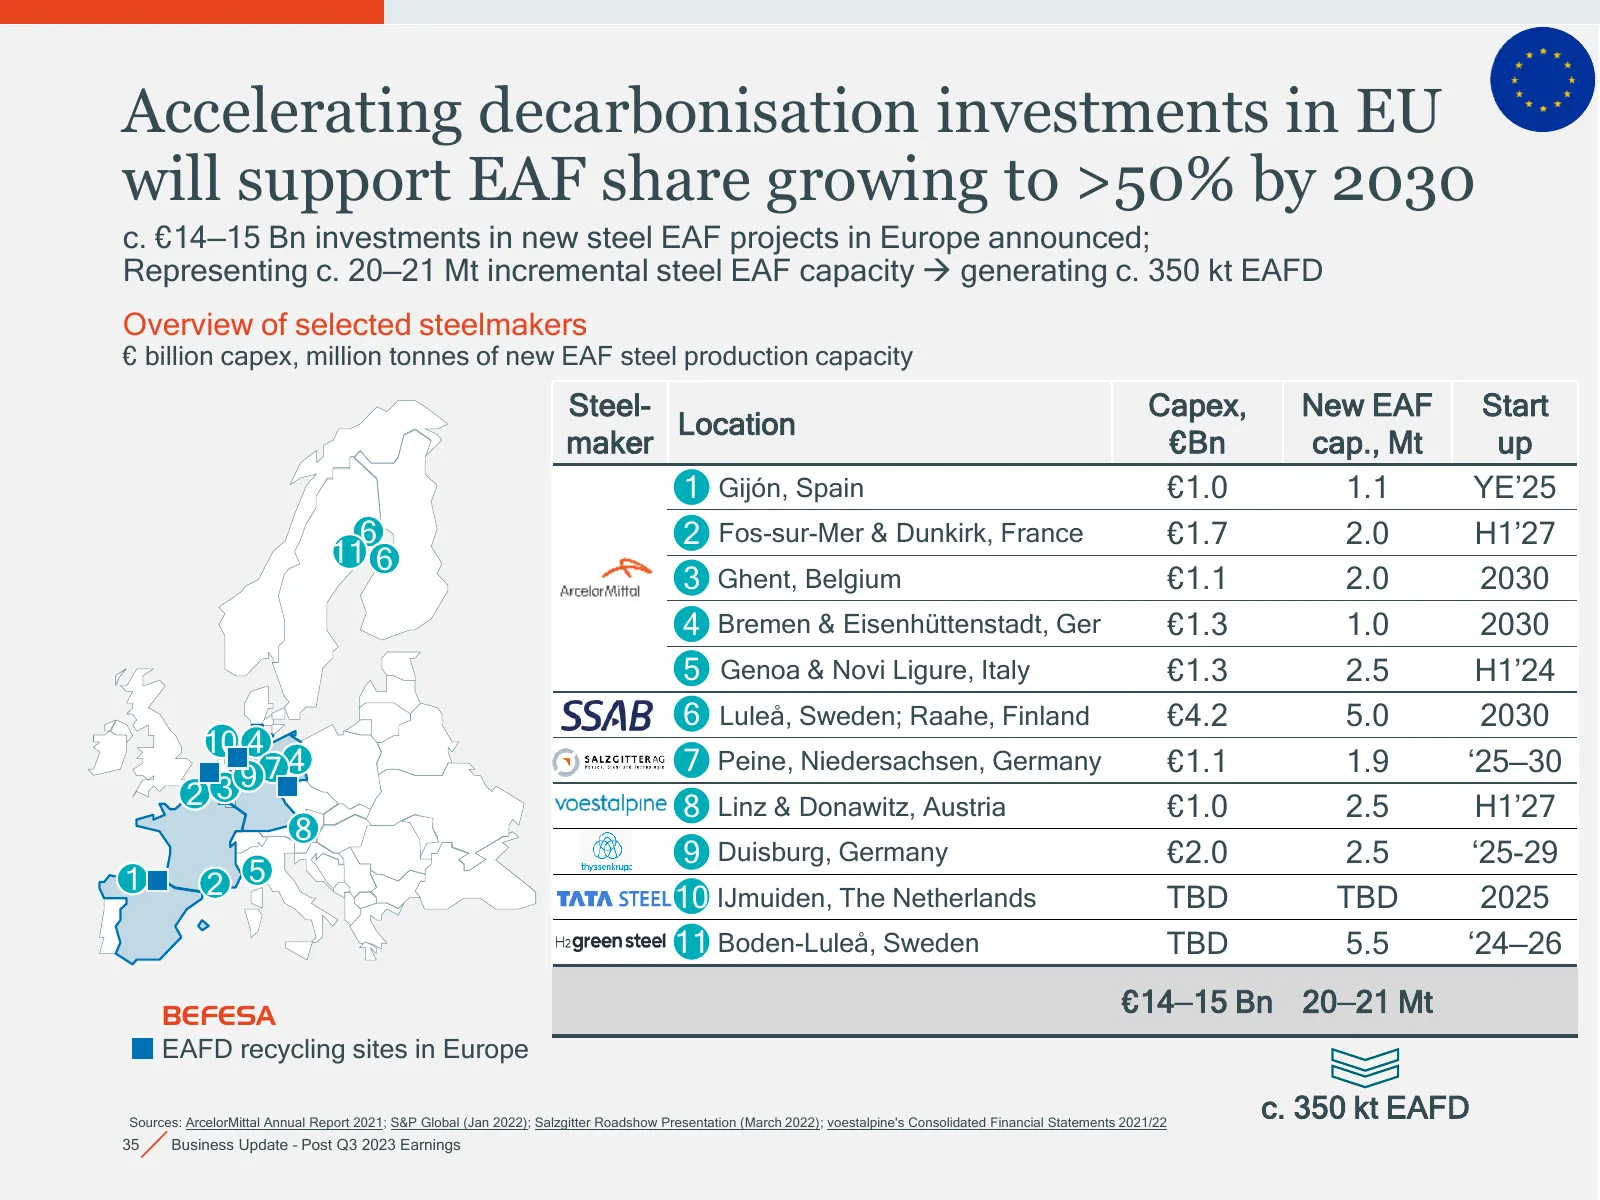
Accelerating decarbonisation investments in EU will support EAF share growing to >50% by 2030 c. €14—15 Bn investments in new steel EAF projects in Europe announced; Representing c. 20—21 Mt incremental steel EAF capacity → generating c. 350 kt EAFD Overview of selected steelmakers € billion capex,
Slide 36: Adding new EAFD recycling capacity and WOX washing expansion
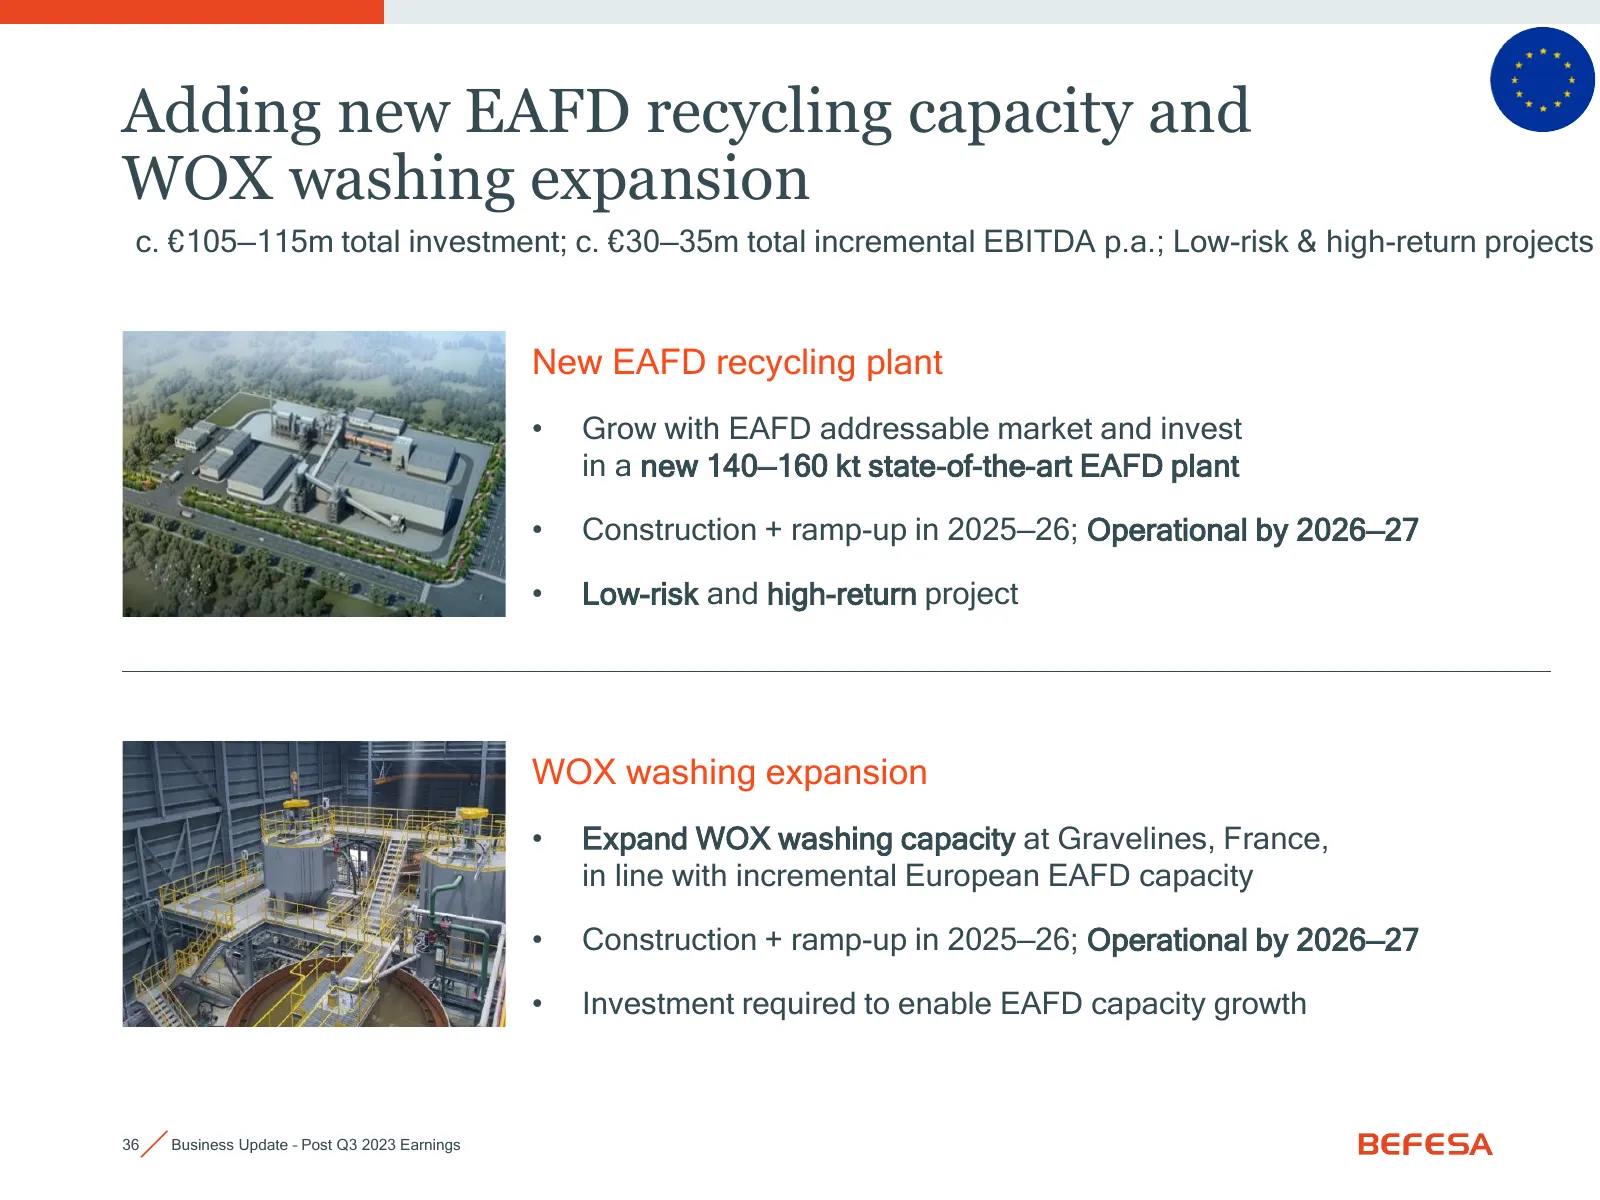
Adding new EAFD recycling capacity and WOX washing expansion c. €105—115m total investment; c. €30—35m total incremental EBITDA p.a.; Low-risk & high-return projects New EAFD recycling plant • Grow with EAFD addressable market and invest in a new 140—160 kt state-of-the-art EAFD plant • Construction
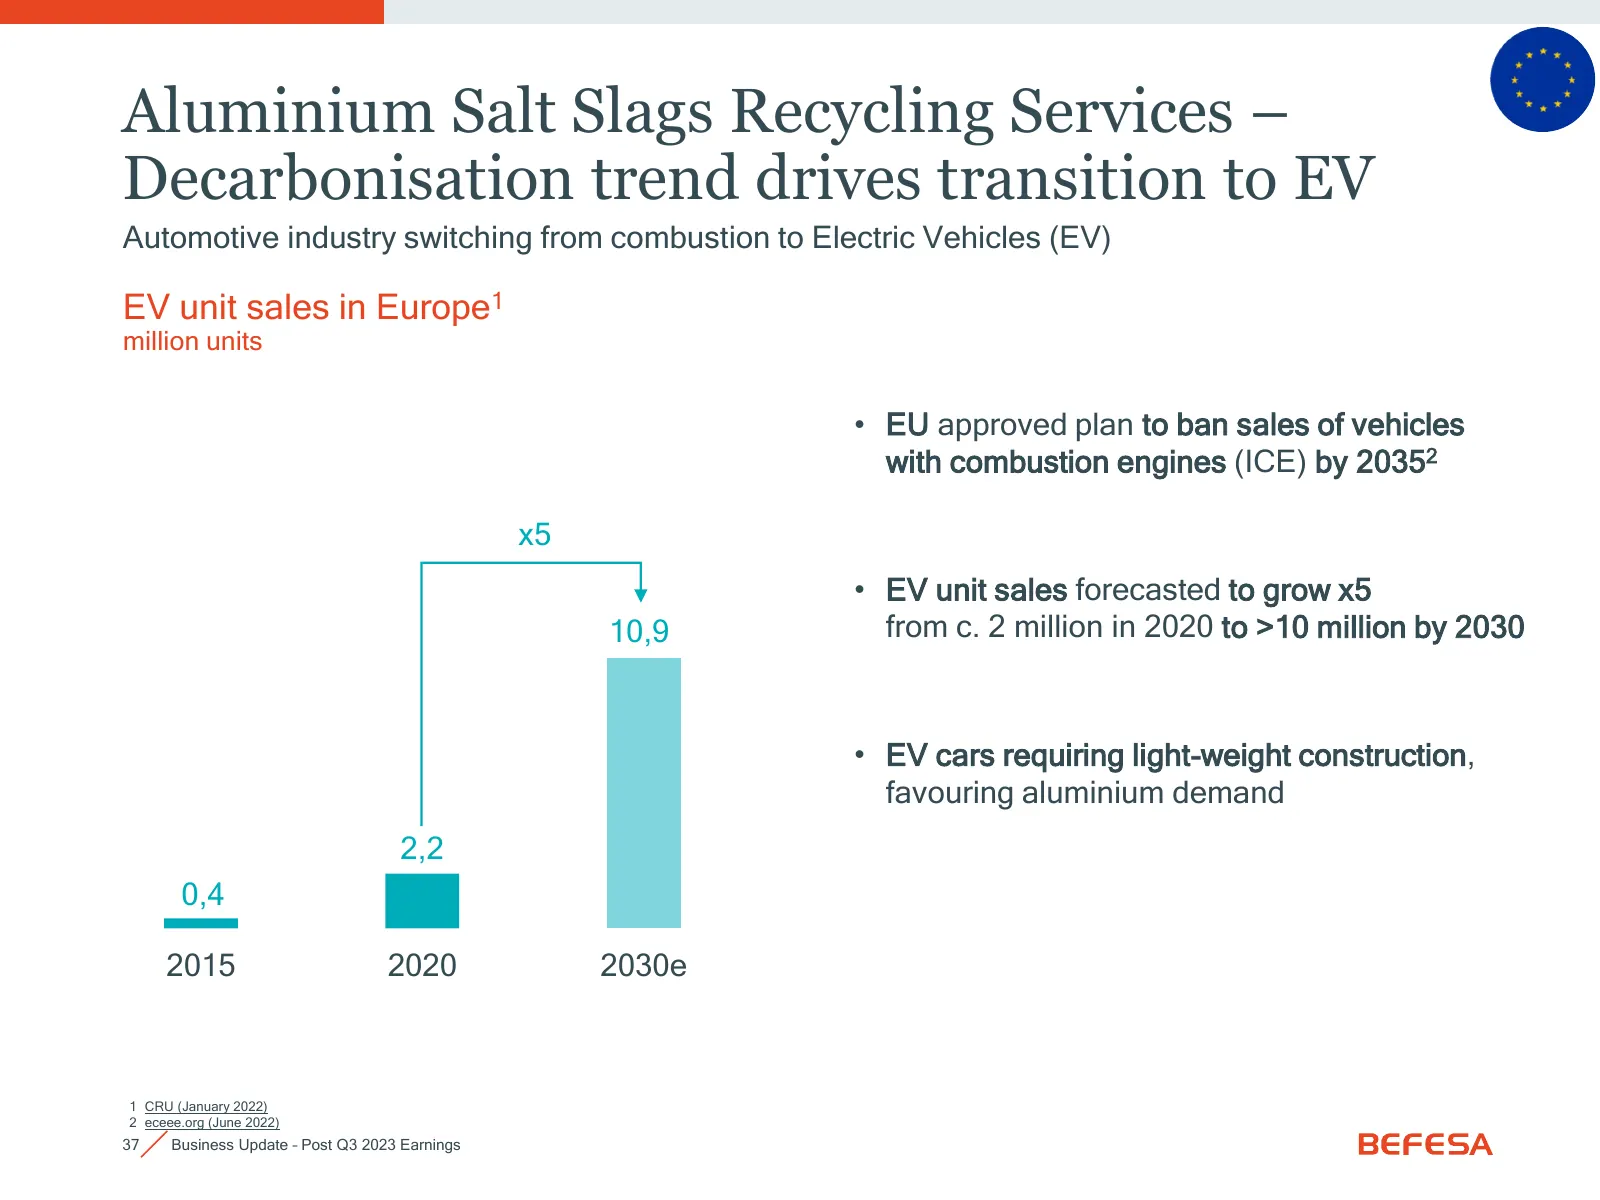
Slide 37: Aluminium Salt Slags Recycling – Decarbonisation drives EV transition
Aluminium Salt Slags Recycling Services – Decarbonisation trend drives transition to EV Automotive industry switching from combustion to Electric Vehicles (EV) EV unit sales in Europe1 million units • EU approved plan to ban sales of vehicles with combustion engines (ICE) by 20352 x5 • EV unit sales
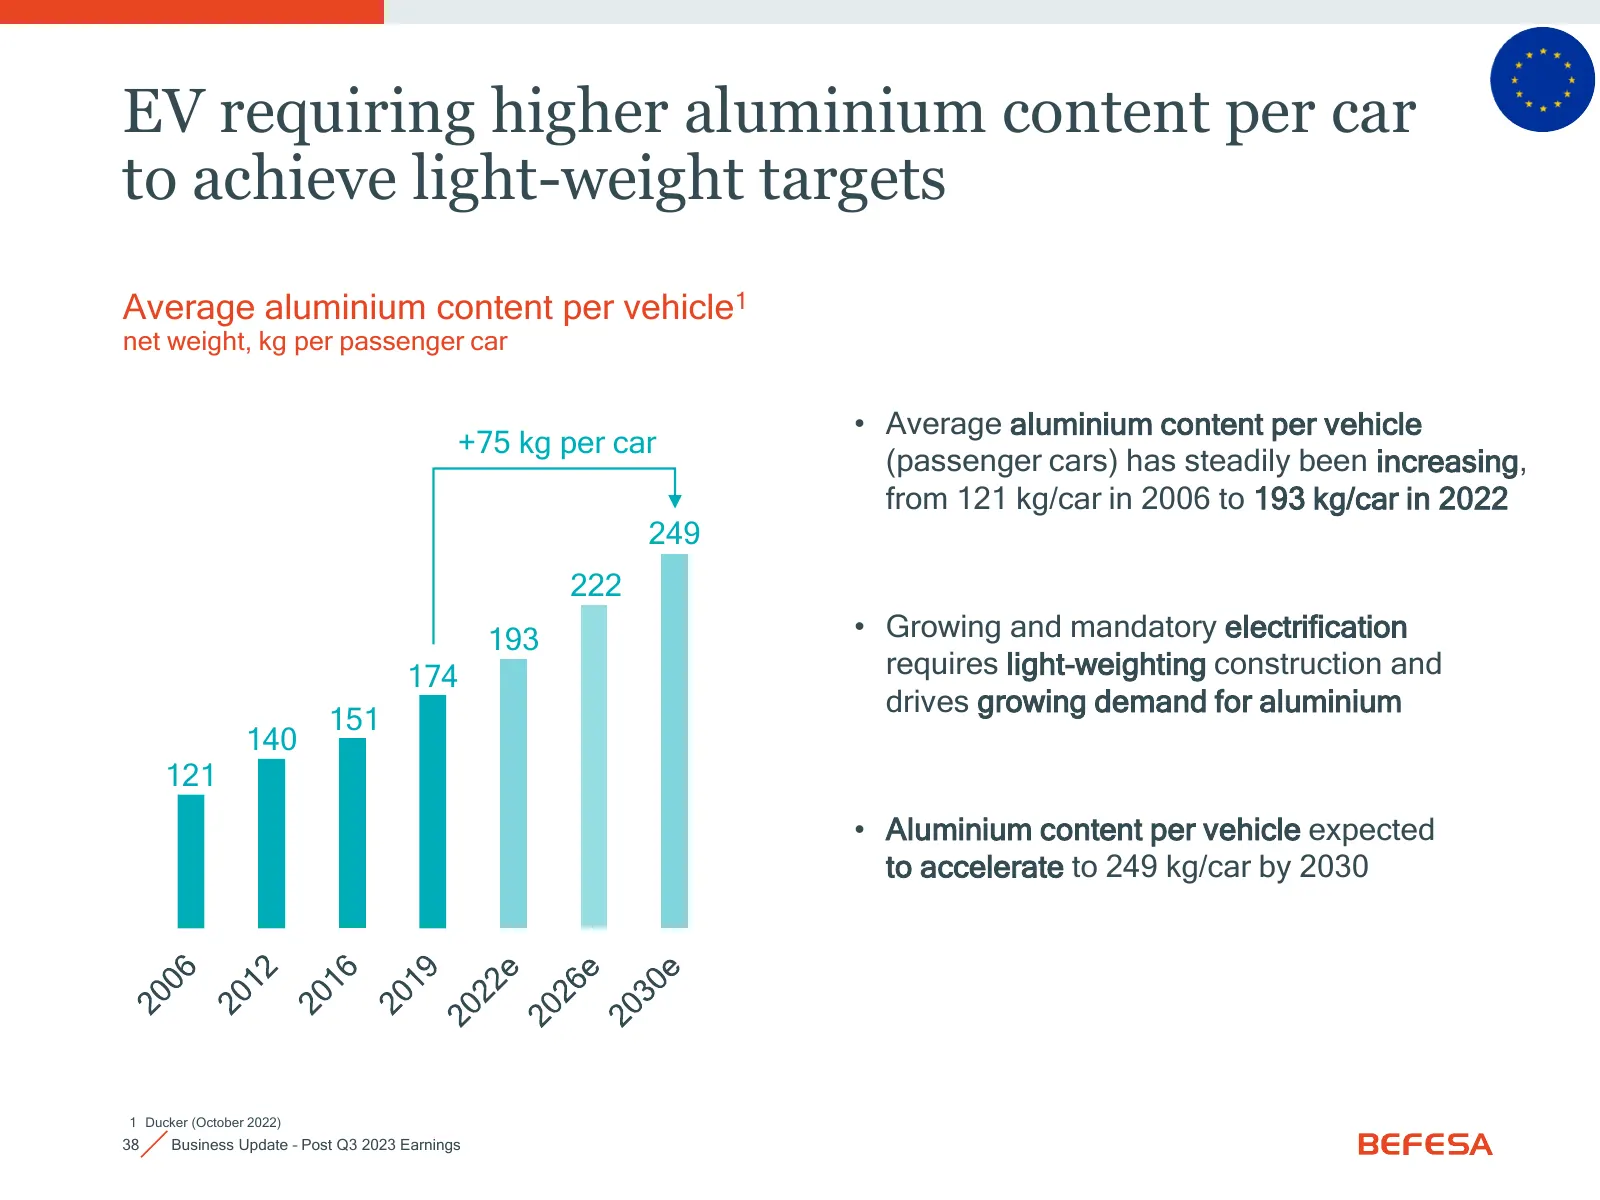
Slide 38: EV requiring higher aluminium content per car
EV requiring higher aluminium content per car to achieve light-weight targets Average aluminium content per vehicle1 net weight, kg per passenger car • Average aluminium content per vehicle +75 kg per car (passenger cars) has steadily been increasing, from 121 kg/car in 2006 to 193 kg/car in 2022 24
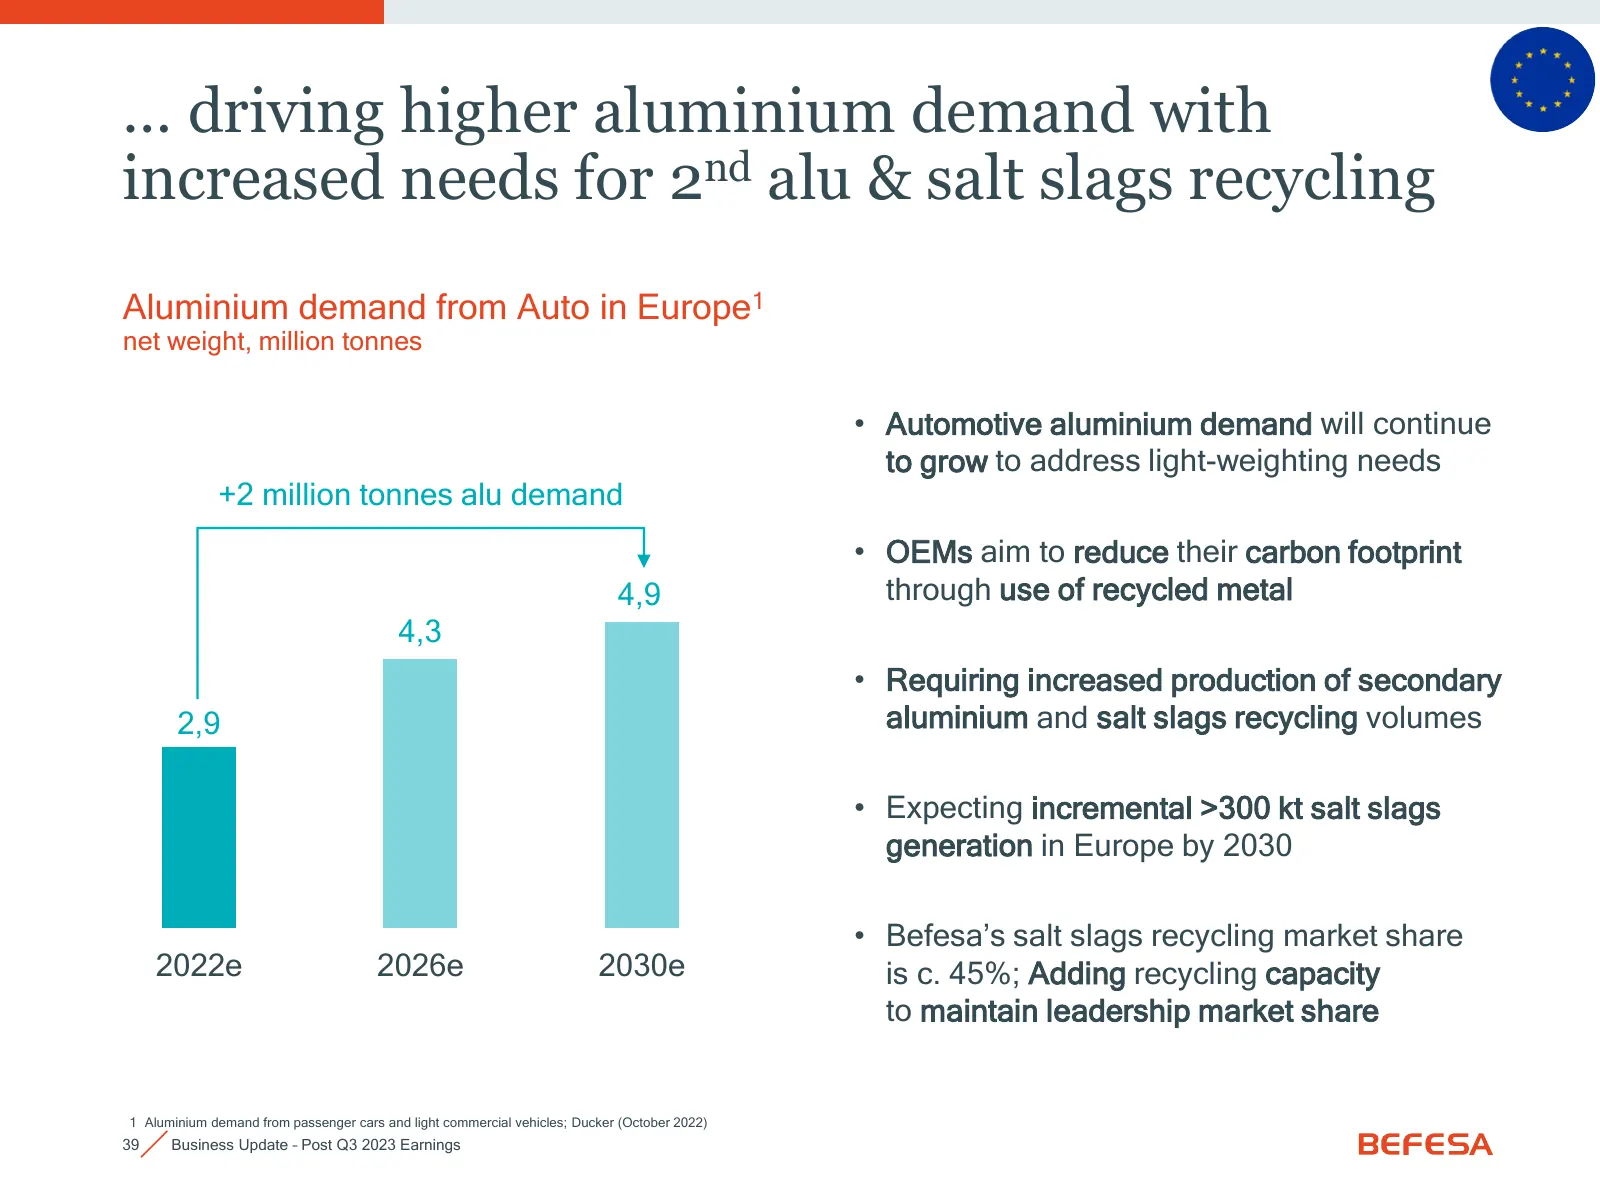
Slide 39: Driving higher aluminium demand and salt slags recycling needs
… driving higher aluminium demand with increased needs for 2nd alu & salt slags recycling Aluminium demand from Auto in Europe1 net weight, million tonnes • Automotive aluminium demand will continue to grow to address light-weighting needs +2 million tonnes alu demand • OEMs aim to reduce their carb
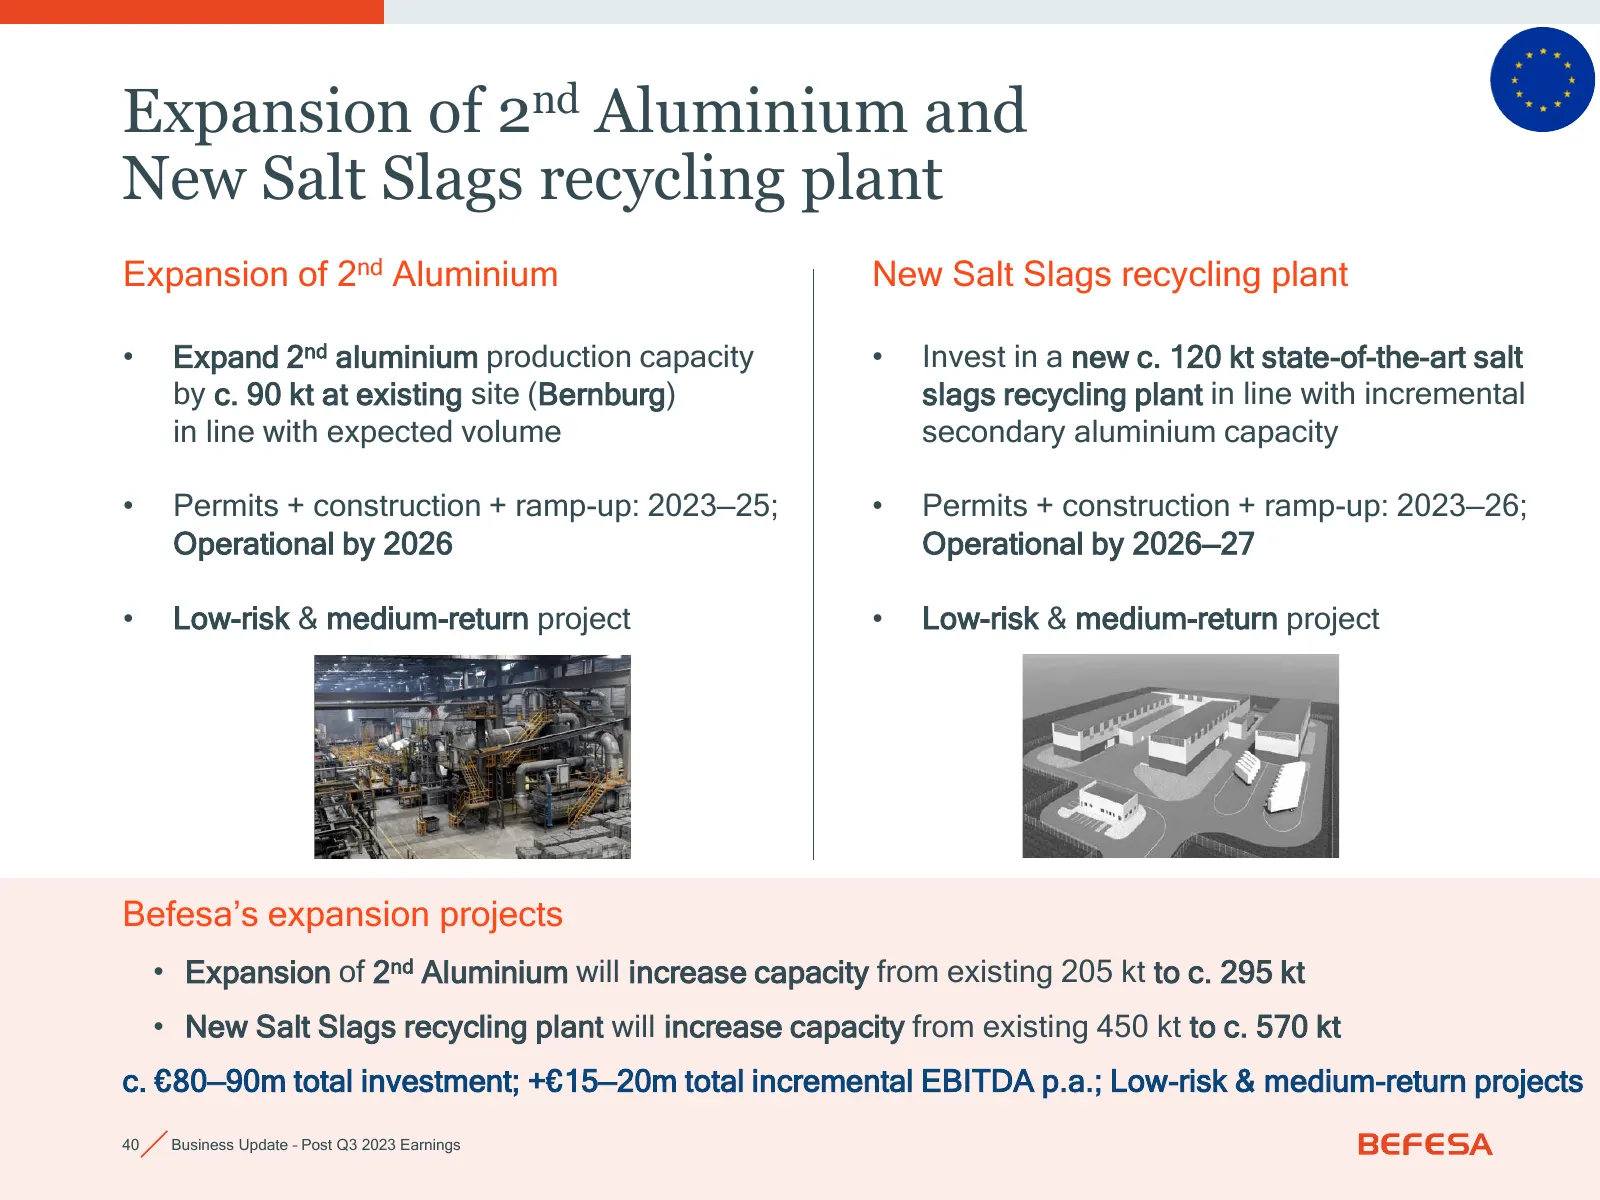
Slide 40: Expansion of 2nd Aluminium and new Salt Slags plant
Expansion of 2nd Aluminium and New Salt Slags recycling plant Expansion of 2nd Aluminium New Salt Slags recycling plant • Expand 2nd aluminium production capacity • Invest in a new c. 120 kt state-of-the-art salt by c. 90 kt at existing site (Bernburg) slags recycling plant in line with incremental
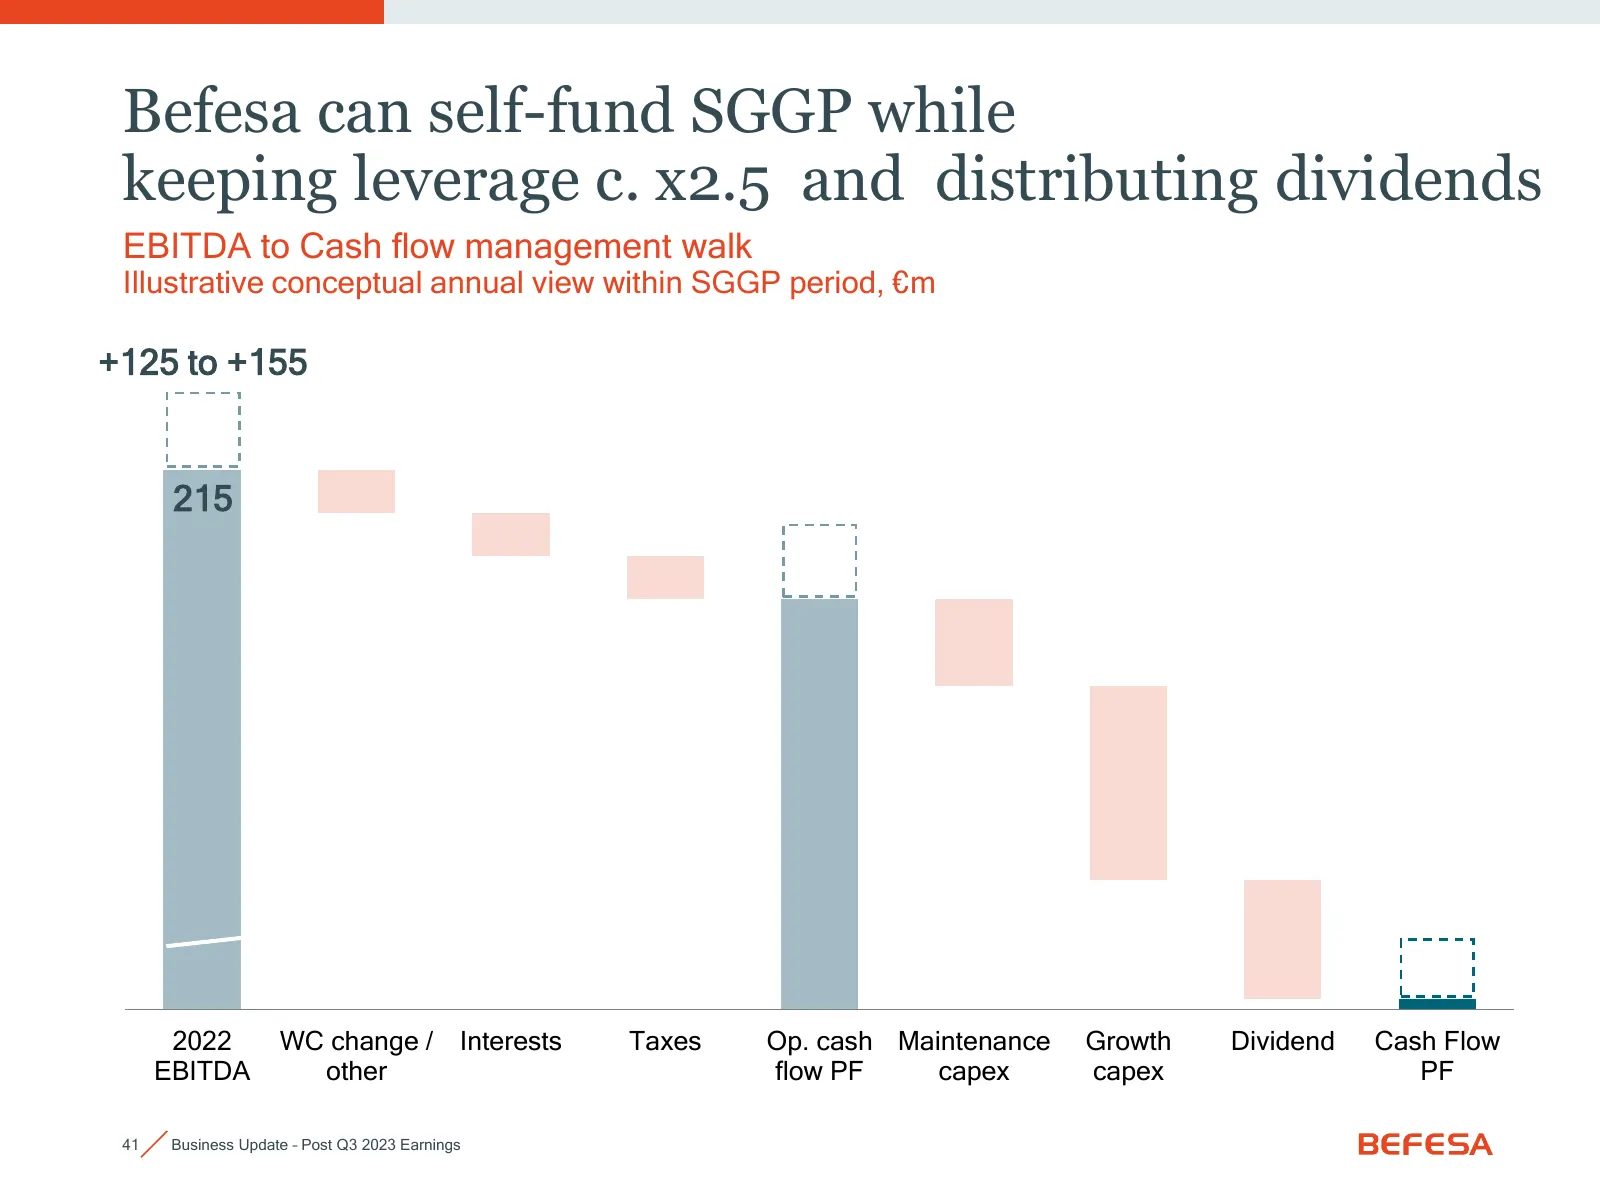
Slide 41: Befesa can self-fund SGGP while keeping leverage c. x2.5
Befesa can self-fund SGGP while keeping leverage c. x2.5 and distributing dividends EBITDA to Cash flow management walk Illustrative conceptual annual view within SGGP period, €m +125 to +155 215 2022 WC change / Interests Taxes Op. cash Maintenance Growth Dividend Cash Flow EBITDA other flow PF cap
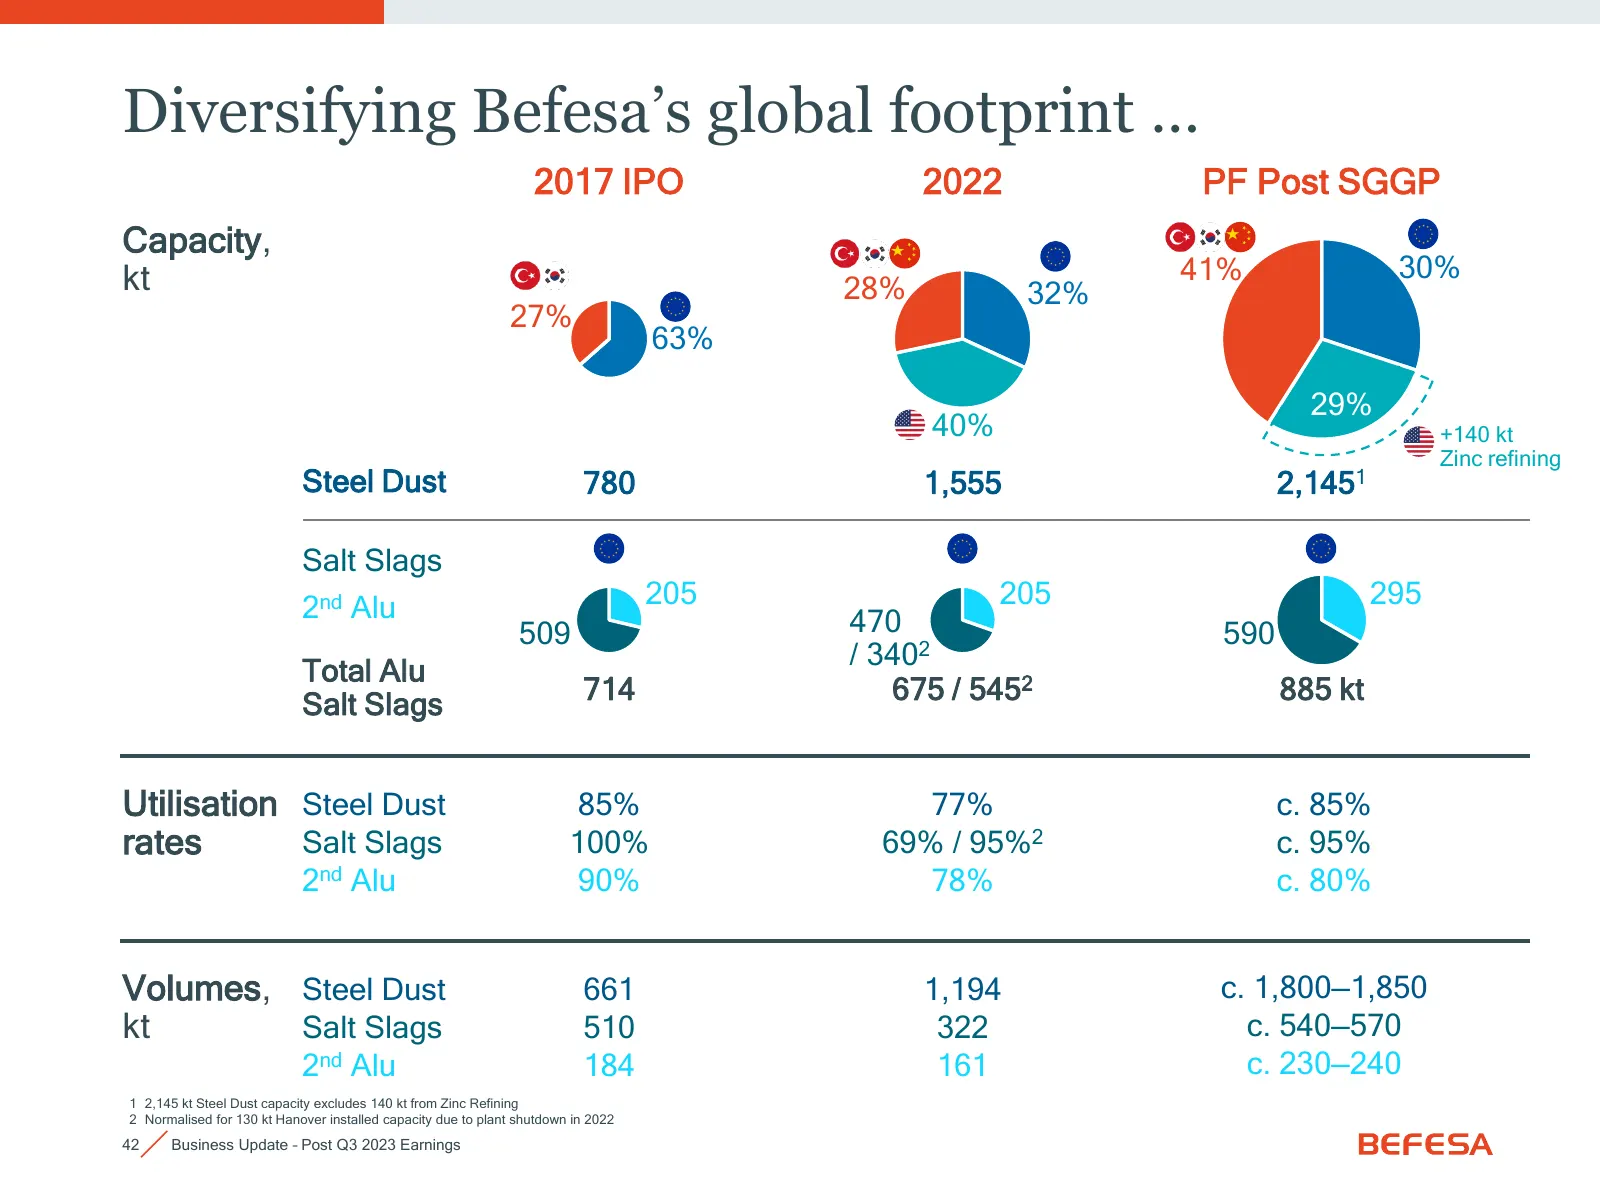
Slide 42: Diversifying Befesa's global footprint
Diversifying Befesa’s global footprint … 2017 IPO 2022 PF Post SGGP Capacity, kt 41% 30% 28% 32% 27% 63% 29% 40% +140 kt Zinc refining Steel Dust 780 1,555 2,1451 Salt Slags 2nd Alu 205 205 295 509 470 590 Total Alu / 3402 Salt Slags 714 675 / 5452 885 kt Utilisation Steel Dust 85% 77% c. 85% rates
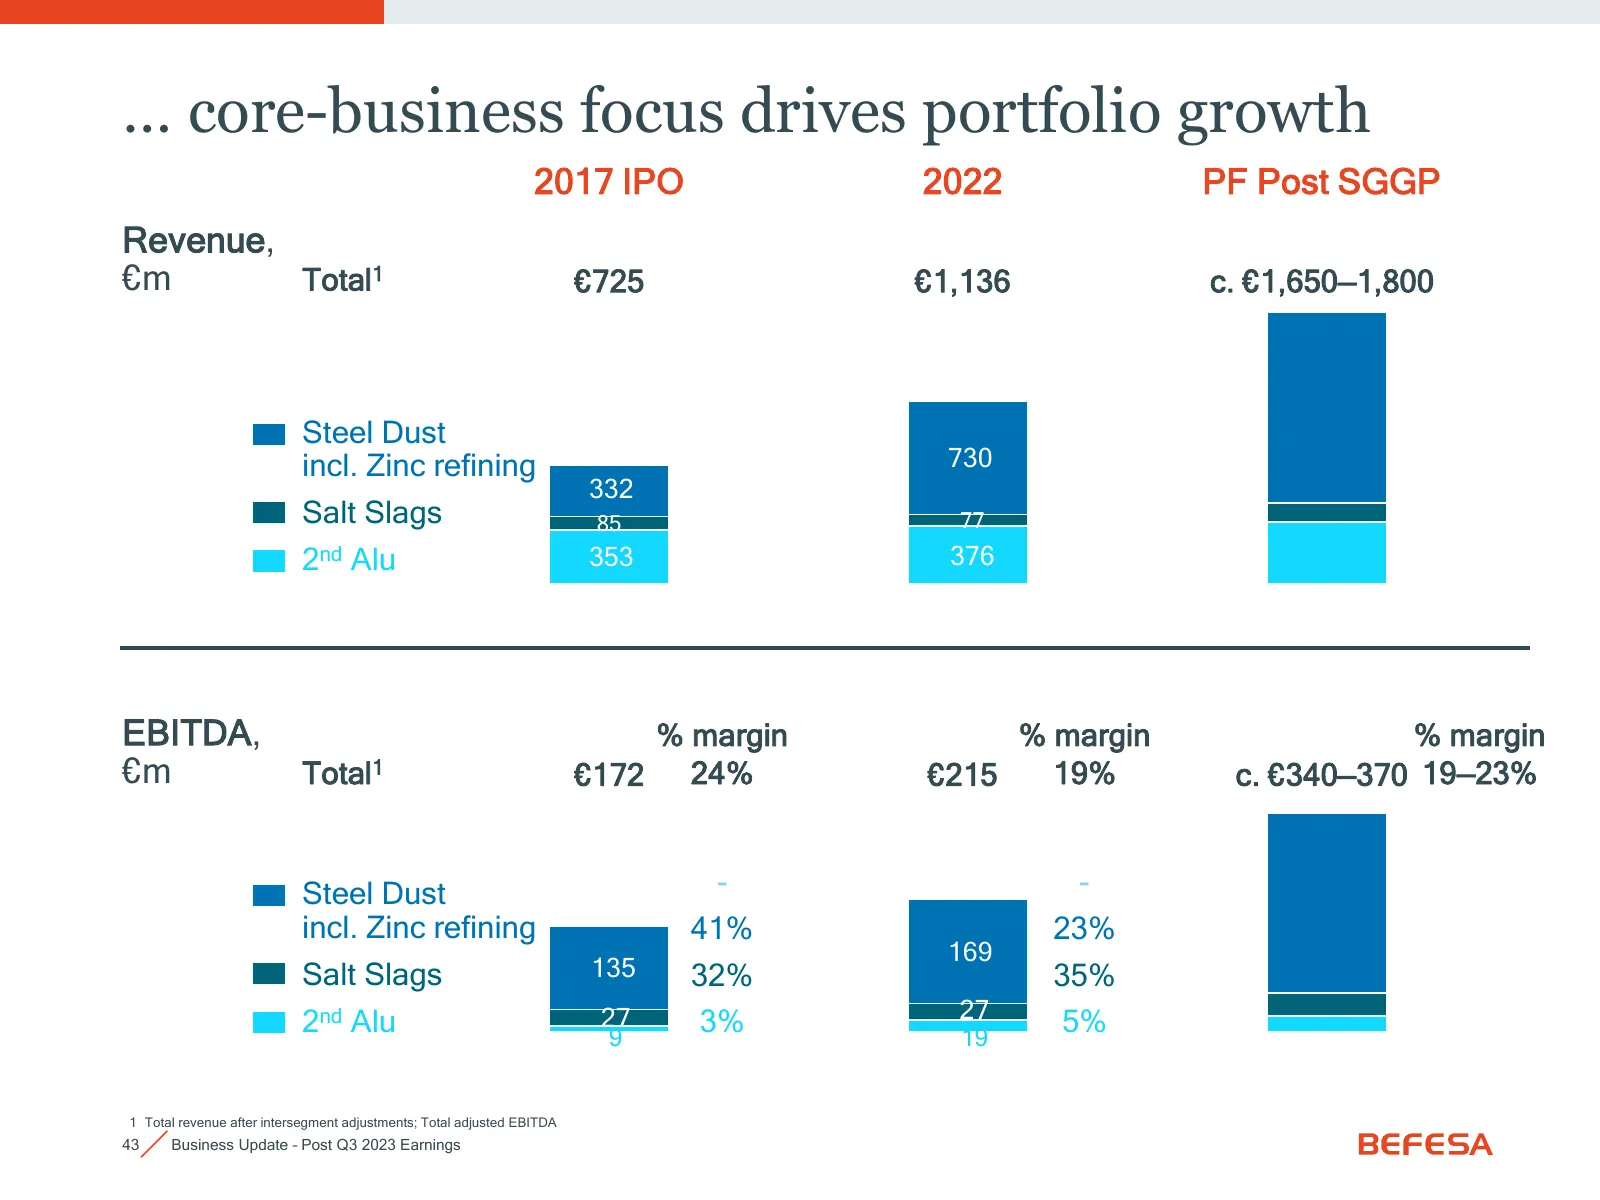
Slide 43: Core-business focus drives portfolio growth
… core-business focus drives portfolio growth 2017 IPO 2022 PF Post SGGP Revenue, €m Total1 €725 €1,136 c. €1,650—1,800 Steel Dust incl. Zinc refining 730 332 Salt Slags 85 77 2nd Alu 353 376 EBITDA, % margin % margin % margin €m Total1 €172 24% €215 19% c. €340—370 19—23% Steel Dust - - incl. Zinc
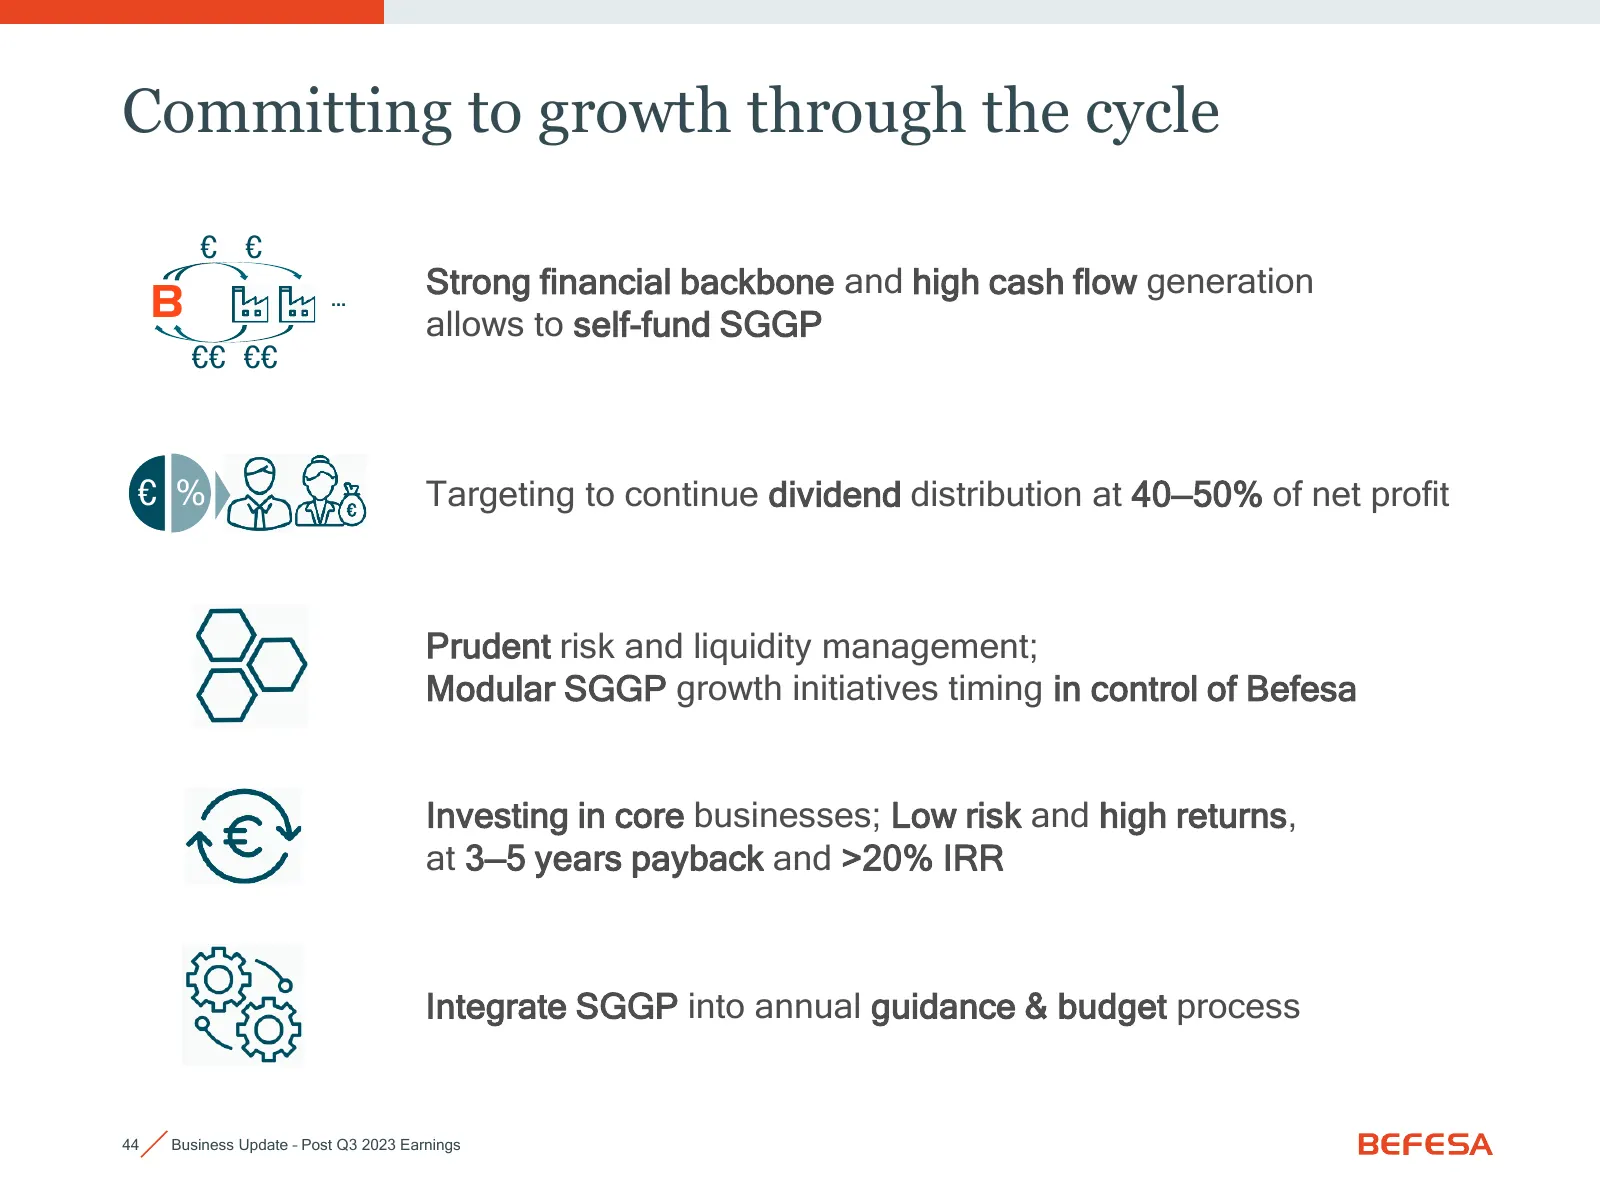
Slide 44: Committing to growth through the cycle
Committing to growth through the cycle € € Strong financial backbone and high cash flow generation B … allows to self-fund SGGP €€ €€ € % € Targeting to continue dividend distribution at 40—50% of net profit Prudent risk and liquidity management; Modular SGGP growth initiatives timing in control of
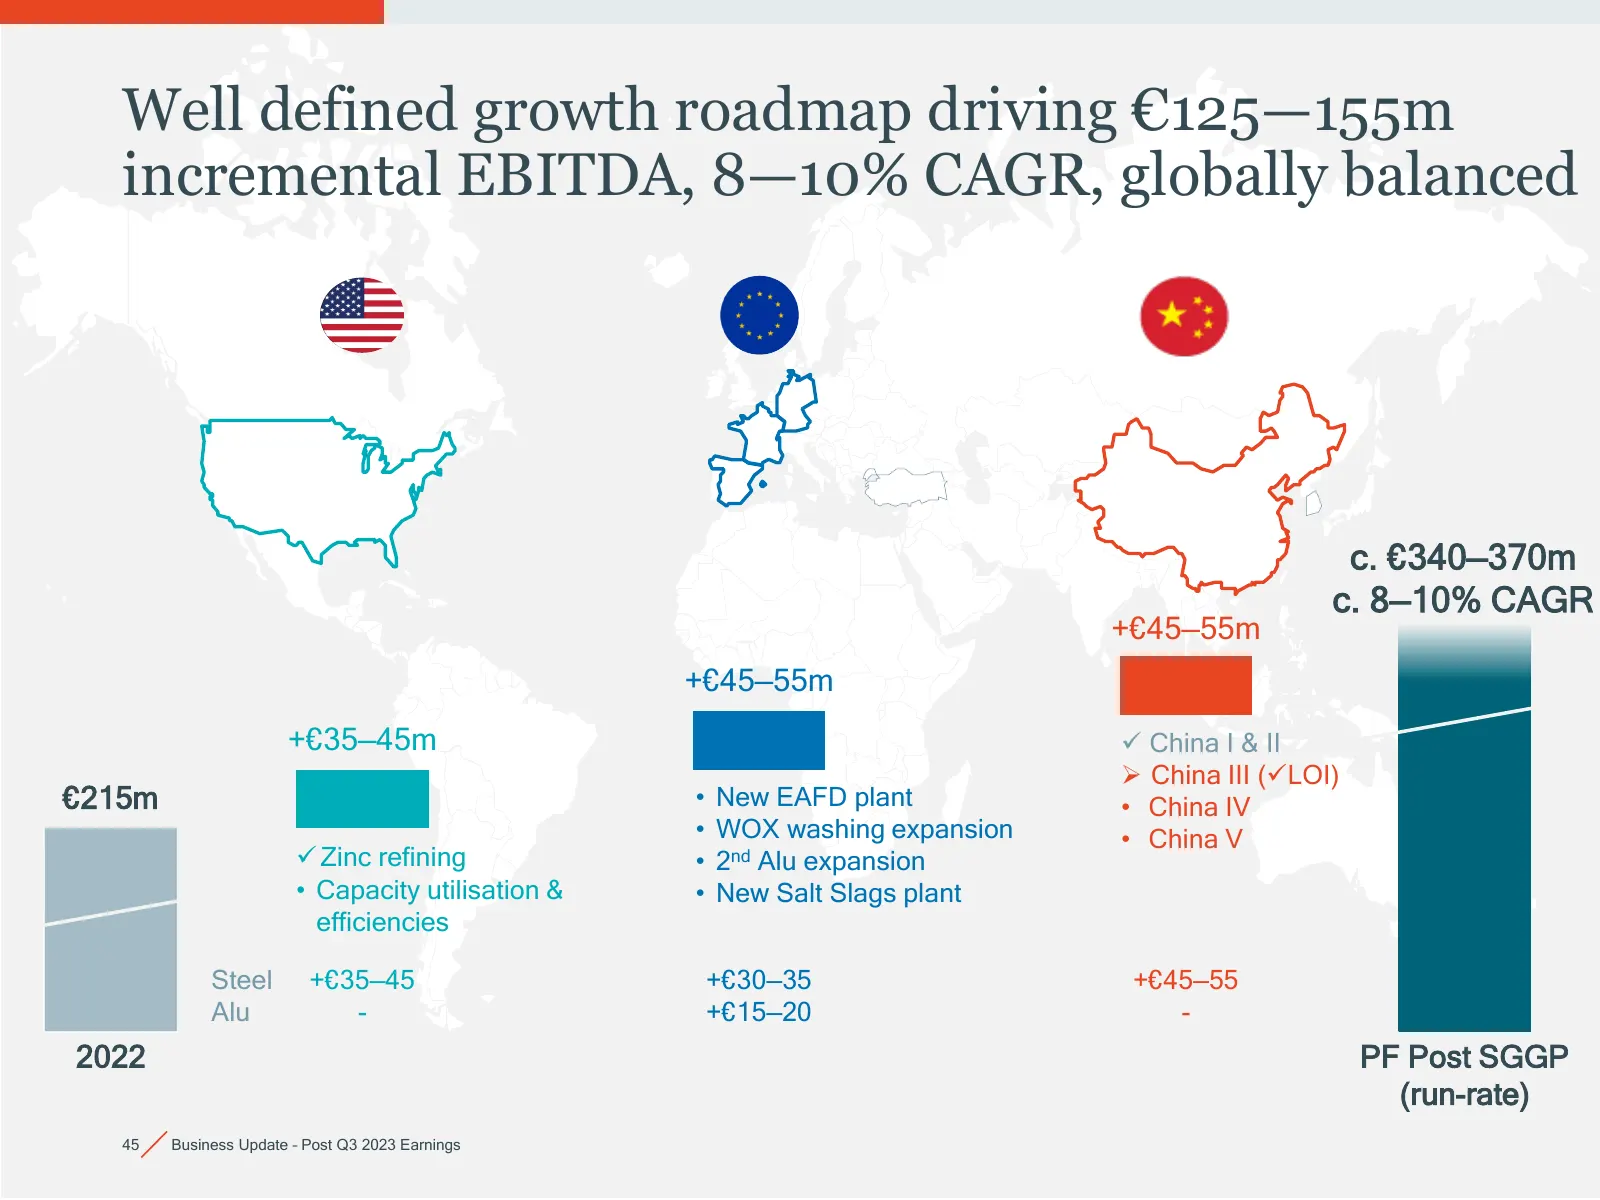
Slide 45: Growth roadmap driving €125-155m incremental EBITDA
Well defined growth roadmap driving €125—155m incremental EBITDA, 8—10% CAGR, globally balanced c. €340—370m c. 8—10% CAGR +€45—55m +€45—55m +€35—45m ✓ China I & II ➢ China III (✓LOI) €215m • New EAFD plant • China IV • WOX washing expansion • China V ✓ Zinc refining • 2nd Alu expansion • Capacity u
Slide 46: 9M 2023 results
a ? _ 0 3 / 9M 2023 results
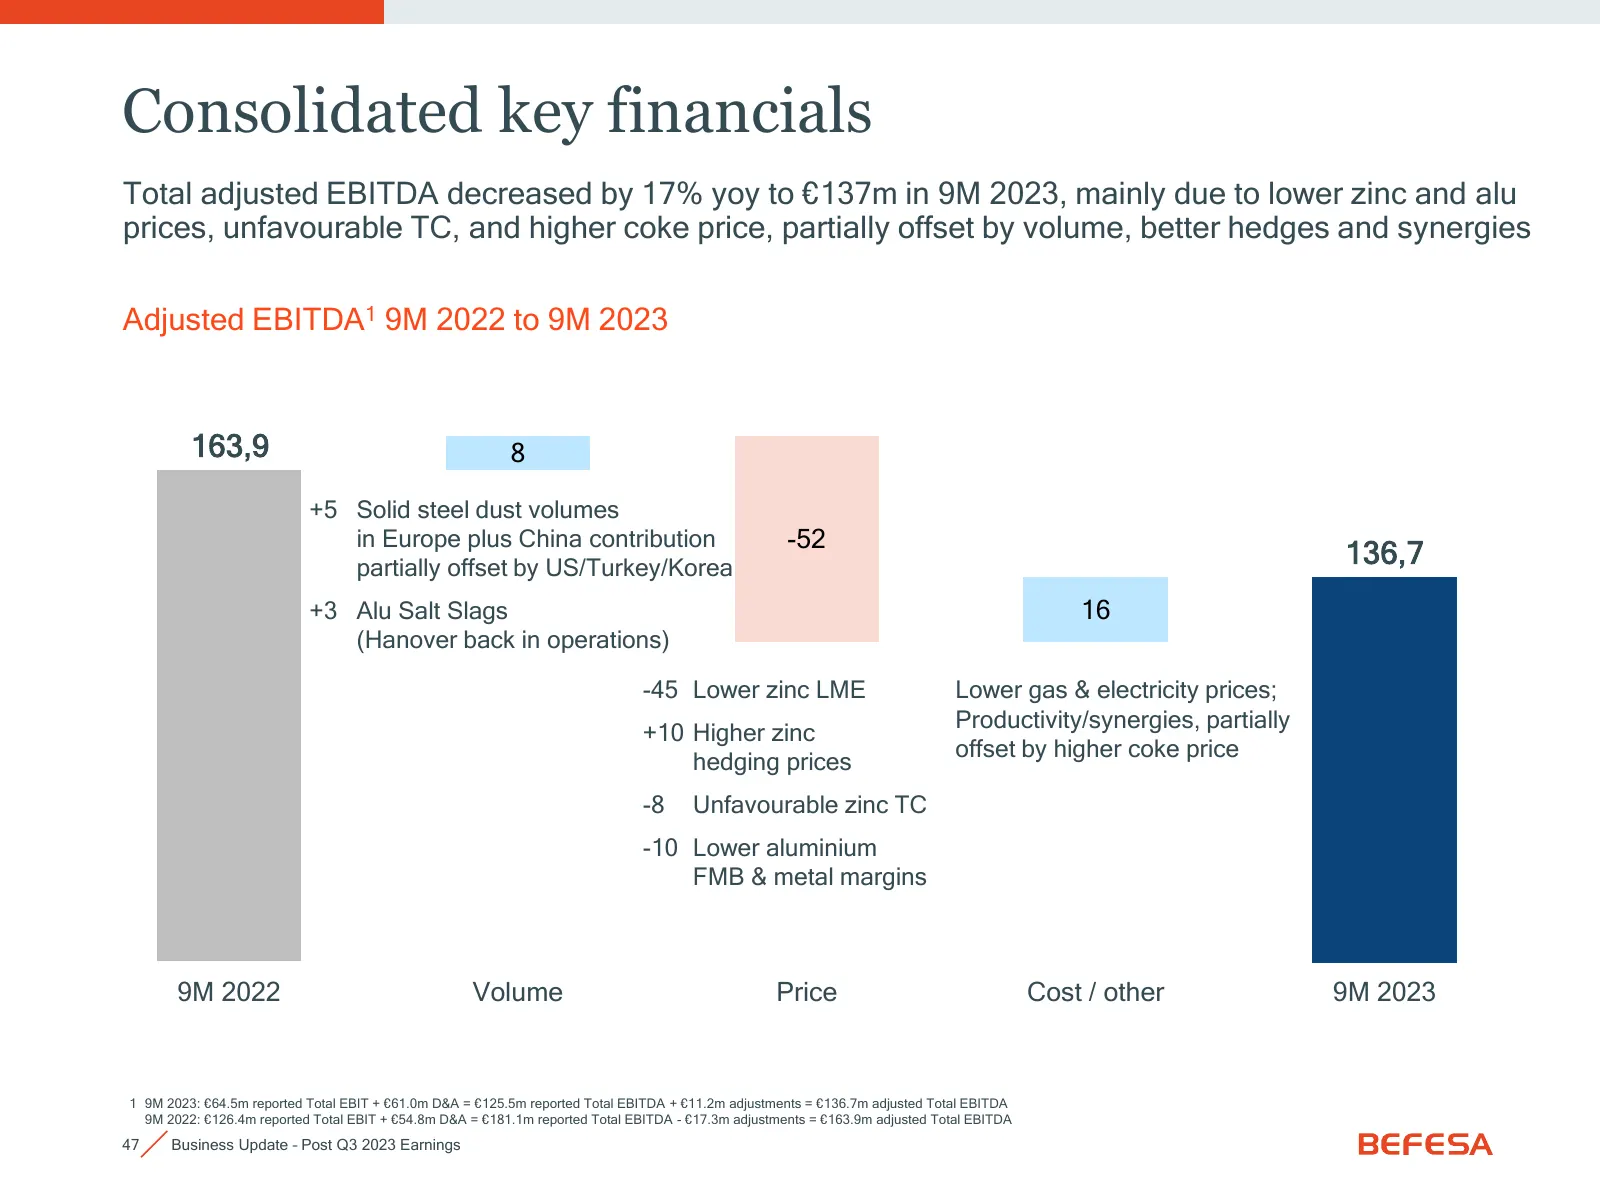
Slide 47: Consolidated key financials
Consolidated key financials Total adjusted EBITDA decreased by 17% yoy to €137m in 9M 2023, mainly due to lower zinc and alu prices, unfavourable TC, and higher coke price, partially offset by volume, better hedges and synergies Adjusted EBITDA1 9M 2022 to 9M 2023 163,9 8 +5 Solid steel dust volumes
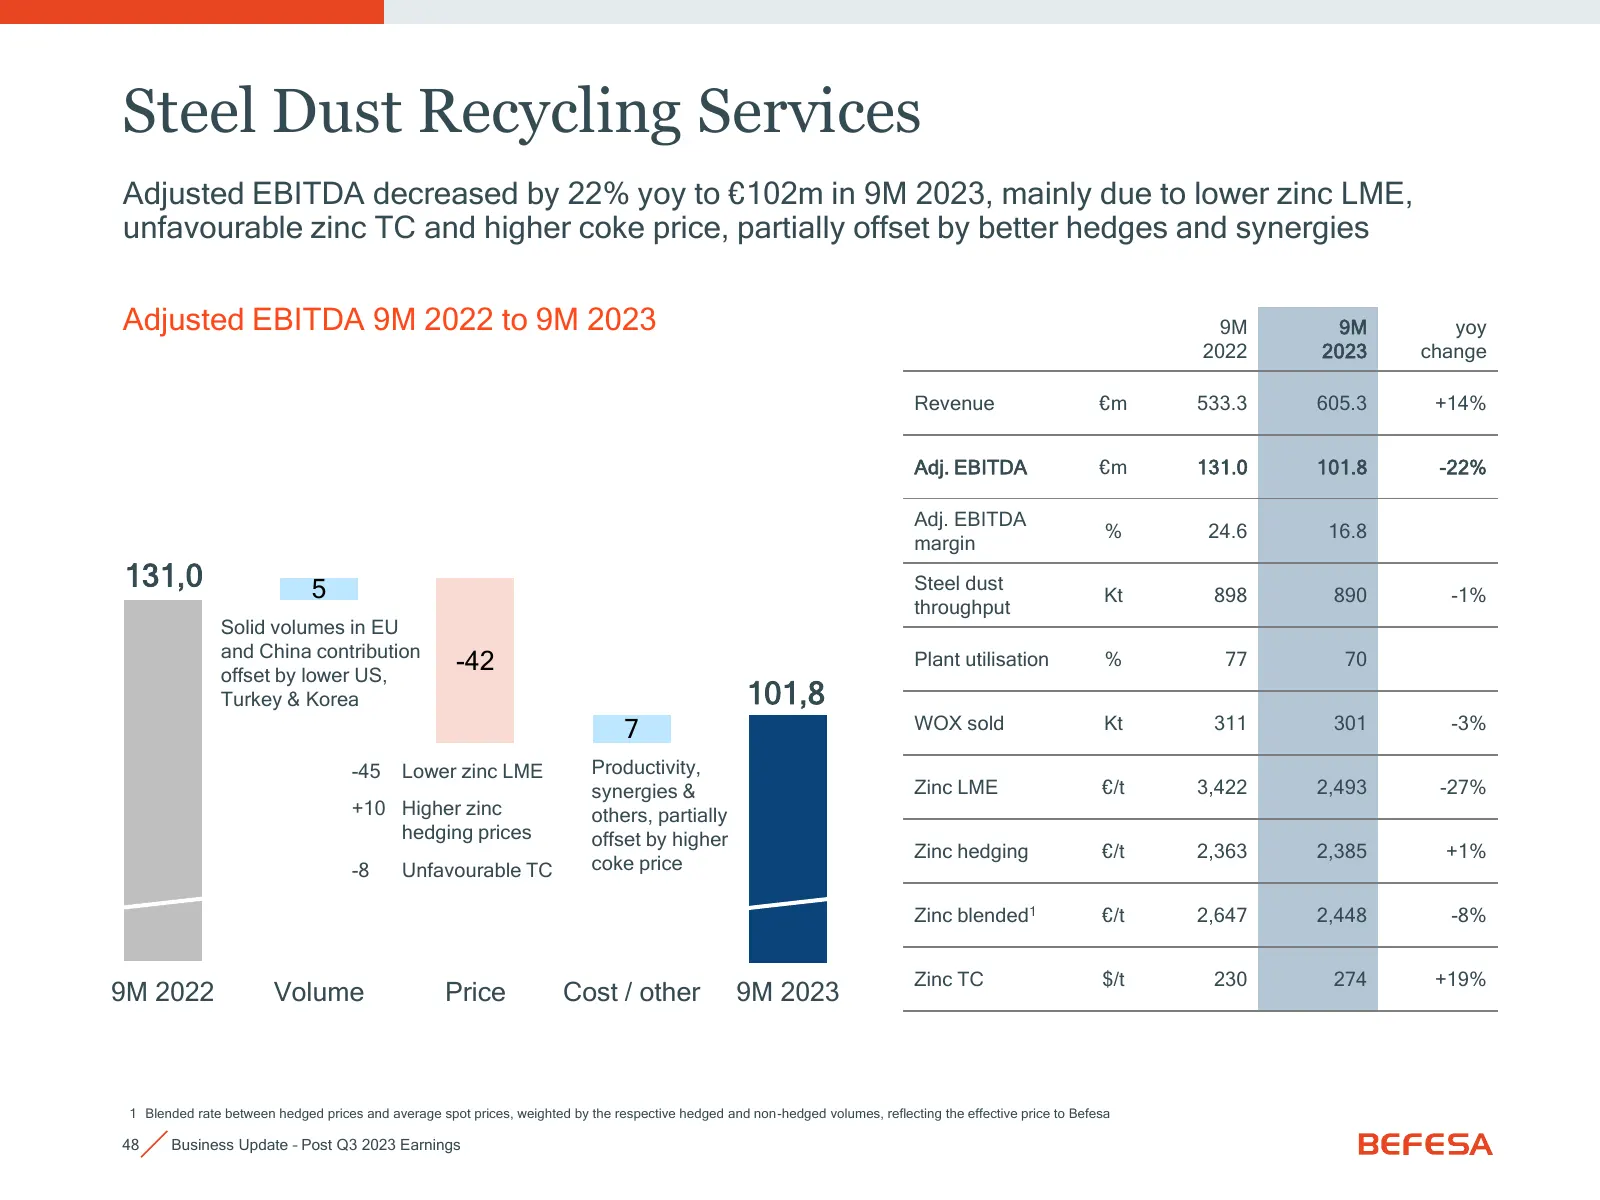
Slide 48: Steel Dust Recycling Services
Steel Dust Recycling Services Adjusted EBITDA decreased by 22% yoy to €102m in 9M 2023, mainly due to lower zinc LME, unfavourable zinc TC and higher coke price, partially offset by better hedges and synergies Adjusted EBITDA 9M 2022 to 9M 2023 9M 9M yoy 2022 2023 change Revenue €m 533.3 605.3 +14%
Slide 49: Aluminium Salt Slags Recycling Services
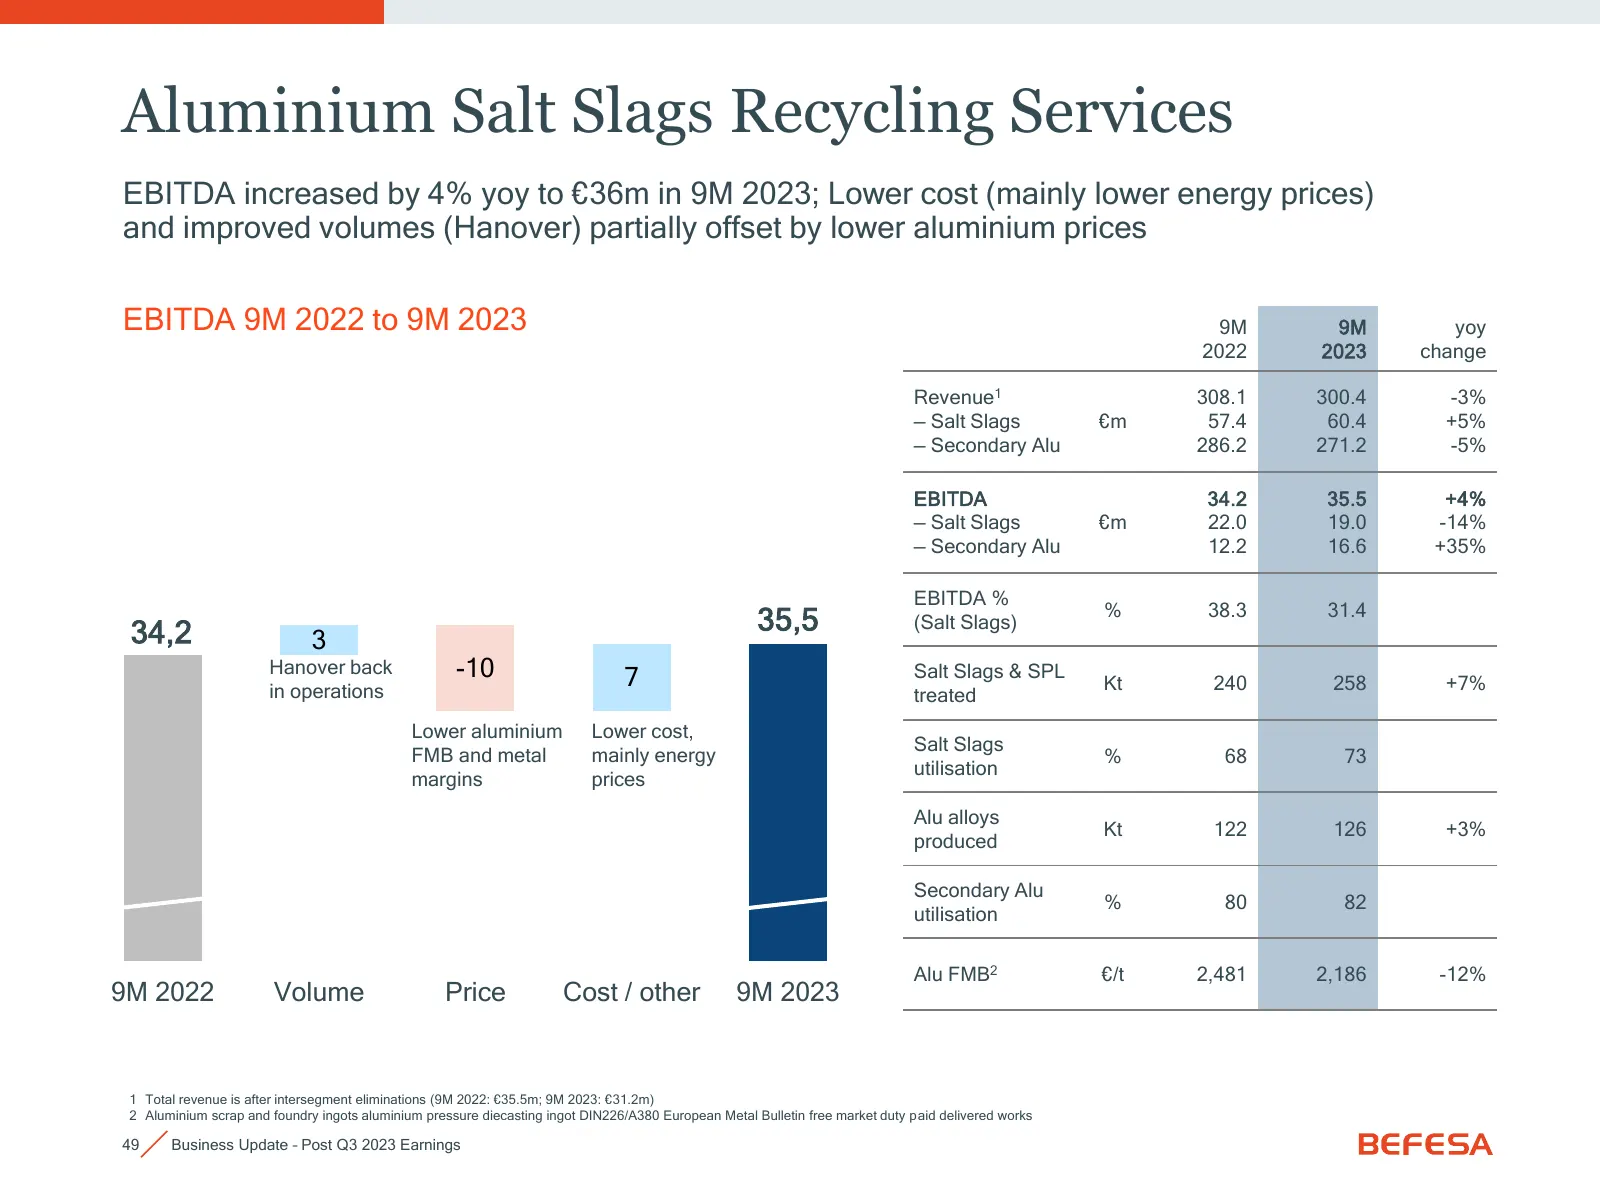
Aluminium Salt Slags Recycling Services EBITDA increased by 4% yoy to €36m in 9M 2023; Lower cost (mainly lower energy prices) and improved volumes (Hanover) partially offset by lower aluminium prices EBITDA 9M 2022 to 9M 2023 9M 9M yoy 2022 2023 change Revenue1 308.1 300.4 -3% — Salt Slags €m 57.4
Slide 50: Cash flow, net debt & leverage
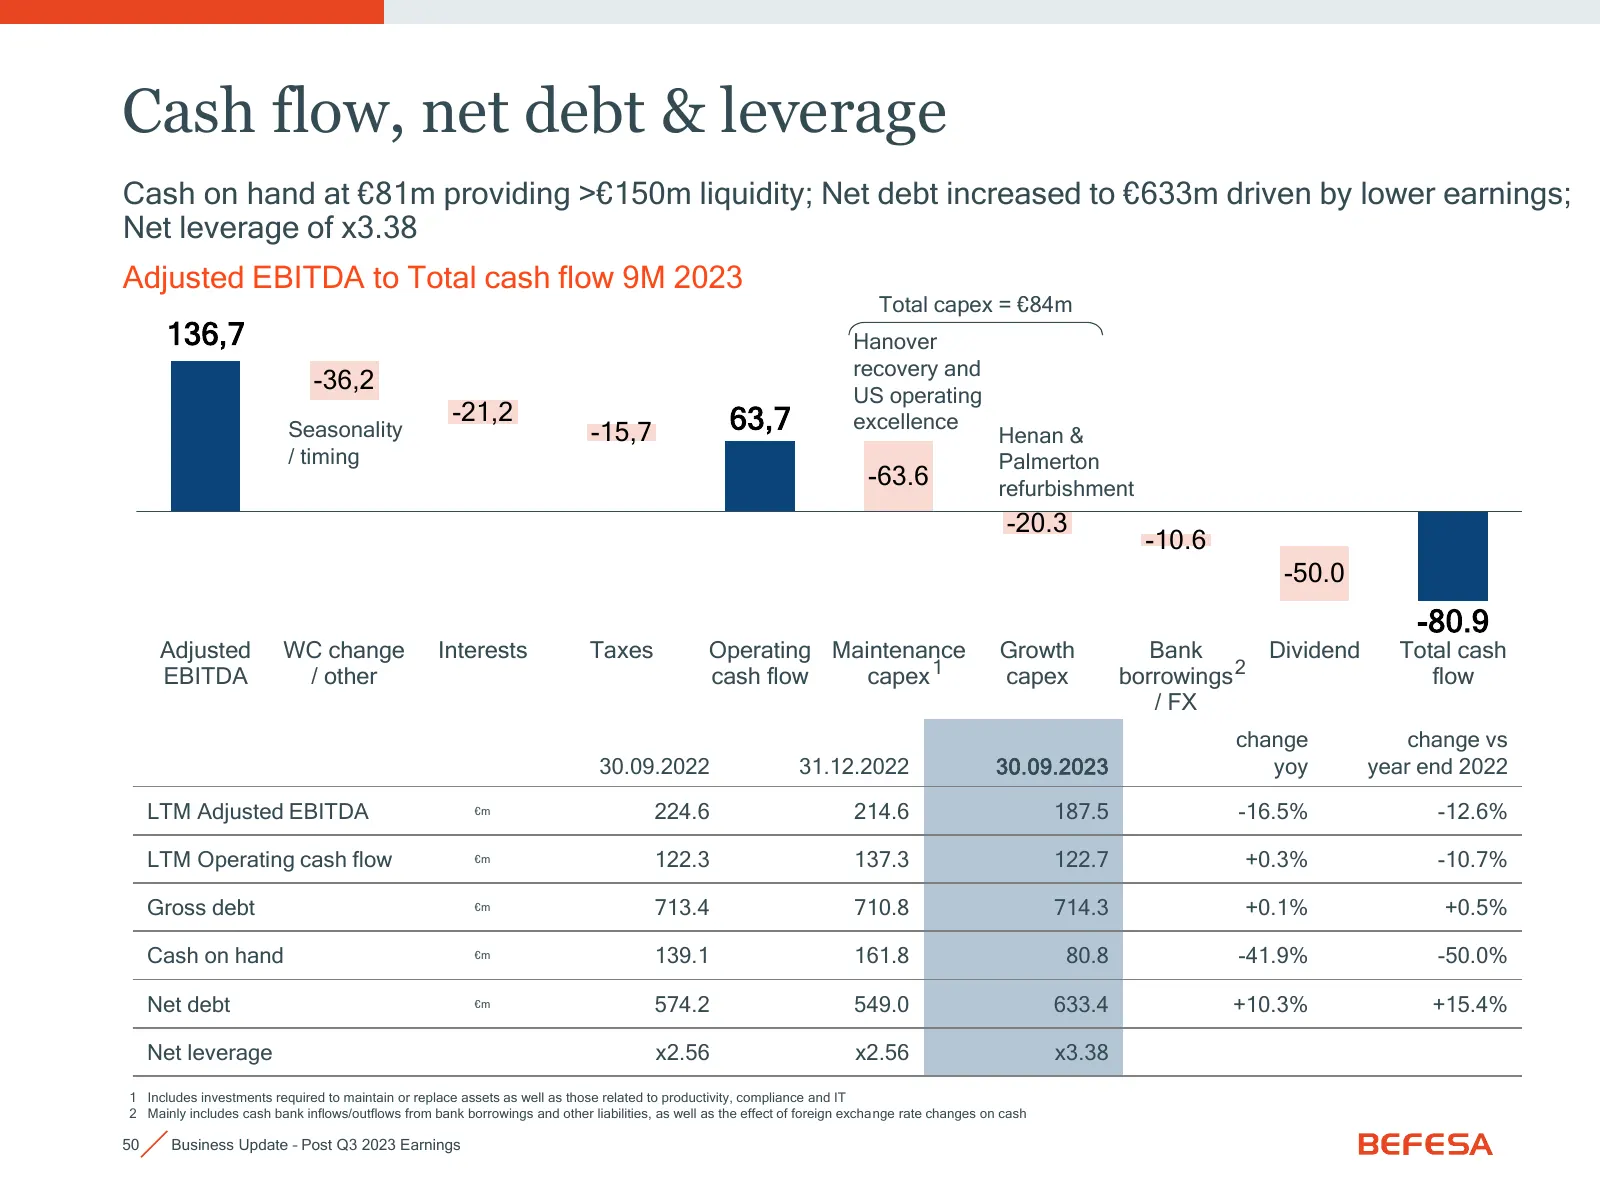
Cash flow, net debt & leverage Cash on hand at €81m providing >€150m liquidity; Net debt increased to €633m driven by lower earnings; Net leverage of x3.38 Adjusted EBITDA to Total cash flow 9M 2023 Total capex = €84m 136,7 Hanover recovery and -36,2 US operating -21,2 63,7 excellence Seasonality -1
Slide 51: Befesa overview
04 Befesa overview
Slide 52: Environmental services for the Steel & Alu industries
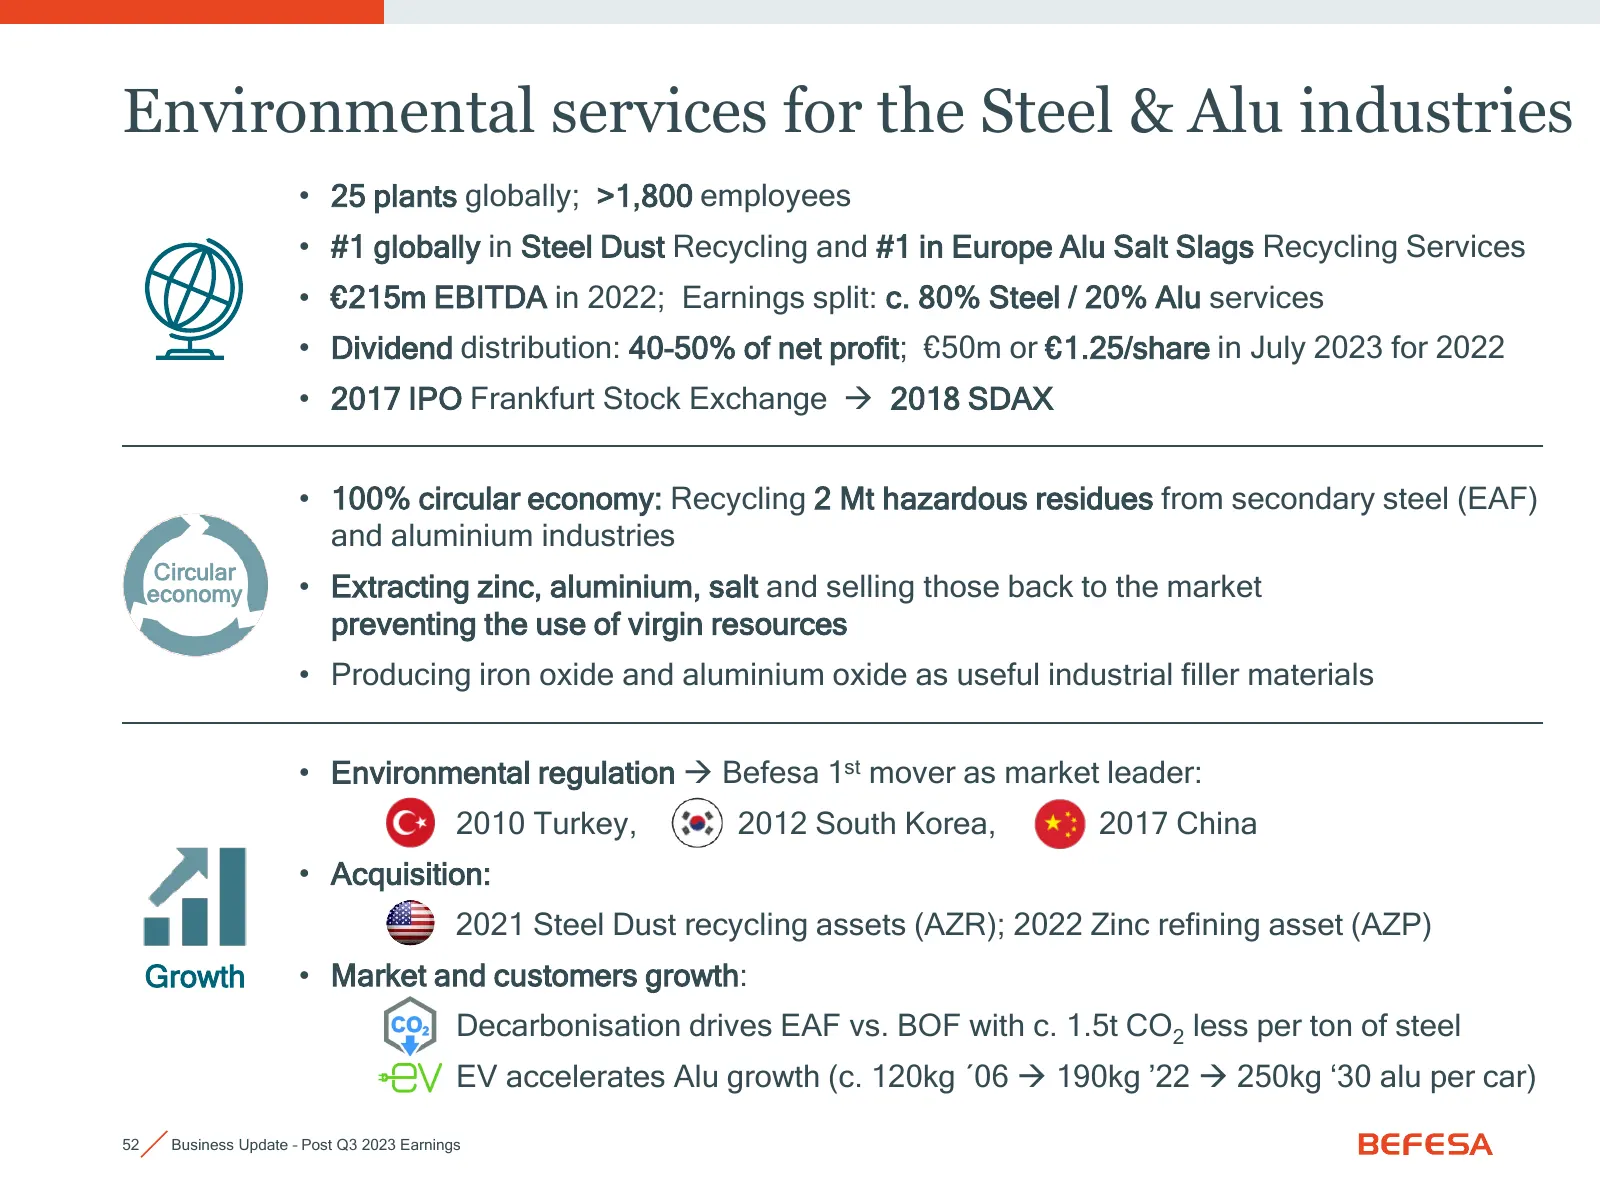
Environmental services for the Steel & Alu industries • 25 plants globally; >1,800 employees • #1 globally in Steel Dust Recycling and #1 in Europe Alu Salt Slags Recycling Services • €215m EBITDA in 2022; Earnings split: c. 80% Steel / 20% Alu services • Dividend distribution: 40-50% of net profit;
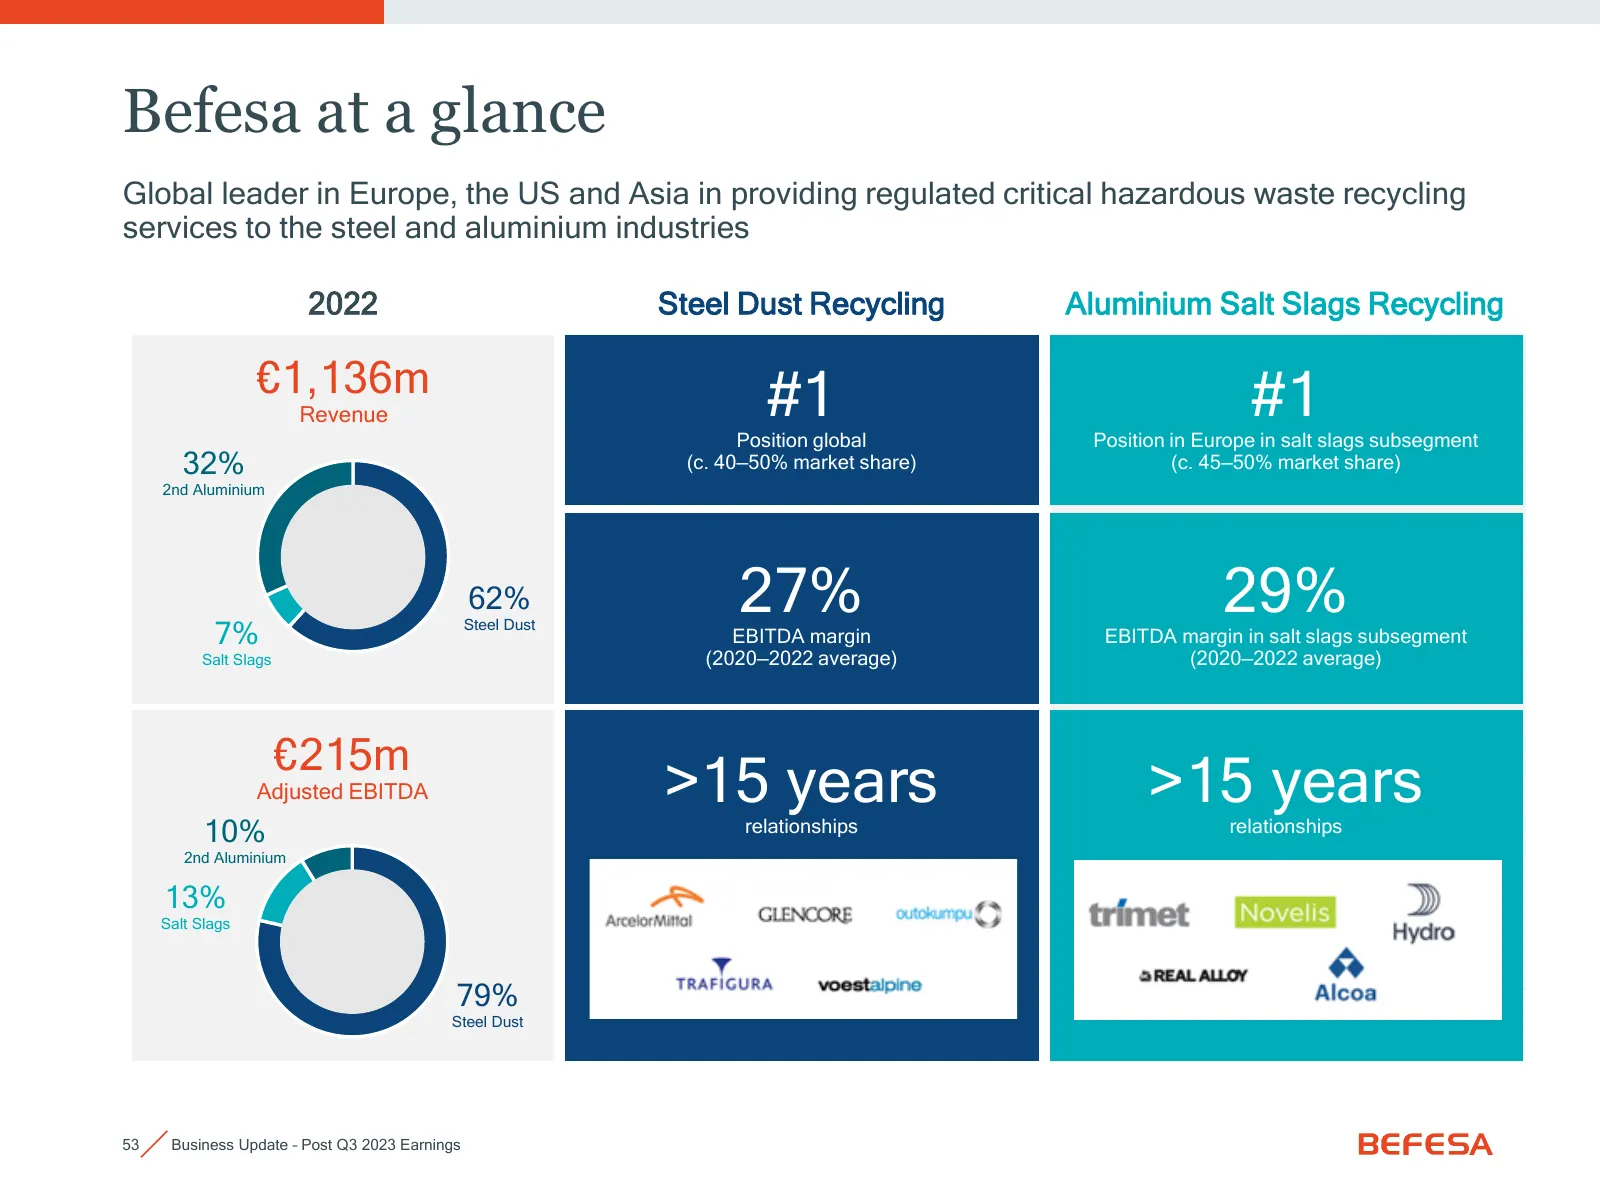
Slide 53: Befesa at a glance
Befesa at a glance Global leader in Europe, the US and Asia in providing regulated critical hazardous waste recycling services to the steel and aluminium industries 2022 Steel Dust Recycling Aluminium Salt Slags Recycling €1,136m Revenue #1 Position global #1 Position in Europe in salt slags subsegm
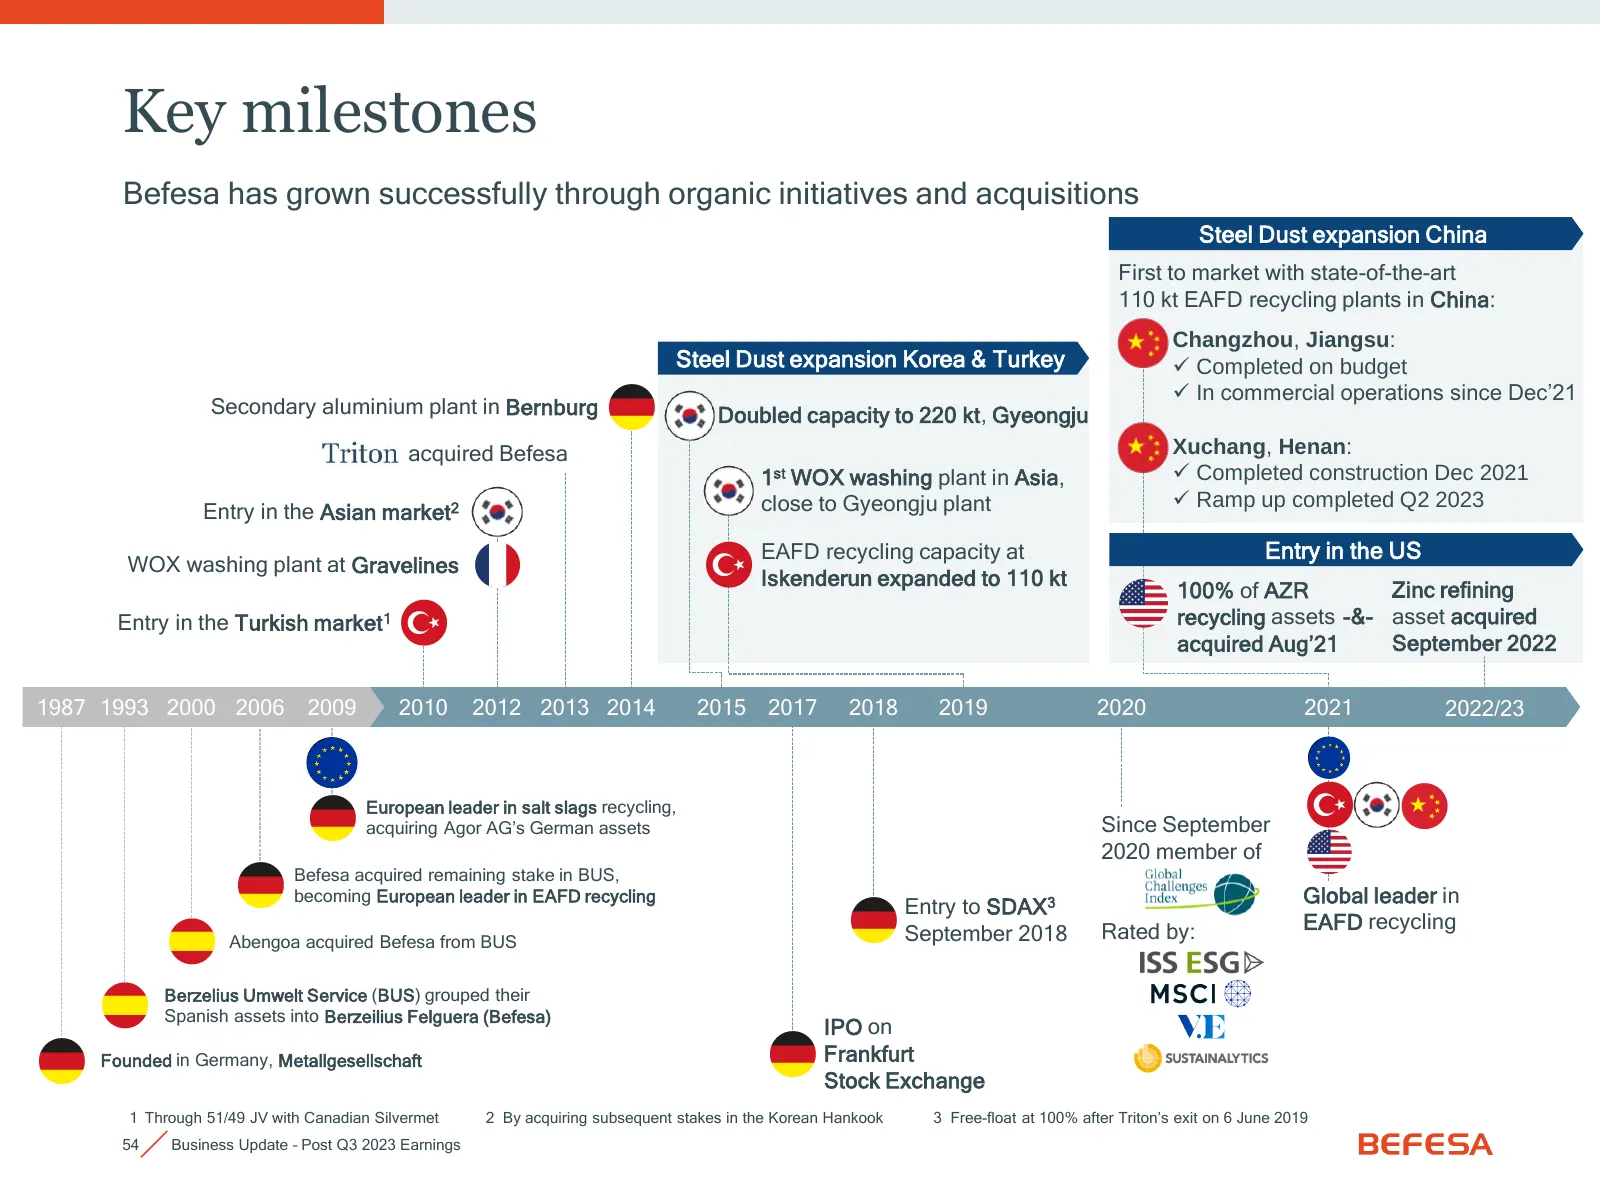
Slide 54: Key milestones
Key milestones Befesa has grown successfully through organic initiatives and acquisitions Steel Dust expansion China First to market with state-of-the-art 110 kt EAFD recycling plants in China: Changzhou, Jiangsu: Steel Dust expansion Korea & Turkey ✓ Completed on budget ✓ In commercial operations s
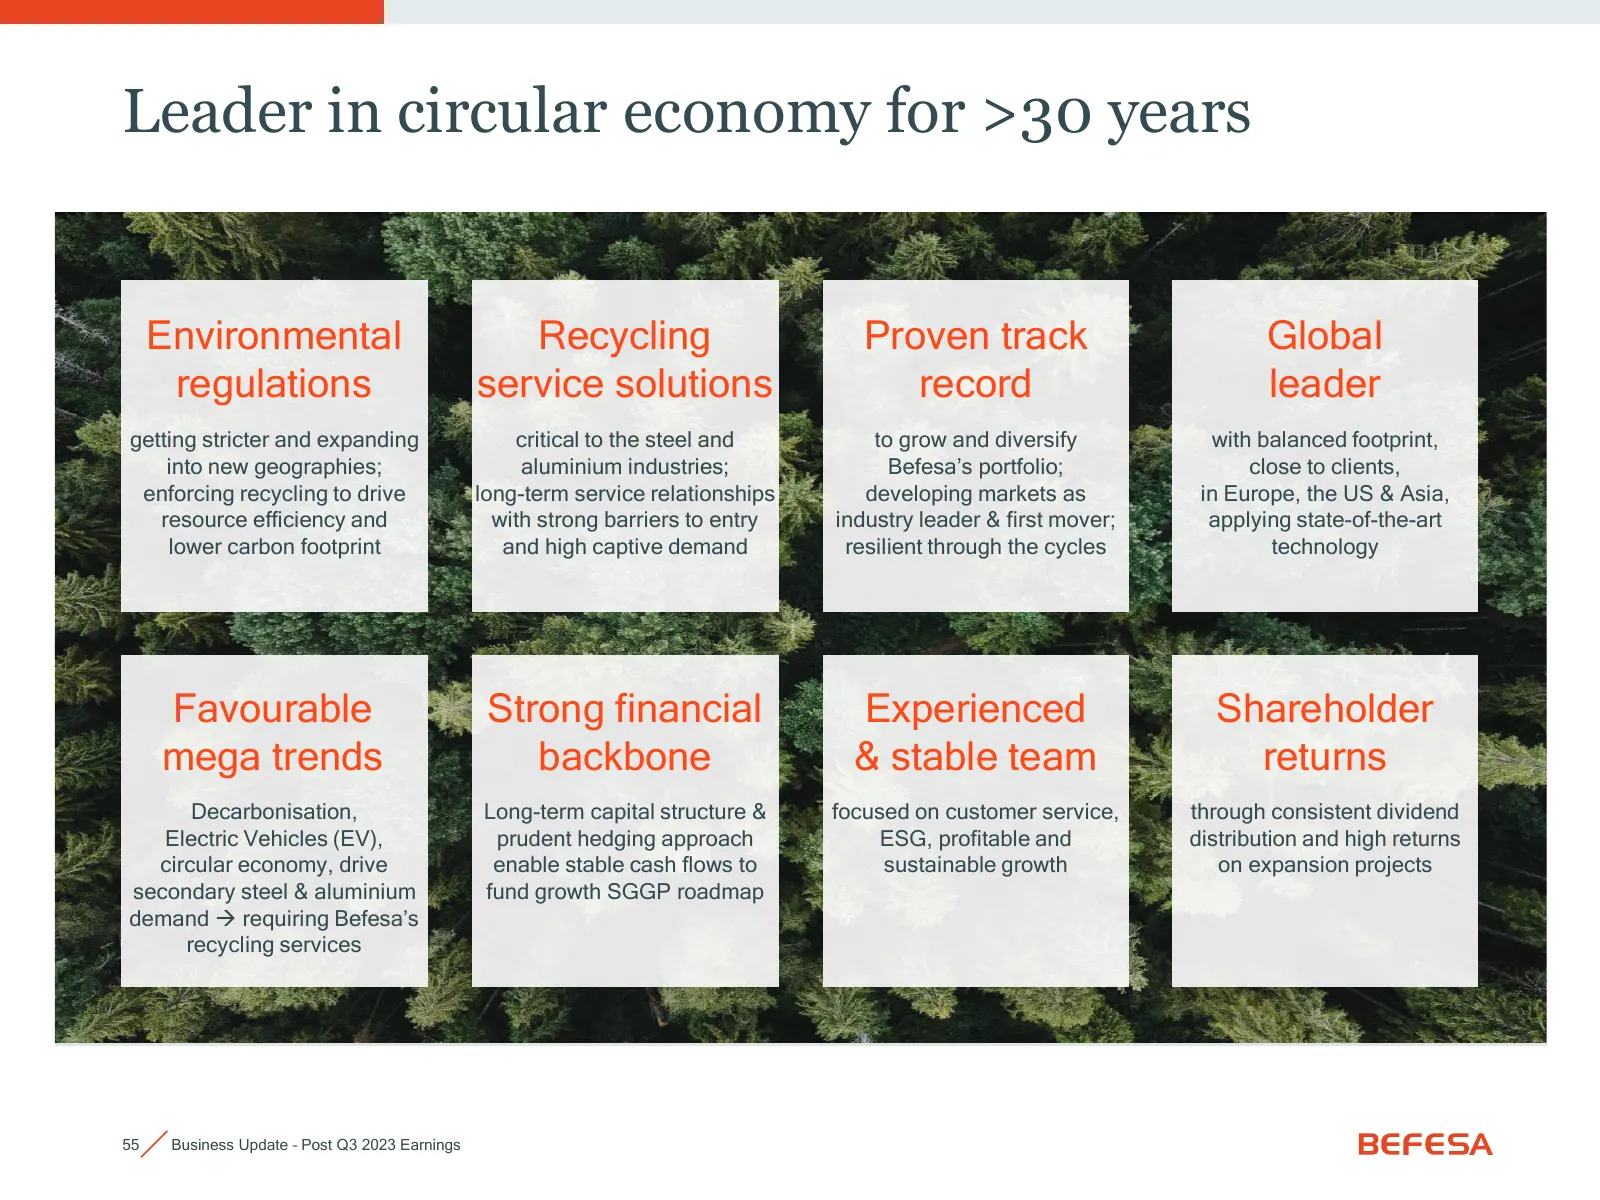
Slide 55: Leader in circular economy for >30 years
Leader in circular economy for >30 years Environmental Recycling Proven track Global regulations service solutions record leader getting stricter and expanding critical to the steel and to grow and diversify with balanced footprint, into new geographies; aluminium industries; Befesa’s portfolio; clo
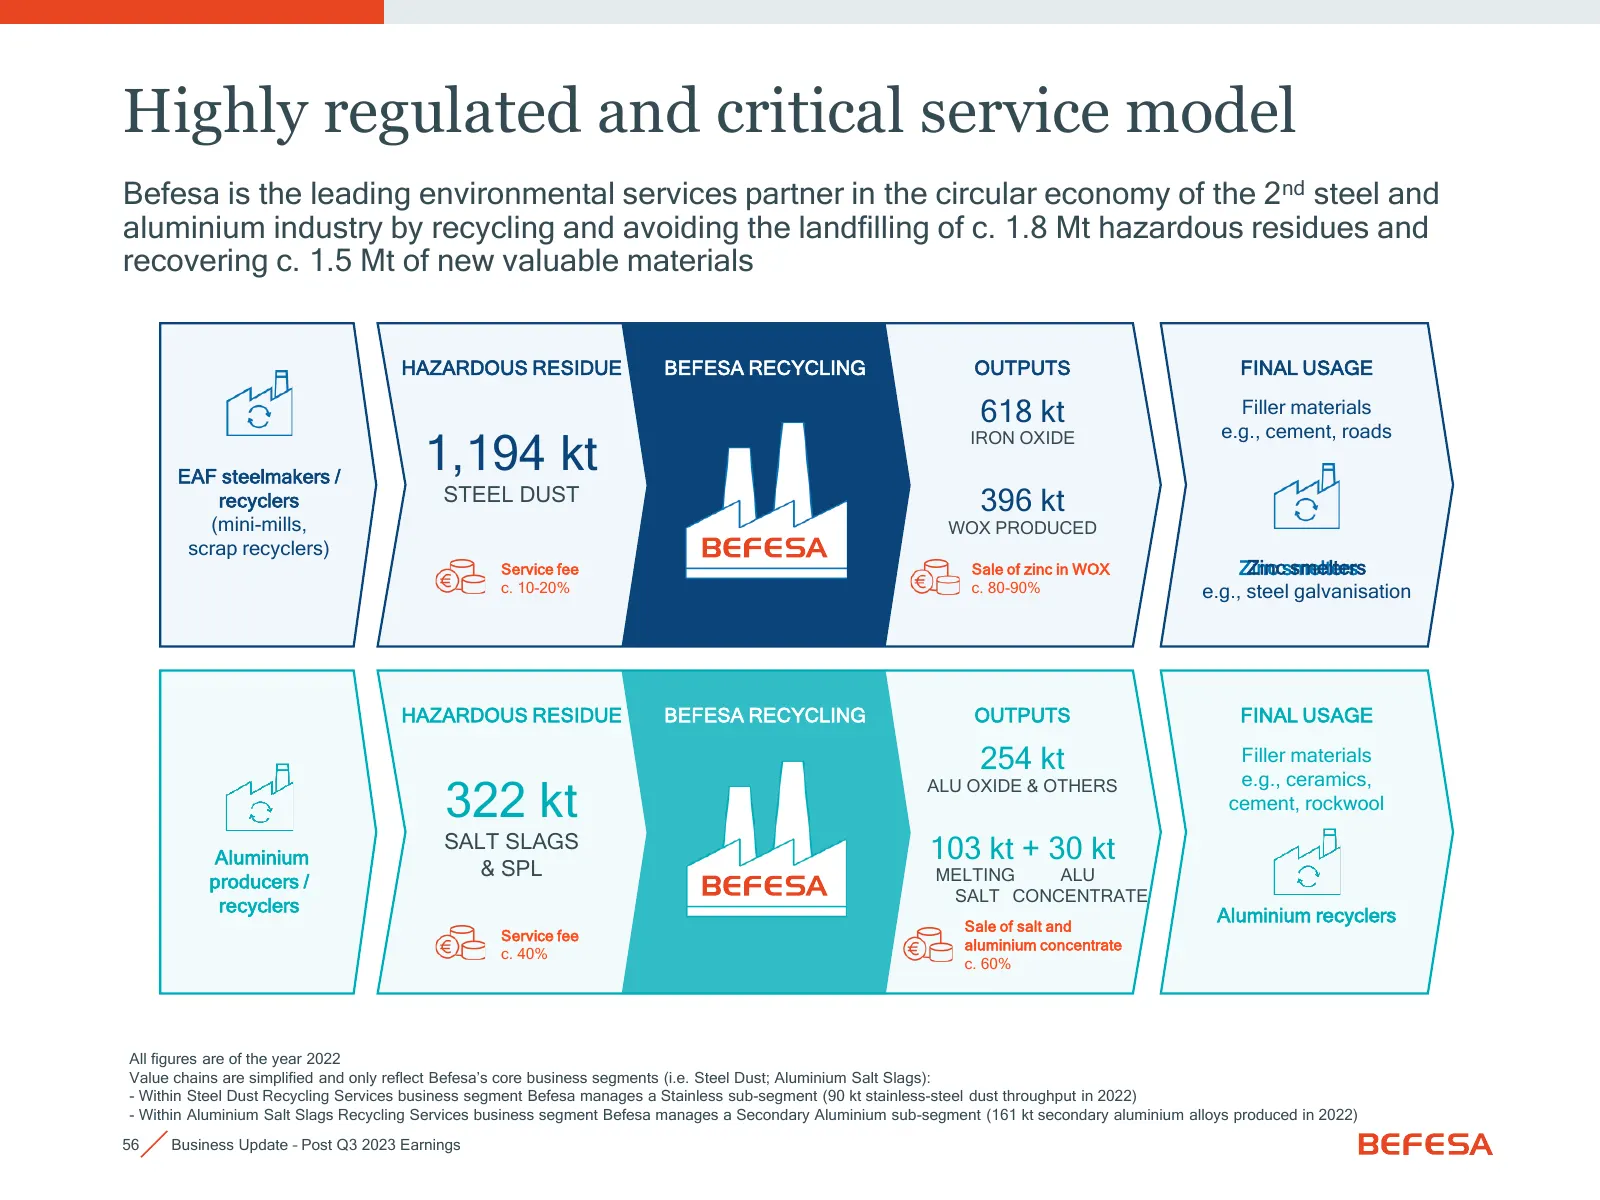
Slide 56: Highly regulated and critical service model
Highly regulated and critical service model Befesa is the leading environmental services partner in the circular economy of the 2nd steel and aluminium industry by recycling and avoiding the landfilling of c. 1.8 Mt hazardous residues and recovering c. 1.5 Mt of new valuable materials HAZARDOUS RESI
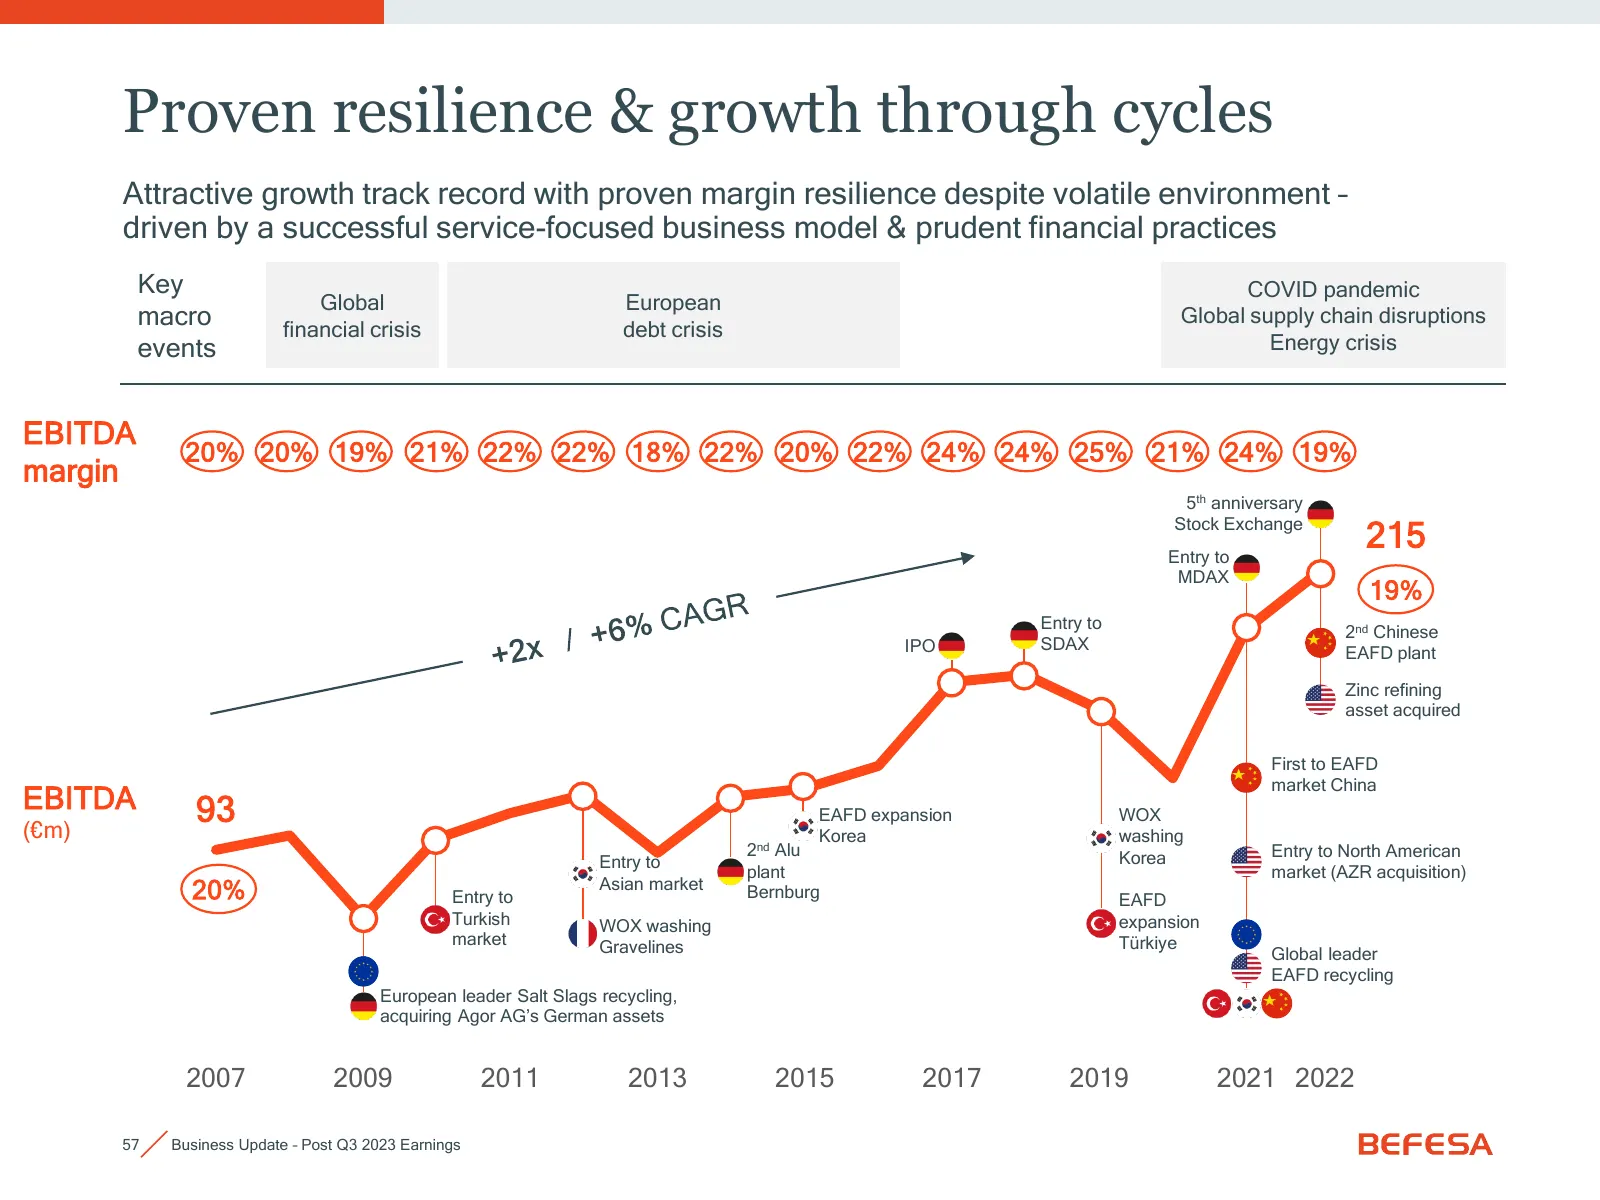
Slide 57: Proven resilience & growth through cycles
Proven resilience & growth through cycles Attractive growth track record with proven margin resilience despite volatile environment – driven by a successful service-focused business model & prudent financial practices Key COVID pandemic Global European macro financial crisis debt crisis Global suppl
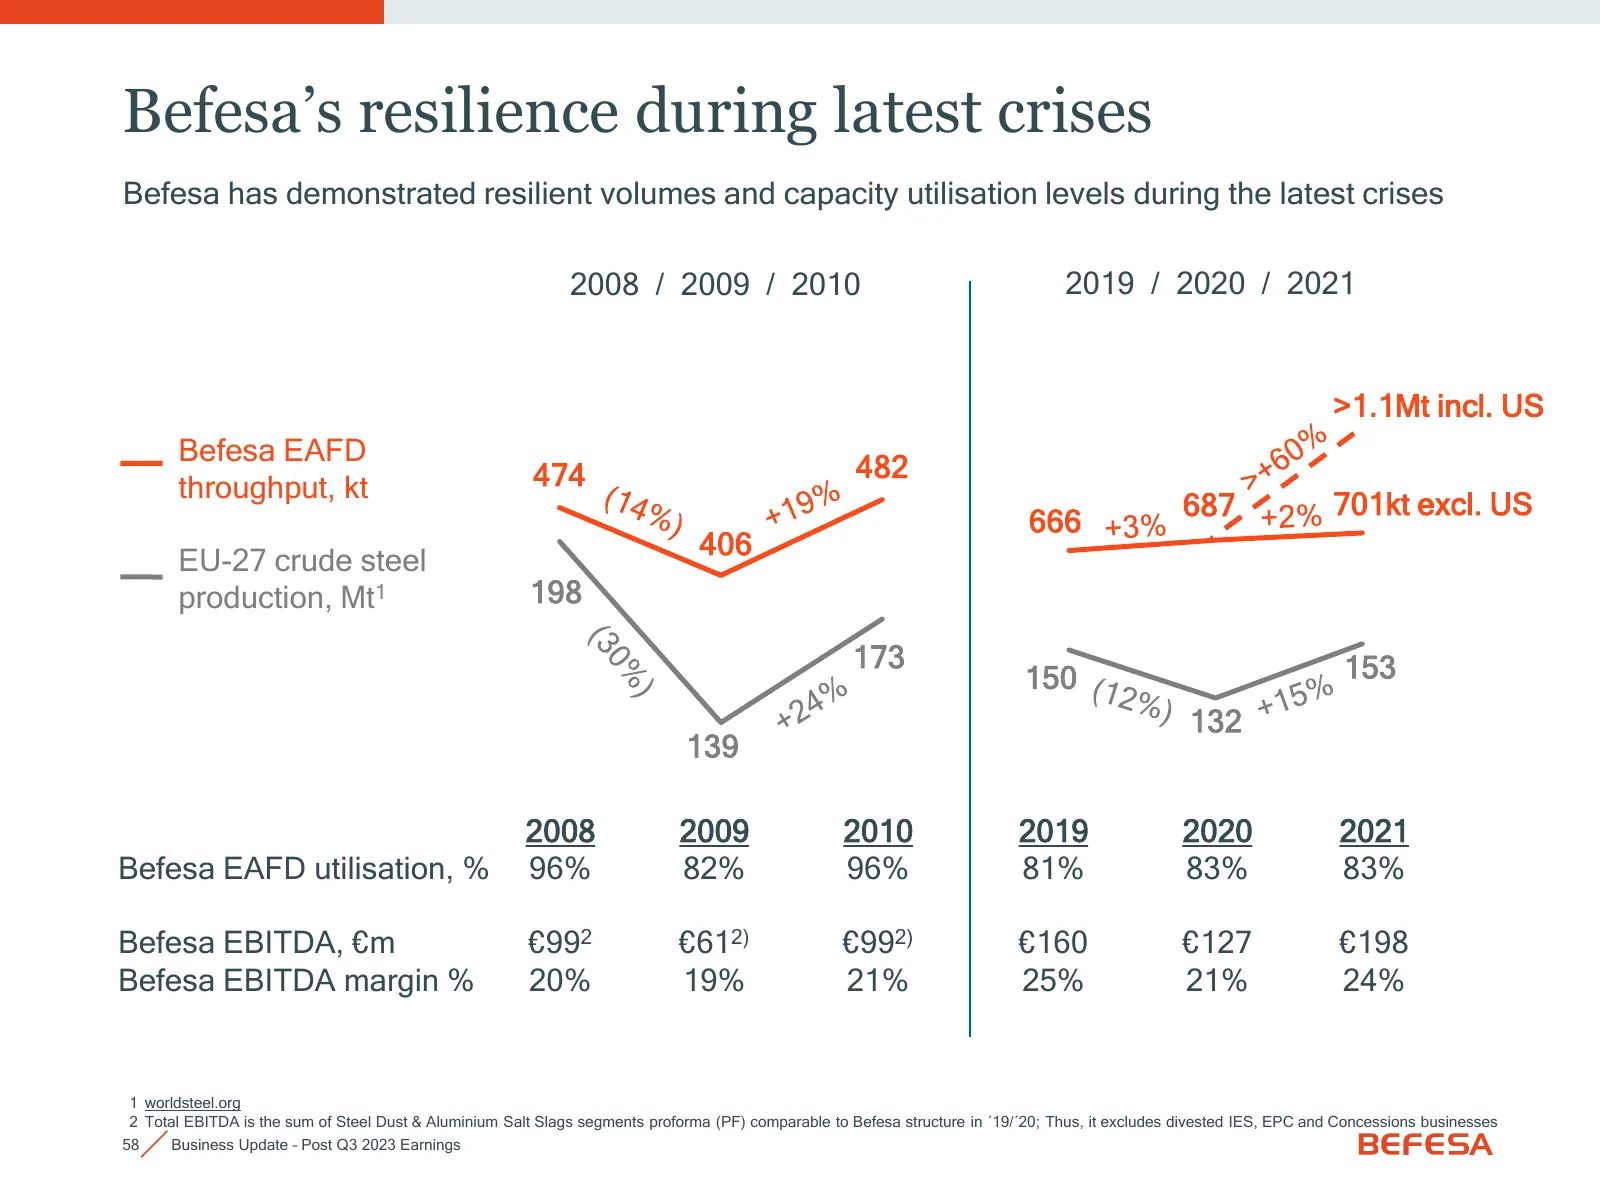
Slide 58: Befesa's resilience during latest crises
Befesa’s resilience during latest crises Befesa has demonstrated resilient volumes and capacity utilisation levels during the latest crises 2008 / 2009 / 2010 2019 / 2020 / 2021 600 1000 2019 2020 2021 240 >1.1Mt incl. 240 US 550 900 Befesa EAFD 500 474 482 220 220 throughput, kt 800 687 701kt excl.
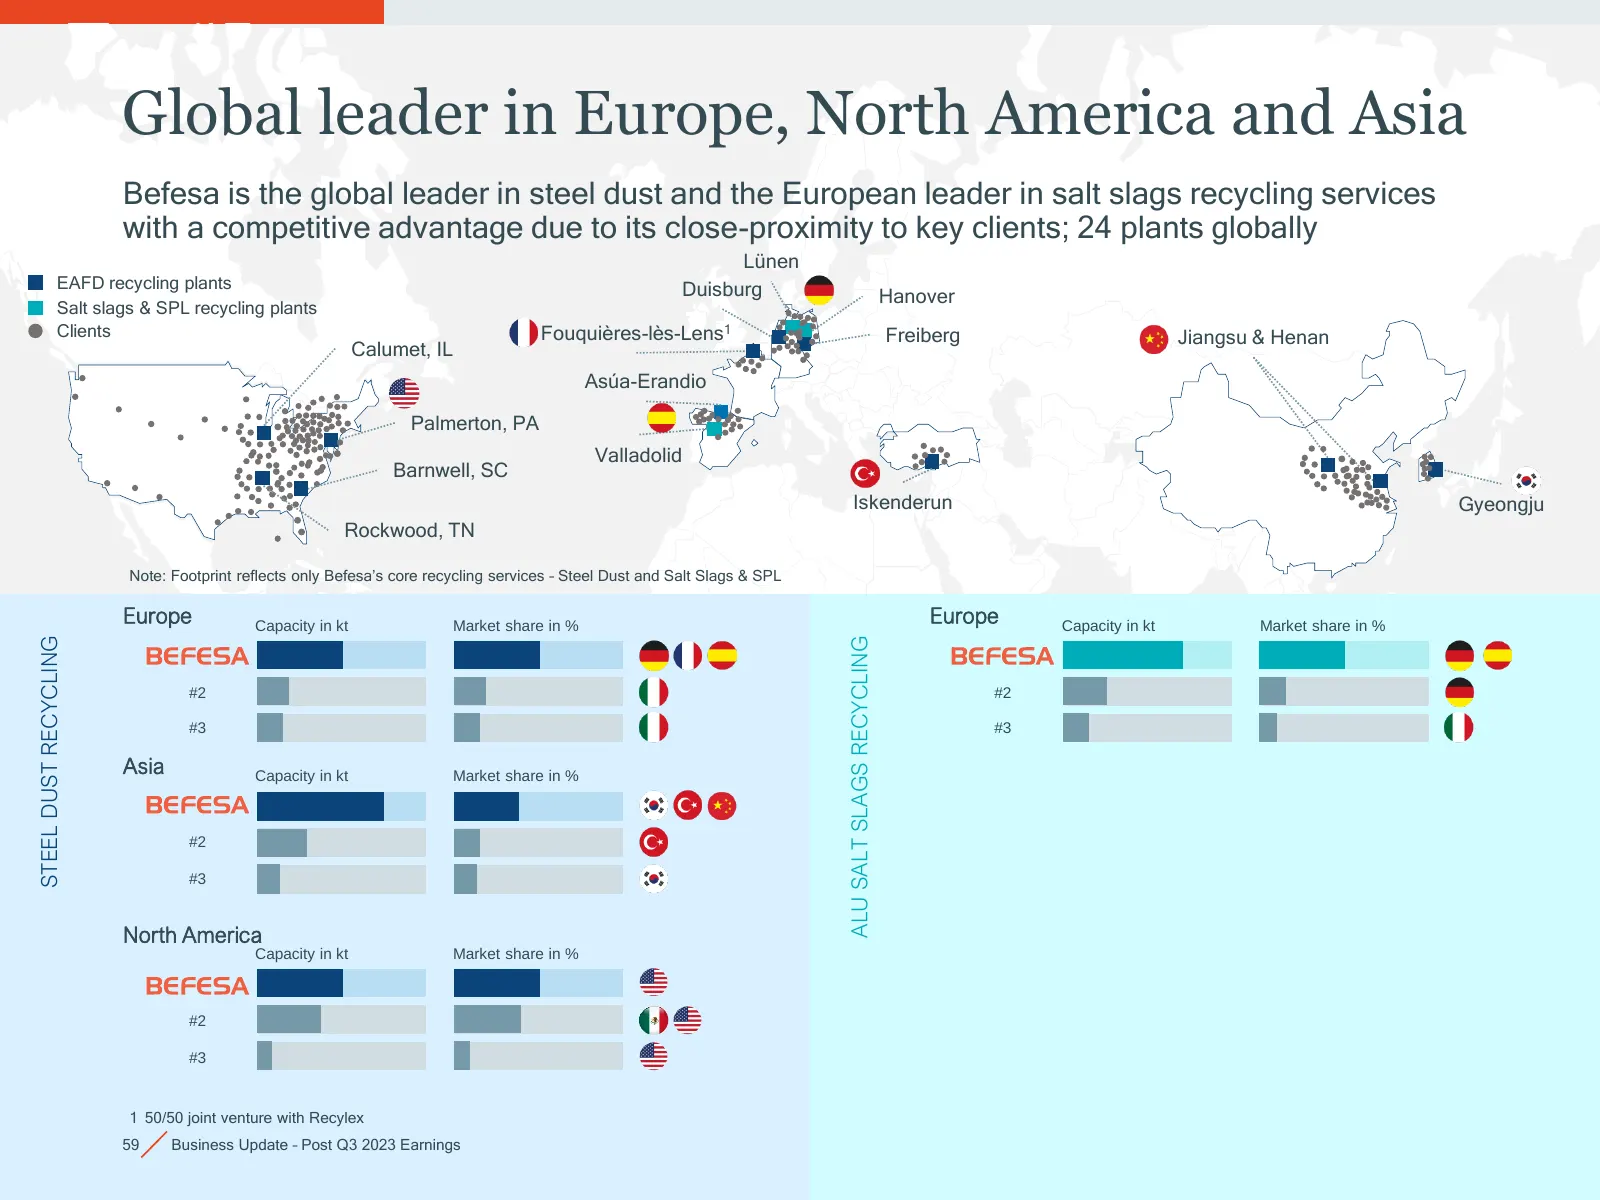
Slide 59: Global leader in Europe, North America and Asia
Global leader in Europe, North America and Asia Befesa is the global leader in steel dust and the European leader in salt slags recycling services with a competitive advantage due to its close-proximity to key clients; 24 plants globally Lünen EAFD recycling plants Duisburg Hanover Salt slags & SPL
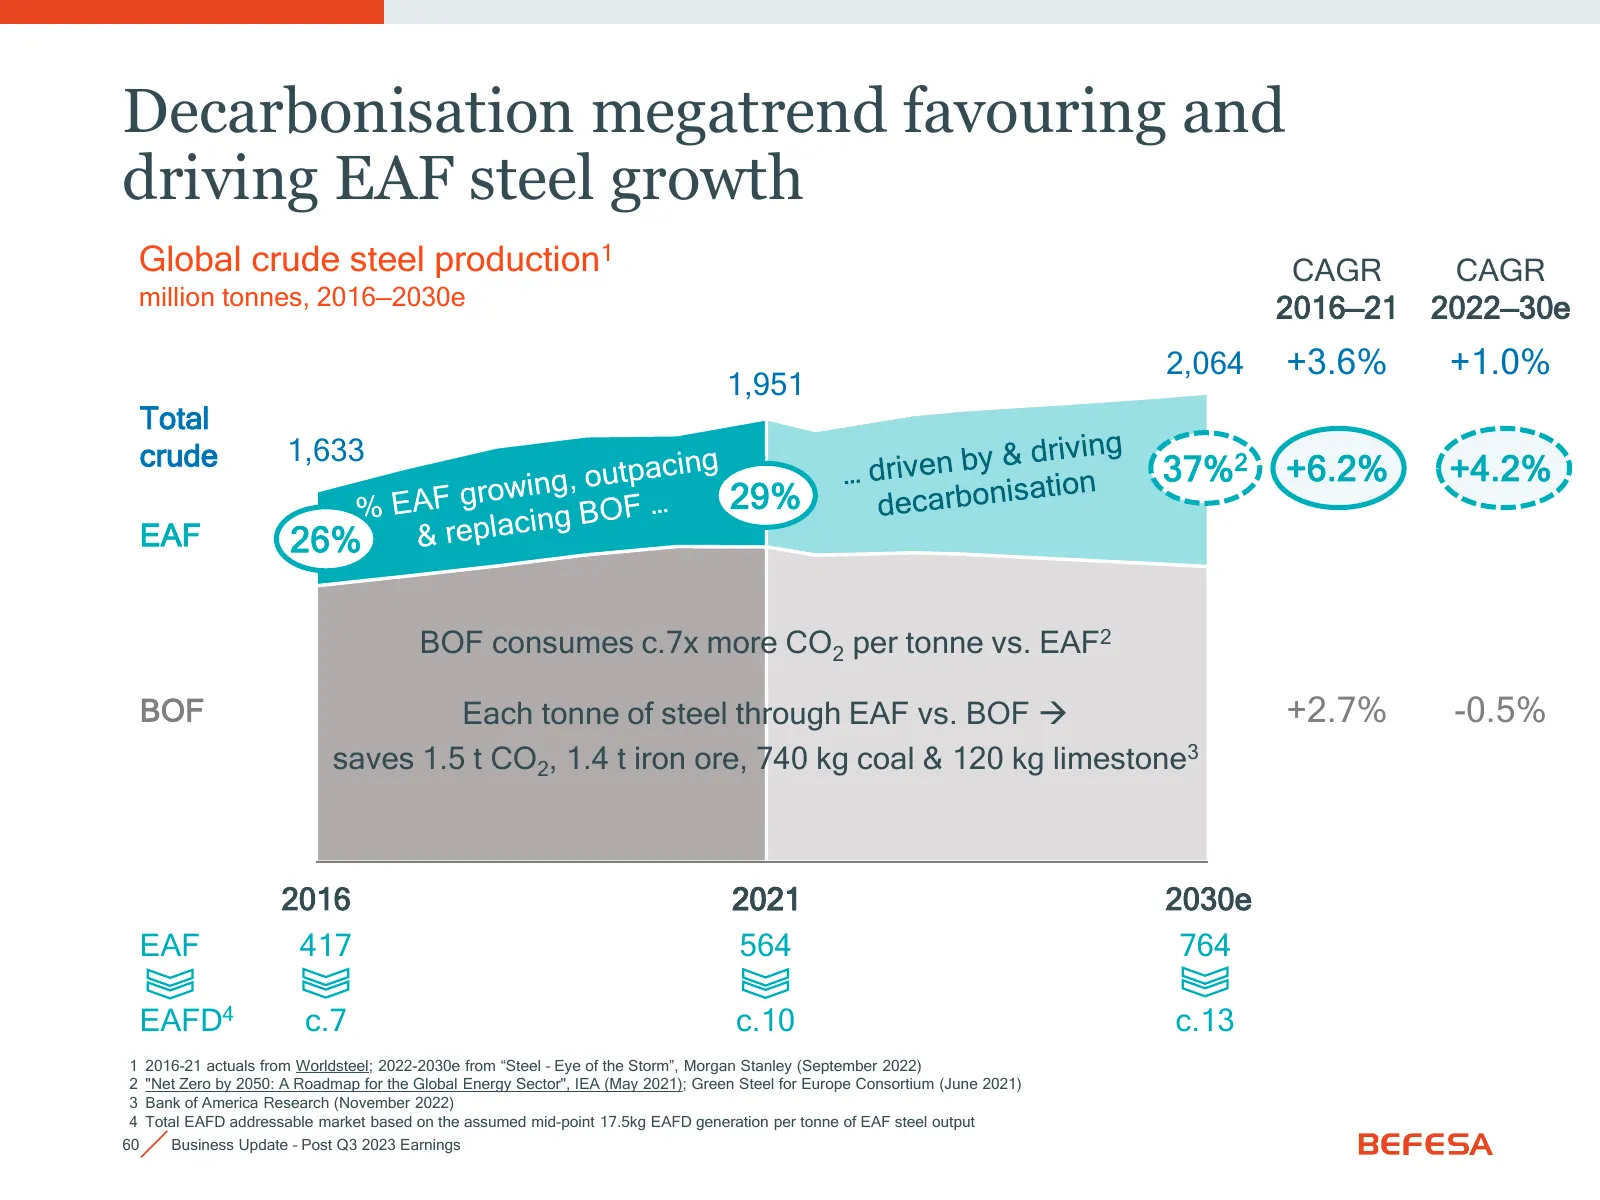
Slide 60: Decarbonisation megatrend favouring EAF steel growth
Decarbonisation megatrend favouring and driving EAF steel growth Global crude steel production1 CAGR CAGR million tonnes, 2016—2030e 2016—21 2022—30e 2,064 +3.6% +1.0% 1,951 Total crude 1,633 564 37%2 +6.2% +4.2% 29% EAF 26% BOF consumes c.7x more CO2 per tonne vs. EAF2 BOF Each tonne of steel throu
Slide 61: Zinc global production grew at 1.4% CAGR over 15 years
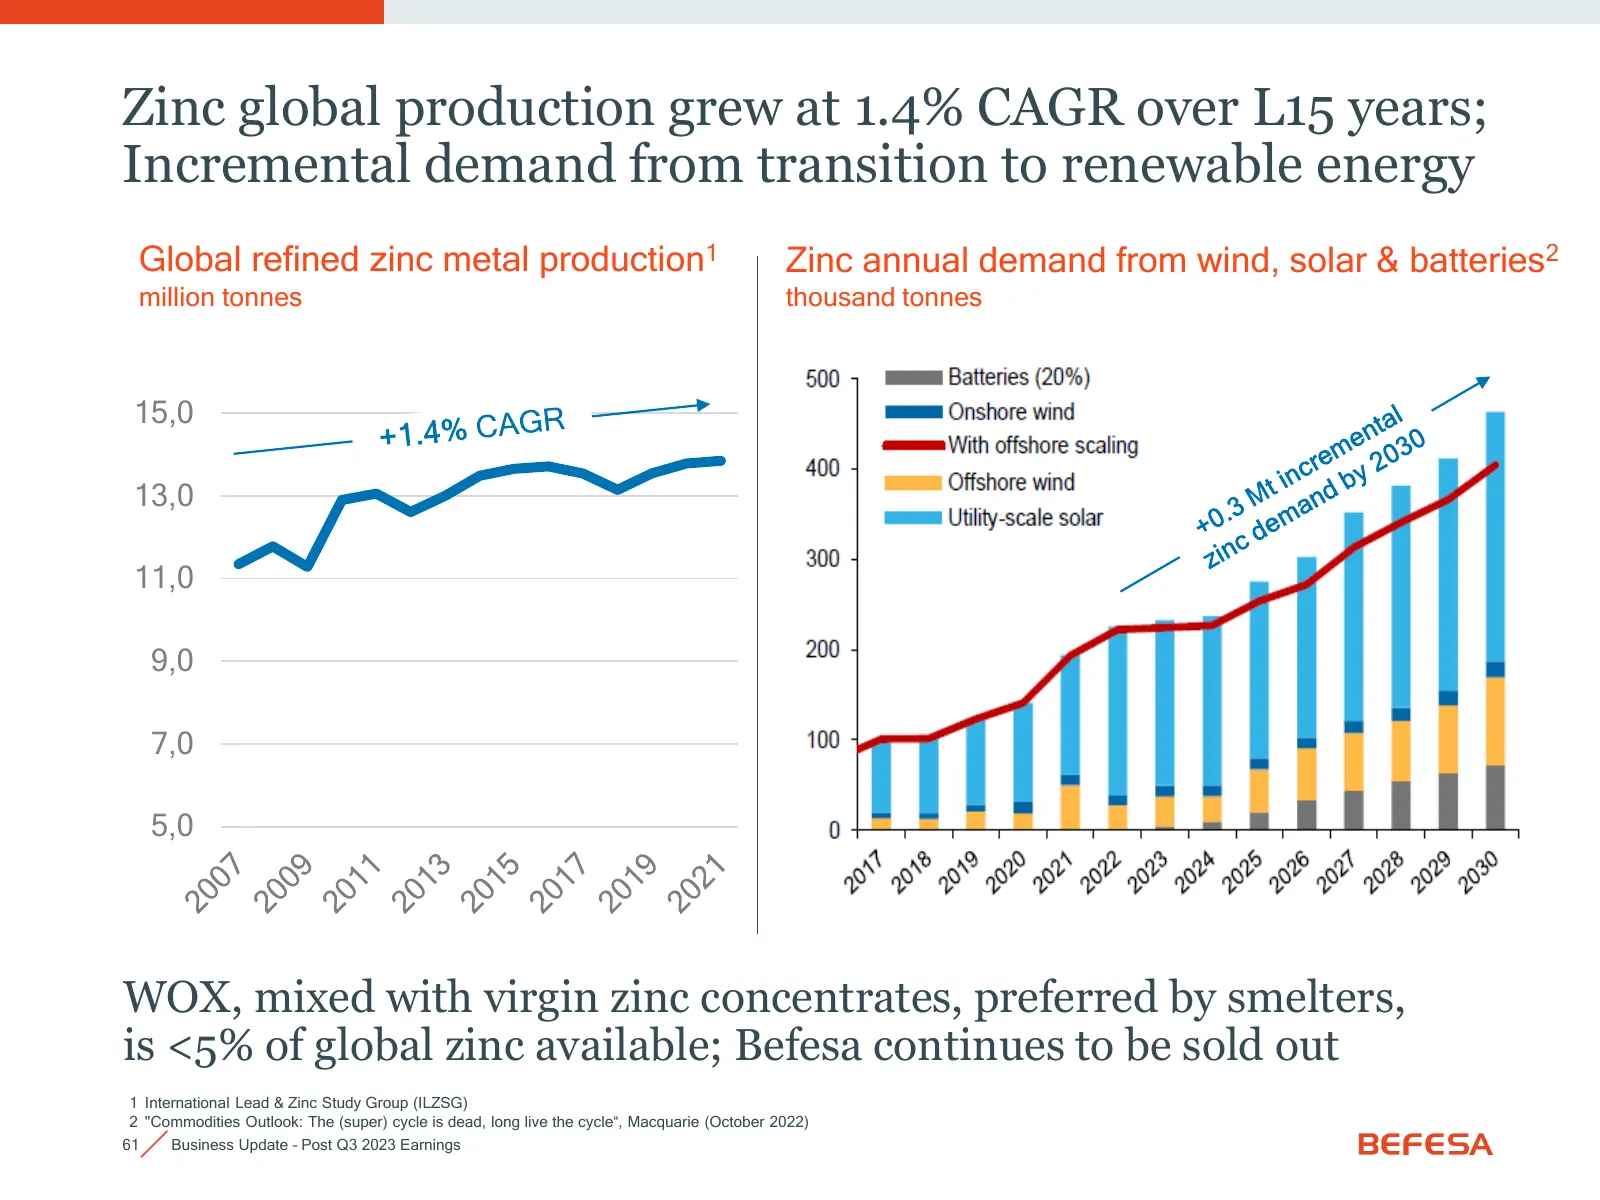
Zinc global production grew at 1.4% CAGR over L15 years; Incremental demand from transition to renewable energy Global refined zinc metal production1 Zinc annual demand from wind, solar & batteries2 million tonnes thousand tonnes 15,0 13,0 11,0 9,0 7,0 5,0 WOX, mixed with virgin zinc concentrates, p
Slide 62: Decarbonisation and EV driving aluminium market growth in Europe
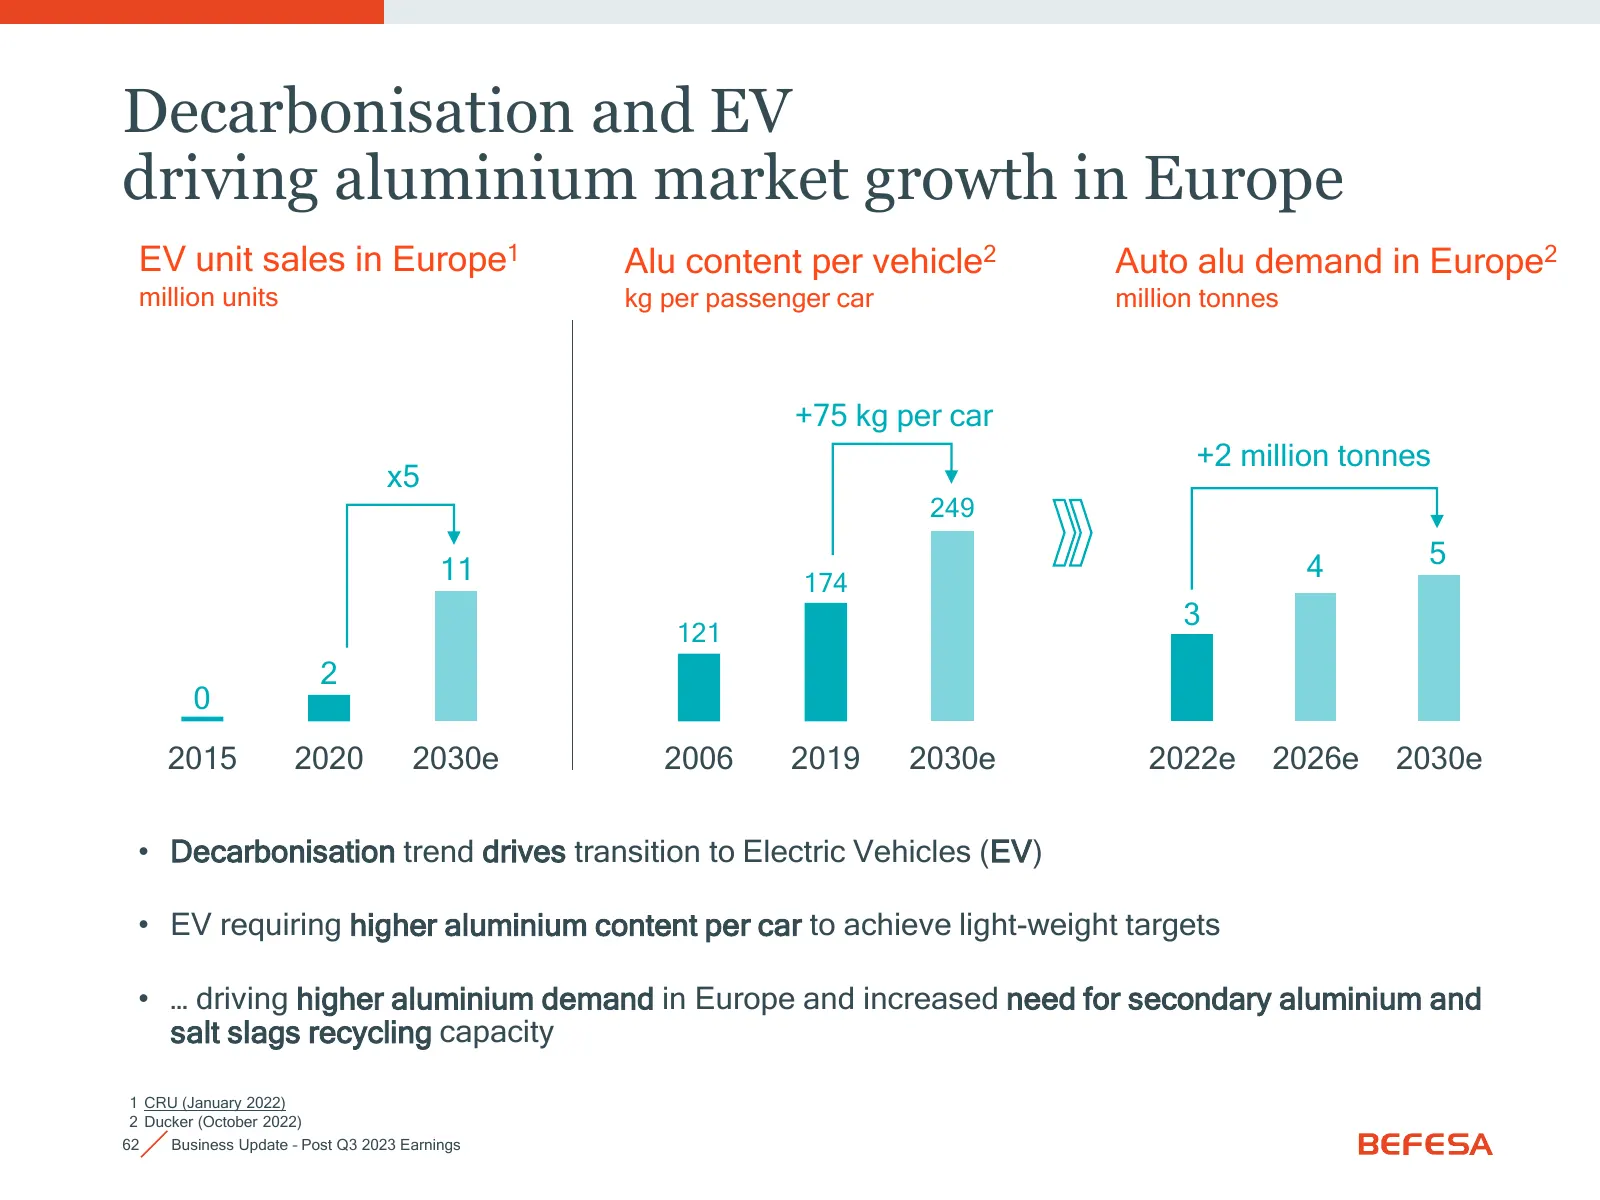
Decarbonisation and EV driving aluminium market growth in Europe EV unit sales in Europe1 Alu content per vehicle2 Auto alu demand in Europe2 million units kg per passenger car million tonnes +75 kg per car +2 million tonnes x5 249 4 5 11 174 3 121 2 0 2015 2020 2030e 2006 2019 2030e 2022e 2026e 203
Slide 63: Strong financial backbone
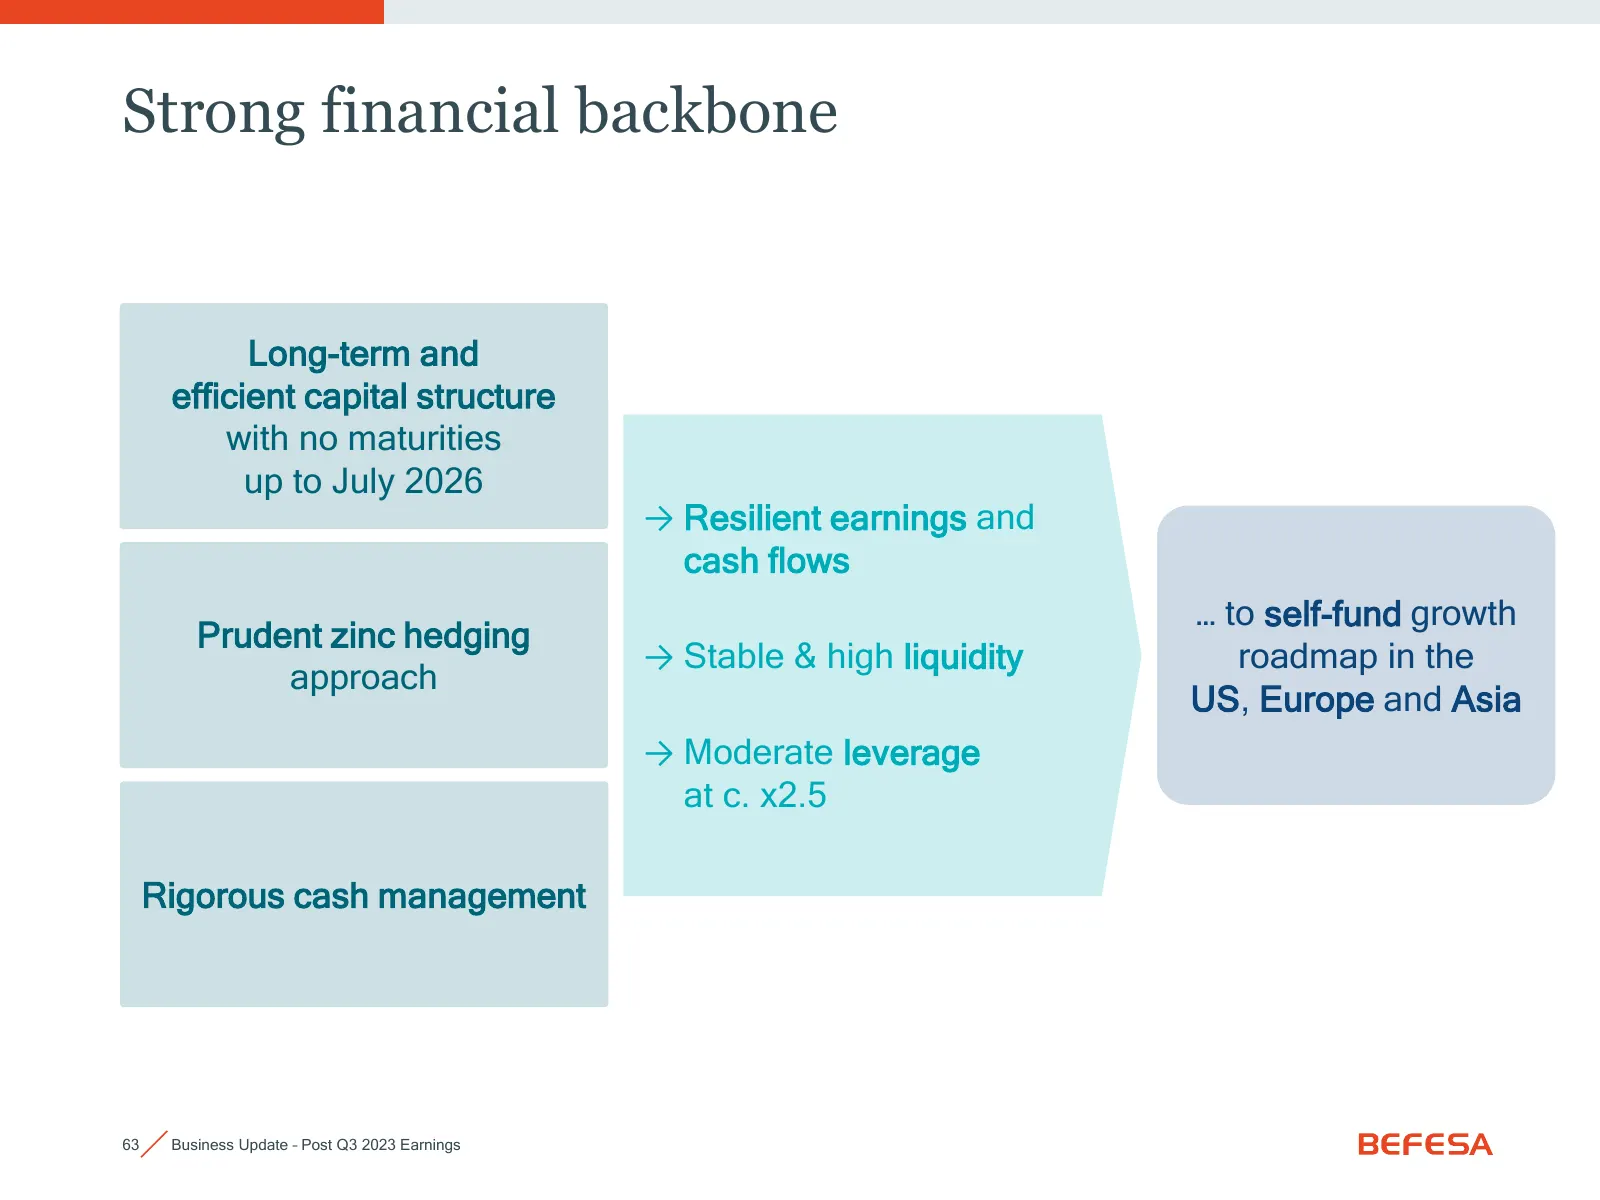
Strong financial backbone Long-term and efficient capital structure with no maturities up to July 2026 → Resilient earnings and cash flows … to self-fund growth Prudent zinc hedging → Stable & high liquidity roadmap in the approach US, Europe and Asia → Moderate leverage at c. x2.5 Rigorous cash man
Slide 64: Experienced and stable management team
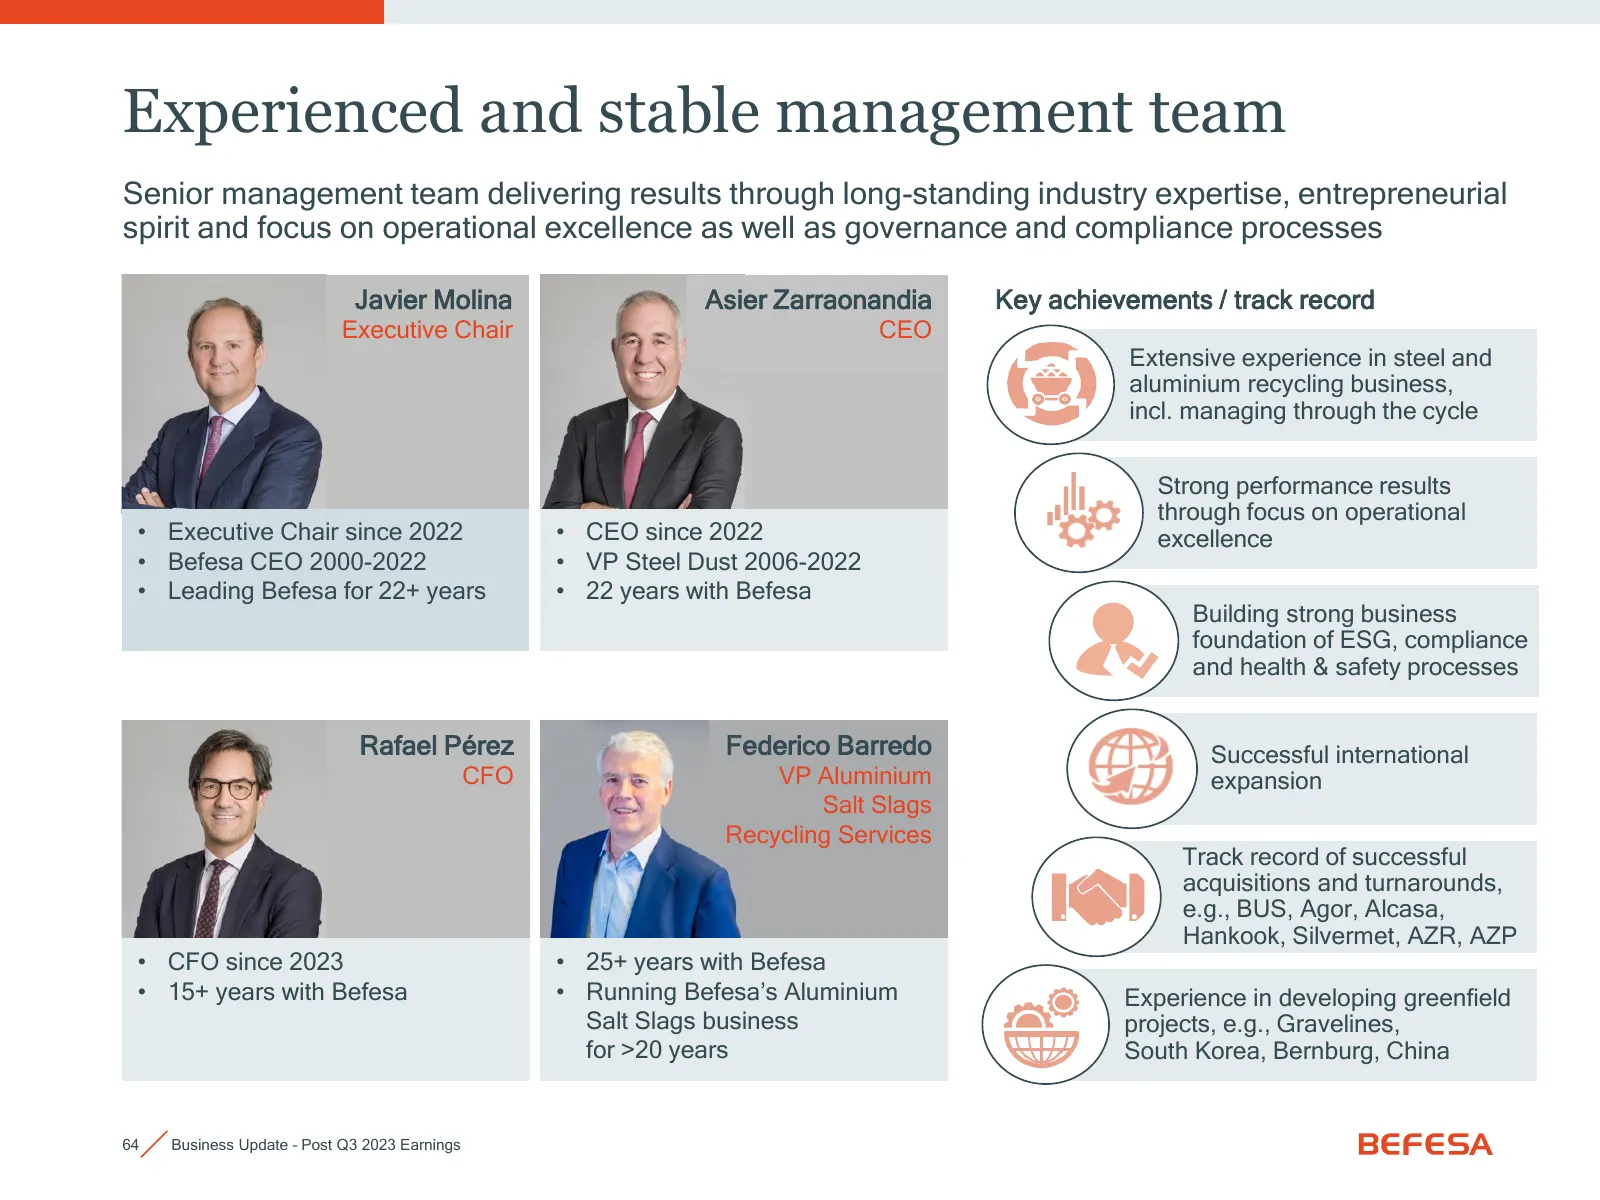
Experienced and stable management team Senior management team delivering results through long-standing industry expertise, entrepreneurial spirit and focus on operational excellence as well as governance and compliance processes Javier Molina Asier Zarraonandia Key achievements / track record Execut
Slide 65: ESG
05 ESG
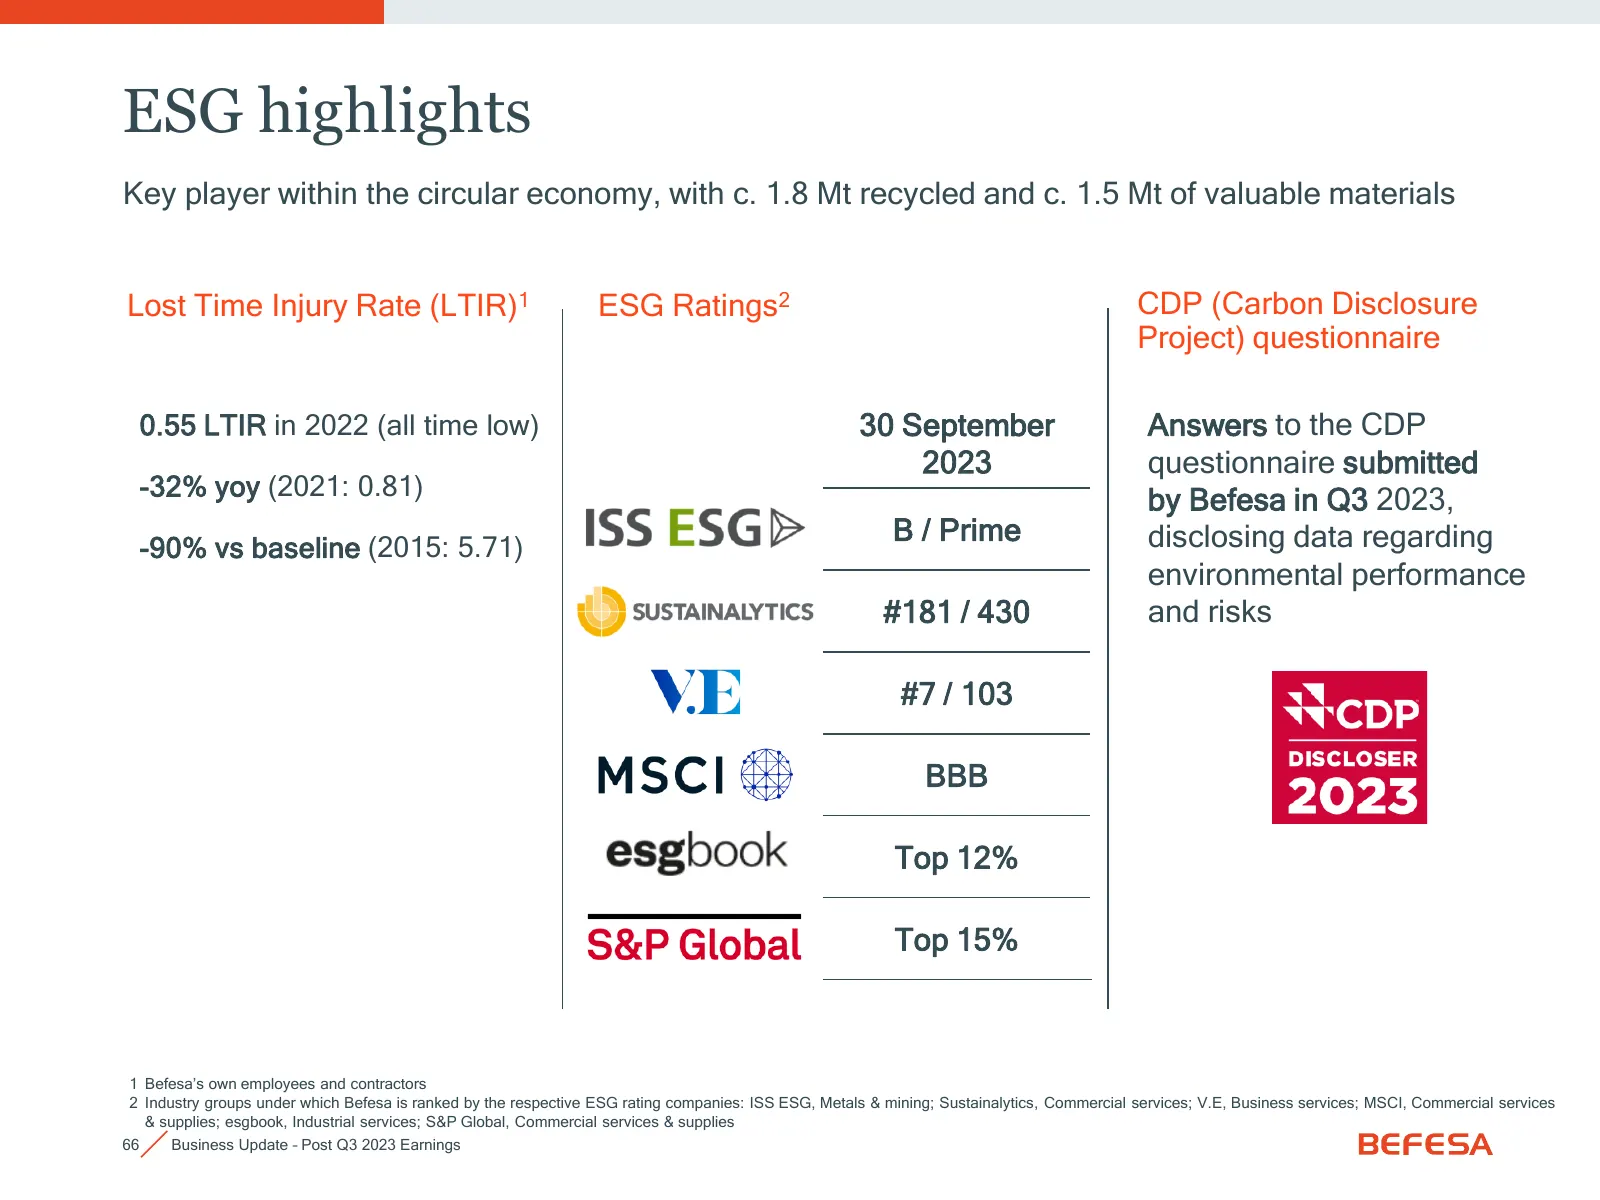
Slide 66: ESG highlights
ESG highlights Key player within the circular economy, with c. 1.8 Mt recycled and c. 1.5 Mt of valuable materials Lost Time Injury Rate (LTIR)1 ESG Ratings2 CDP (Carbon Disclosure Project) questionnaire 0.55 LTIR in 2022 (all time low) 30 September Answers to the CDP 2023 questionnaire submitted -3
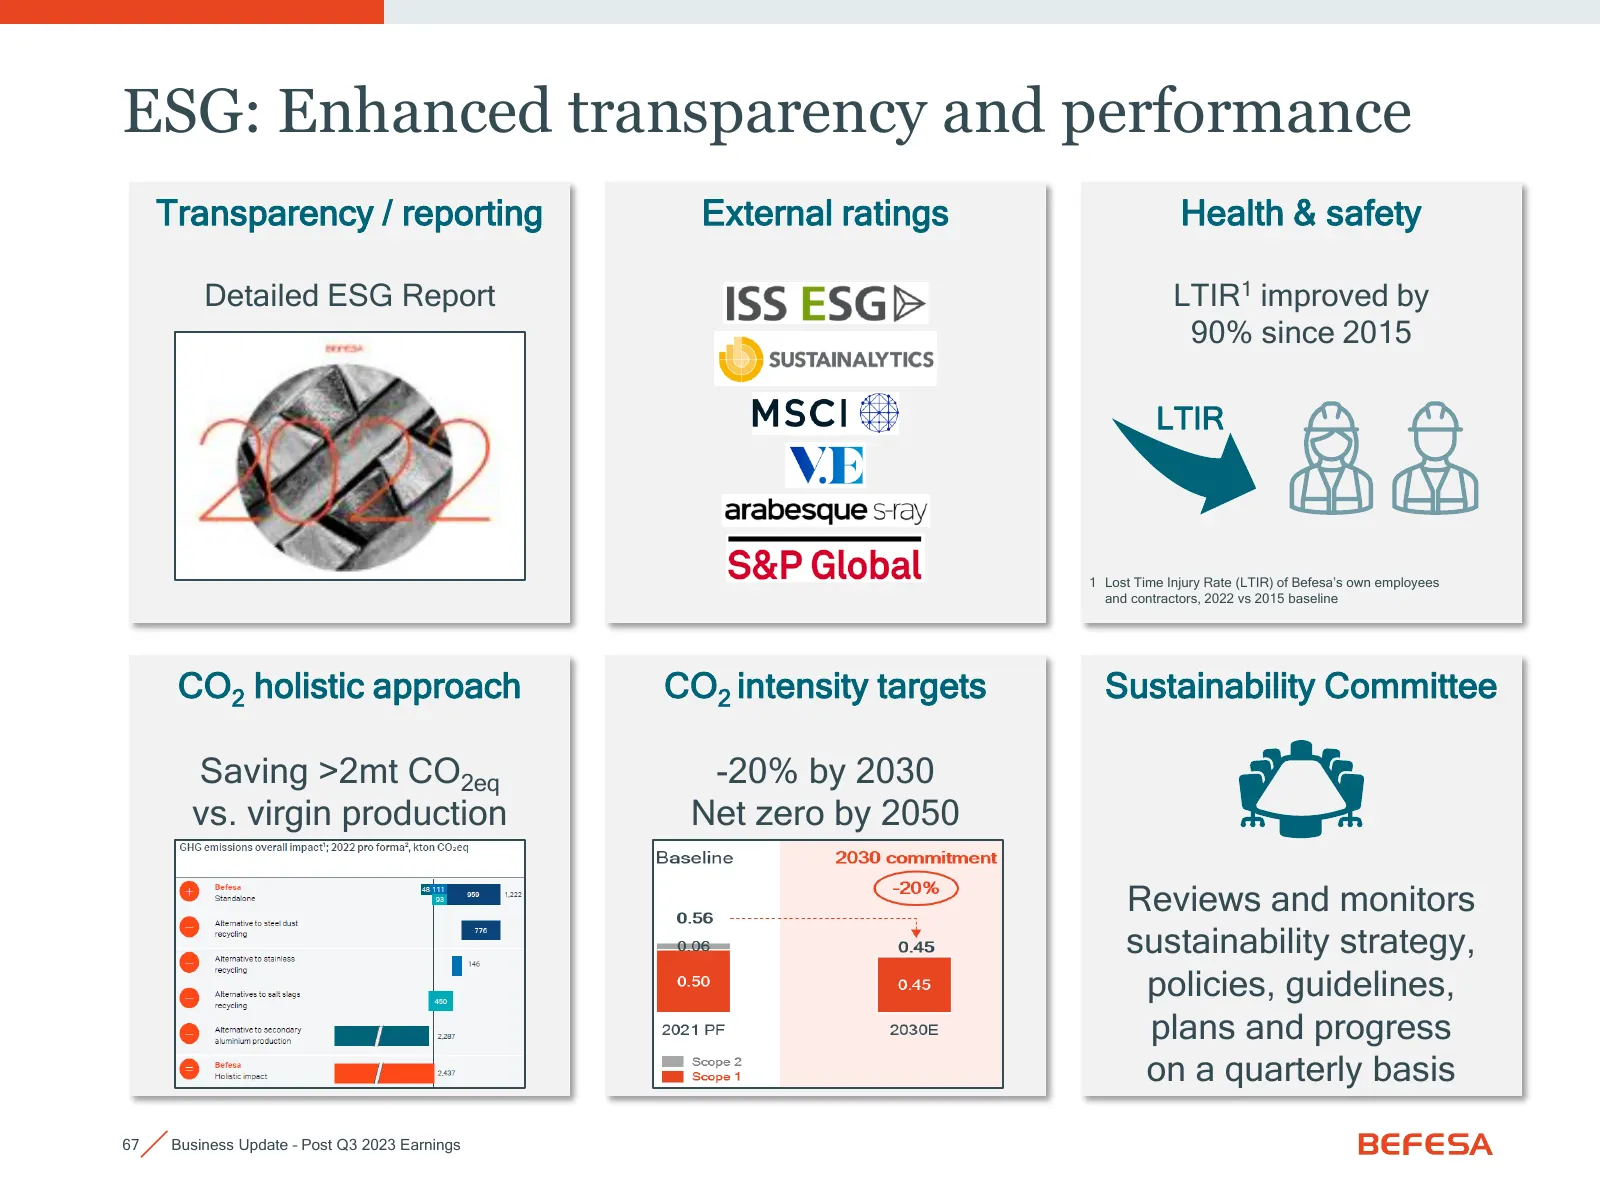
Slide 67: ESG: Enhanced transparency and performance
ESG: Enhanced transparency and performance Transparency / reporting External ratings Health & safety Detailed ESG Report LTIR1 improved by 90% since 2015 LTIR 1 Lost Time Injury Rate (LTIR) of Befesa’s own employees and contractors, 2022 vs 2015 baseline CO2 holistic approach CO2 intensity targets S
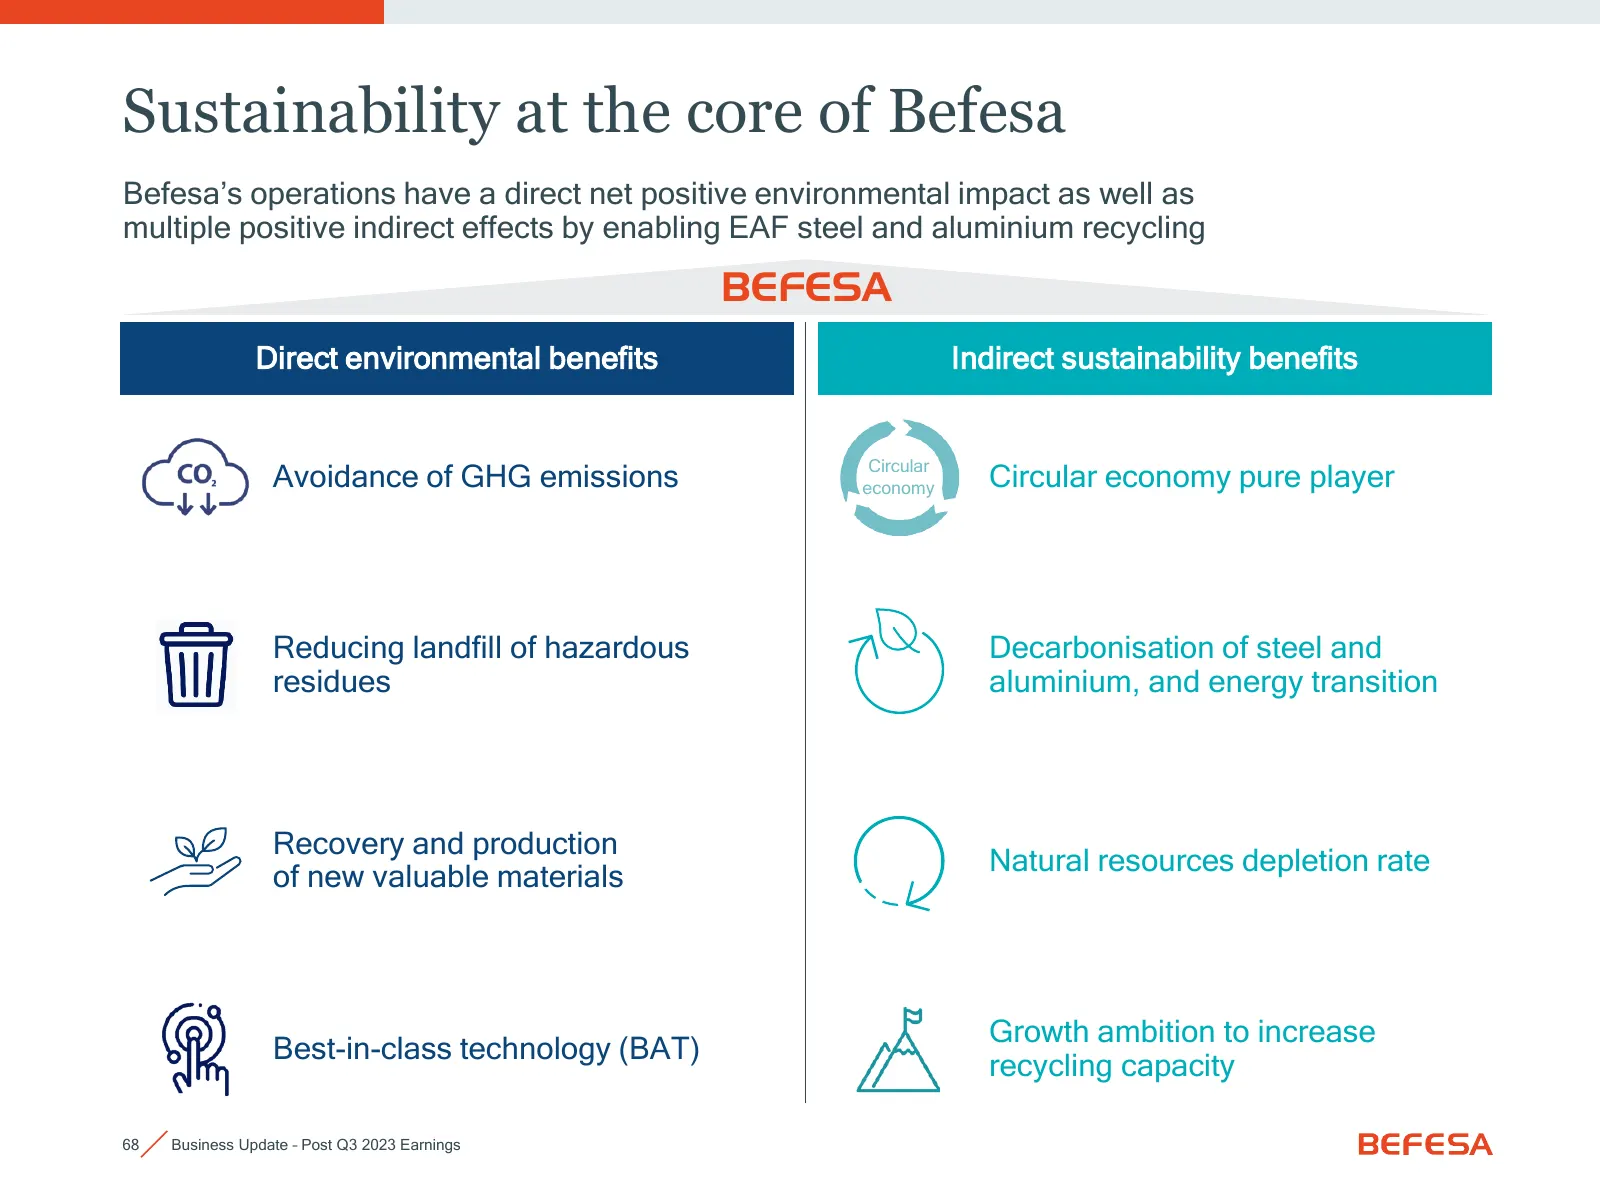
Slide 68: Sustainability at the core of Befesa
Sustainability at the core of Befesa Befesa’s operations have a direct net positive environmental impact as well as multiple positive indirect effects by enabling EAF steel and aluminium recycling BEFESA Direct environmental benefits Indirect sustainability benefits Circular Avoidance of GHG emissio
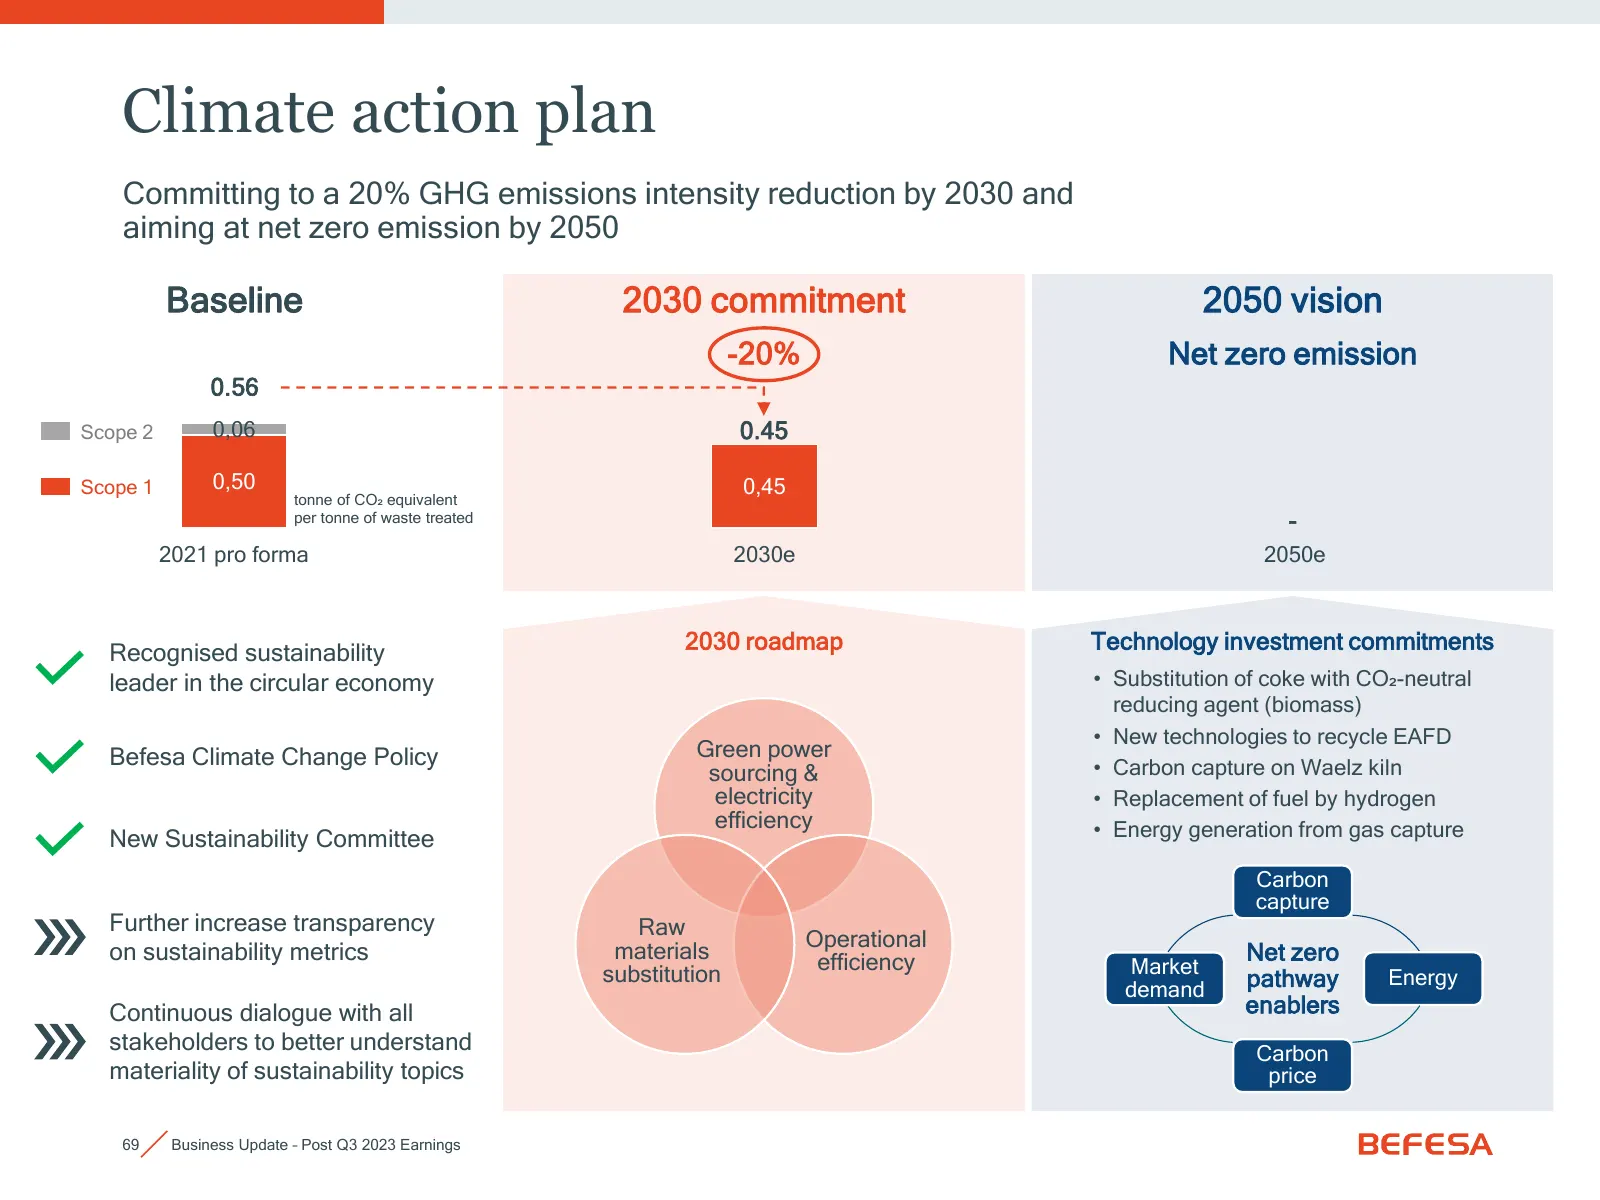
Slide 69: Climate action plan
Climate action plan Committing to a 20% GHG emissions intensity reduction by 2030 and aiming at net zero emission by 2050 Baseline 2030 commitment 2050 vision -20% Net zero emission 0.56 Scope 2 0,06 0.45 Scope 1 0,50 0,45 tonne of CO₂ equivalent per tonne of waste treated - 2021 pro forma 2030e 205
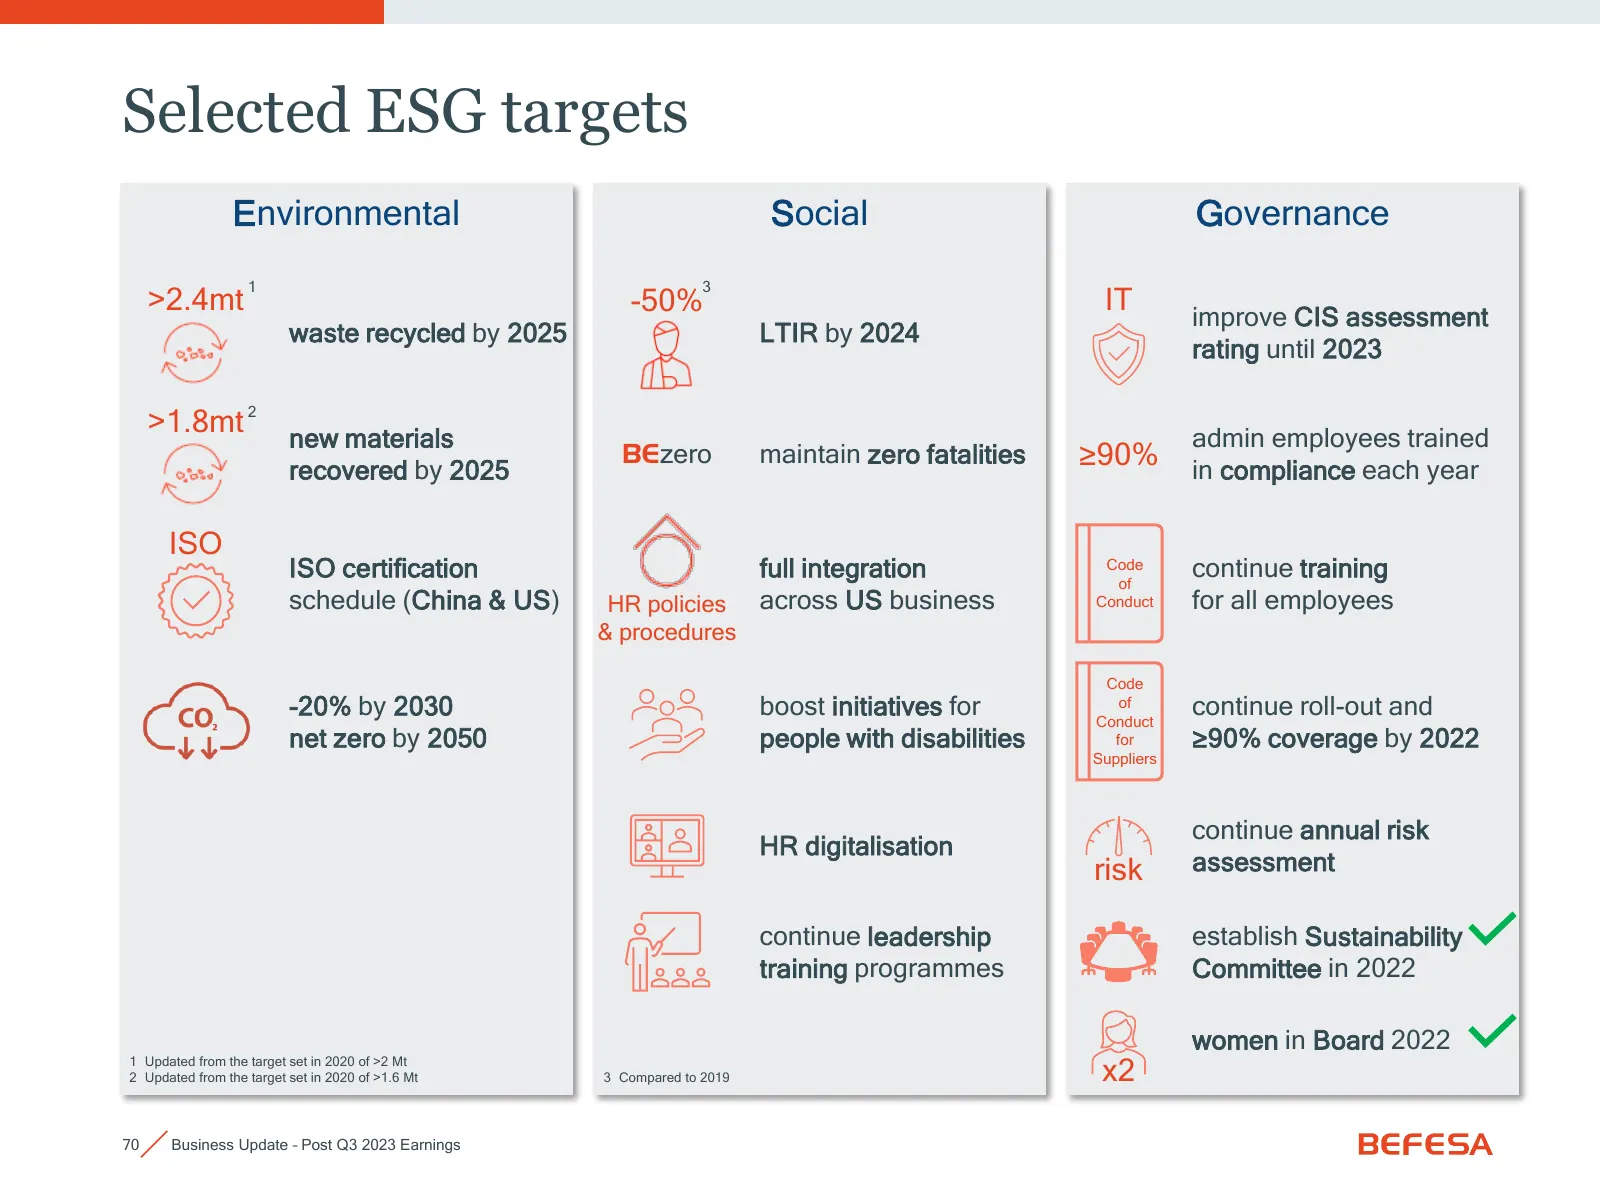
Slide 70: Selected ESG targets
Selected ESG targets Environmental Social Governance 1 3 >2.4mt -50% IT improve CIS assessment waste recycled by 2025 LTIR by 2024 rating until 2023 >1.8mt 2 new materials admin employees trained recovered by 2025 BEzero maintain zero fatalities ≥90% in compliance each year ISO ISO certification ful
Slide 71: Investor agenda & appendix
06 Investor agenda & appendix
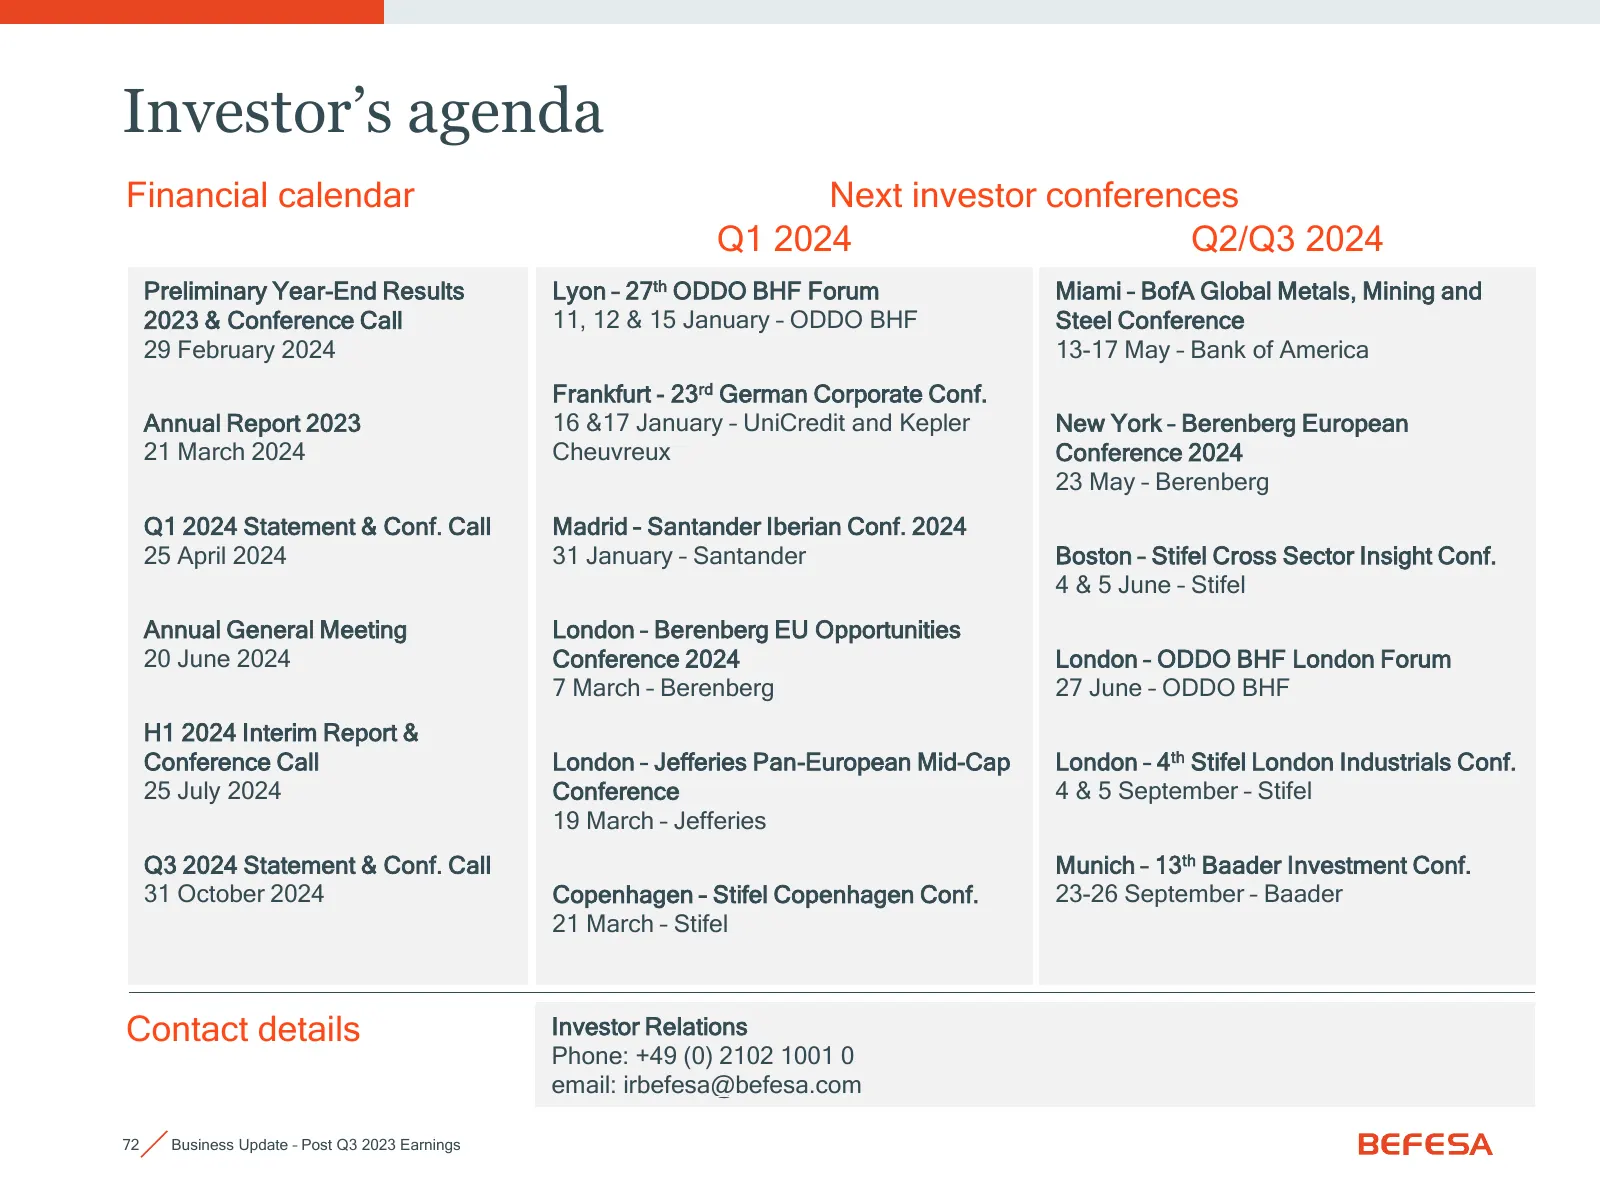
Slide 72: Investor's agenda
Investor’s agenda Financial calendar Next investor conferences Q1 2024 Q2/Q3 2024 Preliminary Year-End Results Lyon – 27th ODDO BHF Forum Miami – BofA Global Metals, Mining and 2023 & Conference Call 11, 12 & 15 January – ODDO BHF Steel Conference 29 February 2024 13-17 May – Bank of America Frankfu
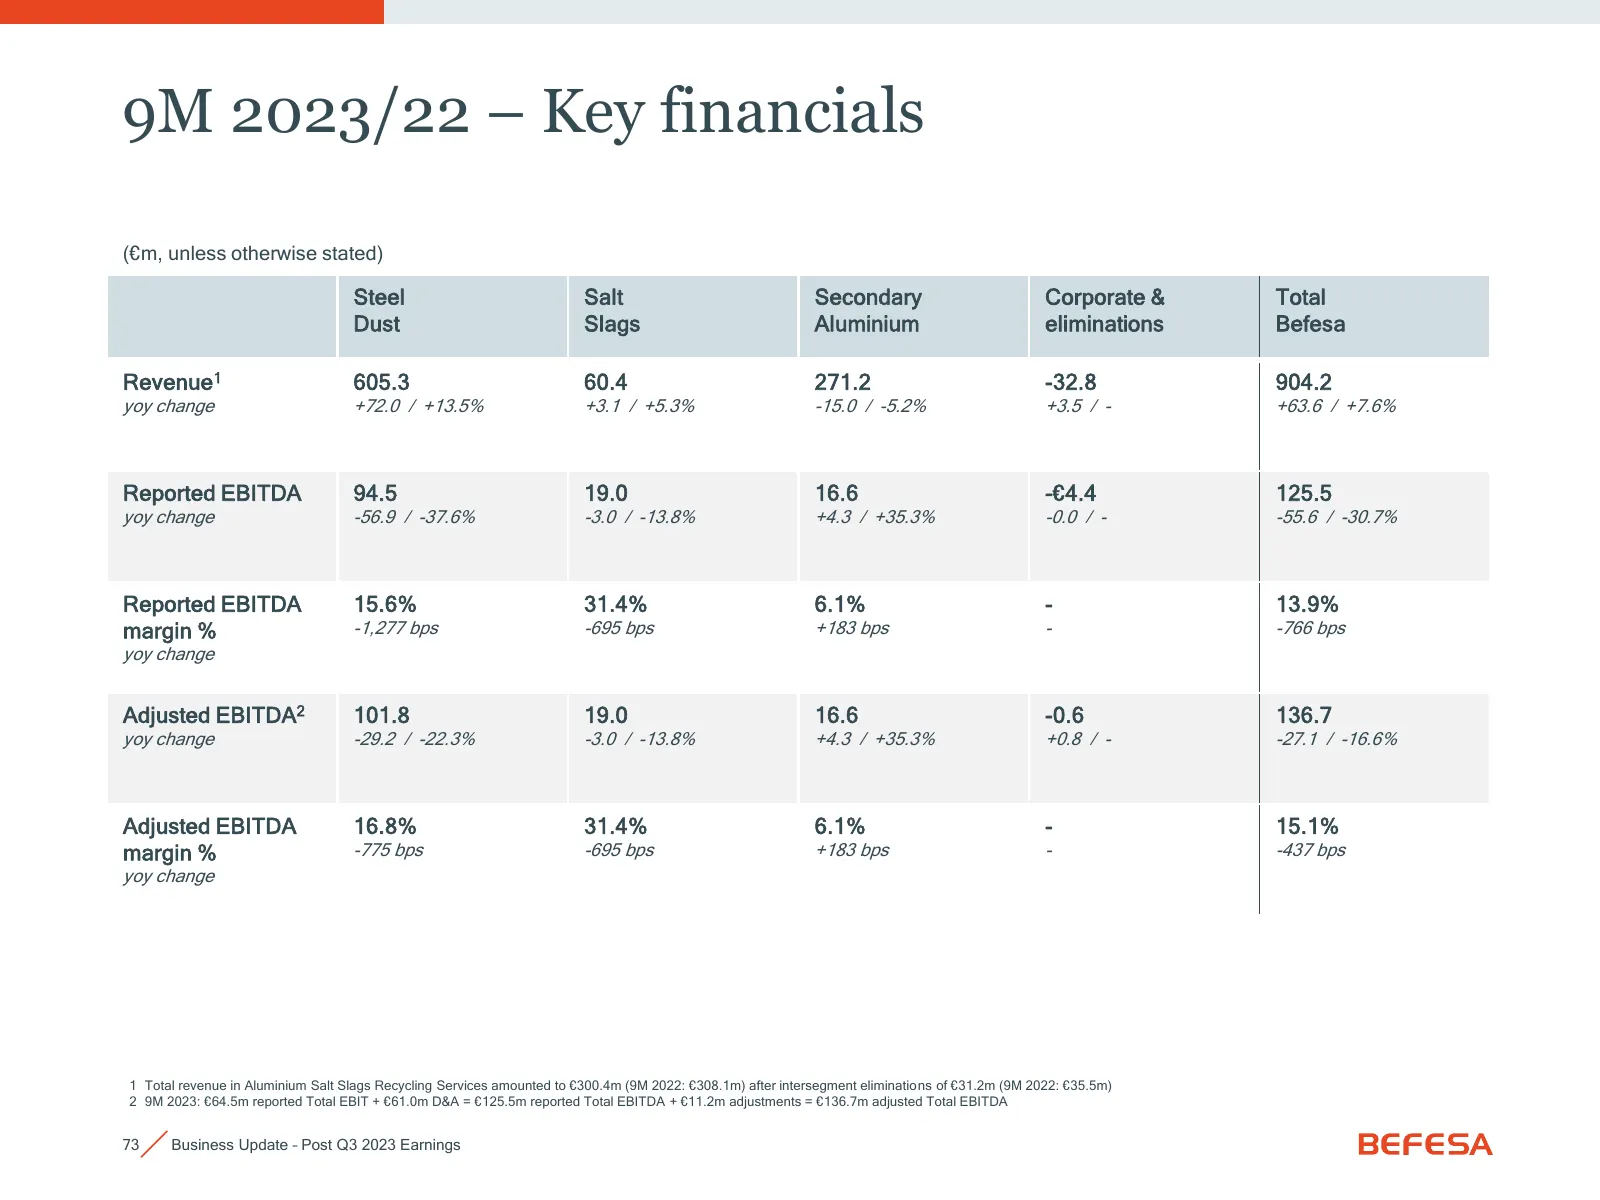
Slide 73: 9M 2023/22 – Key financials
9M 2023/22 – Key financials (€m, unless otherwise stated) Steel Salt Secondary Corporate & Total Dust Slags Aluminium eliminations Befesa Revenue1 605.3 60.4 271.2 -32.8 904.2 yoy change +72.0 / +13.5% +3.1 / +5.3% -15.0 / -5.2% +3.5 / - +63.6 / +7.6% Reported EBITDA 94.5 19.0 16.6 -€4.4 125.5 yoy c
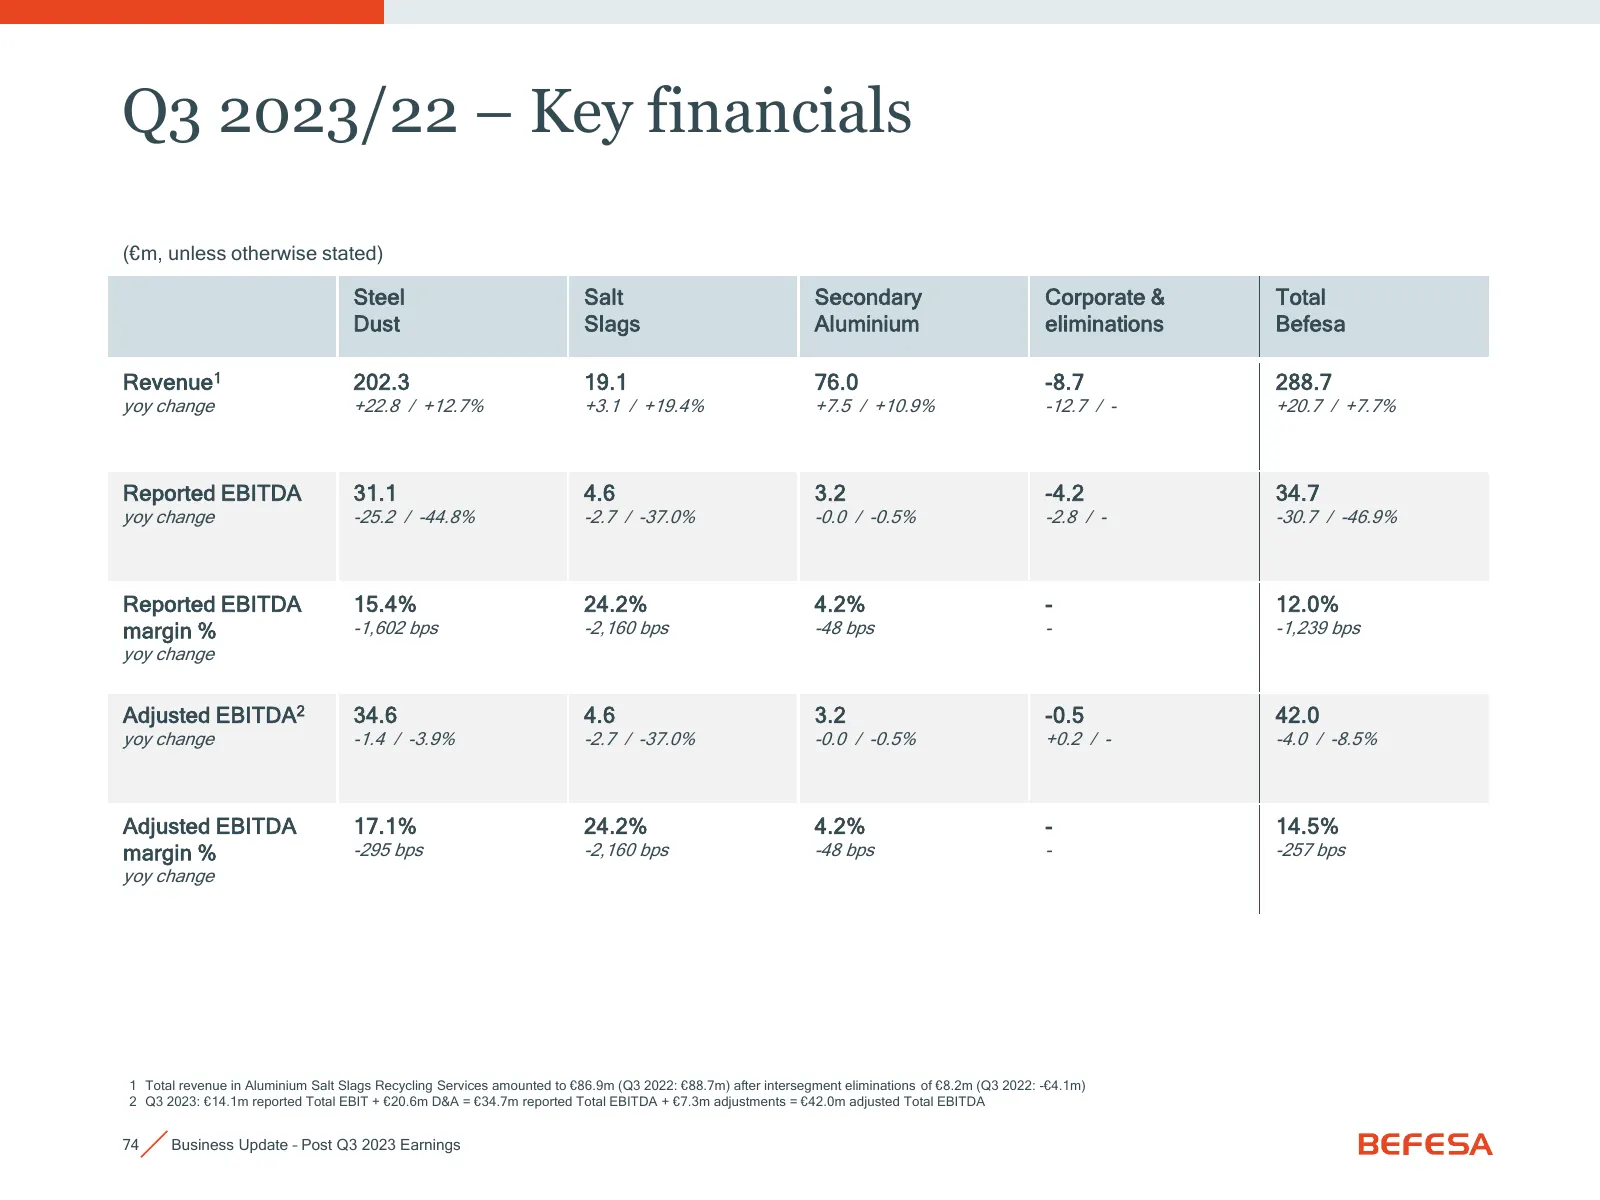
Slide 74: Q3 2023/22 – Key financials
Q3 2023/22 – Key financials (€m, unless otherwise stated) Steel Salt Secondary Corporate & Total Dust Slags Aluminium eliminations Befesa Revenue1 202.3 19.1 76.0 -8.7 288.7 yoy change +22.8 / +12.7% +3.1 / +19.4% +7.5 / +10.9% -12.7 / - +20.7 / +7.7% Reported EBITDA 31.1 4.6 3.2 -4.2 34.7 yoy chang
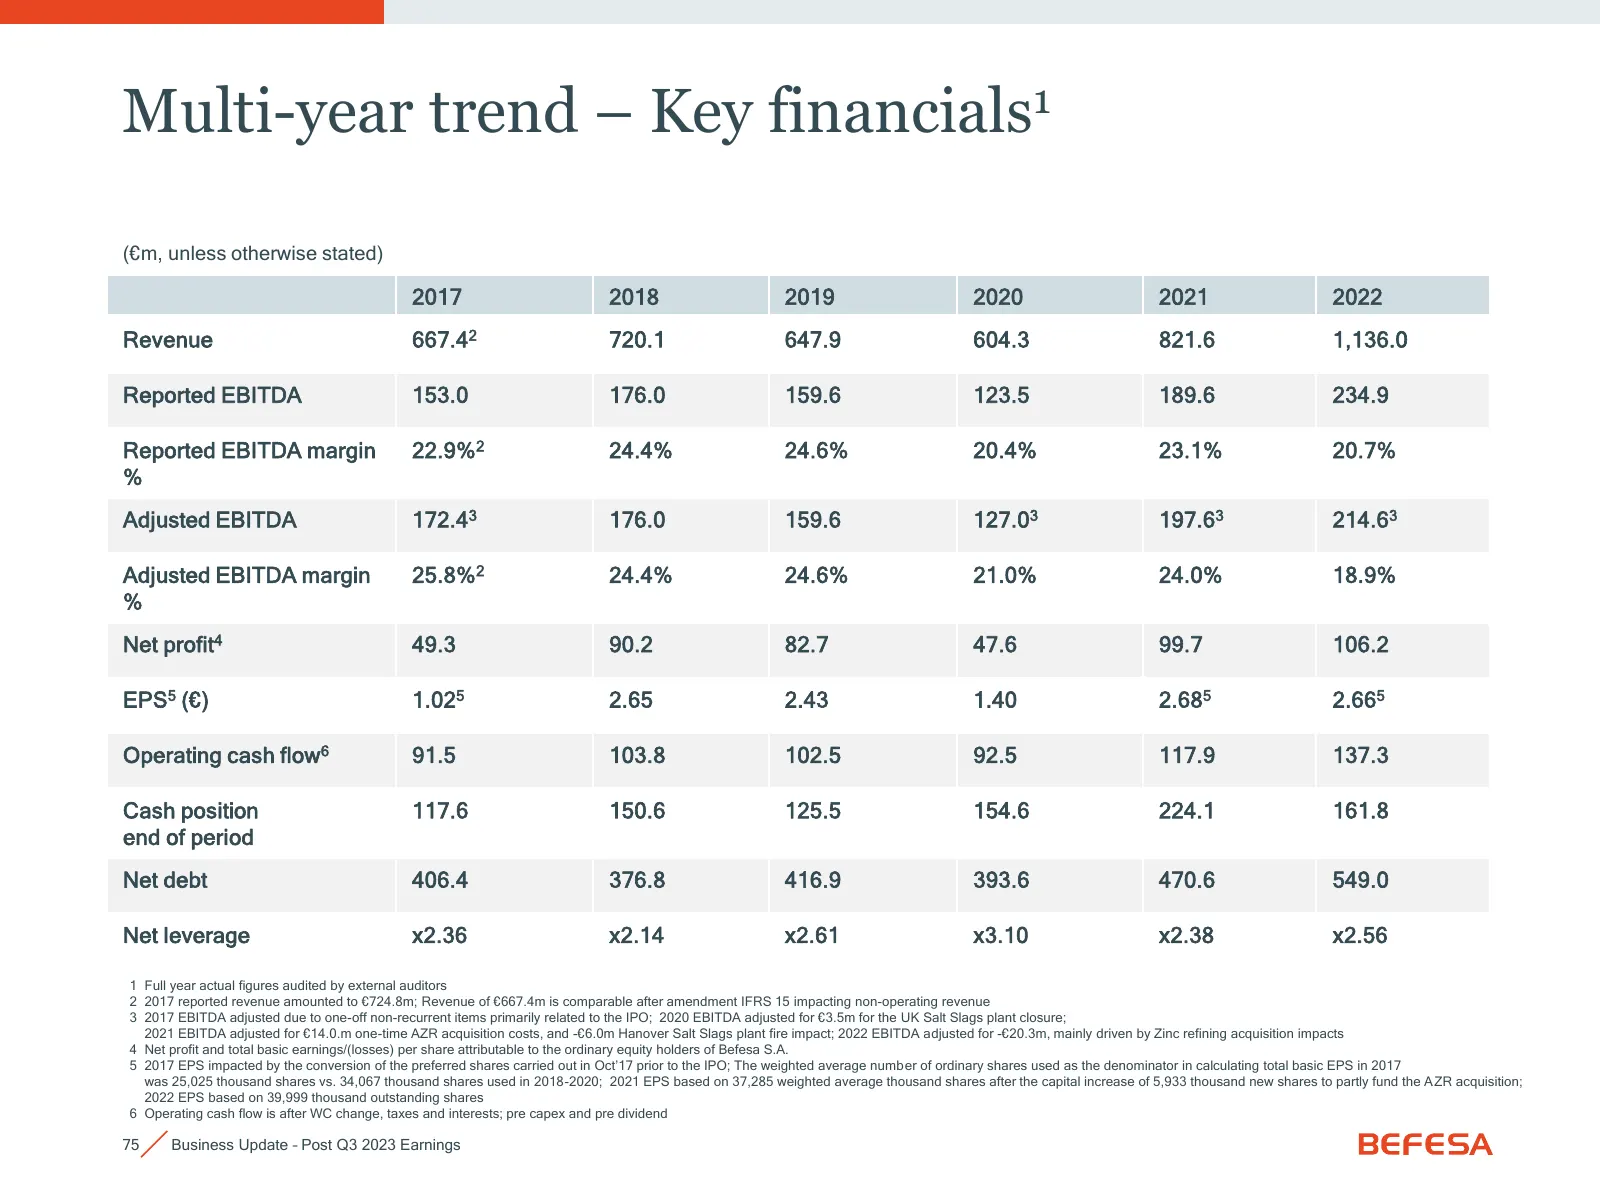
Slide 75: Multi-year trend – Key financials
Multi-year trend – Key financials1 (€m, unless otherwise stated) 2017 2018 2019 2020 2021 2022 Revenue 667.42 720.1 647.9 604.3 821.6 1,136.0 Reported EBITDA 153.0 176.0 159.6 123.5 189.6 234.9 Reported EBITDA margin 22.9%2 24.4% 24.6% 20.4% 23.1% 20.7% % Adjusted EBITDA 172.43 176.0 159.6 127.03 19
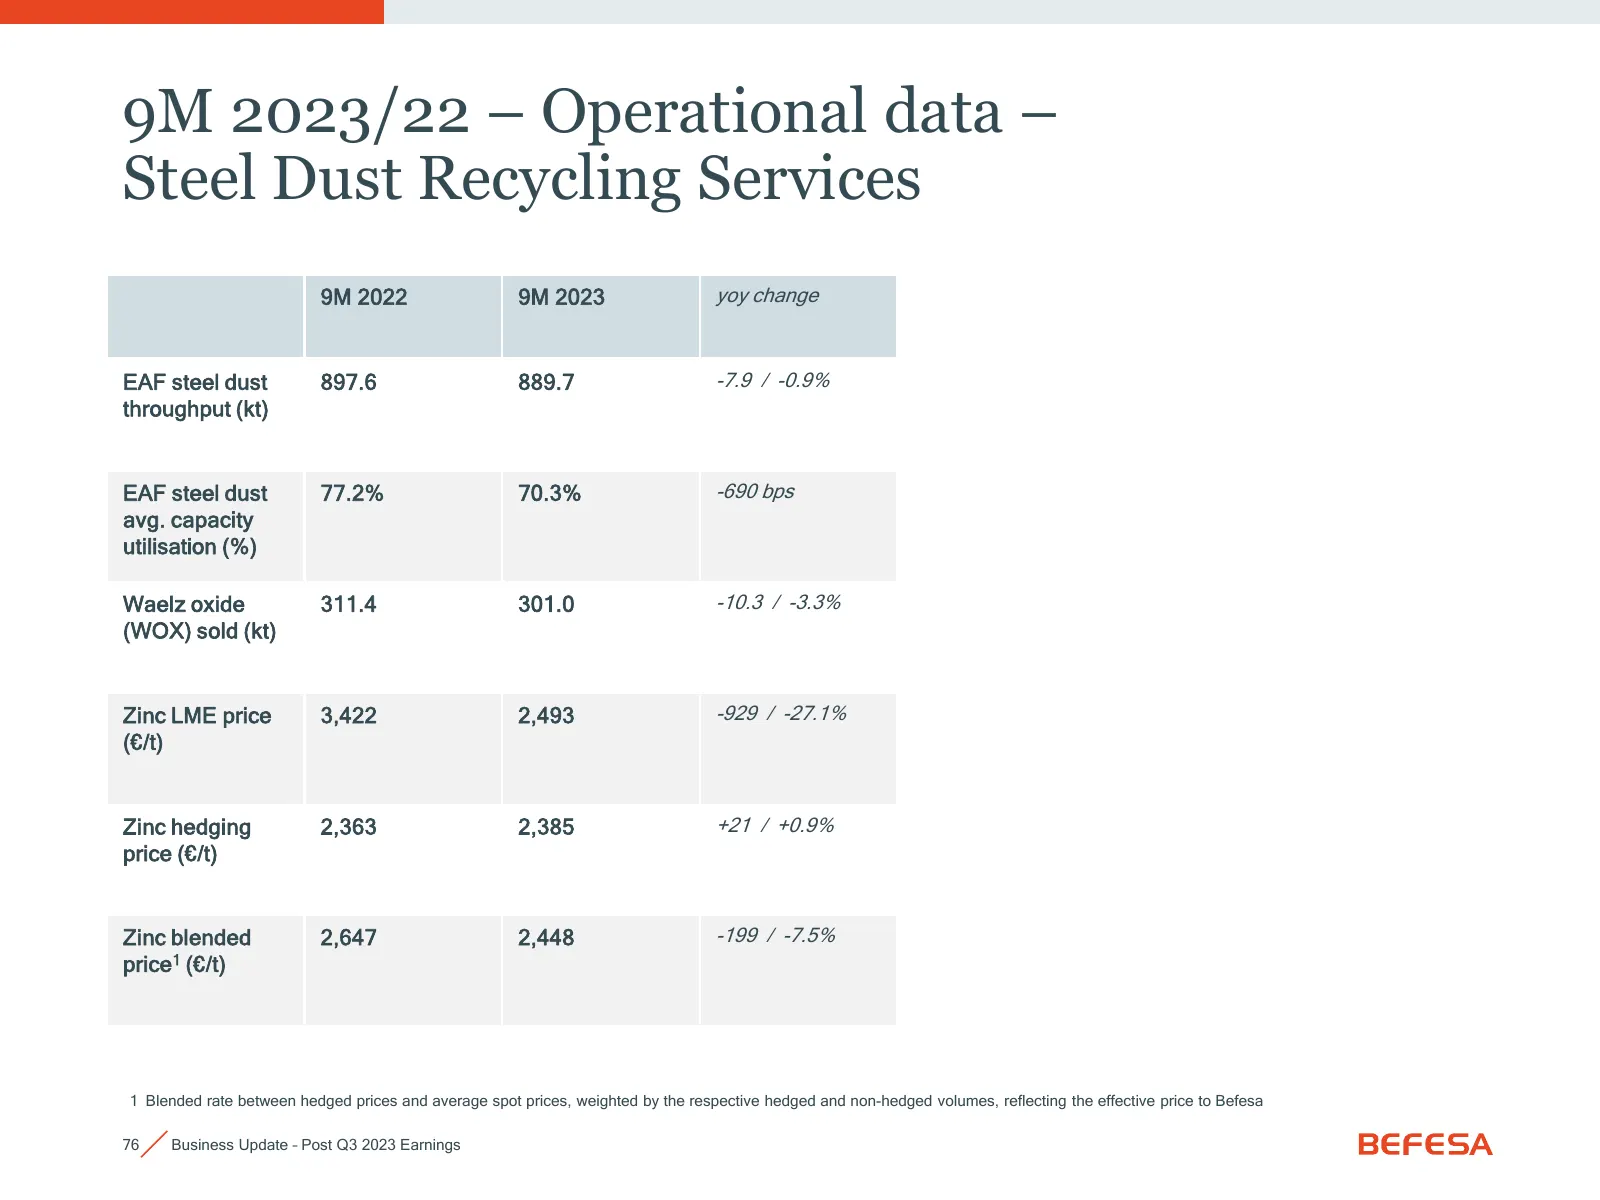
Slide 76: 9M 2023/22 – Operational data – Steel Dust Recycling Services
9M 2023/22 – Operational data – Steel Dust Recycling Services 9M 2022 9M 2023 yoy change EAF steel dust 897.6 889.7 -7.9 / -0.9% throughput (kt) EAF steel dust 77.2% 70.3% -690 bps avg. capacity utilisation (%) Waelz oxide 311.4 301.0 -10.3 / -3.3% (WOX) sold (kt) Zinc LME price 3,422 2,493 -929 / -
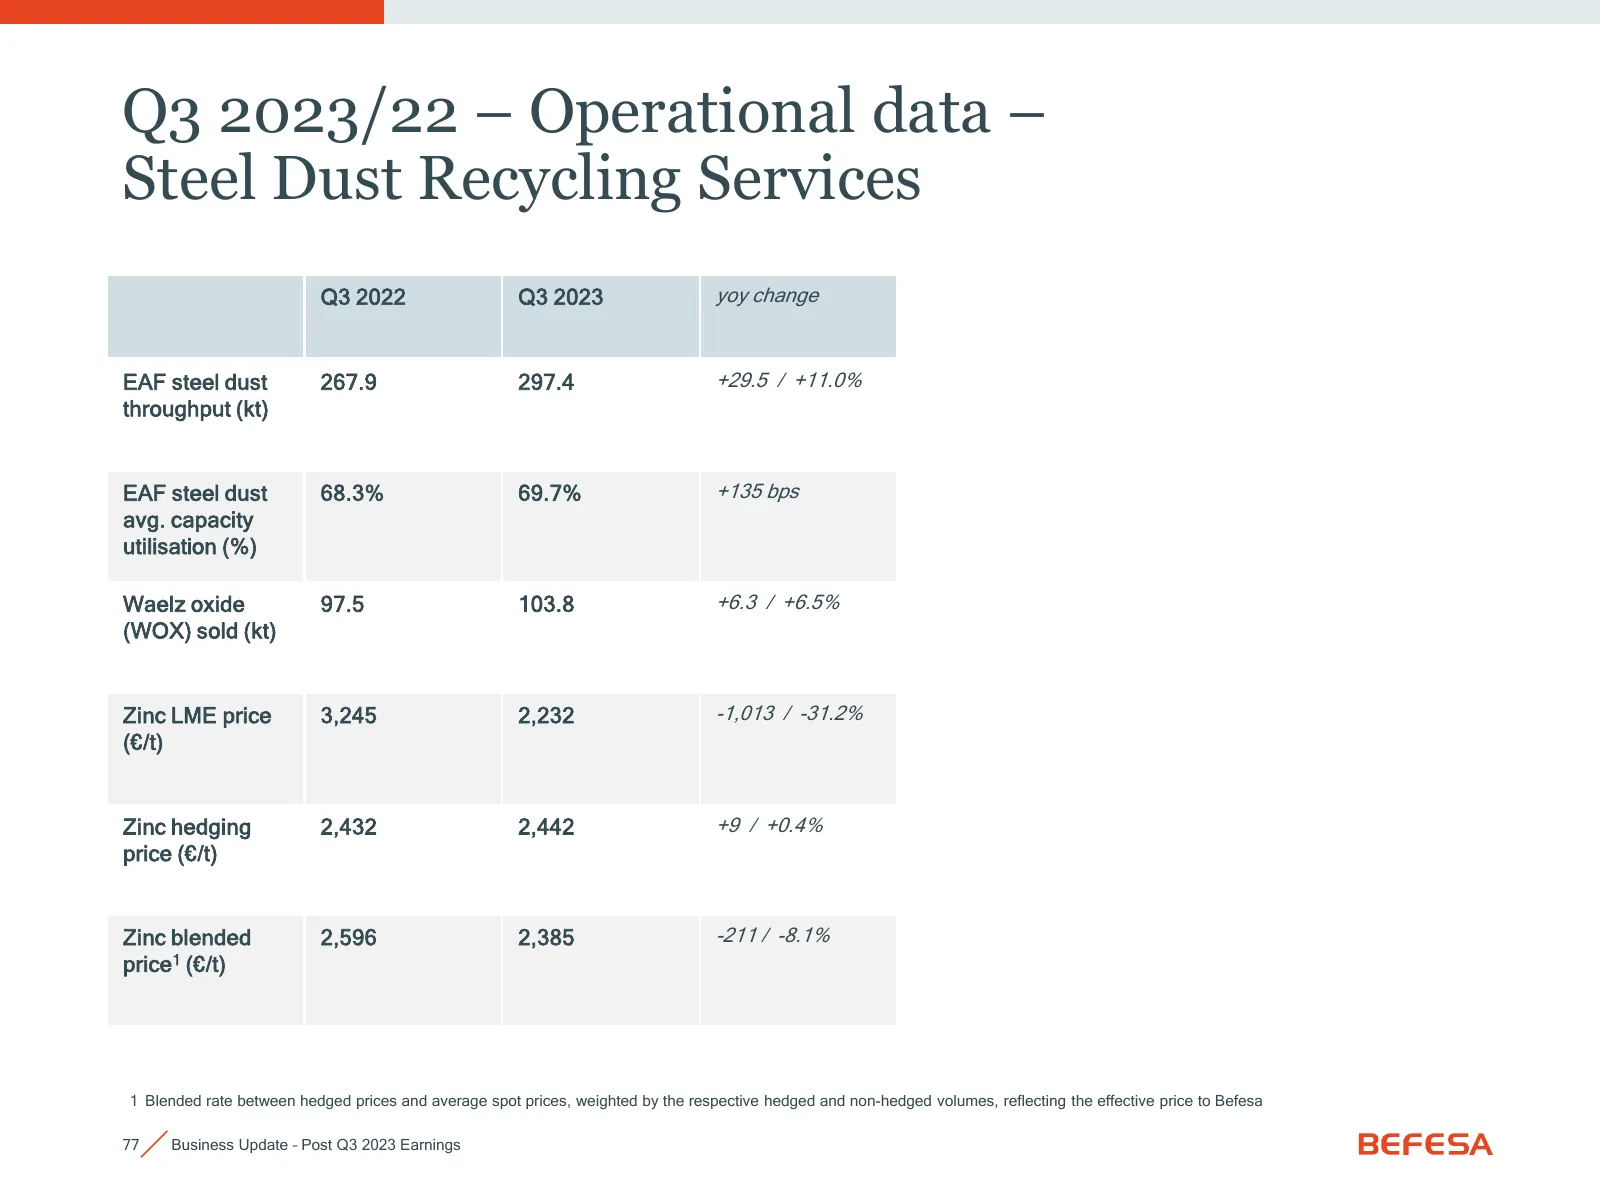
Slide 77: Q3 2023/22 – Operational data – Steel Dust Recycling Services
Q3 2023/22 – Operational data – Steel Dust Recycling Services Q3 2022 Q3 2023 yoy change EAF steel dust 267.9 297.4 +29.5 / +11.0% throughput (kt) EAF steel dust 68.3% 69.7% +135 bps avg. capacity utilisation (%) Waelz oxide 97.5 103.8 +6.3 / +6.5% (WOX) sold (kt) Zinc LME price 3,245 2,232 -1,013 /
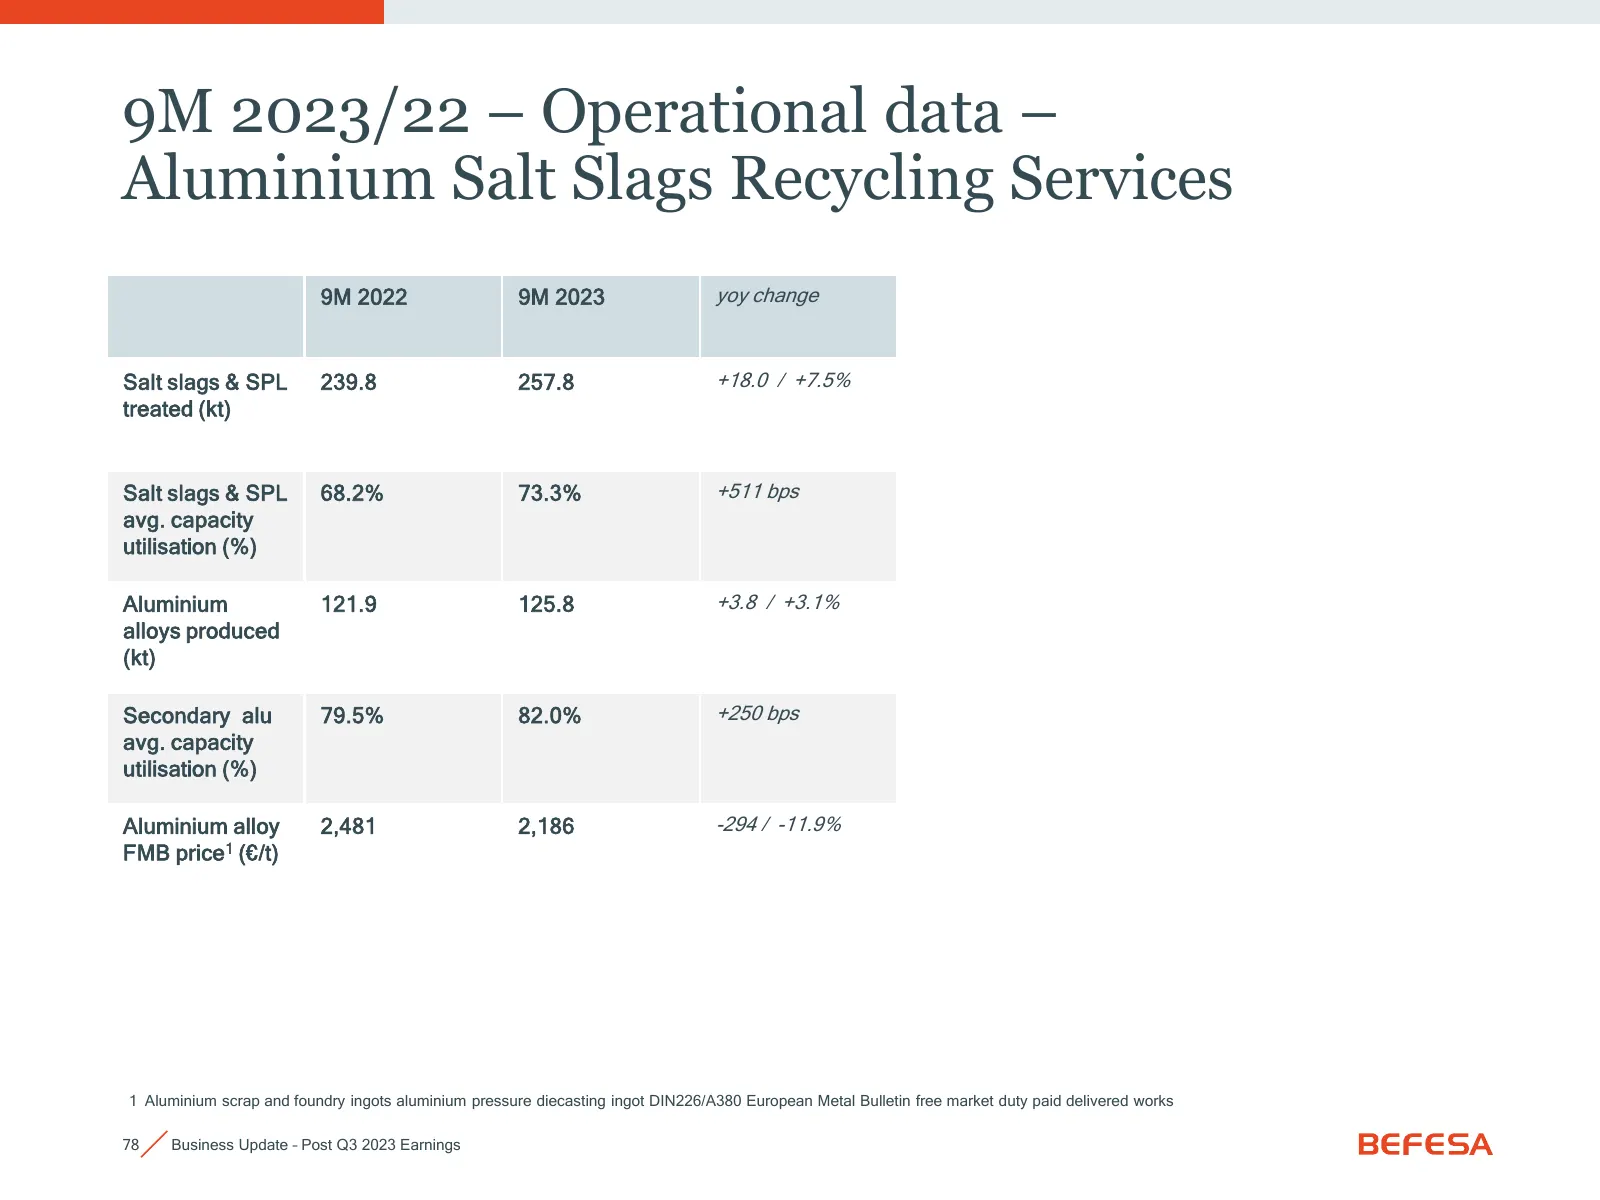
Slide 78: 9M 2023/22 – Operational data – Aluminium Salt Slags Recycling Services
9M 2023/22 – Operational data – Aluminium Salt Slags Recycling Services 9M 2022 9M 2023 yoy change Salt slags & SPL 239.8 257.8 +18.0 / +7.5% treated (kt) Salt slags & SPL 68.2% 73.3% +511 bps avg. capacity utilisation (%) Aluminium 121.9 125.8 +3.8 / +3.1% alloys produced (kt) Secondary alu 79.5% 8
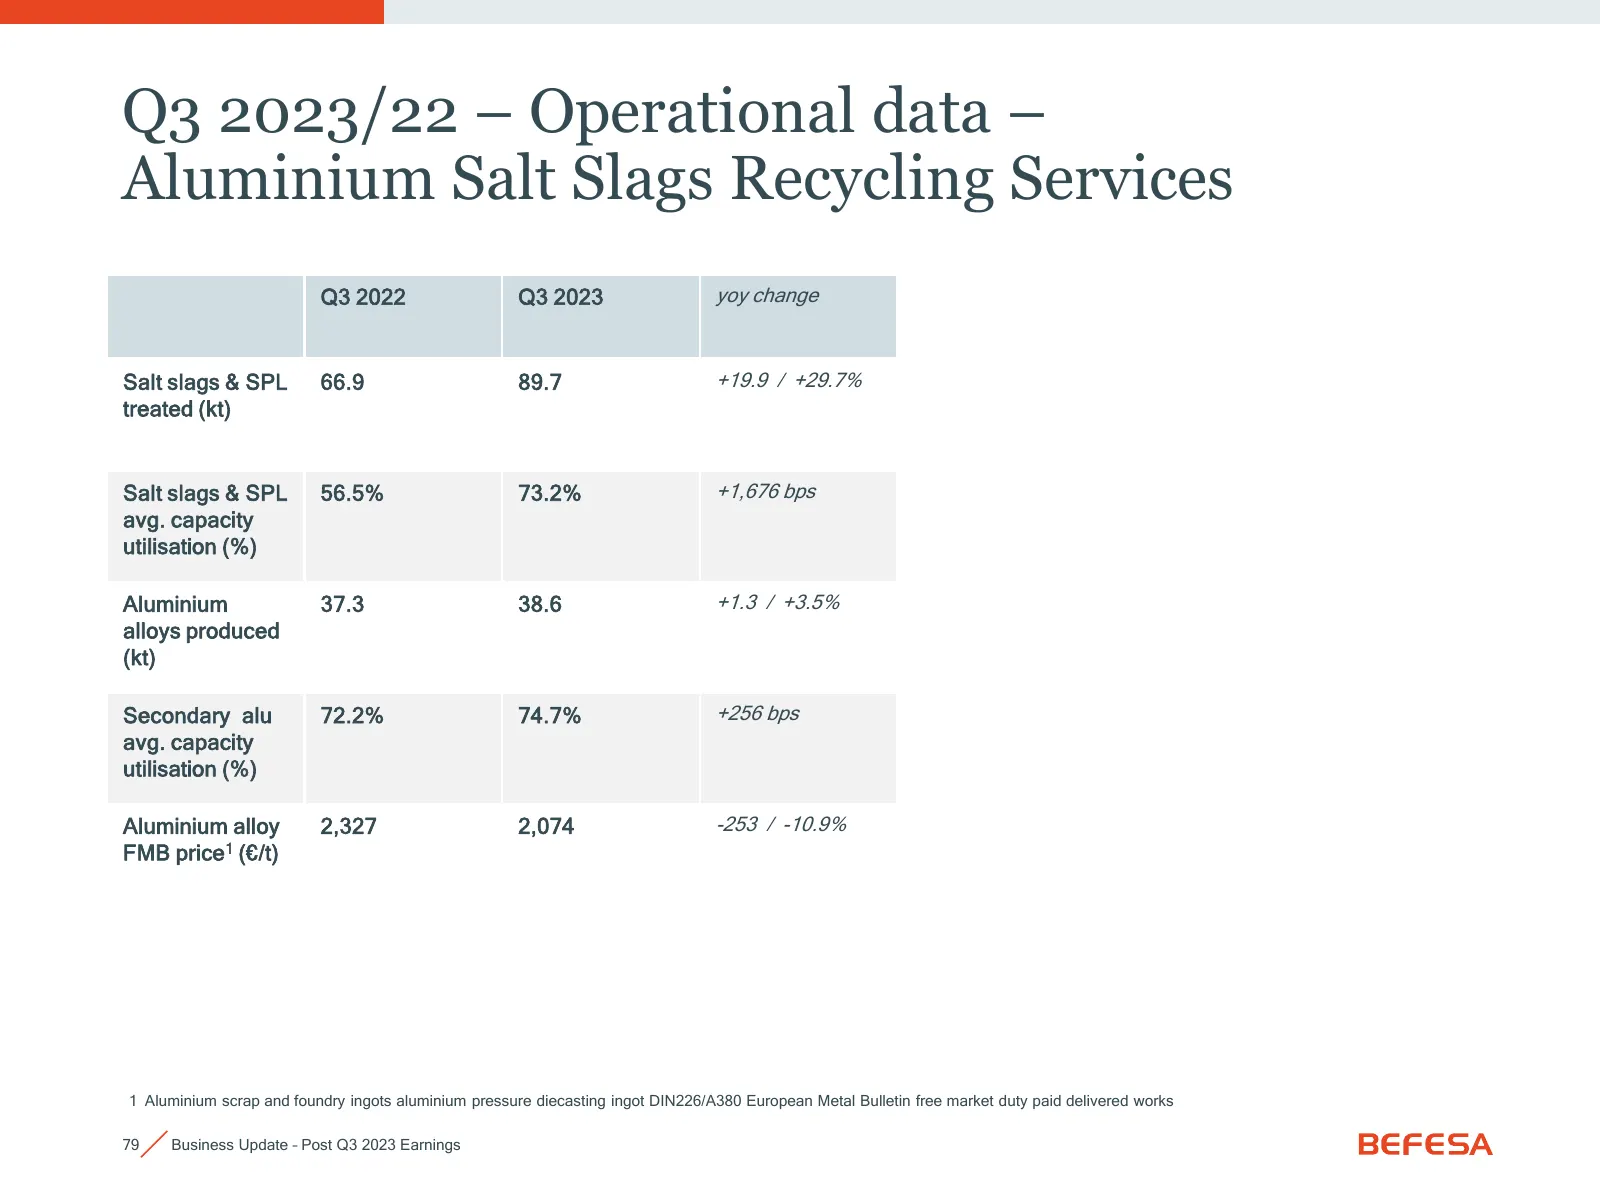
Slide 79: Q3 2023/22 – Operational data – Aluminium Salt Slags Recycling Services
Q3 2023/22 – Operational data – Aluminium Salt Slags Recycling Services Q3 2022 Q3 2023 yoy change Salt slags & SPL 66.9 89.7 +19.9 / +29.7% treated (kt) Salt slags & SPL 56.5% 73.2% +1,676 bps avg. capacity utilisation (%) Aluminium 37.3 38.6 +1.3 / +3.5% alloys produced (kt) Secondary alu 72.2% 74
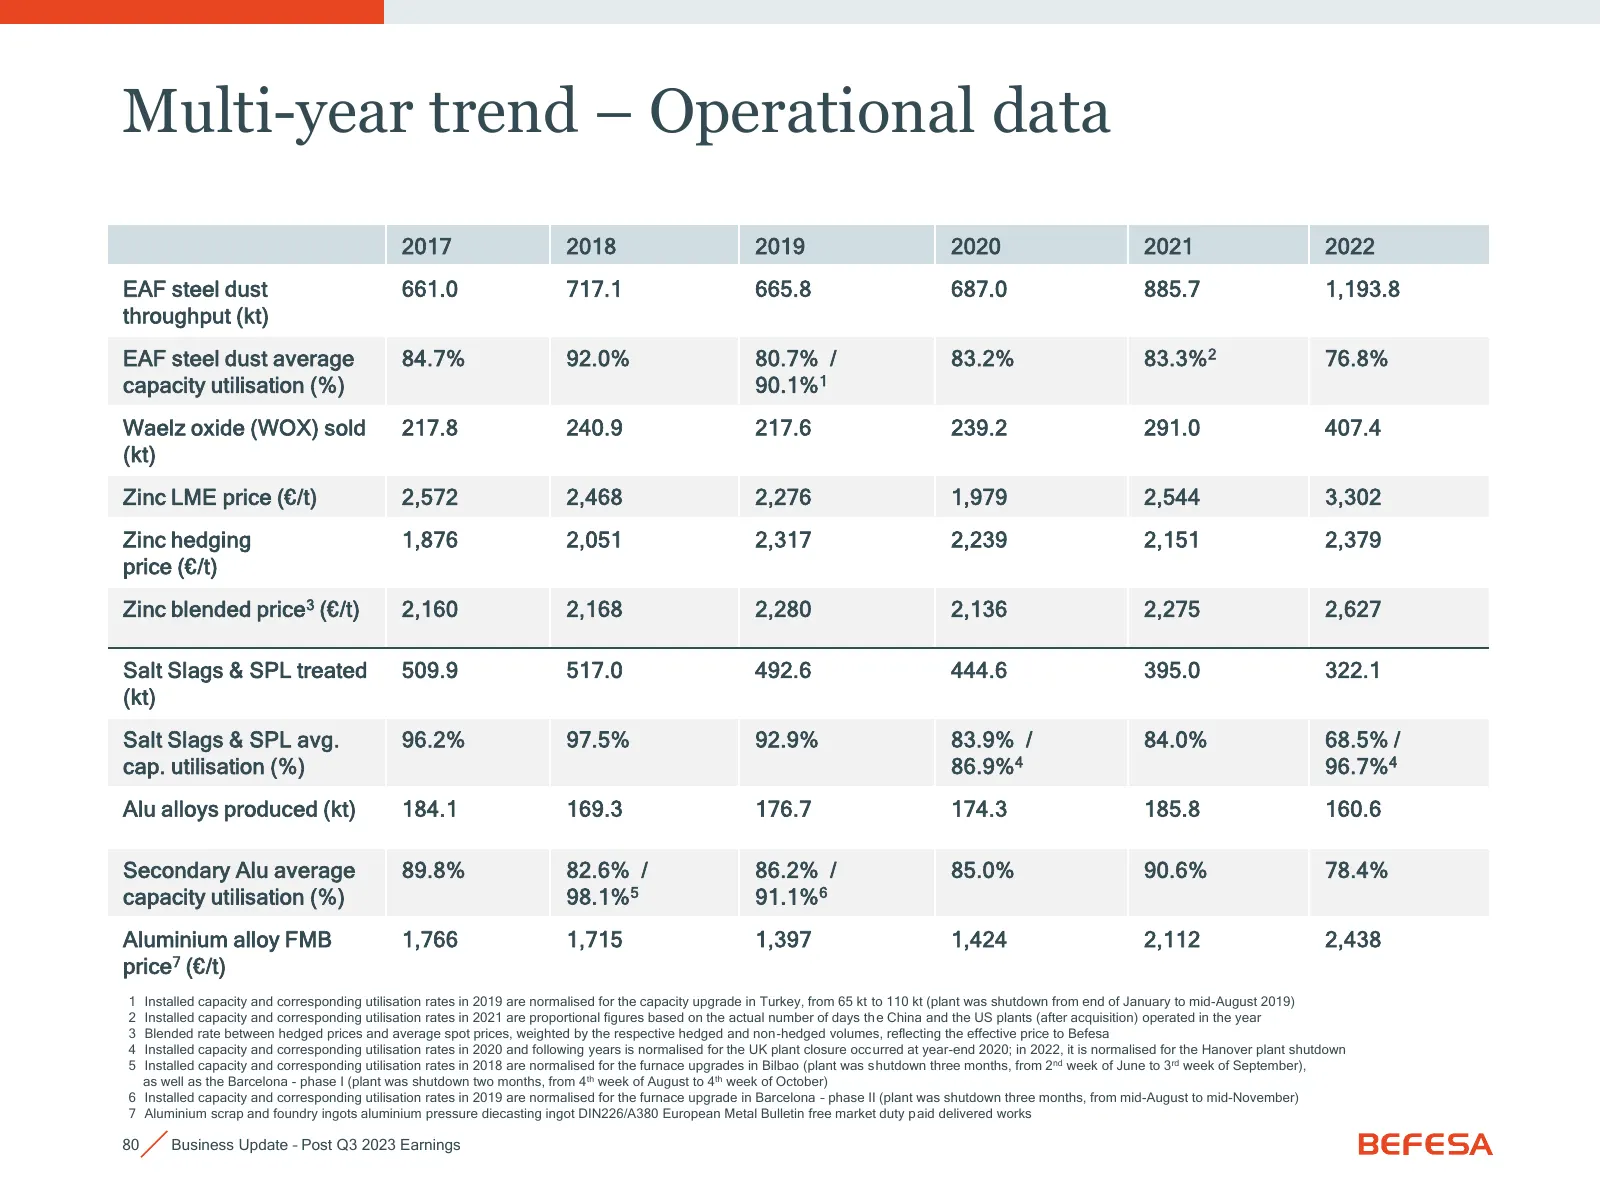
Slide 80: Multi-year trend – Operational data
Multi-year trend – Operational data 2017 2018 2019 2020 2021 2022 EAF steel dust 661.0 717.1 665.8 687.0 885.7 1,193.8 throughput (kt) EAF steel dust average 84.7% 92.0% 80.7% / 83.2% 83.3%2 76.8% capacity utilisation (%) 90.1%1 Waelz oxide (WOX) sold 217.8 240.9 217.6 239.2 291.0 407.4 (kt) Zinc LM
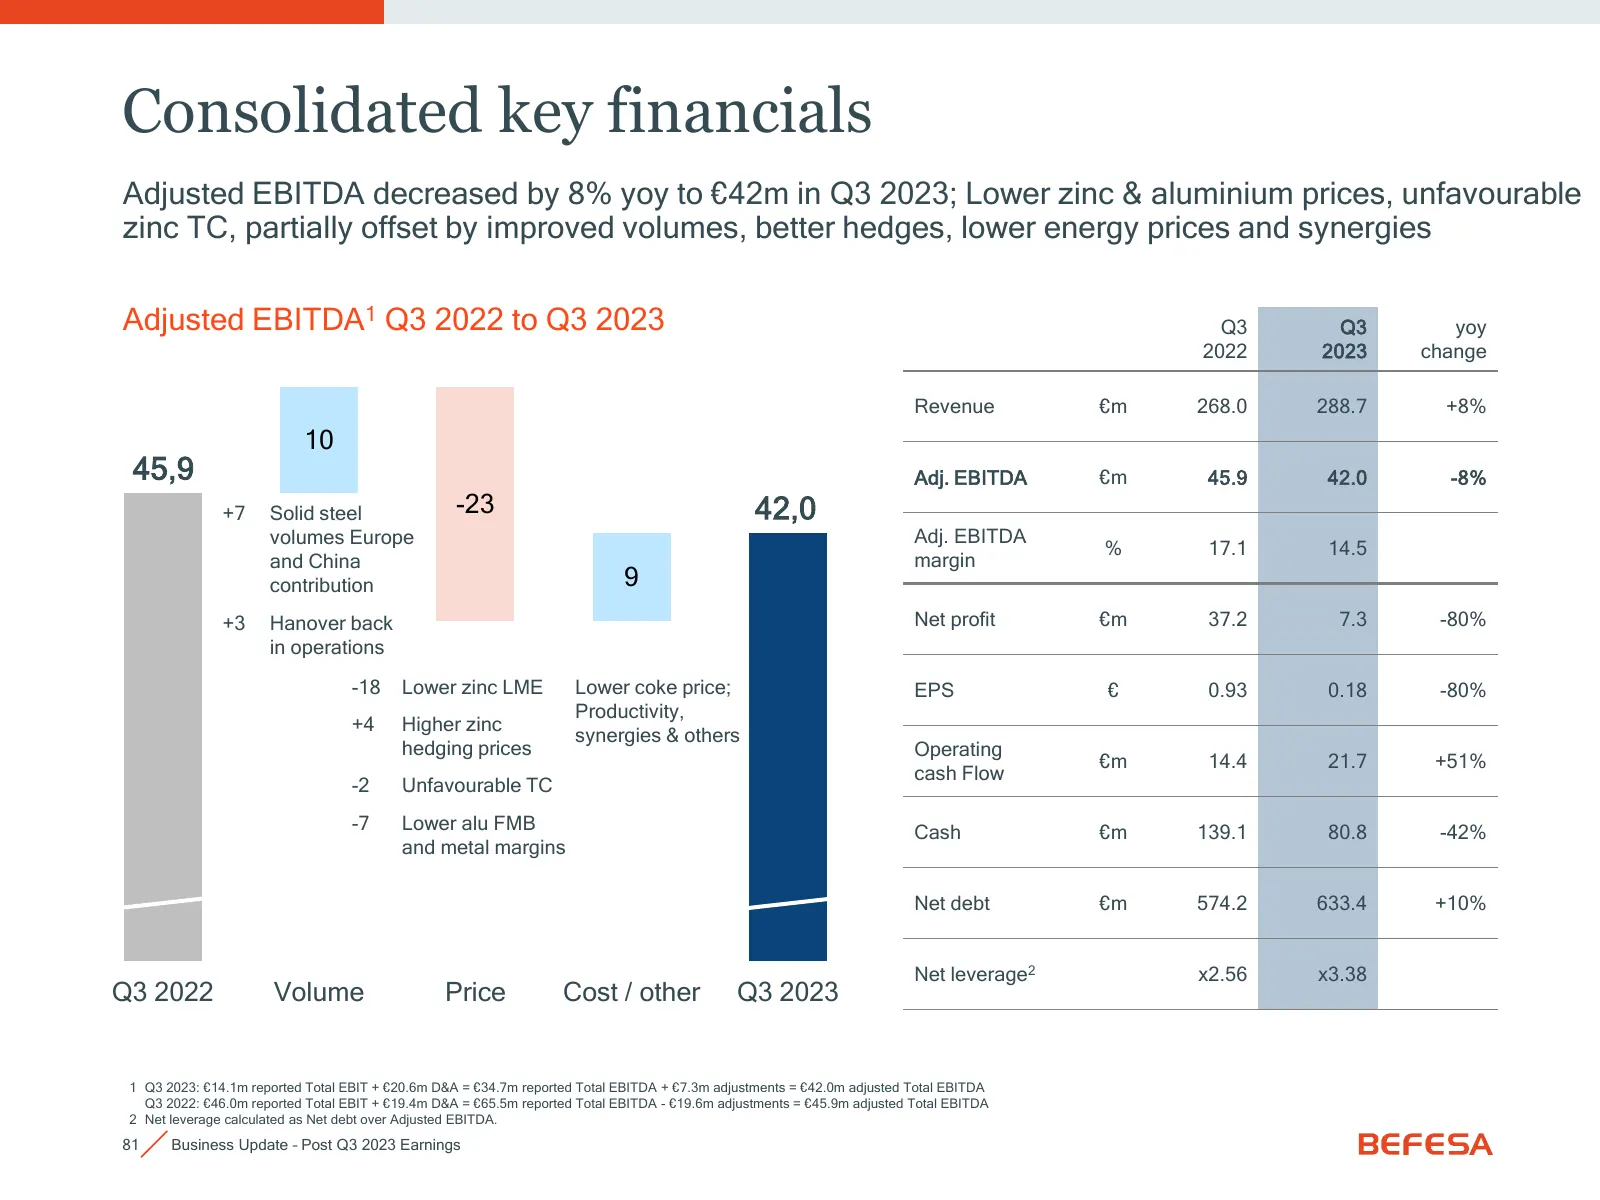
Slide 81: Consolidated key financials
Consolidated key financials Adjusted EBITDA decreased by 8% yoy to €42m in Q3 2023; Lower zinc & aluminium prices, unfavourable zinc TC, partially offset by improved volumes, better hedges, lower energy prices and synergies Adjusted EBITDA1 Q3 2022 to Q3 2023 Q3 Q3 yoy 2022 2023 change Revenue €m 26
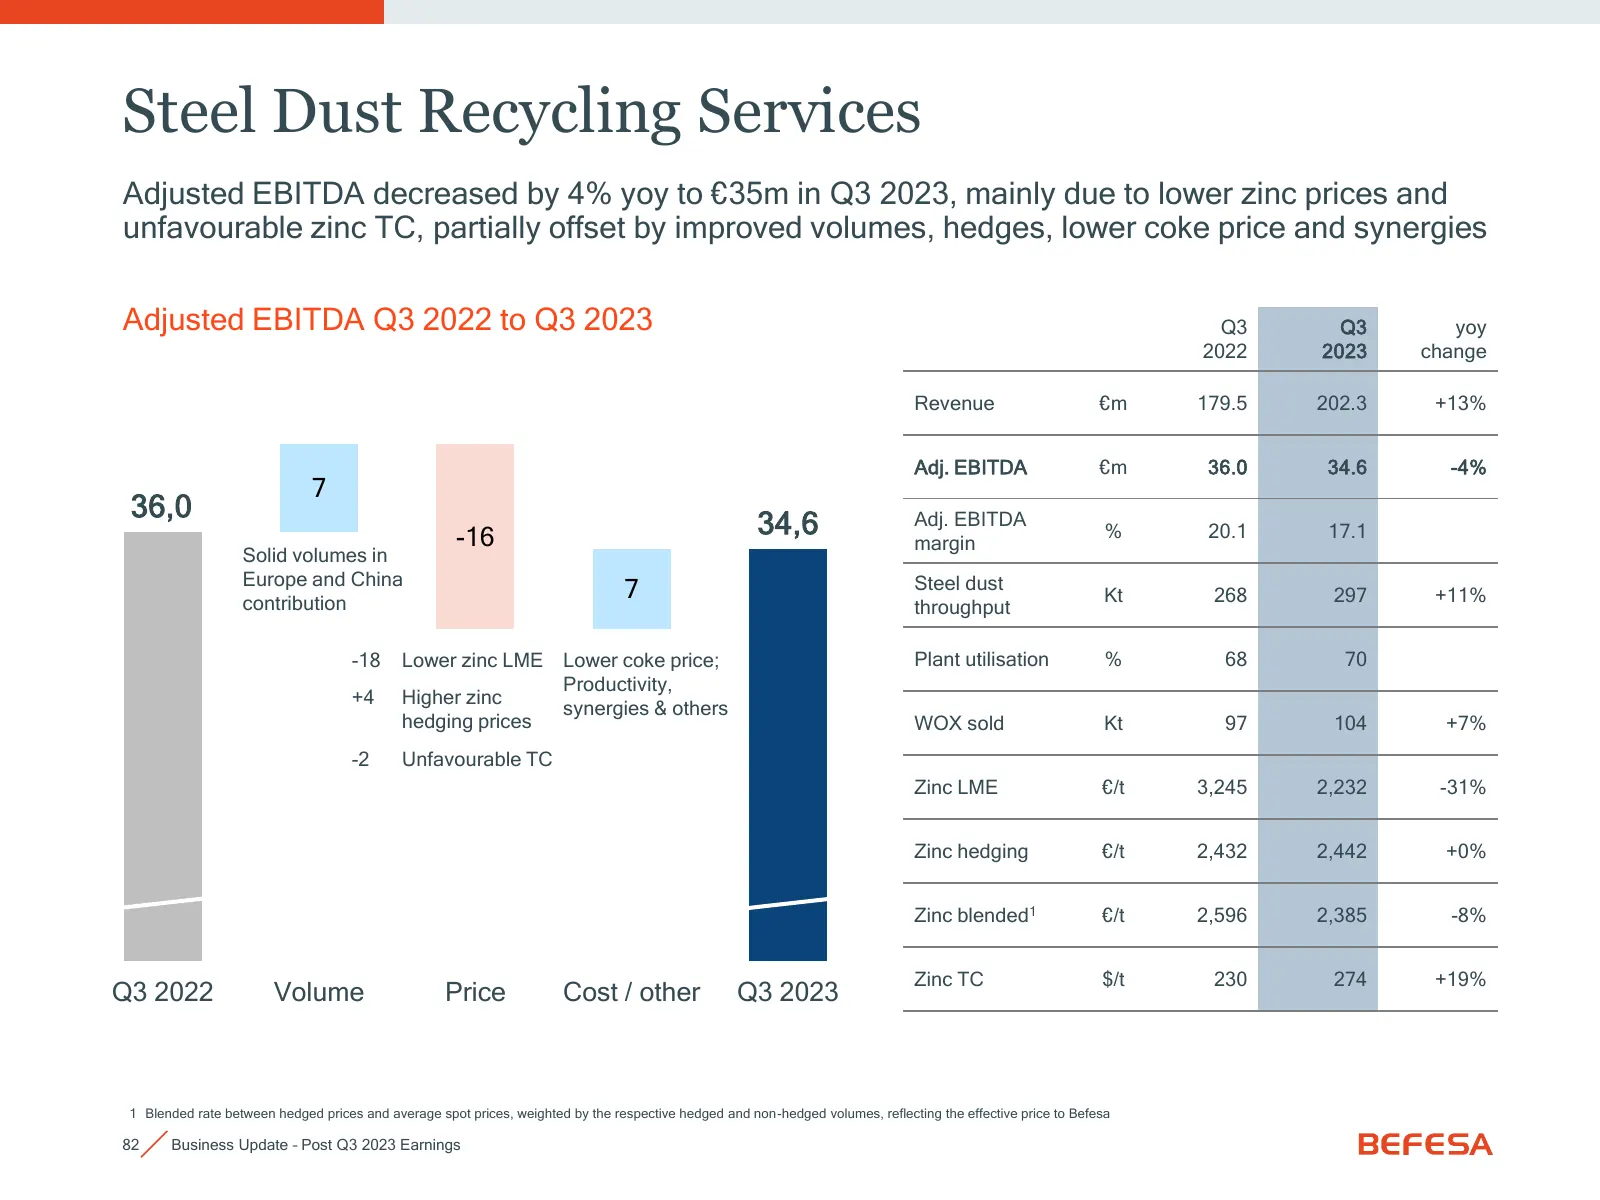
Slide 82: Steel Dust Recycling Services
Steel Dust Recycling Services Adjusted EBITDA decreased by 4% yoy to €35m in Q3 2023, mainly due to lower zinc prices and unfavourable zinc TC, partially offset by improved volumes, hedges, lower coke price and synergies Adjusted EBITDA Q3 2022 to Q3 2023 Q3 Q3 yoy 2022 2023 change Revenue €m 179.5
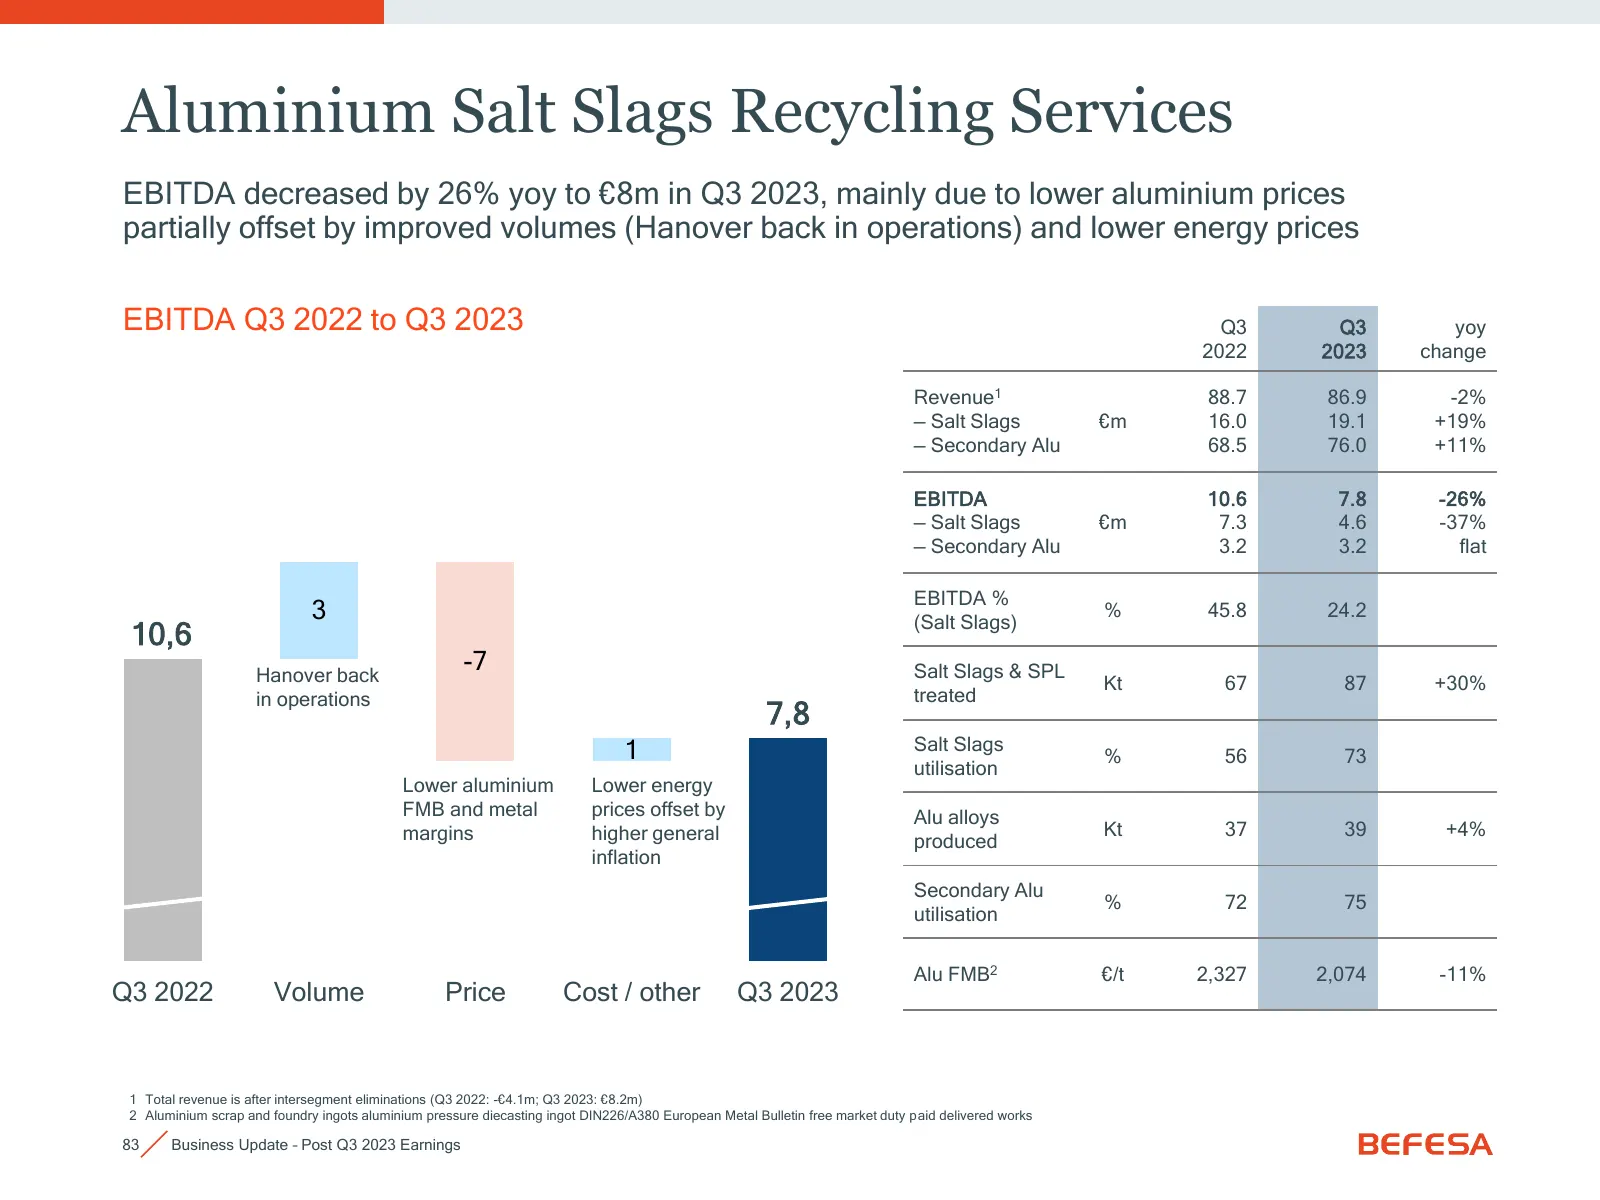
Slide 83: Aluminium Salt Slags Recycling Services
Aluminium Salt Slags Recycling Services EBITDA decreased by 26% yoy to €8m in Q3 2023, mainly due to lower aluminium prices partially offset by improved volumes (Hanover back in operations) and lower energy prices EBITDA Q3 2022 to Q3 2023 Q3 Q3 yoy 2022 2023 change Revenue1 88.7 86.9 -2% — Salt Sla
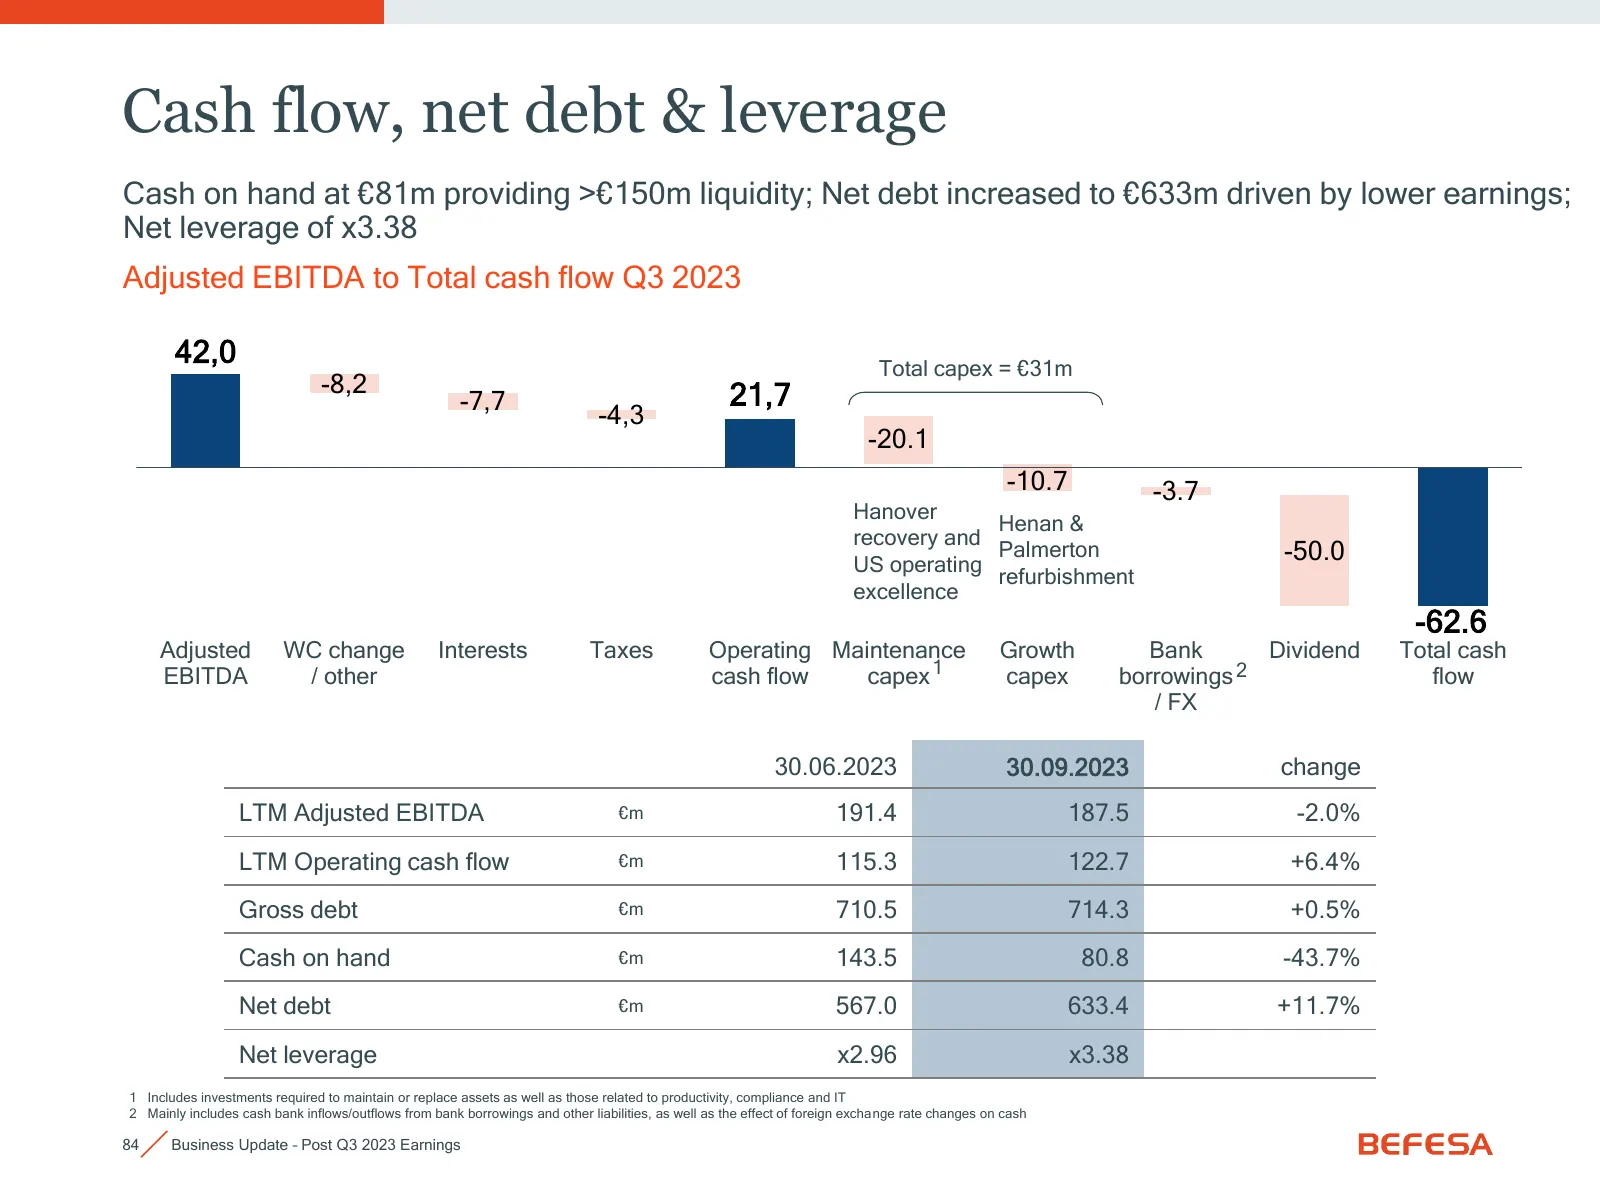
Slide 84: Cash flow, net debt & leverage
Cash flow, net debt & leverage Cash on hand at €81m providing >€150m liquidity; Net debt increased to €633m driven by lower earnings; Net leverage of x3.38 Adjusted EBITDA to Total cash flow Q3 2023 42,0 Total capex = €31m -8,2 21,7 -7,7 -4,3 -20.1 -10.7 -3.7 Hanover Henan & recovery and US operatin
Source: Internet Archive copy of images.befesa.com
More decks from Befesa SA
 Q3 2026 Earnings Presentation12 slides · Oct 29, 2026
 Q3 2026 Earnings Presentation32 slides · Oct 29, 2026
 H1 2026 Earnings Presentation30 slides · Jul 29, 2026
 Investor Presentation (May 2026)11 slides · May 2026
 Q1 2026 Earnings Presentation30 slides · Apr 30, 2026
 FY 2025 Earnings Presentation30 slides · Feb 26, 2026