SRV Yhtiot Oyj · OMXHEX:SRV1V
SRV Yhtiot Oyj — SRV Group — Q1 2010 Earnings Presentation
34 slides from SRV Yhtiot Oyj's earnings presentation, May 5, 2010
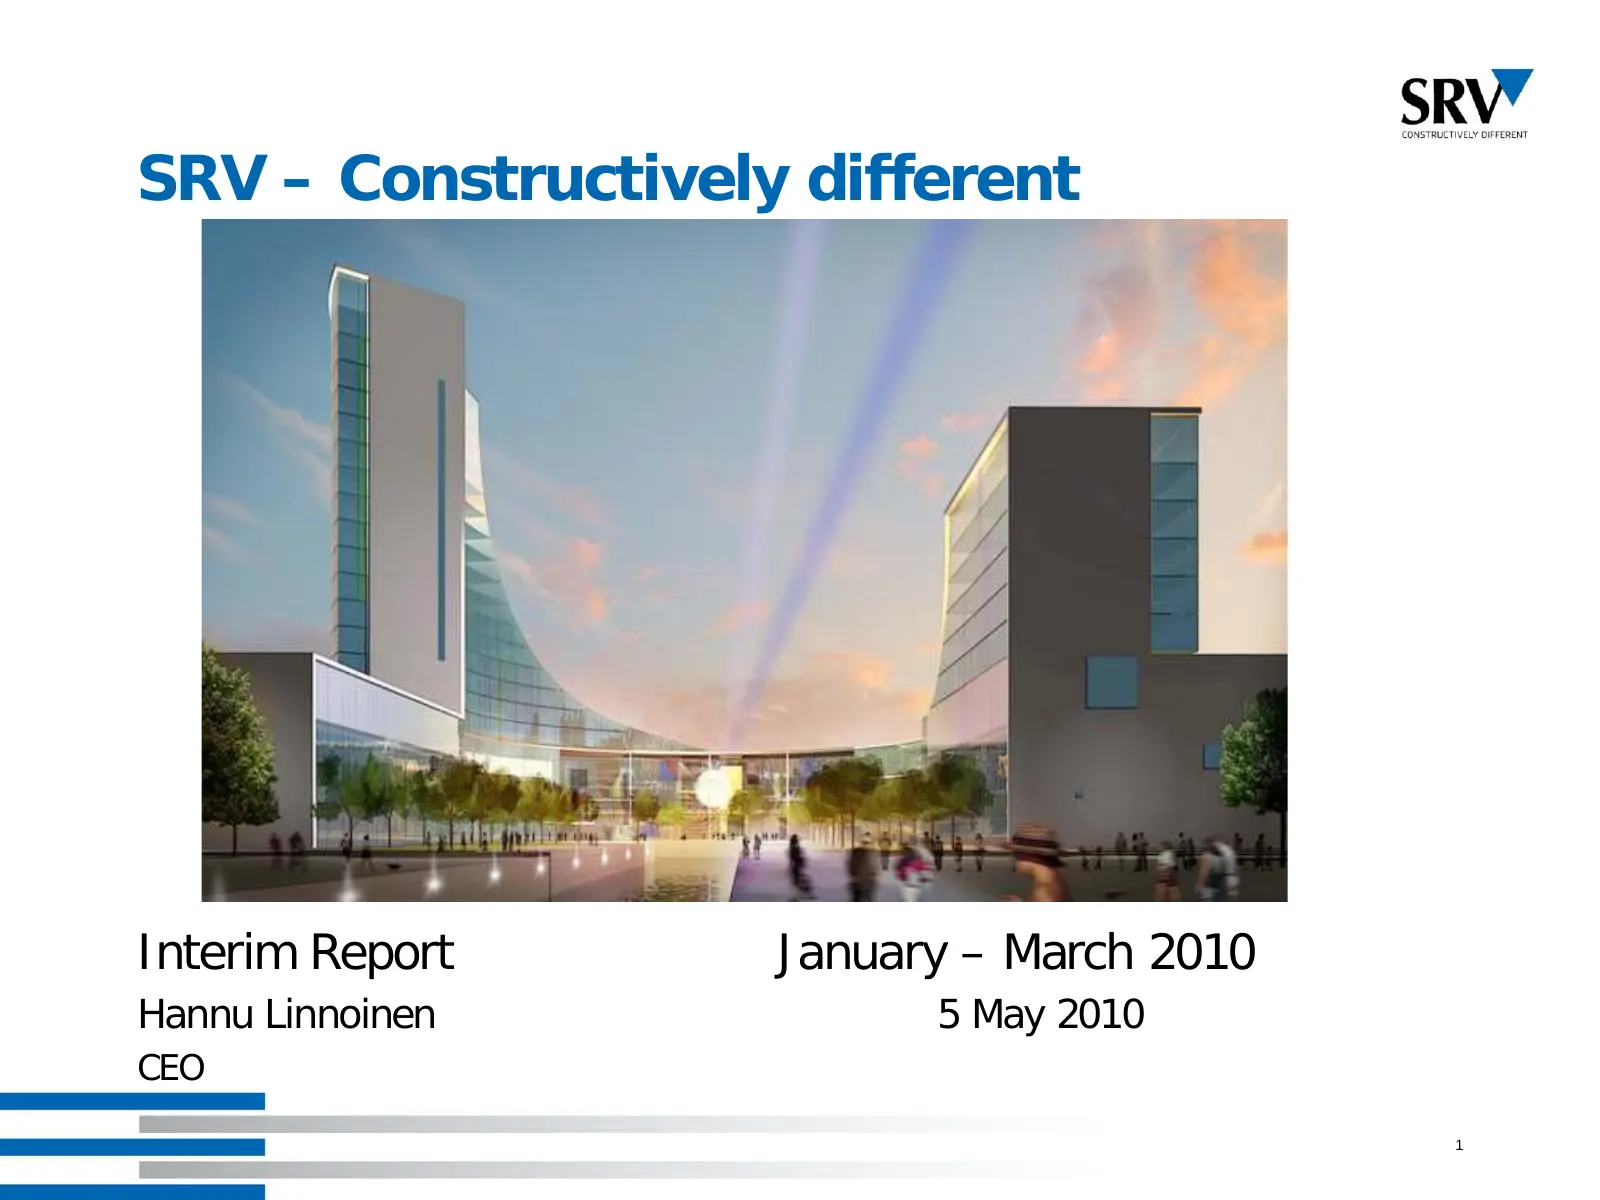
Slide 1: SRV – Constructively different
SRV – Constructively different Interim Report January – March 2010 Hannu Linnoinen 5 May 2010 CEO 1
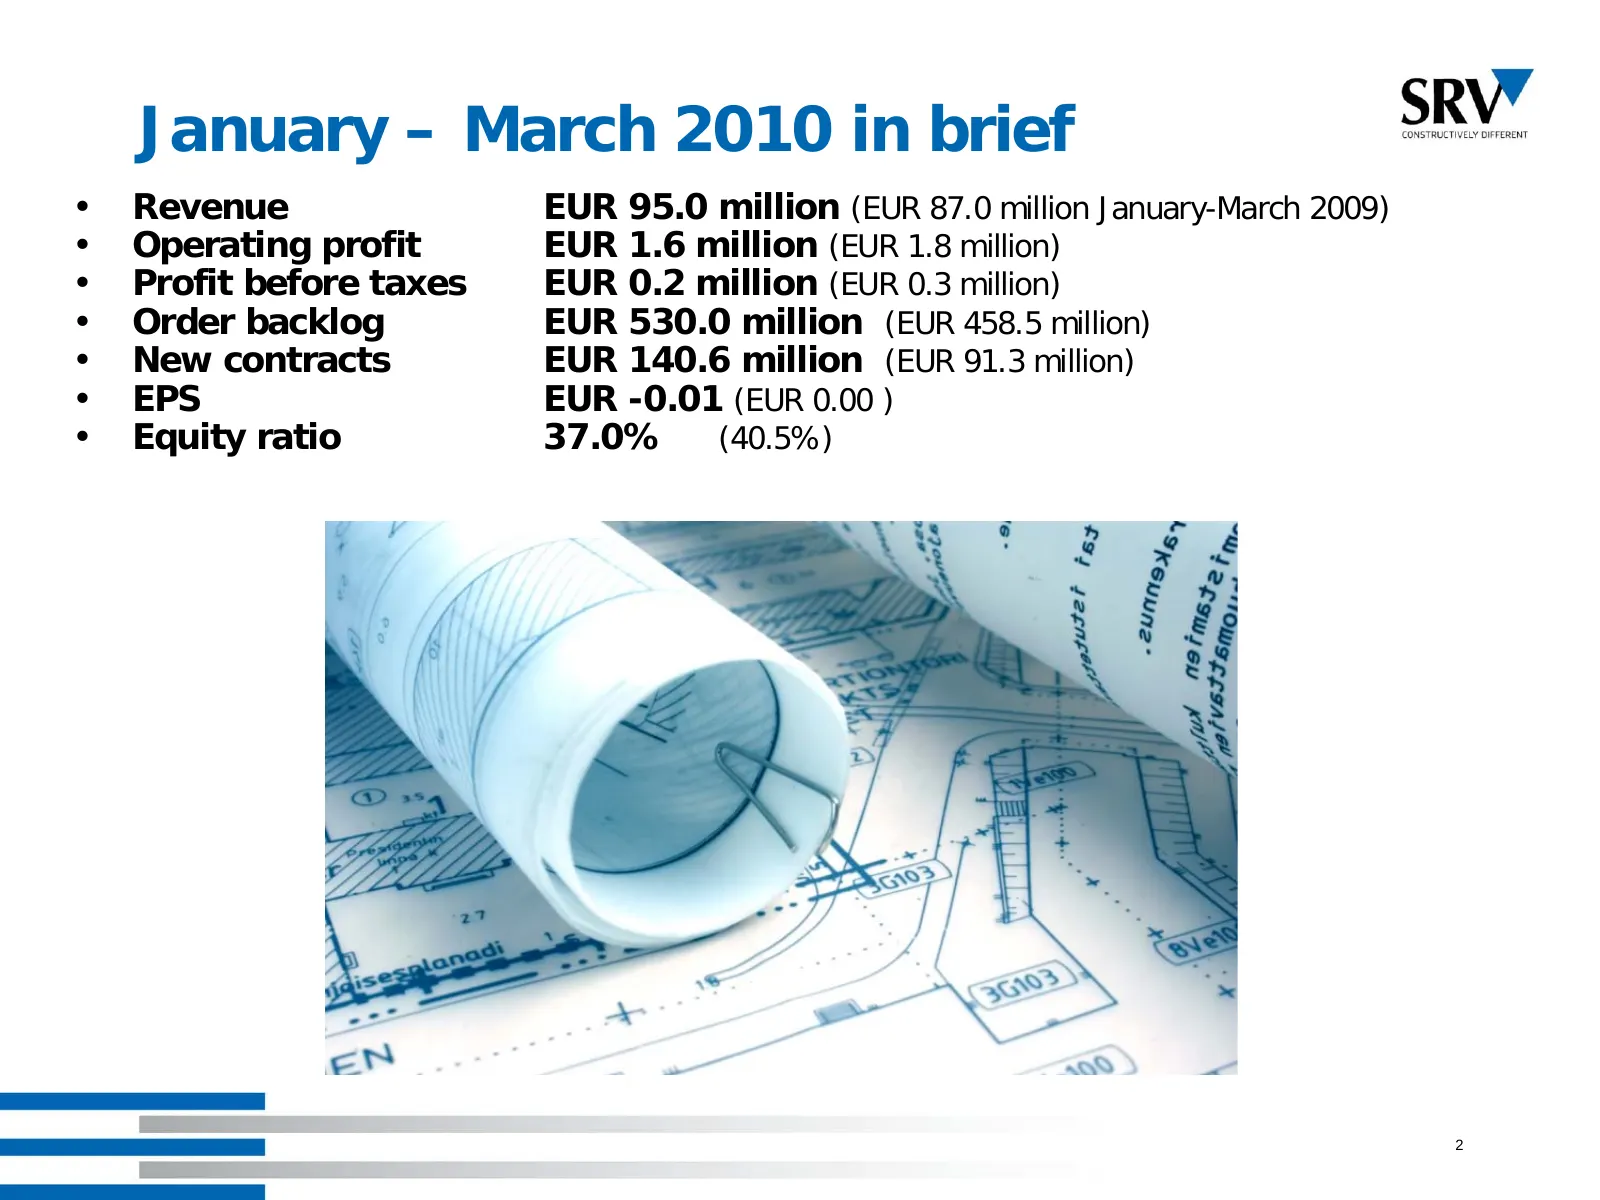
Slide 2: January – March 2010 in brief
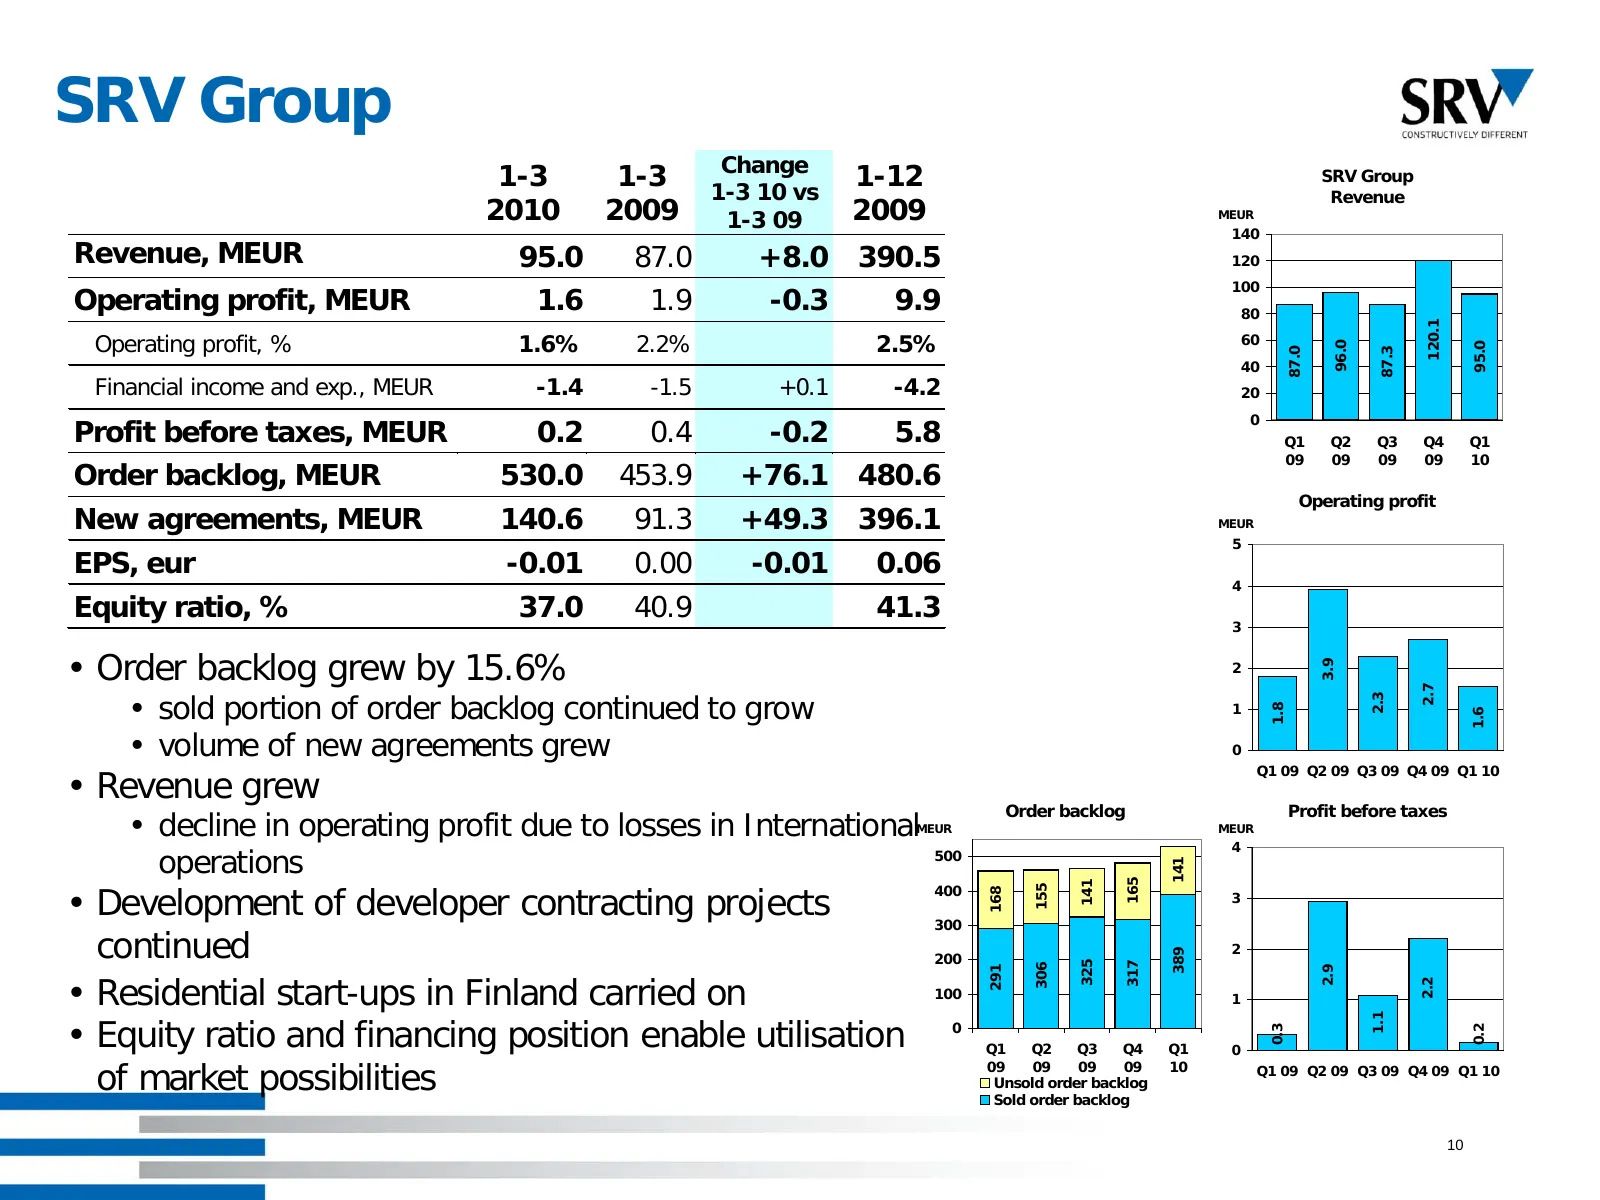
January – March 2010 in brief • Revenue EUR 95.0 million (EUR 87.0 million January-March 2009) • Operating profit EUR 1.6 million (EUR 1.8 million) • Profit before taxes EUR 0.2 million (EUR 0.3 million) • Order backlog EUR 530.0 million (EUR 458.5 million) • New contracts EUR 140.6 million (EUR 91.
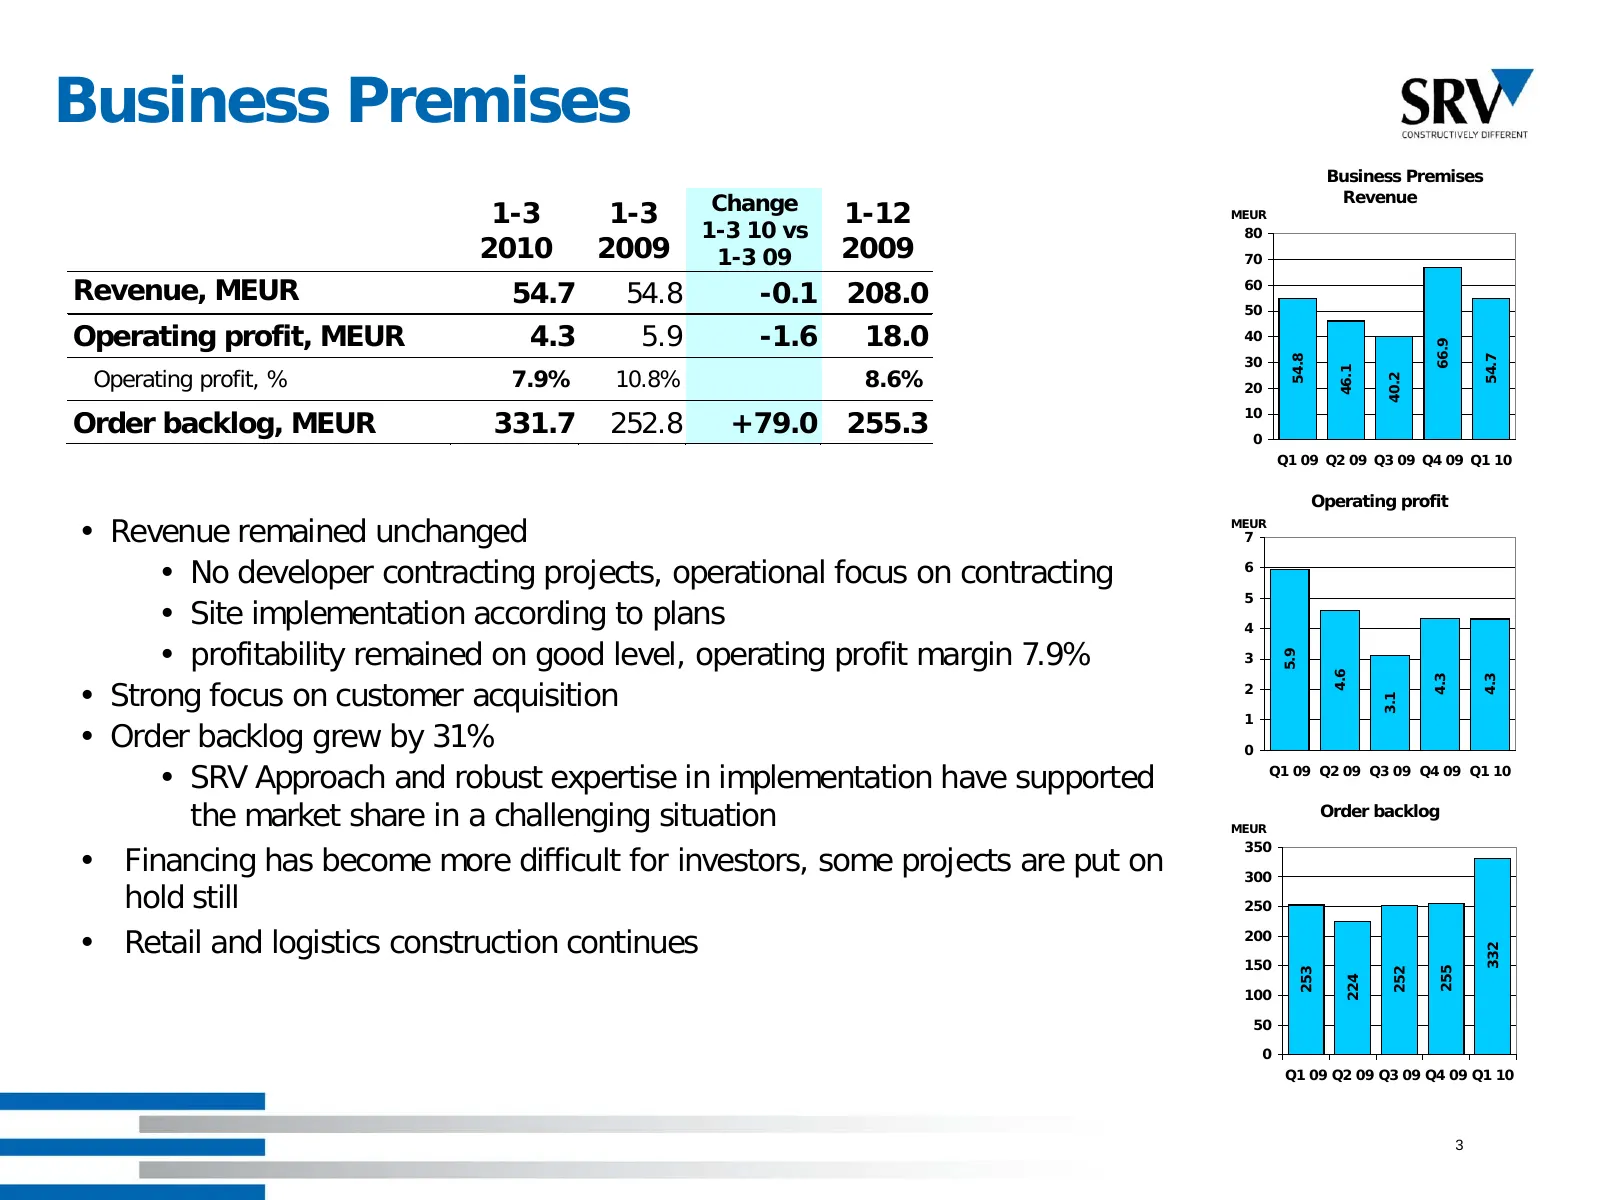
Slide 3: Business Premises
Business Premises Business Premises Change Revenue 1-3 1-3 1-12 MEUR 1-3 10 vs 80 2010 2009 1-3 09 2009 70 Revenue, MEUR 54.7 54.8 -0.1 208.0 60 50 Operating profit, MEUR 4.3 5.9 -1.6 18.0 40 66.9 30 54.8 54.7 Operating profit, % 7.9% 10.8% 8.6% 46.1 40.2 20 Order backlog, MEUR 331.7 252.8 +79.0 255
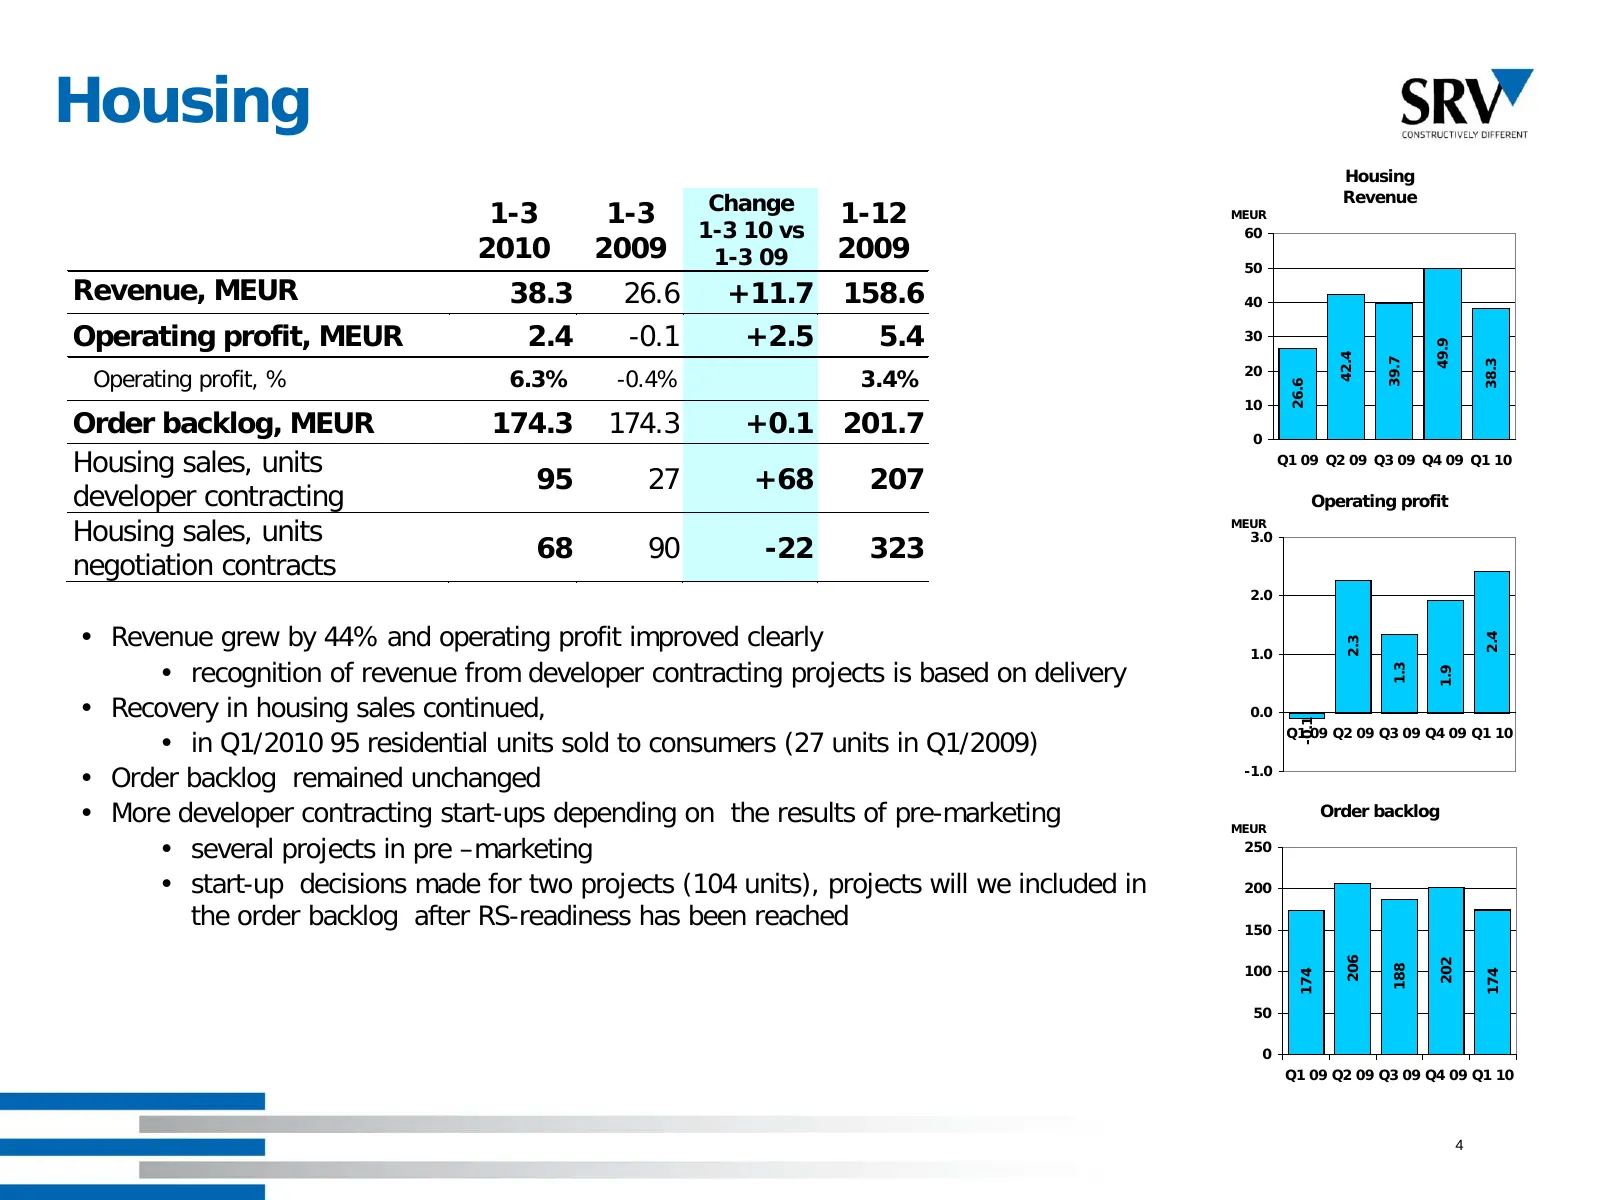
Slide 4: Housing
Housing Housing Change Revenue 1-3 1-3 1-12 MEUR 1-3 10 vs 60 2010 2009 1-3 09 2009 50 Revenue, MEUR 38.3 26.6 +11.7 158.6 40 Operating profit, MEUR 2.4 -0.1 +2.5 5.4 30 49.9 42.4 39.7 38.3 20 Operating profit, % 6.3% -0.4% 3.4% 26.6 10 Order backlog, MEUR 174.3 174.3 +0.1 201.7 0 Housing sales, uni
Slide 5: Housing market in Helsinki metropolitan area
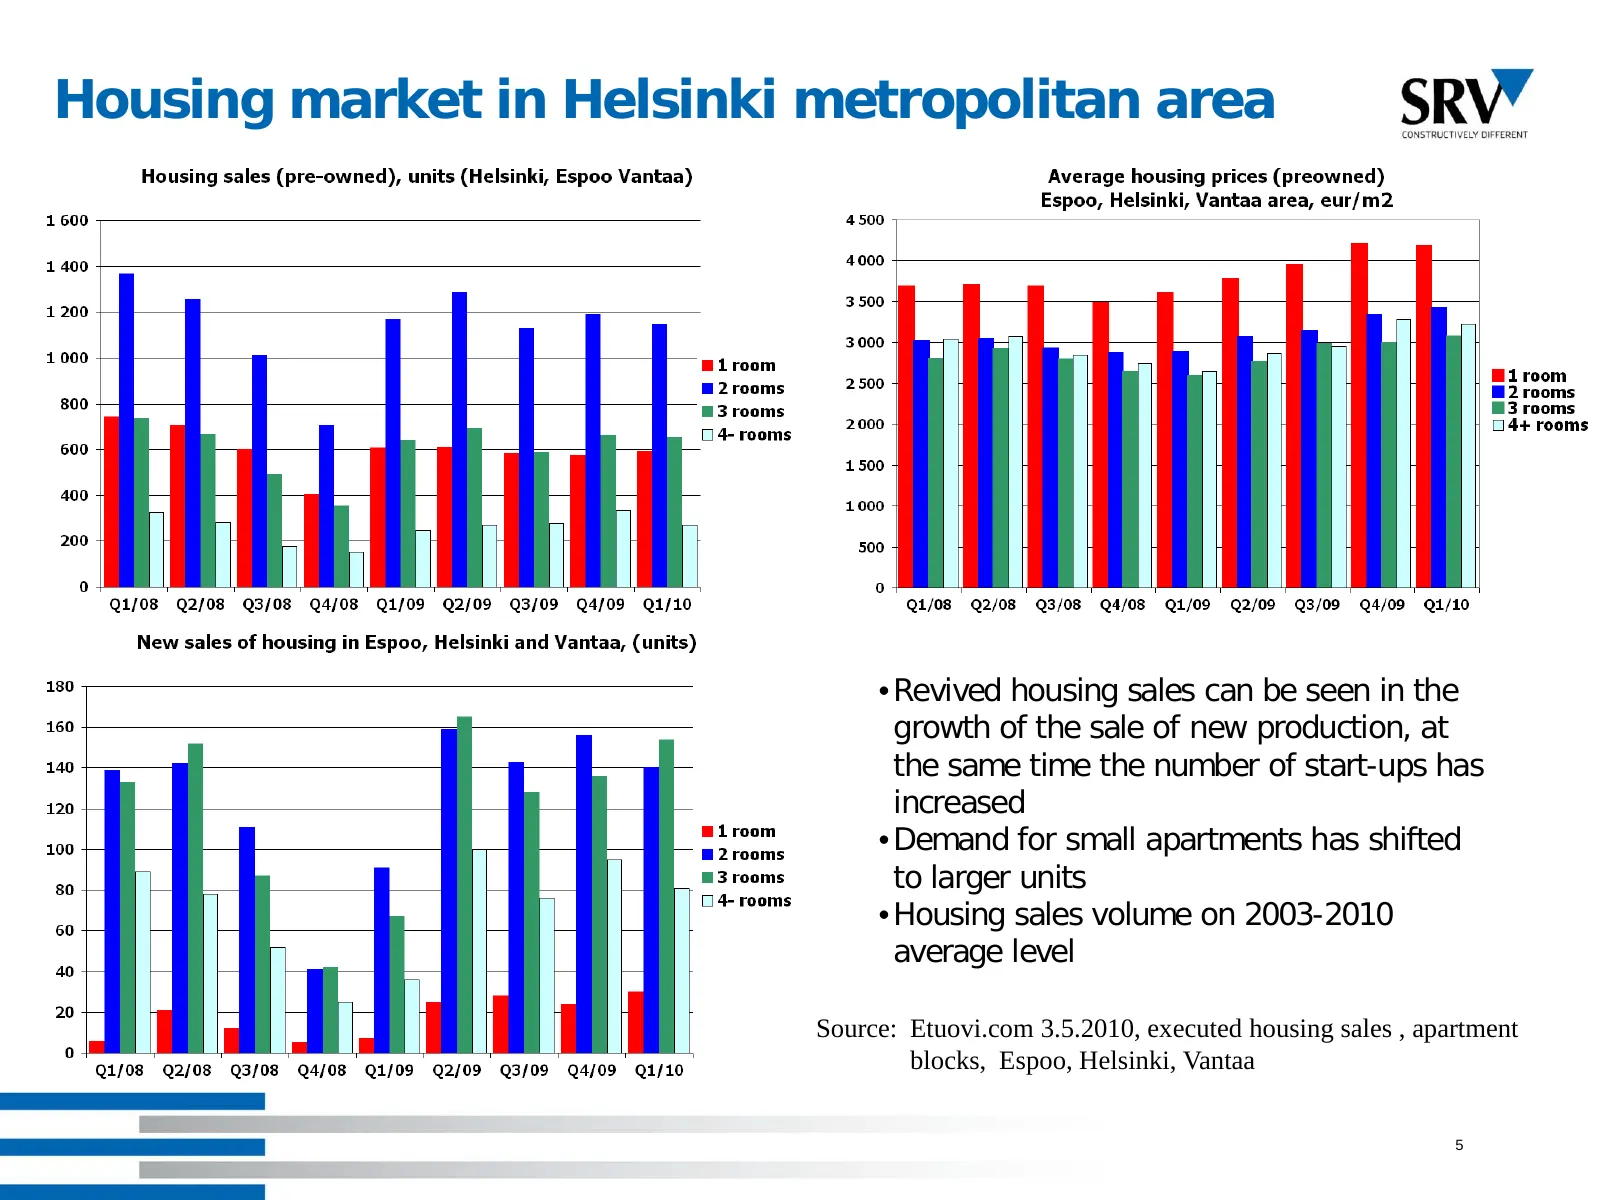
Housing market in Helsinki metropolitan area • Revived housing sales can be seen in the growth of the sale of new production, at the same time the number of start-ups has increased • Demand for small apartments has shifted to larger units • Housing sales volume on 2003-2010 average level Source: Etu
Slide 6: Housing
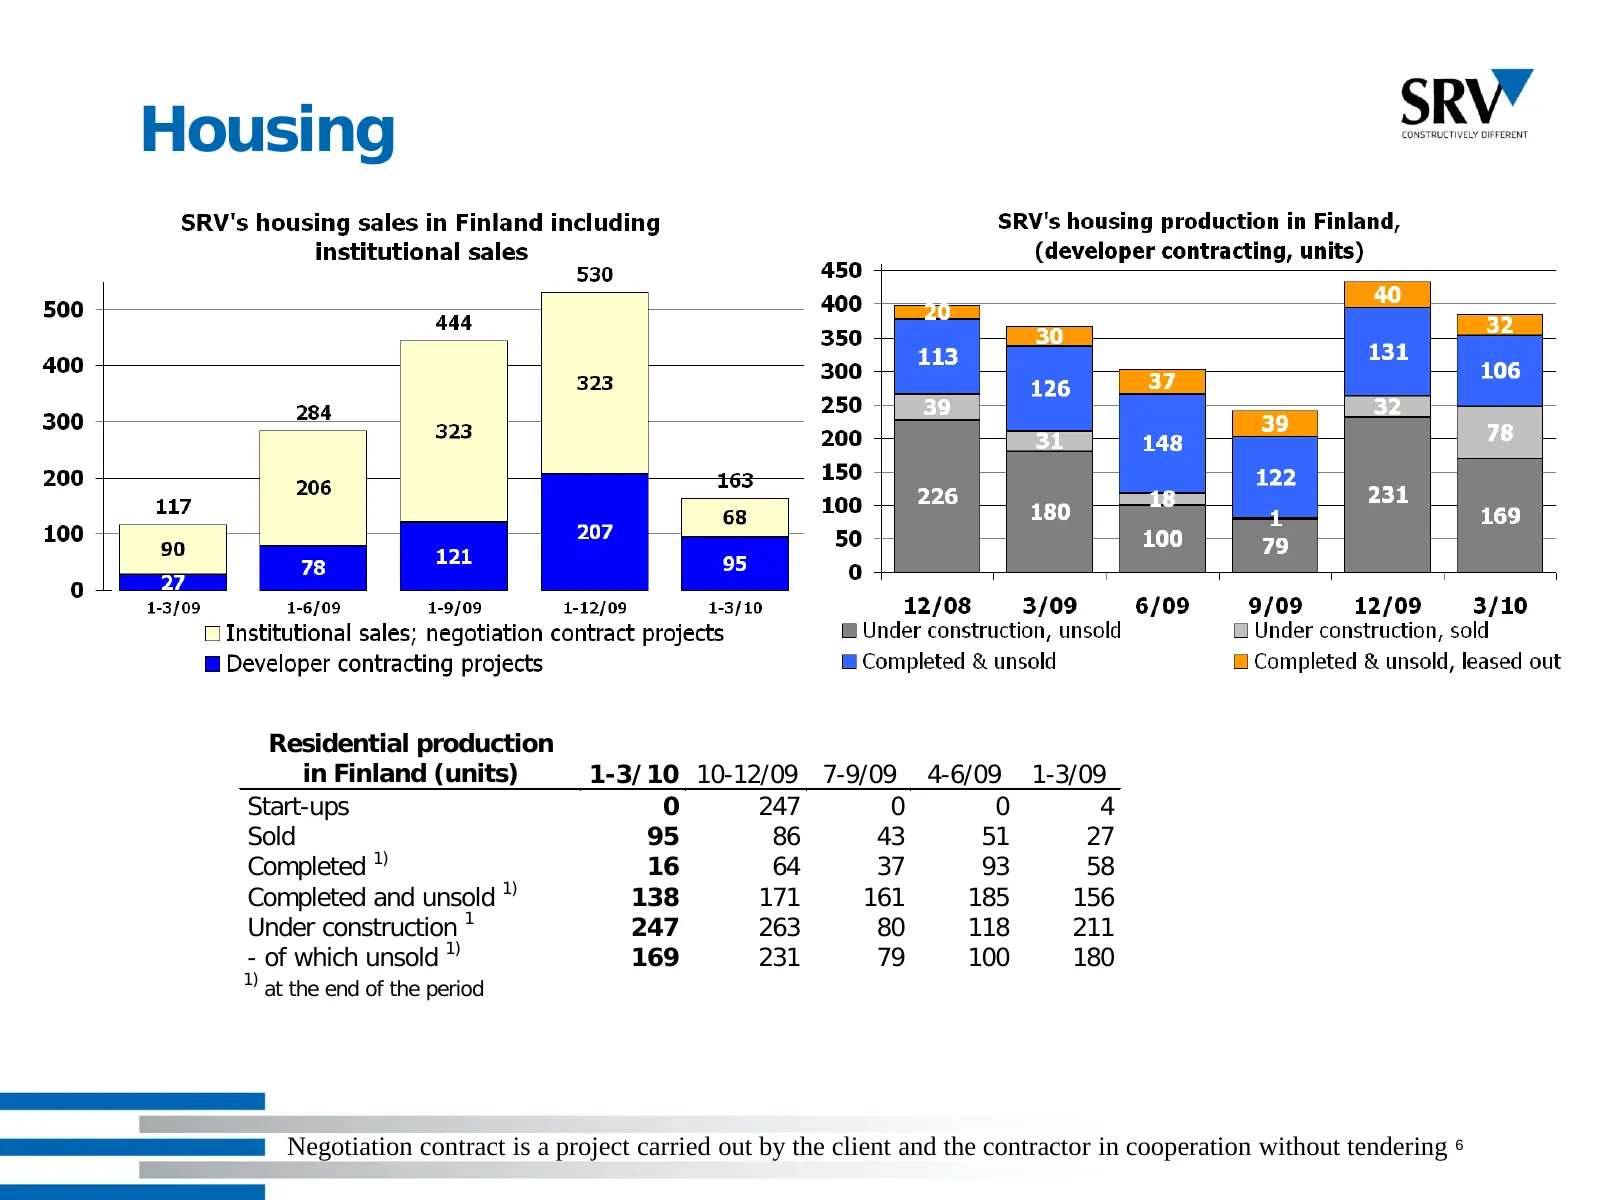
Housing Residential production in Finland (units) 1-3/10 10-12/09 7-9/09 4-6/09 1-3/09 Start-ups 0 247 0 0 4 Sold 95 86 43 51 27 Completed 1) 16 64 37 93 58 Completed and unsold 1) 138 171 161 185 156 Under construction 1 247 263 80 118 211 - of which unsold 1) 169 231 79 100 180 1) at the end of th
Slide 7: International
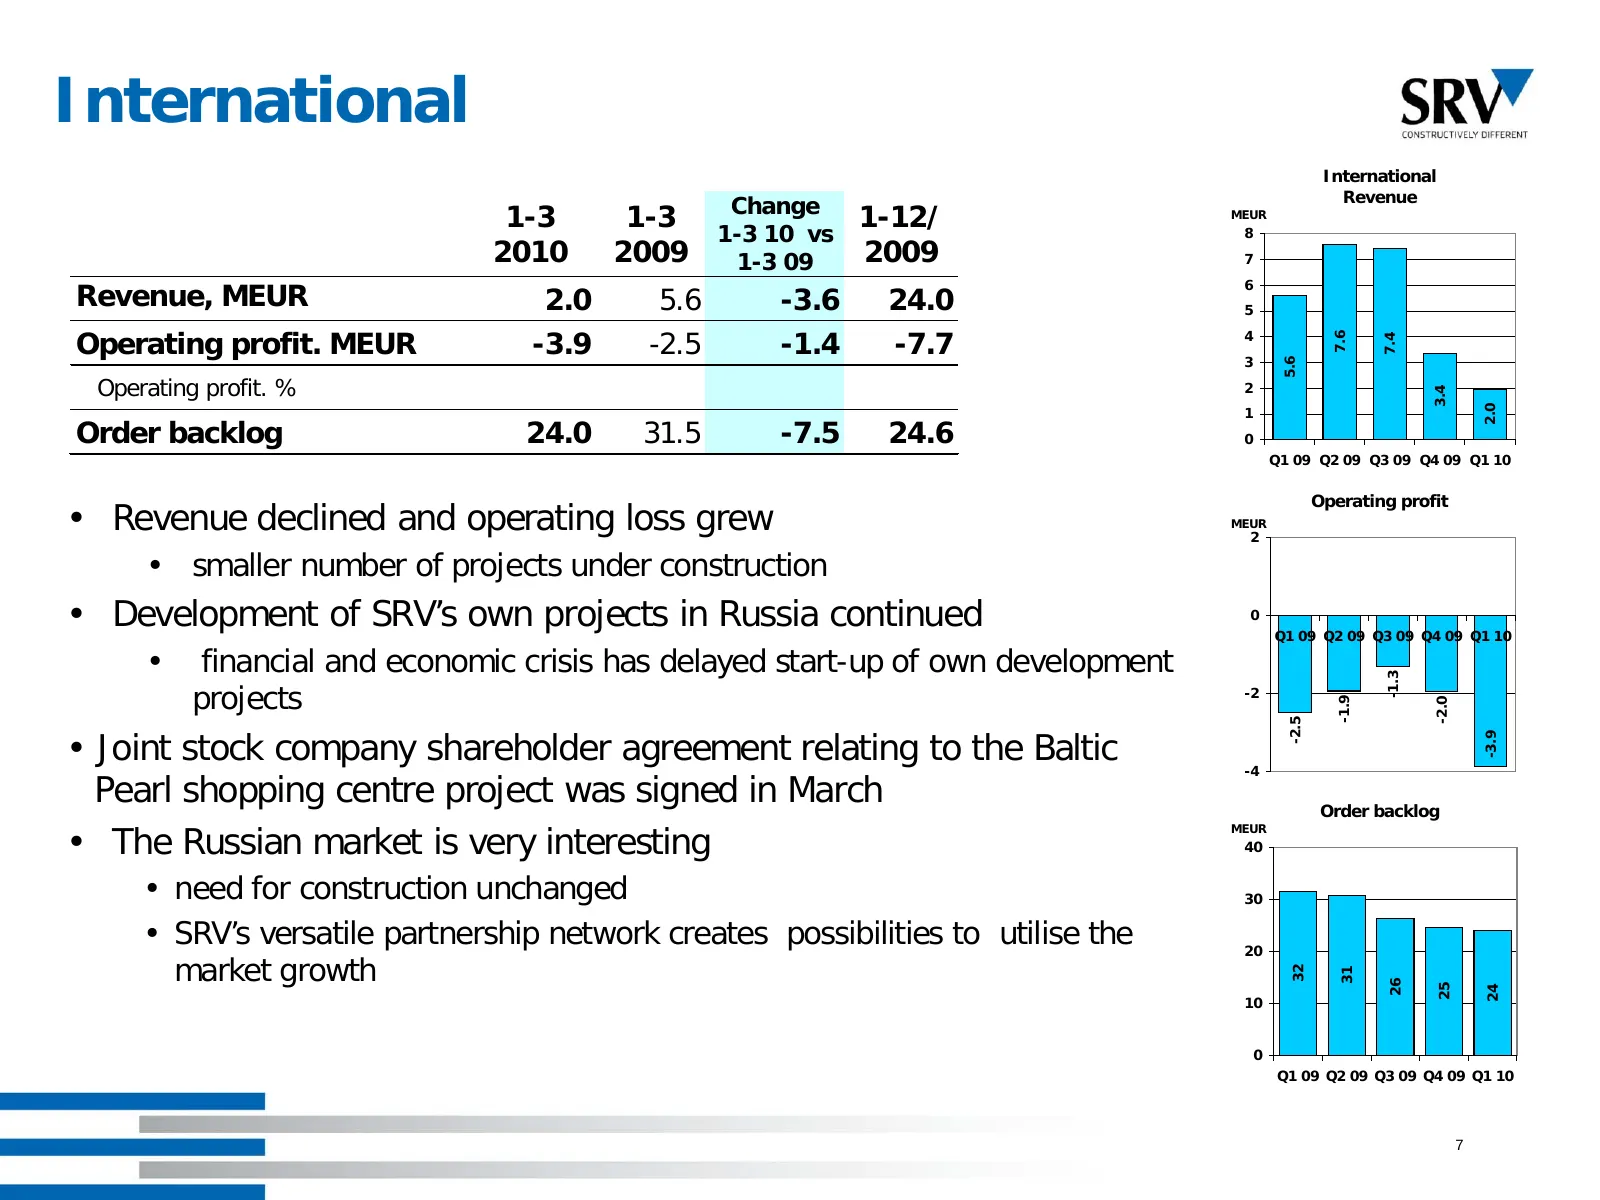
International International Revenue Change 1-3 1-3 1-12/ MEUR 1-3 10 vs 8 2010 2009 1-3 09 2009 7 Revenue, MEUR 6 2.0 5.6 -3.6 24.0 5 Operating profit. MEUR -3.9 -2.5 -1.4 -7.7 4 7.6 7.4 3 5.6 Operating profit. % 2 3.4 2.0 1 Order backlog 24.0 31.5 -7.5 24.6 0 Q1 09 Q2 09 Q3 09 Q4 09 Q1 10 Operating
Slide 8: Baltic Pearl –shopping centre project
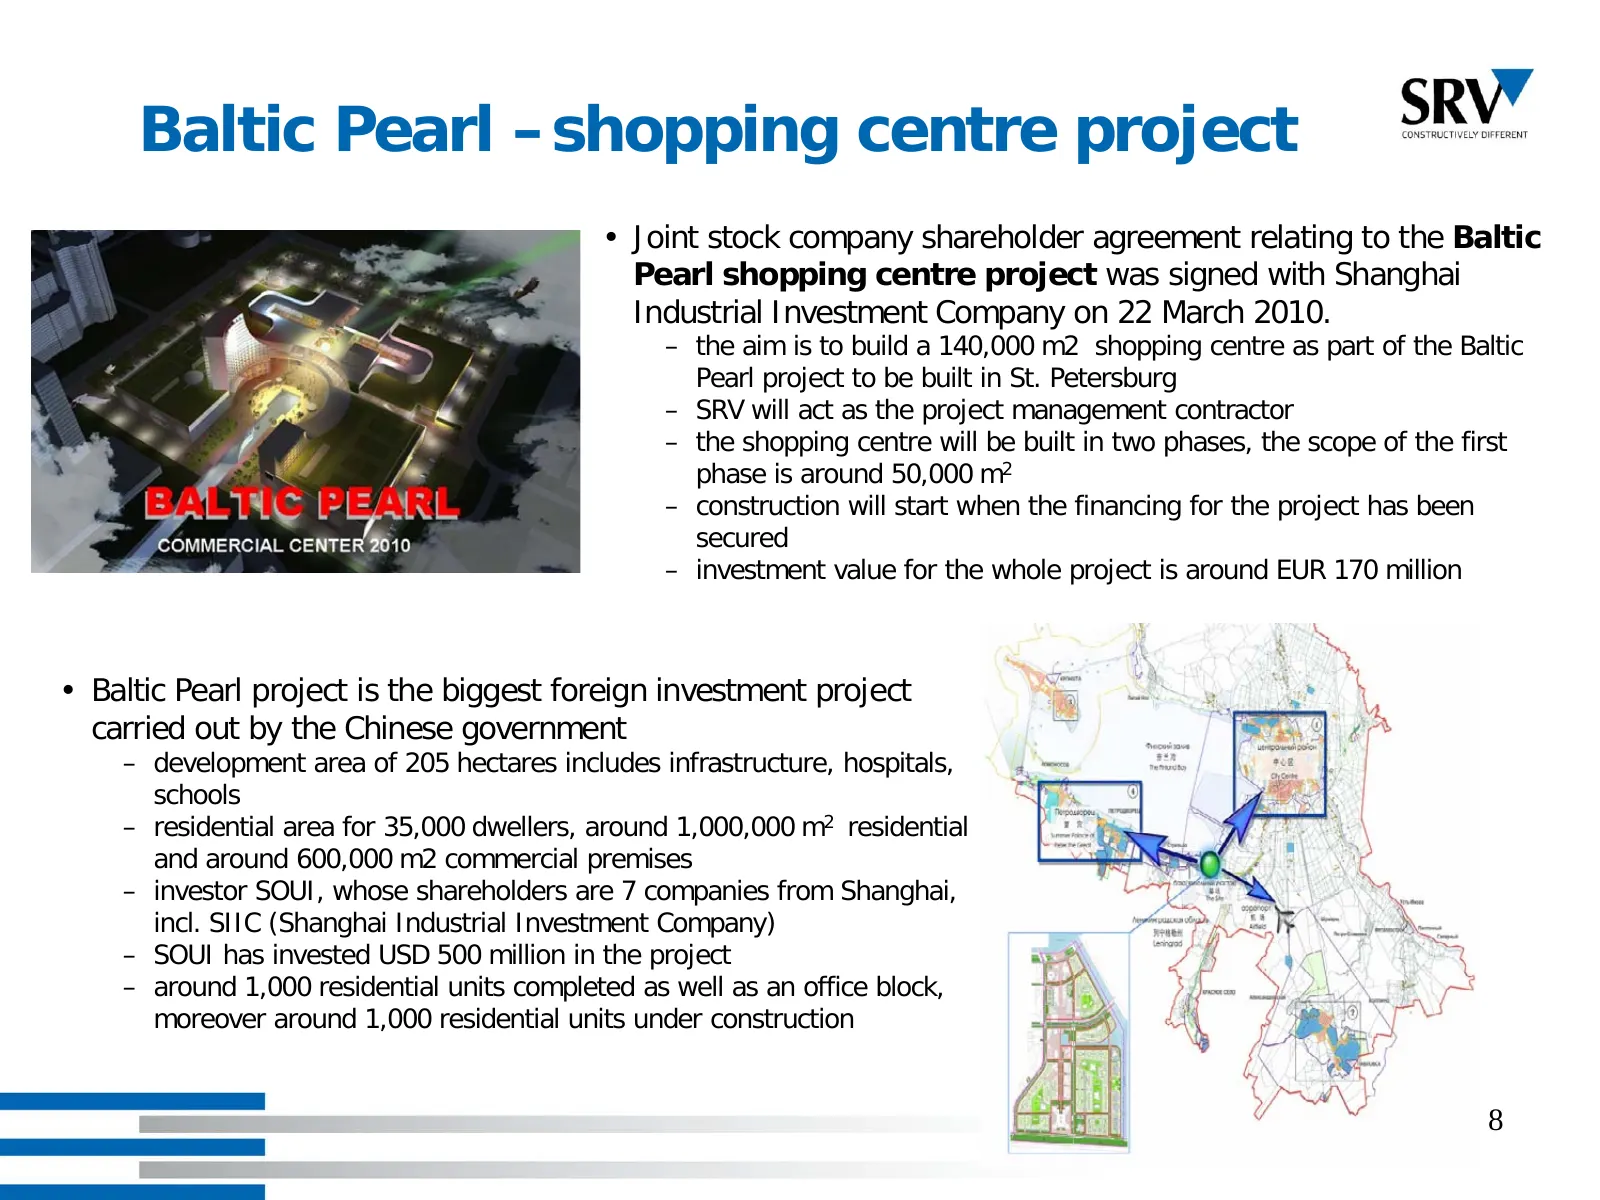
Baltic Pearl –shopping centre project • Joint stock company shareholder agreement relating to the Baltic Pearl shopping centre project was signed with Shanghai Industrial Investment Company on 22 March 2010. – the aim is to build a 140,000 m2 shopping centre as part of the Baltic Pearl project to be
Slide 9: VTB fund cooperation and Septem City
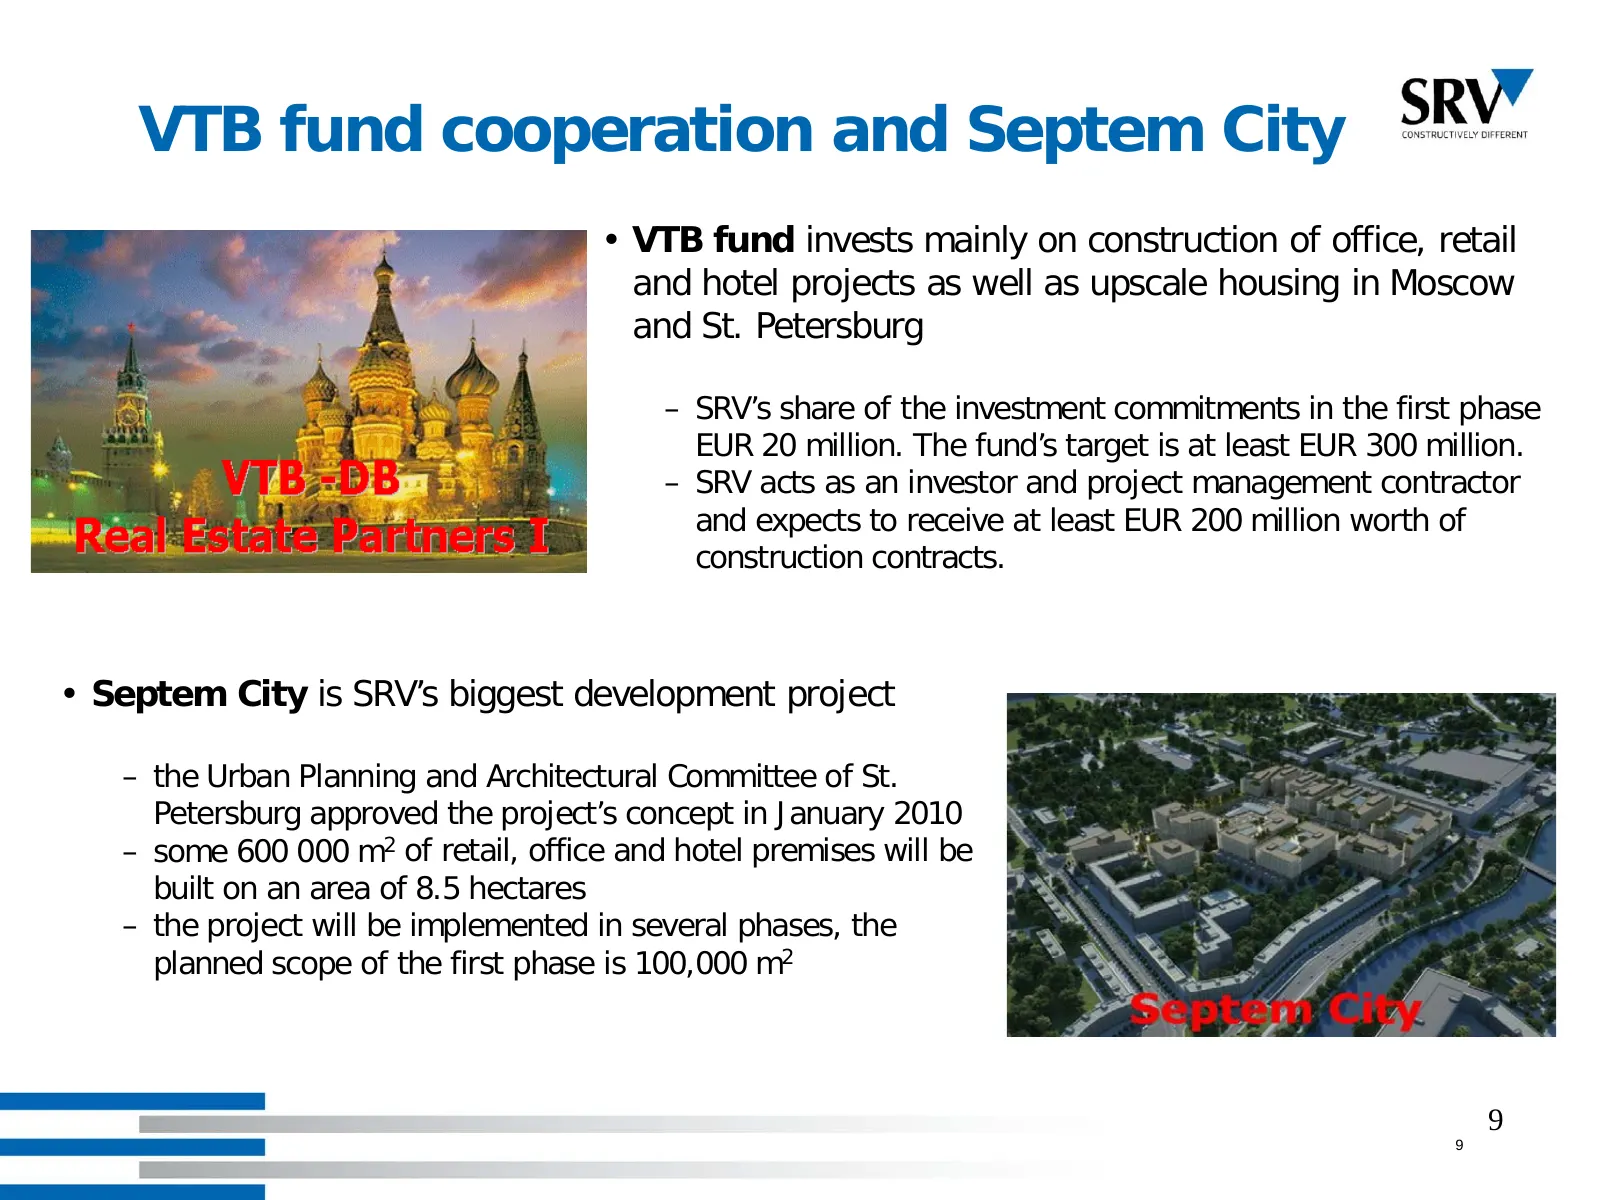
VTB fund cooperation and Septem City • VTB fund invests mainly on construction of office, retail and hotel projects as well as upscale housing in Moscow and St. Petersburg – SRV’s share of the investment commitments in the first phase EUR 20 million. The fund’s target is at least EUR 300 million. –
Slide 10: SRV Group
SRV Group Change 1-3 1-3 1-12 SRV Group 1-3 10 vs Revenue 2010 2009 1-3 09 2009 MEUR 140 Revenue, MEUR 95.0 87.0 +8.0 390.5 120 100 Operating profit, MEUR 1.6 1.9 -0.3 9.9 80 120.1 Operating profit, % 1.6% 2.2% 2.5% 60 96.0 95.0 87.3 87.0 40 Financial income and exp., MEUR -1.4 -1.5 +0.1 -4.2 20 0 P
Slide 11: Order backlog by segment
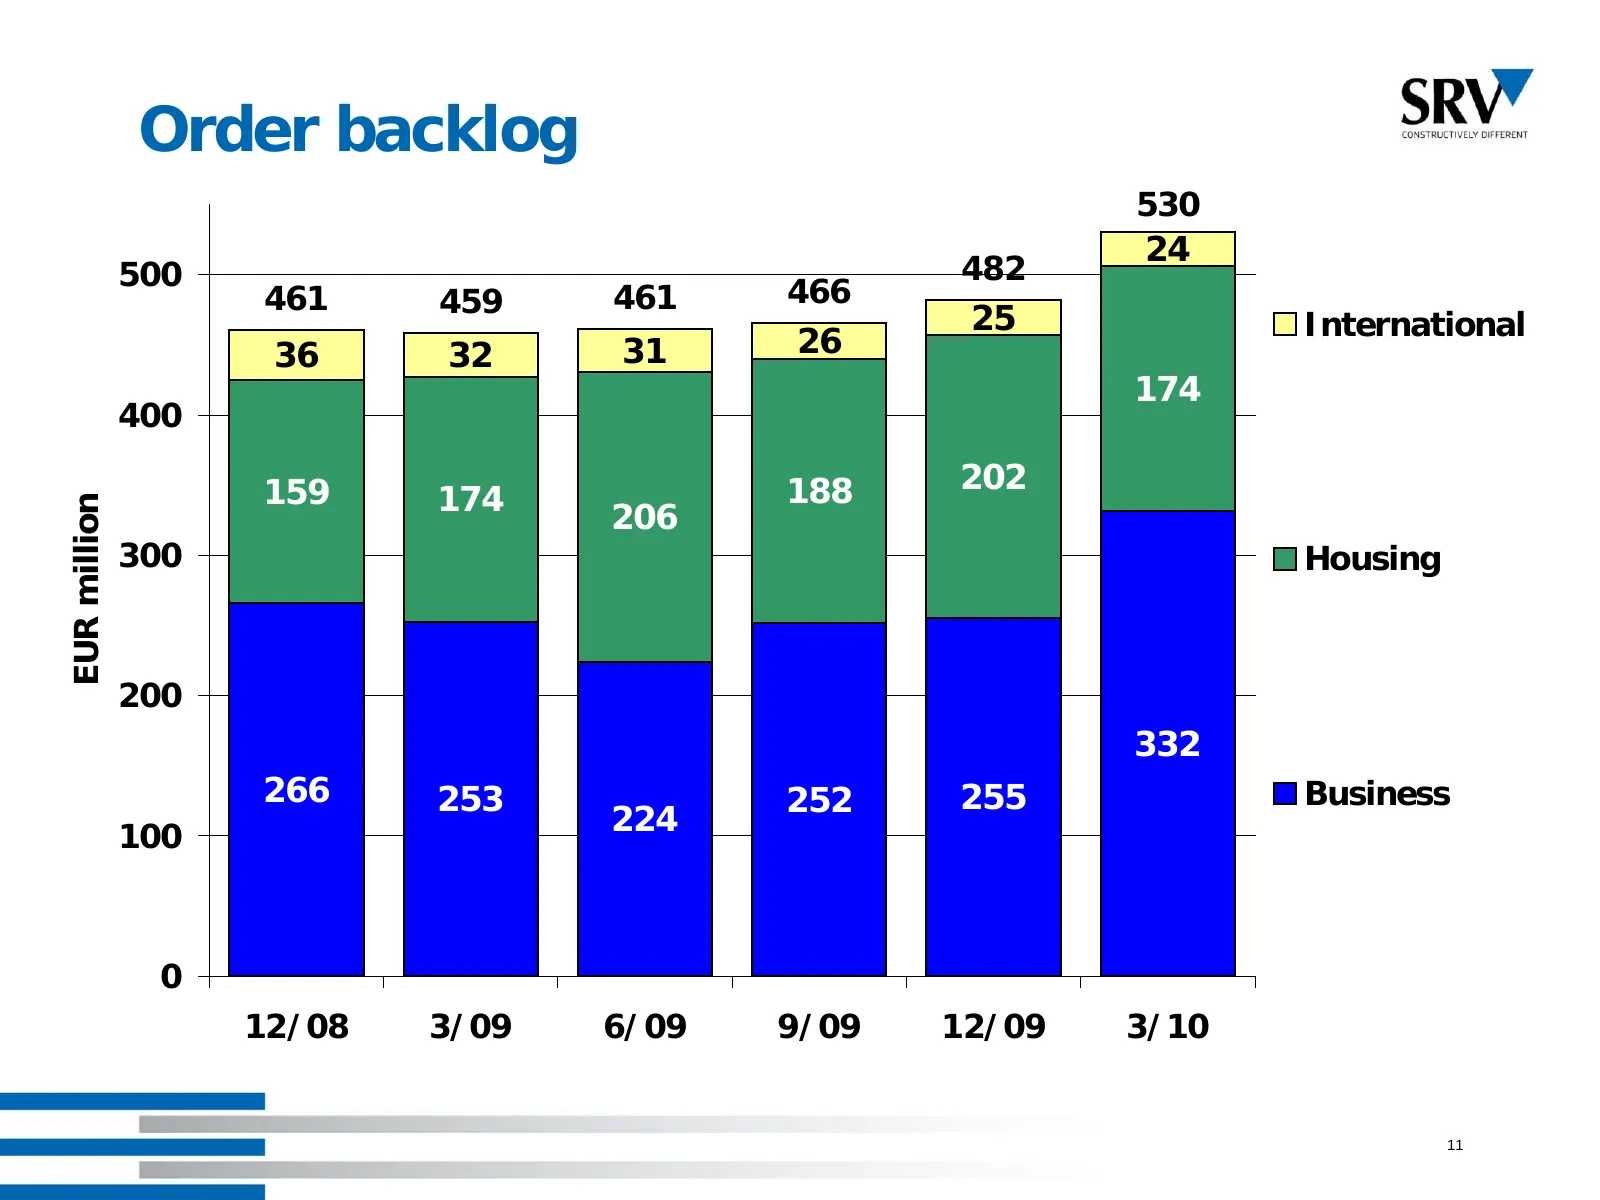
Order backlog 530 24 500 482 461 459 461 466 25 International 36 32 31 26 174 400 159 188 202 174 206 EUR million 300 Housing 200 332 266 253 252 255 Business 100 224 0 12/08 3/09 6/09 9/09 12/09 3/10 11
Slide 12: Competitive edge: SRV Approach
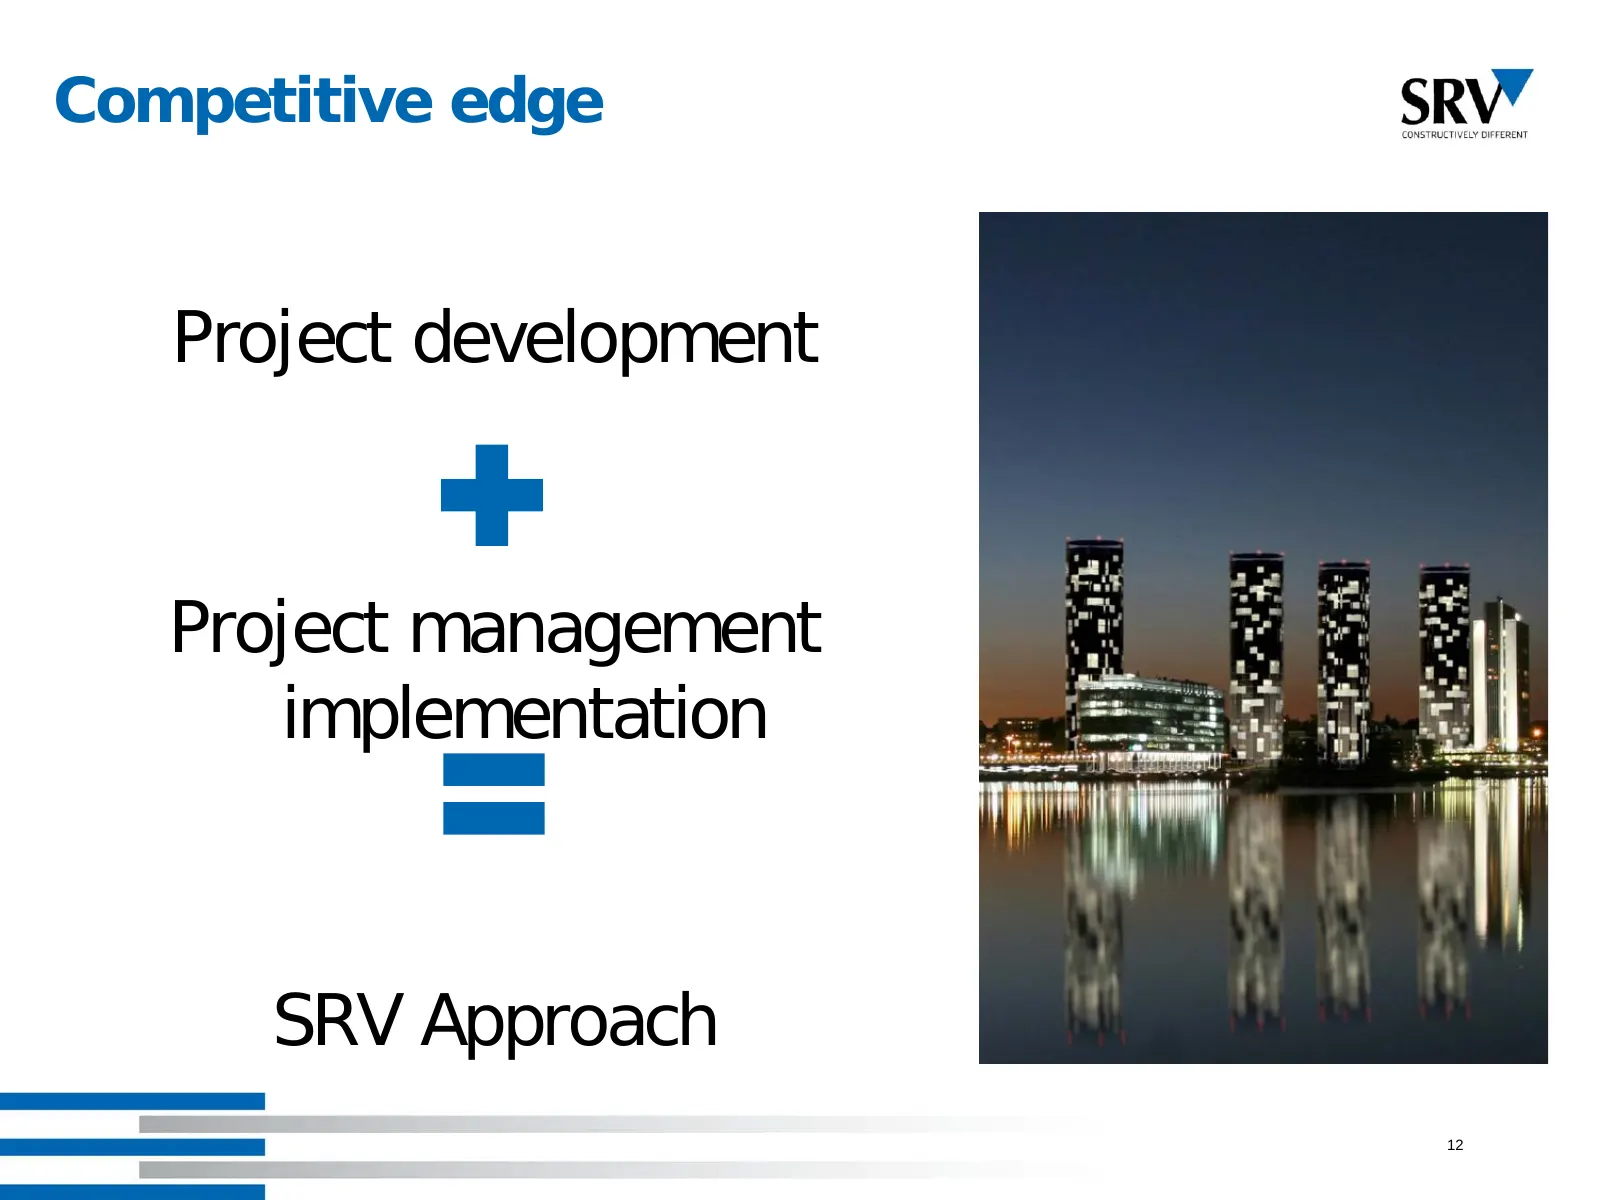
Competitive edge Project development Project management implementation SRV Approach 12
Slide 13: Project Development: versatile business portfolio
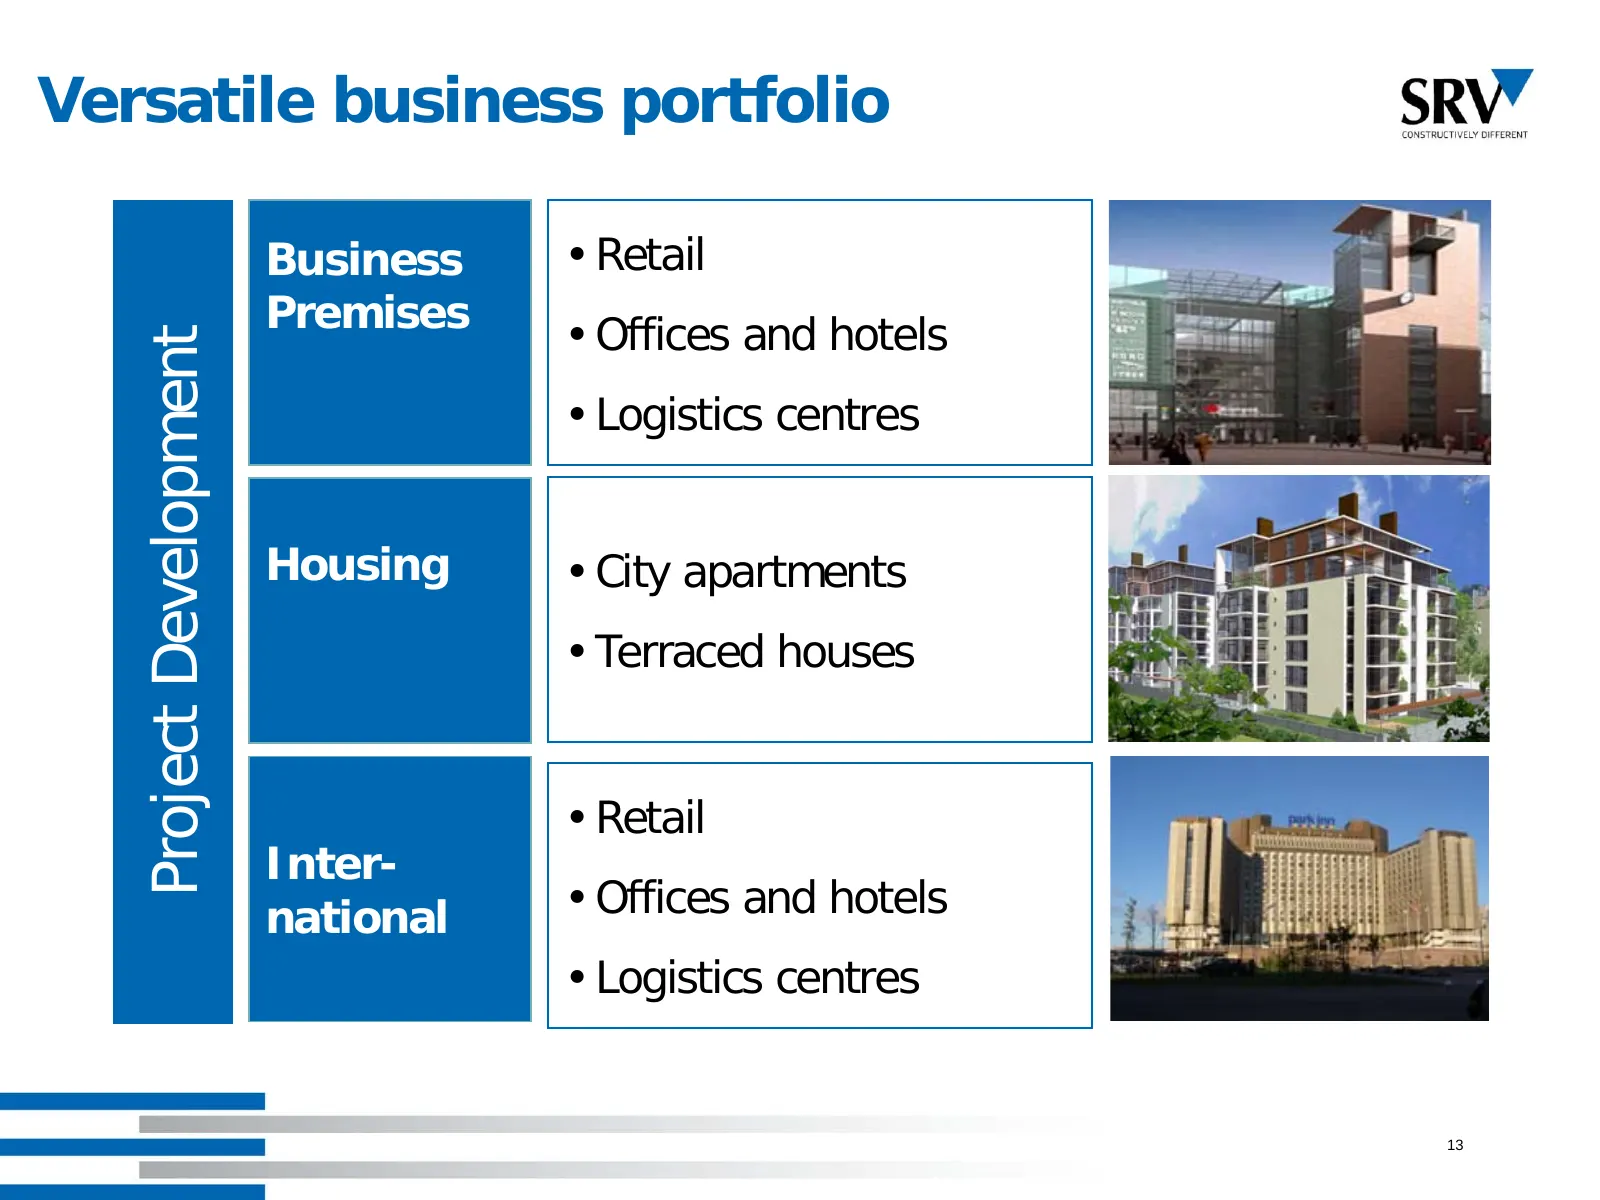
Versatile business portfolio Business • Retail Premises • Offices and hotels Project Development • Logistics centres Housing • City apartments • Terraced houses • Retail Inter- national • Offices and hotels • Logistics centres 13
Slide 14: SRV’s blueprints
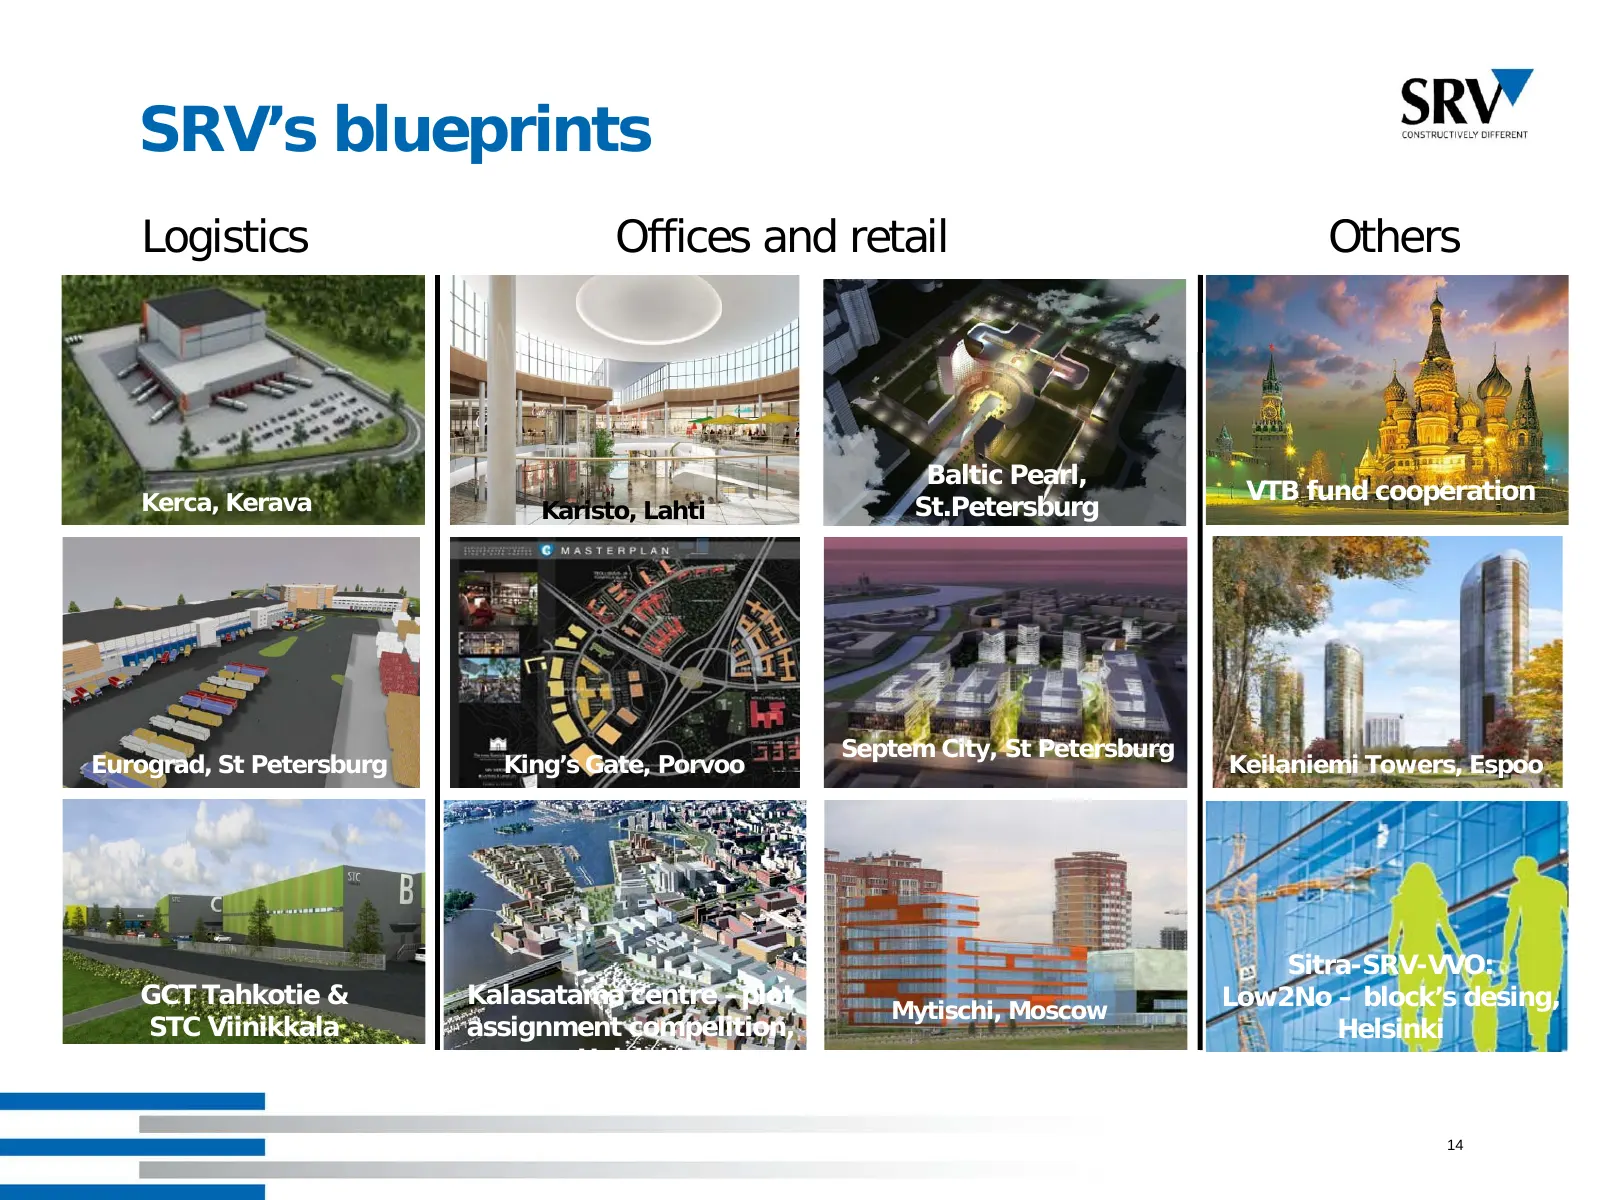
SRV’s blueprints Logistics Offices and retail Others Baltic Pearl, Kerca, Kerava VTB fund cooperation Karisto, Lahti St.Petersburg Septem City, St Petersburg Eurograd, St Petersburg King’s Gate, Porvoo Keilaniemi Towers, Espoo Sitra-SRV-VVO: GCT Tahkotie & Kalasatama centre –plot Low2No – block’s de
Slide 15: Outlook for 2010
Outlook for 2010 SRV changes the previous outlook for 2010 due to the postponement of start- ups of projects in Russia. Revenue in 2010 is expected to exceed the previous year’s level and profit before taxes is expected to be positive 15
Slide 16: SRV Interim Report January – March 2010 Appendices
SRV Interim Report January – March 2010 Appendices 16
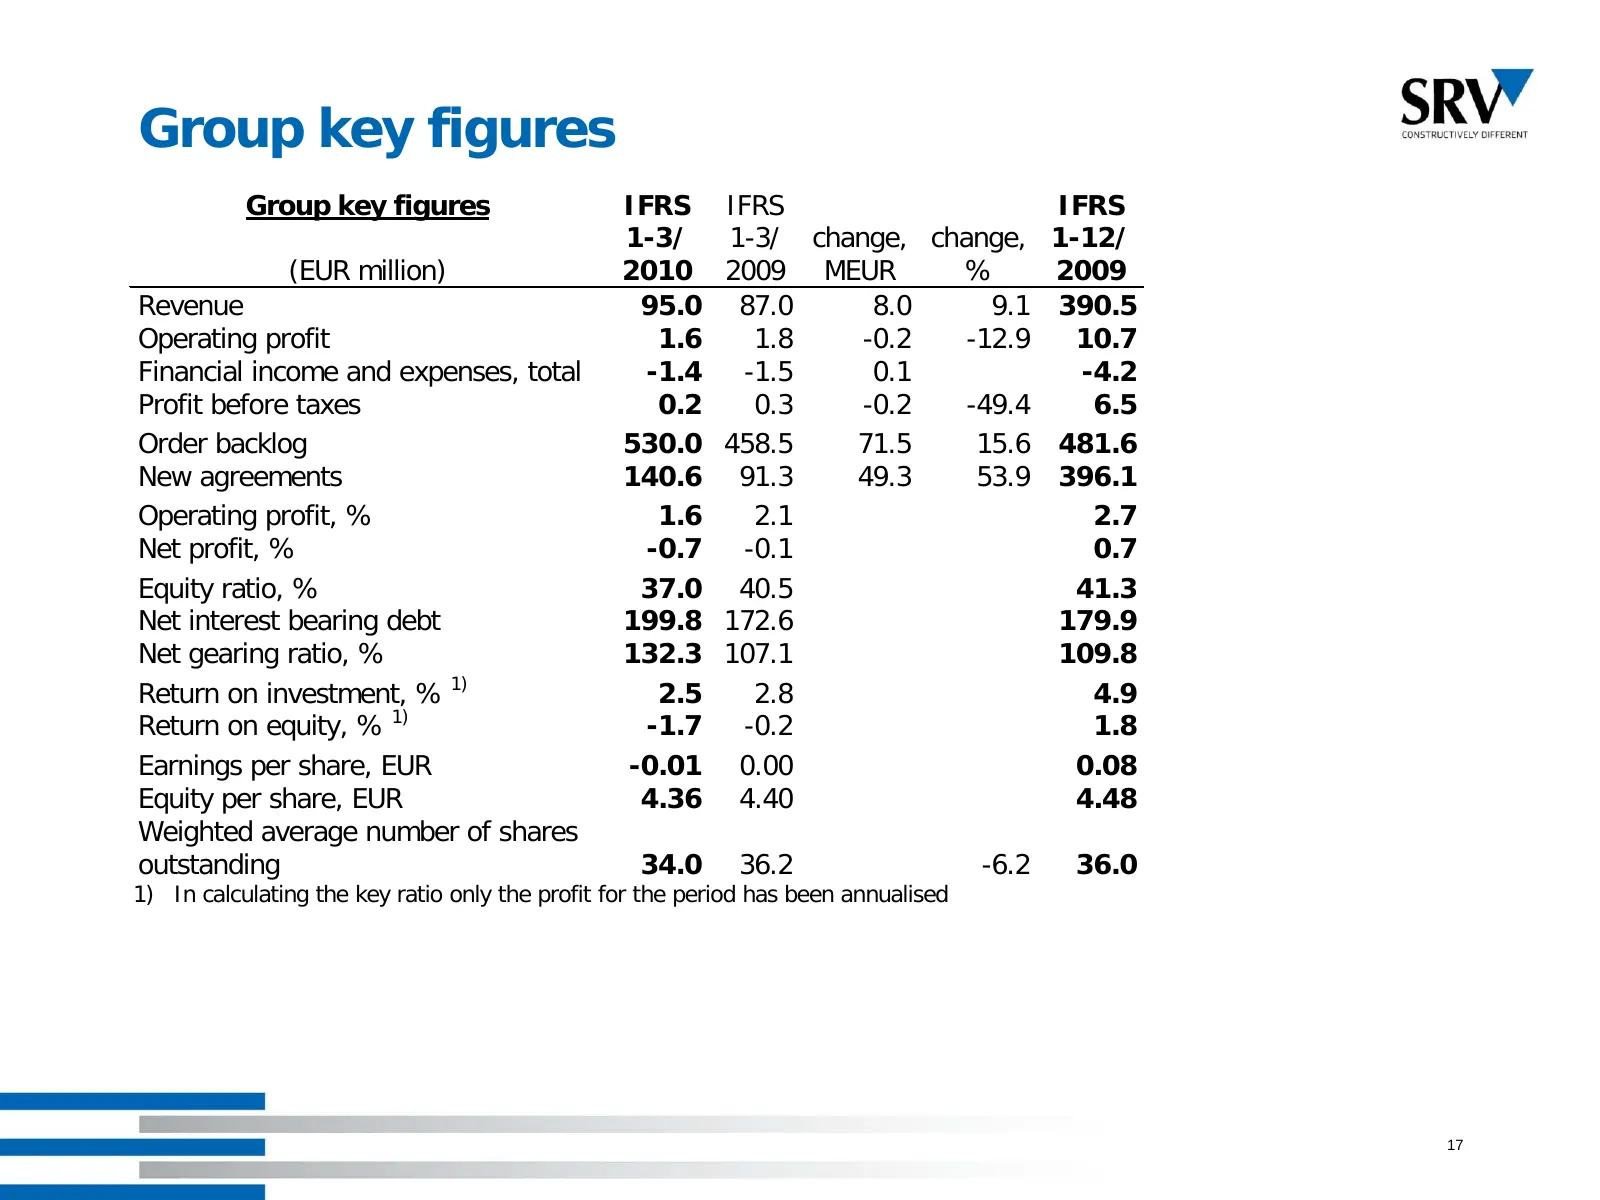
Slide 17: Group key figures
Group key figures Group key figures IFRS IFRS IFRS 1-3/ 1-3/ change, change, 1-12/ (EUR million) 2010 2009 MEUR % 2009 Revenue 95.0 87.0 8.0 9.1 390.5 Operating profit 1.6 1.8 -0.2 -12.9 10.7 Financial income and expenses, total -1.4 -1.5 0.1 -4.2 Profit before taxes 0.2 0.3 -0.2 -49.4 6.5 Order bac
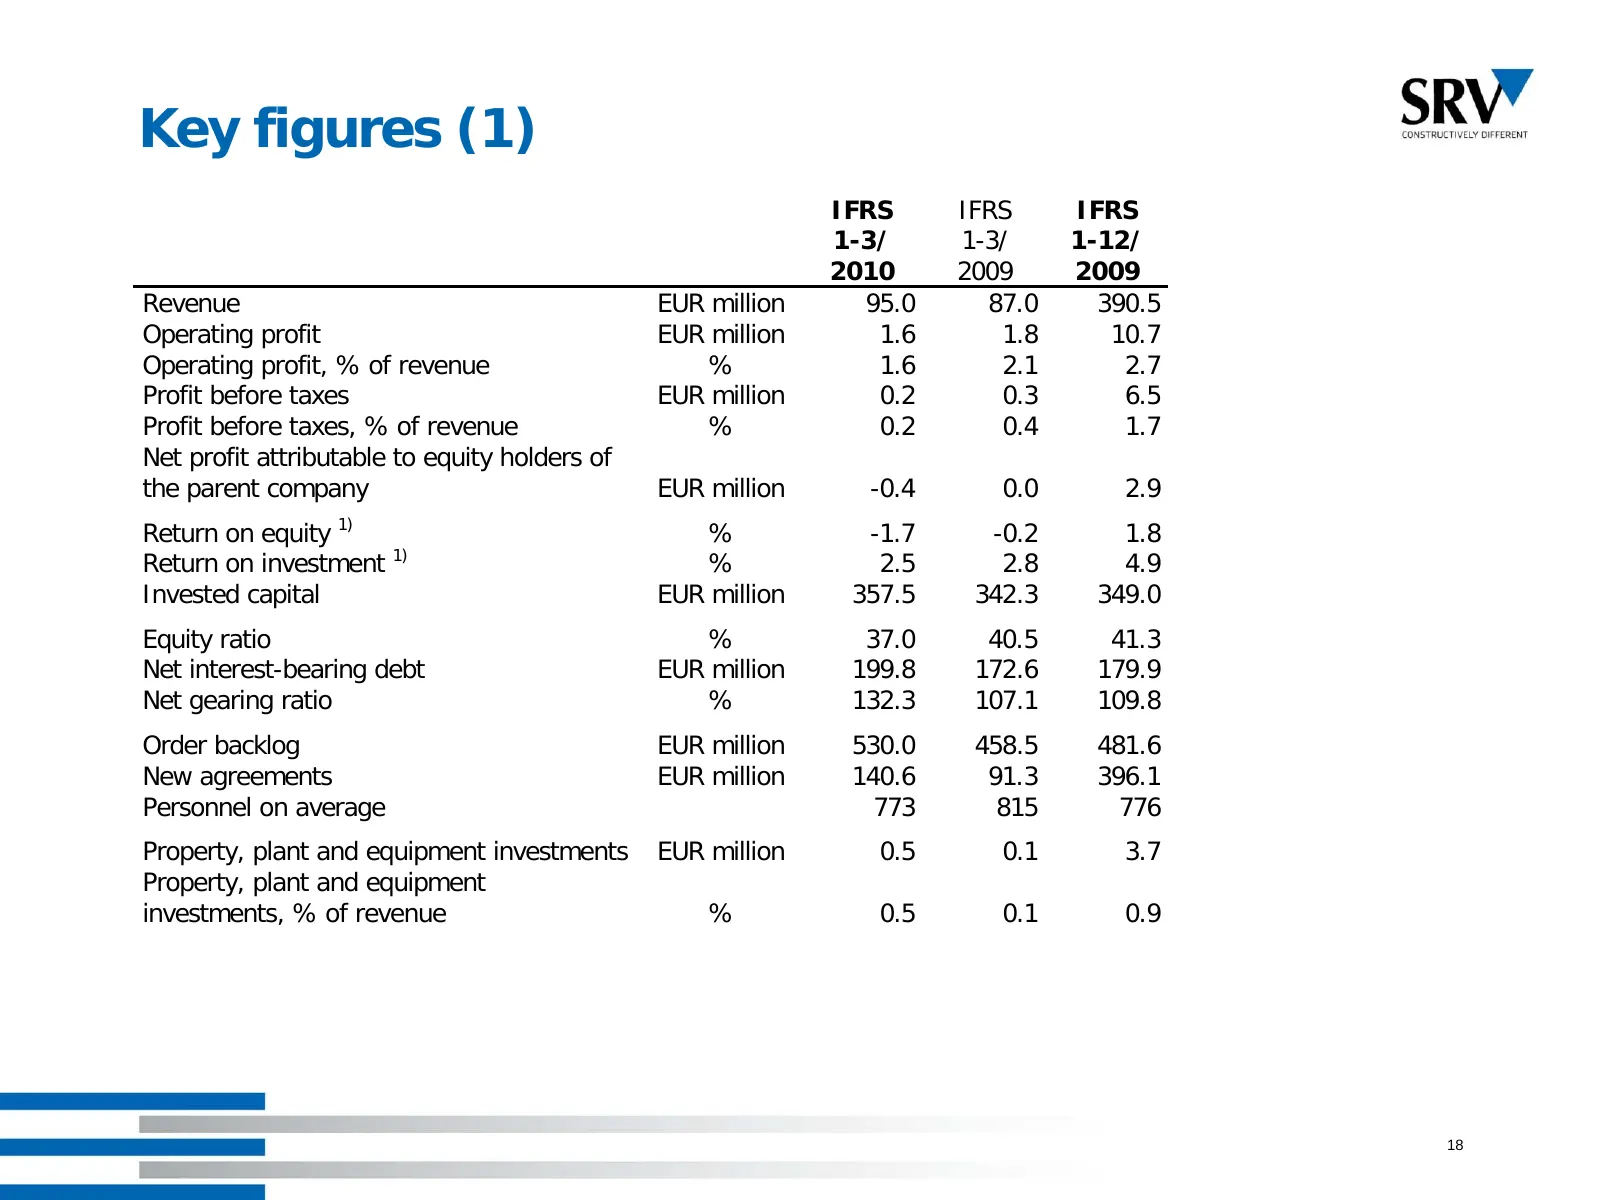
Slide 18: Key figures (1)
Key figures (1) IFRS IFRS IFRS 1-3/ 1-3/ 1-12/ 2010 2009 2009 Revenue EUR million 95.0 87.0 390.5 Operating profit EUR million 1.6 1.8 10.7 Operating profit, % of revenue % 1.6 2.1 2.7 Profit before taxes EUR million 0.2 0.3 6.5 Profit before taxes, % of revenue % 0.2 0.4 1.7 Net profit attributable
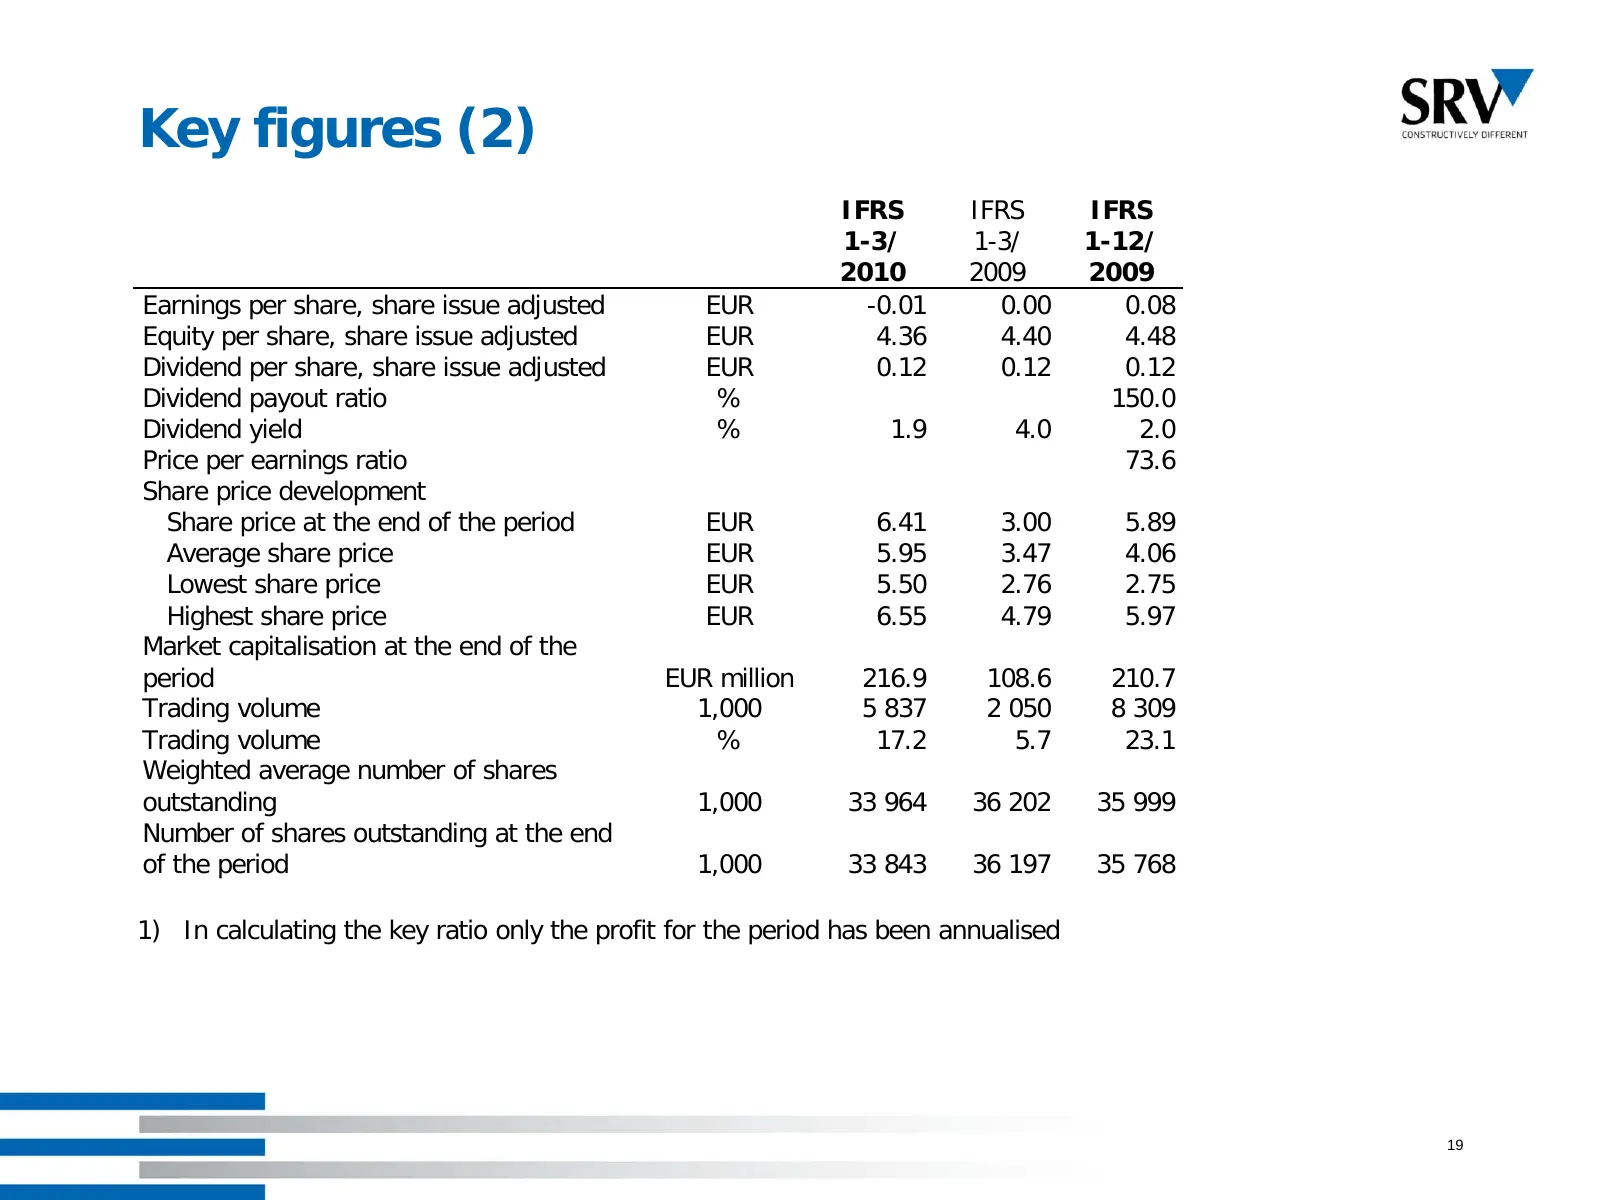
Slide 19: Key figures (2)
Key figures (2) IFRS IFRS IFRS 1-3/ 1-3/ 1-12/ 2010 2009 2009 Earnings per share, share issue adjusted EUR -0.01 0.00 0.08 Equity per share, share issue adjusted EUR 4.36 4.40 4.48 Dividend per share, share issue adjusted EUR 0.12 0.12 0.12 Dividend payout ratio % 150.0 Dividend yield % 1.9 4.0 2.0
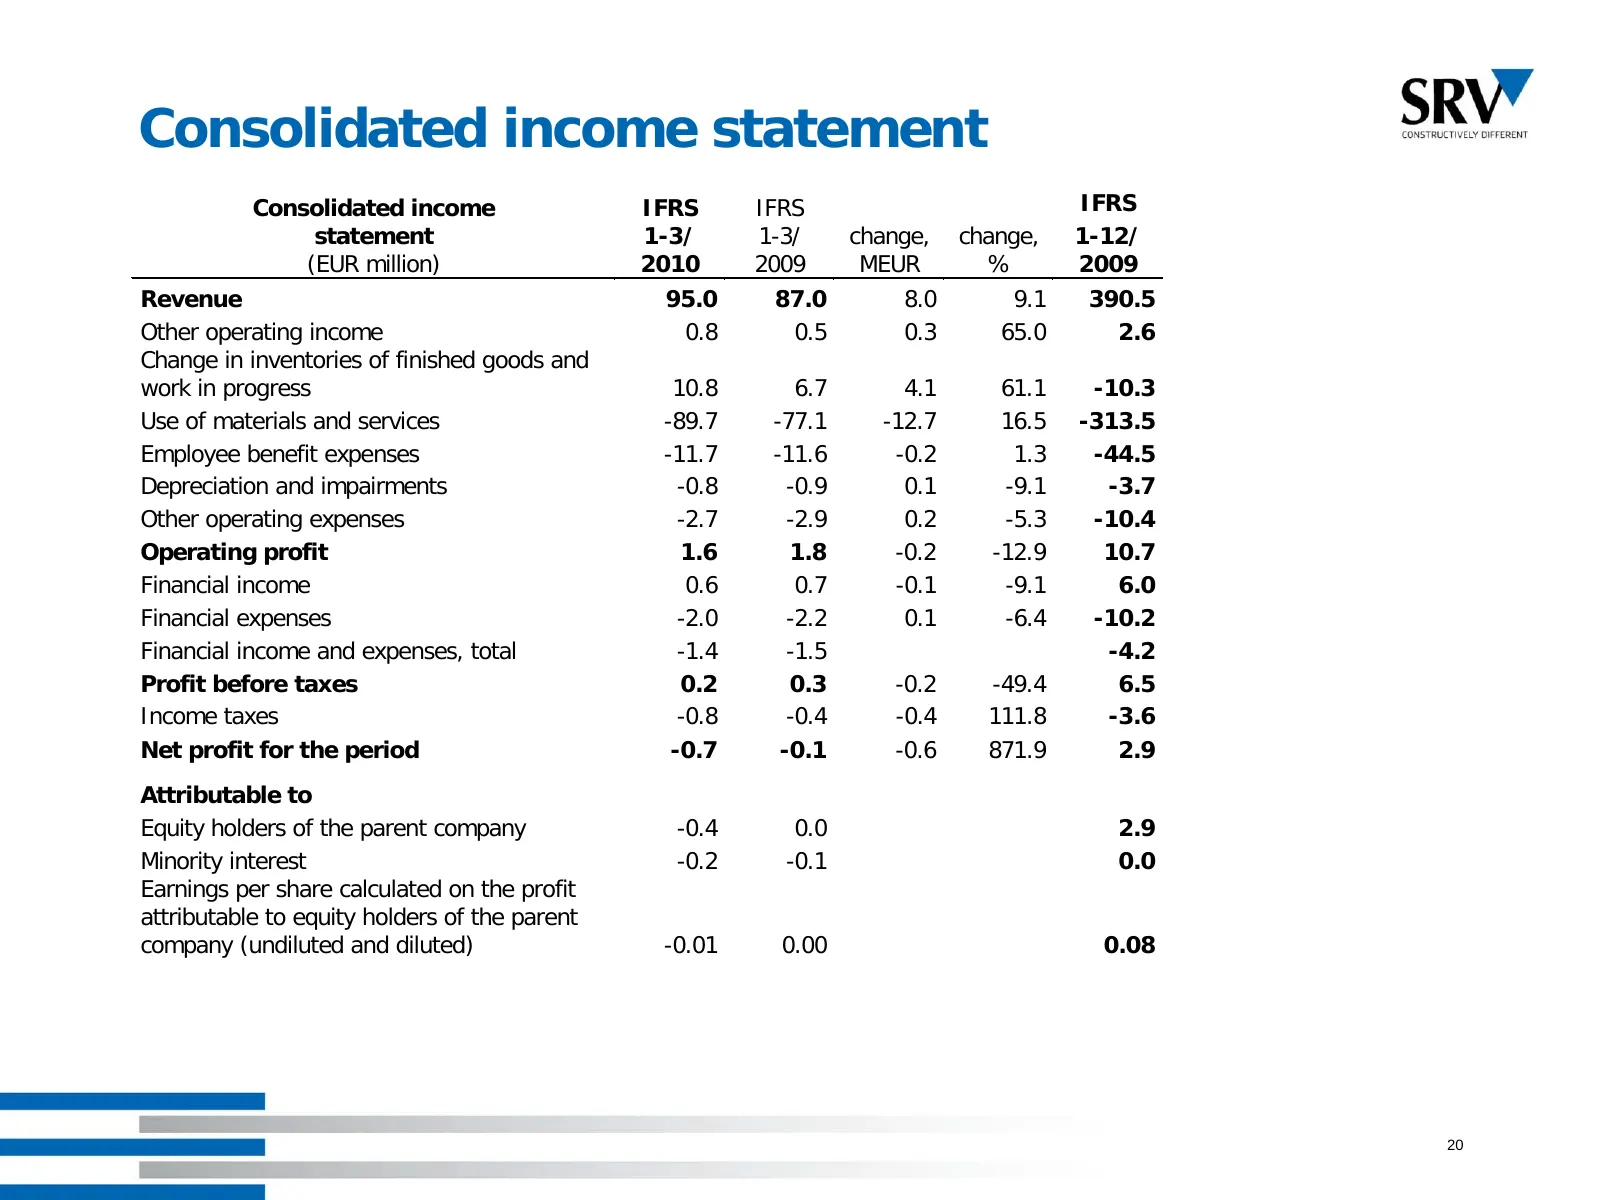
Slide 20: Consolidated income statement
Consolidated income statement Consolidated income IFRS IFRS IFRS statement 1-3/ 1-3/ change, change, 1-12/ (EUR million) 2010 2009 MEUR % 2009 Revenue 95.0 87.0 8.0 9.1 390.5 Other operating income 0.8 0.5 0.3 65.0 2.6 Change in inventories of finished goods and work in progress 10.8 6.7 4.1 61.1 -1
Slide 21: Consolidated statement of comprehensive income
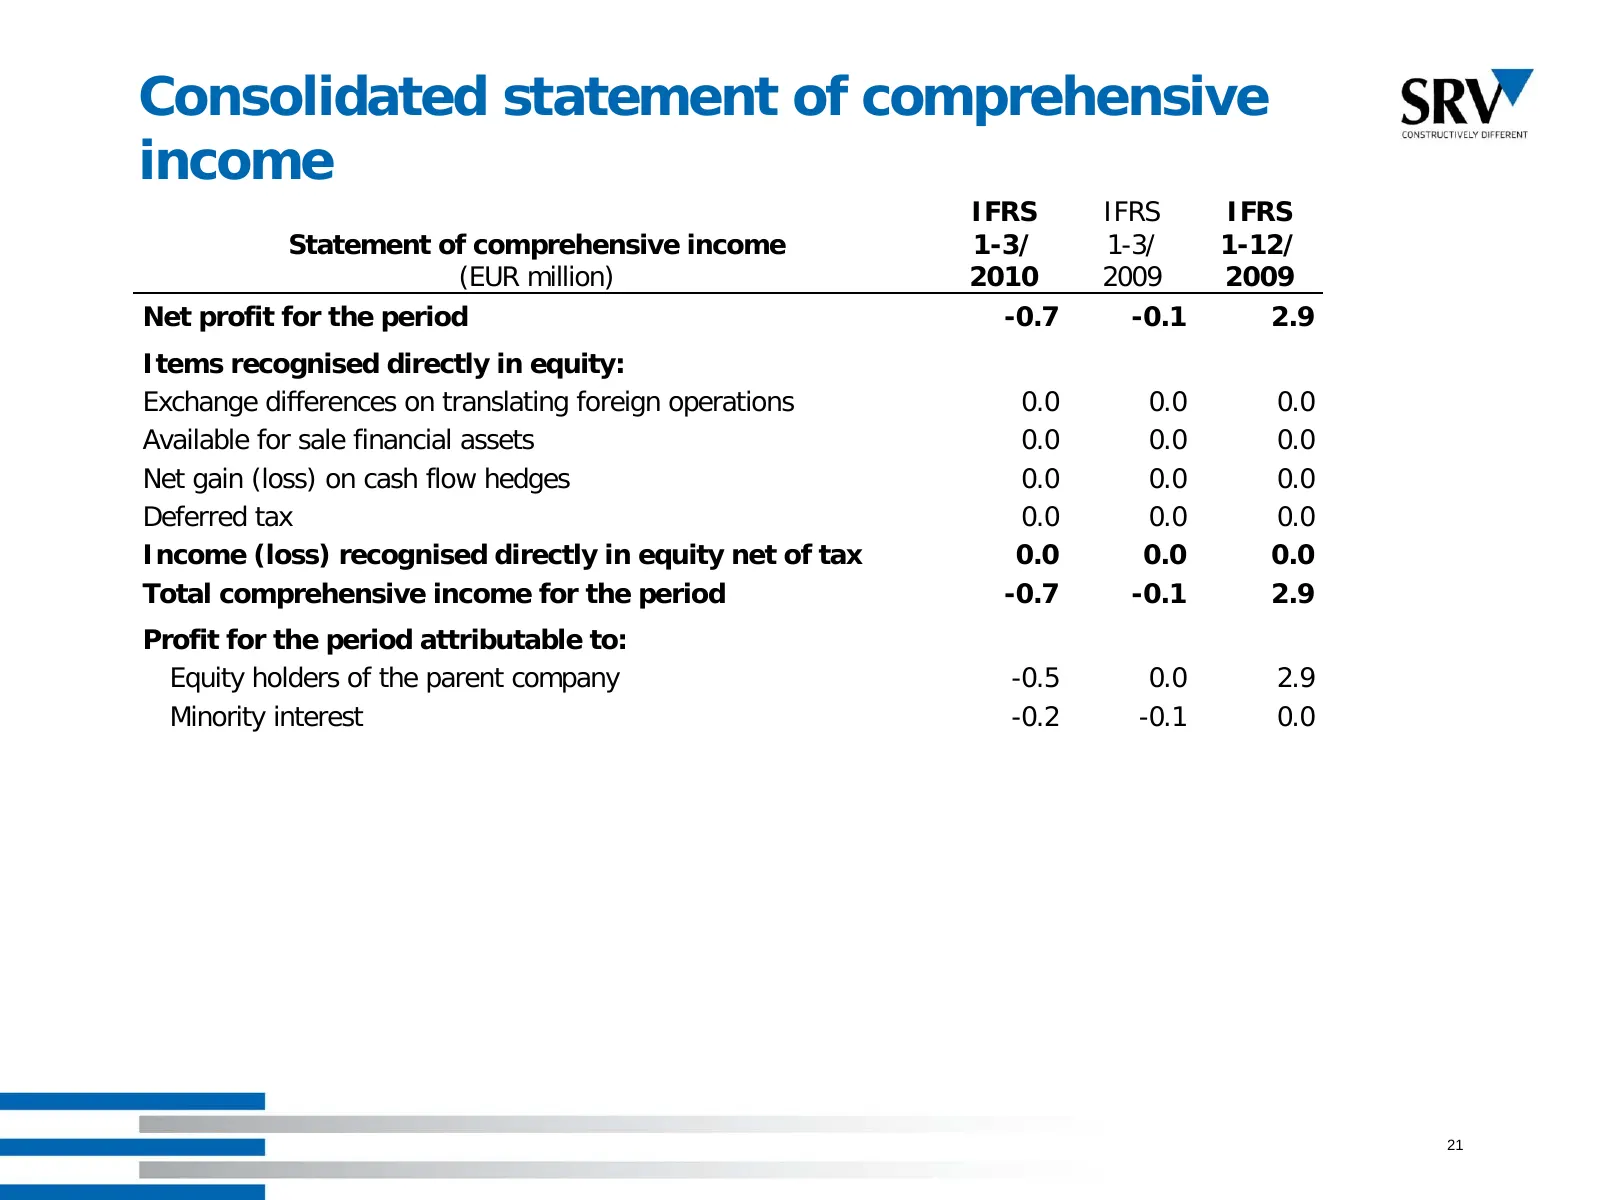
Consolidated statement of comprehensive income IFRS IFRS IFRS Statement of comprehensive income 1-3/ 1-3/ 1-12/ (EUR million) 2010 2009 2009 Net profit for the period -0.7 -0.1 2.9 Items recognised directly in equity: Exchange differences on translating foreign operations 0.0 0.0 0.0 Available for s
Slide 22: Consolidated balance sheet: Assets
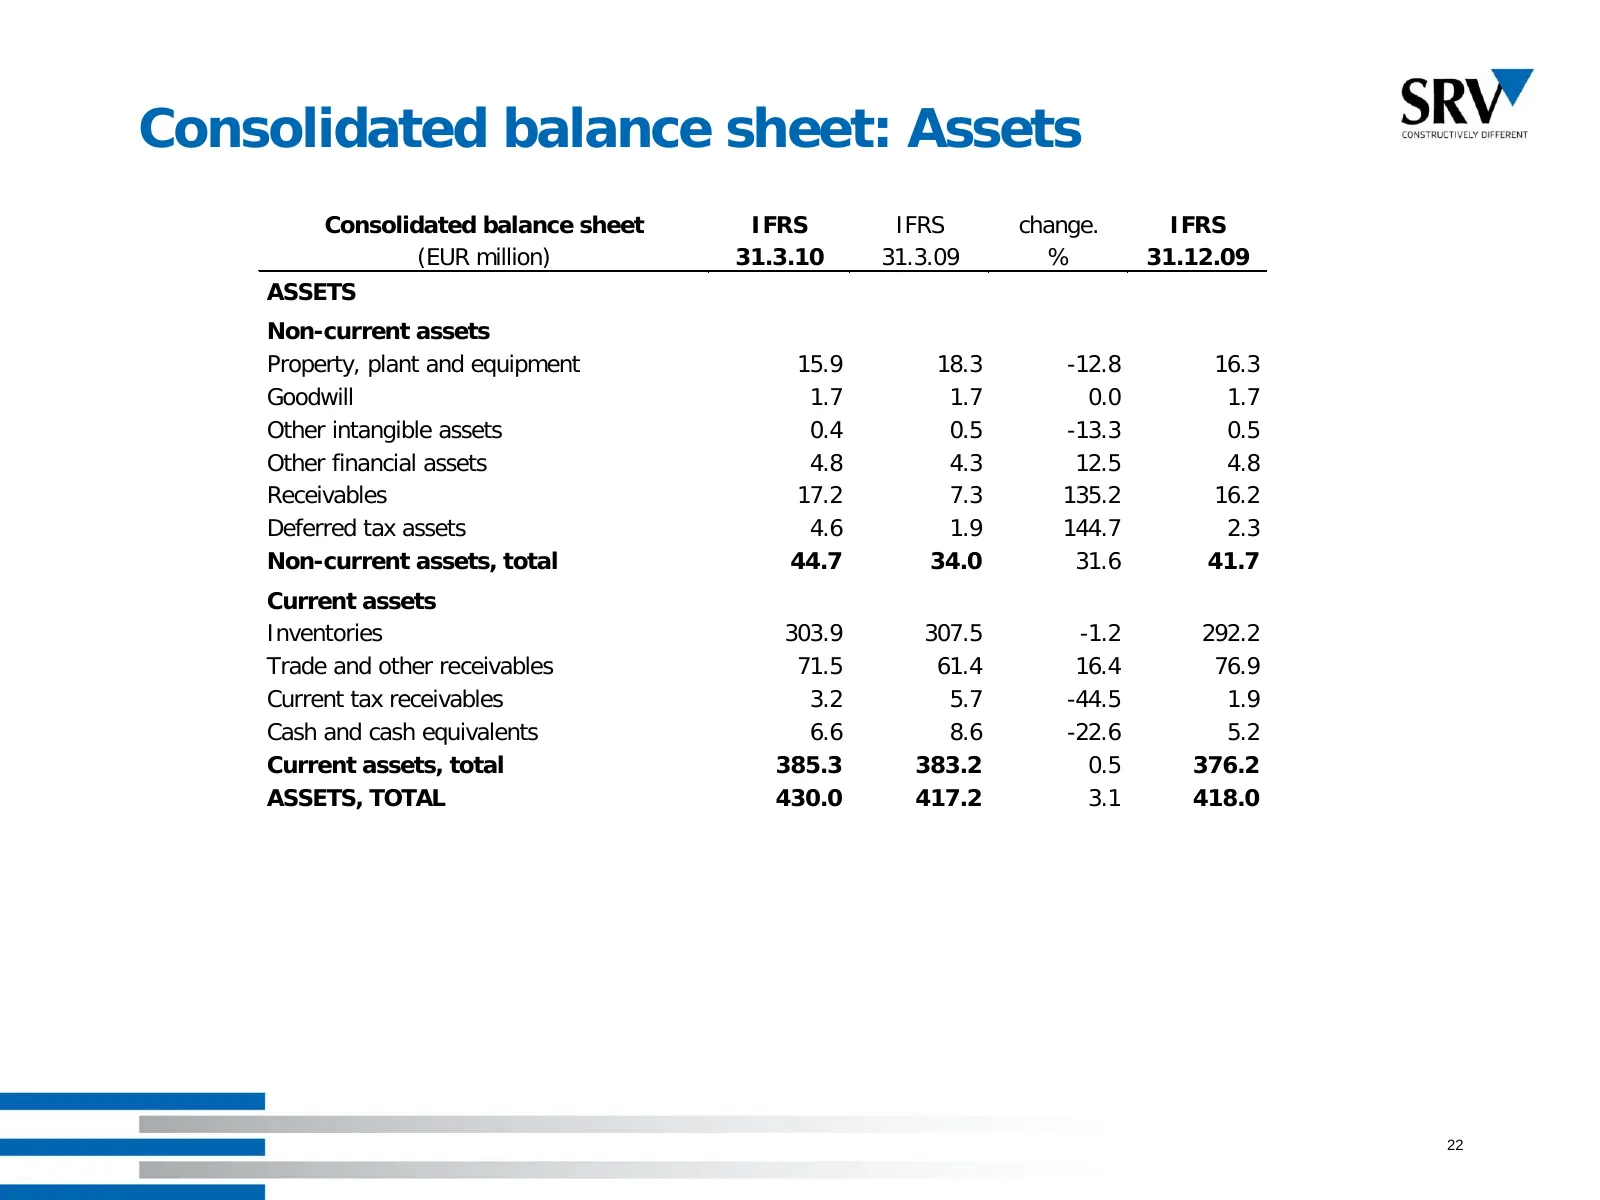
Consolidated balance sheet: Assets Consolidated balance sheet IFRS IFRS change. IFRS (EUR million) 31.3.10 31.3.09 % 31.12.09 ASSETS Non-current assets Property, plant and equipment 15.9 18.3 -12.8 16.3 Goodwill 1.7 1.7 0.0 1.7 Other intangible assets 0.4 0.5 -13.3 0.5 Other financial assets 4.8 4.3
Slide 23: Consolidated balance sheet: Equity and liabilities
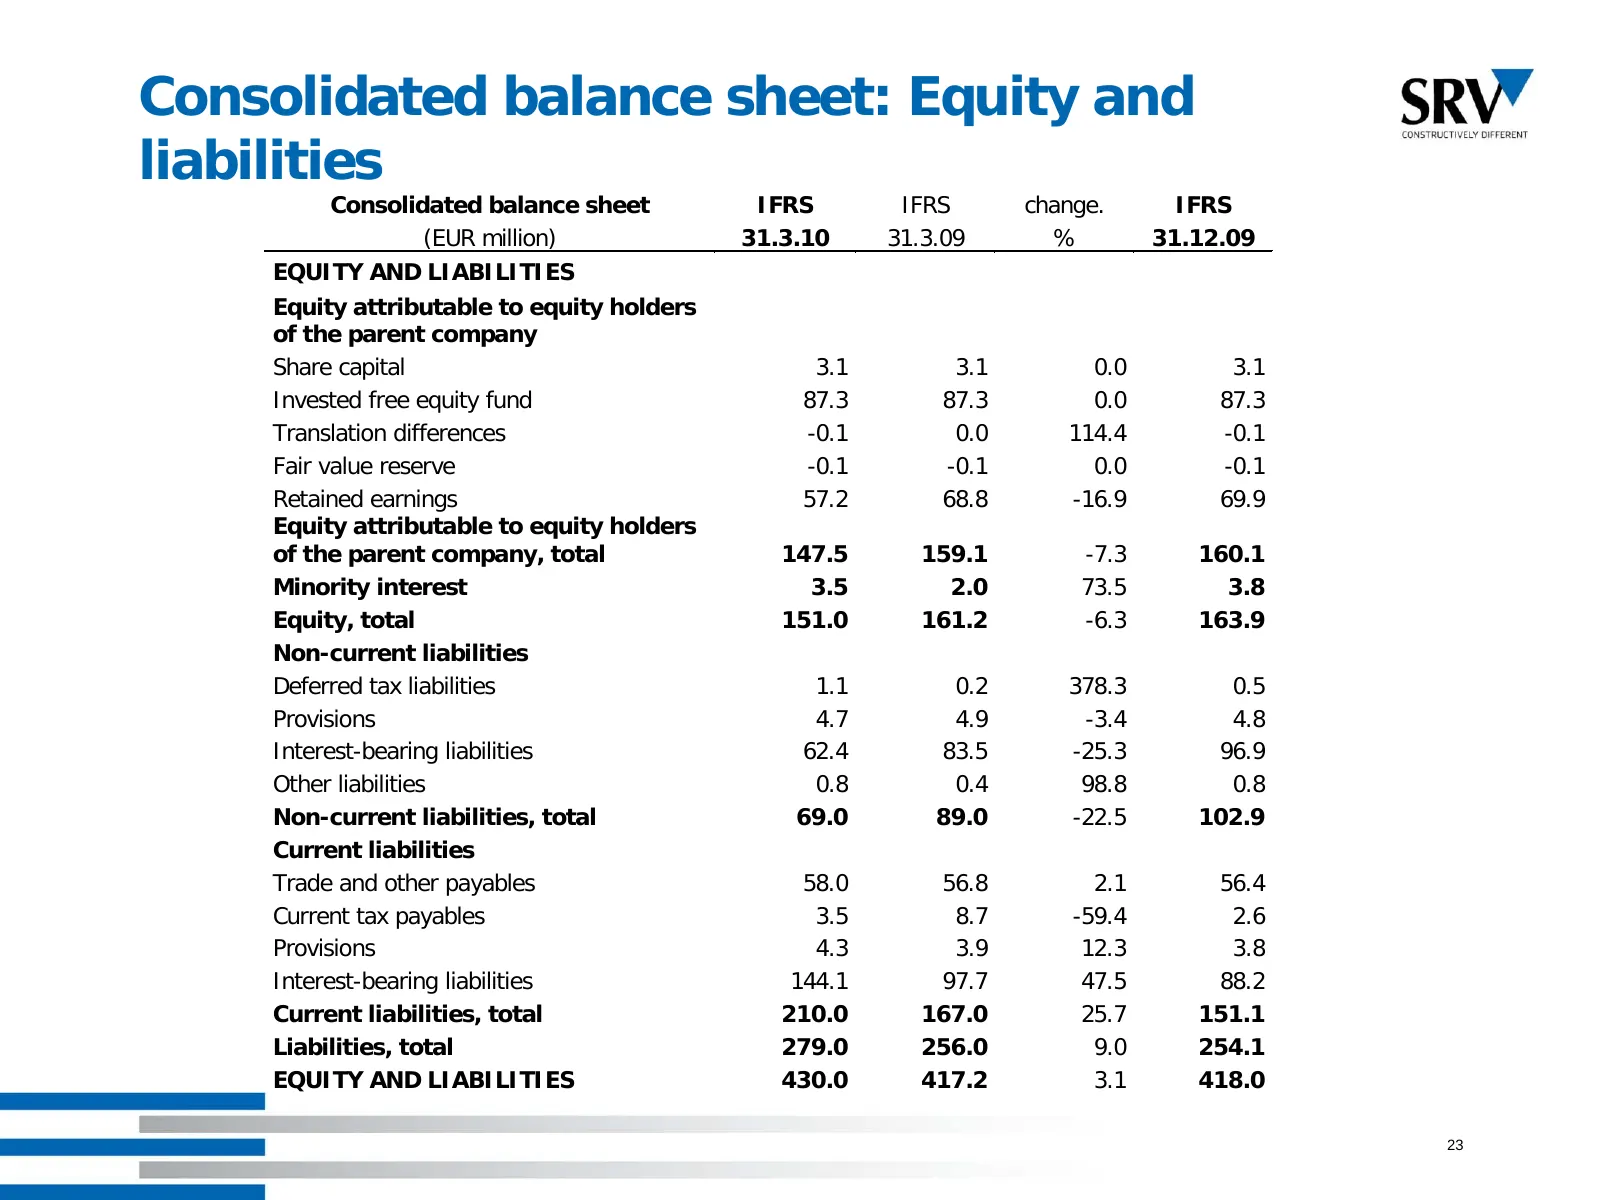
Consolidated balance sheet: Equity and liabilities Consolidated balance sheet IFRS IFRS change. IFRS (EUR million) 31.3.10 31.3.09 % 31.12.09 EQUITY AND LIABILITIES Equity attributable to equity holders of the parent company Share capital 3.1 3.1 0.0 3.1 Invested free equity fund 87.3 87.3 0.0 87.3
Slide 24: Changes in Group equity 1-3/2010
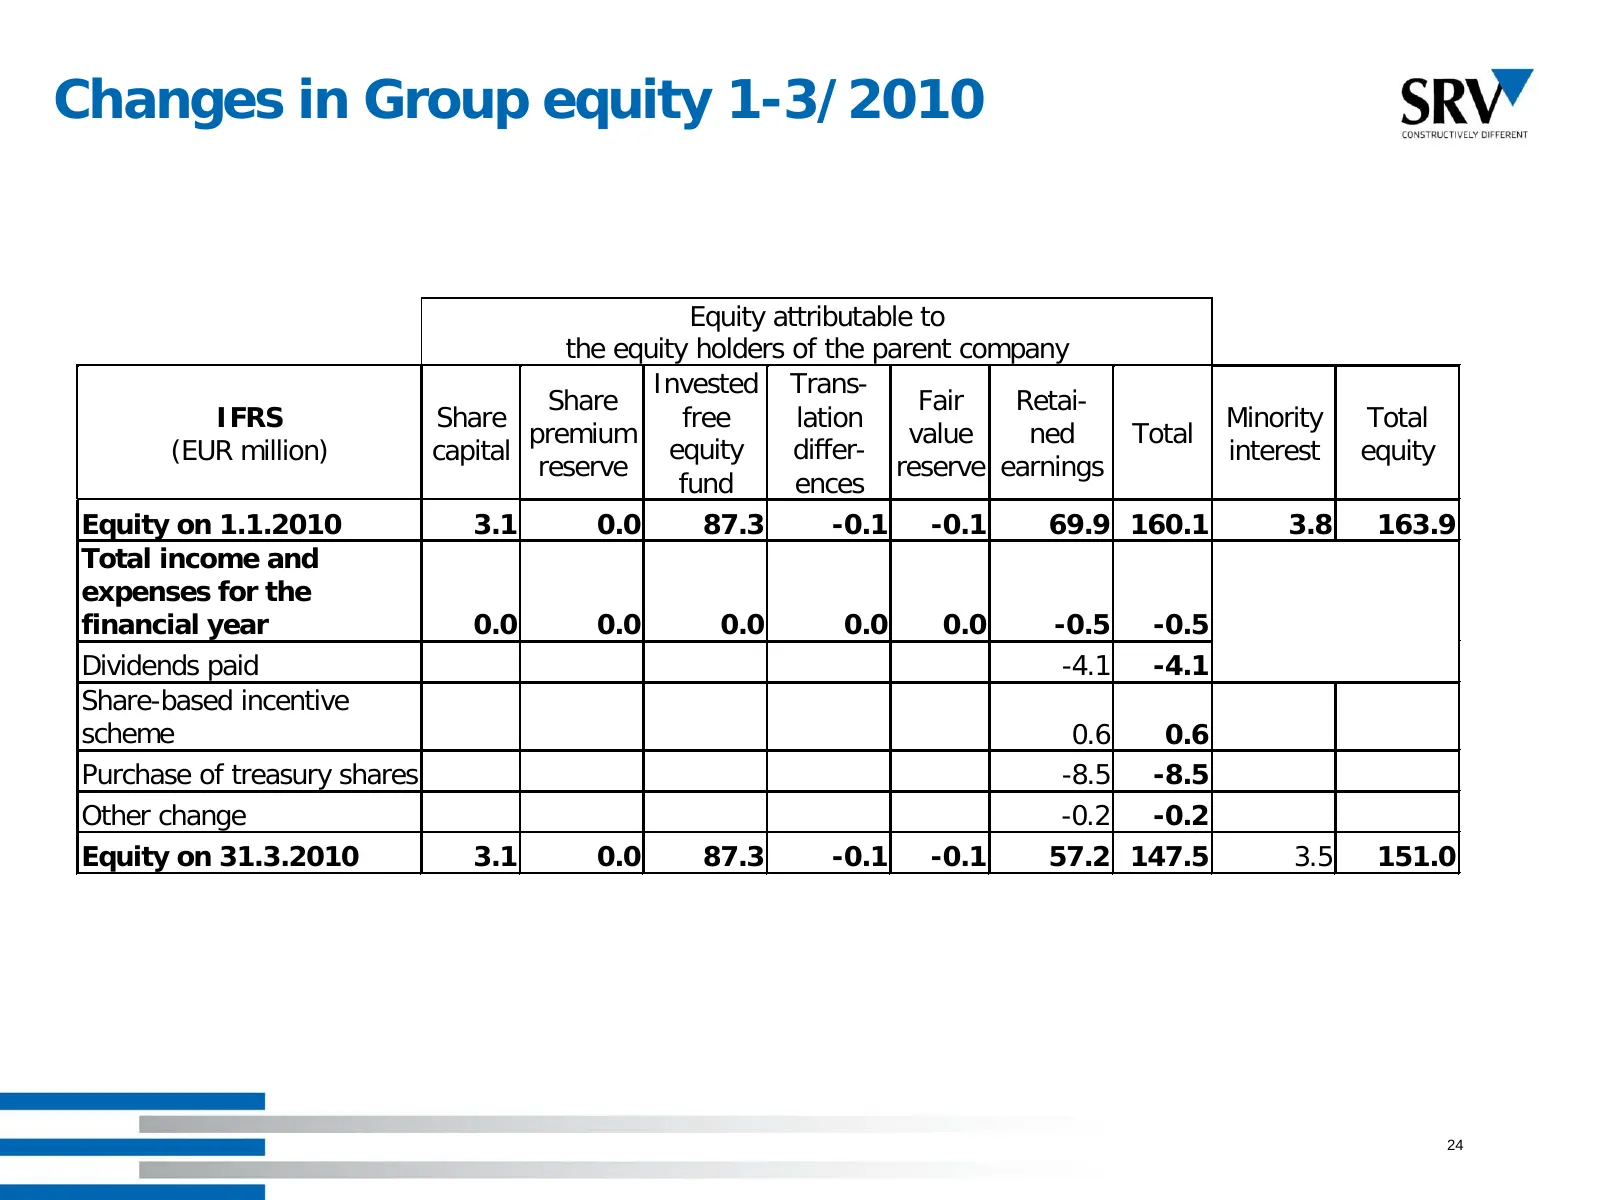
Changes in Group equity 1-3/2010 Equity attributable to the equity holders of the parent company Invested Trans- Share Fair Retai- IFRS Share free lation Minority Total premium value ned Total (EUR million) capital equity differ- interest equity reserve reserve earnings fund ences Equity on 1.1.2010
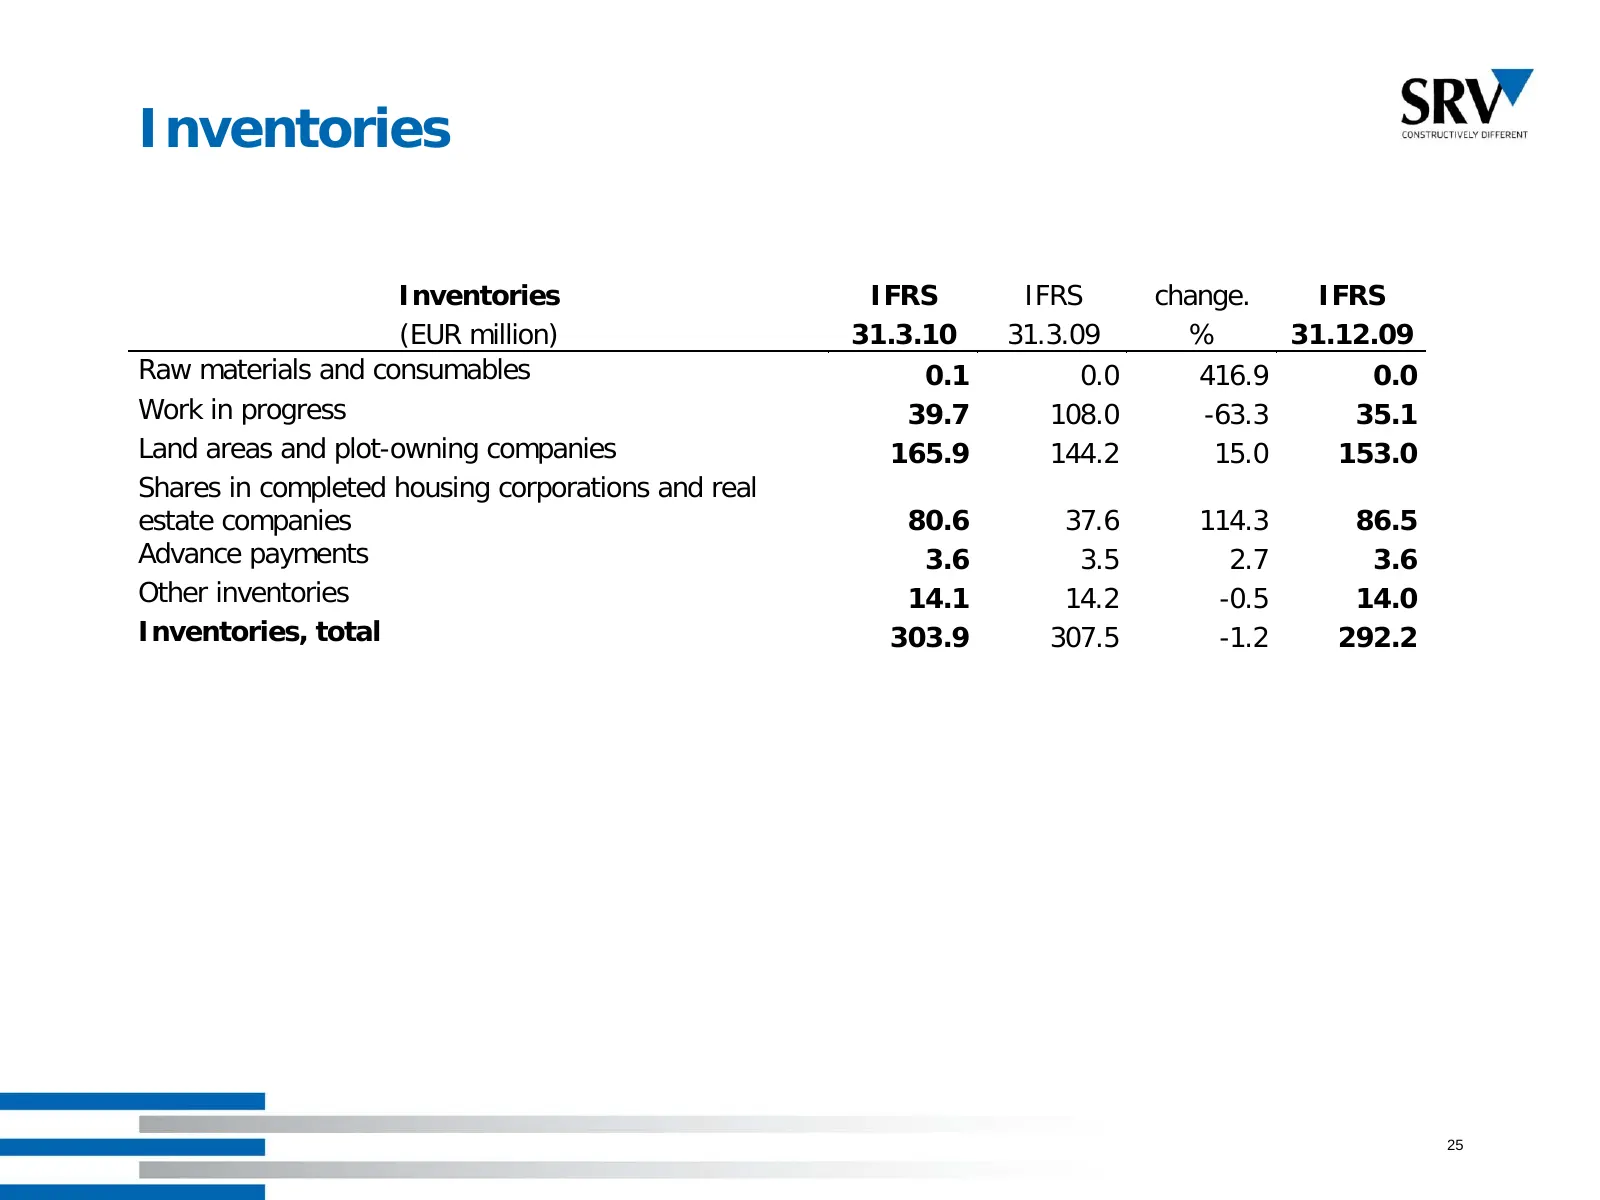
Slide 25: Inventories
Inventories Inventories IFRS IFRS change. IFRS (EUR million) 31.3.10 31.3.09 % 31.12.09 Raw materials and consumables 0.1 0.0 416.9 0.0 Work in progress 39.7 108.0 -63.3 35.1 Land areas and plot-owning companies 165.9 144.2 15.0 153.0 Shares in completed housing corporations and real estate companie
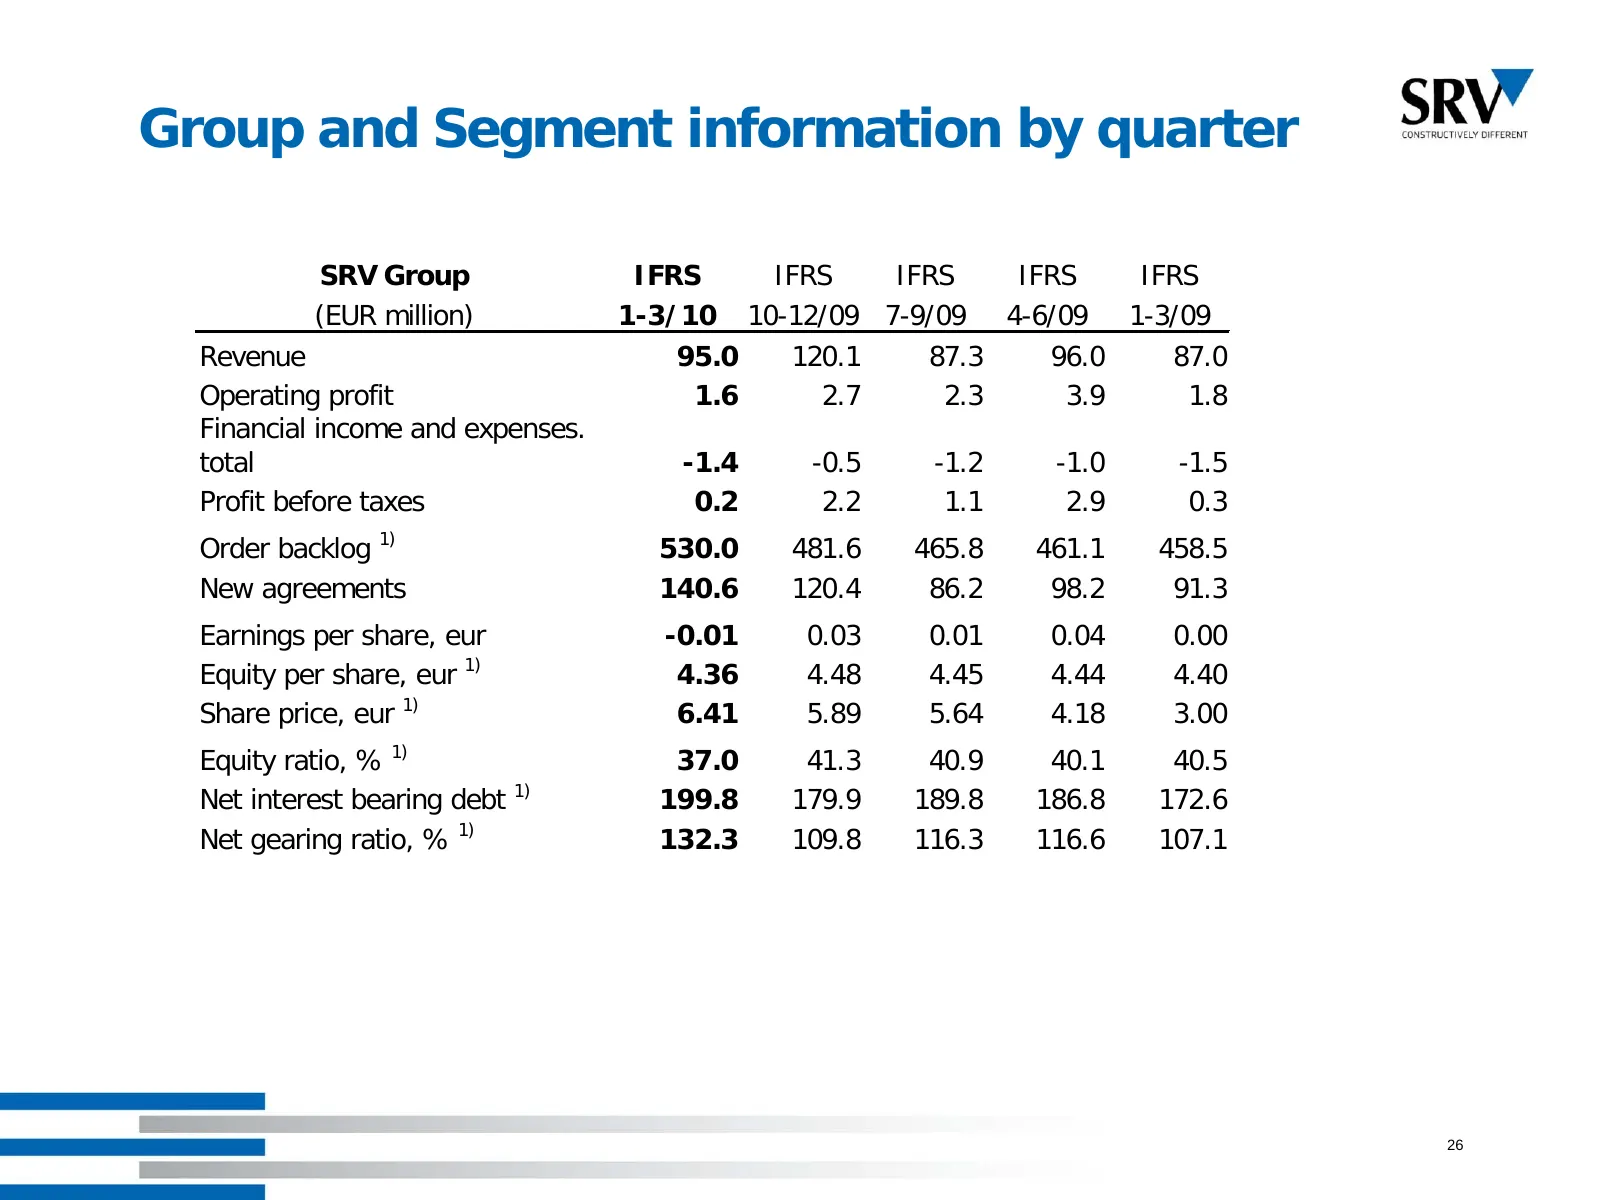
Slide 26: Group and Segment information by quarter
Group and Segment information by quarter SRV Group IFRS IFRS IFRS IFRS IFRS (EUR million) 1-3/10 10-12/09 7-9/09 4-6/09 1-3/09 Revenue 95.0 120.1 87.3 96.0 87.0 Operating profit 1.6 2.7 2.3 3.9 1.8 Financial income and expenses. total -1.4 -0.5 -1.2 -1.0 -1.5 Profit before taxes 0.2 2.2 1.1 2.9 0.3
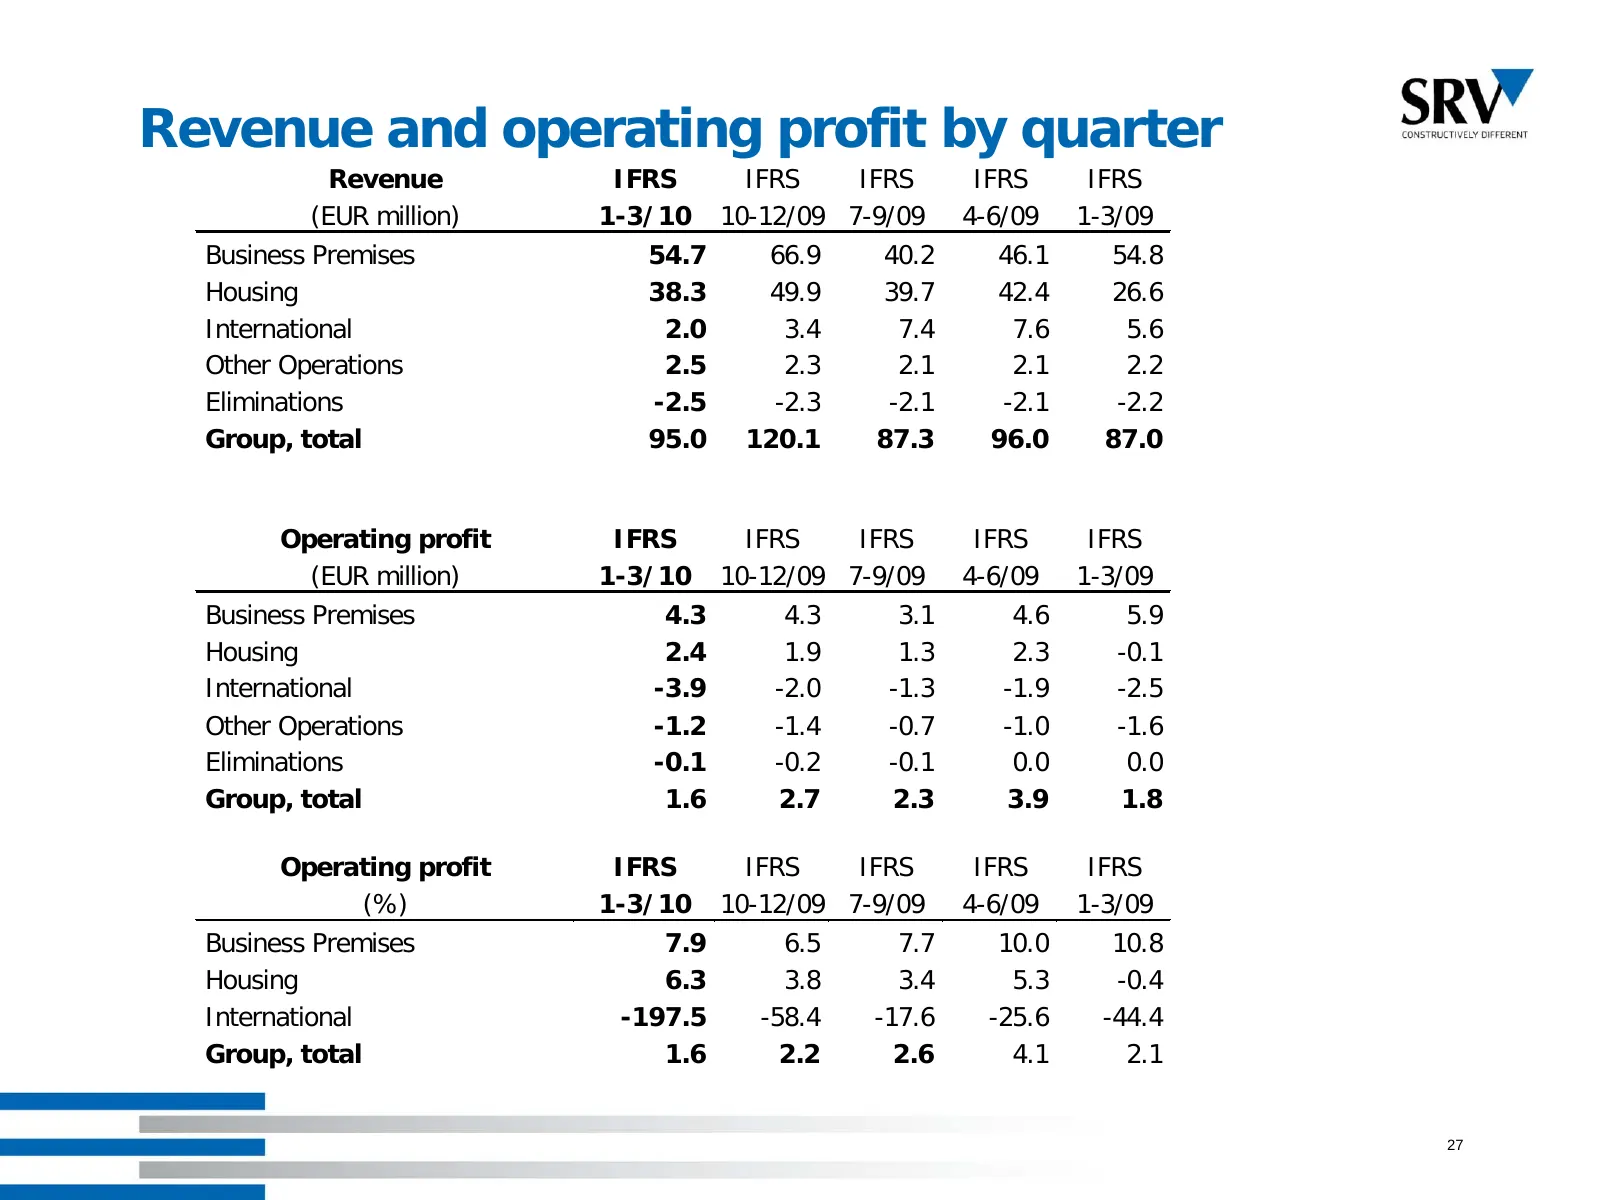
Slide 27: Revenue and operating profit by quarter
Revenue and operating profit by quarter Revenue IFRS IFRS IFRS IFRS IFRS (EUR million) 1-3/10 10-12/09 7-9/09 4-6/09 1-3/09 Business Premises 54.7 66.9 40.2 46.1 54.8 Housing 38.3 49.9 39.7 42.4 26.6 International 2.0 3.4 7.4 7.6 5.6 Other Operations 2.5 2.3 2.1 2.1 2.2 Eliminations -2.5 -2.3 -2.1 -
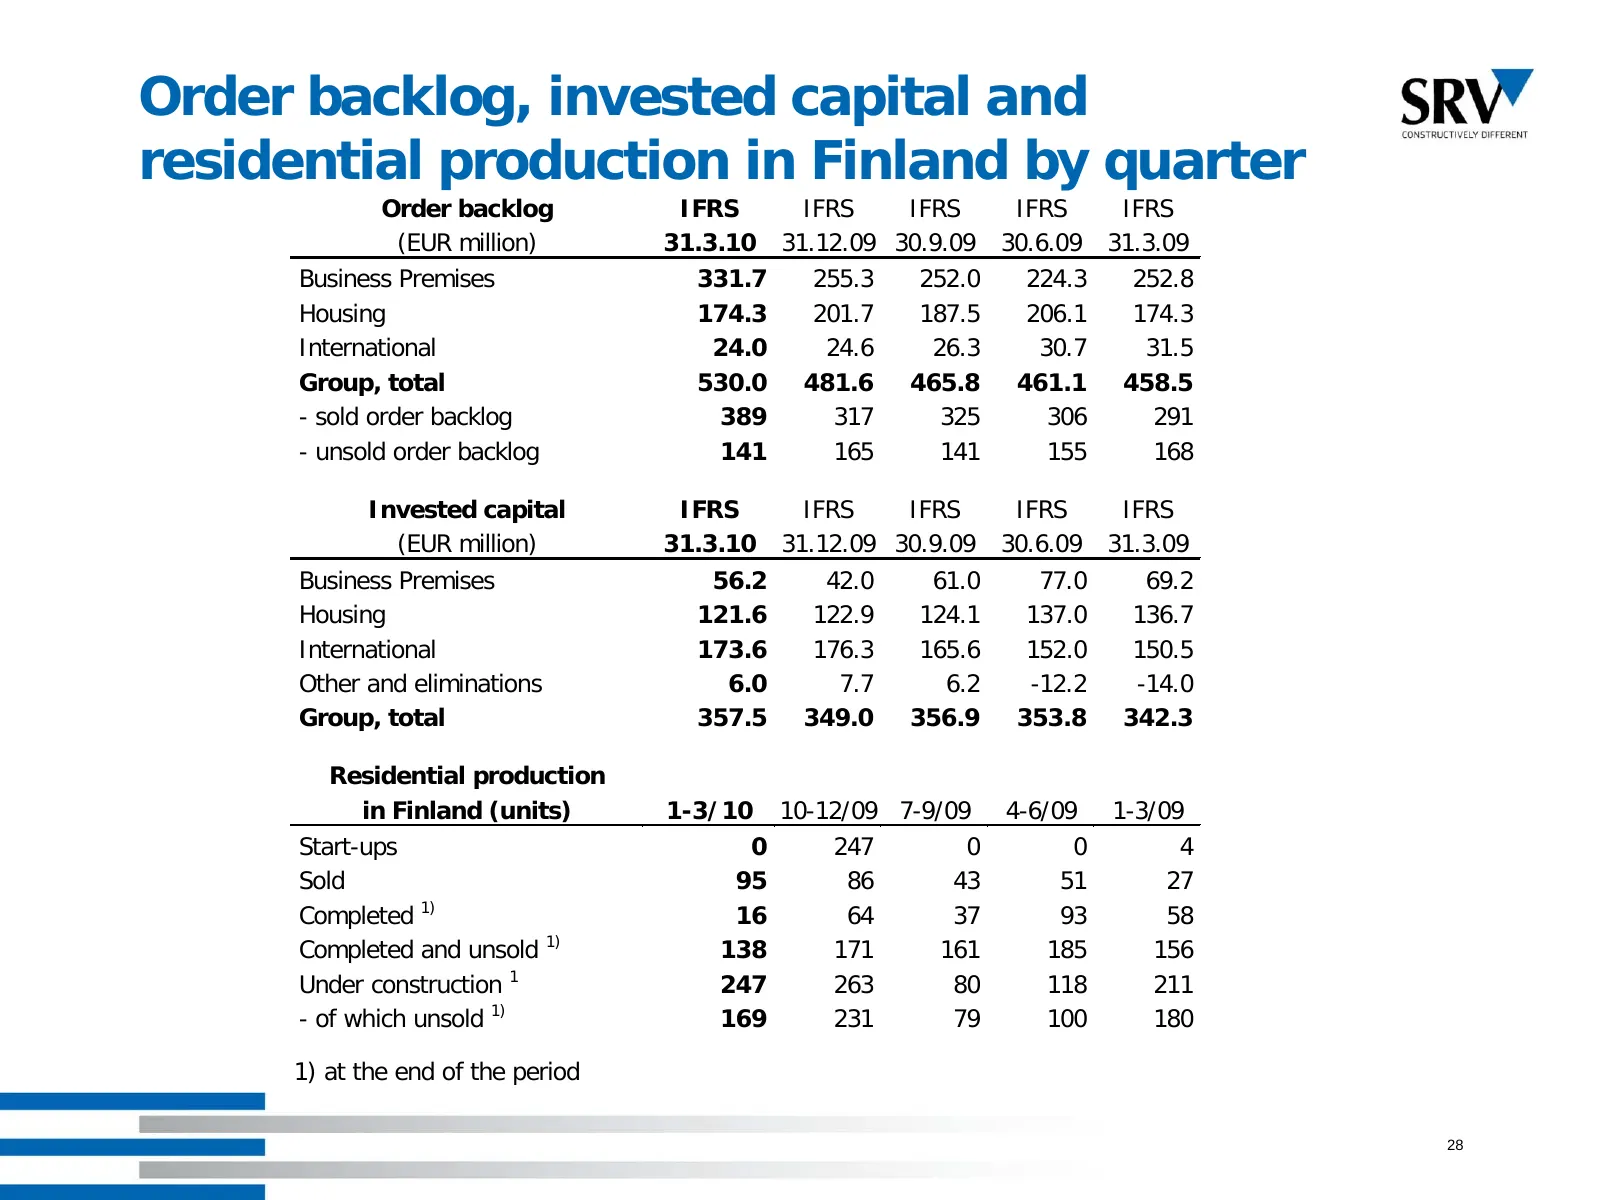
Slide 28: Order backlog, invested capital and residential production in Finland by quarter
Order backlog, invested capital and residential production in Finland by quarter Order backlog IFRS IFRS IFRS IFRS IFRS (EUR million) 31.3.10 31.12.09 30.9.09 30.6.09 31.3.09 Business Premises 331.7 255.3 252.0 224.3 252.8 Housing 174.3 201.7 187.5 206.1 174.3 International 24.0 24.6 26.3 30.7 31.5
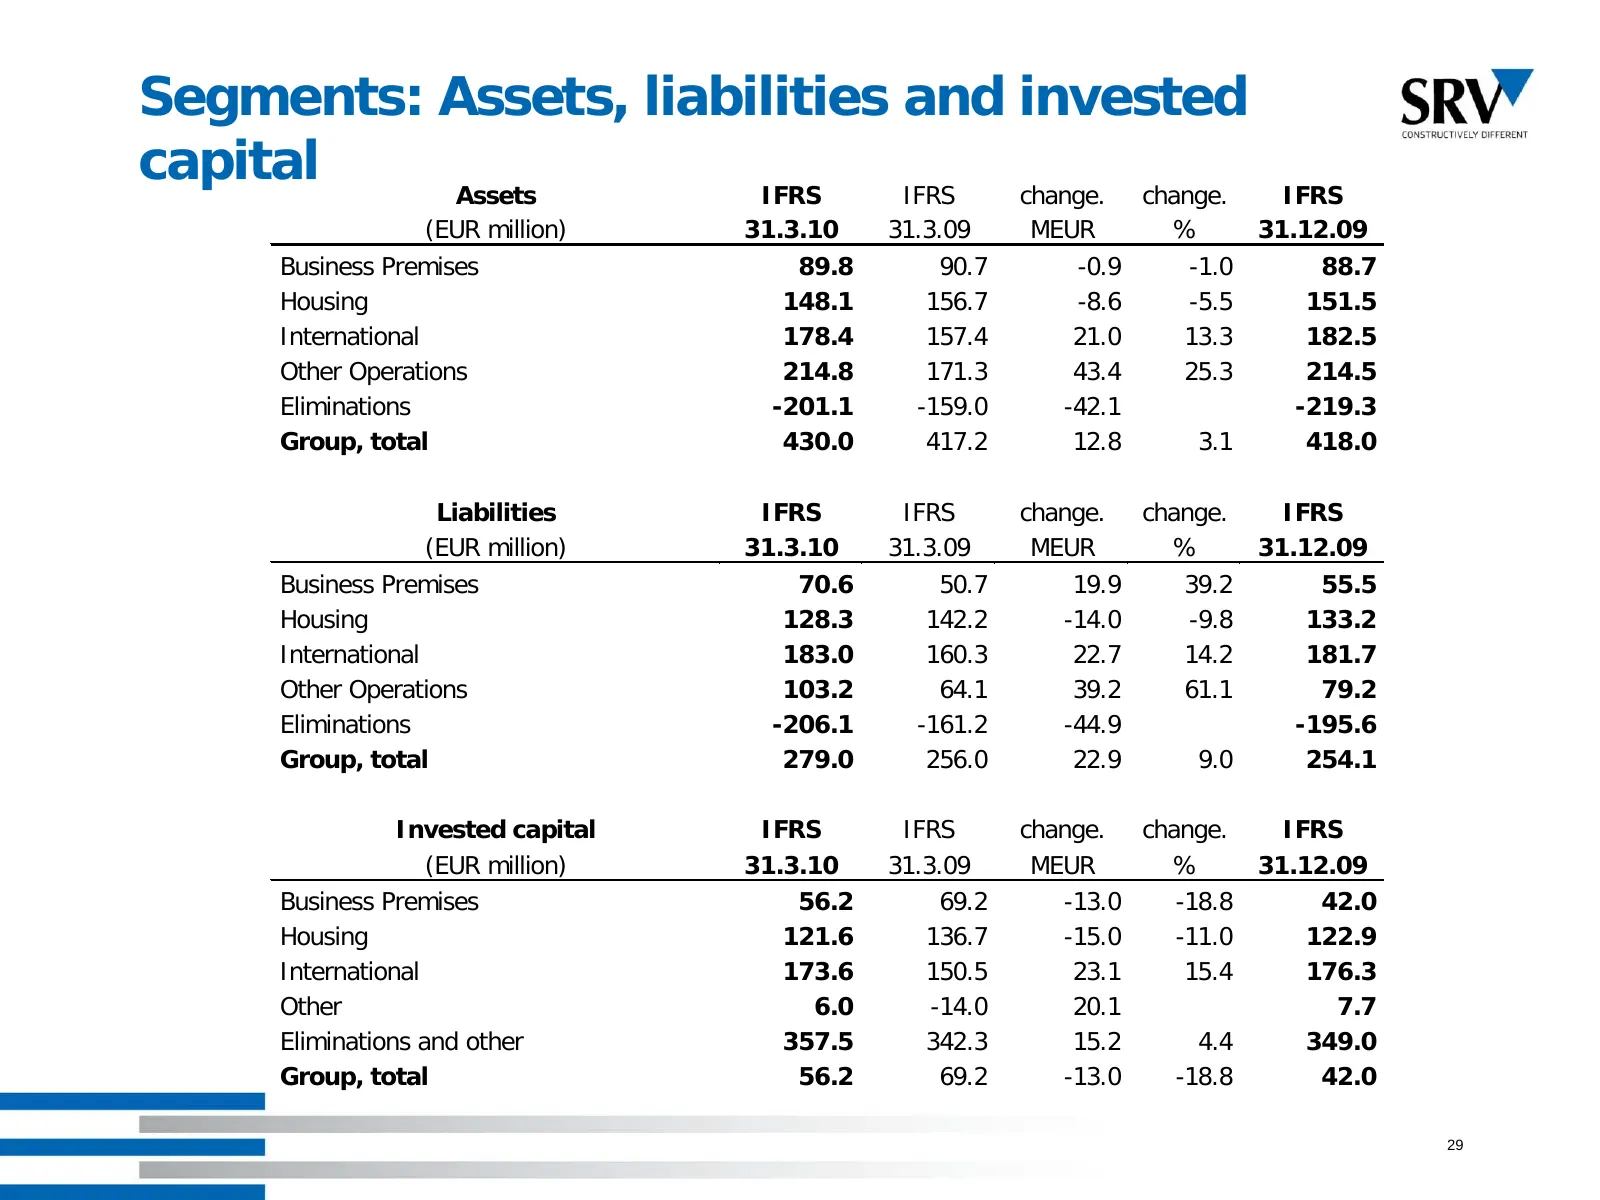
Slide 29: Segments: Assets, liabilities and invested capital
Segments: Assets, liabilities and invested capital Assets IFRS IFRS change. change. IFRS (EUR million) 31.3.10 31.3.09 MEUR % 31.12.09 Business Premises 89.8 90.7 -0.9 -1.0 88.7 Housing 148.1 156.7 -8.6 -5.5 151.5 International 178.4 157.4 21.0 13.3 182.5 Other Operations 214.8 171.3 43.4 25.3 214.5
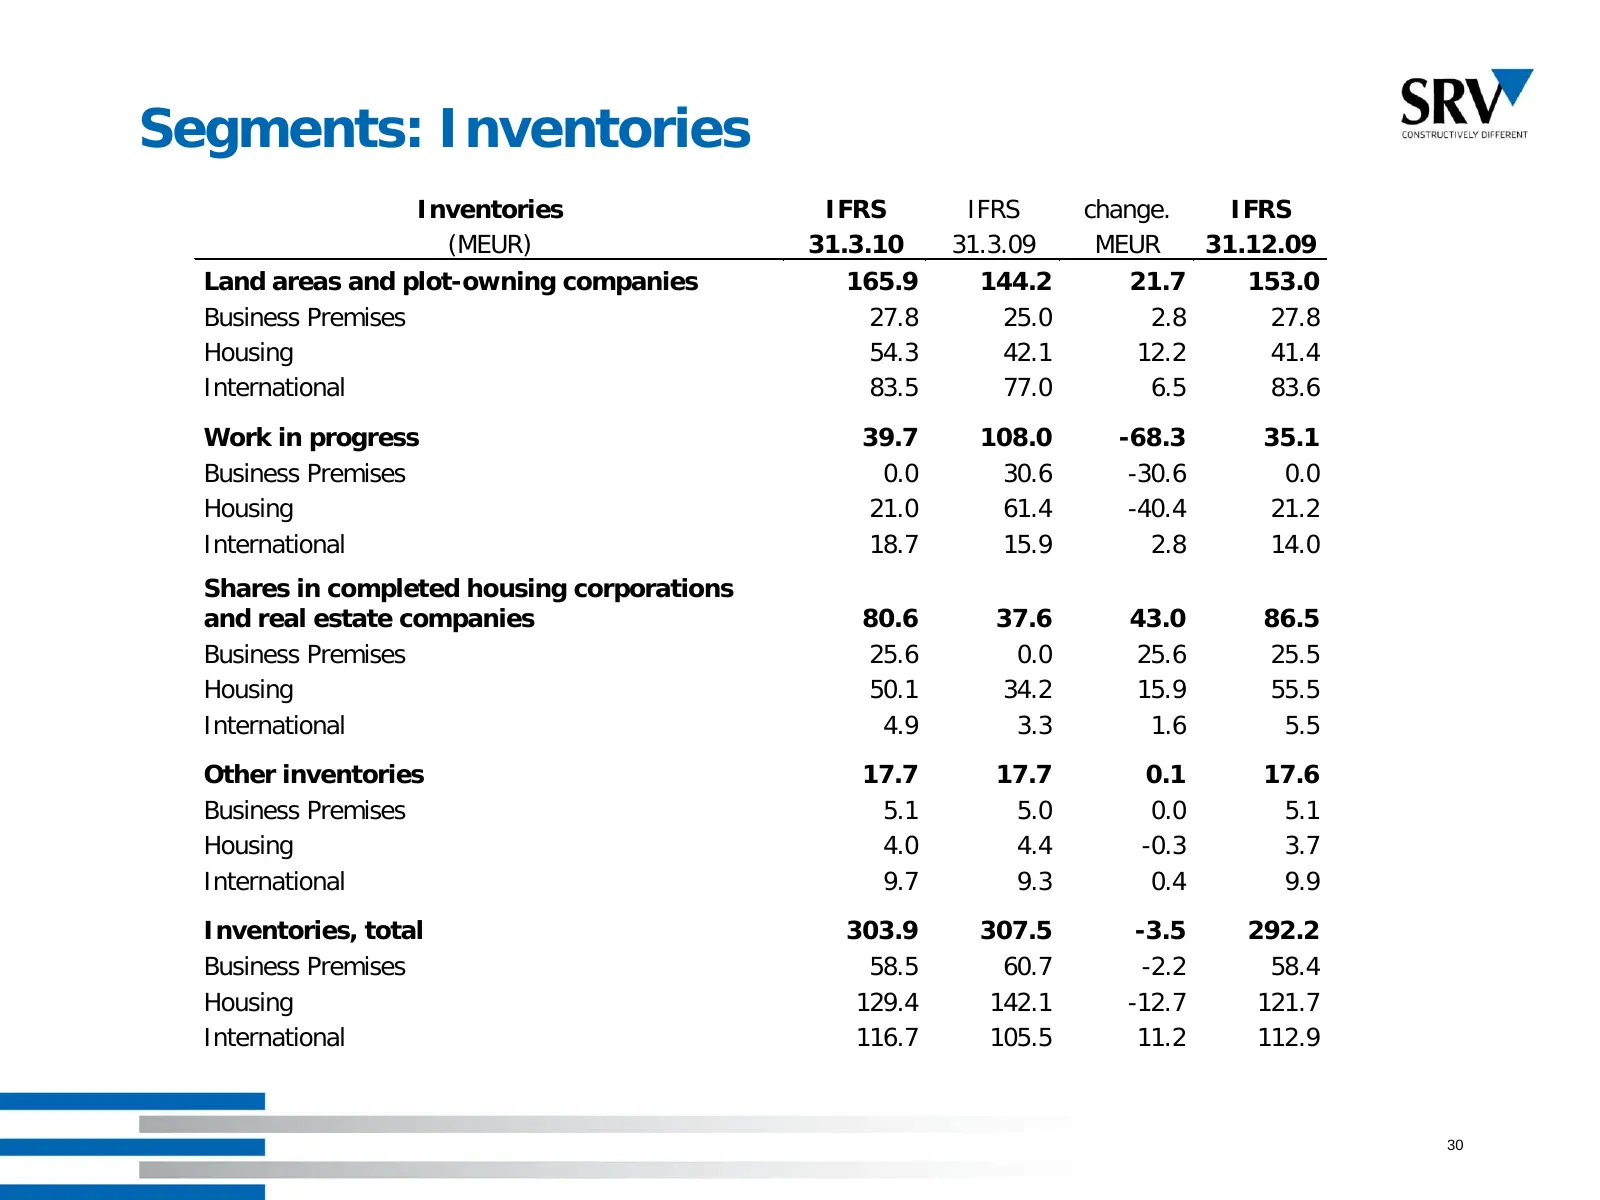
Slide 30: Segments: Inventories
Segments: Inventories Inventories IFRS IFRS change. IFRS (MEUR) 31.3.10 31.3.09 MEUR 31.12.09 Land areas and plot-owning companies 165.9 144.2 21.7 153.0 Business Premises 27.8 25.0 2.8 27.8 Housing 54.3 42.1 12.2 41.4 International 83.5 77.0 6.5 83.6 Work in progress 39.7 108.0 -68.3 35.1 Business
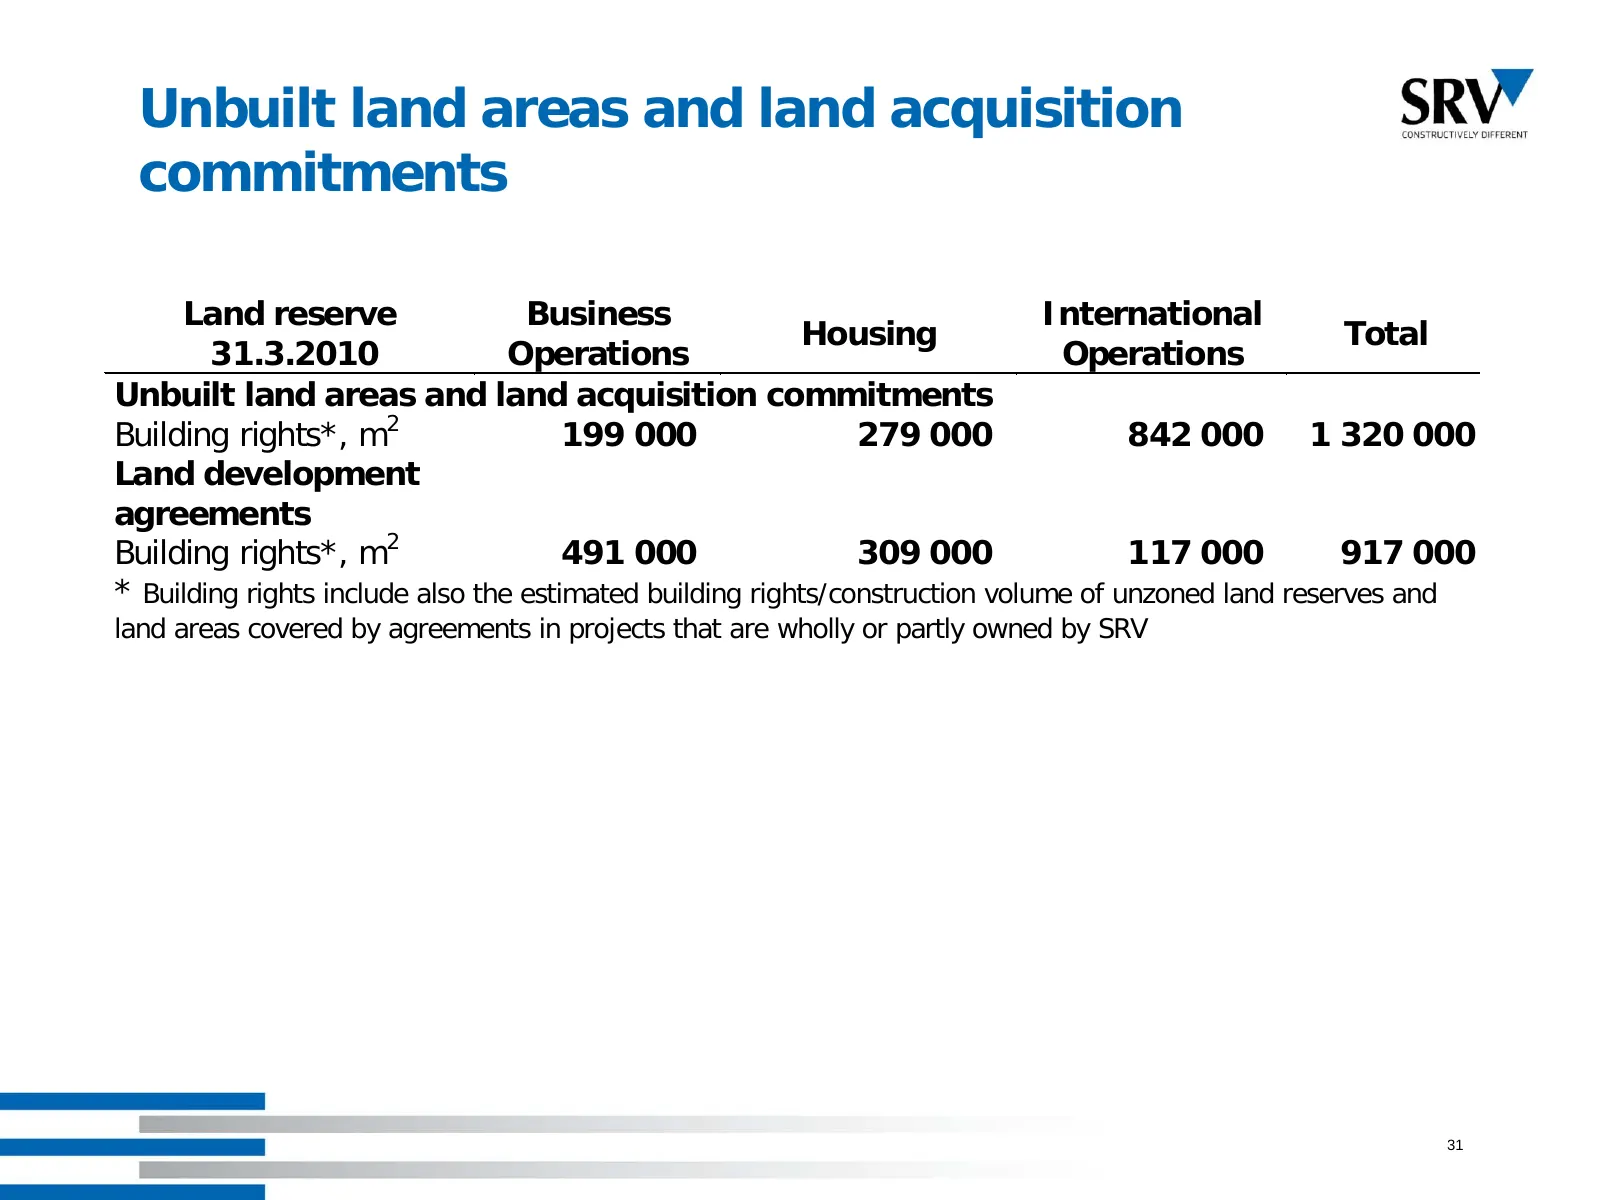
Slide 31: Unbuilt land areas and land acquisition commitments
Unbuilt land areas and land acquisition commitments Land reserve Business International Housing Total 31.3.2010 Operations Operations Unbuilt land areas and land acquisition commitments Building rights*, m2 199 000 279 000 842 000 1 320 000 Land development agreements Building rights*, m2 491 000 30
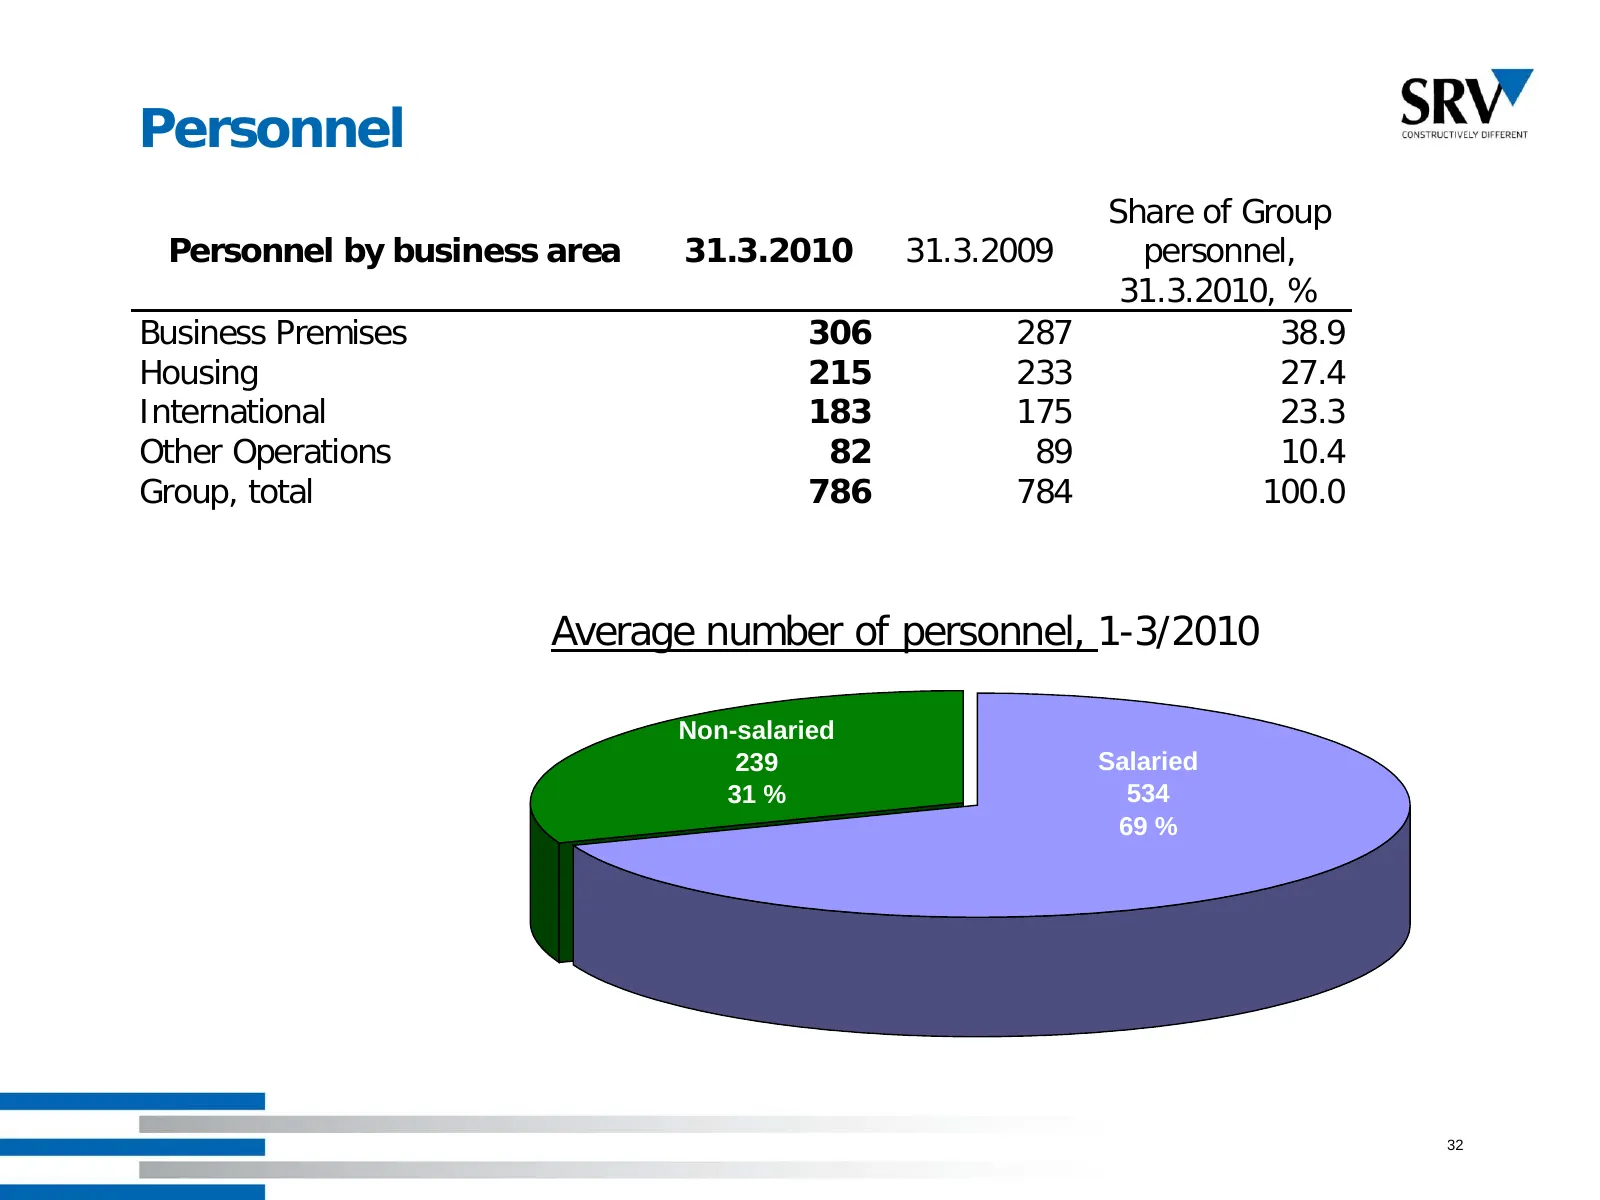
Slide 32: Personnel
Personnel Share of Group Personnel by business area 31.3.2010 31.3.2009 personnel, 31.3.2010, % Business Premises 306 287 38.9 Housing 215 233 27.4 International 183 175 23.3 Other Operations 82 89 10.4 Group, total 786 784 100.0 Average number of personnel, 1-3/2010 Non-salaried 239 Salaried 31 % 5
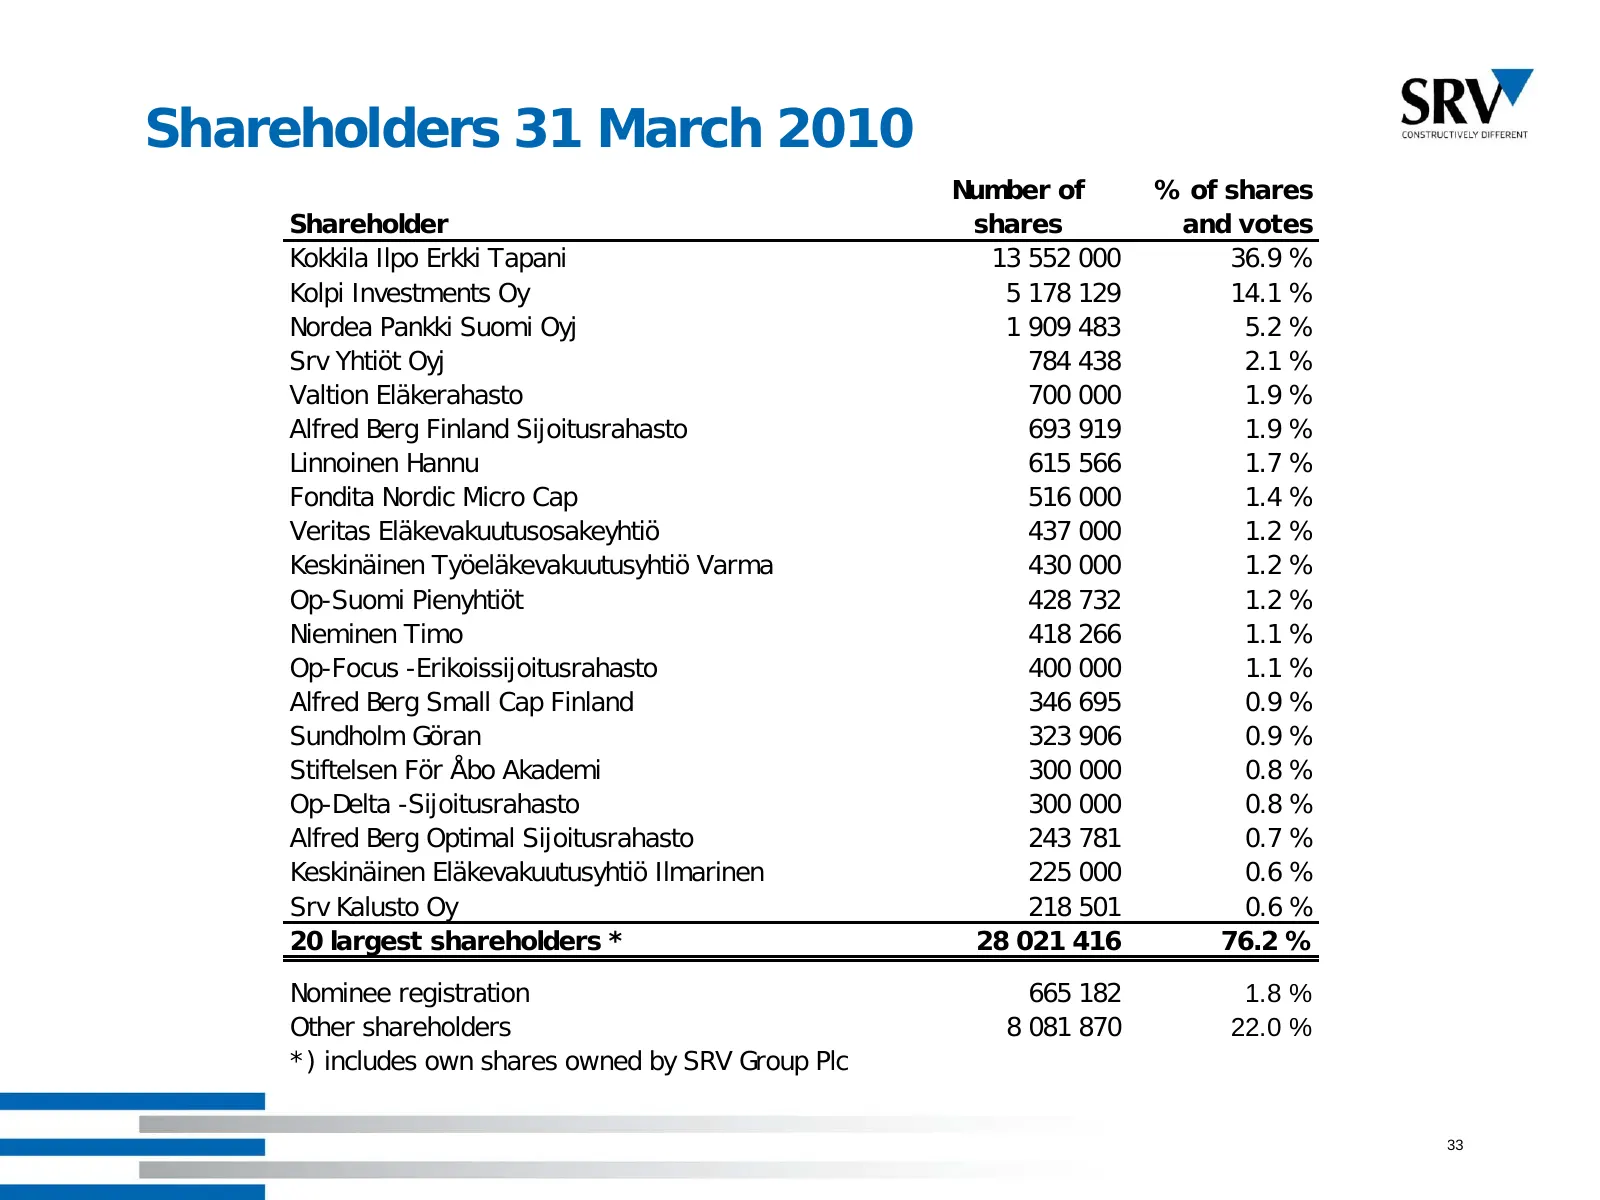
Slide 33: Shareholders 31 March 2010
Shareholders 31 March 2010 Number of % of shares Shareholder shares and votes Kokkila Ilpo Erkki Tapani 13 552 000 36.9 % Kolpi Investments Oy 5 178 129 14.1 % Nordea Pankki Suomi Oyj 1 909 483 5.2 % Srv Yhtiöt Oyj 784 438 2.1 % Valtion Eläkerahasto 700 000 1.9 % Alfred Berg Finland Sijoitusrahasto
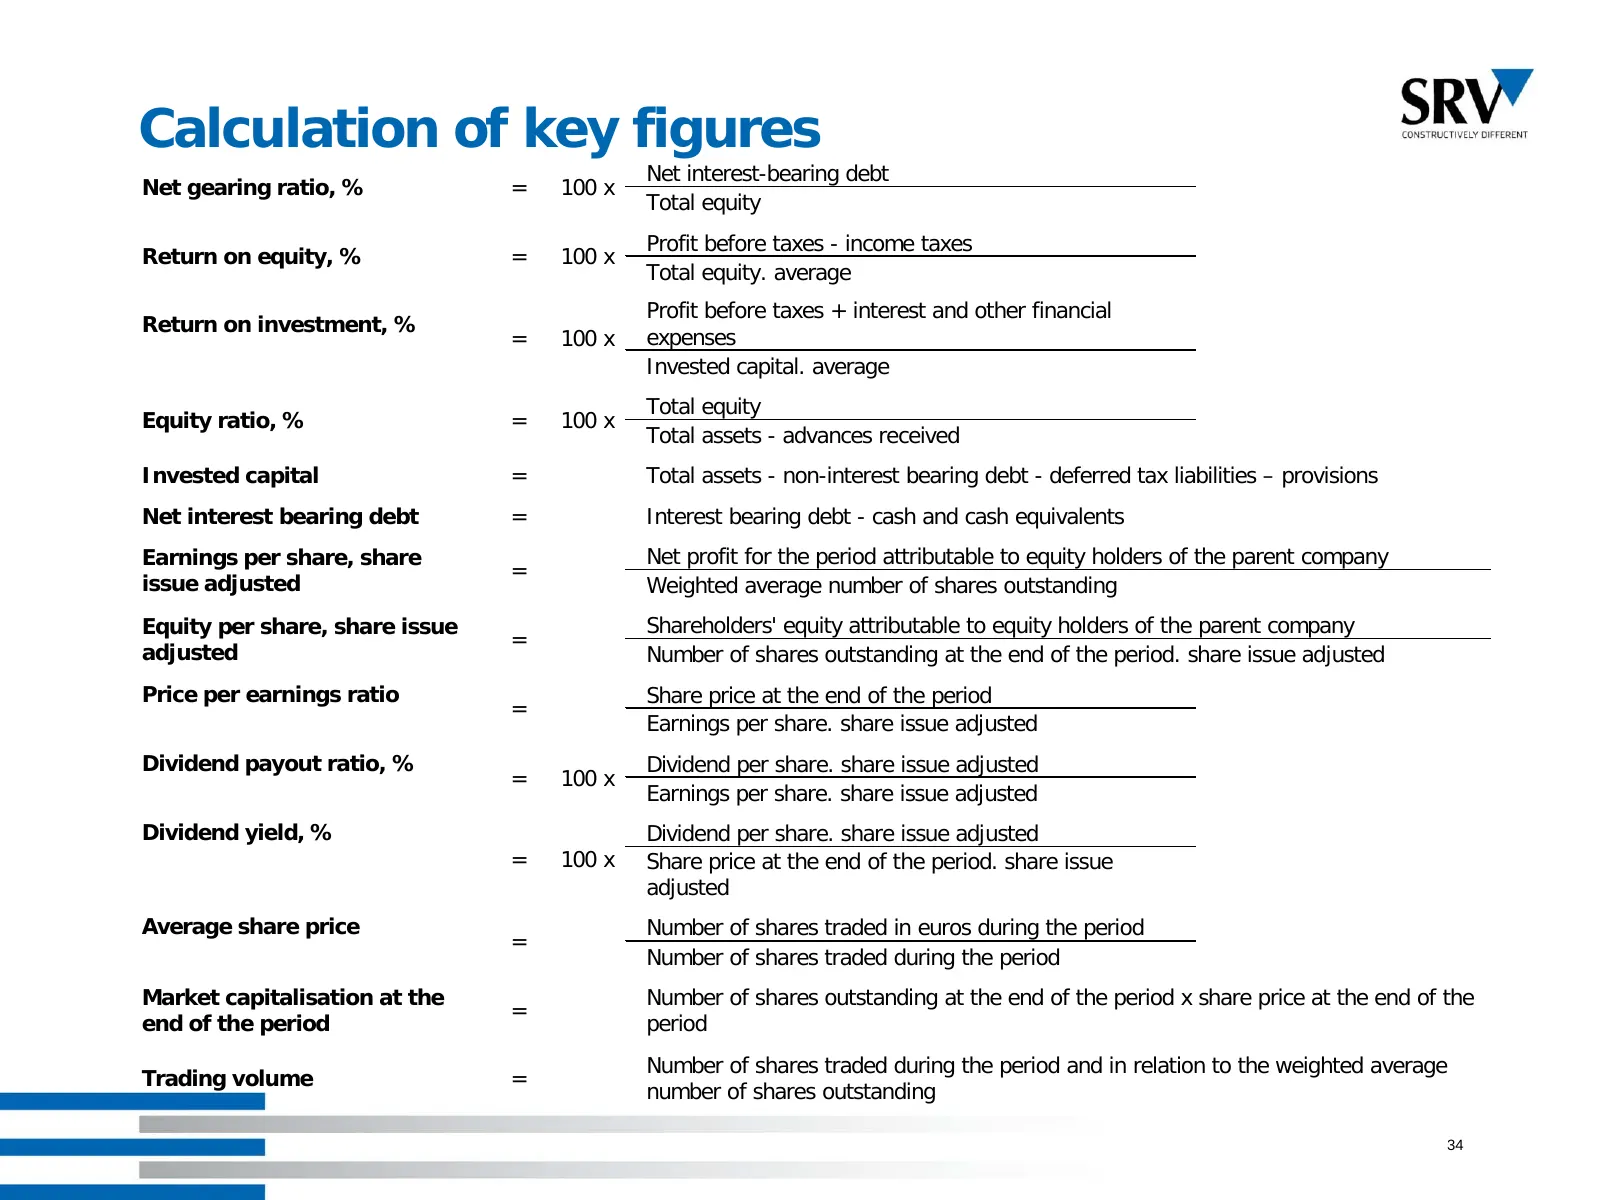
Slide 34: Calculation of key figures
Calculation of key figures Net interest-bearing debt Net gearing ratio, % = 100 x Total equity Profit before taxes - income taxes Return on equity, % = 100 x Total equity. average Profit before taxes + interest and other financial Return on investment, % = 100 x expenses Invested capital. average To
Source: Internet Archive copy of old.srv.fi
More decks from SRV Yhtiot Oyj
 Q1 2024 Earnings Presentation30 slides · Apr 25, 2024
 Q1 2022 Earnings Presentation30 slides · Apr 28, 2022
 Q3 2019 Earnings Presentation46 slides · Oct 31, 2019
 Q3 2016 Earnings Presentation40 slides · Nov 3, 2016
 H1 2016 Earnings Presentation26 slides · Jul 21, 2016
 H1 2016 Earnings Presentation26 slides · Jul 15, 2016