Boyd Group Services Inc · TSX:BYD
Boyd Group Services — Investor Presentation (January 2018)
33 slides from Boyd Group Services's investor presentation, January 2018
Slide 1: Investor Presentation January 2018
Investor Presenta-on January 2018 1
Slide 2: Forward-Looking Statements
Forward-‐Looking Statements This presenta,on contains forward-‐looking statements, other than historical facts, which reflect the view of the Fund's management with respect to future events. Such forward-‐looking statements reflect the current views of the Fund's management and are made on the basi
Slide 3: Capital Markets Profile (as at January 5, 2018)
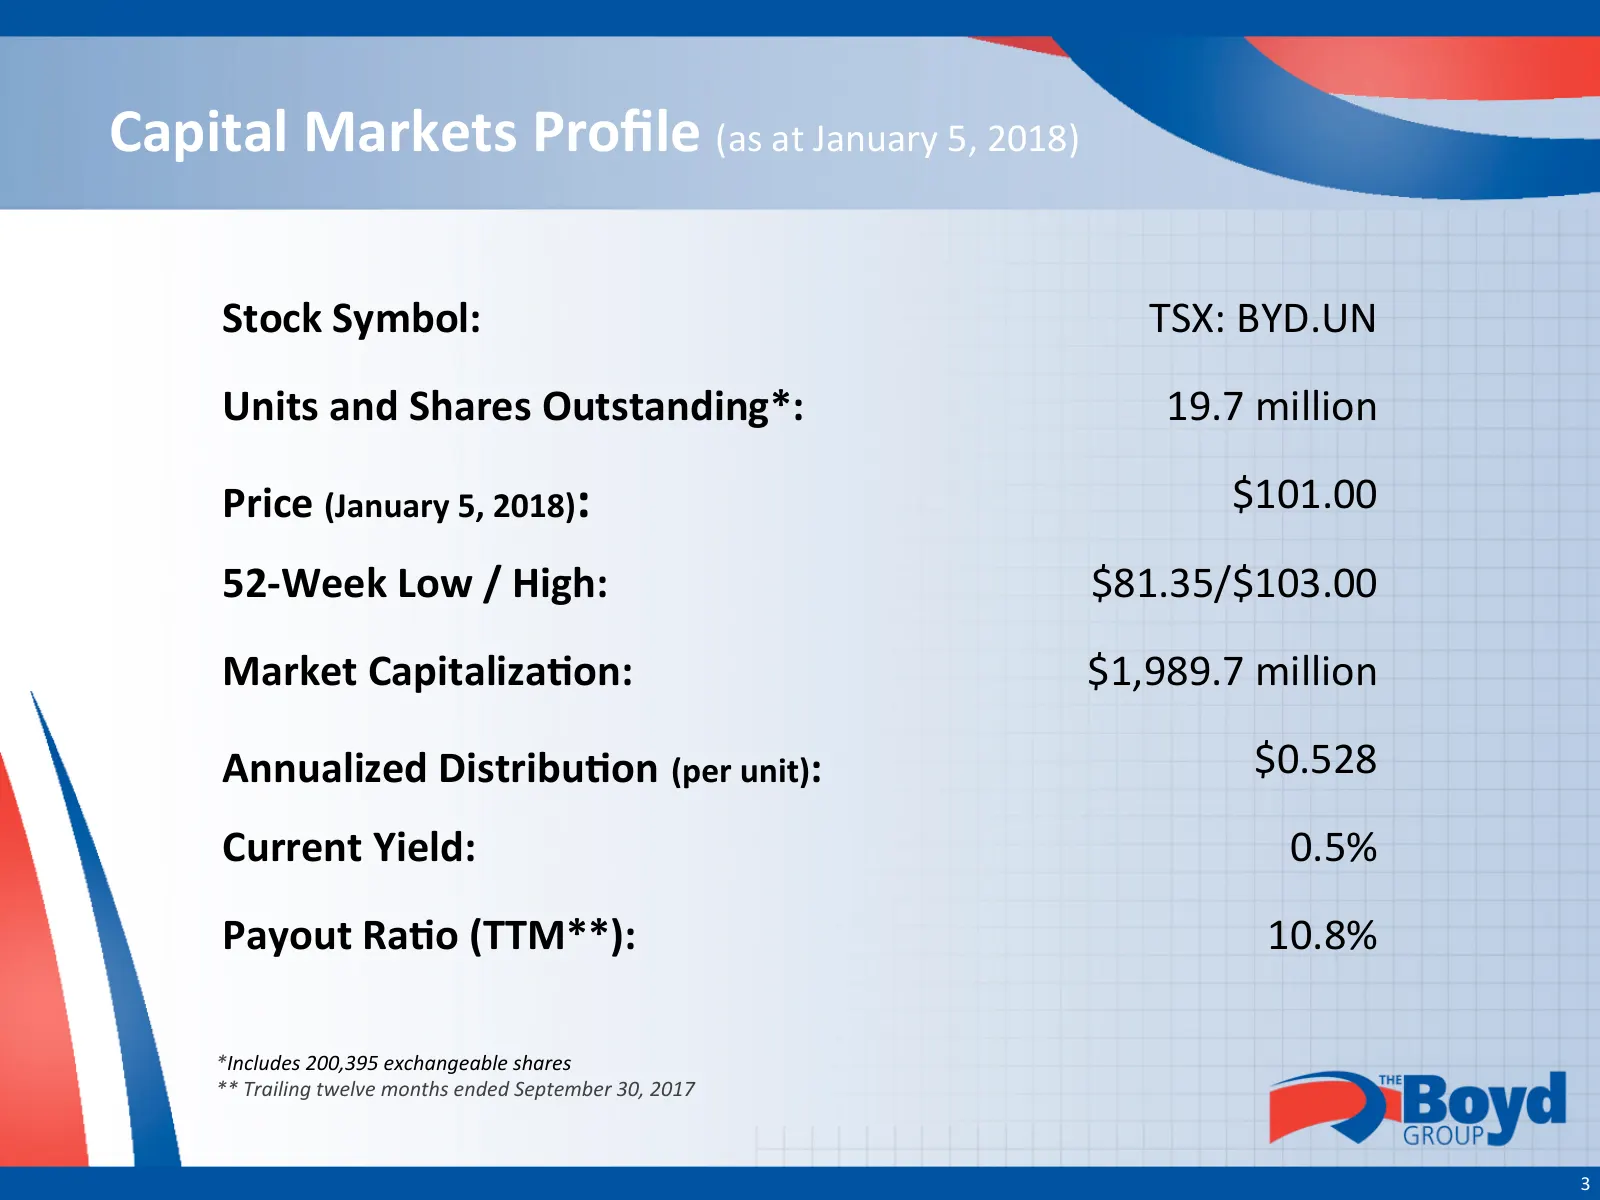
Capital Markets Profile (as at January 5, 2018) Stock Symbol: TSX: BYD.UN Units and Shares Outstanding*: 19.7 million Price (January 5, 2018): $101.00 52-‐Week Low / High: $81.35/$103.00 Market CapitalizaOon: $1,989.7 million Annualized DistribuOon (per unit): $0.528 Current Yield: 0.5% Payout RaOo
Slide 4: Company Overview
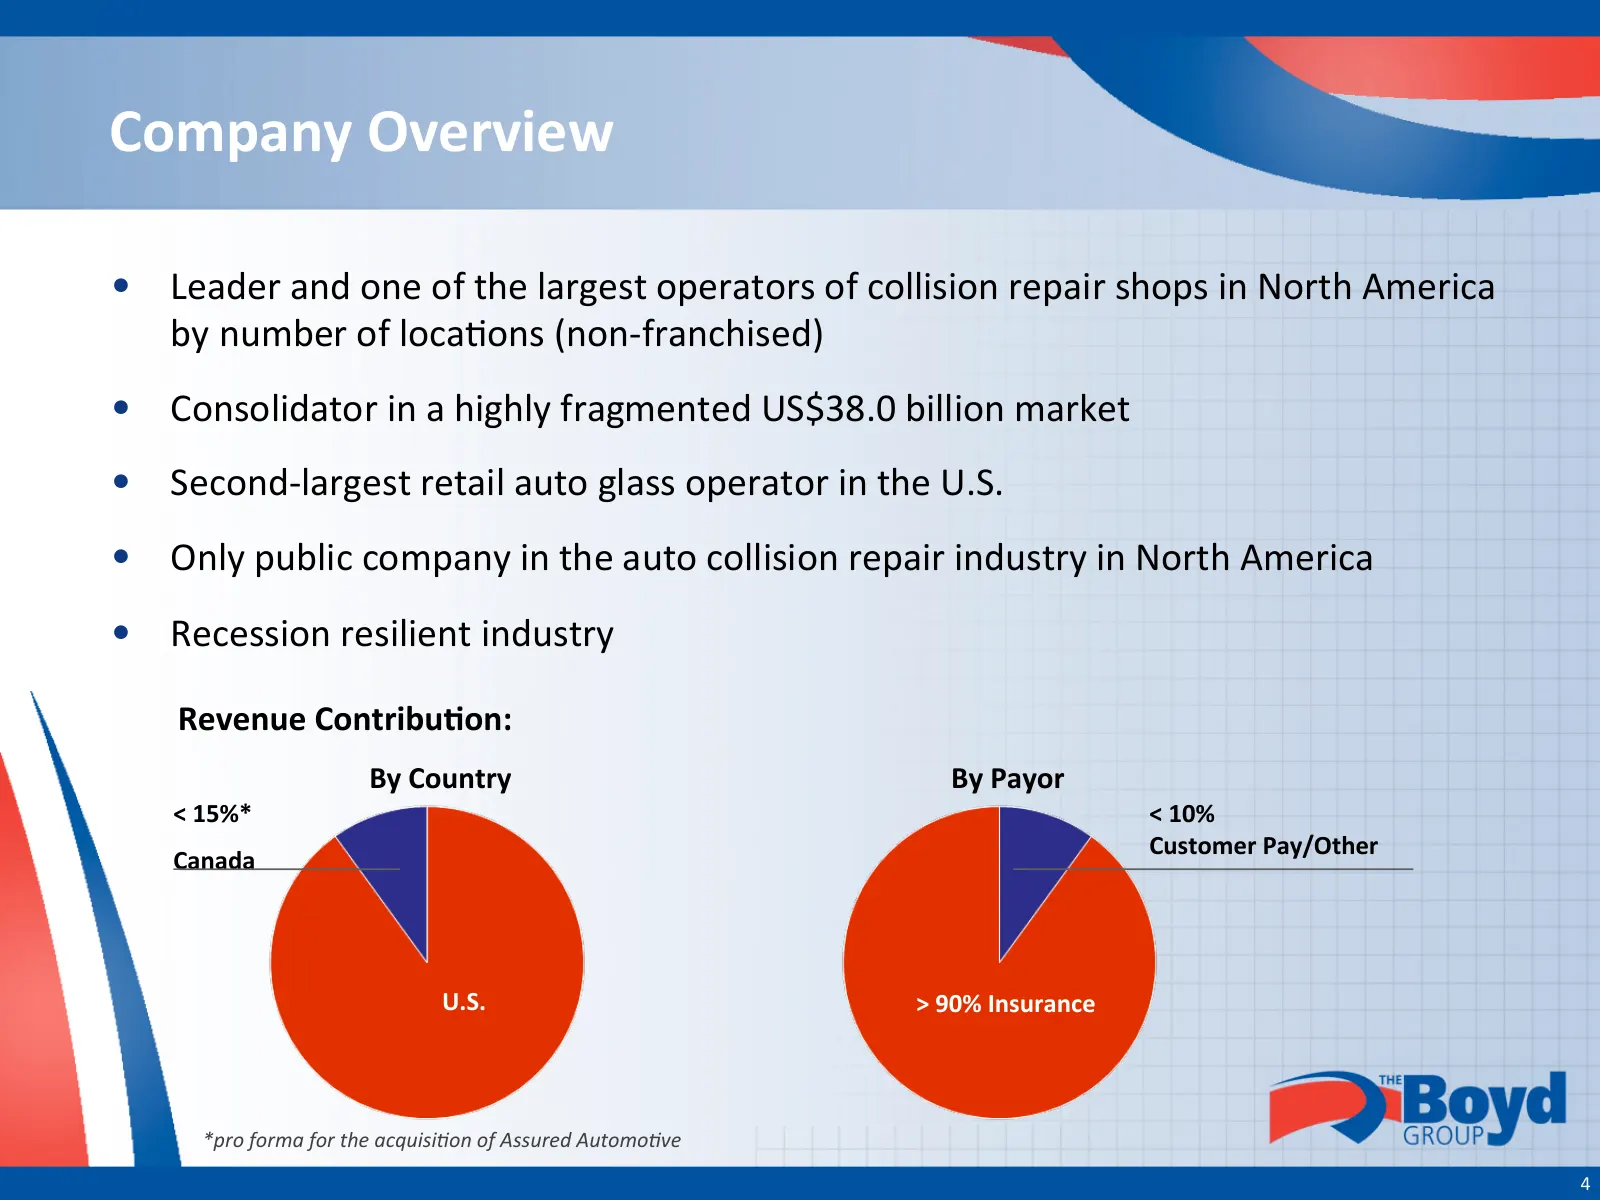
Company Overview • Leader and one of the largest operators of collision repair shops in North America by number of loca-ons (non-‐franchised) • Consolidator in a highly fragmented US$38.0 billion market • Second-‐largest retail auto glass operator in the U.S. • Only public company in the auto coll
Slide 5: Collision Operations
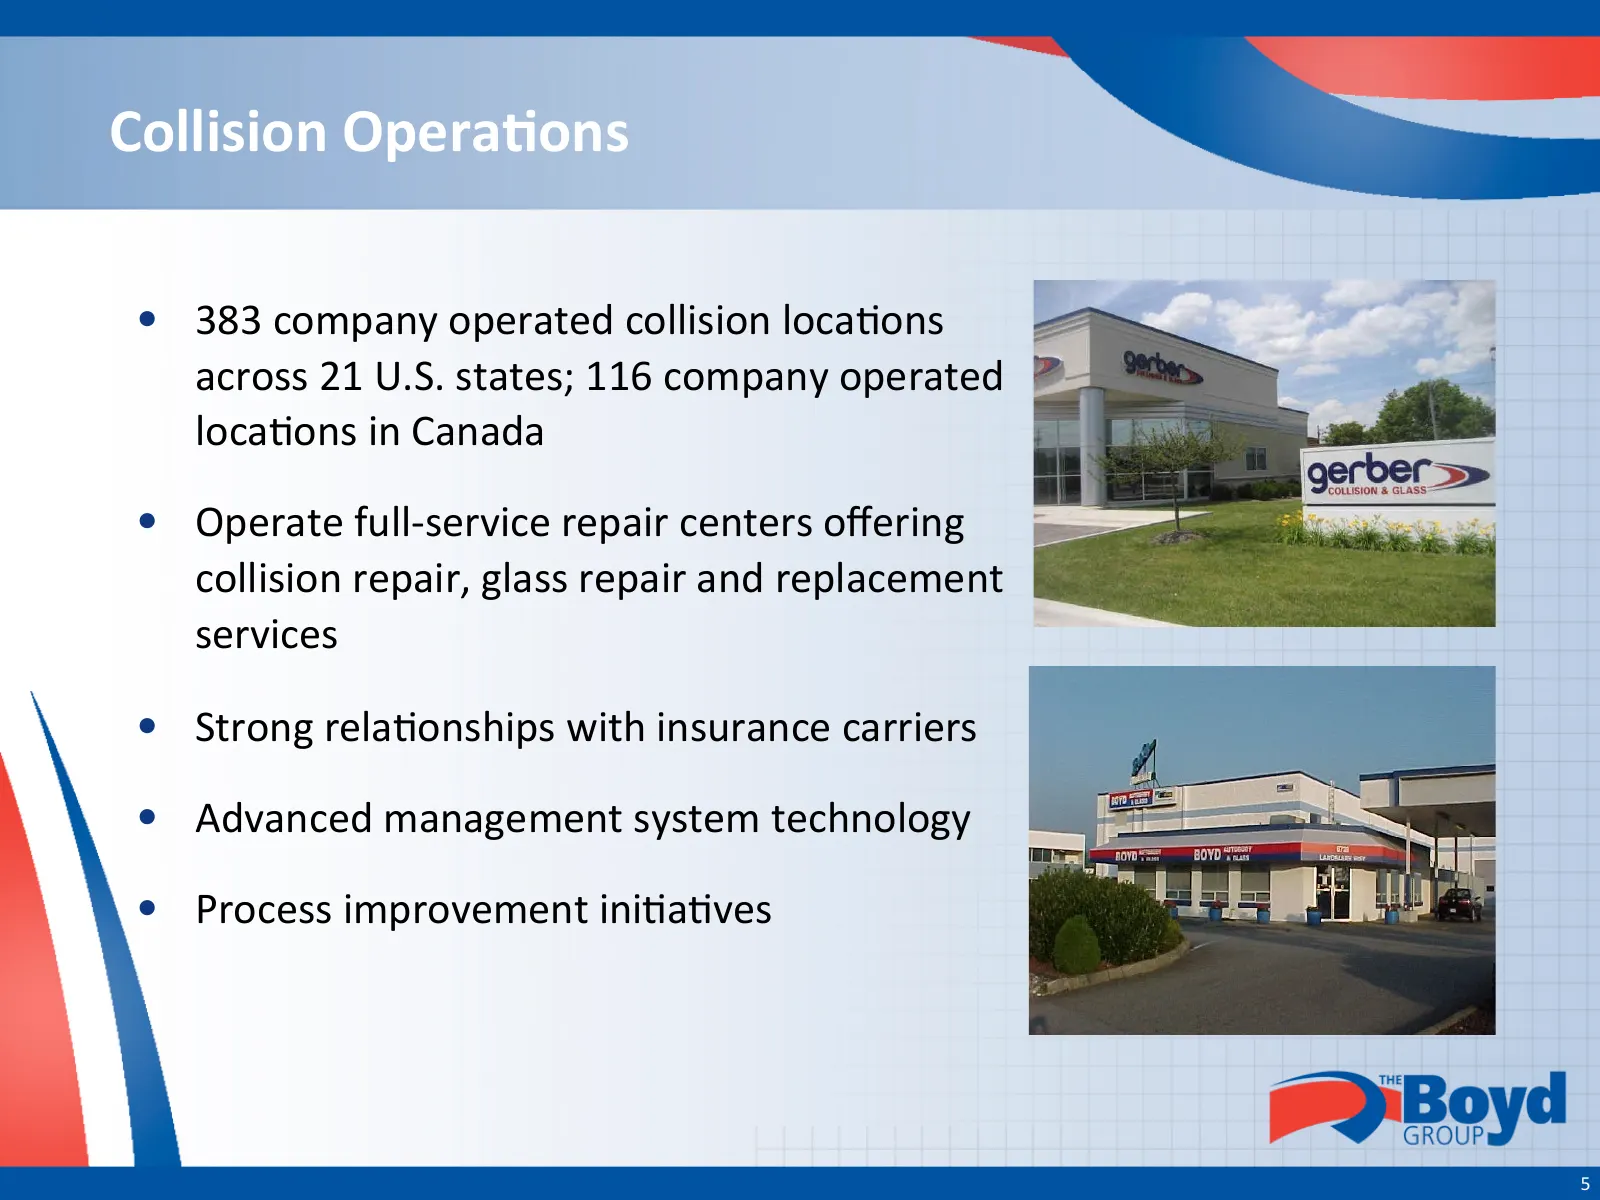
Collision OperaOons • 383 company operated collision loca-ons across 21 U.S. states; 116 company operated loca-ons in Canada • Operate full-‐service repair centers offering collision repair, glass repair and replacement services • Strong rela-onships with insurance carriers • Advanced management sys
Slide 6: North American Collision Repair Footprint
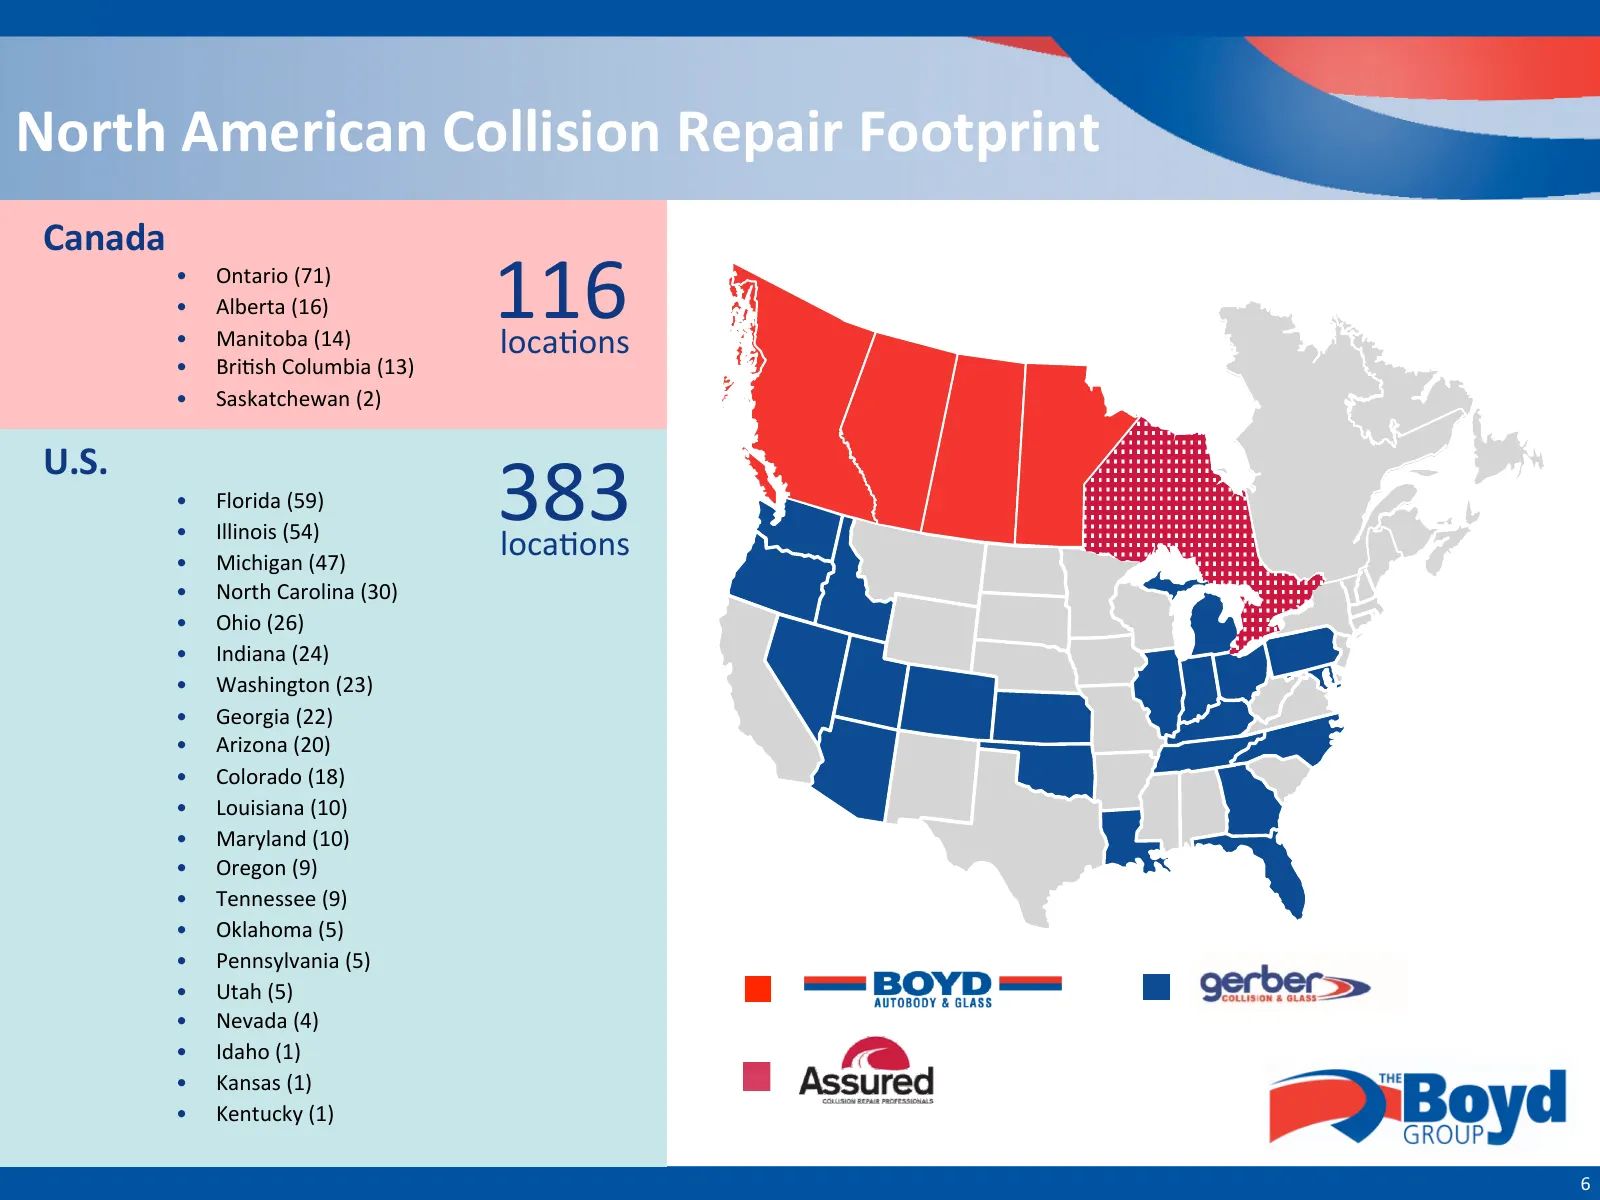
North American Collision Repair Footprint Canada • • • Ontario (71) Alberta (16) Manitoba (14) 116 loca-ons • Bri-sh Columbia (13) • Saskatchewan (2) 383 U.S. • Florida (59) • Illinois (54) • Michigan (47) loca-ons • North Carolina (30) • Ohio (26) • Indiana (24) • Washington (23) • Georgia (22) • A
Slide 7: Glass Operations
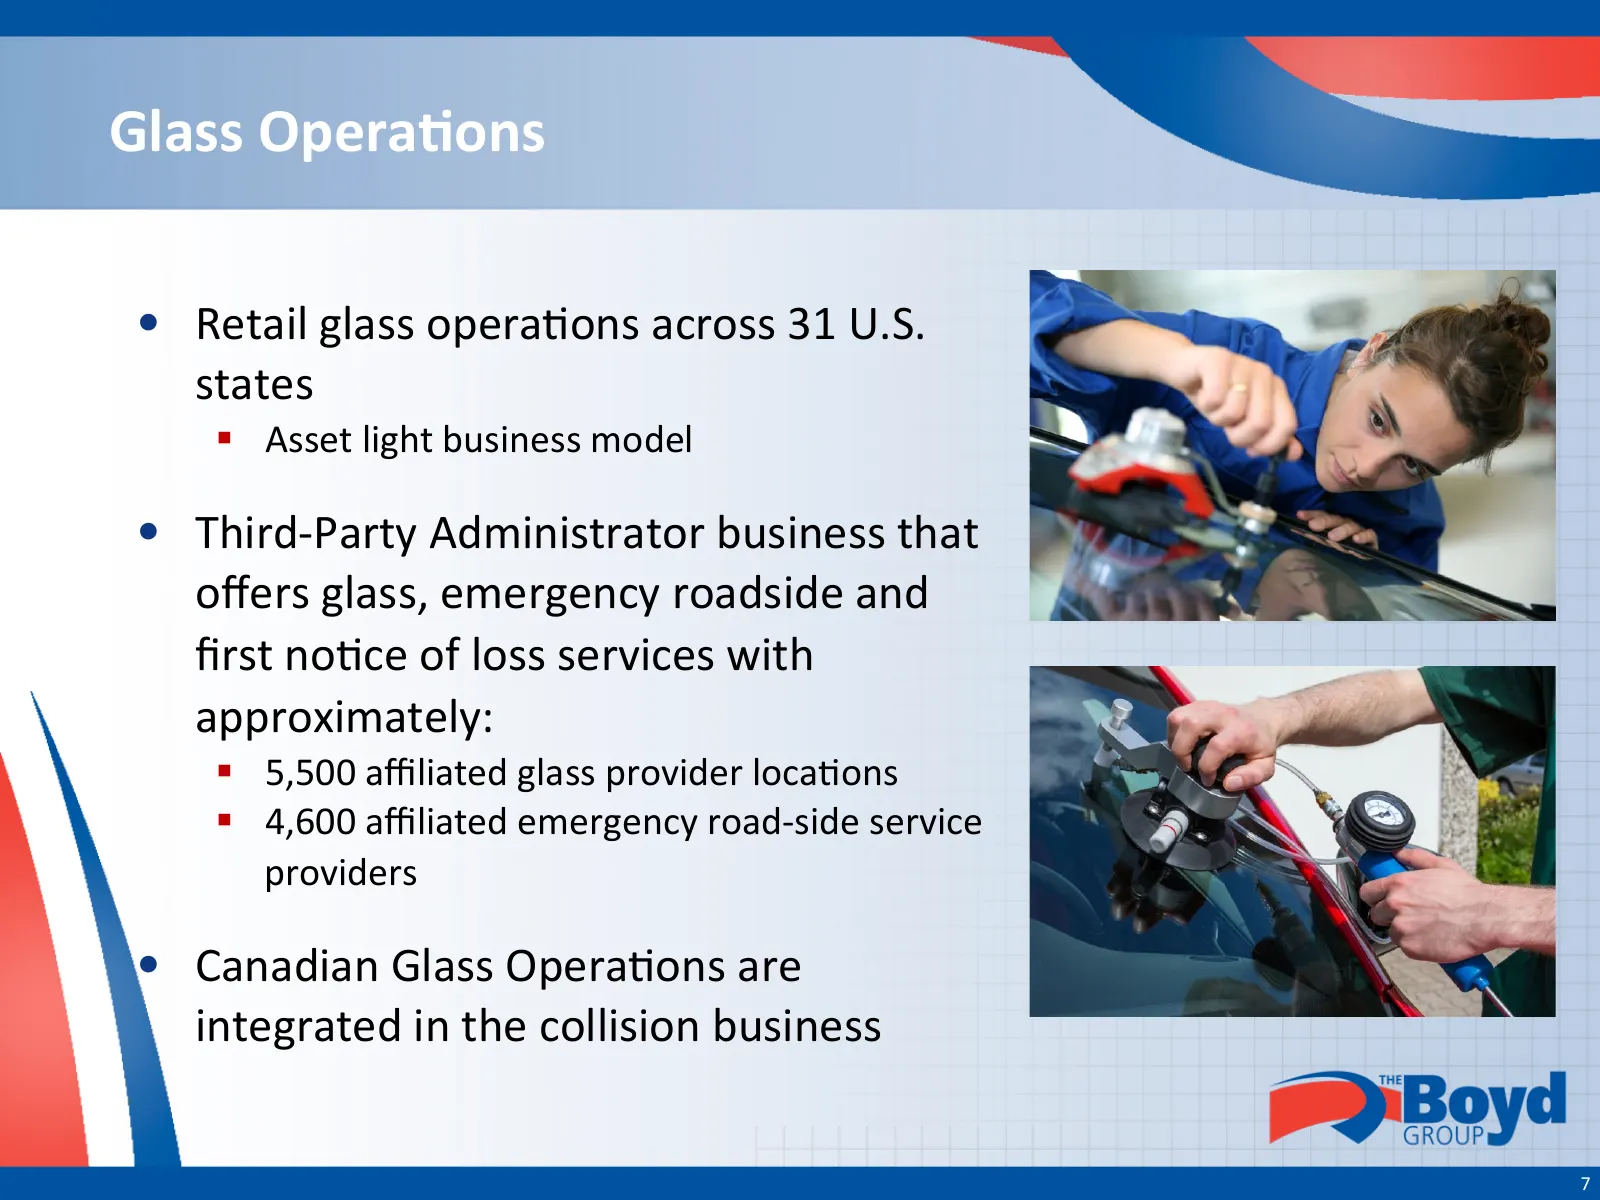
Glass OperaOons • Retail glass opera-ons across 31 U.S. states § Asset light business model • Third-‐Party Administrator business that offers glass, emergency roadside and first no-ce of loss services with approximately: § 5,500 affiliated glass provider loca-ons § 4,600 affiliated emergency road-‐si
Slide 8: North American Glass Footprint
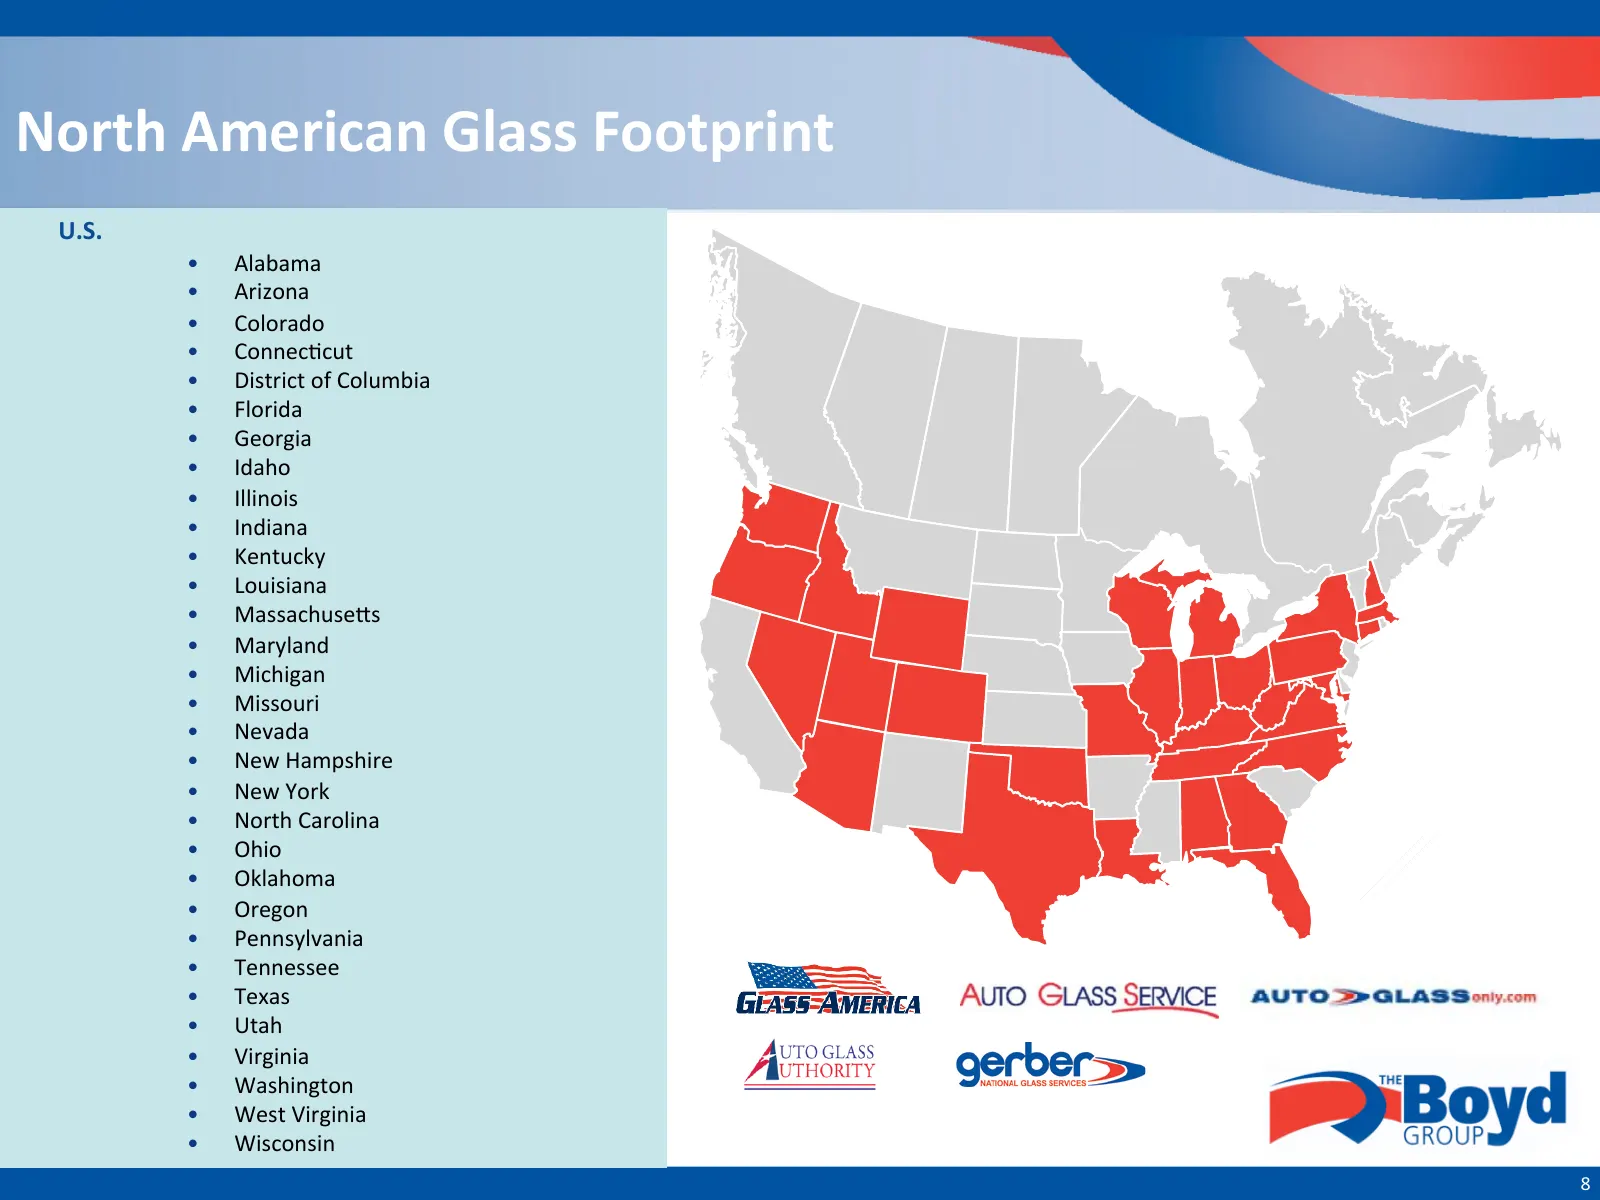
North American Glass Footprint U.S. • Alabama • Arizona • Colorado • Connec-cut • District of Columbia • Florida • Georgia • Idaho • Illinois • Indiana • Kentucky • Louisiana • Massachusehs • Maryland • Michigan • Missouri • Nevada • New Hampshire • New York • North Carolina • Ohio • Oklahoma • Oreg
Slide 9: Market Overview & Business Strategy
Market Overview & Business Strategy 9
Slide 10: Large, Fragmented Market
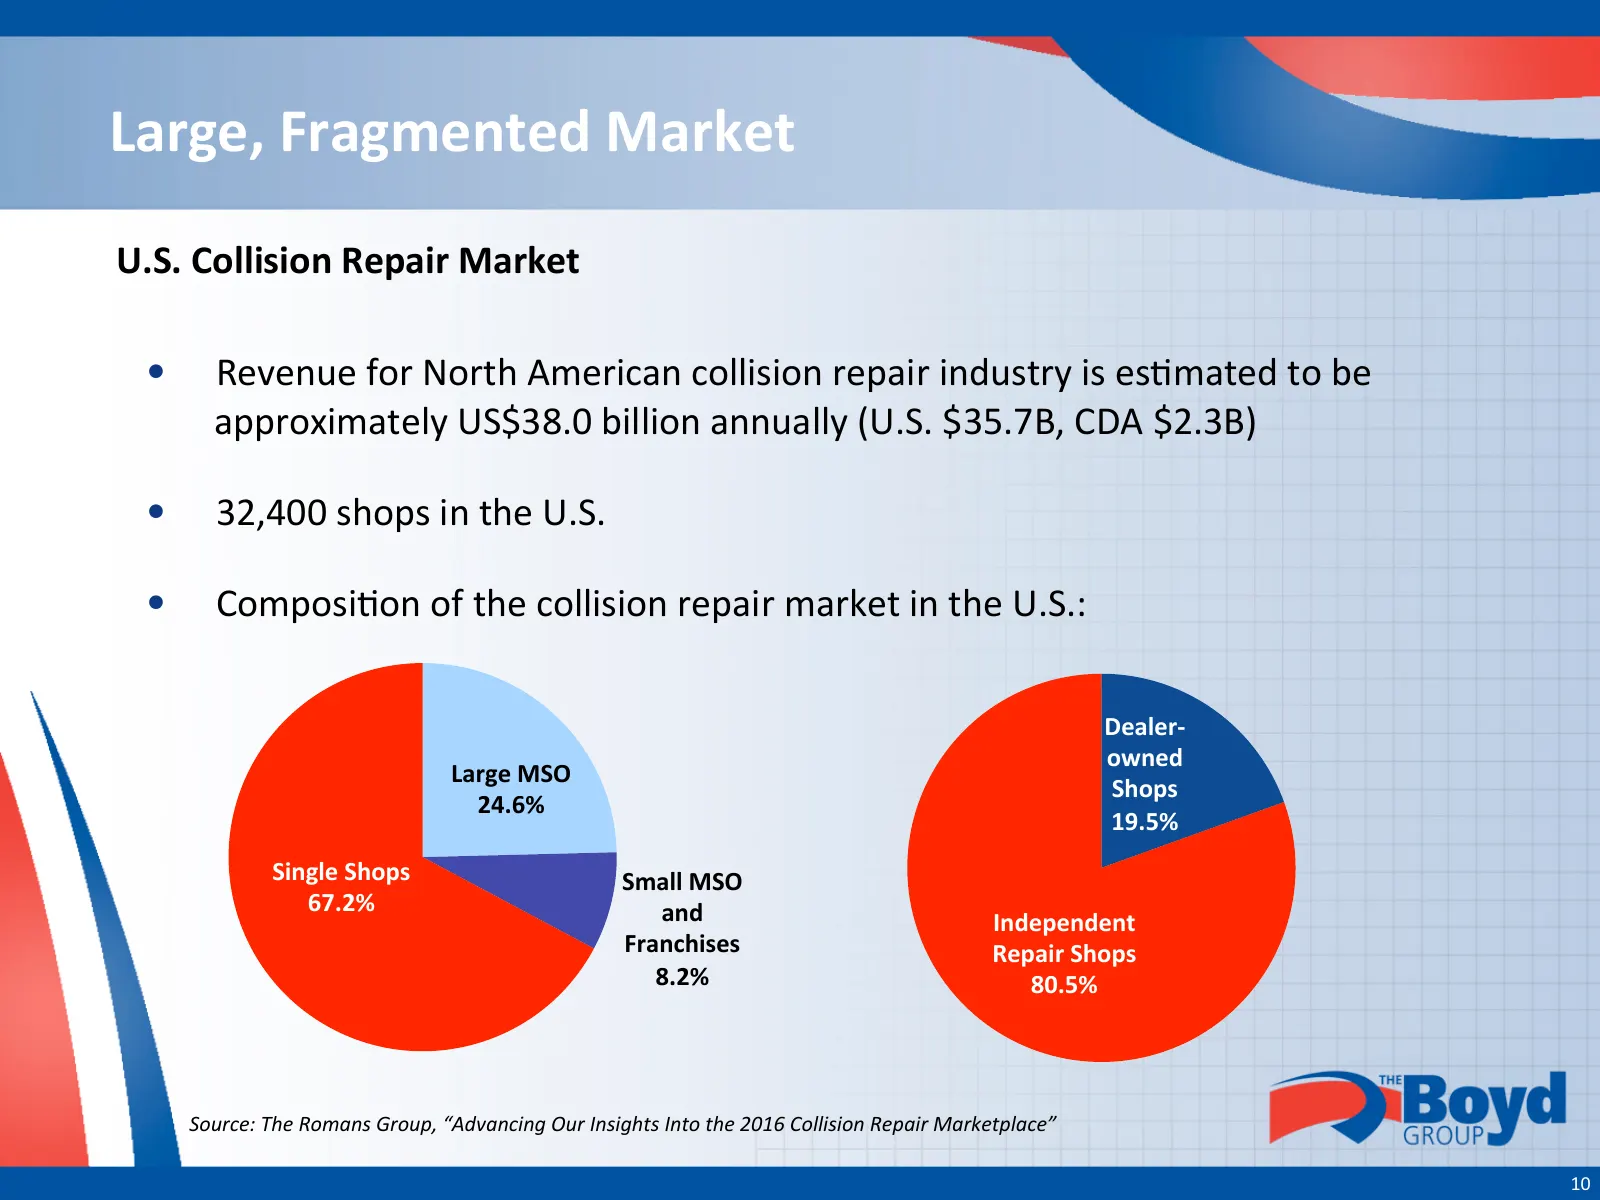
Large, Fragmented Market U.S. Collision Repair Market • Revenue for North American collision repair industry is es-mated to be approximately US$38.0 billion annually (U.S. $35.7B, CDA $2.3B) • 32,400 shops in the U.S. • Composi-on of the collision repair market in the U.S.: Dealer-‐ owned Large MSO
Slide 11: Evolving Collision Repair Market
Evolving Collision Repair Market • Long-‐term decline of independent and dealership repair facili-es § Total number of independent and dealership collision repair loca-ons has declined by 24.7% from late 2007 to 2016, and almost 60% over the past 36 years • Large mul--‐shop collision repair opera
Slide 12: Strong Relationships with Insurance Companies through DRPs
Strong RelaOonships with Insurance Companies through DRPs • Direct Repair Programs (“DRPs”) are established between insurance companies and collision repair shops to beher manage auto repair claims and the level of customer sa-sfac-on • Auto insurers u-lize DRPs for a growing percentage of collision
Slide 13: Insurer Market Dynamics
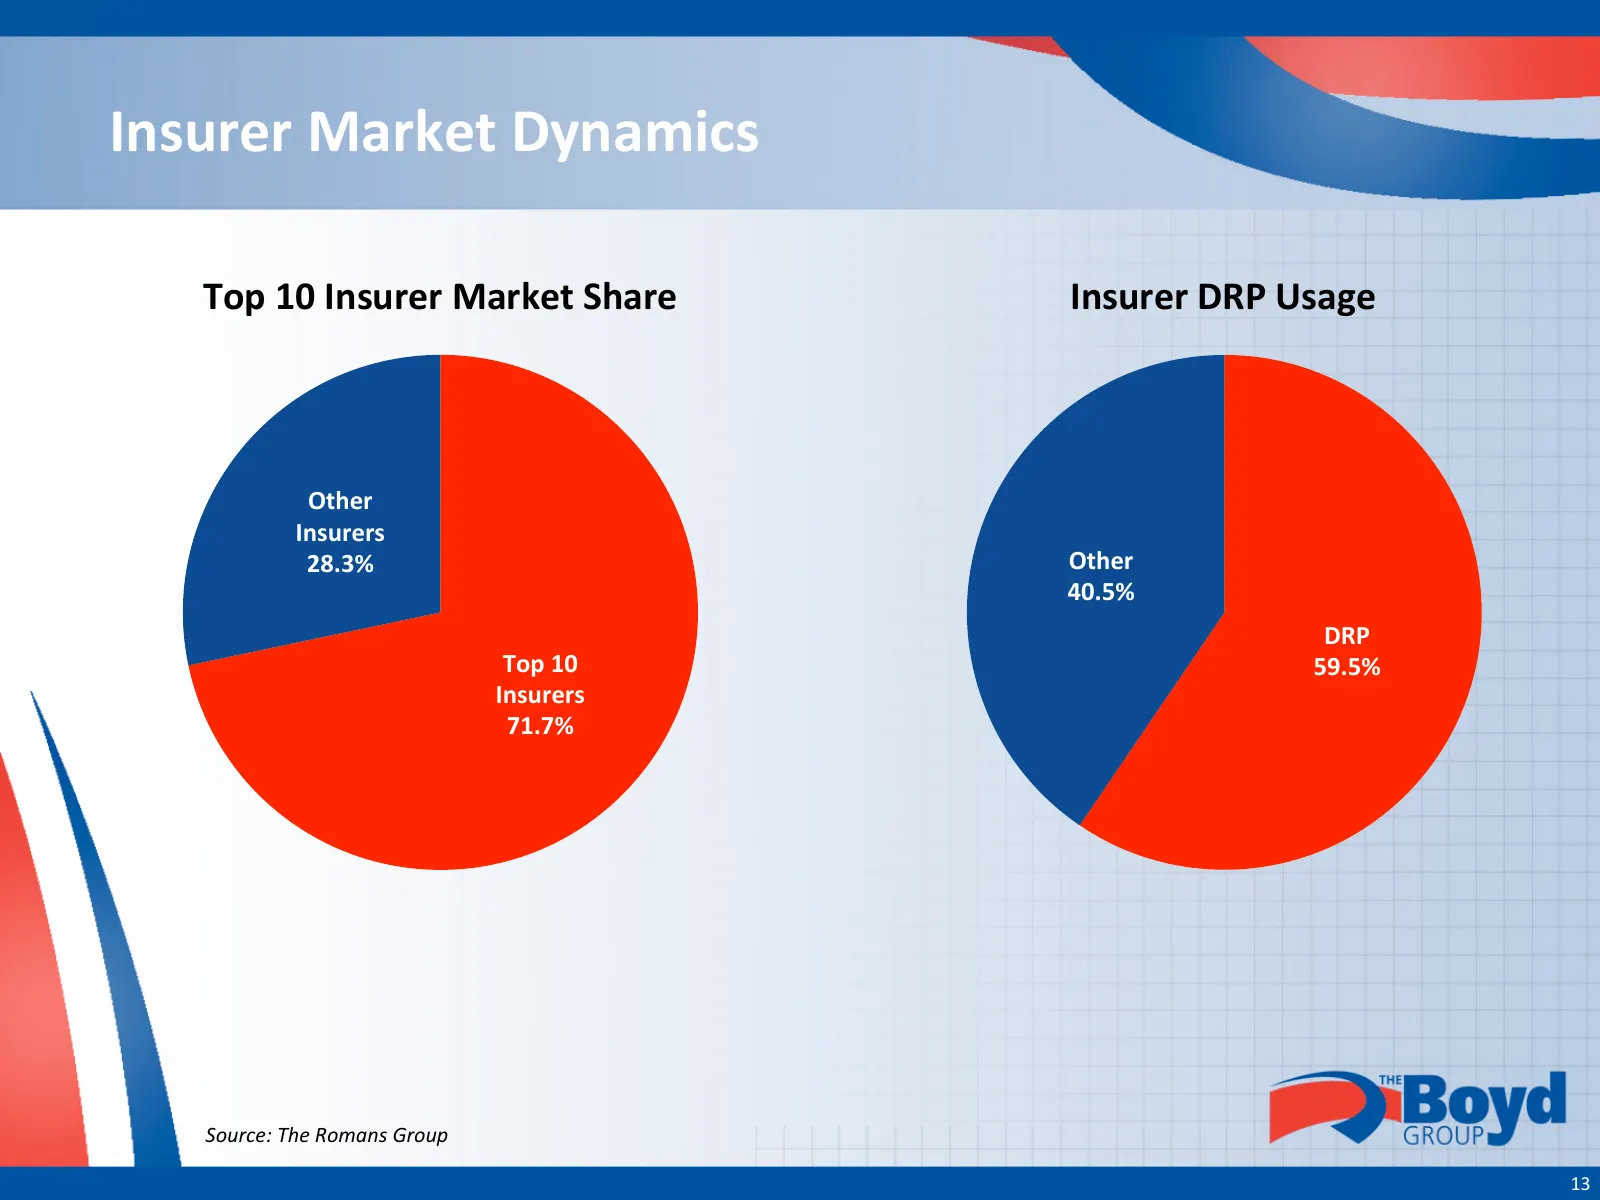
Insurer Market Dynamics Top 10 Insurer Market Share Insurer DRP Usage Other Insurers 28.3% Other 40.5% DRP Top 10 59.5% Insurers 71.7% Source: The Romans Group 13
Slide 14: Impact of Collision Avoidance Systems
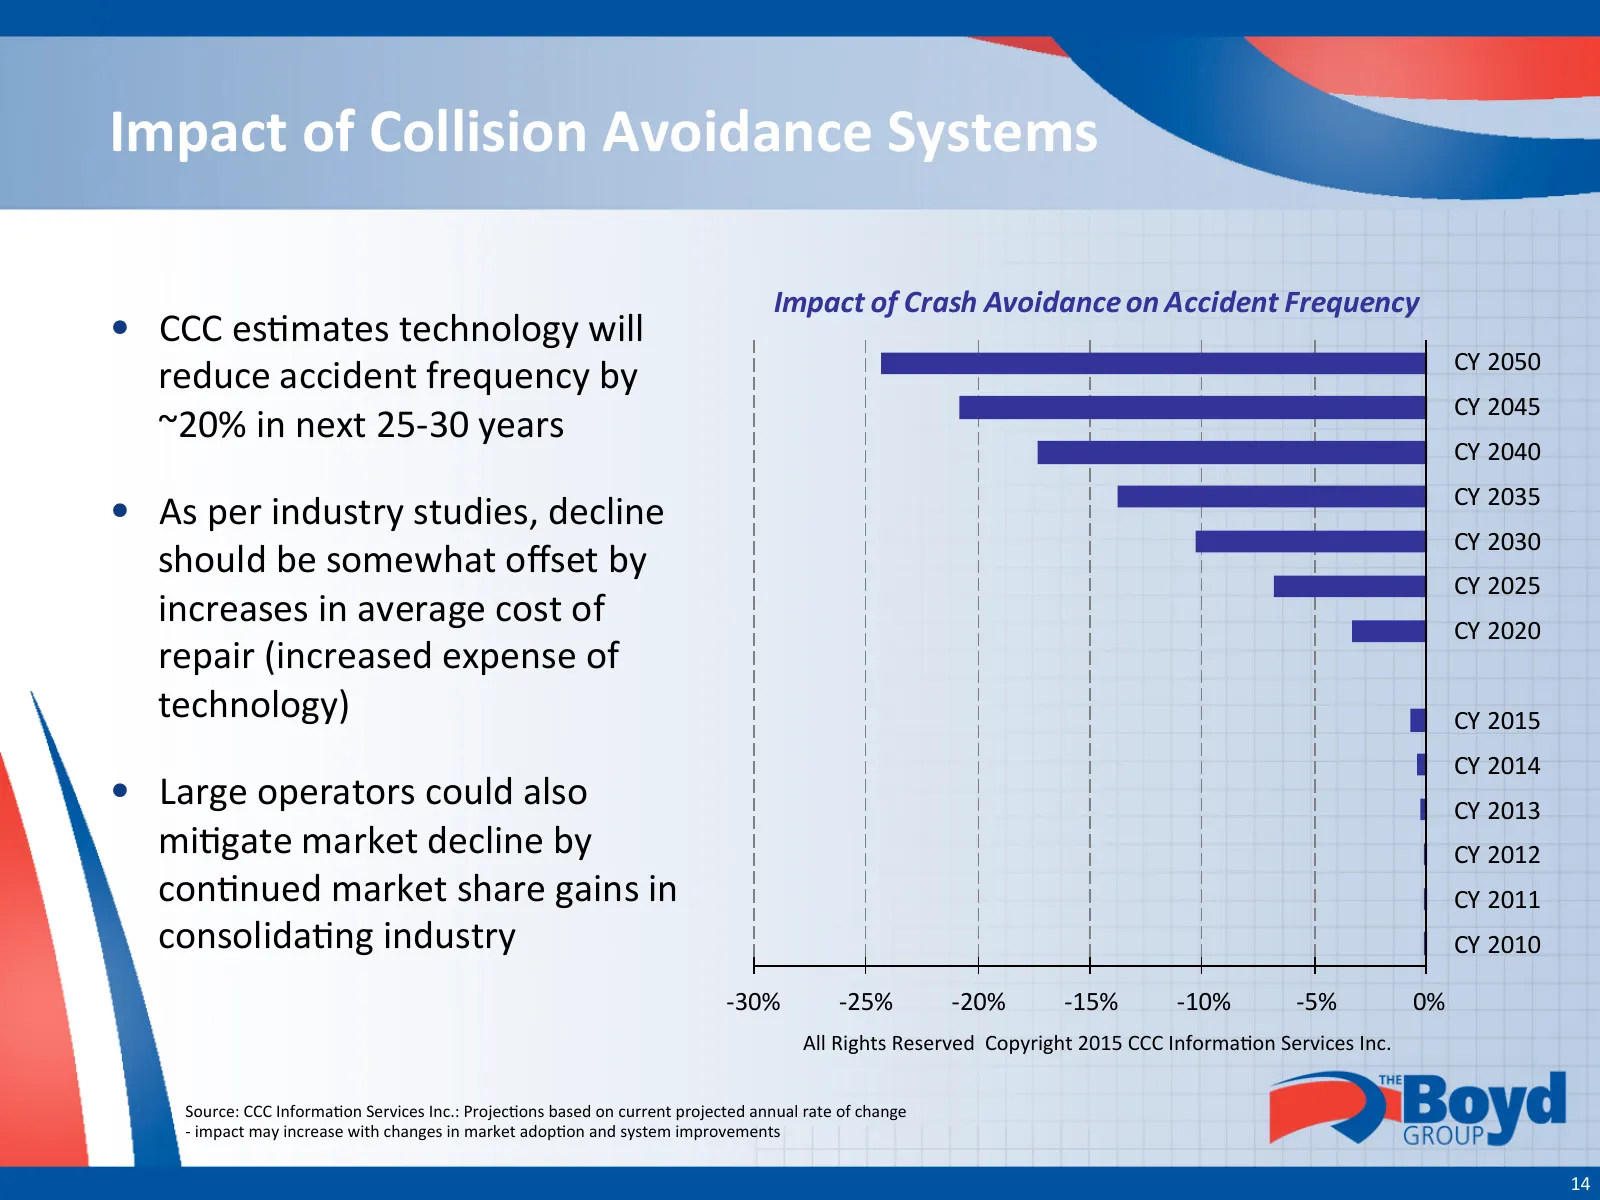
Impact of Collision Avoidance Systems Impact of Crash Avoidance on Accident Frequency • CCC es-mates technology will CY 2050 reduce accident frequency by CY 2045 ~20% in next 25-‐30 years CY 2040 CY 2035 • As per industry studies, decline CY 2030 should be somewhat offset by CY 2025 increases in ave
Slide 15: Business Strategy
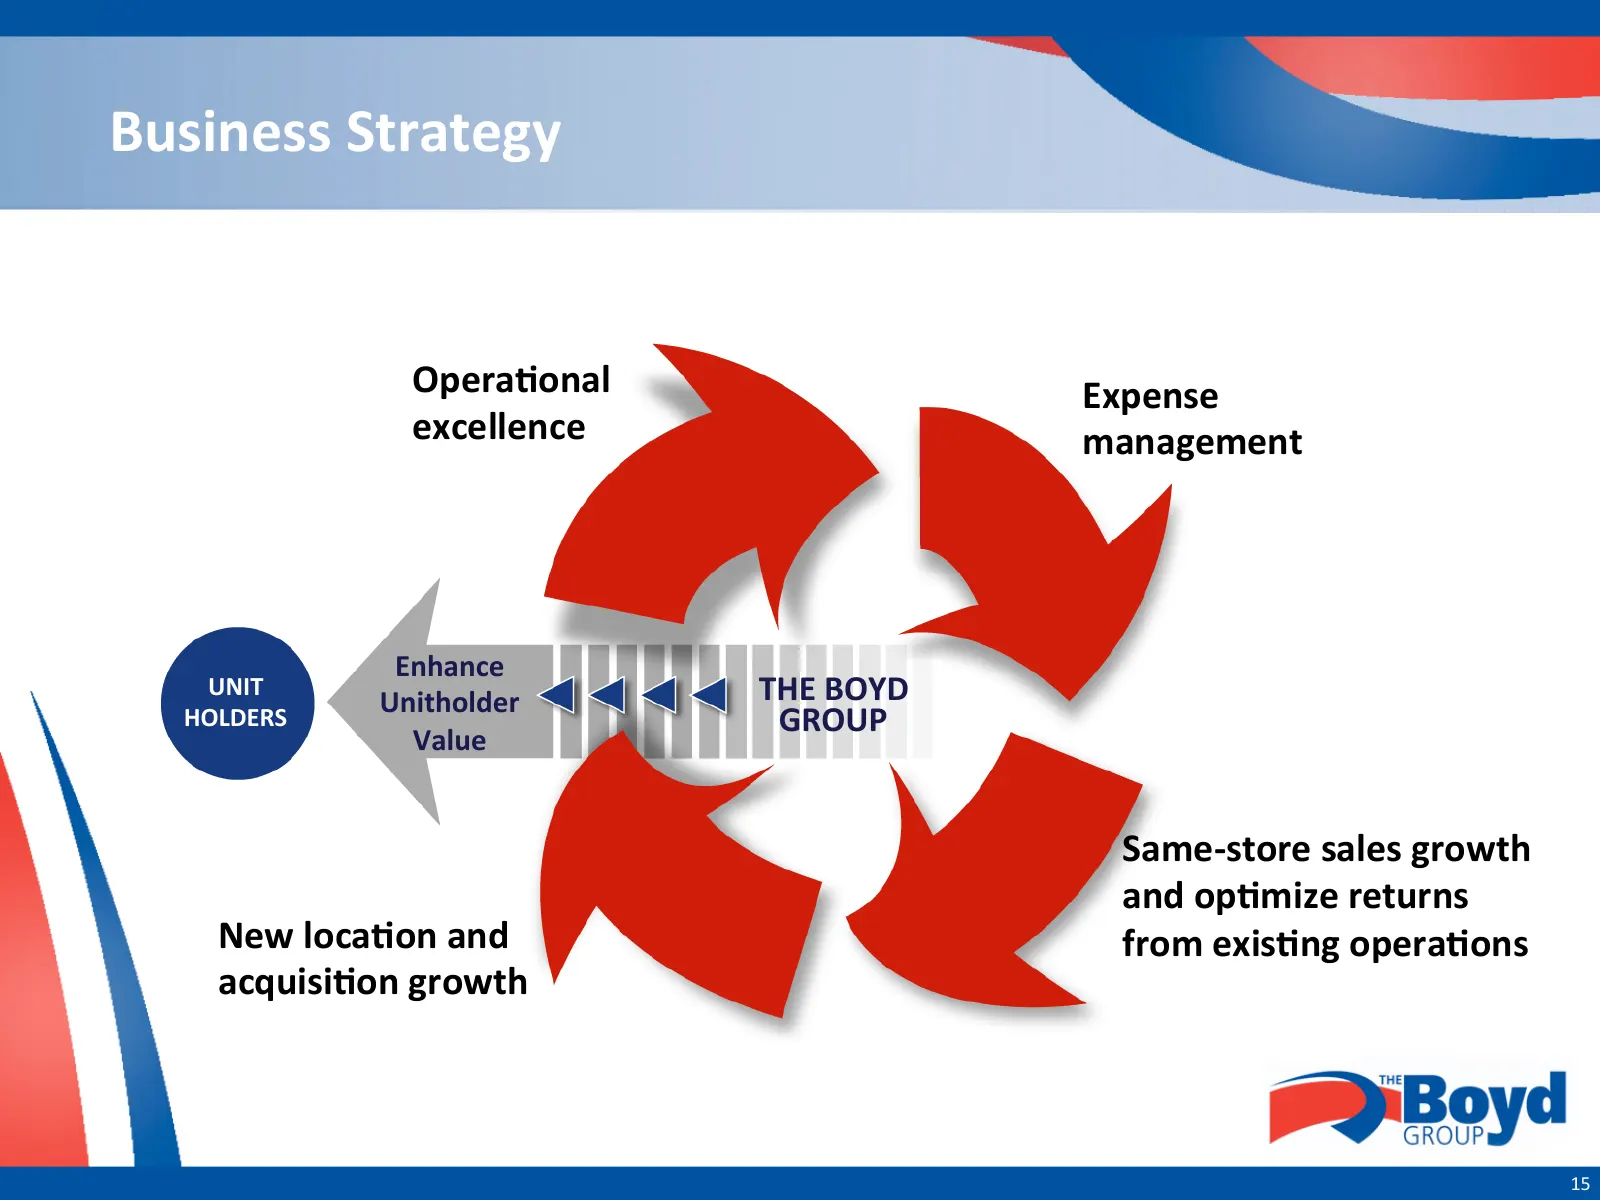
Business Strategy OperaOonal Expense excellence management Enhance UNIT Unitholder THE BOYD HOLDERS GROUP Value Same-‐store sales growth and opOmize returns New locaOon and from exisOng operaOons acquisiOon growth 15
Slide 16: Operational Excellence – WOW Operating Way
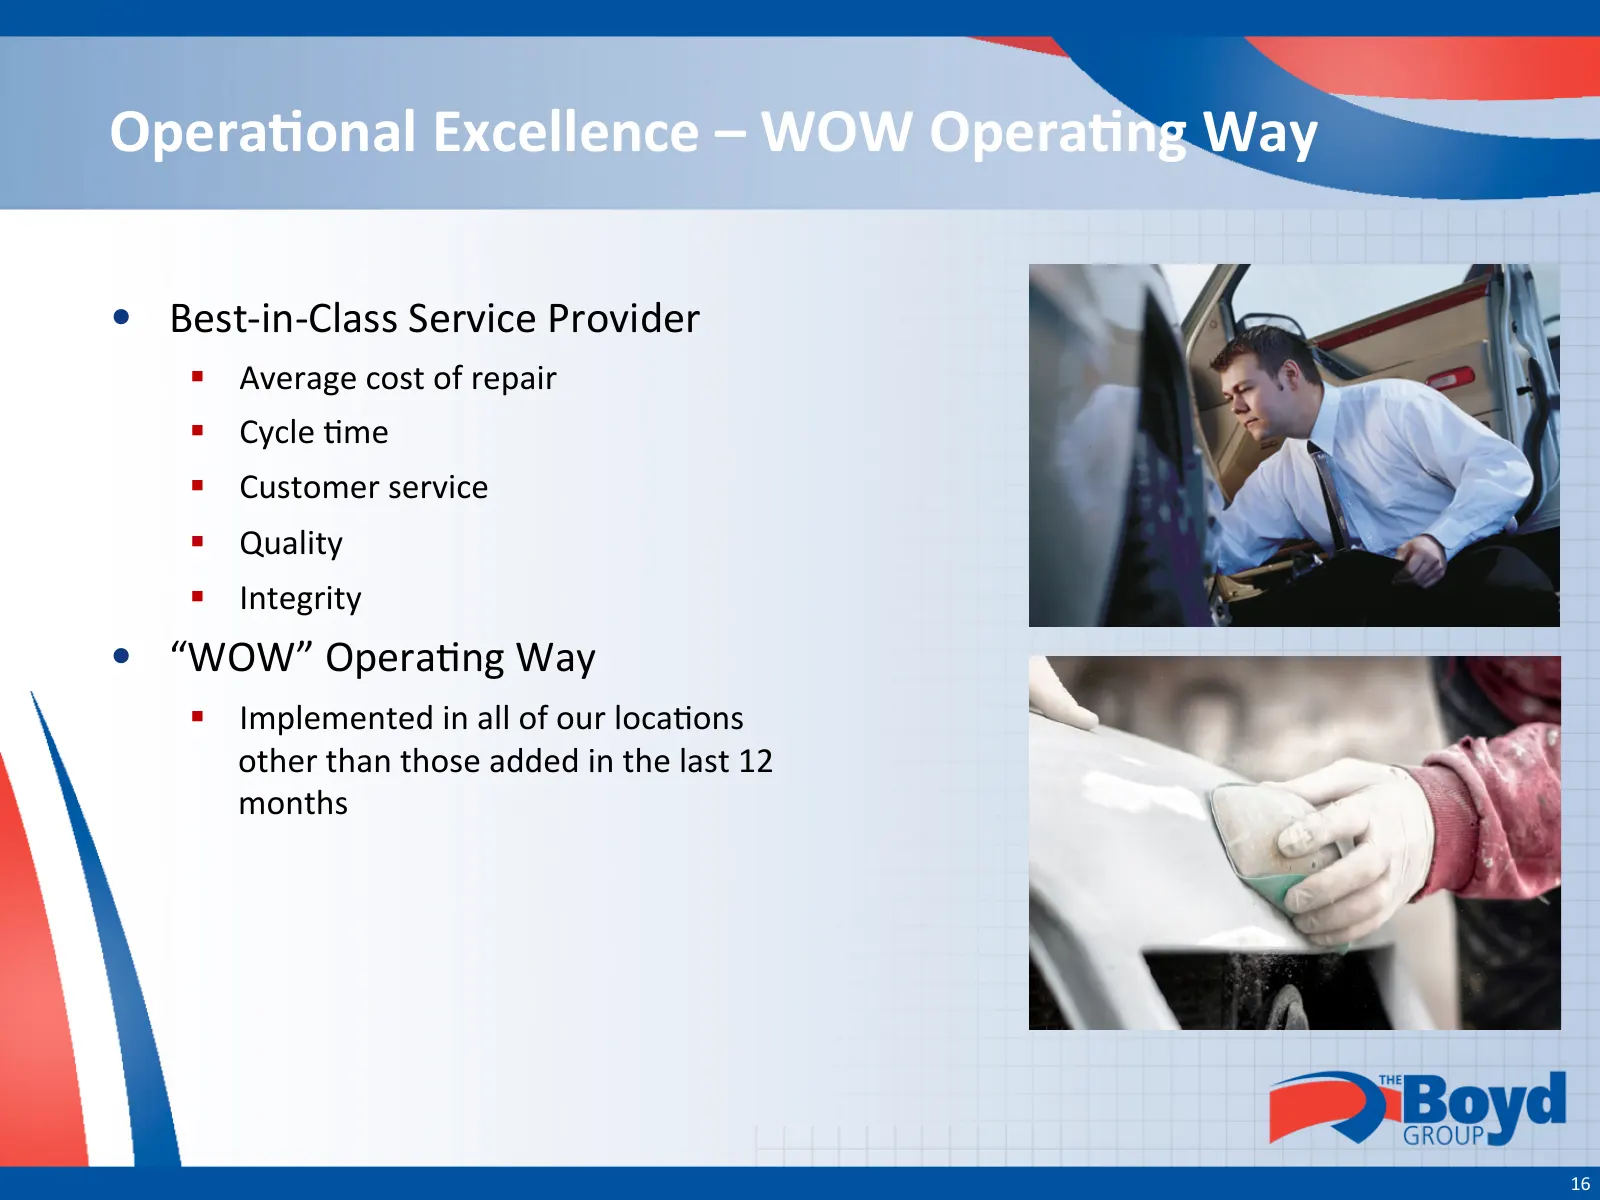
OperaOonal Excellence – WOW OperaOng Way • Best-‐in-‐Class Service Provider § Average cost of repair § Cycle -me § Customer service § Quality § Integrity • “WOW” Opera-ng Way § Implemented in all of our loca-ons other than those added in the last 12 months 16
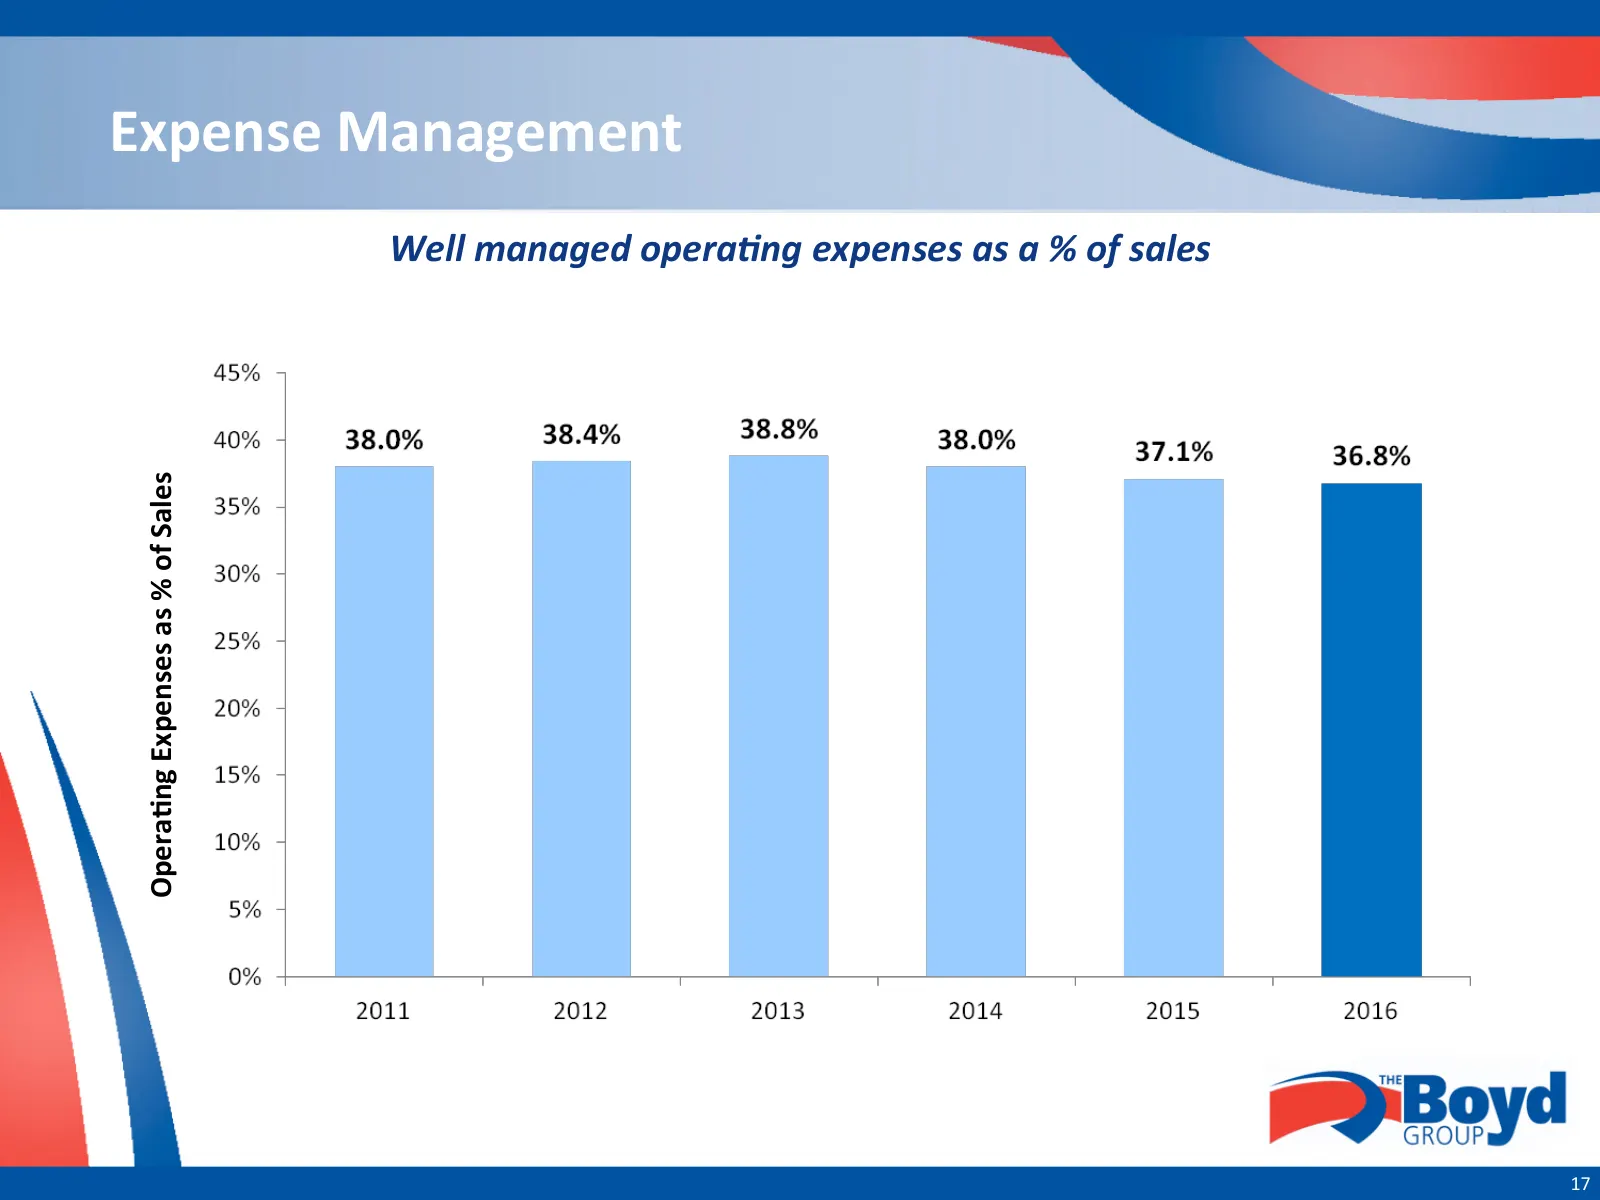
Slide 17: Operating Expenses as % of Sales
Expense Management Well managed opera-ng expenses as a % of sales OperaOng Expenses as % of Sales 17
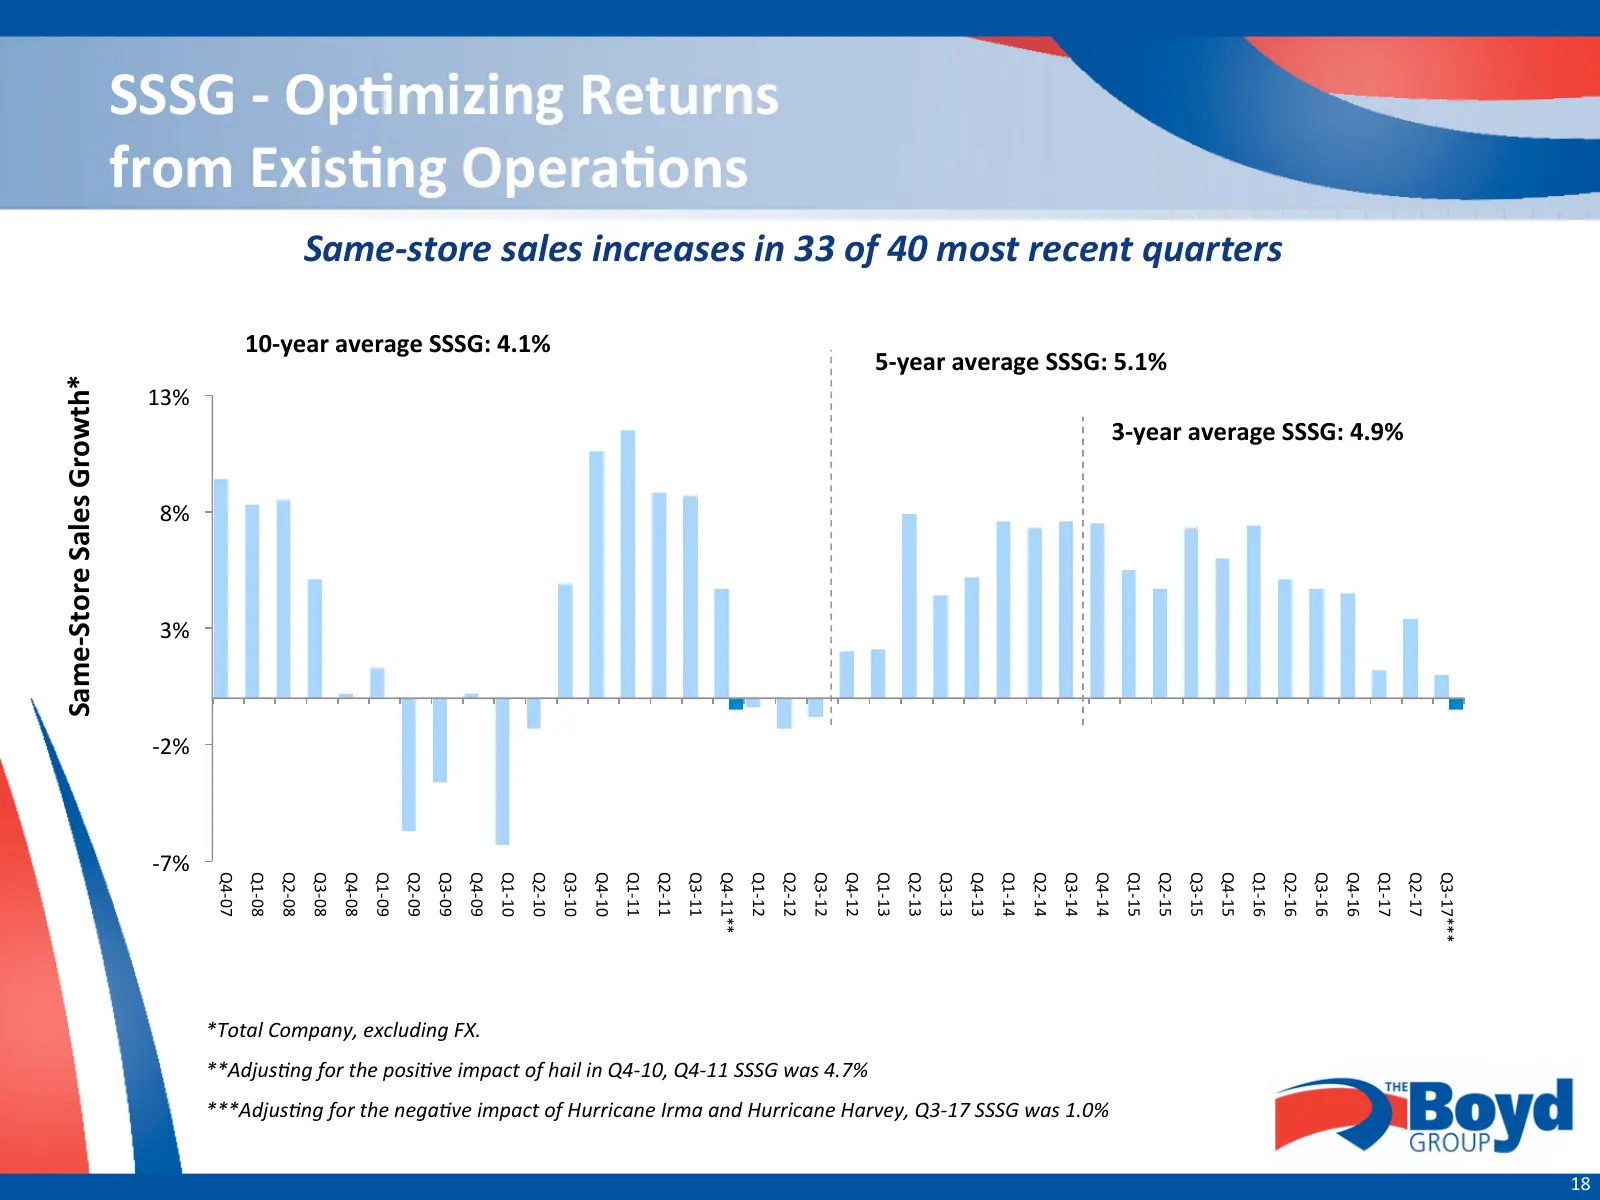
Slide 18: Same-Store Sales Growth
SSSG -‐ OpOmizing Returns from ExisOng OperaOons Same-‐store sales increases in 33 of 40 most recent quarters 10-‐year average SSSG: 4.1% 5-‐year average SSSG: 5.1% Same-‐Store Sales Growth* 13% 3-‐year average SSSG: 4.9% 8% 3% -‐2% -‐7% Q4-‐07 Q1-‐08 Q2-‐08 Q3-‐08 Q4-‐08 Q1-‐09 Q2-‐0
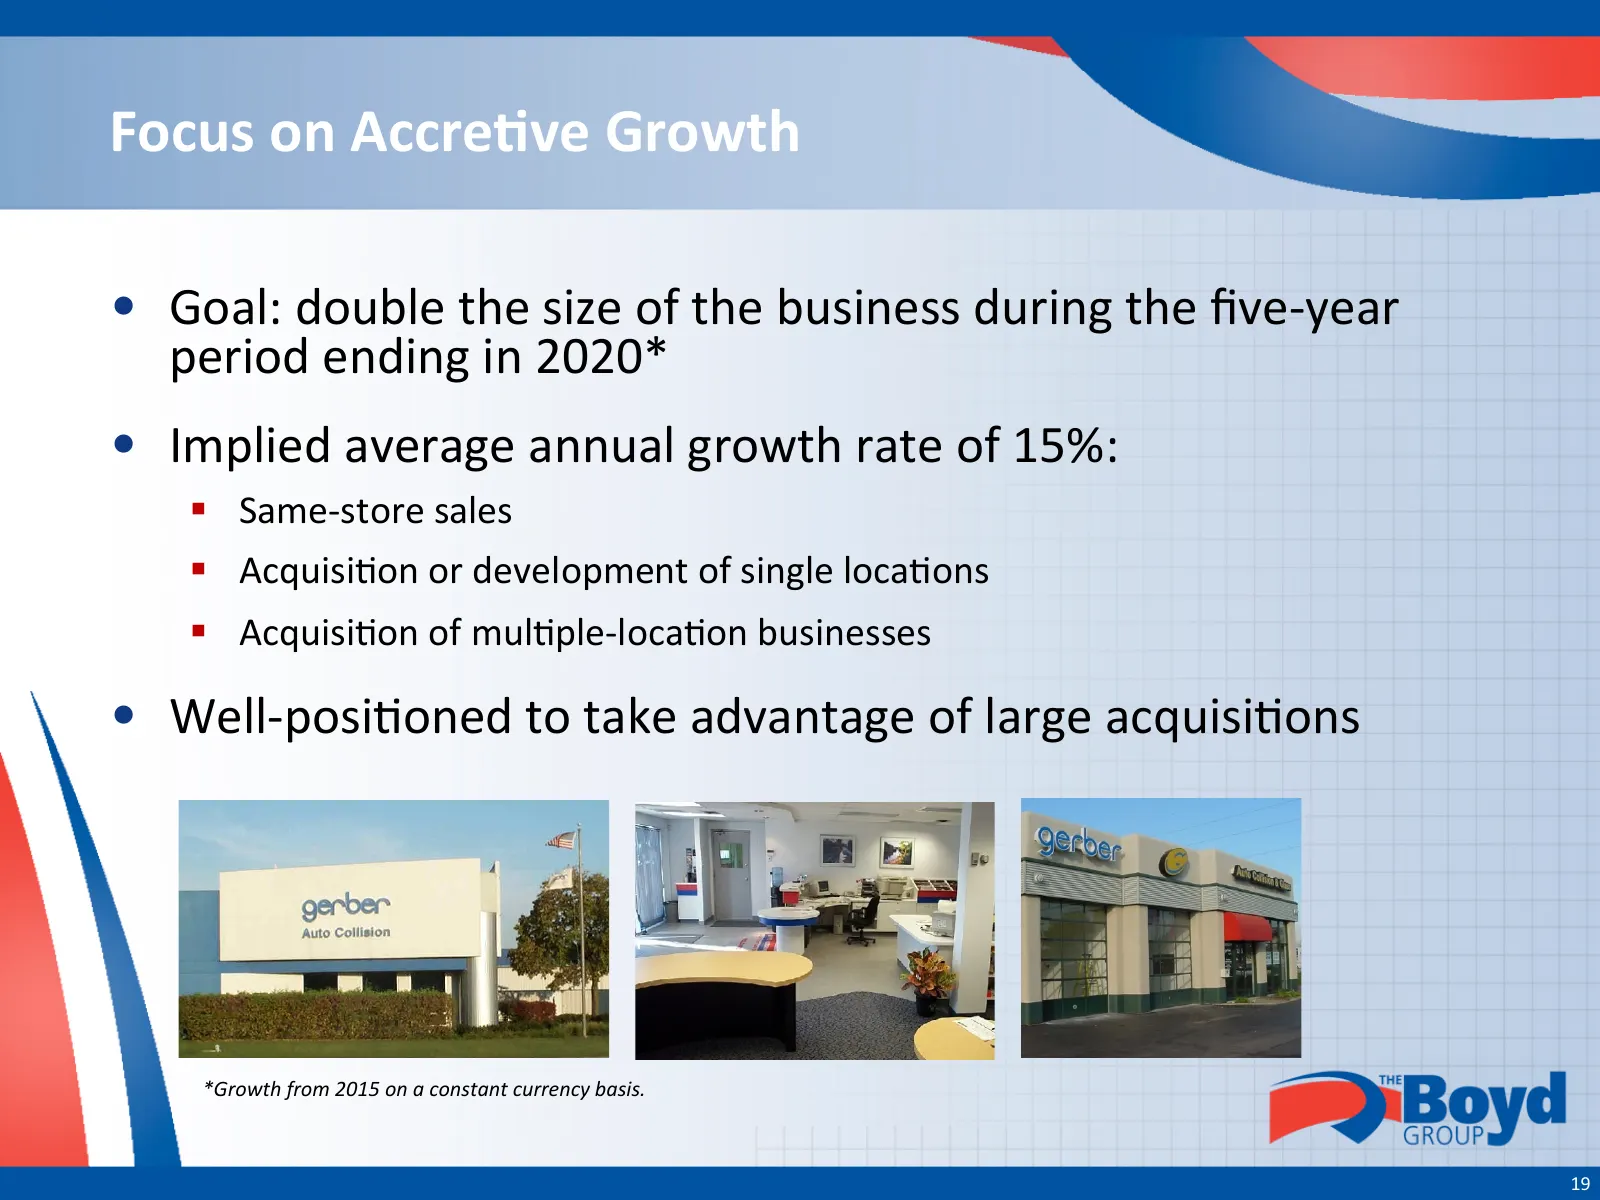
Slide 19: Focus on Accretive Growth
Focus on AccreOve Growth • Goal: double the size of the business during the five-‐year period ending in 2020* • Implied average annual growth rate of 15%: § Same-‐store sales § Acquisi-on or development of single loca-ons § Acquisi-on of mul-ple-‐loca-on businesses • Well-‐posi-oned to take ad
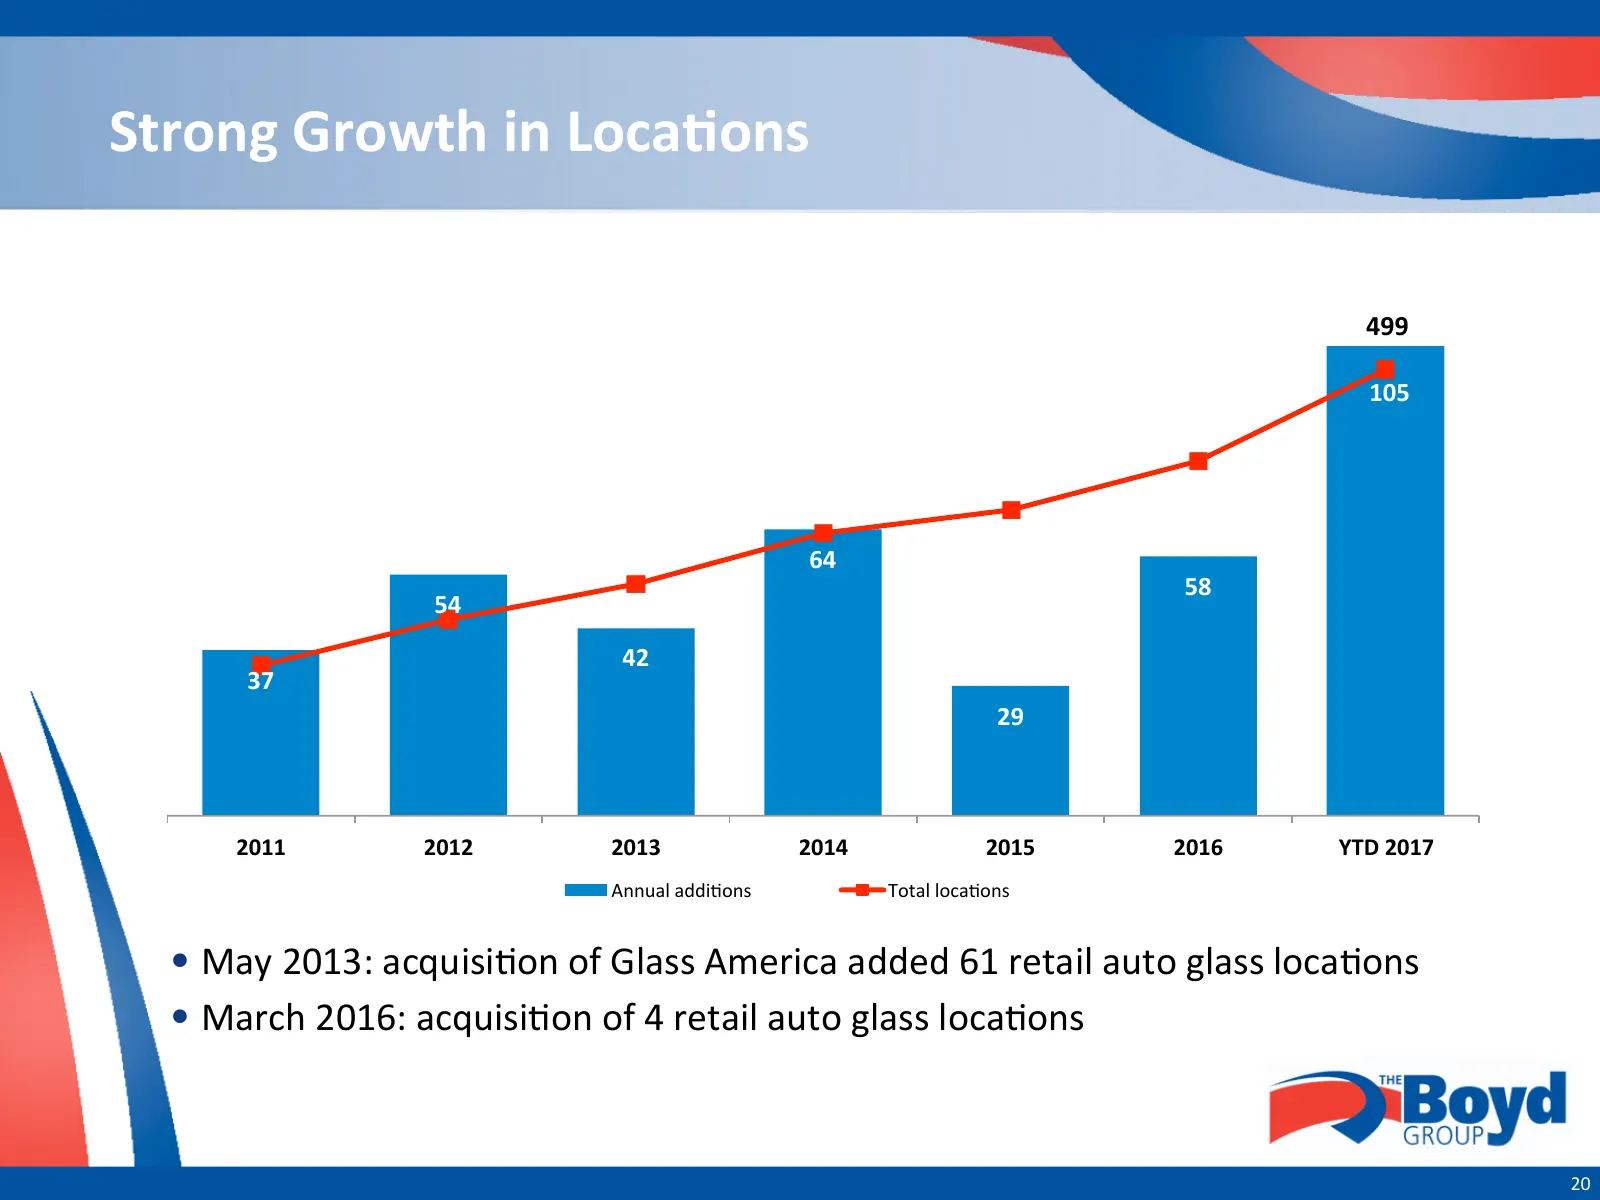
Slide 20: Strong Growth in Locations
Strong Growth in LocaOons 120 600 499 100 500 105 80 400 60 300 64 58 54 40 200 42 37 20 29 100 0 0 2011 2012 2013 2014 2015 2016 YTD 2017 Annual addi-ons Total loca-ons • May 2013: acquisi-on of Glass America added 61 retail auto glass loca-ons • March 2016: acquisi-on of 4 retail auto glass loca-o
Slide 21: Financial Review
situ J FUND Financial Review
Slide 22: Revenue Growth
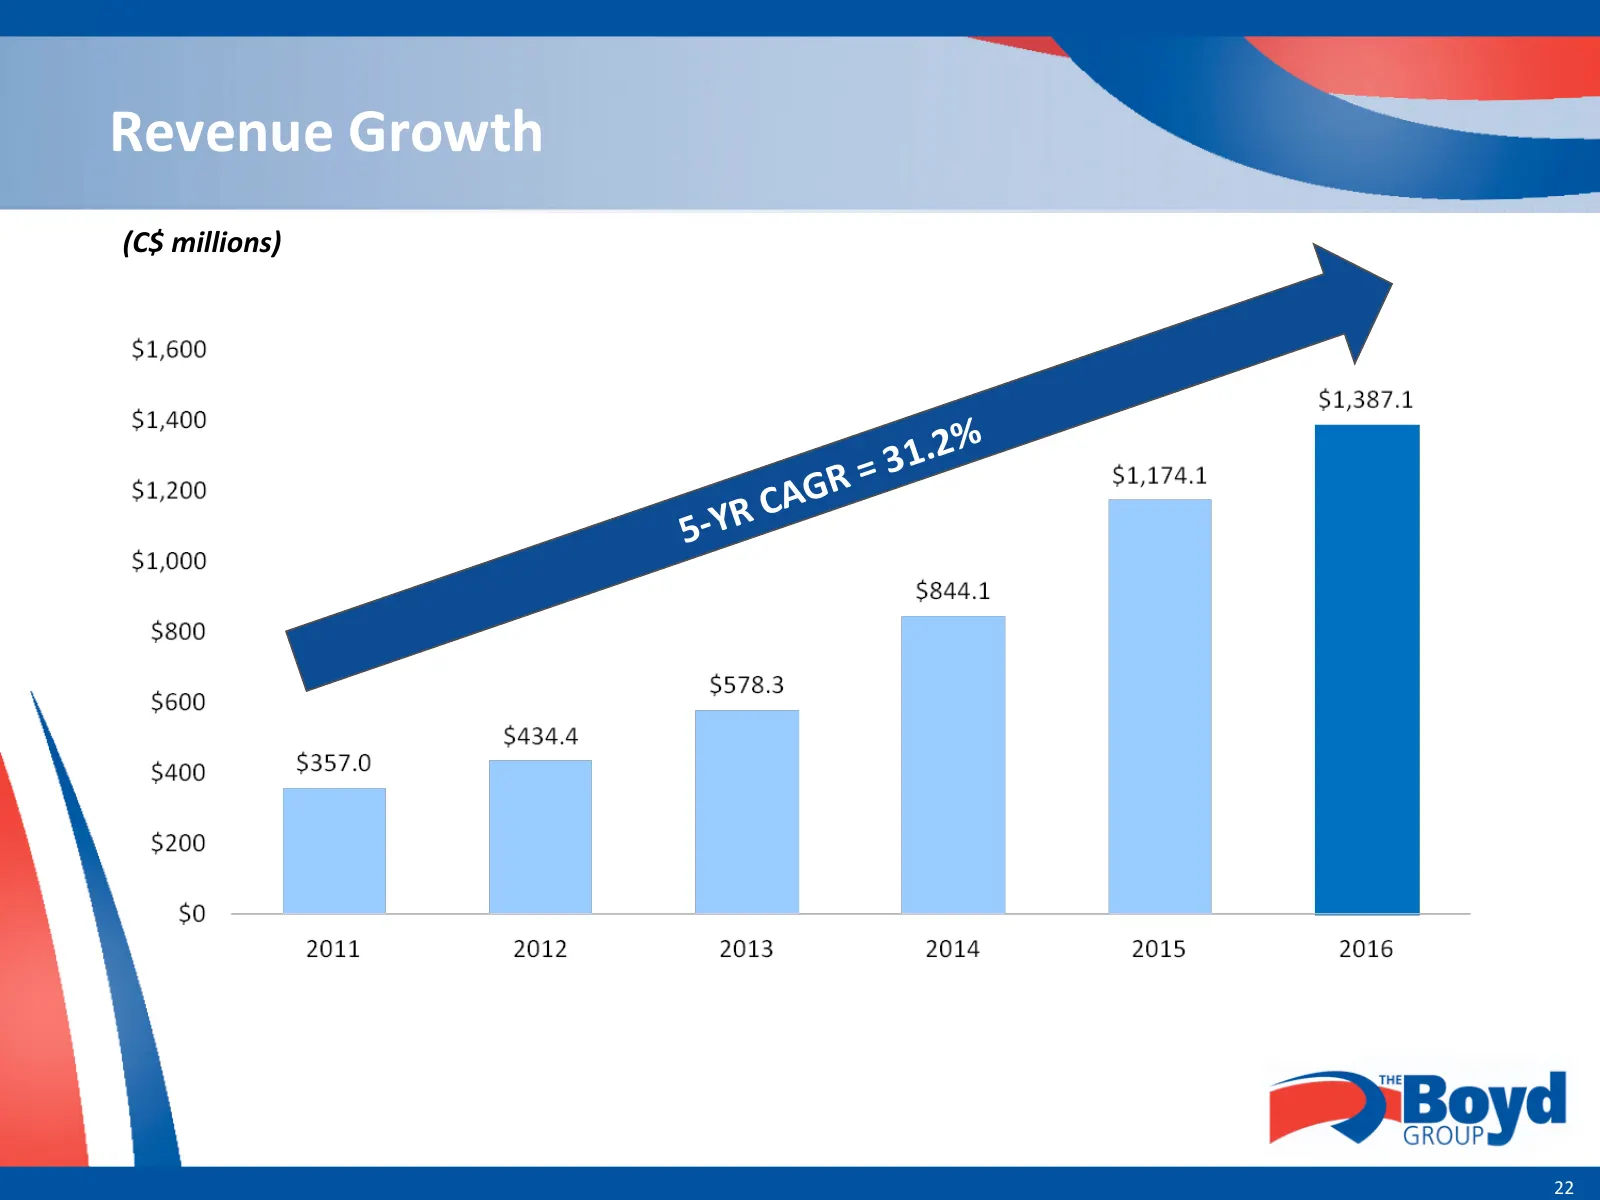
Revenue Growth (C$ millions) 1. 2% G R = 3 -‐ YR CA 5 22
Slide 23: Adjusted EBITDA Growth
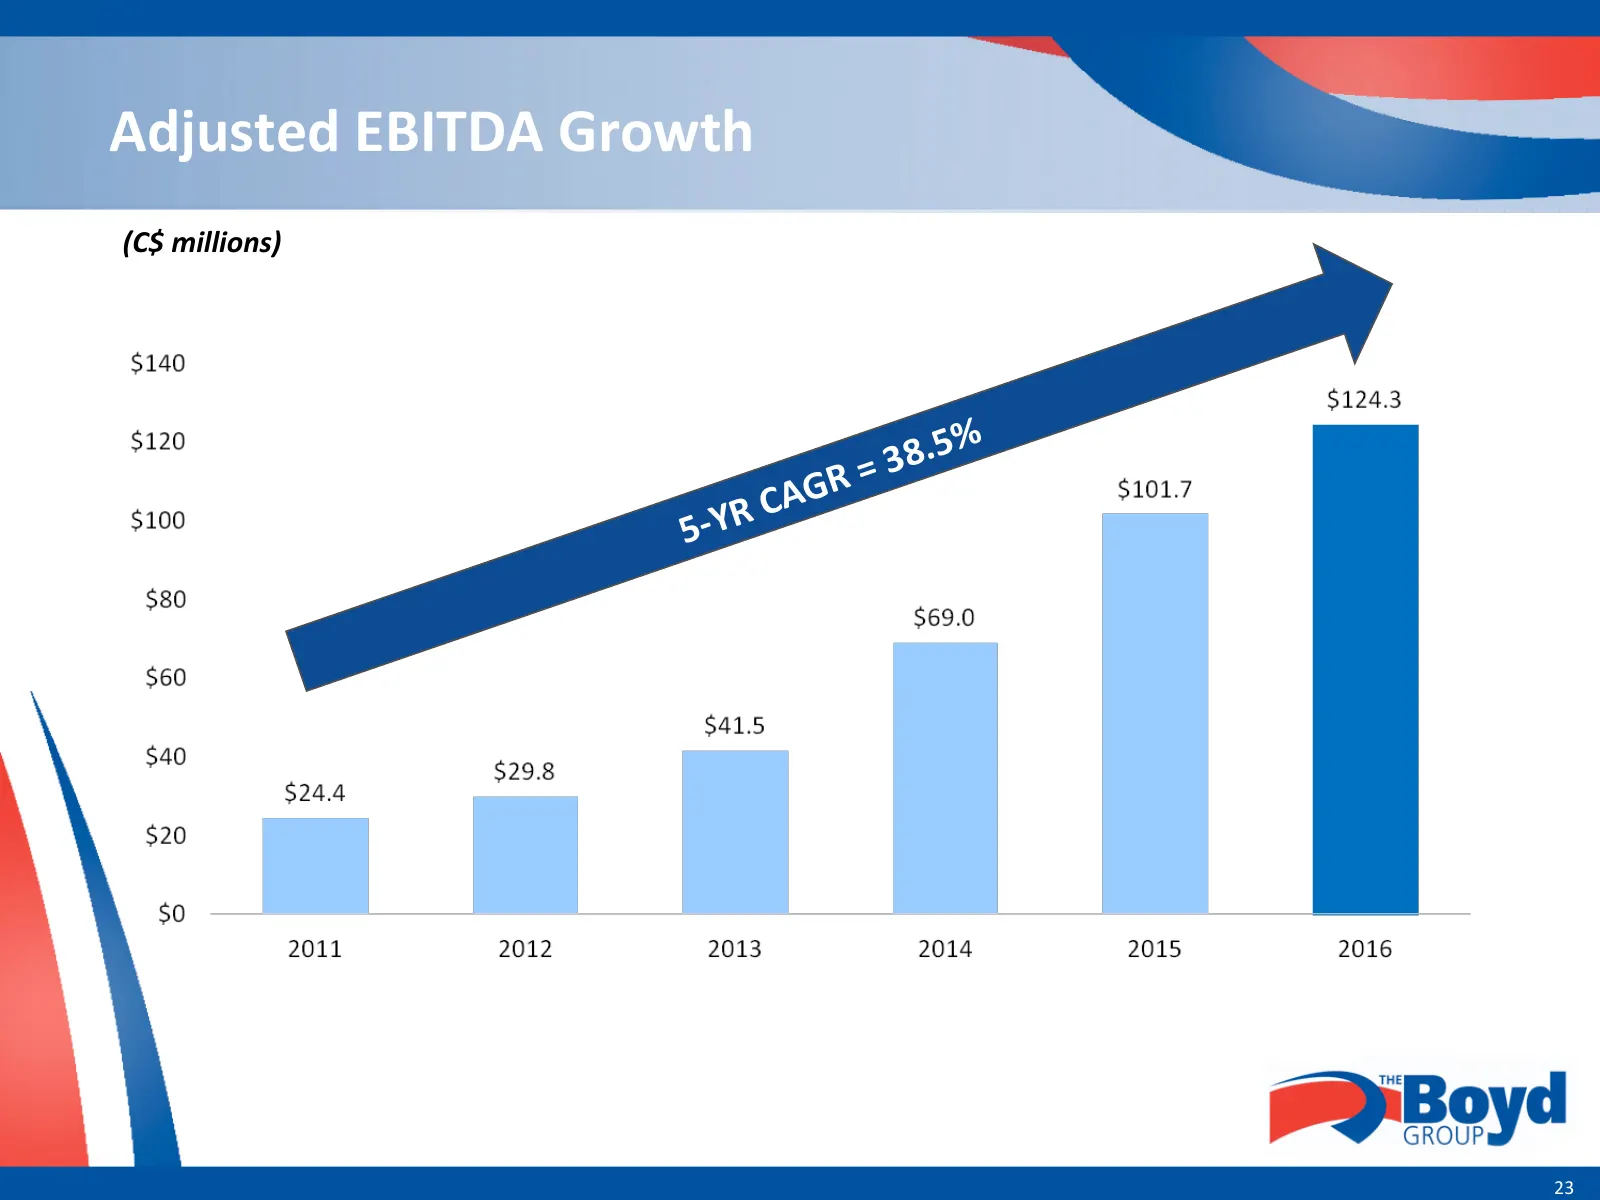
Adjusted EBITDA Growth (C$ millions) 8. 5% G R = 3 -‐ YR CA 5 23
Slide 24: Financial Summary
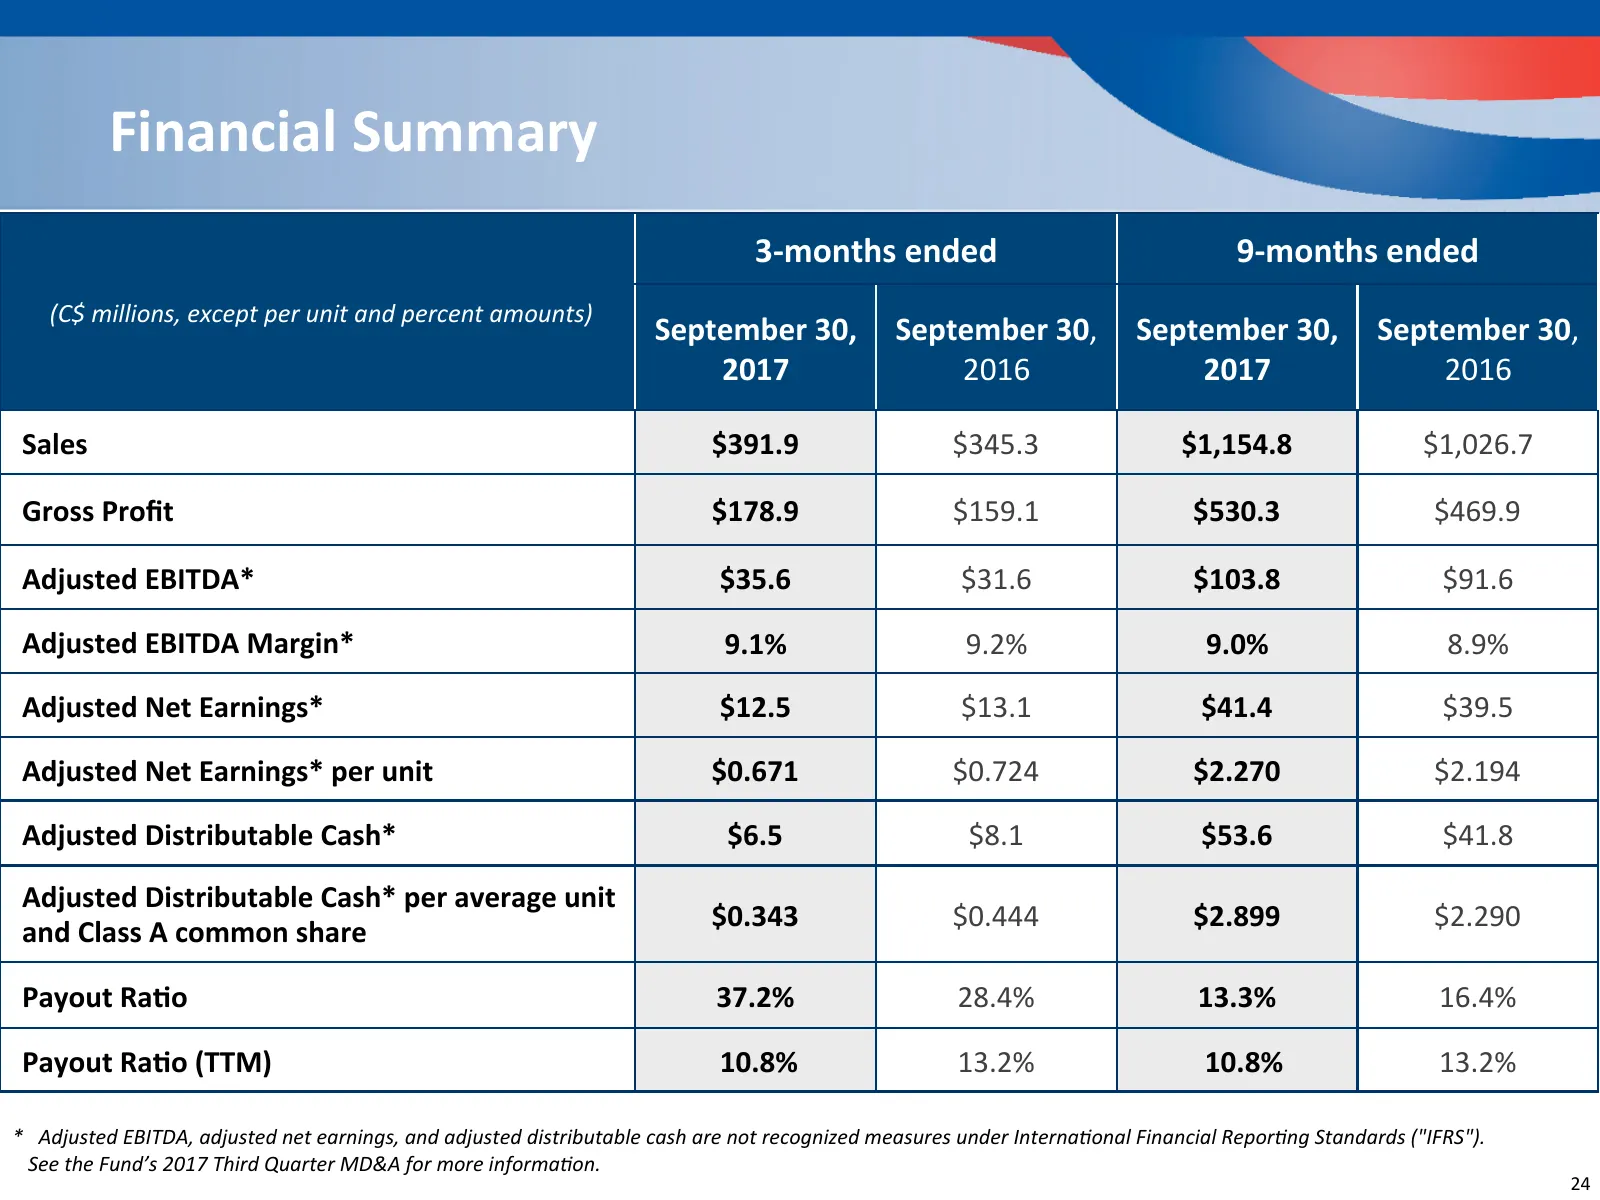
Financial Summary 3-‐months ended 9-‐months ended (C$ millions, except per unit and percent amounts) September 30, September 30, September 30, September 30, 2017 2016 2017 2016 Sales $391.9 $345.3 $1,154.8 $1,026.7 Gross Profit $178.9 $159.1 $530.3 $469.9 Adjusted EBITDA* $35.6 $31.6 $103.8 $91.6 A
Slide 25: Strong Balance Sheet
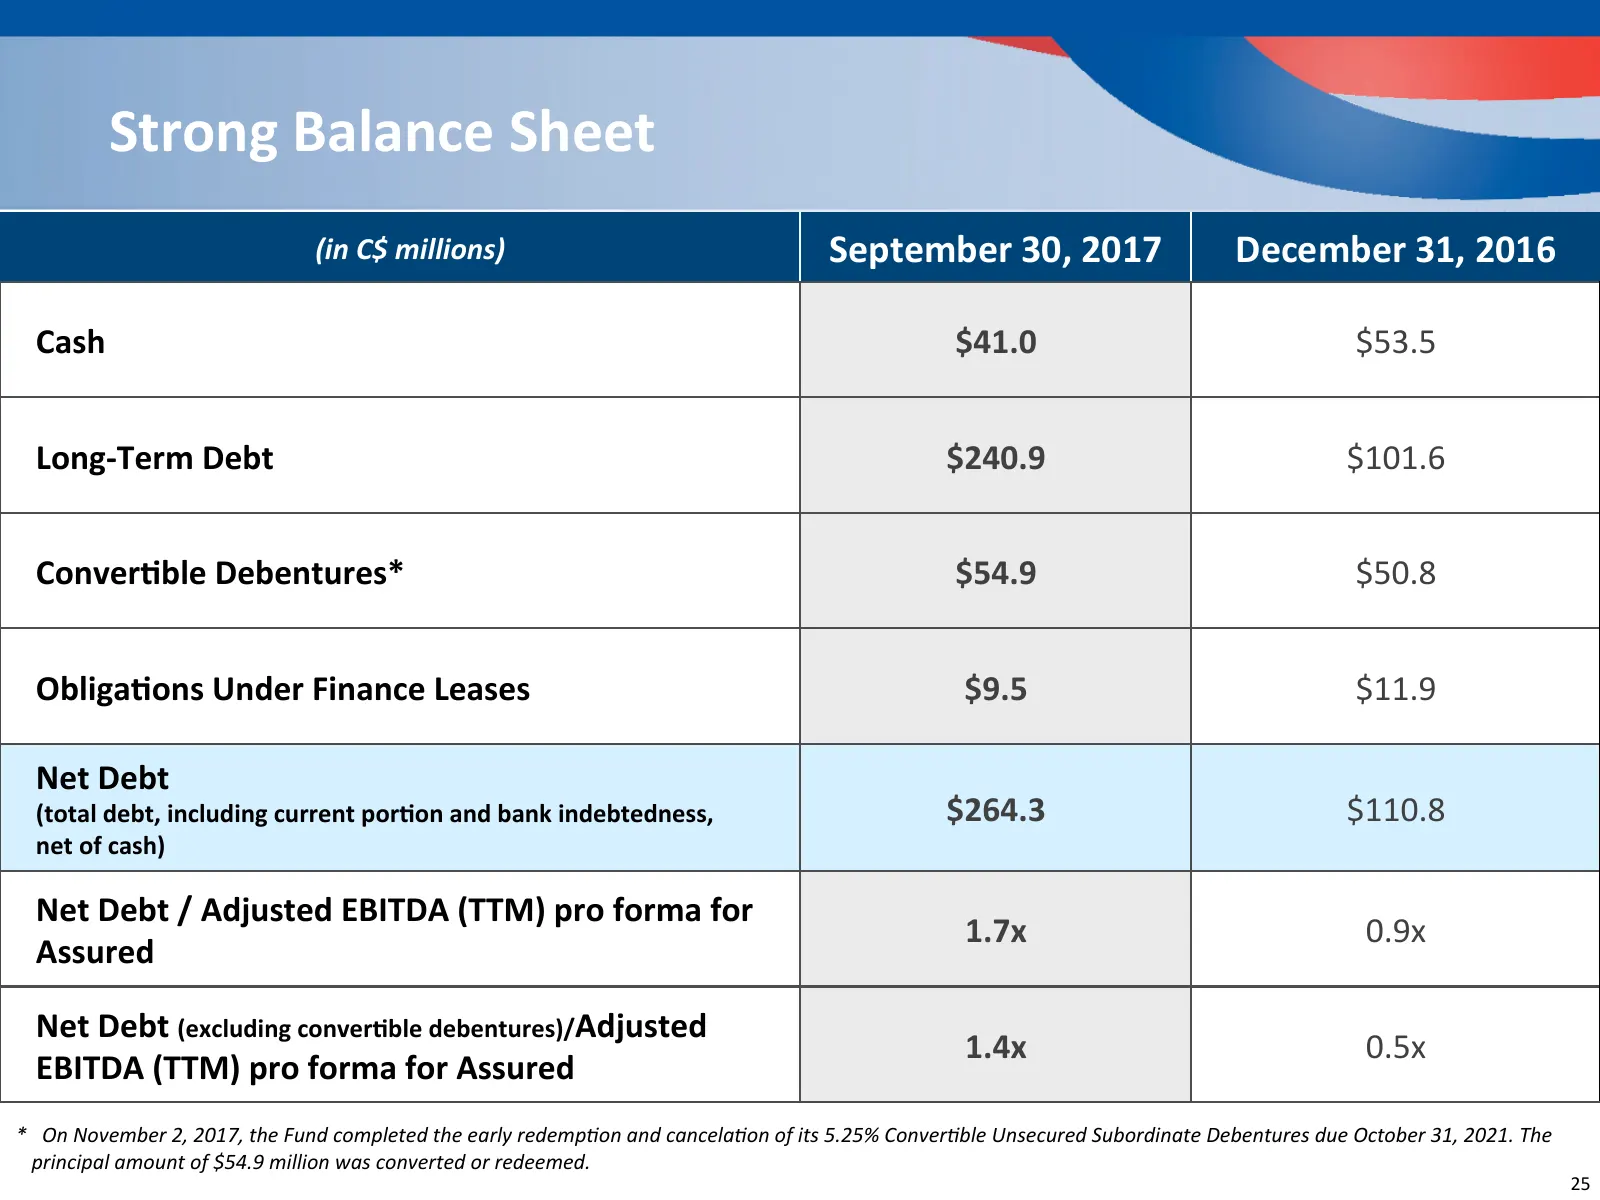
Strong Balance Sheet (in C$ millions) September 30, 2017 December 31, 2016 Cash $41.0 $53.5 Long-‐Term Debt $240.9 $101.6 ConverOble Debentures* $54.9 $50.8 ObligaOons Under Finance Leases $9.5 $11.9 Net Debt (total debt, including current porOon and bank indebtedness, $264.3 $110.8 net of cash) Ne
Slide 26: Financial Flexibility
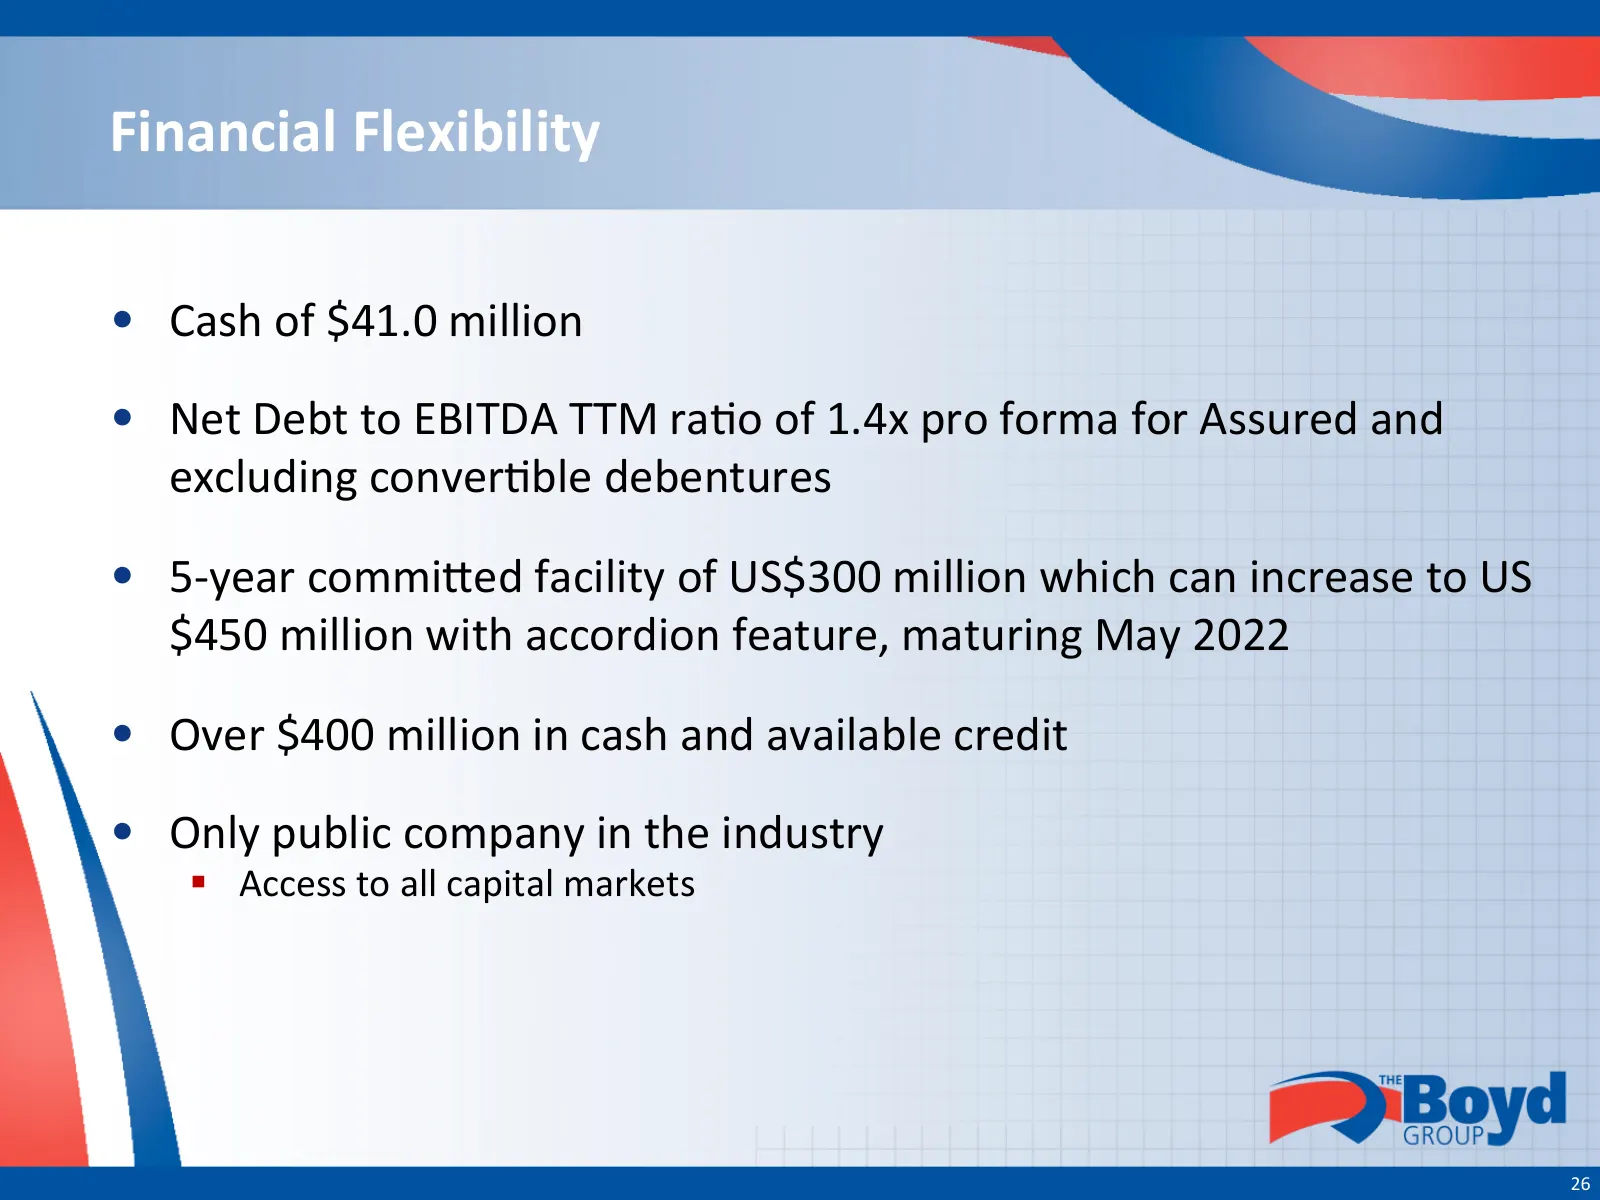
Financial Flexibility • Cash of $41.0 million • Net Debt to EBITDA TTM ra-o of 1.4x pro forma for Assured and excluding conver-ble debentures • 5-‐year commihed facility of US$300 million which can increase to US $450 million with accordion feature, maturing May 2022 • Over $400 million in cash and
Slide 27: Estimate of U.S. Tax Reform Impact
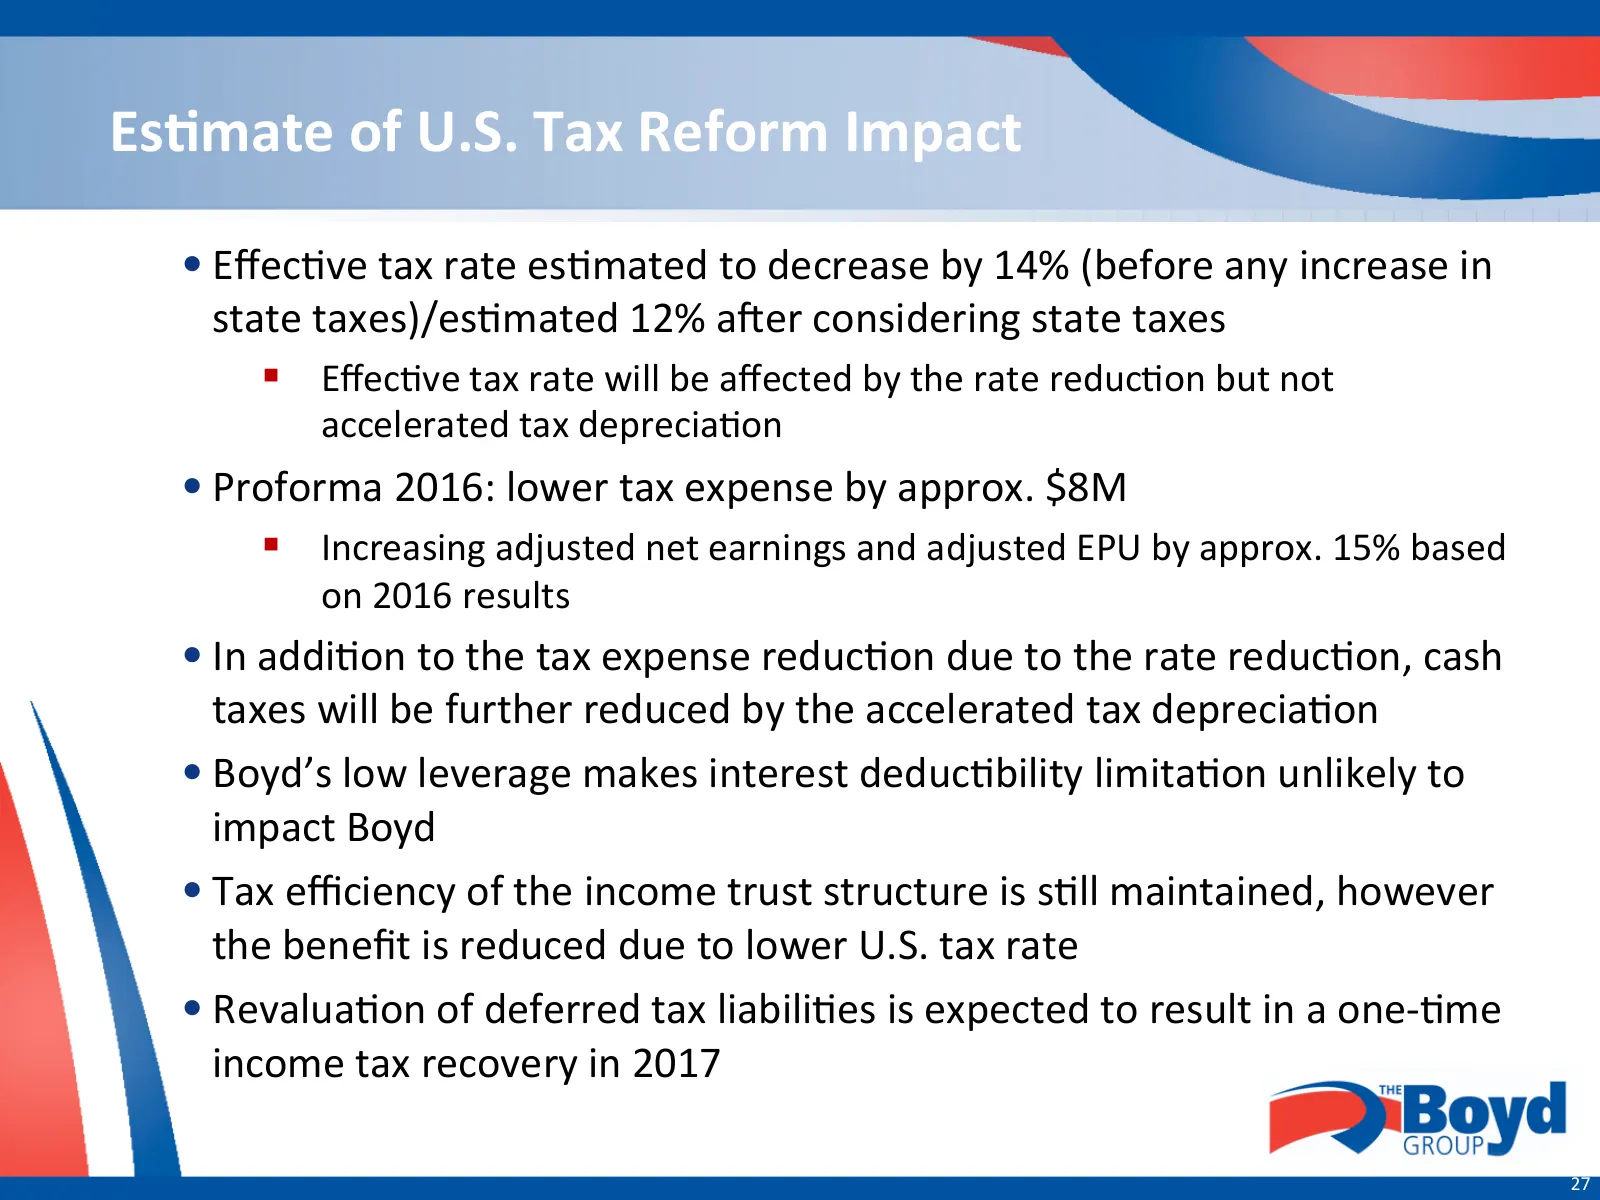
EsOmate of U.S. Tax Reform Impact • Effec-ve tax rate es-mated to decrease by 14% (before any increase in state taxes)/es-mated 12% aver considering state taxes § Effec-ve tax rate will be affected by the rate reduc-on but not accelerated tax deprecia-on • Proforma 2016: lower tax expense by approx. $
Slide 28: Distributions
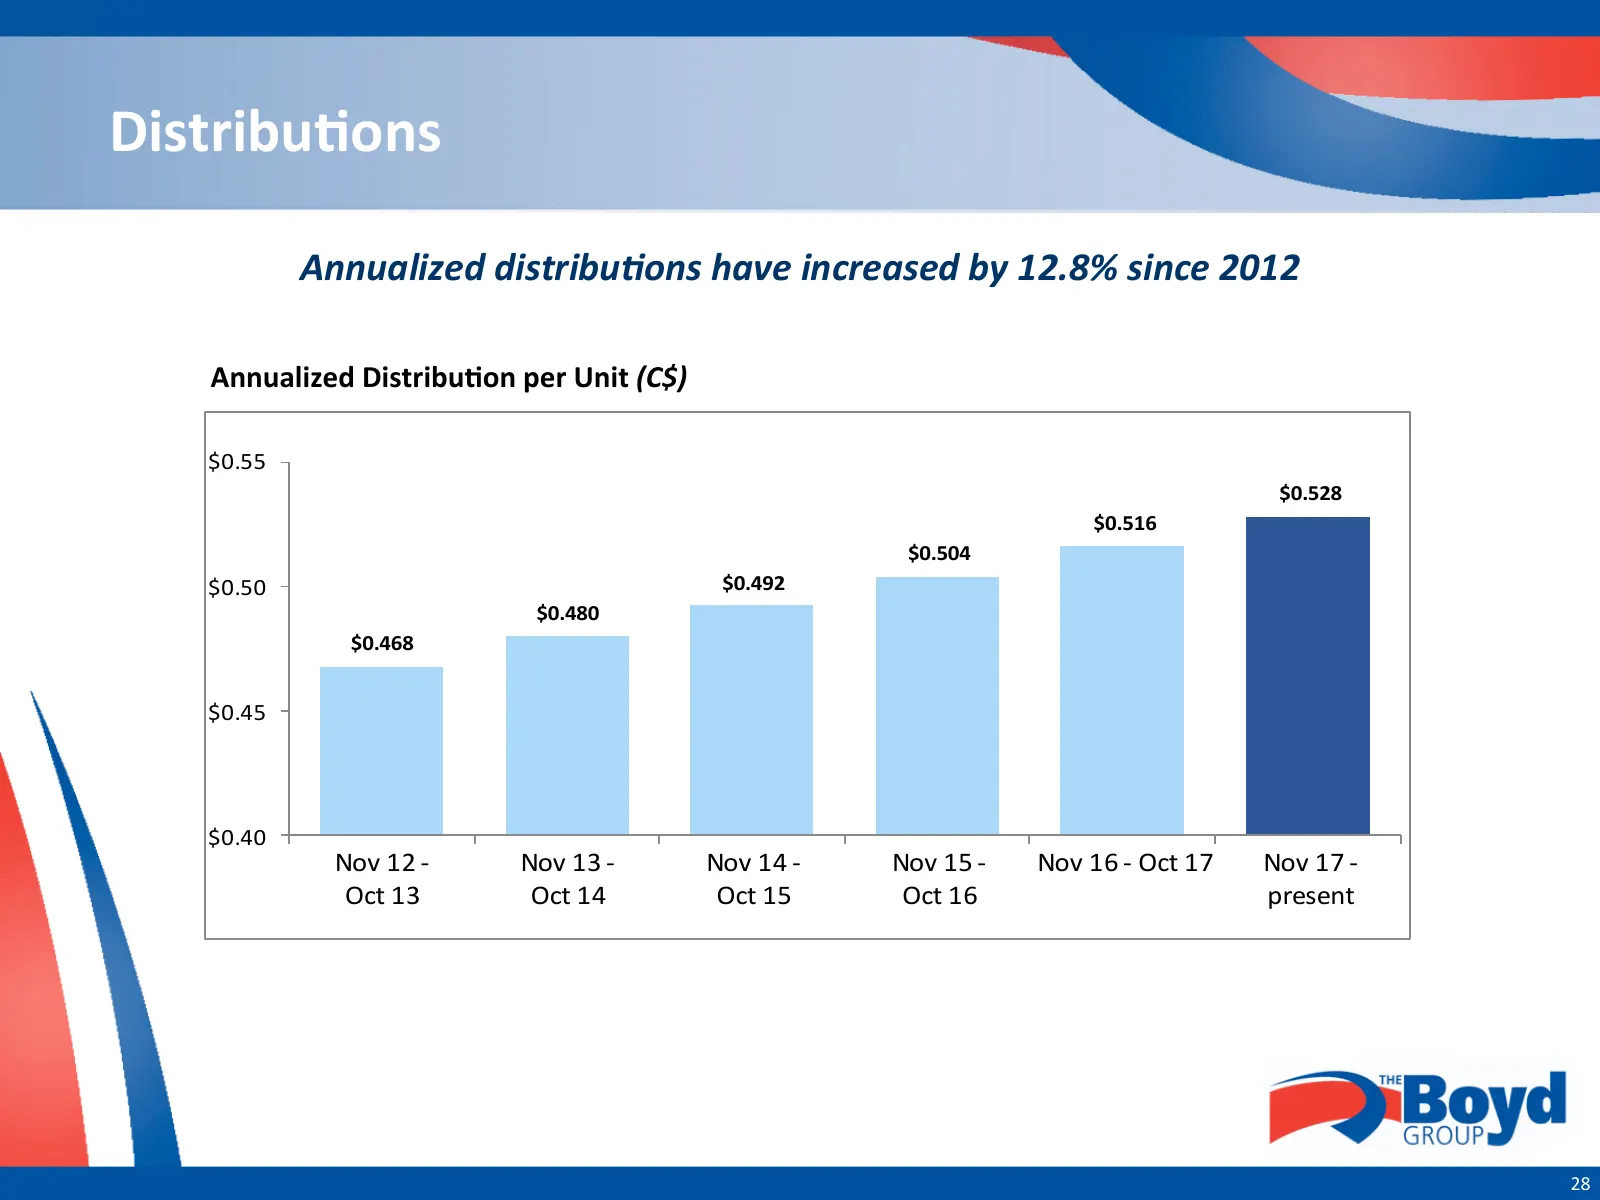
DistribuOons Annualized distribu-ons have increased by 12.8% since 2012 Annualized DistribuOon per Unit (C$) $0.55 $0.528 $0.516 $0.504 $0.50 $0.492 $0.480 $0.468 $0.45 $0.40 Nov 12 -‐ Nov 13 -‐ Nov 14 -‐ Nov 15 -‐ Nov 16 -‐ Oct 17 Nov 17 -‐ Oct 13 Oct 14 Oct 15 Oct 16 present 28
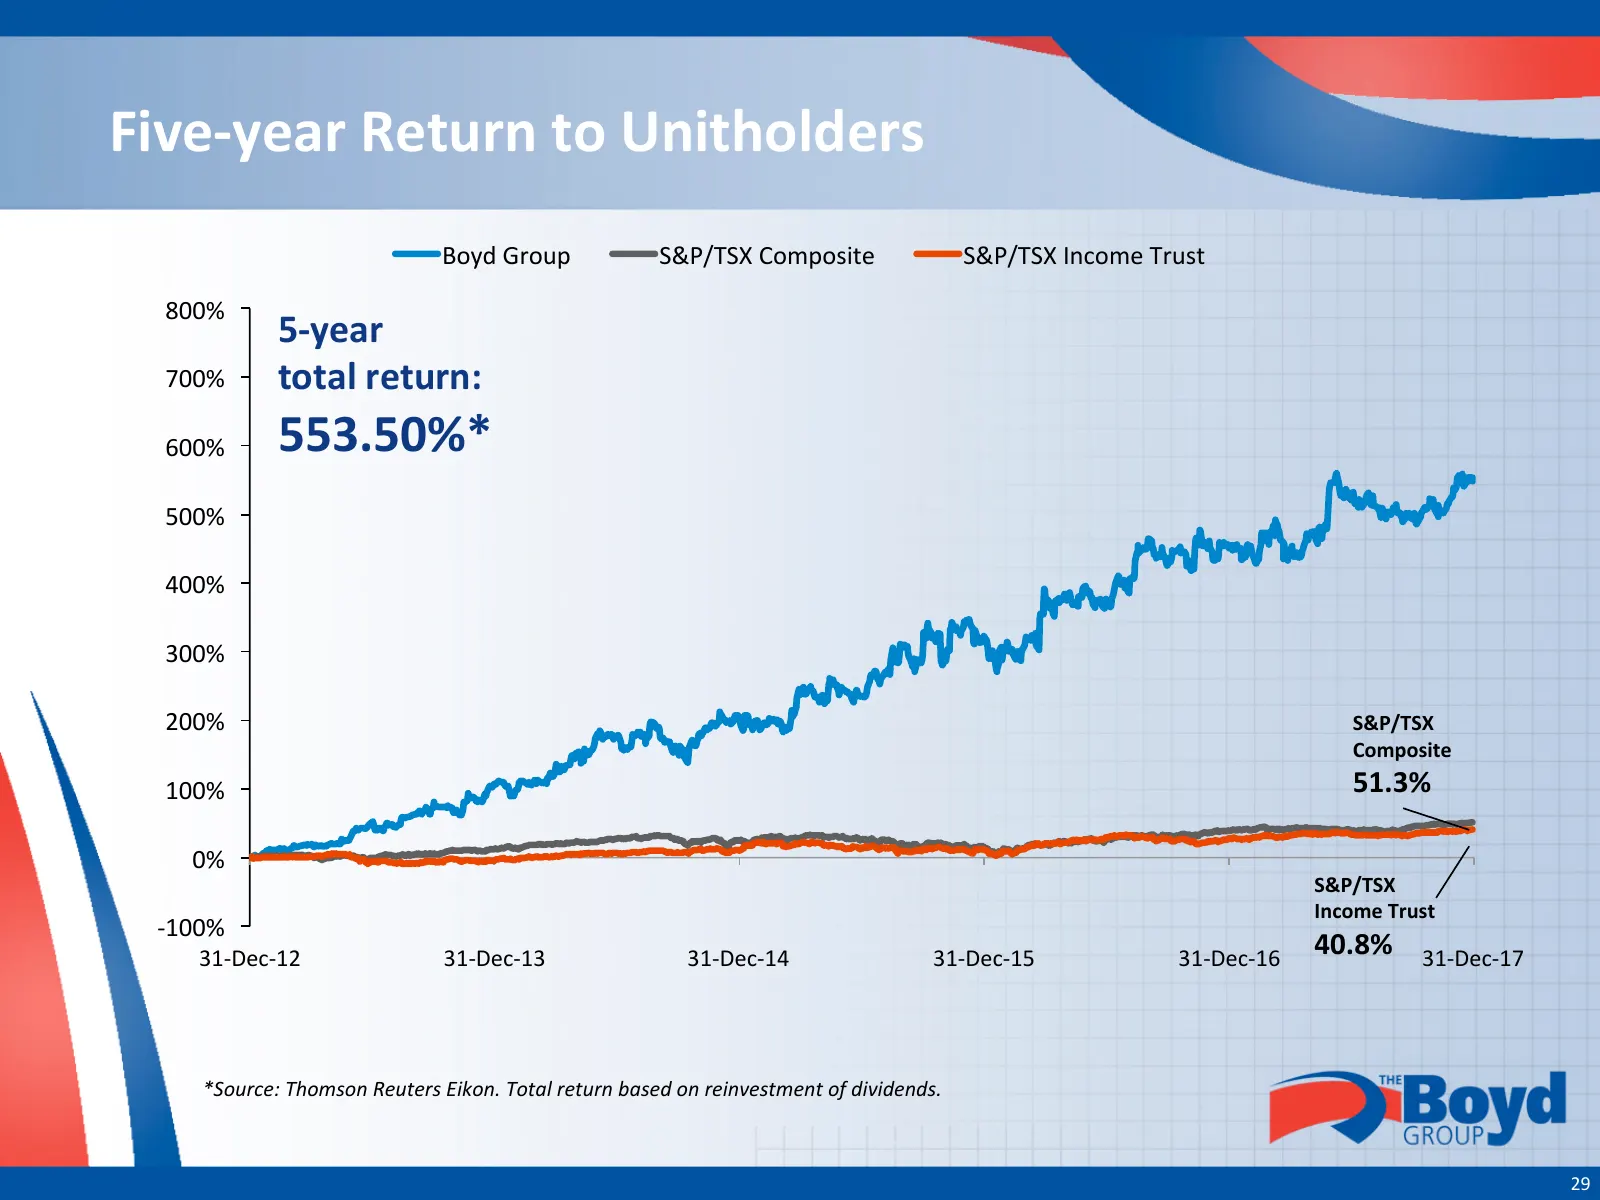
Slide 29: Five-year Return to Unitholders
Five-‐year Return to Unitholders Boyd Group S&P/TSX Composite S&P/TSX Income Trust 800% 5-‐year 700% total return: 600% 553.50%* 500% 400% 300% 200% S&P/TSX Composite 100% 51.3% 0% S&P/TSX Income Trust -‐100% 31-‐Dec-‐12 31-‐Dec-‐13 31-‐Dec-‐14 31-‐Dec-‐15 31-‐Dec-‐16 40.8% 31-‐Dec-‐1
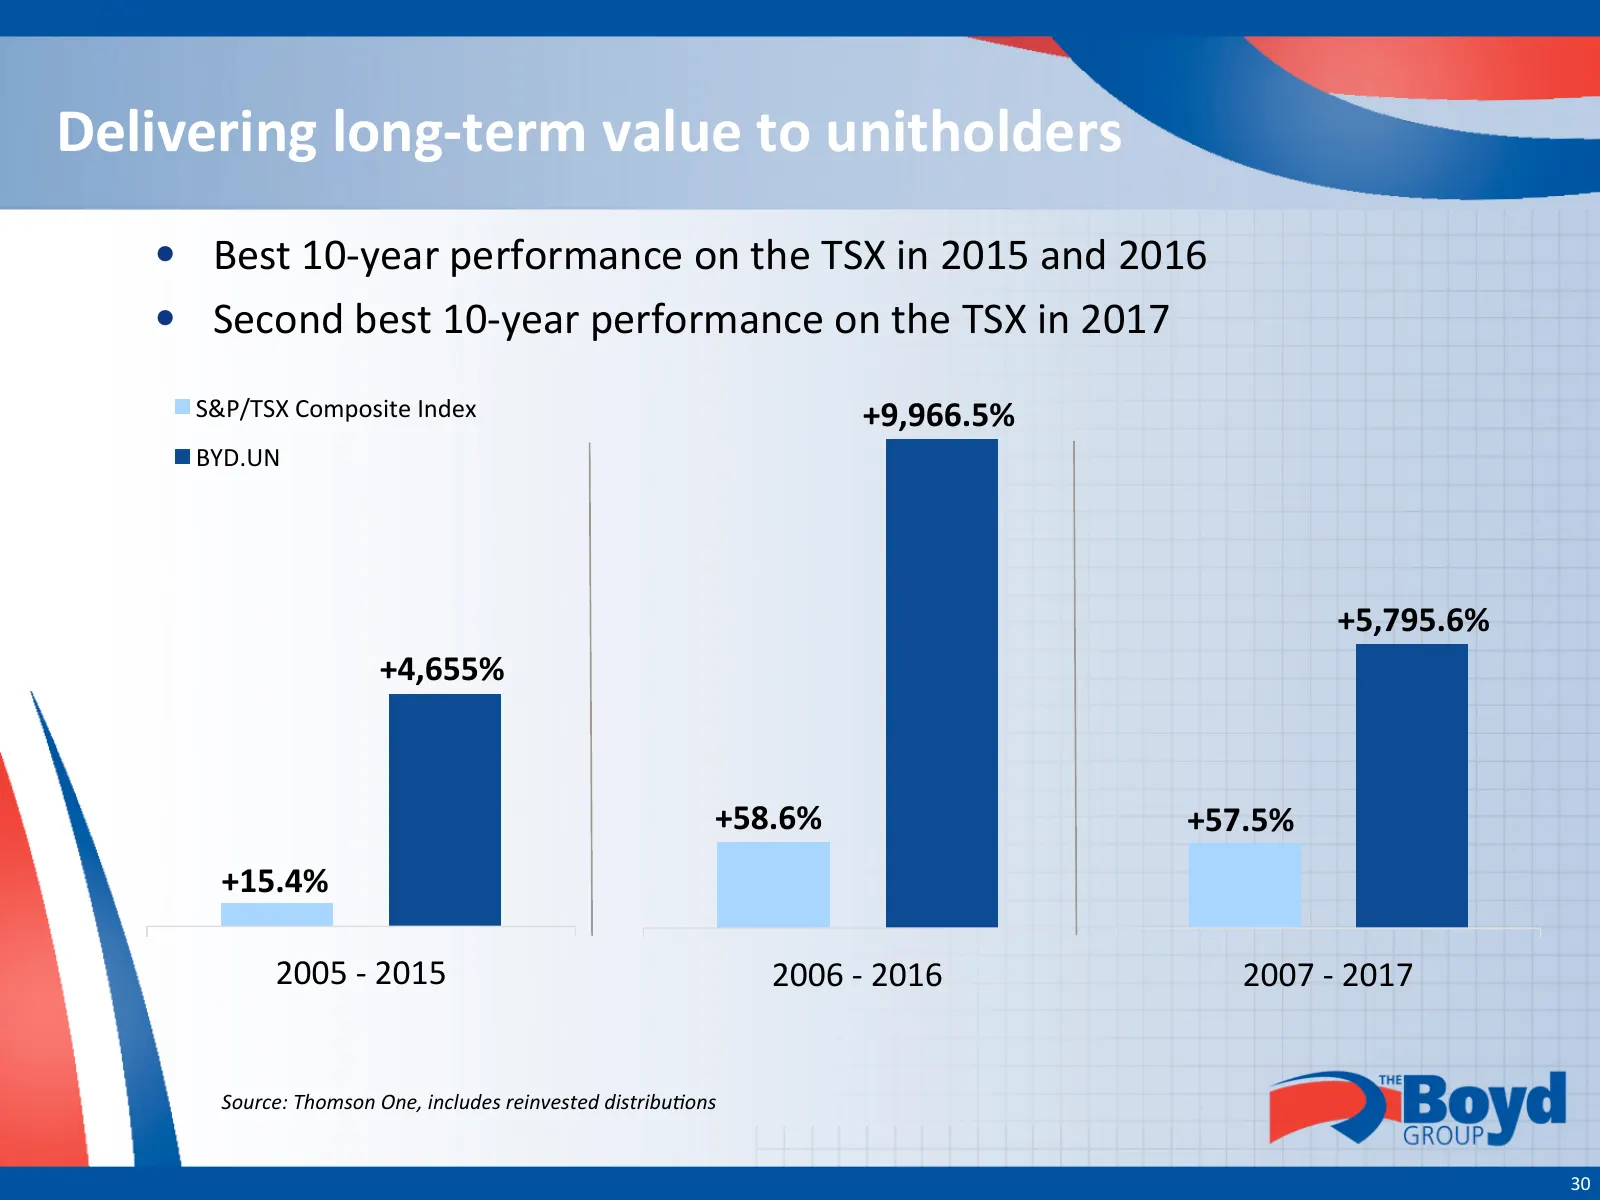
Slide 30: Delivering long-term value to unitholders
Delivering long-‐term value to unitholders • Best 10-‐year performance on the TSX in 2015 and 2016 • Second best 10-‐year performance on the TSX in 2017 S&P/TSX Composite Index +9,966.5% BYD.UN +5,795.6% +4,655% +58.6% +57.5% +15.4% 2005 -‐ 2015 2006 -‐ 2016 2007 -‐ 2017 Source: Thomson One, i
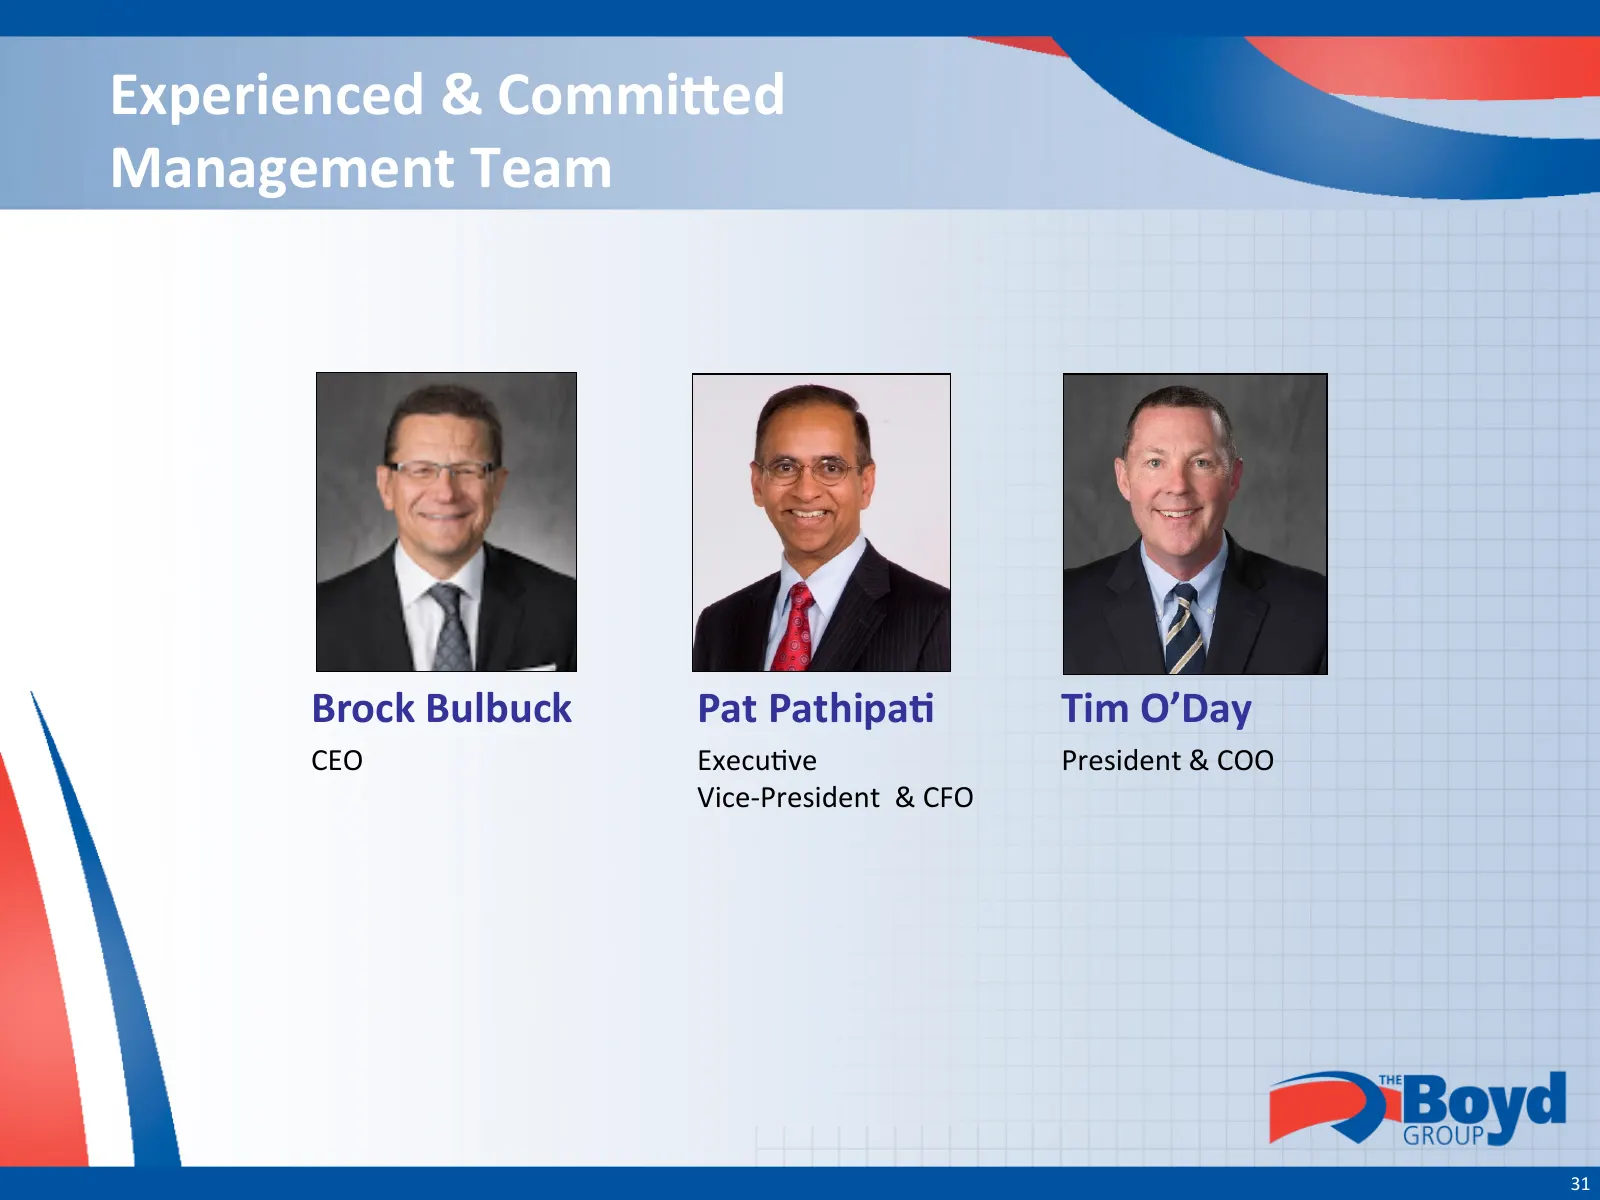
Slide 31: Experienced & Committed Management Team
Experienced & Commioed Management Team Brock Bulbuck Pat PathipaO Tim O’Day CEO Execu-ve President & COO Vice-‐President & CFO 31
Slide 32: Outlook
Outlook • Increase North American presence through: § Drive same-‐store sales growth through enhanced capacity u-liza-on, development of DRP arrangements and leveraging exis-ng major and regional insurance rela-onships § Acquire or develop new single loca-ons as well as the acquisi-on of mul--‐l
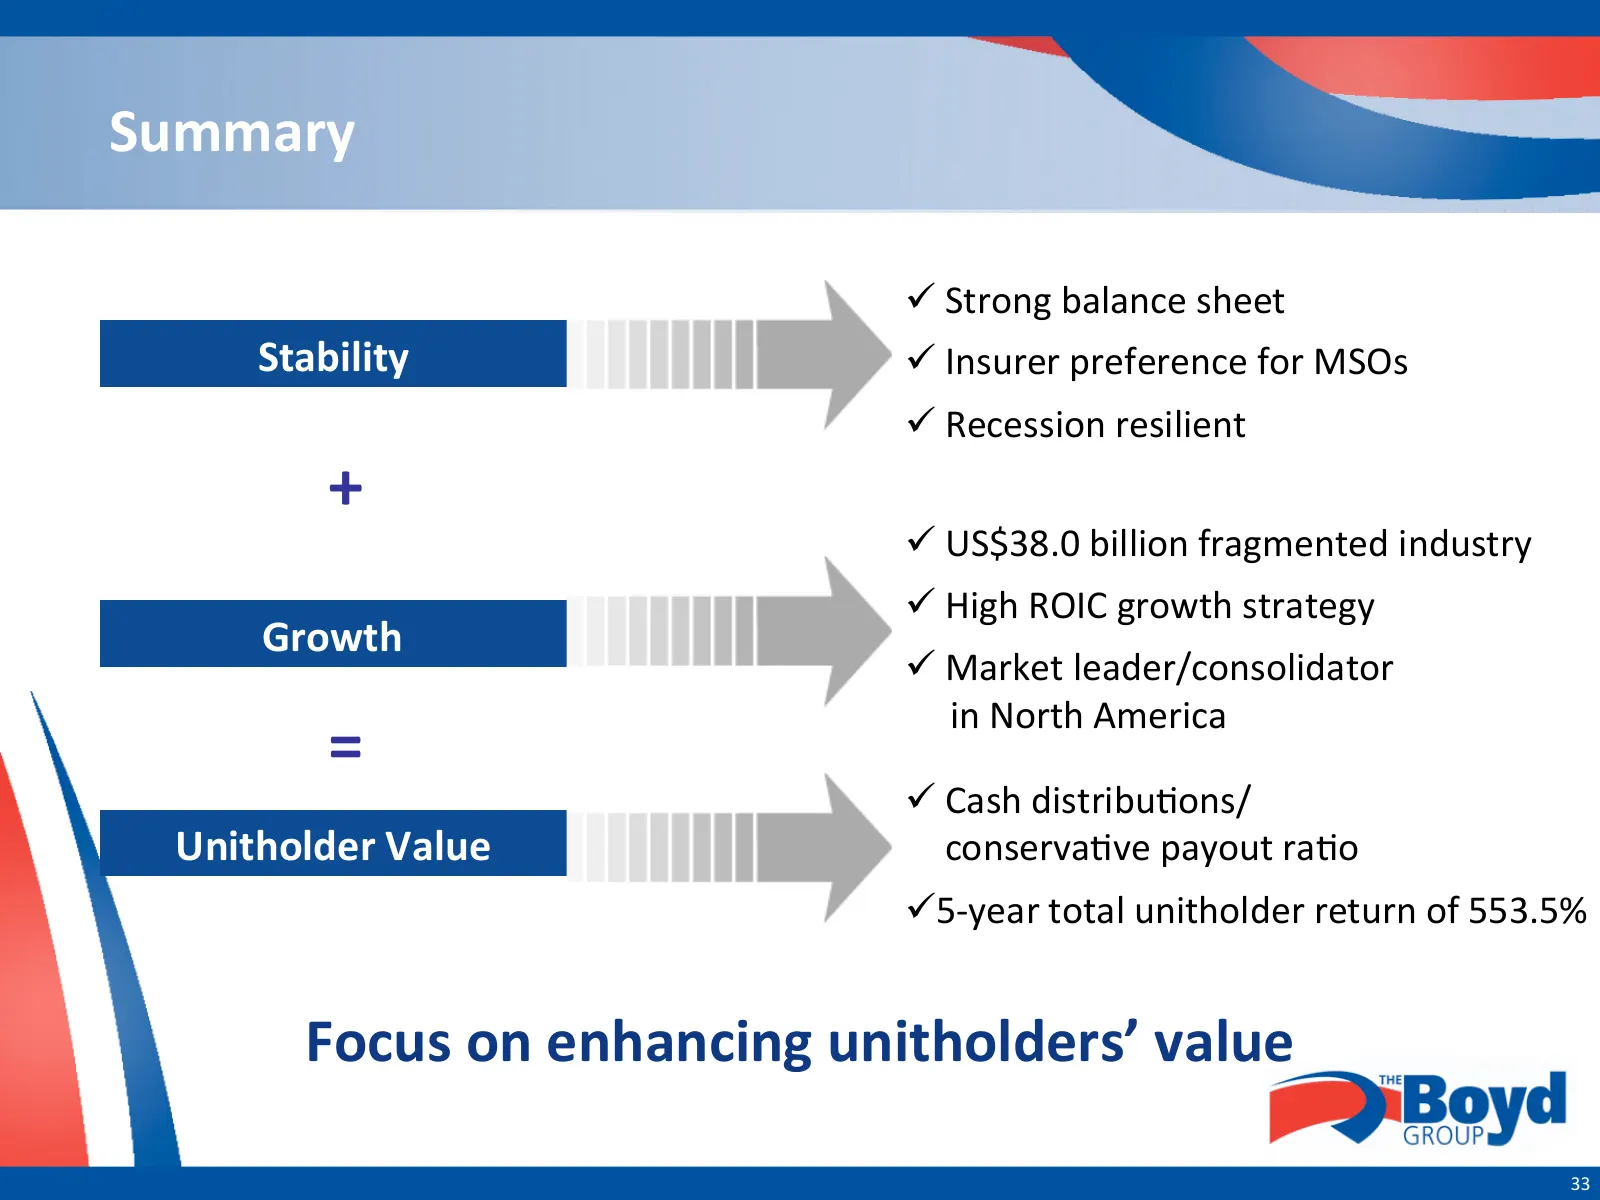
Slide 33: Summary
Summary ü Strong balance sheet Stability ü Insurer preference for MSOs ü Recession resilient + ü US$38.0 billion fragmented industry ü High ROIC growth strategy Growth ü Market leader/consolidator in North America = ü Cash distribu-ons/ Unitholder Value conserva-ve payout ra-o ü5-‐year tota
Source: Internet Archive copy of boydgroup.com
More decks from Boyd Group Services Inc
 Investor Presentation (September 2026)28 slides · September 2026
 Q1 2026 Earnings Presentation24 slides · May 13, 2026
 Investor Presentation (May 2026)23 slides · May 2026
 Investor Presentation (February 2026)25 slides · February 2026
 Q1 2024 Earnings Presentation38 slides · May 2024
 Investor Presentation (January 2024)33 slides · January 2024