South Jersey Industries — Wells Fargo Midstream and Utility Symposium 2018
58 slides from South Jersey Industries's conference presentation, Dec 6, 2018

Slide 1: Wells Fargo Midstream and Utility Symposium December 6, 2018
Wells Fargo Midstream and Utility Symposium December 6, 2018
Slide 2: Forward-Looking Statements and Use of Non-GAAP Measures
Forward-Looking Statements and Use of Non-GAAP Measures Certain statements contained in this presentation may qualify as “forward-looking statements” within the meaning of Section 27A of the Securities Act of 1933 and Section 21E of the Securities Exchange Act of 1934. All statements other than stat
Slide 3: Vision To Drive Shareholder Value
Vision To Drive Shareholder Value ▪ Our vision is to drive shareholder value through investment in expanding and modernizing our utility infrastructure and through regulatory innovation that provides safety, reliability, value and certainty to our customers. ▪ Knowing the criticality of reliable, co
Slide 4: Business Transformation
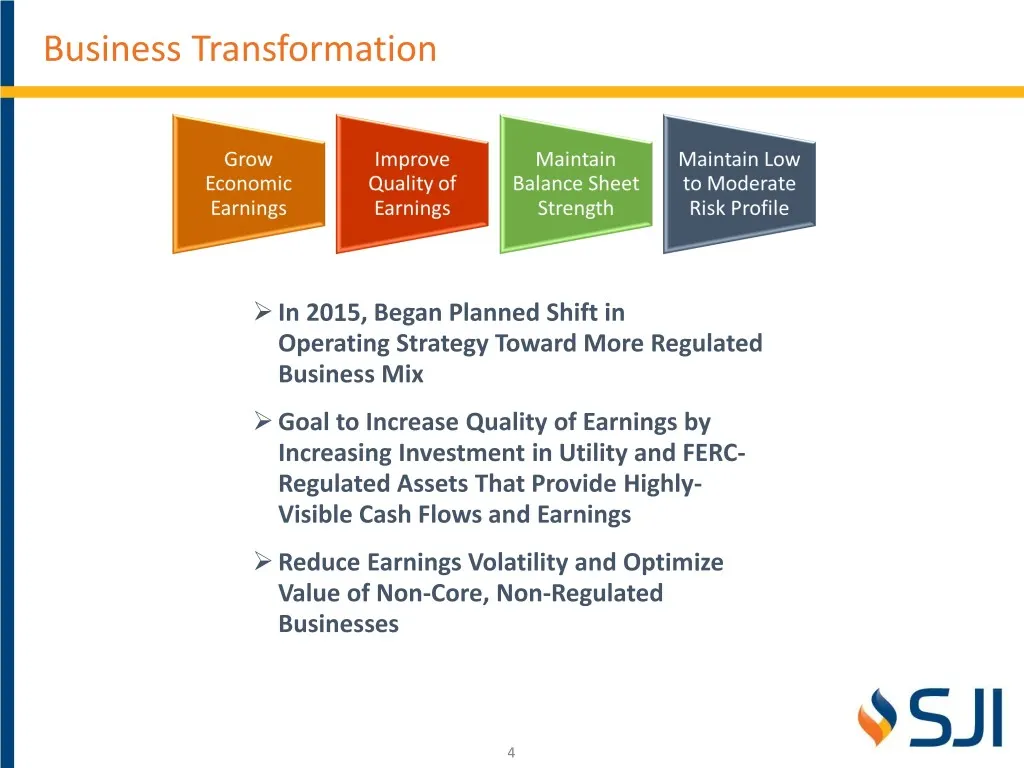
Business Transformation ➢ In 2015, Began Planned Shift in Operating Strategy Toward More Regulated Business Mix ➢ Goal to Increase Quality of Earnings by Increasing Investment in Utility and FERC- Regulated Assets That Provide Highly- Visible Cash Flows and Earnings ➢ Reduce Earnings Volatility and
Slide 5: We Have Executed Strategic Priorities
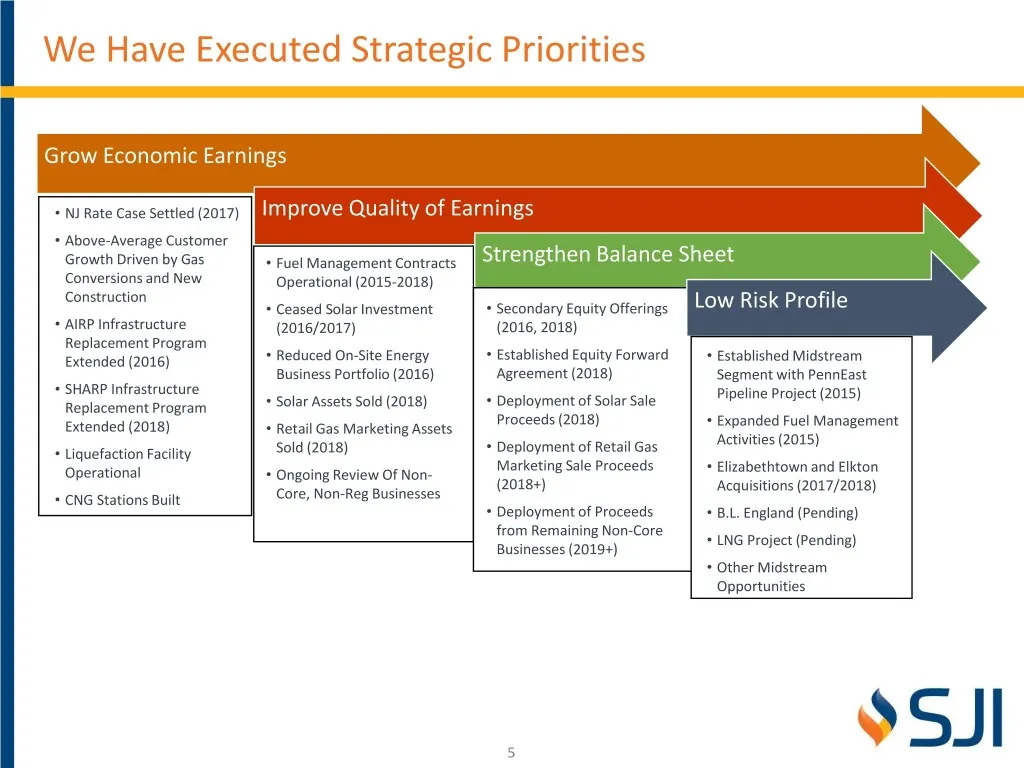
We Have Executed Strategic Priorities Grow Economic Earnings • NJ Rate Case Settled (2017) Improve Quality of Earnings • Above-Average Customer Growth Driven by Gas • Fuel Management Contracts Strengthen Balance Sheet Conversions and New Operational (2015-2018) Construction • Ceased Solar Investment
Slide 6: Organizational Structure Today
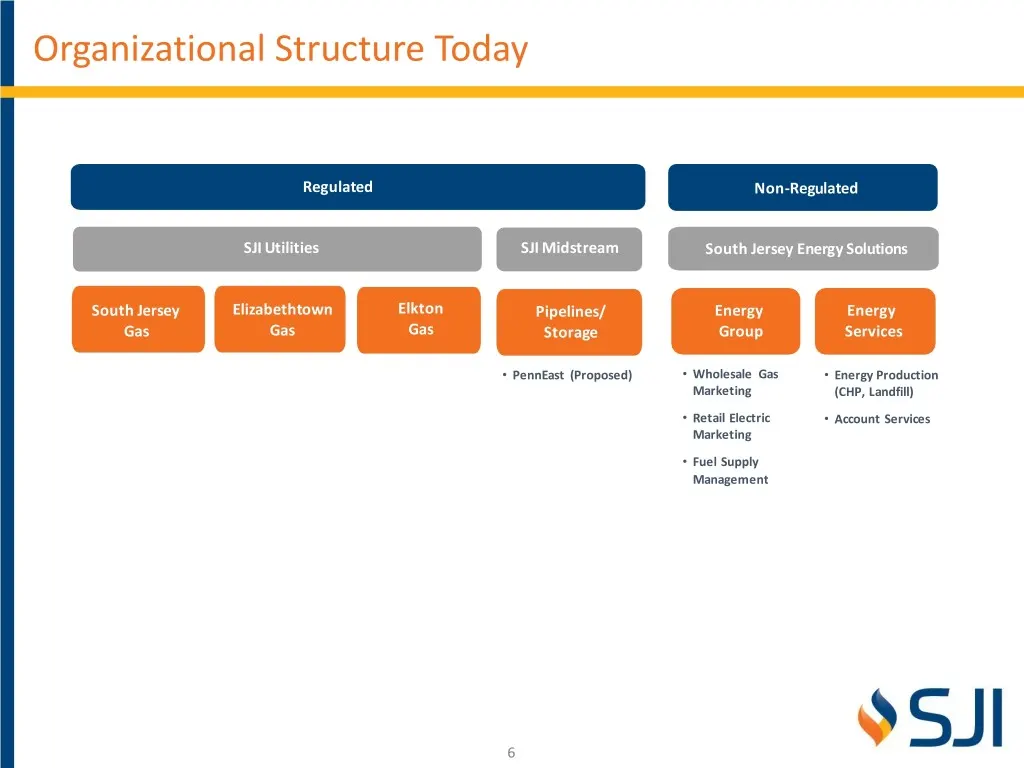
Organizational Structure Today Regulated Non-Regulated SJI Utilities SJI Midstream South Jersey Energy Solutions South Jersey Elizabethtown Elkton Pipelines/ Energy Energy Gas Gas Gas Storage Group Services • PennEast (Proposed) • Wholesale Gas • Energy Production Marketing (CHP, Landfill) • Retail
Slide 7: More Regulated and Stable Earnings Mix
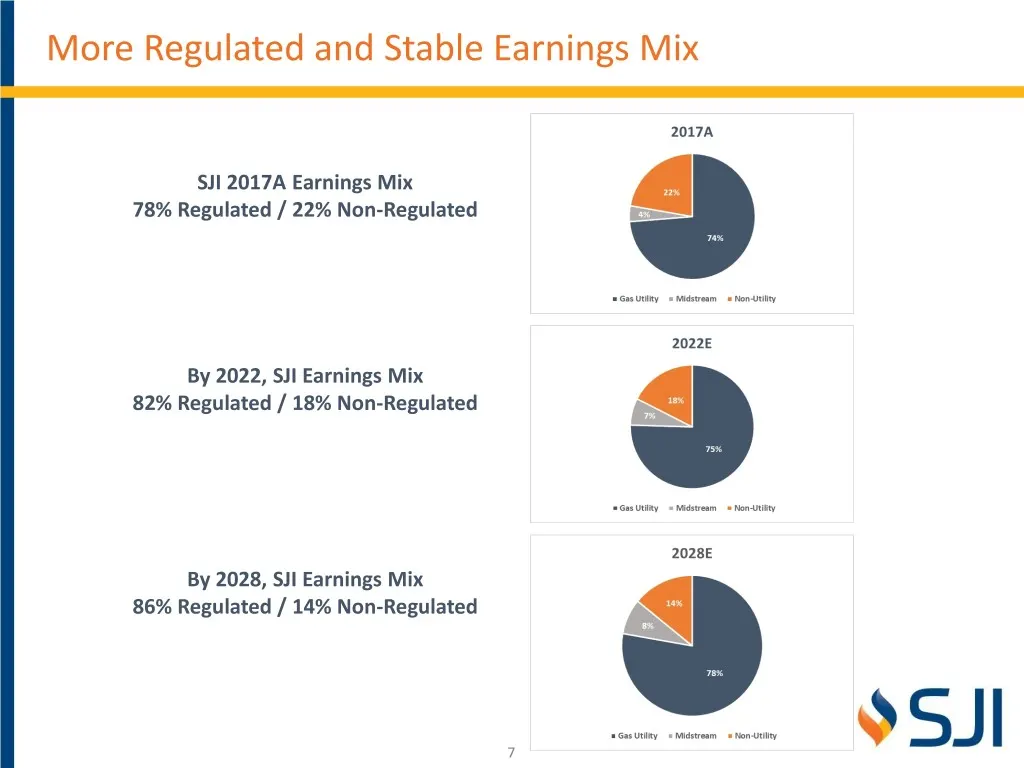
More Regulated and Stable Earnings Mix SJI 2017A Earnings Mix 78% Regulated / 22% Non-Regulated By 2022, SJI Earnings Mix 82% Regulated / 18% Non-Regulated By 2028, SJI Earnings Mix 86% Regulated / 14% Non-Regulated 7
Slide 8: Key Tenets of Growth Plan
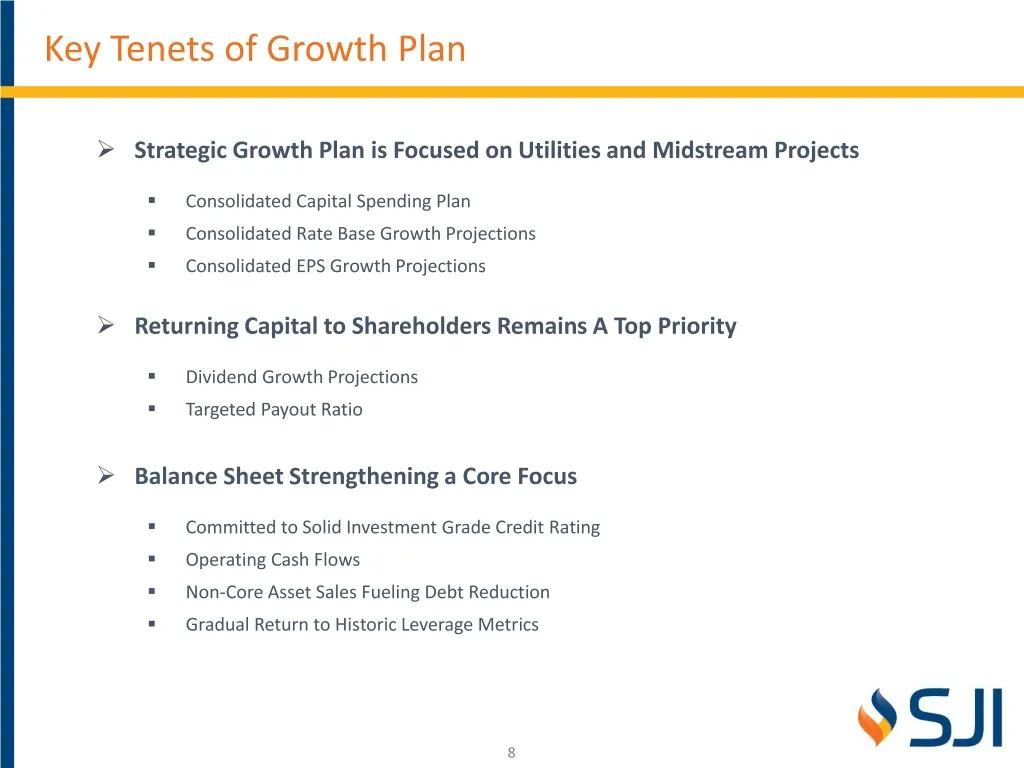
Key Tenets of Growth Plan ➢ Strategic Growth Plan is Focused on Utilities and Midstream Projects ▪ Consolidated Capital Spending Plan ▪ Consolidated Rate Base Growth Projections ▪ Consolidated EPS Growth Projections ➢ Returning Capital to Shareholders Remains A Top Priority ▪ Dividend Growth Project
Slide 9: Capital Expenditures 2018-2022
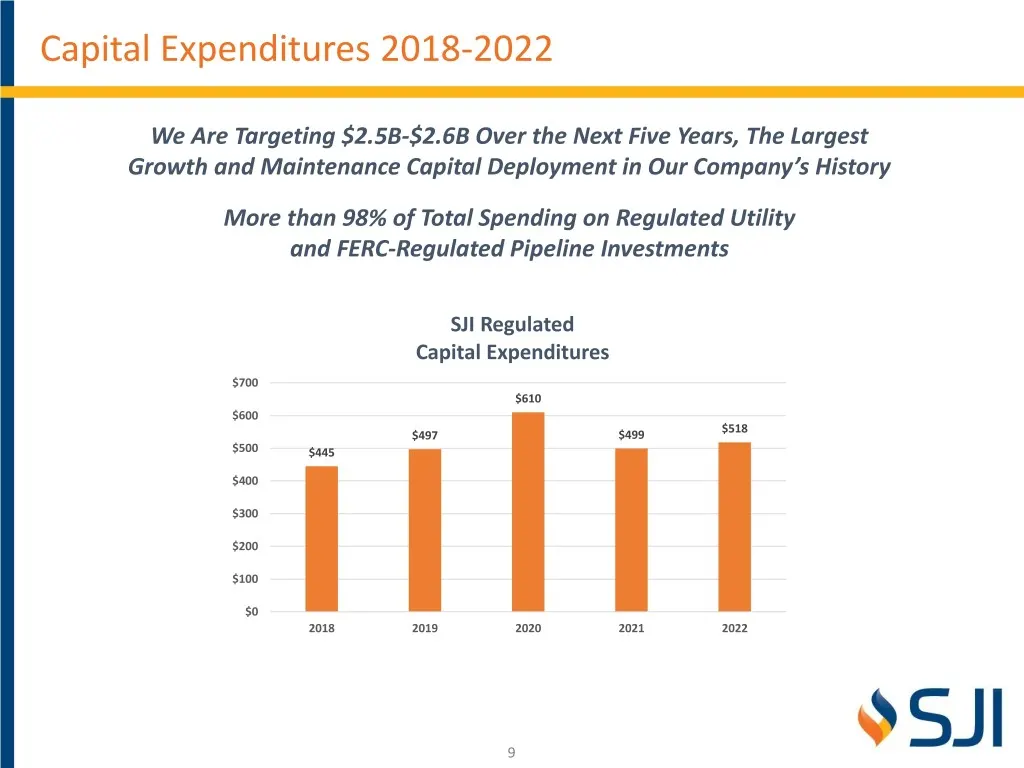
Capital Expenditures 2018-2022 We Are Targeting $2.5B-$2.6B Over the Next Five Years, The Largest Growth and Maintenance Capital Deployment in Our Company’s History More than 98% of Total Spending on Regulated Utility and FERC-Regulated Pipeline Investments SJI Regulated Capital Expenditures $700 $6
Slide 10: Rate Base Growth 2018-2022
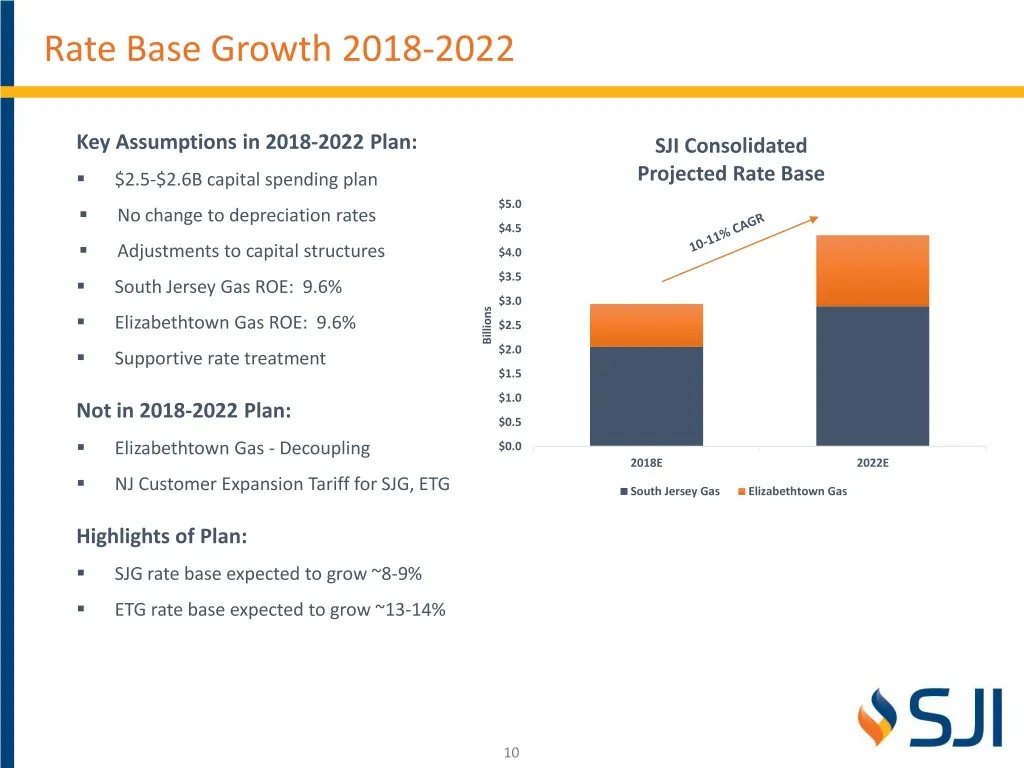
Rate Base Growth 2018-2022 Key Assumptions in 2018-2022 Plan: SJI Consolidated ▪ $2.5-$2.6B capital spending plan Projected Rate Base $5.0 ▪ No change to depreciation rates $4.5 ▪ Adjustments to capital structures $4.0 $3.5 ▪ South Jersey Gas ROE: 9.6% $3.0 ▪ Elizabethtown Gas ROE: 9.6% $2.5 Billion
Slide 11: Economic EPS Growth 2018-2022
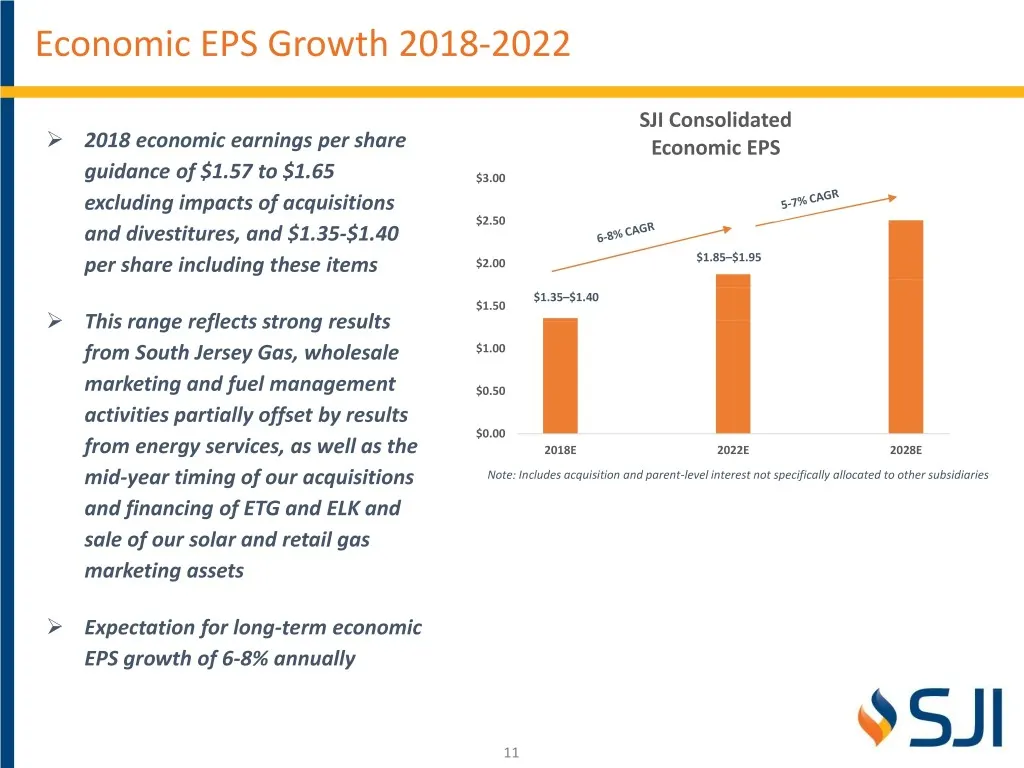
Economic EPS Growth 2018-2022 ➢ SJI Consolidated 2018 economic earnings per share Economic EPS guidance of $1.57 to $1.65 $3.00 excluding impacts of acquisitions $2.50 and divestitures, and $1.35-$1.40 per share including these items $2.00 $1.85–$1.95 $1.35–$1.40 $1.50 ➢ This range reflects strong r
Slide 12: Dividend Growth 2018-2022
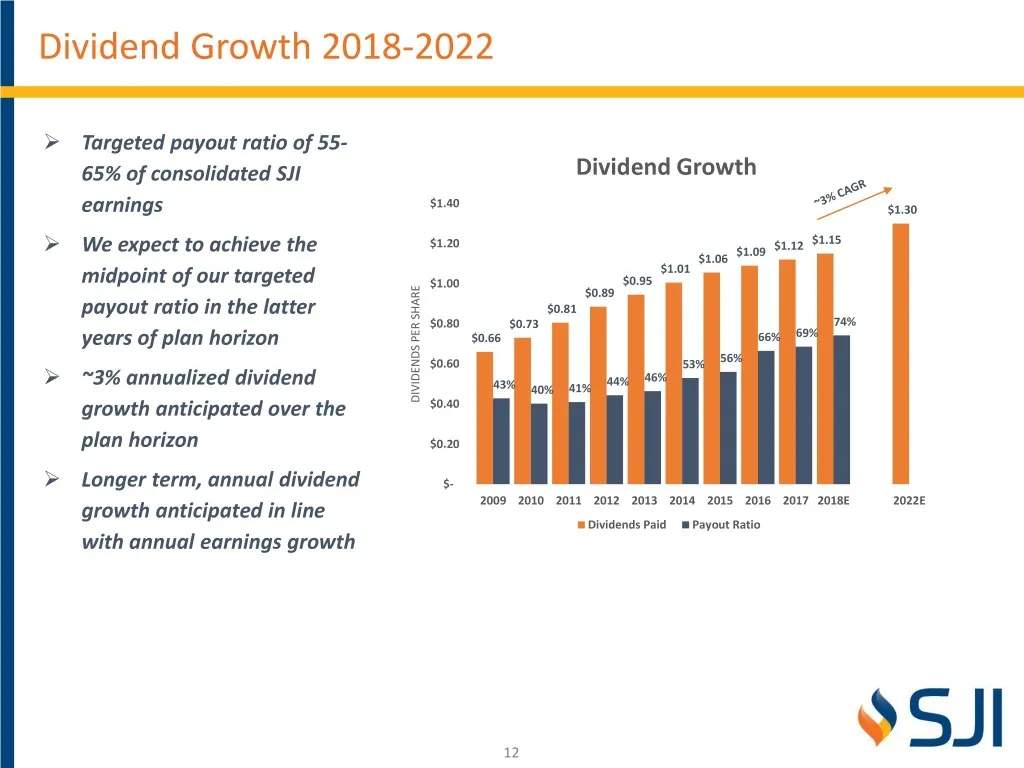
Dividend Growth 2018-2022 ➢ Targeted payout ratio of 55- 65% of consolidated SJI Dividend Growth $1.40 earnings $1.30 ➢ $1.20 $1.15 We expect to achieve the $1.09 $1.12 $1.06 $1.01 midpoint of our targeted $1.00 $0.95 $0.89 payout ratio in the latter $0.81 $0.80 $0.73 74% years of plan horizon $0.66
Slide 13: Committed to Solid Balance Sheet and Credit Rating
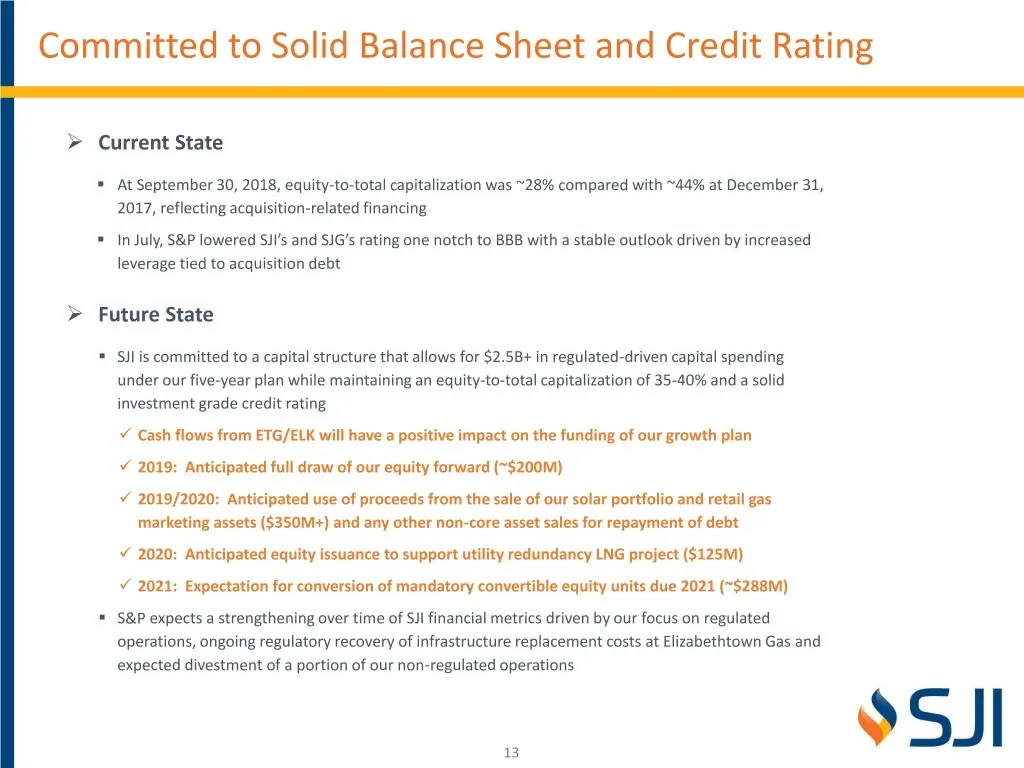
Committed to Solid Balance Sheet and Credit Rating ➢ Current State ▪ At September 30, 2018, equity-to-total capitalization was ~28% compared with ~44% at December 31, 2017, reflecting acquisition-related financing ▪ In July, S&P lowered SJI’s and SJG’s rating one notch to BBB with a stable outlook d
Slide 14: Strategy
Strategy 9SJI
Slide 15: Business Transformation – Next Steps
Business Transformation – Next Steps ➢ Acquisition Integration ▪ Integration of ETG/Elkton and Adoption of Best Practices ➢ Business Transformation Initiative ▪ Leveraging Talent and Technology to Improve Business Processes and Results ➢ Non-Core Businesses ▪ Complete Review of Remaining Non- Core,
Slide 16: Acquisition Integration
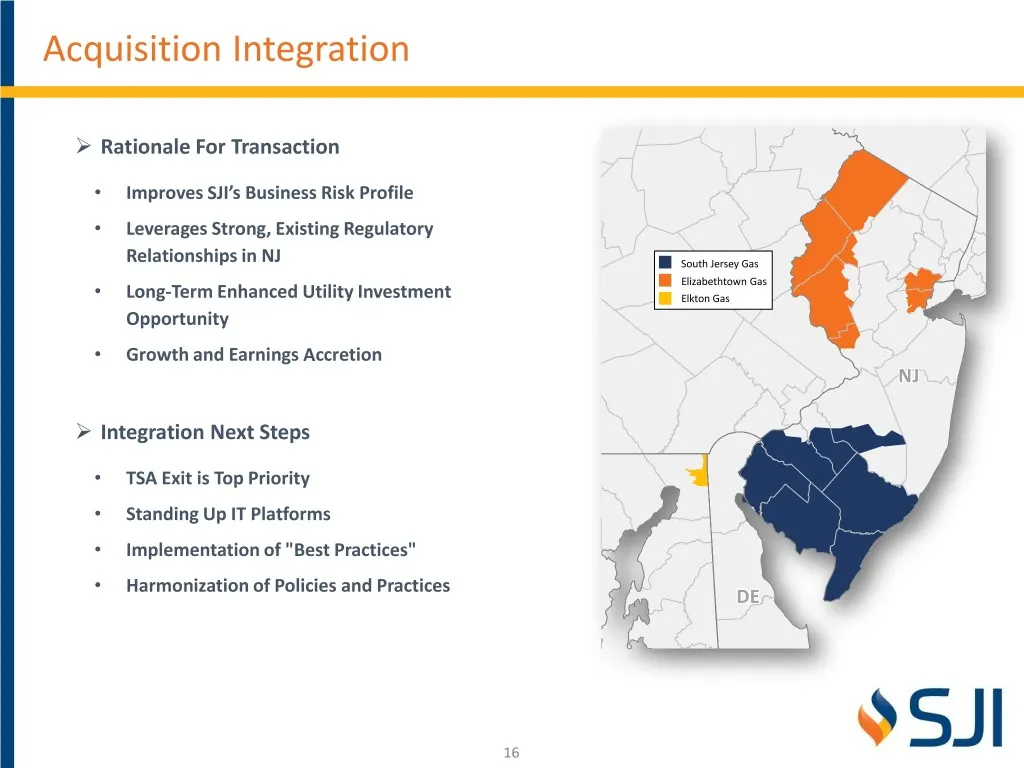
NYNY Acquisition Integration ➢ Rationale For Transaction • Improves SJI’s Business Risk Profile • Leverages Strong, Existing Regulatory Relationships in NJ SouthPAPA Jersey Gas Elizabethtown Gas • Long-Term Enhanced Utility Investment Elkton Gas Opportunity • Growth and Earnings Accretion NJNJ ➢ Int
Slide 17: Non-Core Businesses
Non-Core Businesses ➢ As part of our business transformation plan, we are seeking to optimize the value of our non-core, non-regulated businesses ➢ These businesses include our investment/ownership in solar, retail gas and electric commodity marketing operations, combined heat-and-power assets and l
Slide 18: Upcoming Regulatory Initiatives | SJG
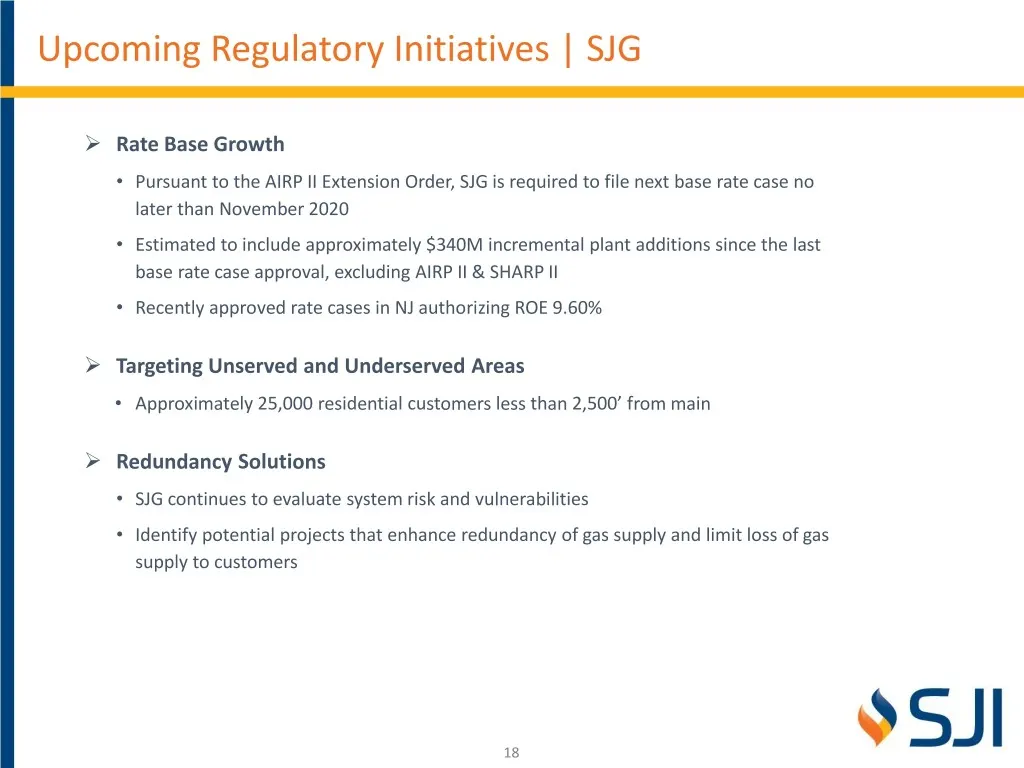
Upcoming Regulatory Initiatives | SJG ➢ Rate Base Growth • Pursuant to the AIRP II Extension Order, SJG is required to file next base rate case no later than November 2020 • Estimated to include approximately $340M incremental plant additions since the last base rate case approval, excluding AIRP II
Slide 19: Upcoming Regulatory Initiatives | ETG
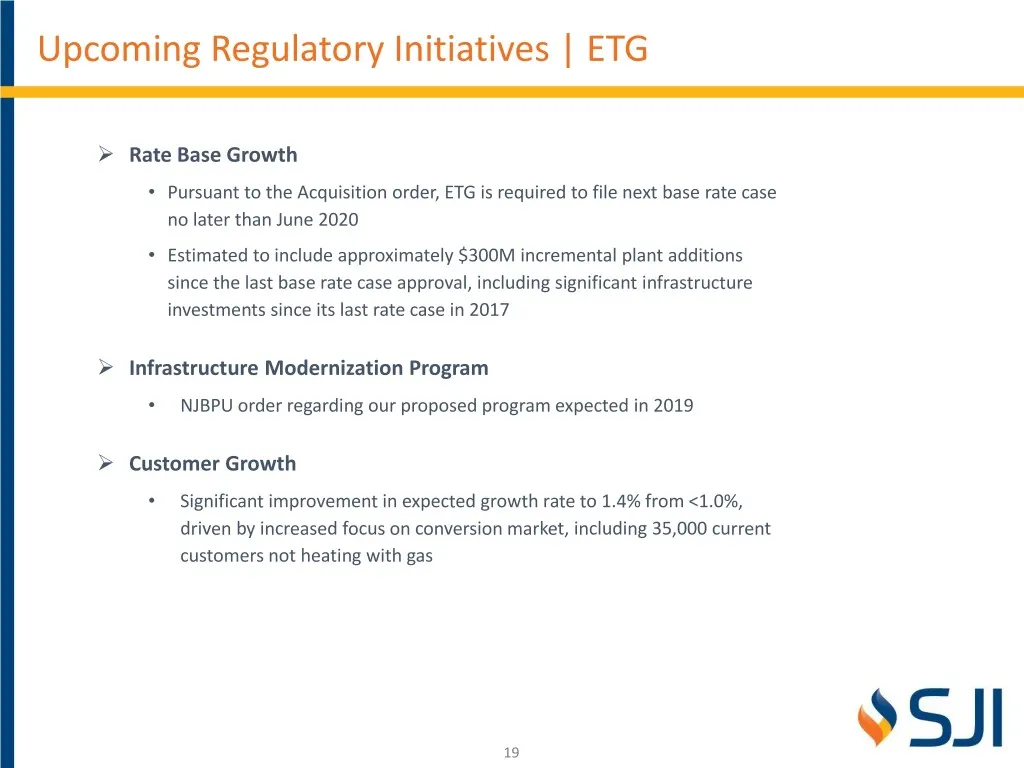
Upcoming Regulatory Initiatives | ETG ➢ Rate Base Growth • Pursuant to the Acquisition order, ETG is required to file next base rate case no later than June 2020 • Estimated to include approximately $300M incremental plant additions since the last base rate case approval, including significant infra
Slide 20: Regulatory Initiatives Beyond 2020
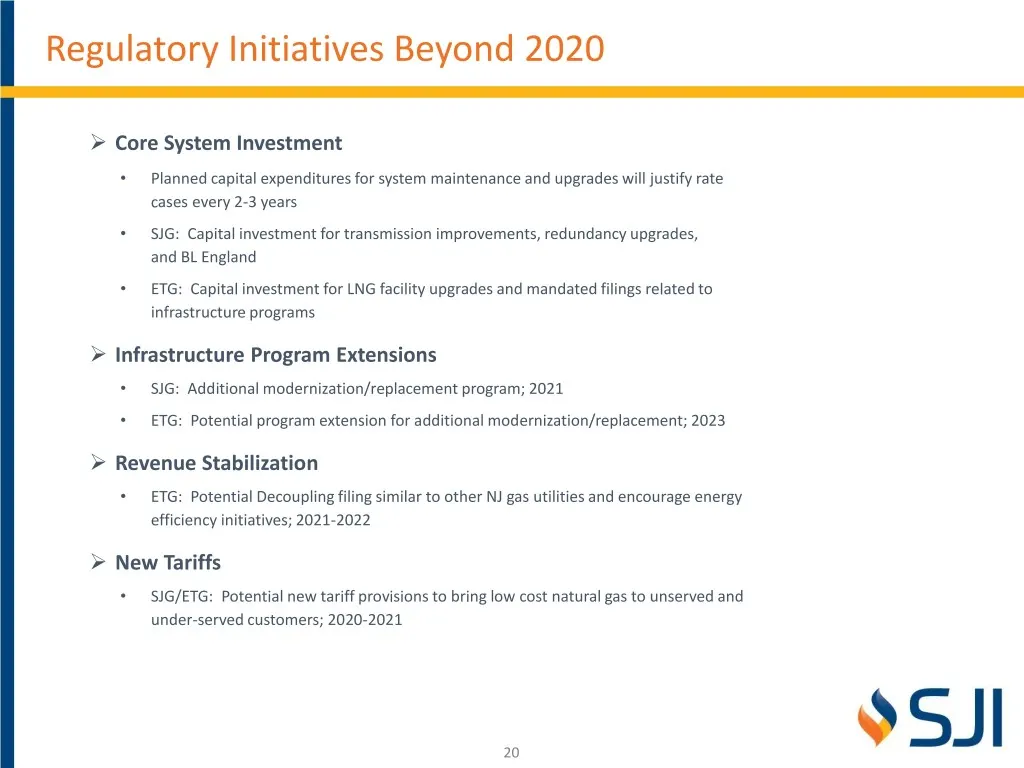
Regulatory Initiatives Beyond 2020 ➢ Core System Investment • Planned capital expenditures for system maintenance and upgrades will justify rate cases every 2-3 years • SJG: Capital investment for transmission improvements, redundancy upgrades, and BL England • ETG: Capital investment for LNG facili
Slide 21: SJI Utilities (SJIU)
SJI Utilities (SJIU) 9SJI
Slide 22: SJI Utilities | Overview
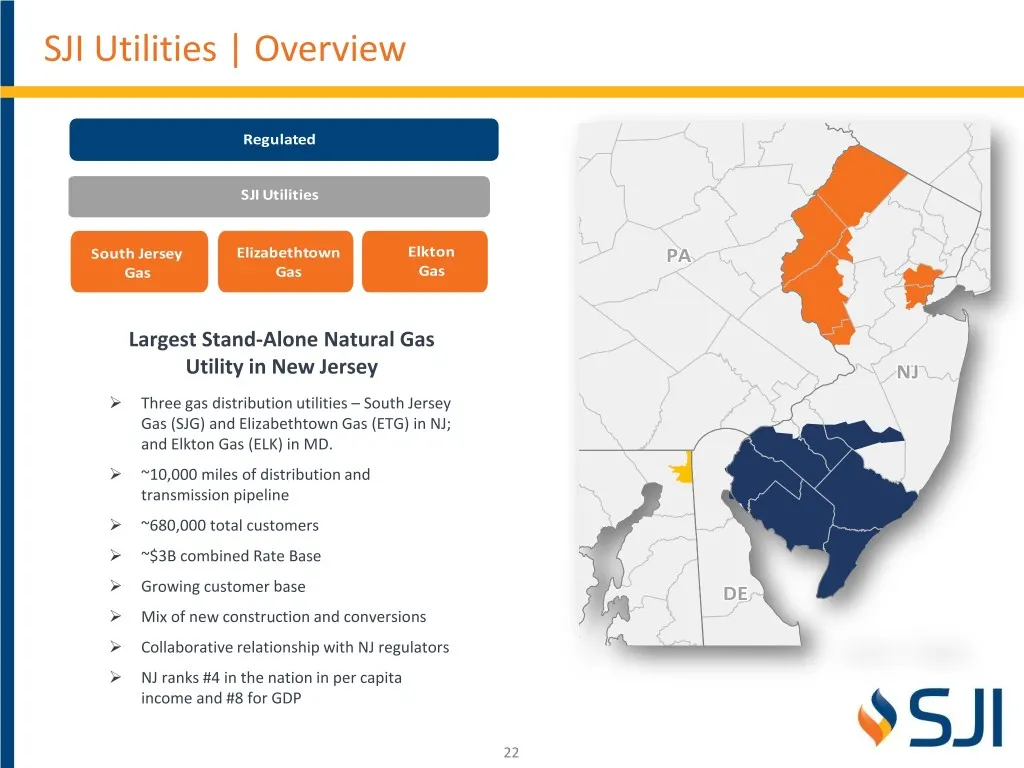
NYNY SJI Utilities | Overview Regulated SJI Utilities South Jersey Elizabethtown Elkton PAPA Gas Gas Gas Largest Stand-Alone Natural Gas Utility in New Jersey NJNJ ➢ Three gas distribution utilities – South Jersey Gas (SJG) and Elizabethtown Gas (ETG) in NJ; and Elkton Gas (ELK) in MD. ➢ ~10,000 mil
Slide 23: SJI Utilities | Opportunity For Infrastructure Upgrades
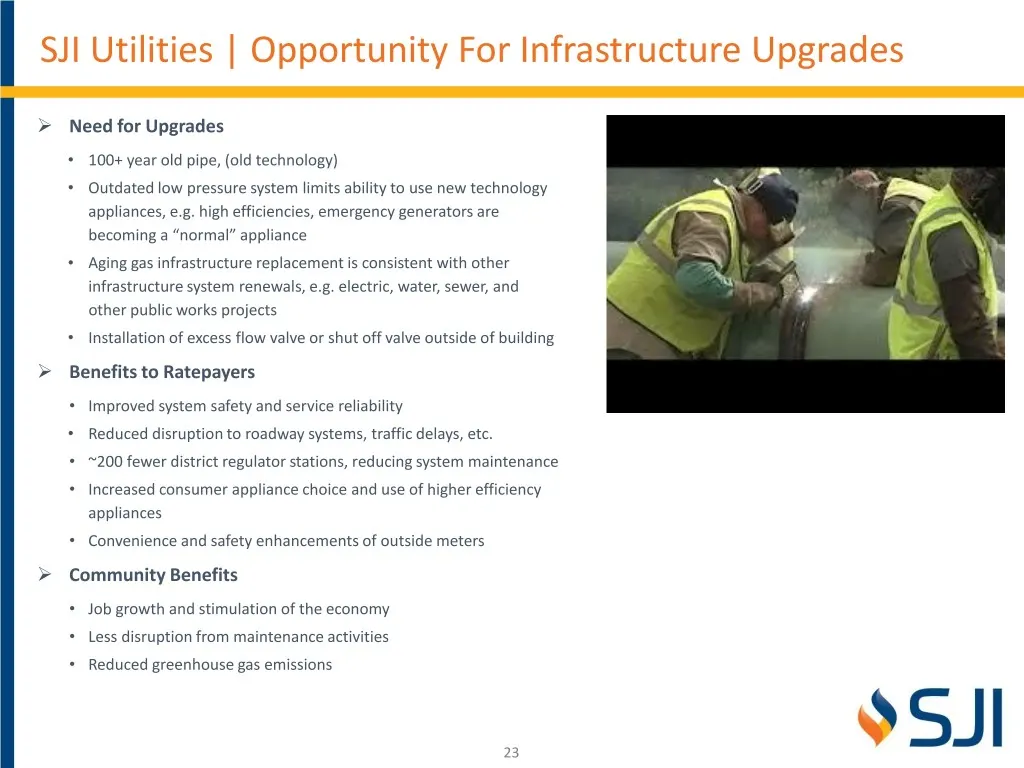
SJI Utilities | Opportunity For Infrastructure Upgrades ➢ Need for Upgrades • 100+ year old pipe, (old technology) • Outdated low pressure system limits ability to use new technology appliances, e.g. high efficiencies, emergency generators are becoming a “normal” appliance • Aging gas infrastructure
Slide 24: South Jersey Gas | Overview
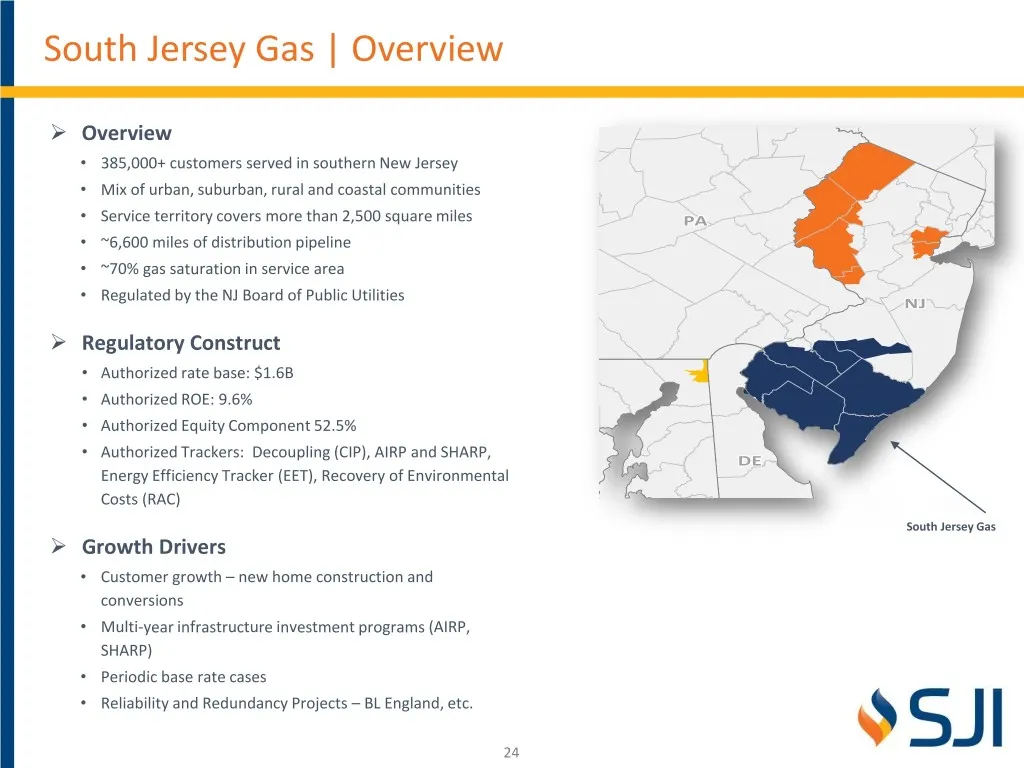
NYNY South Jersey Gas | Overview ➢ Overview • 385,000+ customers served in southern New Jersey • Mix of urban, suburban, rural and coastal communities • Service territory covers more than 2,500 square miles PAPA • ~6,600 miles of distribution pipeline • ~70% gas saturation in service area • Regulate
Slide 25: South Jersey Gas | Customer Growth
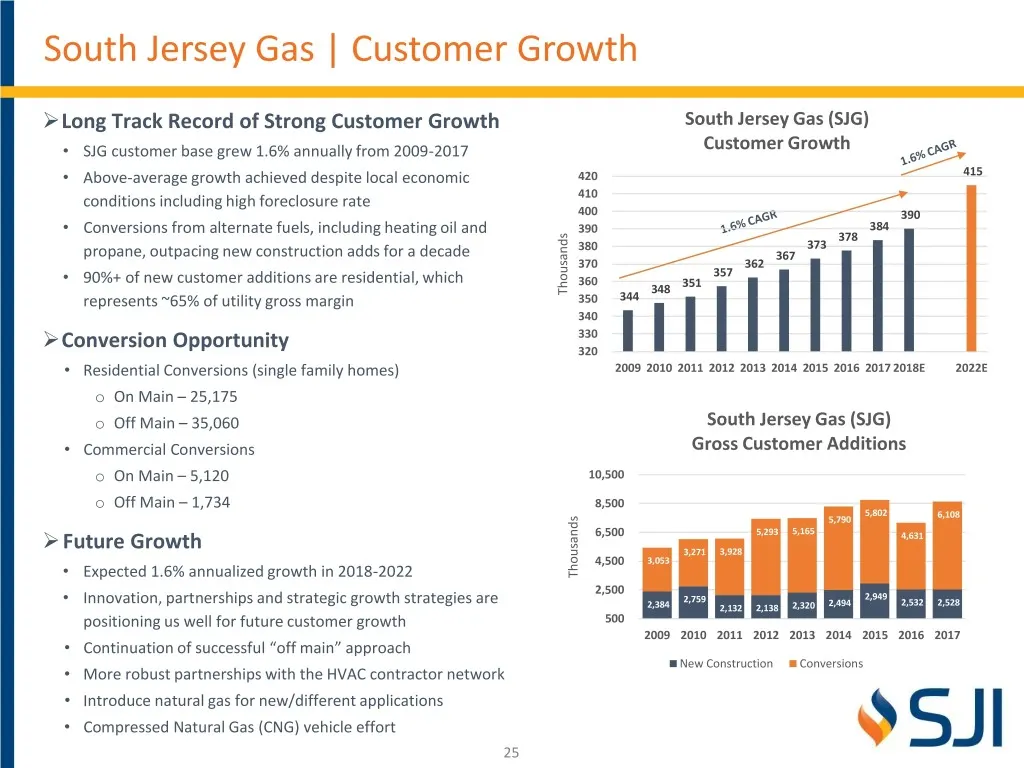
South Jersey Gas | Customer Growth ➢Long Track Record of Strong Customer Growth South Jersey Gas (SJG) • SJG customer base grew 1.6% annually from 2009-2017 Customer Growth • Above-average growth achieved despite local economic 420 415 conditions including high foreclosure rate 410 400 390 • Convers
Slide 26: South Jersey Gas | Infrastructure Modernization
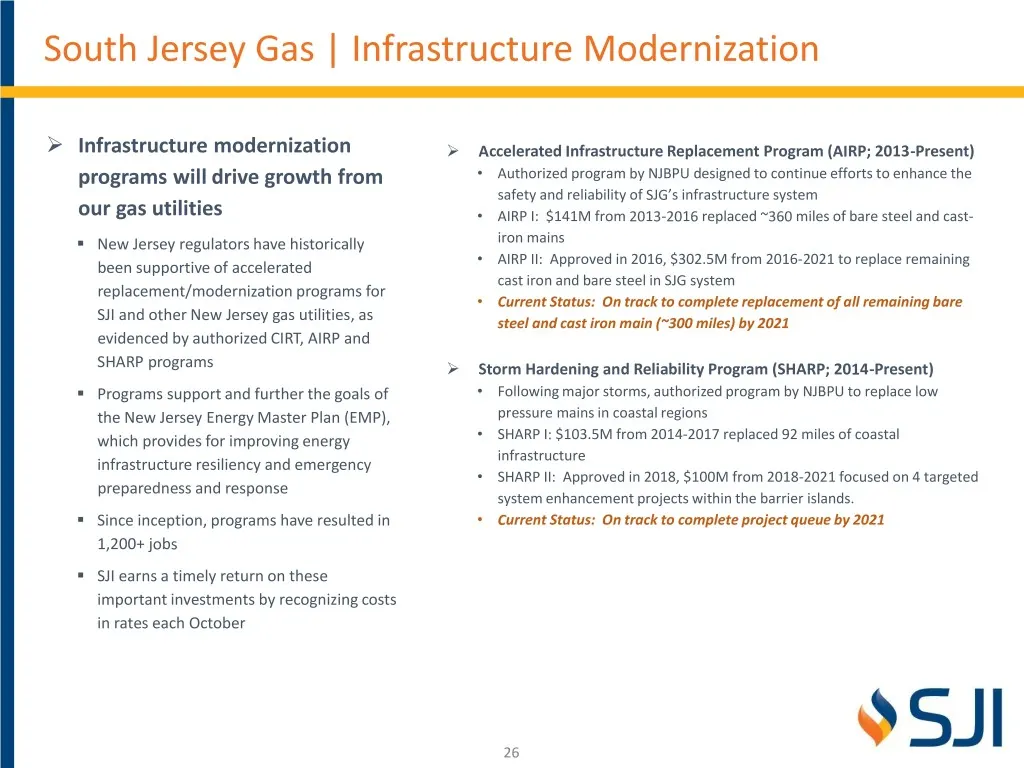
South Jersey Gas | Infrastructure Modernization ➢ Infrastructure modernization ➢ Accelerated Infrastructure Replacement Program (AIRP; 2013-Present) programs will drive growth from • Authorized program by NJBPU designed to continue efforts to enhance the safety and reliability of SJG’s infrastructur
Slide 27: South Jersey Gas | Pipeline Replacement
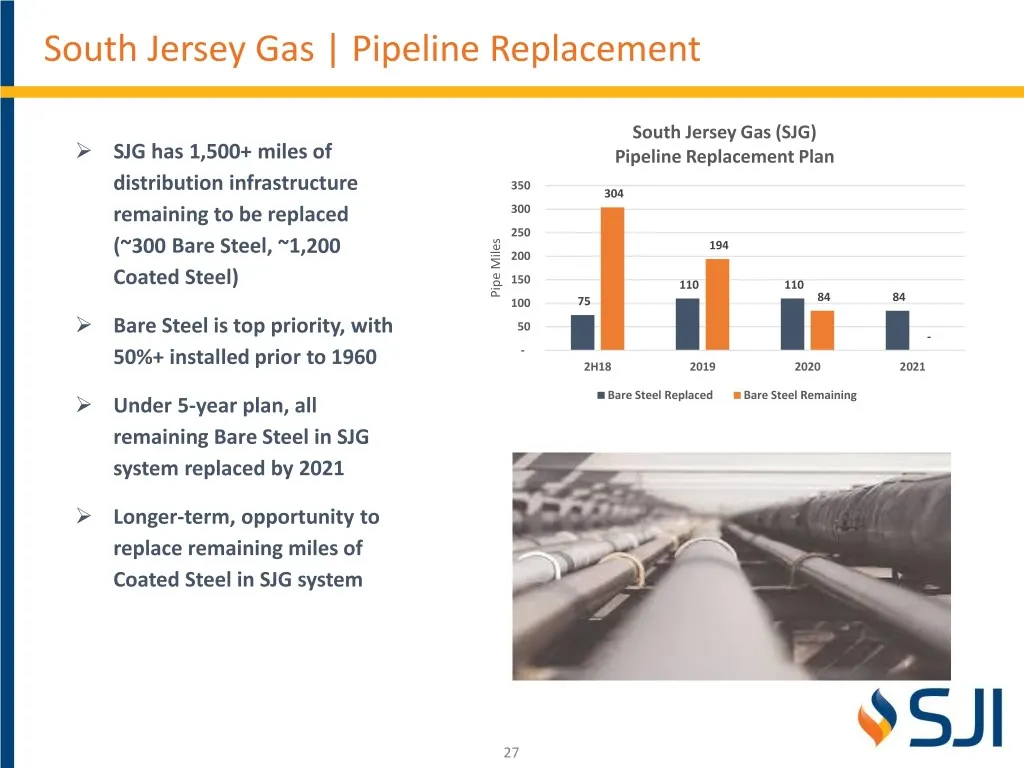
South Jersey Gas | Pipeline Replacement ➢ South Jersey Gas (SJG) SJG has 1,500+ miles of Pipeline Replacement Plan 350 distribution infrastructure 304 remaining to be replaced 300 250 194 (~300 Bare Steel, ~1,200 200 Coated Steel) 150 110 110 Pipe Miles Pipe 100 75 84 84 ➢ 50 Bare Steel is top prior
Slide 28: South Jersey Gas | Redundancy Solutions
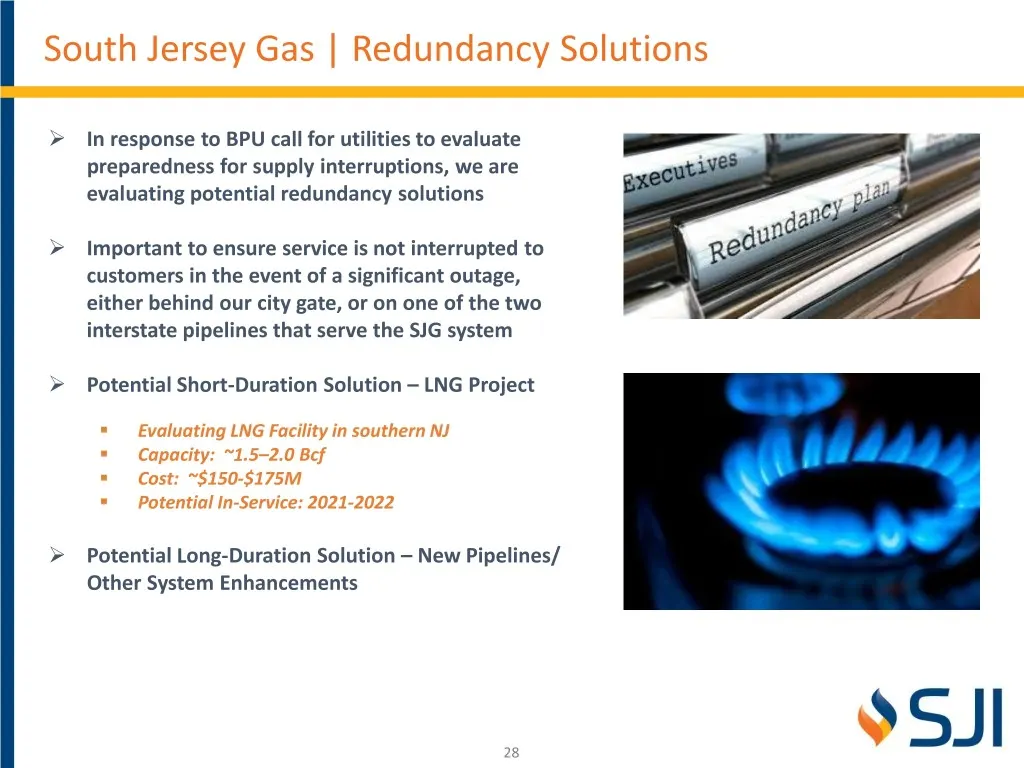
South Jersey Gas | Redundancy Solutions ➢ In response to BPU call for utilities to evaluate preparedness for supply interruptions, we are evaluating potential redundancy solutions ➢ Important to ensure service is not interrupted to customers in the event of a significant outage, either behind our ci
Slide 29: South Jersey Gas | Capital Expenditures
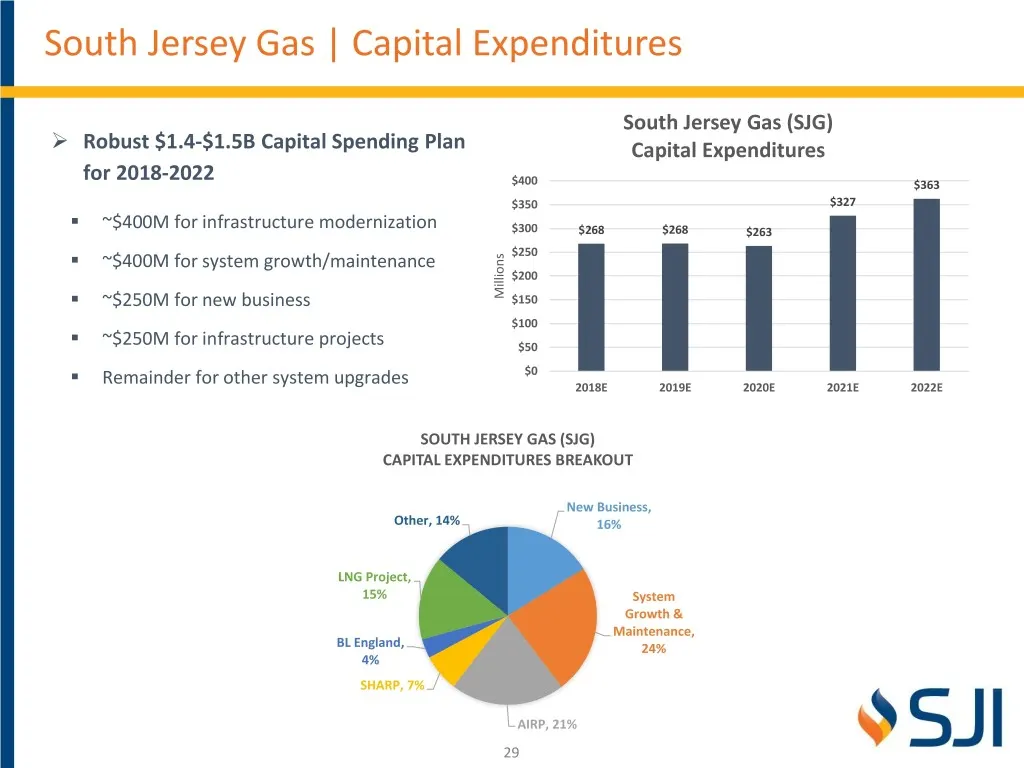
South Jersey Gas | Capital Expenditures ➢ South Jersey Gas (SJG) Robust $1.4-$1.5B Capital Spending Plan Capital Expenditures for 2018-2022 $400 $363 $327 ▪ $350 ~$400M for infrastructure modernization $300 $268 $268 $263 ▪ ~$400M for system growth/maintenance $250 $200 ▪ Millions ~$250M for new bus
Slide 30: Elizabethtown Gas | Overview
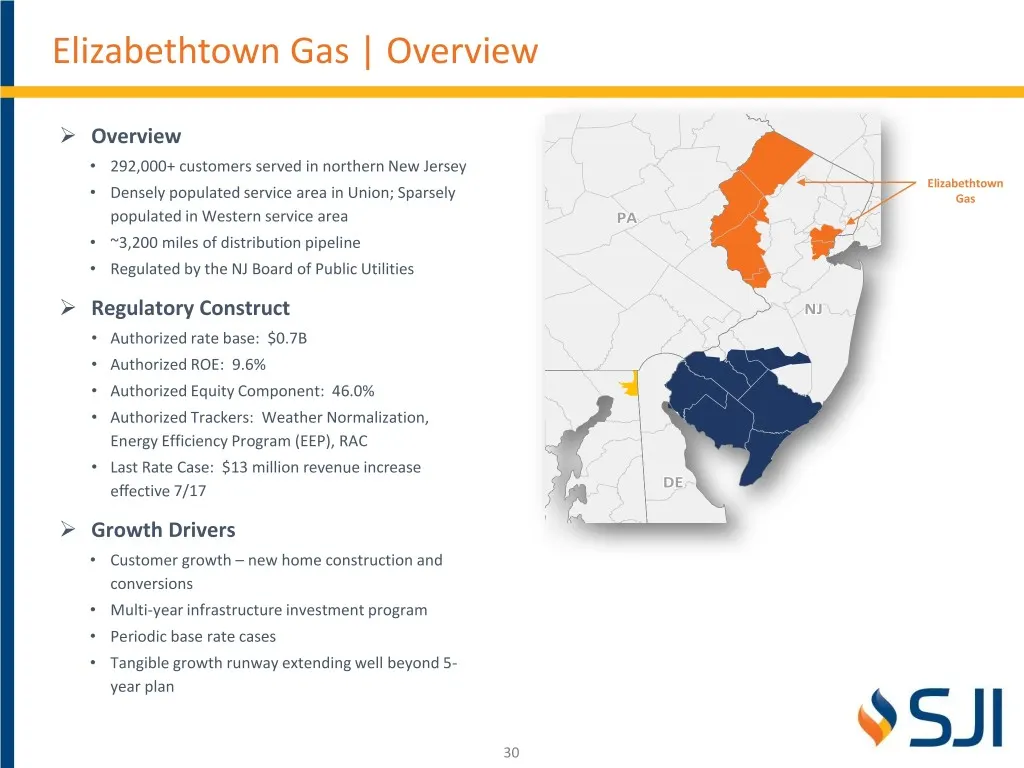
NYNY Elizabethtown Gas | Overview ➢ Overview • 292,000+ customers served in northern New Jersey Elizabethtown • Densely populated service area in Union; Sparsely Gas populated in Western service area PAPA • ~3,200 miles of distribution pipeline • Regulated by the NJ Board of Public Utilities ➢ Regul
Slide 31: Elizabethtown Gas | Customer Growth
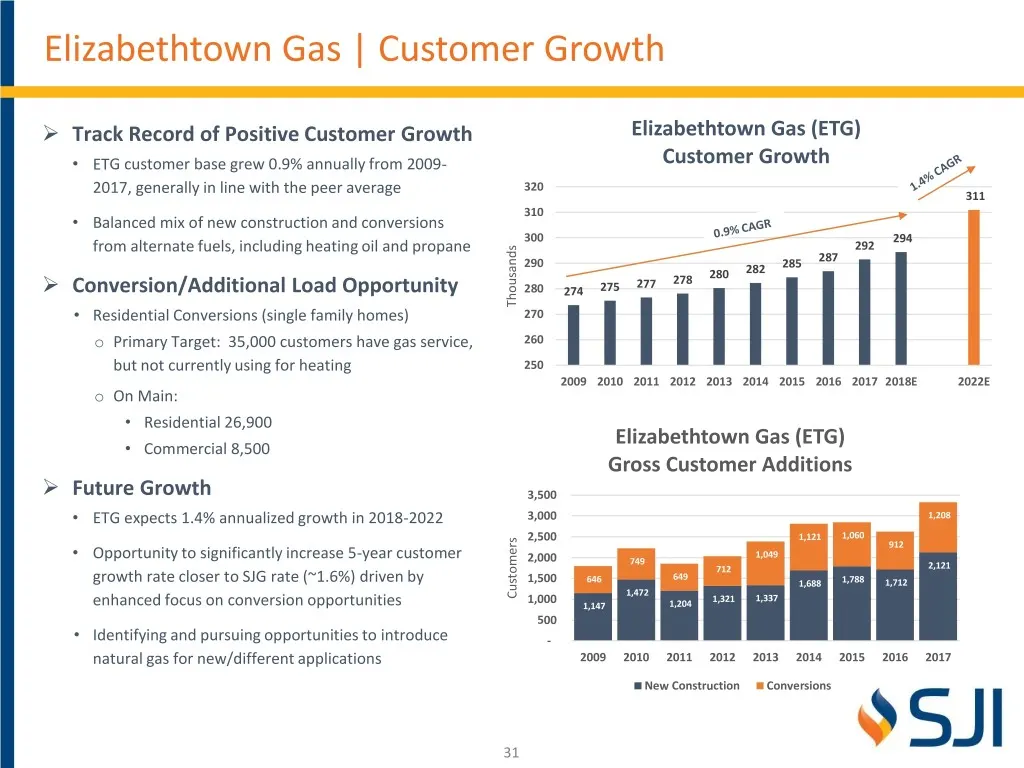
Elizabethtown Gas | Customer Growth ➢ Track Record of Positive Customer Growth Elizabethtown Gas (ETG) • ETG customer base grew 0.9% annually from 2009- Customer Growth 320 2017, generally in line with the peer average 311 310 • Balanced mix of new construction and conversions 300 294 from alternate
Slide 32: Elizabethtown Gas | Proposed Infrastructure Program
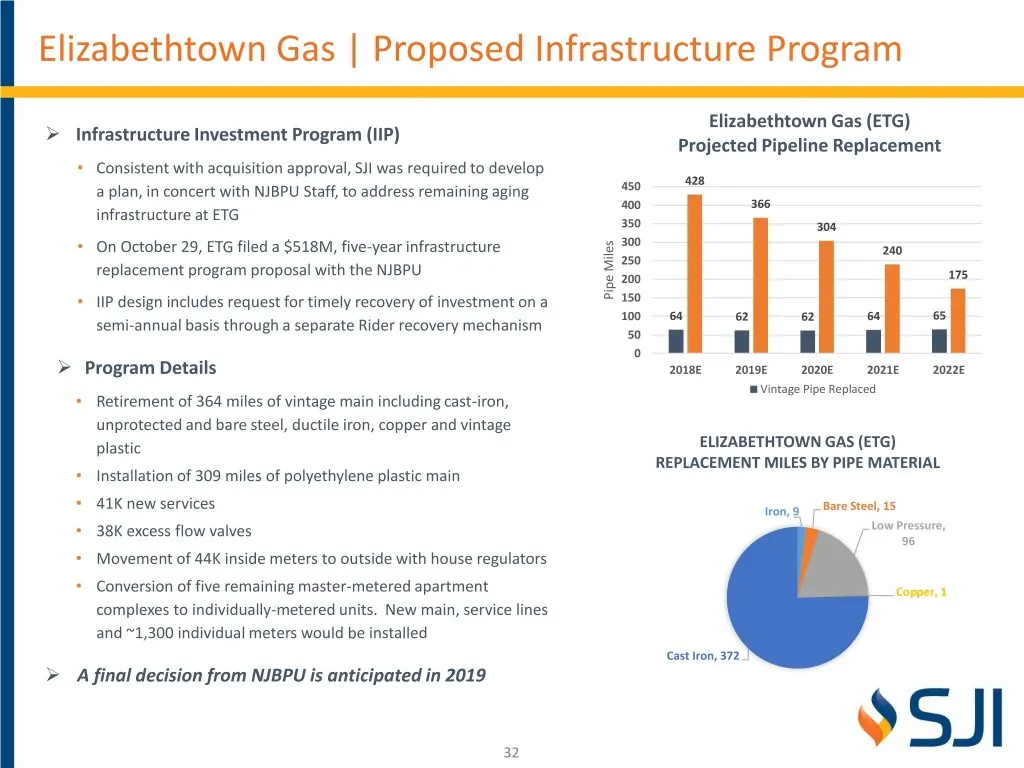
Elizabethtown Gas | Proposed Infrastructure Program Elizabethtown Gas (ETG) ➢ Infrastructure Investment Program (IIP) Projected Pipeline Replacement • Consistent with acquisition approval, SJI was required to develop 428 a plan, in concert with NJBPU Staff, to address remaining aging 450 400 366 inf
Slide 33: Elizabethtown Gas | Capital Expenditures
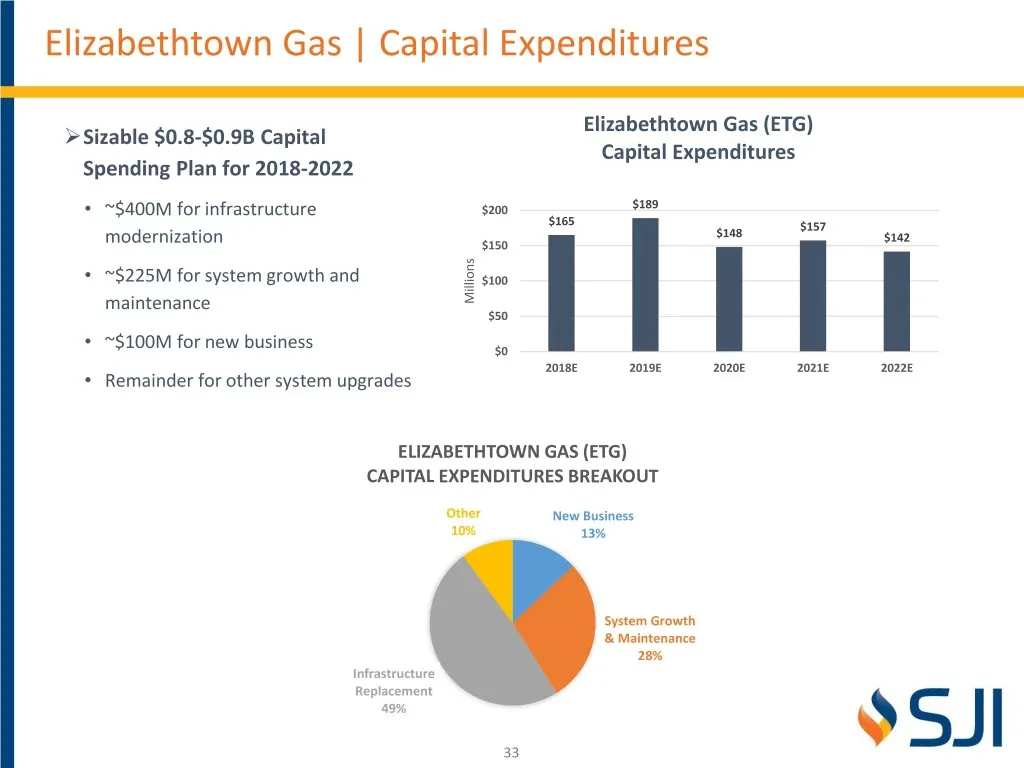
Elizabethtown Gas | Capital Expenditures Elizabethtown Gas (ETG) ➢Sizable $0.8-$0.9B Capital Capital Expenditures Spending Plan for 2018-2022 • ~$400M for infrastructure $200 $189 $165 $157 $148 $142 modernization $150 • ~$225M for system growth and $100 maintenance Millions $50 • ~$100M for new bus
Slide 34: Elkton Gas | Overview
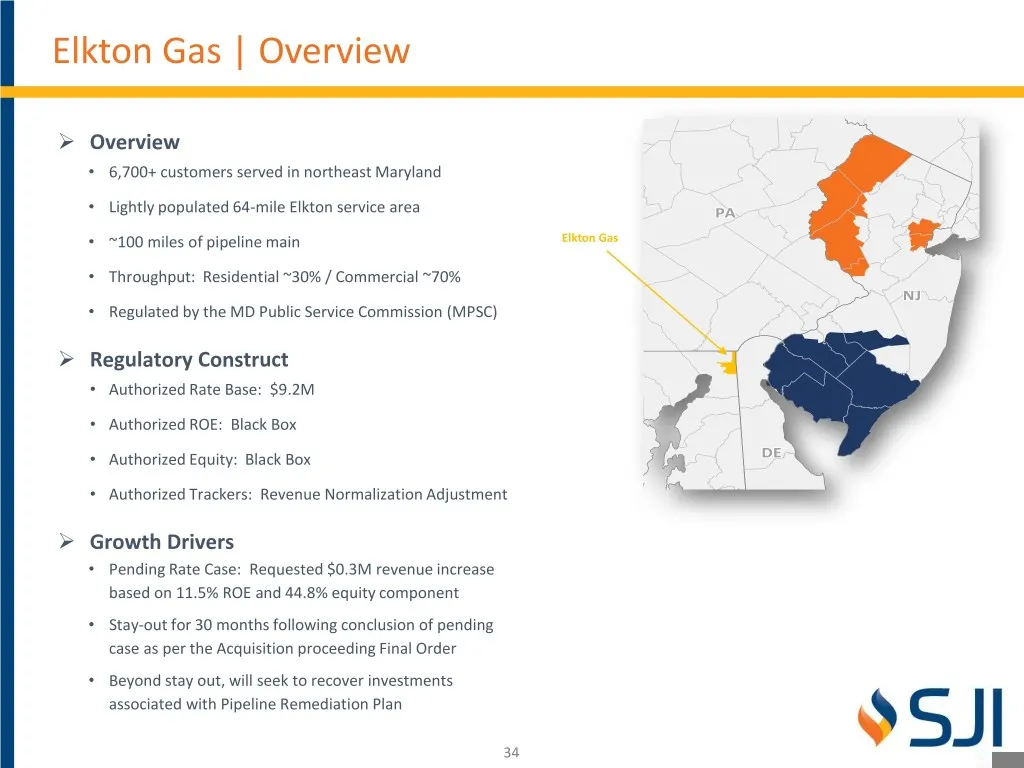
NYNY Elkton Gas | Overview ➢ Overview • 6,700+ customers served in northeast Maryland • Lightly populated 64-mile Elkton service area PAPA • ~100 miles of pipeline main Elkton Gas • Throughput: Residential ~30% / Commercial ~70% NJNJ • Regulated by the MD Public Service Commission (MPSC) ➢ Regulator
Slide 35: SJIU Summary | Well Positioned For Strong Growth
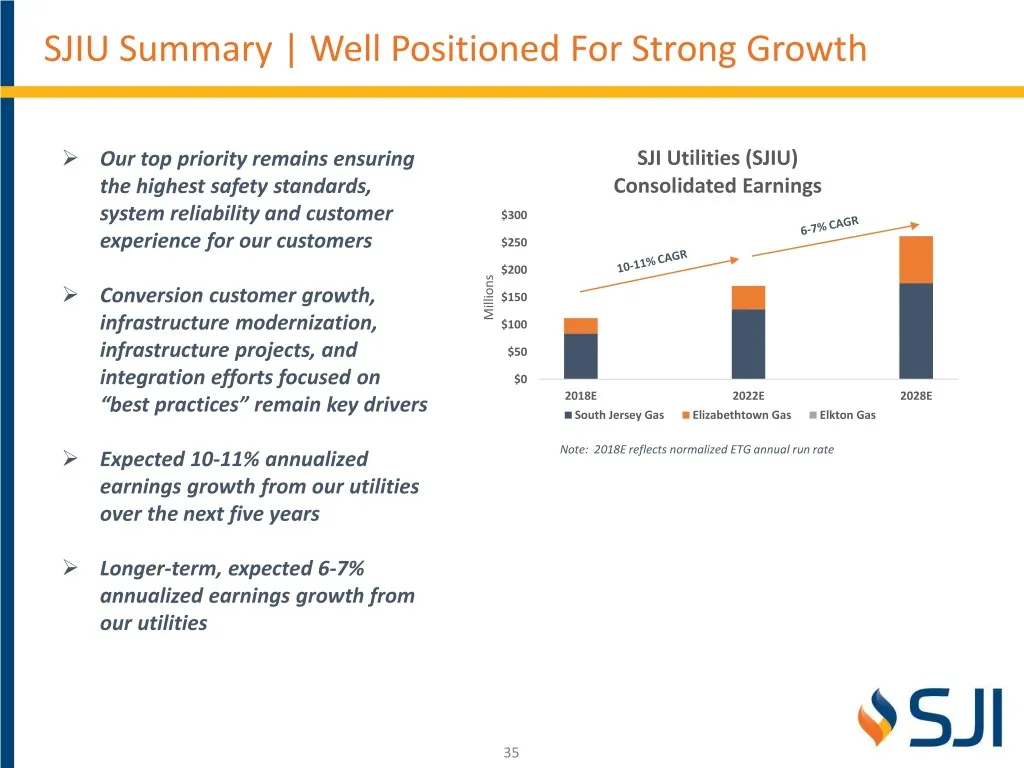
SJIU Summary | Well Positioned For Strong Growth ➢ Our top priority remains ensuring SJI Utilities (SJIU) the highest safety standards, Consolidated Earnings system reliability and customer $300 experience for our customers $250 $200 ➢ Conversion customer growth, $150 infrastructure modernization, M
Slide 36: Midstream
Midstream 9SJI
Slide 37: PennEast Pipeline
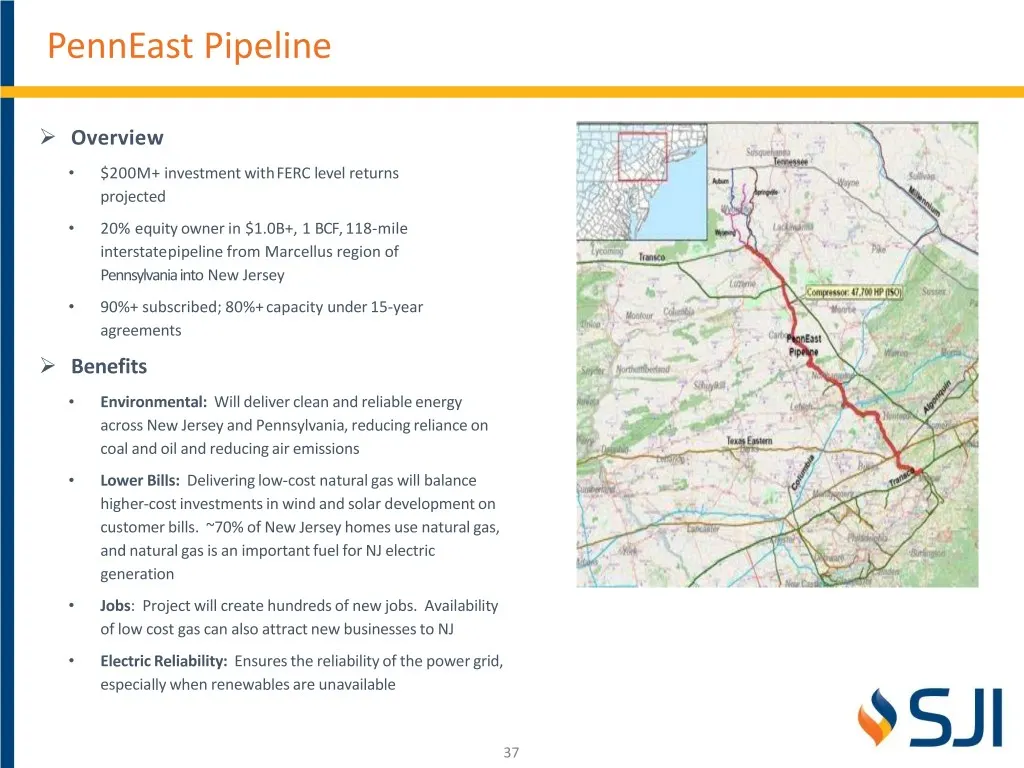
PennEast Pipeline ➢ Overview • $200M+ investment withFERC level returns projected • 20% equity owner in $1.0B+, 1 BCF, 118-mile interstatepipeline from Marcellus region of Pennsylvania into New Jersey • 90%+ subscribed; 80%+ capacity under 15-year agreements ➢ Benefits • Environmental: Will deliver
Slide 38: PennEast Status
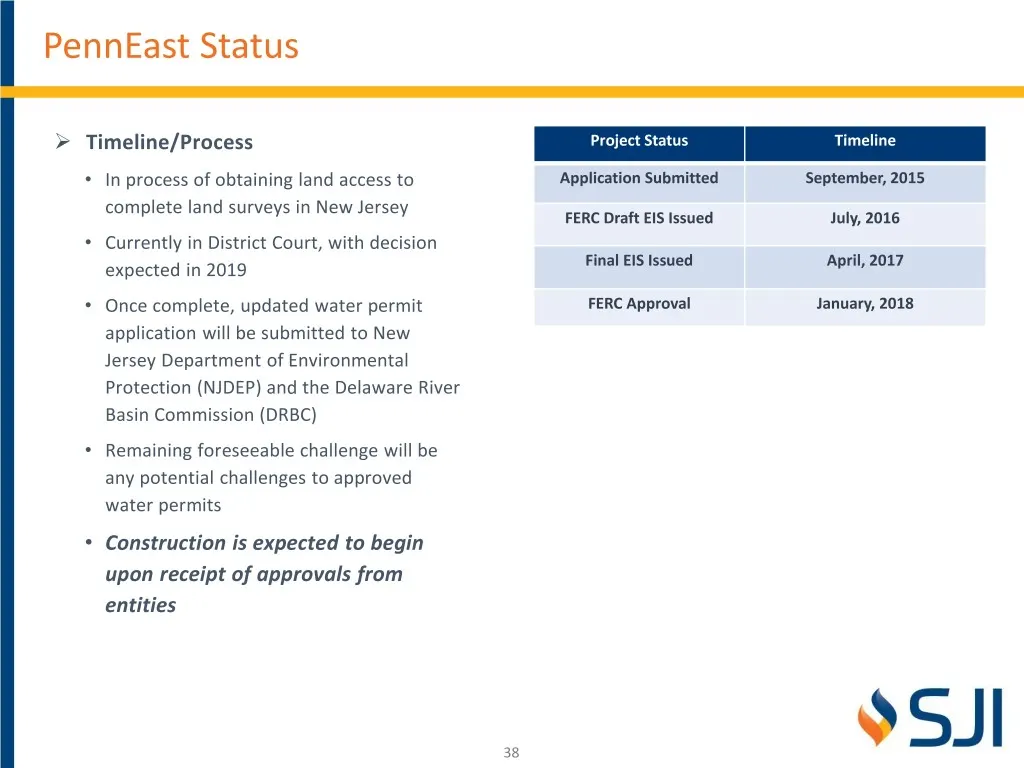
PennEast Status ➢ Timeline/Process Project Status Timeline • In process of obtaining land access to Application Submitted September, 2015 complete land surveys in New Jersey FERC Draft EIS Issued July, 2016 • Currently in District Court, with decision expected in 2019 Final EIS Issued April, 2017 •
Slide 39: Midstream | Earnings Growth Targets
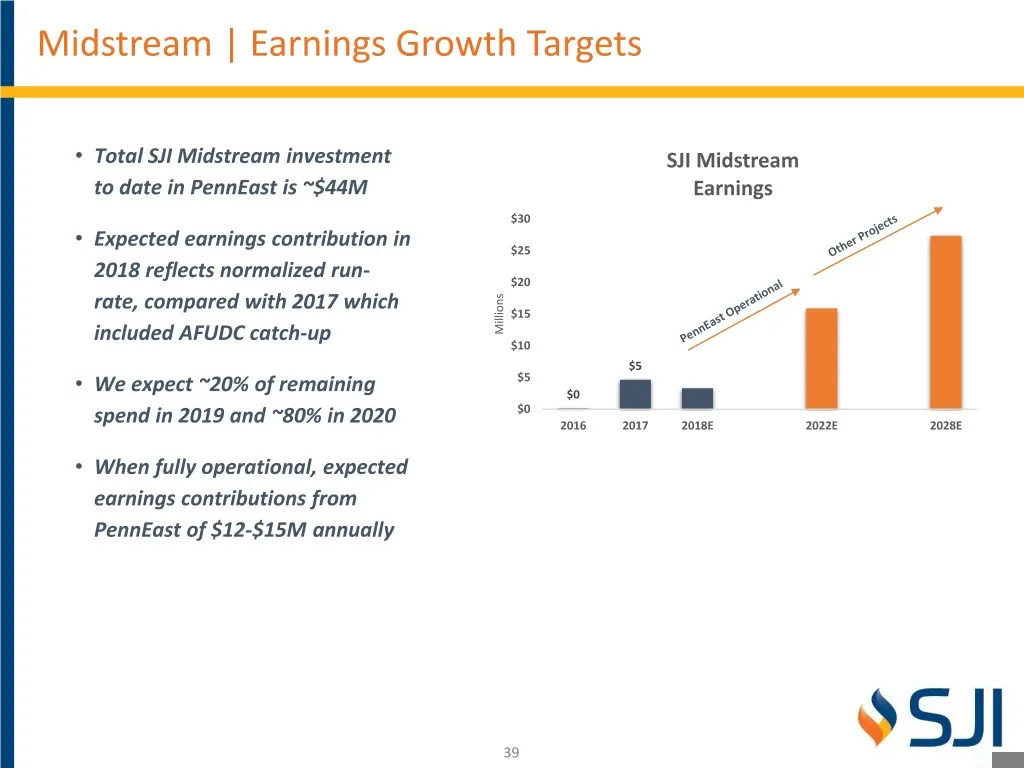
Midstream | Earnings Growth Targets • Total SJI Midstream investment SJI Midstream to date in PennEast is ~$44M Earnings $30 • Expected earnings contribution in $25 2018 reflects normalized run- $20 rate, compared with 2017 which $15 included AFUDC catch-up Millions $10 $5 $5 • We expect ~20% of rem
Slide 40: Summary | Committed to Infrastructure Investment
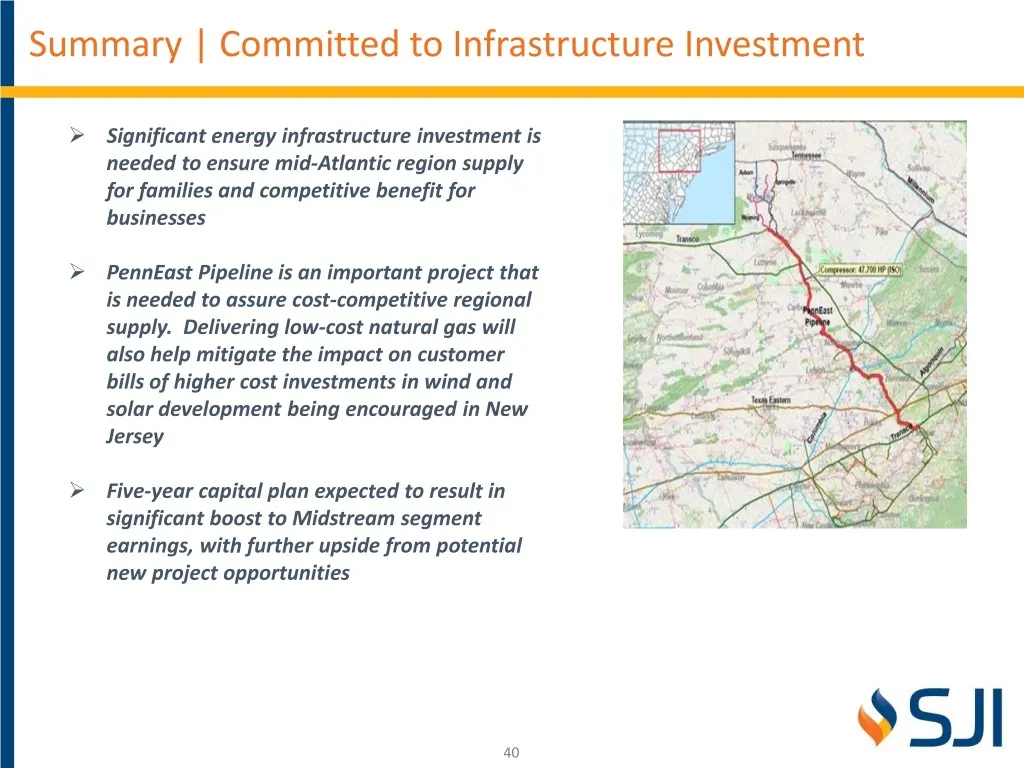
Summary | Committed to Infrastructure Investment ➢ Significant energy infrastructure investment is needed to ensure mid-Atlantic region supply for families and competitive benefit for businesses ➢ PennEast Pipeline is an important project that is needed to assure cost-competitive regional supply. De
Slide 41: Non-Regulated Operations
Non-Regulated Operations 41
Slide 42: Energy Group | Overview
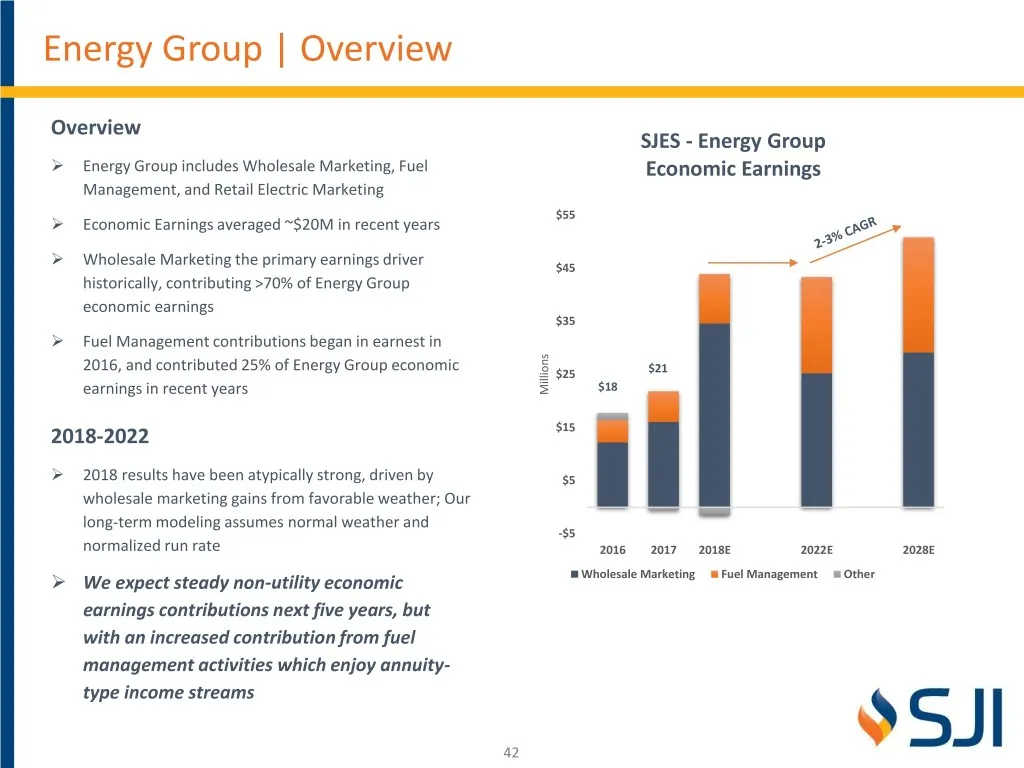
Energy Group | Overview Overview SJES - Energy Group ➢ Energy Group includes Wholesale Marketing, Fuel Economic Earnings Management, and Retail Electric Marketing $55 ➢ Economic Earnings averaged ~$20M in recent years ➢ Wholesale Marketing the primary earnings driver $45 historically, contributing >
Slide 43: Energy Group | Wholesale Marketing
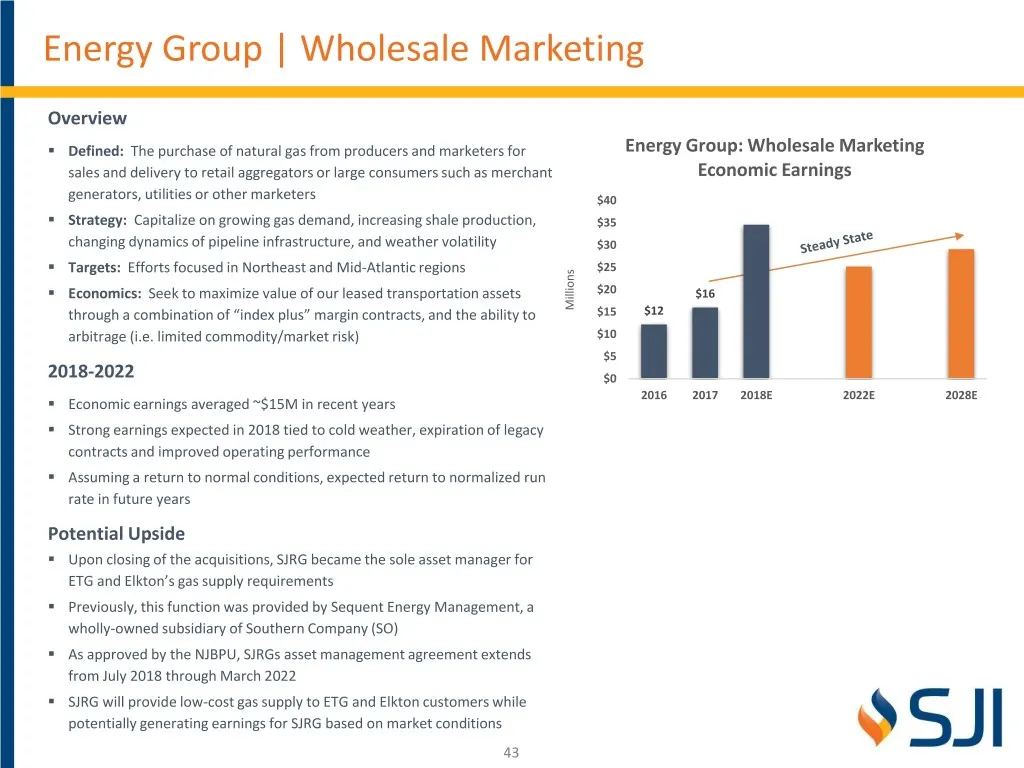
Energy Group | Wholesale Marketing Overview ▪ Defined: The purchase of natural gas from producers and marketers for Energy Group: Wholesale Marketing sales and delivery to retail aggregators or large consumers such as merchant Economic Earnings generators, utilities or other marketers $40 ▪ Strategy
Slide 44: Energy Group | Fuel Management
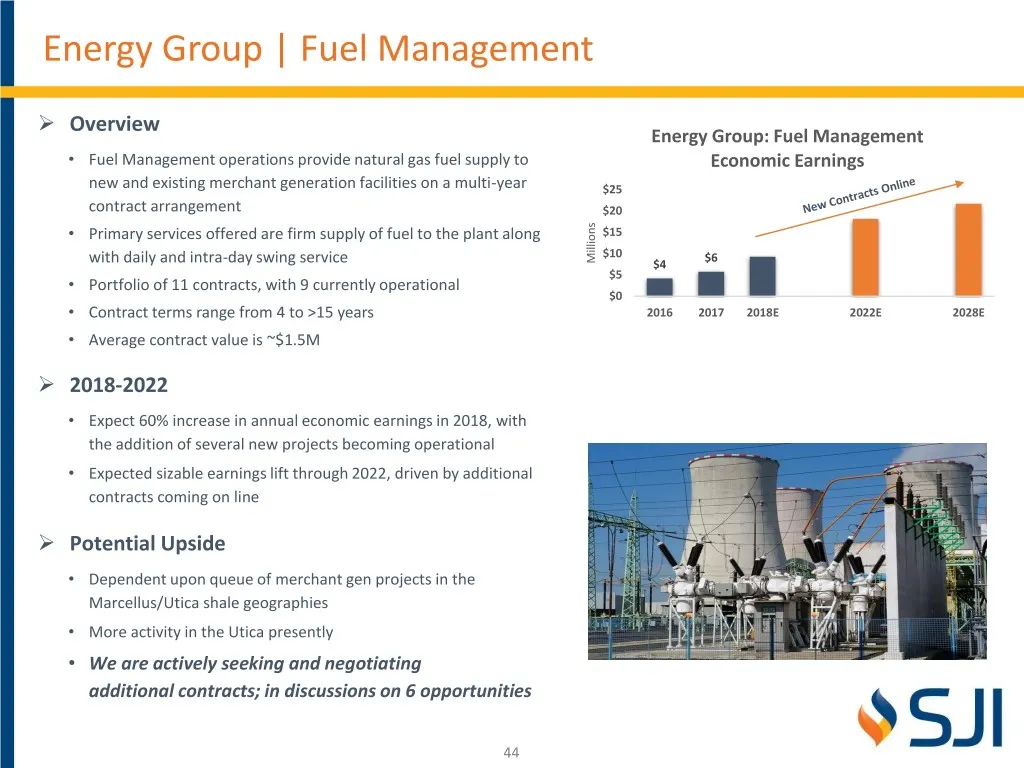
Energy Group | Fuel Management ➢ Overview Energy Group: Fuel Management • Fuel Management operations provide natural gas fuel supply to Economic Earnings new and existing merchant generation facilities on a multi-year $25 contract arrangement $20 • Primary services offered are firm supply of fuel to
Slide 45: Energy Services | Overview
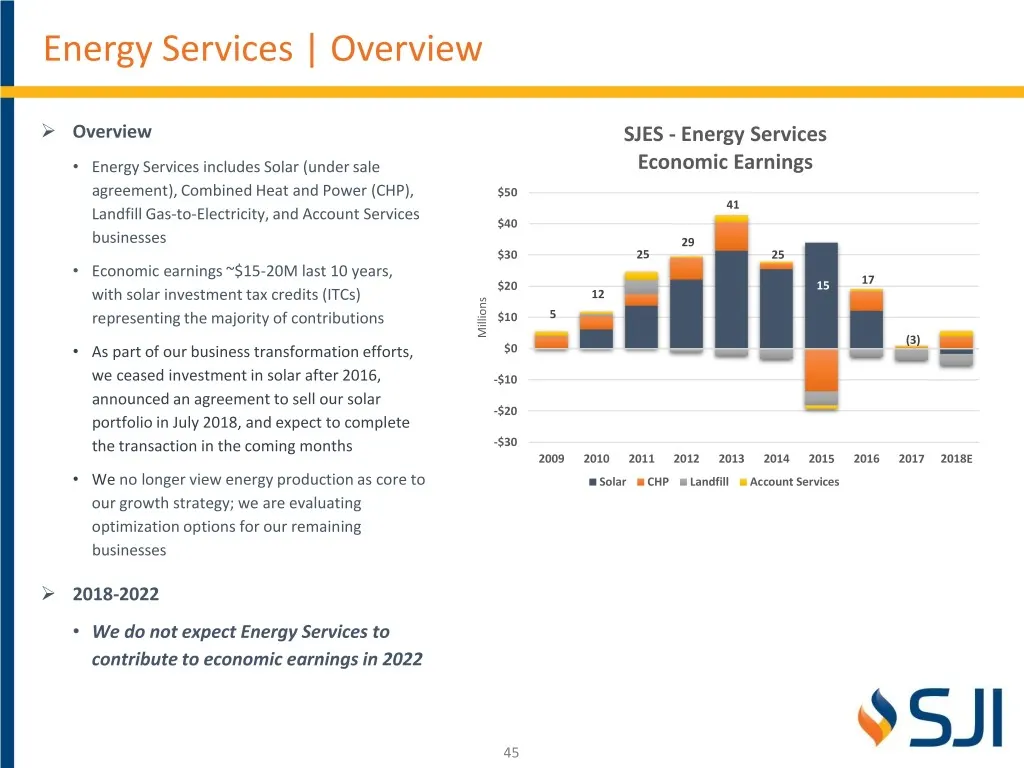
Energy Services | Overview ➢ Overview SJES - Energy Services • Energy Services includes Solar (under sale Economic Earnings agreement), Combined Heat and Power (CHP), $50 41 Landfill Gas-to-Electricity, and Account Services $40 businesses 29 $30 25 25 • Economic earnings ~$15-20M last 10 years, $20
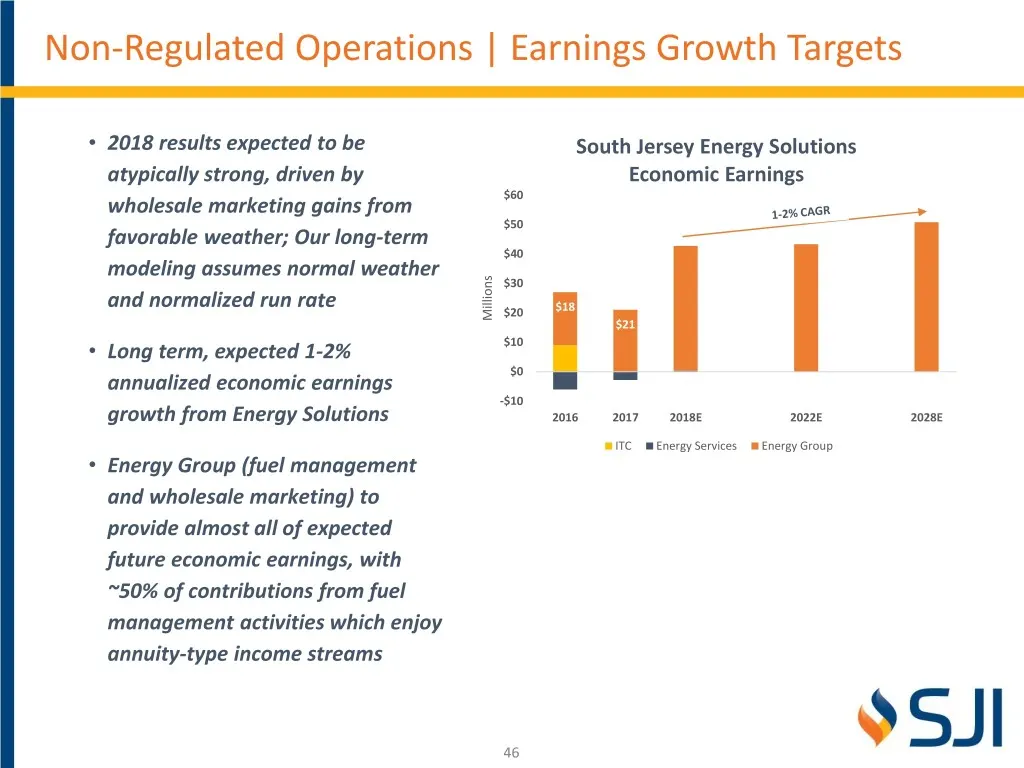
Slide 46: Non-Regulated Operations | Earnings Growth Targets
Non-Regulated Operations | Earnings Growth Targets • 2018 results expected to be South Jersey Energy Solutions atypically strong, driven by Economic Earnings wholesale marketing gains from $60 $50 favorable weather; Our long-term $40 modeling assumes normal weather $30 and normalized run rate $20 $1
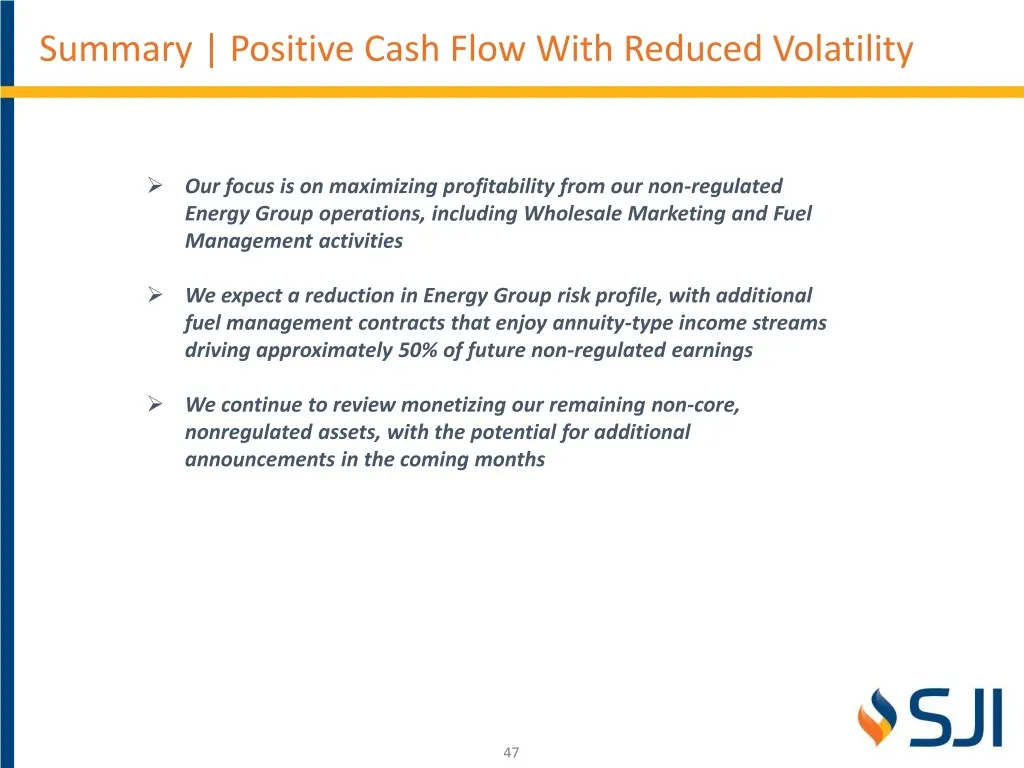
Slide 47: Summary | Positive Cash Flow With Reduced Volatility
Summary | Positive Cash Flow With Reduced Volatility ➢ Our focus is on maximizing profitability from our non-regulated Energy Group operations, including Wholesale Marketing and Fuel Management activities ➢ We expect a reduction in Energy Group risk profile, with additional fuel management contracts
Slide 48: SJI Investment Rationale
SJI Investment Rationale 9SJI
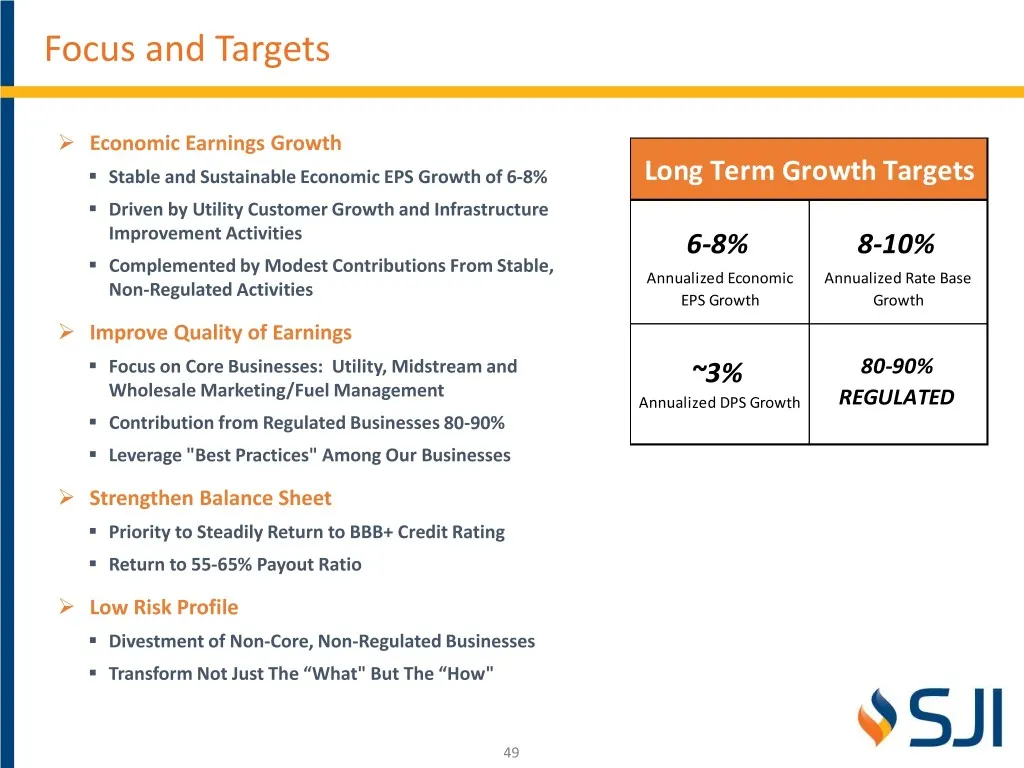
Slide 49: Focus and Targets
Focus and Targets ➢ Economic Earnings Growth ▪ Stable and Sustainable Economic EPS Growth of 6-8% Long Term Growth Targets ▪ Driven by Utility Customer Growth and Infrastructure Improvement Activities 6-8% 8-10% ▪ Complemented by Modest Contributions From Stable, Annualized Economic Annualized Rate
Slide 50: Well Positioned For Top-Tier Shareholder Returns
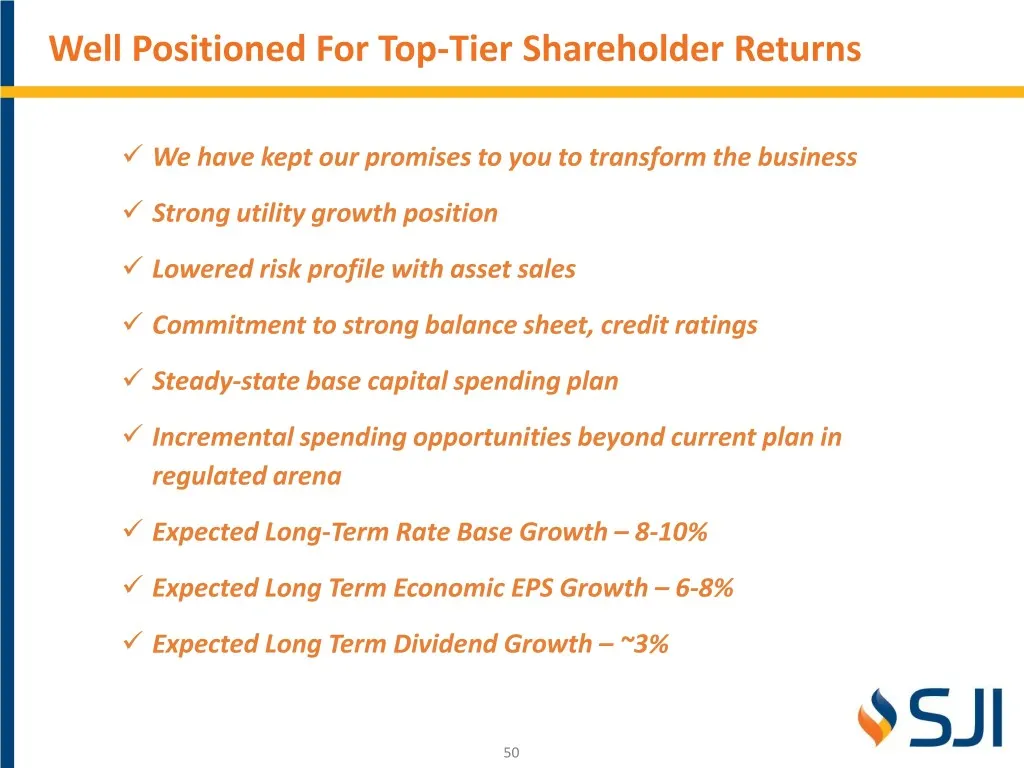
Well Positioned For Top-Tier Shareholder Returns ✓ We have kept our promises to you to transform the business ✓ Strong utility growth position ✓ Lowered risk profile with asset sales ✓ Commitment to strong balance sheet, credit ratings ✓ Steady-state base capital spending plan ✓ Incremental spending
Slide 51: Appendix
Appendix 9SJI
Slide 52: Earnings Performance – Q3'18 Versus Q3'17
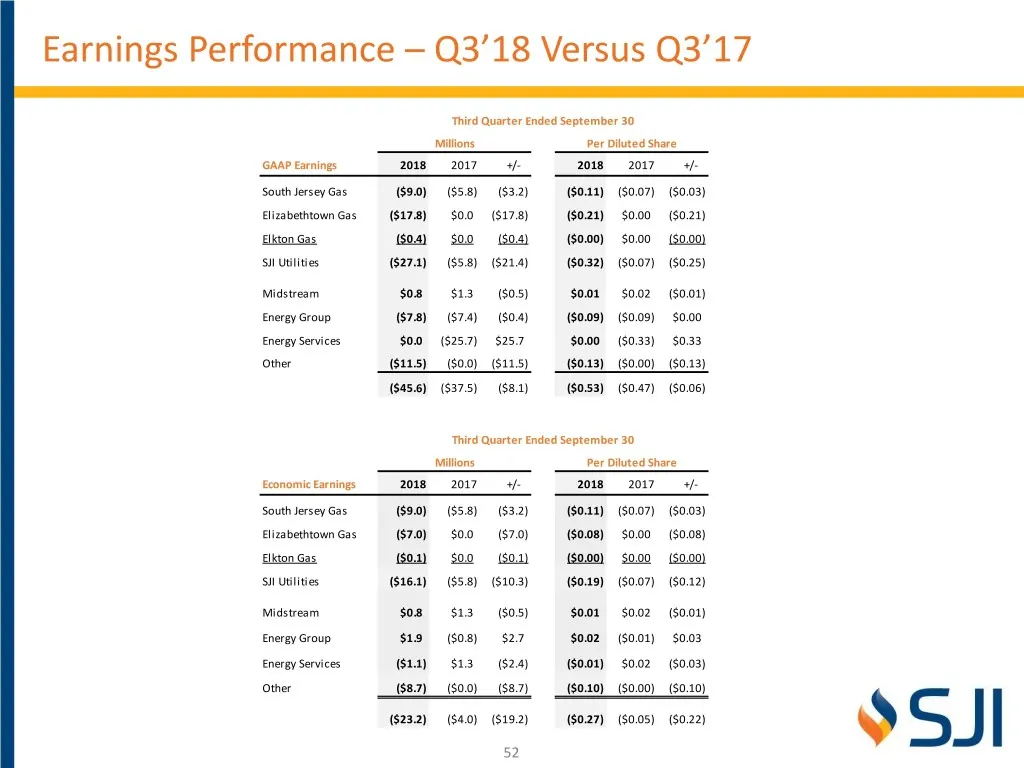
Earnings Performance – Q3’18 Versus Q3’17 Third Quarter Ended September 30 Millions Per Diluted Share GAAP Earnings 2018 2017 +/- 2018 2017 +/- South Jersey Gas ($9.0) ($5.8) ($3.2) ($0.11) ($0.07) ($0.03) Elizabethtown Gas ($17.8) $0.0 ($17.8) ($0.21) $0.00 ($0.21) Elkton Gas ($0.4) $0.0 ($0.4) ($0
Slide 53: Earnings Performance – YTD'18 Versus YTD'17
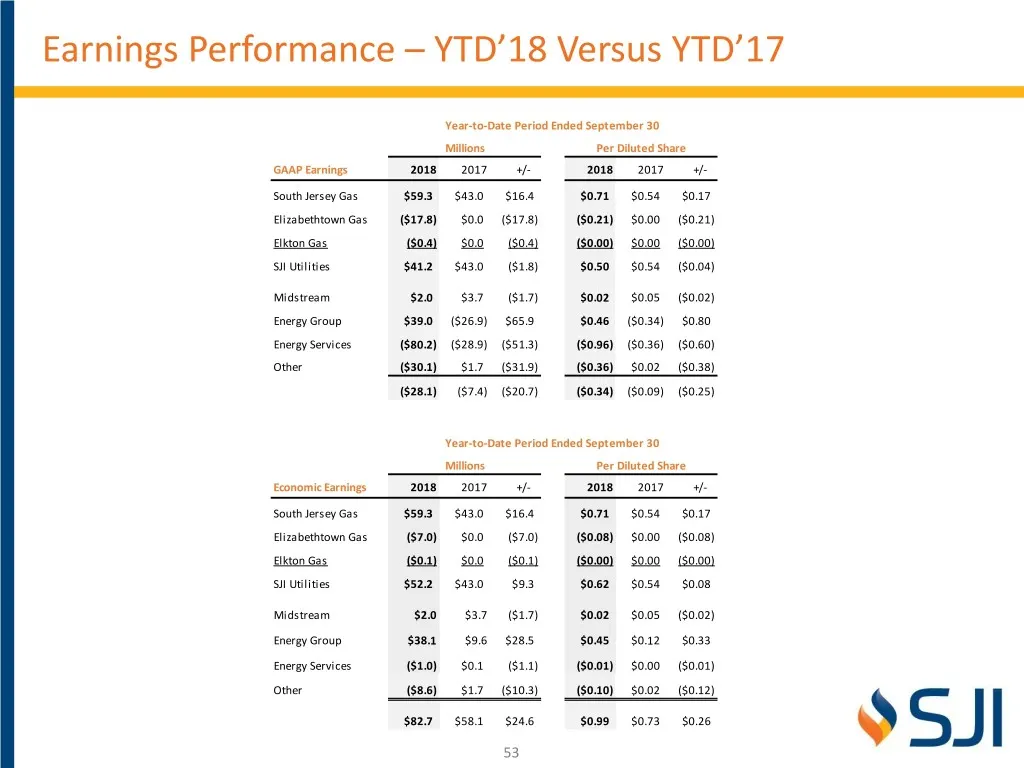
Earnings Performance – YTD’18 Versus YTD’17 Year-to-Date Period Ended September 30 Millions Per Diluted Share GAAP Earnings 2018 2017 +/- 2018 2017 +/- South Jersey Gas $59.3 $43.0 $16.4 $0.71 $0.54 $0.17 Elizabethtown Gas ($17.8) $0.0 ($17.8) ($0.21) $0.00 ($0.21) Elkton Gas ($0.4) $0.0 ($0.4) ($0.
Slide 54: South Jersey Gas | BL England
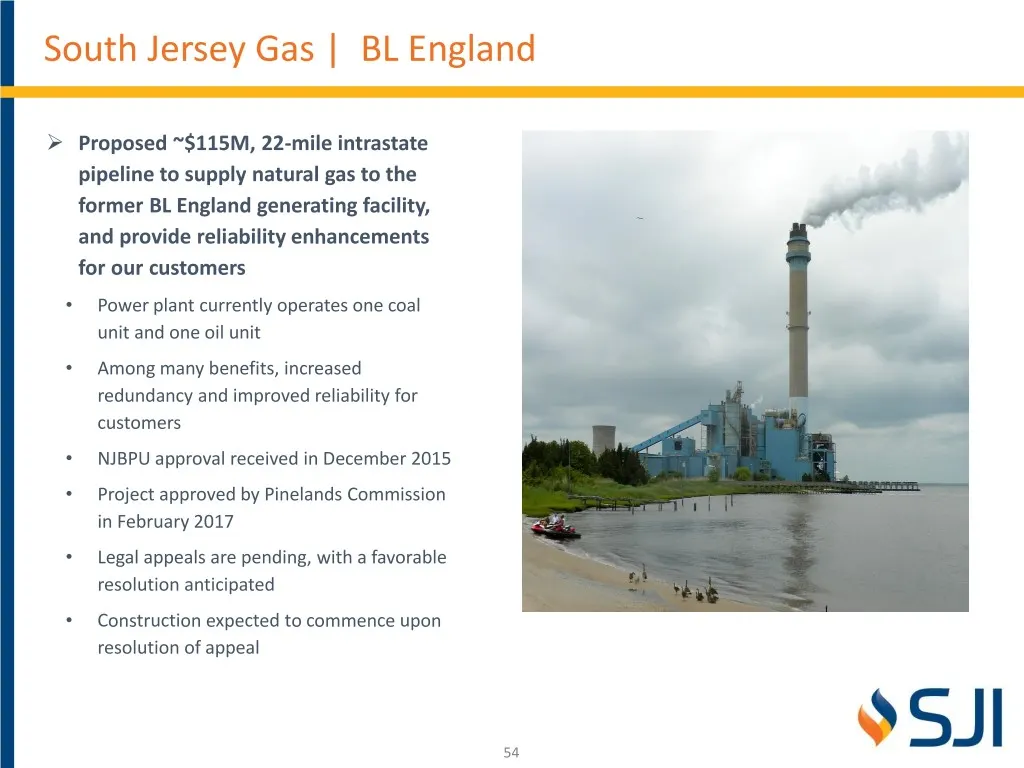
South Jersey Gas | BL England ➢ Proposed ~$115M, 22-mile intrastate pipeline to supply natural gas to the former BL England generating facility, and provide reliability enhancements for our customers • Power plant currently operates one coal unit and one oil unit • Among many benefits, increased red
Slide 55: Energy Group | Wholesale Marketing
Energy Group | Wholesale Marketing ➢ How We Make Money • Optimization of leased pipeline transportation and storage services • Trading of physical gas or gas derivatives, either as a position or hedging • Utilization of a variety of strategies including asset management agreements; fuel management s
Slide 56: Energy Group | Fuel Management
Energy Group | Fuel Management ➢ How We Make Money • Intrinsic - Monthly Demand Fee; Utilization Fee; Profit Sharing/Asset Management Agreement • Extrinsic - Supply Arrangements; Segmenting of Capacity; Balancing Services ➢ Market Position • We estimate capturing a 20% market share of new merchant g
Slide 57: Energy Group | Fuel Management Contracts
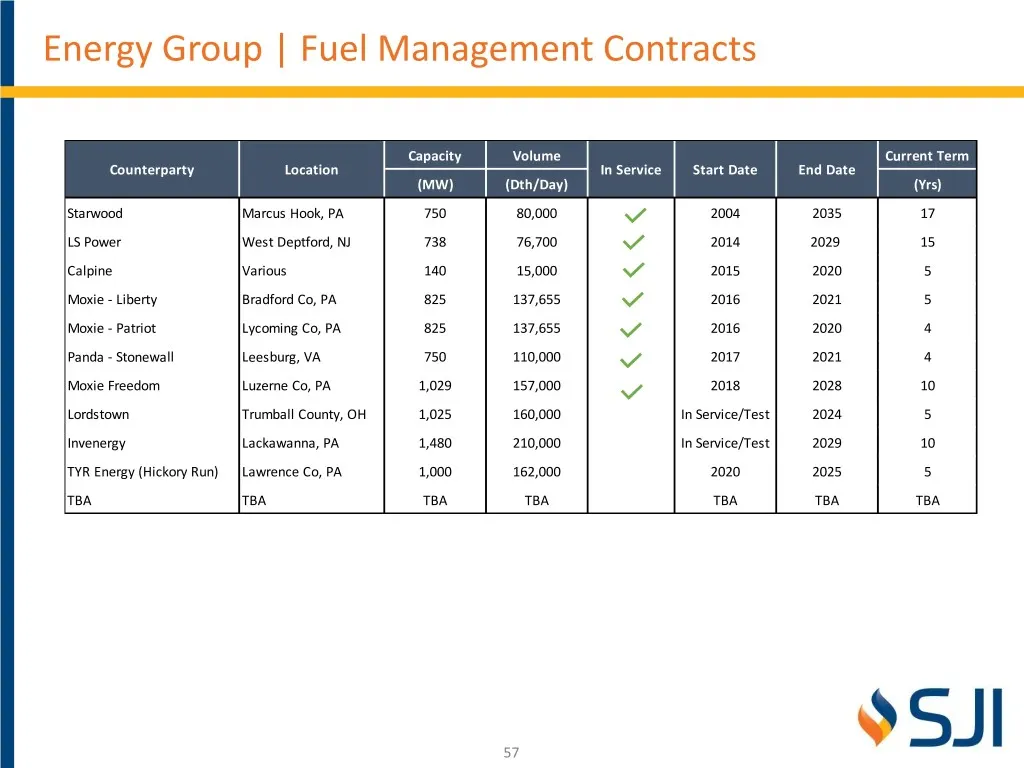
Energy Group | Fuel Management Contracts Capacity Volume Current Term Counterparty Location In Service Start Date End Date (MW) (Dth/Day) (Yrs) Starwood Marcus Hook, PA 750 80,000 2004 2035 17 LS Power West Deptford, NJ 738 76,700 2014 2029 15 Calpine Various 140 15,000 2015 2020 5 Moxie - Liberty B
Slide 58: Non-GAAP Financial Measures
Non-GAAP Financial Measures Management uses the non-generally accepted accounting principles (non-GAAP) financial measures of Economic Earnings and Economic Earnings per share when evaluating its results of operations. These non-GAAP financial measures should not be considered as an alternative to G
Source: SEC EDGAR · 8-K filed Dec 6, 2018
More decks from South Jersey Industries Inc
 FY2021 Earnings Presentation29 slides · Feb 24, 2022
 Q3 2021 Earnings Presentation31 slides · Nov 3, 2021
 Q2 2021 Earnings Presentation31 slides · Aug 4, 2021
 Investor Day (May 2021)88 slides · May 6, 2021
 FY2020 Earnings Presentation31 slides · Feb 24, 2021
 Q3 2020 Earnings Presentation37 slides · Nov 4, 2020